ibisworld industry report 49311 public storage...
TRANSCRIPT

WWW.IBISWORLD.COM� Public�Storage�&�Warehousing�in�the�US April 2011 1
IBISWorld Industry Report 49311Public Storage & Warehousing in the USApril�2011� Taylor�Hamilton
Stocking up: Strong manufacturing, wholesaling and retail support industry growth
2� About�this�Industry2 Industry Definition
2 Main Activities
2 Similar Industries
2 Additional Resources
3� Industry�at�a�Glance
4� Industry�Performance4 Executive Summary
4 Key External Drivers
5 Current Performance
8 Industry Outlook
10 Industry Life Cycle
12� Products�&�Markets12 Supply Chain
12 Products & Services
13 Demand Determinants
13 Major Markets
14 International Trade
15 Business Locations
17� Competitive�Landscape17 Market Share Concentration
17 Key Success Factors
17 Cost Structure Benchmarks
18 Basis of Competition
19 Barriers to Entry
19 Industry Globalization
20� Major�Companies20 Deutsche Post AG
21 United Parcel Service Inc.
24� Operating�Conditions24 Capital Intensity
25 Technology & Systems
26 Revenue Volatility
26 Regulation & Policy
26 Industry Assistance
27� Key�Statistics27 Industry Data
27 Annual Change
27 Key Ratios
28� Jargon�&�Glossary
www.ibisworld.com��|��1-800-330-3772��| ��[email protected]
WWW.IBISWORLD.COM� Public�Storage�&�Warehousing�in�the�US April 2011 2
This industry operates storage warehousing and storage facilities. These establishments generally use equipment such as forklifts, pallets and racks to handle goods in containers such as boxes,
barrels and drums. Industry firms avoid specializing in handling bulk products of any particular type, size or quantity. Warehouses operated in this industry cater mainly to non-bulk products.
The�primary�activities�of�this�industry�are
Bonded warehousing, general merchandise
Private warehousing and storage, general merchandise
Public warehousing and storage (except self storage), general merchandise
Warehousing (including foreign trade zones), general merchandise
Warehousing and storage, general merchandise
General warehousing and storage
48411 Local�Freight�Trucking�in�the�USCompanies in this industry ship goods from warehouses to manufacturers, wholesalers and retailers.
48412 Long-Distance�Freight�Trucking�in�the�USFirms in this industry transport goods by road. Import volumes dominate the industry.
49312 Refrigerated�Public�Storage�&�Warehousing�in�the�USEstablishments in this industry provide storage in climate controlled environments.
49313 Farm�Product�Storage�&�Warehousing�in�the�USBusinesses in this industry provide specialized bulk storage for the agricultural sector. Grain storage dominates this industry.
Industry�Definition
Main�Activities�
Similar�Industries
Additional�Resources
About�this�Industry
For�additional�information�on�this�industry
www.arcweb.com�ARC Advisory Group
www.bts.gov�Bureau of Transportation Statistics
www.census.gov�US Census Bureau
The�major�products�and�services�in�this�industry�are
Contract warehousing and storage
Other services
Public warehousing and storage
Services related to motor carrier and storage

WWW.IBISWORLD.COM� Public�Storage�&�Warehousing�in�the�US April 2011 3
% c
hang
e
4
−1
0
1
2
3
1604 06 08 10 12 14Year
Per capita disposable income
SOURCE: WWW.IBISWORLD.COM
% c
hang
e
15
−10
−5
0
5
10
1703 05 07 09 11 13 15Year
Revenue Employment
Revenue vs. employment growth
Products and services segmentation (2011)
48%Contract warehousing
and storage
24%Public warehousing and storage
19%Other services
9%Services related to
motor carrier and storage
SOURCE: WWW.IBISWORLD.COM
Key�Statistics�Snapshot
Industry�at�a�GlancePublic�Storage�&�Warehousing�in�2011
Industry�Structure Life Cycle Stage Mature
Revenue Volatility Medium
Capital Intensity Low
Industry Assistance Low
Concentration Level Low
Regulation Level Light
Technology Change High
Barriers to Entry Low
Industry Globalization Low
Competition Level High
Revenue
$14.3bnProfit
$1.5bnWages
$4.2bnBusinesses
3,568
Annual�Growth�11-16
3.8%Annual�Growth�06-11
0.6%
Key�External�DriversPer�capita�disposable�incomeDemand�from�retail�tradeInformation�technology�costs�Pervasive�outsourcing�Demand�from�manufacturing
Market�ShareDeutsche Post AG 15.7%
United Parcel Service Inc. 7.0%
p. 20
p. 4
FOR ADDITIONAL STATISTICS AND TIME SERIES SEE THE APPENDIX ON PAGE 27
SOURCE: WWW.IBISWORLD.COM

WWW.IBISWORLD.COM� Public�Storage�&�Warehousing�in�the�US April 2011 4
Key�External�Drivers Per capita disposable incomeMovements in disposable income have impacts on household consumption, which ultimately affects demand for general warehousing services. This driver is expected to increase slowly over the next year. This is a potential opportunity for the industry.
Demand from retail tradeDemand for third-party storage by retailers influences industry revenue.
Strong retail spending increases the need for higher stock levels and, in turn, boosts industry revenue. Inversely, when retail sales drop, retailers slash orders and the volume of merchandise flowing into warehouses declines. This driver is expected to increase over the next year.
Information technology costs The level of automation and introduction of information technology is sensitive to the cost of that technology. Smaller
Executive�Summary
Growth for the Public Storage and Warehousing industry has been supported by strong manufacturing, wholesaling and retail trade. Increased outsourcing to third-party warehouses has supported industry growth along with international trade, but the industry has come under pressure from integrated logistics networks. For example, major players have operations in related transport industries that allow them to provide door-to-door transport and distribution services.
In addition, the recession caused manufacturing, wholesaling and retail activity to contract in 2009. In turn, inventories arriving at warehouses declined sharply, thus pulling industry revenue lower. Slower stock turnover, however, has softened the decline. Between 2006 and 2011, industry revenue has increased at an average rate of 0.6% annually to total $14.3 billion. In 2011, industry revenue is expected to grow 3.2% as wholesalers and retailers rebuild inventories.
Industry costs have increased since 2006, especially for large operators. Costs grew as the industry moved into larger, more complex warehouses with electronic monitoring and tracking systems. Declining revenue in 2009 is expected to slow this trend, but warehouses will continue to develop more advanced tracking and picking systems through the next five years. Despite falling revenue, establishment numbers and employment have remained relatively steady over the past five years. Even as the US economy stabilizes in 2010 and 2011, many operators will go into bankruptcy under the weight of debt built up in 2009. Over the five years to 2011, industry enterprises are expected to increase only marginally, at an average of 0.8% annually to total 3,568.
Over the five years to 2016, revenue is forecast to increase steadily, supported by a stronger economy, increased retail stock turnover, higher manufacturing levels and greater outsourcing. Industry revenue is forecast to increase 3.8% annually and reach $17.3 billion through 2016. This growth includes an expected increase of 3.9% in 2012. As industry revenue climbs, the number of industry establishments and employment levels are also forecast to improve.
Industry�PerformanceExecutive�Summary�� |�� Key�External�Drivers�� |�� Current�PerformanceIndustry�Outlook�� |�� Life�Cycle�Stage
� Slower stock turnover softened the declines incurred by downstream activity

WWW.IBISWORLD.COM� Public�Storage�&�Warehousing�in�the�US April 2011 5
Industry�Performance
Current�Performance
The Public Storage and Warehousing industry has managed to grow marginally over the five years to 2011, increasing 0.6% annually to total $14.3 billion, including an expected growth in revenue of 3.2% in 2011. In 2009, poor economic conditions, falling manufacturing activities and, more importantly, falling inventory levels drew the average growth rate down. Industry profitability can vary year from year but is estimated at 10.5% in 2011. This number is well below the 12.0% profit reported in 2004, mainly due to slow economic conditions and low turnover of stock.
The major users of warehousing services are the manufacturing, wholesale and retail sectors. The industry’s recent performance can be linked to: movements in industrial production, which acts as a proxy for domestic manufacturing; personal consumption expenditure, which acts as a proxy for the retail sector; and import activity, which acts as a proxy for the wholesale sector. In addition, the effect of outsourcing distribution to contract warehousing and the growth of third-party logistics providers have also contributed to industry revenue.
Key�External�Driverscontinued
operators have little incentive to invest in information technology when implementation costs are high. While technology can improve efficiency and lower labor costs, it makes start-up costs significantly higher and smaller operators have trouble competing. This driver is expected to increase over the next year. This is a potential threat for the industry.
Pervasive outsourcingThe growing trend toward outsourcing warehouse and associated services by manufacturers, wholesalers and retailers
has been a growth area for this industry. This driver is expected to increase over the next year.
Demand from manufacturingThe manufacturing sector is a significant user of warehousing facilities. Consumer spending, in turn, drives the manufacturing sector. As manufacturing activity slowed at the start of the recession in 2008, growth in industry revenue also slowed. This driver is expected to increase over the next year.
% c
hang
e
6
−9
−6
−3
0
3
1604 06 08 10 12 14Year
Demand from retail trade
SOURCE: WWW.IBISWORLD.COM
% c
hang
e
4
−1
−0
1
2
2
3
1604 06 08 10 12 14Year
Per capita disposable income

WWW.IBISWORLD.COM� Public�Storage�&�Warehousing�in�the�US April 2011 6
Industry�Performance
Current�Performancecontinued
Although US economic growth remained slow in the first half of 2010, industry revenue grew steadily. Growth has been partly supported by higher production volumes and, to a greater extent, a rebuilding of inventories. In 2009, inventories slowly declined as companies slashed orders of new stock and production volumes. Early in 2009, container freight volumes through ports on the West Coast fell about 40% to 45% year on year, indicating a very large reduction in orders and meaning scant new stock was arriving in warehouses. Although freight volumes stabilized in late 2009, they remained well below 2008 levels. Data from the US Census Bureau indicate the value of inventories in the United States declined 15.0% through the year to September 2009. The monthly seasonally adjusted data show a notable 1.1% decline from August 2009, suggesting that a turnaround in the US economy is still some time away.
As the US economy entered recession in 2008, demand began to wane as retail sales fell and manufacturing activity faltered. In contrast, the first half of the year was relatively strong, so many industries were slow to respond to the changing economic environment. As such, the quantity of goods in storage increased in the second half of the year as new stock arrived in warehouses and little was distributed.
Strong economic activity, surging imports, strong manufacturing activity, high disposable incomes and good retail spending supported strong growth in the demand for warehousing from 2004 to 2006; however, the fallout of the subprime crisis in 2007 slowed demand. In 2004, revenue tumbled 4.9% due to a combination of factors, including redistribution of manufacturing activity to offshore operations (China in particular) and an increase of in-house storage by large retailers, especially big-box retailers. As manufacturing shifted offshore, many large warehouse operators also shifted functions offshore and used facilities in the United States as transit and distribution points rather than storage facilities.
Establishments�grow Over the five years to 2011, establishment numbers are expected to grow at an average rate of 0.4% per year to total 5,658. Due to improving business conditions, the number of establishments is expected to grow 0.7% in 2011 alone. Over the past five years, the cost of building and managing warehouses has increased significantly. The average size of facilities has increased, while the
adoption of tracking systems and automated inventory-picking technology has caused a sharp rise in up-front capital expenditure. The higher start-up costs have discouraged many new operators from entering the industry. Self-storage has been a growing market for the industry, so much of the establishment growth has been in the provision of storage to this market. Self-storage units
% c
hang
e
10
−10
−5
0
5
1703 05 07 09 11 13 15Year
Industry revenue
SOURCE: WWW.IBISWORLD.COM

WWW.IBISWORLD.COM� Public�Storage�&�Warehousing�in�the�US April 2011 7
Industry�Performance
Establishments�growcontinued
have lower start-up costs, and the use of investment strategies, such as strata title, by which each storage unit is sold to an
investor then leased back to the operator, have contributed to the boom in industry establishments that target this market.
Employment�rises,�but�wages�fall
Traditionally, warehousing industries have lower labor requirements, and the move to automated picking systems has caused demand for labor to decline since 2006. The need for additional employees to provide auxiliary services, such as repacking and distribution, has more than offset the labor decline from automation. Over the five years to 2011, employment has increased by an average
0.3% per year. The low demand for warehouse services in 2009 resulted in a decline in employment, and the increasing number of business closures in 2010 caused it to fall even further. Total industry wages have increased at a rate of about 1.6% per year, thus indicating an increase in the average wage due to dispersal across a smaller labor pool.
Technology�drives�the�industry
The uptake of radio frequency identification (RFID) technology, which helps track products from assembly line to store shelf, has been increasing. Third-party logistics providers, which are companies that provide a one-stop shop for part of or all supply management functions, were in a unique position when it came to RFID. Many have been among the first to implement these systems because their customers have demanded them. These firms provide services to Walmart, Target and other giant retailers or operate facilities for those retailers. Unlike the suppliers to those retailers, third-party logistics providers have been able to pass on the
cost of RFID implementation to their customers. In addition, the cost of the microchips used in RFID applications has fallen as production has increased and scale economies were delivered.
In an effort to make supply chains more efficient, US manufacturers and retailers are increasingly shifting warehouses and distribution facilities to China. A growing proportion of goods are sorted, packaged and labeled before leaving China. Once in the United States, the goods go directly to the retailer or consumer and bypass US warehouses, and facilities are being provided by logistics partners such as DHL and UPS.
Industry�trends General warehousing in the United States has evolved significantly from the traditional wharf-side storage sheds to fully automated warehouses that encompass sophisticated logistics systems of today. Traditionally, all components of the logistics function have been operated as separate departments or entities while warehousing and the associated materials handling were
centralized. This centralization had been successful for companies that have
� Business customers’ changing needs have required firms to integrate their logistics

WWW.IBISWORLD.COM� Public�Storage�&�Warehousing�in�the�US April 2011 8
Industry�Performance
Industry�Outlook
The Public Storage and Warehousing industry is expected to continue growth in 2012 as the US economy picks up pace and American manufacturers, wholesalers and retailers rebuild inventory levels. Industry revenue depends on the level of goods in storage and the length of time they are there. The transport sector works on a six- to 12-month lead on the rest of the economy, with goods for the Christmas period being distributed and stored from June and July. Over the five years to 2016, industry revenue is forecast to increase at an average annualized rate of 3.8% and total $17.3 billion, including expected growth of 3.9% in 2012. A large part of this growth will be from an increase in per capita disposable income, which is expected to increase 1.9% annually.
As incomes rise, people are able to buy more goods, and demand to store them will increase. Also, more demand for consumer goods will increase demand on
inventories, and demand for warehouses will increase as a result.
Establishment numbers are also expected to grow in 2012, although just 1.4% to 5,735. Over the five years to 2016, establishments will grow at an average rate of 1.2% annually to reach 6,006. Employment growth will pick up in 2012 due to strong growth in demand, higher inventory levels and continuing growth in establishment numbers. Over the five years to 2016, employment will increase at an estimated average rate of 3.3% per year. Last, profit is expected to reach about 12.0% to 13.0% in 2012 as the US economy and manufacturing activity returns to steady growth.
Industry�trendscontinued
similar operational activities and customer requirements; however, with the changing needs of the business community and its customers, especially in the manufacturing sector where markets were becoming increasing global and just-in-time (JIT) processes were being implemented, there was a need for firms to integrate their logistics functions. Initially, manufacturing firms had in-house distribution functions, but they experienced high costs, low customer service and general industrial problems with the myriad of unions covering employees in each link of the logistics chain. These issues led to the emergence of firms that provide contract distribution (i.e. third-party logistics
providers) that allow clients to carry on with their core activities.
Still, large companies such as Walmart, General Motors, Target and Kmart continue to operate private warehouses so they can exercise a greater degree of control. The firm has direct control of and responsibility for the product until the customer takes possession following delivery. The greater degree of control allows the firm to integrate the warehousing function more easily into the company’s total logistics system. With this warehouse control comes a greater degree of flexibility to design and operate the warehouse in order to fit the needs of the customers and characteristics of the product.
� As incomes rise, people are able to buy more goods, and demand to store them will increase

WWW.IBISWORLD.COM� Public�Storage�&�Warehousing�in�the�US April 2011 9
Industry�Performance
Warehouses�go�high�tech
Contract warehouse operators will take market share from private warehouse operators as third-party logistics providers continue to develop innovative cost-reduction solutions. This move will be achieved through cutting-edge technology, such as voice recognition and radio frequency identification (RFID) in material-handling activities.
First, real-time data collection allows vendors to predict demand fluctuations accurately. Advances in real-time data collection, along with the development of rapid track-and-trace technology, may reduce the use of warehouses in the long term, with transportation acting as mobile warehouses. Inventory will always be required, though, and the key to efficient warehouse operations is to know the level of inventory required to minimize stock shortages. Smaller players will continue serving geography-specific market niches and maintain good relations with local customers.
The uptake of RFID technology will increase in the next two years, according to research commissioned by the Computing Technology Industry Association, and the automotive, consumer goods and transportation and logistics industries will lead the way in implementing these technology solutions. Mandates and directives from key organizations, including the US Department of Defense, the Food and
Drug Administration and Walmart, drive much of the RFID adoption in the United States. The global RFID market is anticipated to increase to $26.0 billion in 2016, compared to $3.0 billion in 2006, according to research conducted by ID TechEx, a Cambridge, England-based consultancy. In addition, the number of tags delivered in 2016 is forecast to be more than 450 times the number delivered in 2006.
Tag and RFID system costs are significant impediments to a faster global rollout. Tag costs are typically not quoted by manufacturers since the total cost depends on volumes purchased and the capability and reach of the tags themselves. Prices of passive RFID tag costs have approached seven cents each in the United States, 10 cents in Europe and 25 to 30 cents in Asia. In the United States, the average retailer spends more than $500,000 for RFID hardware and software, including on chips, inserts, printers, tags, antennae, readers, data aggregation and filtering systems, middleware and directory services.
Integrated�logistics Globally, there has been a shift toward vertically integrated logistics networks that provide a full range of transport solutions. Public storage and warehousing firms have not been exempt from the trend, and IBISWorld projects that this trend will drive the industry over the next five years. As many industry operators struggle financially, some major operators in other transport industries will likely enter the industry
or expand their existing involvement in the industry through acquisitions.
To succeed, industry operators will need to be a part of or have alliances with integrated network providers. This involvement is likely to increase the need for electronic tracking systems and the complexity and expense of these systems. Conversely, more industry operators will offer additional allied services.
� Mandates and directives from key organizations drive much of the RFID adoption in America

WWW.IBISWORLD.COM� Public�Storage�&�Warehousing�in�the�US April 2011 10
Industry�PerformanceGrowth from outsourcing warehousing has been increasing in the form of contract distribution
There has been some new technology introduced leading to semi-automated warehouses
There have been few new geographic locations of warehouses and associated markets
In terms of ownership, there have been some in-roads by foreign-owned companies
Life�Cycle�Stage
SOURCE: WWW.IBISWORLD.COM
30
25
20
15
10
5
0
–5
–10–10 100 20–5 155 25 30
%�G
row
th�o
f�pro
fi�t/G
DP
%�Growth�of�establishments
DeclineCrash or Grow?
Potential�Hidden�GemsFuture Industries
Quality�GrowthHigh growth in economic importance; weaker companies close down; developed technology and markets
Time�WastersHobby Industries
MaturityCompany consolidation;level of economic importance stable
Shake-out
Shake-out
Quantity�GrowthMany new companies; minor growth in economic importance; substantial technology change
Key�Features�of�a�Mature�Industry
Revenue grows at same pace as economyCompany numbers stabilize; M&A stageEstablished technology & processesTotal market acceptance of product & brandRationalization of low margin products & brands
Local�Freight�TruckingIndustrial�Building�Construction
Long-Distance�Freight�Trucking
Forklift�&�Conveyor�Equipment�Manufacturing
Refrigerated�Public�Storage�&�Warehousing
Public�Storage�&�Warehousing

WWW.IBISWORLD.COM� Public�Storage�&�Warehousing�in�the�US April 2011 11
Industry�Performance
Industry�Life�Cycle The trend toward outsourcing has been steadily growing as manufacturers, wholesalers and retailers concentrate on their core activities. In an attempt to reduce inventory costs and enhance customer service levels, innovative solutions by third-party logistics providers have been the key driving forces. The larger players have embraced new technology, which has led to automation of warehouses.
Over the 10 years to 2016, industry valued added has outpaced GDP growing 2.5% annually compared to 2.0% annually. Also, industry enterprises have
grown 0.9% annually between 2007 and 2011 and 2.3% annually between 2012 and 2016.
In addition, there have been no new geographical locations, with traditional distribution centers located strategically close in proximity to end users. In-roads made by foreign-owned third-party logistics providers have contributed to growth in contract warehousing. As a result of these characteristics, IBISWorld expects the industry to remain mature over the next five years, with merger and acquisition activity sitting high on the agenda.
�This industry is Mature
WWW.IBISWORLD.COM� Public�Storage�&�Warehousing�in�the�US April 2011 12
Products�&�Services
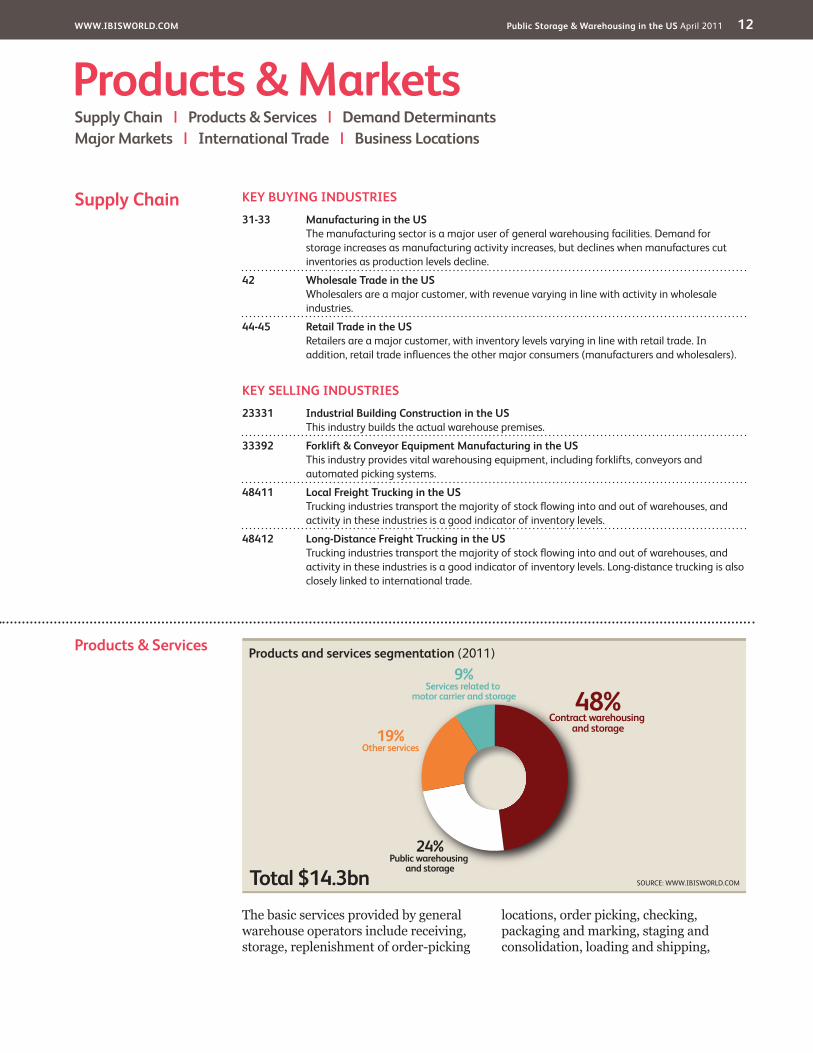
The basic services provided by general warehouse operators include receiving, storage, replenishment of order-picking
locations, order picking, checking, packaging and marking, staging and consolidation, loading and shipping,
�Products�&�MarketsSupply�Chain�� |�� Products�&�Services�� |�� Demand�DeterminantsMajor�Markets�� |�� International�Trade�� |�� Business�Locations
KEY�BUYING�INDUSTRIES
31-33� Manufacturing�in�the�US�The manufacturing sector is a major user of general warehousing facilities. Demand for storage increases as manufacturing activity increases, but declines when manufactures cut inventories as production levels decline.
42� Wholesale�Trade�in�the�US�Wholesalers are a major customer, with revenue varying in line with activity in wholesale industries.
44-45� Retail�Trade�in�the�US�Retailers are a major customer, with inventory levels varying in line with retail trade. In addition, retail trade influences the other major consumers (manufacturers and wholesalers).
KEY�SELLING�INDUSTRIES
23331� Industrial�Building�Construction�in�the�US�This industry builds the actual warehouse premises.
33392� Forklift�&�Conveyor�Equipment�Manufacturing�in�the�US�This industry provides vital warehousing equipment, including forklifts, conveyors and automated picking systems.
48411� Local�Freight�Trucking�in�the�US�Trucking industries transport the majority of stock flowing into and out of warehouses, and activity in these industries is a good indicator of inventory levels.
48412� Long-Distance�Freight�Trucking�in�the�US�Trucking industries transport the majority of stock flowing into and out of warehouses, and activity in these industries is a good indicator of inventory levels. Long-distance trucking is also closely linked to international trade.
Supply�Chain
Products and services segmentation (2011)
Total $14.3bn
48%Contract warehousing
and storage
24%Public warehousing
and storage
19%Other services
9%Services related to
motor carrier and storage
SOURCE: WWW.IBISWORLD.COM

WWW.IBISWORLD.COM� Public�Storage�&�Warehousing�in�the�US April 2011 13
Products�&�Markets
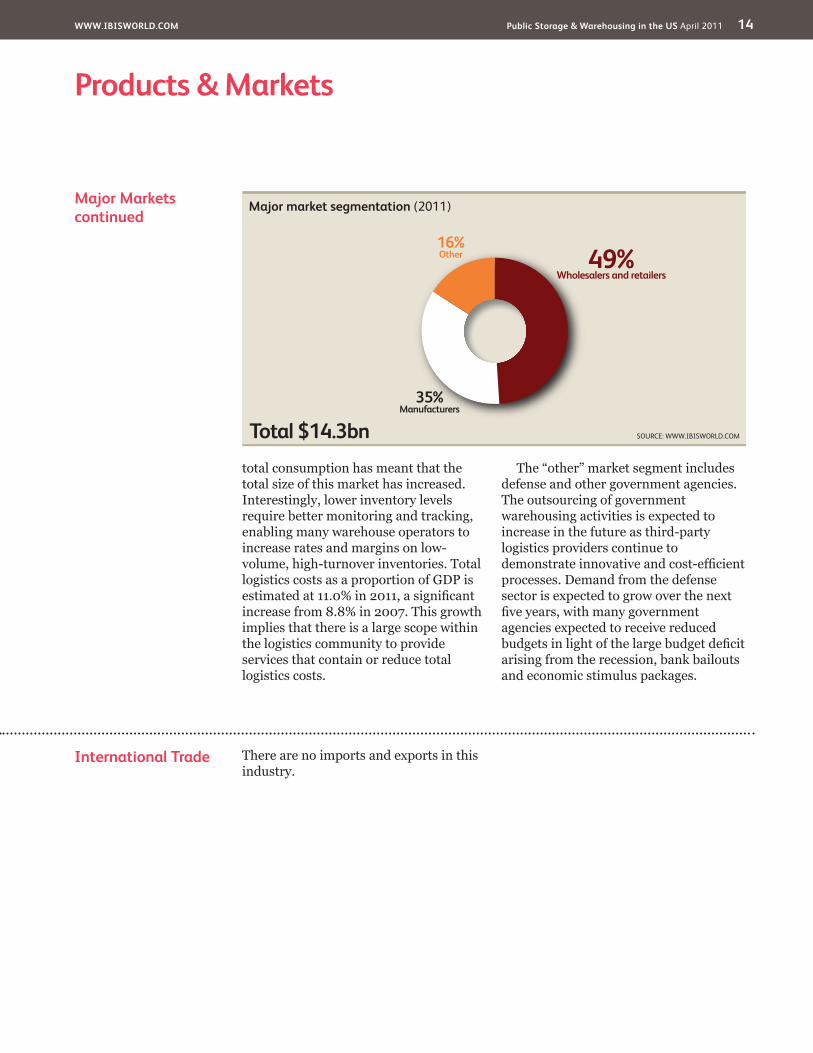
Major�Markets The manufacturing, wholesale and retail sectors have been the main contributors to growth in contract distribution because third-party logistics providers continue to develop solutions for inventory reduction processes. Outsourcing of warehousing functions also frees up resources for manufacturers, wholesalers and retailers focus on and build their core business.
Storage for manufacturers has been slowly decreasing over the past decade as more and more manufacturing activity is moved offshore. This trend has been further compounded by increased use of just-in-time (JIT) inventory management systems. JIT inventory management has also caused the average stock level or wholesaler inventory level to decrease over the past decade; however, growth in
DemandDeterminants
Demand for general warehousing is determined in aggregate by the level of domestic demand in the United States. The industries that predominantly use general warehousing services can be grouped by wholesale, retail and manufacturing sectors and imports.
The major factors affecting the performance of the wholesale and retail sectors are growth in real household distribution income, interest rates and consumer confidence. The manufacturing sector’s performance is dependent on the
level of domestic demand for manufactured products, import penetration in the domestic market and to some extent the export capabilities of firms. Contract distribution growth is dependent on the level of outsourcing by manufacturers, wholesalers and retail traders. In recent years, contract distribution has been growing strongly following the demonstrated ability by third-party logistics providers to reduce distribution costs by introducing innovative cost-reduction solutions.
Products�&�Servicescontinued
information systems updating and maintenance of material handling equipment.
Contract distribution within a firm’s integrated logistics management activity has been a growing segment within the Public Storage and Warehousing industry. These third-party logistics providers typically provide innovative solutions for the distribution needs of a firm. According to the 2007 Economic Census, the share of contract distribution increased from 28.3% in 1997 to 40.0% in 2007. IBISWorld estimates that in 2011, this proportion will increase to nearly 50.0%. The provision of contract warehousing and increased outsourcing over the next five years is expected to cause this segment to continue growing strongly.
Other services include value-added services such as the operations of small manufacturing cells. This trend toward providing these services is expected to increase in the future as the notion of postponement in the manufacturing process increases to satisfy the changing tastes and preferences of consumers.
Value-added services are expected to become increasingly important in the Public Storage & Warehousing industry, with clients demanding door-to-door transport networks. As such, other transport operators will begin competing more directly with the industry, and public storage and warehousing operators will need to offer more services to compete effectively with increased competition.
WWW.IBISWORLD.COM� Public�Storage�&�Warehousing�in�the�US April 2011 14
Products�&�Markets
International�Trade There are no imports and exports in this industry.
Major�Marketscontinued
total consumption has meant that the total size of this market has increased. Interestingly, lower inventory levels require better monitoring and tracking, enabling many warehouse operators to increase rates and margins on low-volume, high-turnover inventories. Total logistics costs as a proportion of GDP is estimated at 11.0% in 2011, a significant increase from 8.8% in 2007. This growth implies that there is a large scope within the logistics community to provide services that contain or reduce total logistics costs.
The “other” market segment includes defense and other government agencies. The outsourcing of government warehousing activities is expected to increase in the future as third-party logistics providers continue to demonstrate innovative and cost-efficient processes. Demand from the defense sector is expected to grow over the next five years, with many government agencies expected to receive reduced budgets in light of the large budget deficit arising from the recession, bank bailouts and economic stimulus packages.
Major market segmentation (2011)
Total $14.3bn
49%Wholesalers and retailers
35%Manufacturers
16%Other
SOURCE: WWW.IBISWORLD.COM

WWW.IBISWORLD.COM� Public�Storage�&�Warehousing�in�the�US April 2011 15
�Products�&�Markets
Business�Locations�2011
MO2.3
West
West
West
Rocky Mountains Plains
Southwest
Southeast
New England
Great Lakes
VT0.1
MA2.2
RI0.2
NJ5.2
DE0.4
NH0.3
CT1.0
MD1.9
DC0.1
1
5
3
7
2
6
4
8 9
Additional�States�(as marked on map)
AZ1.5
CA12.5
NV1.2
OR1.3
WA1.9
MT0.2
NE0.5
MN1.2
IA1.0
OH4.7 VA
2.3
FL4.9
KS0.8
CO1.4
UT0.8
ID0.4
TX8.0
OK0.9
NC3.1
AK0.1
WY0.1
TN3.2
KY1.6
GA4.2
IL4.9
ME0.4
ND0.1
WI2.2 MI
2.7 PA4.1
WV0.4
SD0.1
NM0.2
AR0.8
MS0.8
AL1.4
SC2.0
LA1.3
HI0.3
IN2.4
NY4.4 5
67
8
321
4
9
SOURCE: WWW.IBISWORLD.COM
Mid- Atlantic
Establishments�(%)�
� Less�than�3%� 3%�to�less�than�10%� 10%�to�less�than�20%� 20%�or�more

WWW.IBISWORLD.COM� Public�Storage�&�Warehousing�in�the�US April 2011 16
�Products�&�Markets
Business�Locations Industry establishments are concentrated in regions with high populations, high levels of manufacturing activity and large retail sectors. As such, the Great Lakes and Southeast regions have the highest proportion of establishments, while the New England, Southwest and Plains regions all have a smaller proportion of establishment than the proportion of the population. The Southeast region contains the largest portion of the US population, and demand for storage facilities in the region is driven by wholesale and retail activity.
The Great Lakes region dominates US manufacturing activity, especially in heavy manufacturing. Additionally, Chicago is a major transport and distribution hub. The West is a major transport hub for goods imported from Asia. Goods imported from Asia, enter the United States through ports on the West Coast before being transported over land to Chicago. Once in Chicago, these goods are stored, repackaged and distributed to manufacturers, wholesalers and retailers across the eastern seaboard. As international trade grows through the next five years, the number of establishments in the Southeast is expected to increase.
Over the five years to 2016, IBISWorld forecasts a minor redistribution of establishments. The populations in the Southeast and Southwest are expected to continue to grow, while declining populations and manufacturing activity
in the Great Lakes region will cause establishments to decline in that region.
Although not included directly in this industry, a growing number of major players are expanding facilities outside the United States. The strongest growth has been in China, were operators are establishing large warehouse and distribution facilities. These facilities are increasingly being used for storage due to more manufacturing conducted in China. With storage and distribution functions moving offshore, facilities in the United States are increasingly operating more as transit points that hold stock for brief periods before final distribution.
%
30
0
10
20
Sout
hwes
t
Wes
t
Gre
at L
akes
Mid
-Atla
ntic
New
Eng
land
Plai
ns
Rock
y M
ount
ains
Sout
heas
t
EstablishmentsPopulation
Establishments vs. population
SOURCE: WWW.IBISWORLD.COM

WWW.IBISWORLD.COM� Public�Storage�&�Warehousing�in�the�US April 2011 17
Cost�Structure�Benchmarks
Wages and salaries constitute the largest proportion of industry costs due to labor-intensive distribution activity. Wages as a share of revenue have increased over the past five years due to strong growth in employment. As the industry improves over the next five years, IBISWorld expects the industry wage expense (as a percent of revenue) to decrease because increased use of automated systems will reduce the need
for floor staff. Rental costs are expected to continue to rise in key markets, though, and according to industry sources, average rent increased by 3.4% over 2009 to average about $5.56 per square foot.
Industry profitability can vary year from year, but it is expected to average about 10.5% in 2011. This profit is well below the 12.0% profit reported in 2004, which is due in part to the slow economic
Key�Success�Factors Use of most efficient work practicesIt is essential to control labor costs and promote good industrial relations because the industry is relatively labor intensive.
Ability to alter mix of inputs in line with costMonitoring the cost of facilities, such as buildings, fittings and material handling equipment, can be a significant contributor to success.
Production of premium goods and servicesCustomer service levels need to be superior to their competitors and used as a product and service differentiation tool.
Optimum capacity utilizationIncreased throughput and associated value-added services govern profitability.
Output is sold under contract – incorporate long-term sales contractsLong-term contracts are needed because start-up costs are high and returns are very low in the first year.
Provision of appropriate facilitiesHaving a warehouse design that caters to the specific products accommodates clients’ needs.
Market�Share�Concentration
The industry has a low level of concentration, with the top four players accounting for 32.4% of industry revenue in 2011. The low level of concentration is substantiated by the survey of County Business Patterns, which indicates that more than 33.0% of establishments employed fewer than four people, and nearly 67.0% employed fewer than 20.
Over the period from 2006 to 2011, revenue per establishment has remained steady at about $2.5 million. This figure,
however, is distorted by declining revenue in 2009. In 2008, each establishment earned $2.5 million on average. Over the same five-year period, the average number of employees per establishment has increased from 21 to 24. This growth indicates that the average size of establishments in the industry has grown and industry concentration has increased over the past five years. The low level of concentration is due to the relative low barriers to entry and exit.
Competitive�LandscapeMarket�Share�Concentration�� |�� Key�Success�Factors�� |�� Cost�Structure�BenchmarksBasis�of�Competition�� |�� Barriers�to�Entry�� |�� Industry�Globalization
Level��Concentration in this industry is Low
�IBISWorld identifies 250 Key Success Factors for a business. The most important for this industry are:

WWW.IBISWORLD.COM� Public�Storage�&�Warehousing�in�the�US April 2011 18
Competitive�Landscape
Basis�of�Competition The general warehousing segment is very competitive because capacity exceeds demand. Competition is based on price and service levels. In contract distribution warehousing, innovative problem solving for the client can lead to long-term contracts, therefore assuring a reasonable rate of return on the investment of the operator.
Although the Public Storage and Warehousing industry has been experiencing a growing profile, this profile needs to be lifted because warehousing is an important component of logistics and supply chains and its efficient use of resources will contribute to cheaper domestic consumer goods and competitive exports overseas. The ability to provide flexible services would attract a larger range of clients that consider the provision
of general warehousing services as part of their overall supply chain strategy.
External competition stems from the ability of clients to operate their own warehousing facilities. Companies such as Walmart, General Motors, Target, Kmart and Sysco provide substantial warehouse capacity for their own operations. In addition, developments in information technology can reduce lead times in the supply and demand chains, thus reducing the need for warehousing.
With increasing globalization, US warehouses are increasingly being bypassed, especially by products from China. In efforts to make their supply chains more efficient, US manufacturers and retailers are increasingly shifting warehouses and distribution facilities to China.
Cost�Structure�Benchmarkscontinued
conditions and low turnover of stock that are squeezing industry margins. Profit is expected to return to about 12.0% to 13.0% in 2011 as the US economy revives and manufacturing activity returns.
Depreciation costs are relatively lower despite the large capital costs of establishing new warehouses. This proportion is mainly due to the long life-span of infrastructure rather than total capital investment. Over the past
five years, average industry depreciation has increased as firms invested in new larger and more technically advanced warehouse and distribution facilities. This trend is expected to continue through the next five years, pushing depreciation costs even higher.
Purchases include the costs of running warehouse management systems, financing or hiring material handling equipment and waste removal services.
Industry�Costs�and�Average�Sector�Costs■�Profi�t■�Rent■�Utilities■�Depreciation■�Other■�Wages■�Purchases
Industry�Costs�(2011)�
Average�Costs�of�all�Industries�in�sector�(2011)�
10.5Profit
25.829.517.83.15.2
8.1
19.528.036.25.2
2.8
SOURCE: WWW.IBISWORLD.COM
0 100%
3.84.5Profit
Level�&�Trend��Competition in this industry is High and the trend is Steady

WWW.IBISWORLD.COM� Public�Storage�&�Warehousing�in�the�US April 2011 19
Competitive�Landscape
Industry�Globalization
The industry has a medium level of globalization with a number of third-party logistics providers that are either foreign owned or have substantial operations overseas. For instance, Exel USA is now owned by Deutsche Post World Net, and APL Logistics is owned by Singapore-based Neptune and Orient Lines. UPS Supply Chain Solutions has substantial exposure in Europe, and Total Logistics Inc. has a growing presence in South America.
As distribution patterns and supply chain systems have been changing in the United States, UPS and Exel invested in warehouses in China. This move means they will warehouse Chinese-made goods in China and deliver directly to clients, bypassing US warehouses. Opportunities exist in China and India as these countries focus on expanding domestic consumption, which would invariably lead to more effective distribution networks and warehousing services.
Barriers�to�Entry At the lower end of the market, the industry is characterized by a large number of operators that provide basic storage space, and this segment is highly competitive due to its low barriers to entry. In general, though, entry activity in public warehousing is relatively low without the provision of any value-added services. Basic warehousing costs consist of labor and leasing or renting buildings.
With the emergence of third-party logistics providers in the market, contract warehousing has developed into a sophisticated activity, with increasing cost barriers associated with automation and information technology requirements. Contract warehousing also entails long-term contracts with clients, which creates a deterrent to entry because tailor-made systems are developed to service these clients over a
longer period. Additionally, growth in the size of warehouses and the complexity of picking and inventory management systems are increasing the capital outlay that is required to establish new enterprises. This growth may act as a barrier to new entrants, with many new players acquiring existing firms rather than developing new facilities.
Barriers�to�Entry�checklist� LevelCompetition HighConcentration LowLife Cycle Stage MatureCapital Intensity LowTechnology Change HighRegulation & Policy LightIndustry Assistance Low
SOURCE: WWW.IBISWORLD.COM
Level�&�Trend��Barriers to Entry in this industry are Low and Increasing
Level�&�Trend��Globalization in this industry is Low and the trend is Steady

WWW.IBISWORLD.COM� Public�Storage�&�Warehousing�in�the�US April 2011 20
Player�Performance Deutsche Post AG is a global provider of express delivery logistics services. These include freight and forwarding to more than 200 countries through its DHL unit. Deutsche Post also handles mail in Germany, delivering an average of 70 million letters per working day. Through its DHL unit, the company’s courier, express and parcel segment (CEP) was founded by Adrian Dalsey, Larry Hillblom and Robert Lynn in San Francisco in 1969. DHL operates through five business divisions: express, logistics, mail, financial services (through Postbank AG) and services.
The CEP and logistics segments of the business operate through three of the five divisions of the company. The express segment provides transport courier, express and parcel services around the world and combines air and ground transport under the DHL brand. The division provides same-day, time-definite and day-definite products in every major region around the world and is the largest income earner for the company. The logistics division provides a range of international logistics services and has long-term contracts with major and multinational companies across industries. The mail segment caters to the entire mail value chain, which includes the production facilities at central hubs and sales and production centers, to more than 200 countries around the world.
Over the five years to 2011, industry specific company revenue is expected to increase 1.6% to $2.3 billion. Global
economic conditions remained very weak in 2009, especially in Europe where Deutsche Post AG earns most of its revenue. Throughout 2009, company revenue declined 5.1% to $43.05 billion. However, the company did return to profitability due to lower input costs and fuel prices. Despite increased revenue in 2008, Deutsche Post reported a 230.0% decline in profit because of strong growth in all expenses. Notably, wages increased 12.0% to $26.4 billion, materials increased 11.5% and other expenses increased 29.9% to $7.5 billion.
Revenue from logistics activities increased from $780 million in 2003 to $5346 million in 2007, with the strongest growth in 2006 after the acquisition of Exel PLC. Over the year, consolidated revenue increased 51.3% to $79.94 billion. The strong revenue growth was largely attributed to the successful integration of Exel into its logistics business and BHW Holding into the Postbank Group. The rise was also attributable to the appreciation of the euro, which increased strongly against the US dollar. The share of consolidated revenue outside of Germany grew from 49.7% in 2005 to 59.0% in 2006.
The acquisition of Exel occurred in late 2005, forming DHL Exel Supply Chain, one of five DHL brands maintained by Deutsche Post. Others include DHL Express, DHL Freight, DHL Global Forwarding and DHL Global Mail. Exel is the leading contract logistics provider in the Americas and has 40,000 associates at more than 500
�Major�CompaniesDeutsche�Post�AG�� |�� United�Parcel�Service�Inc.�� |�� Other�Companies
77.3%Other
Deutsche�Post�AG�15.7%
United�Parcel�Service�Inc.�7.0%
SOURCE: WWW.IBISWORLD.COM
Major�players(Market share)
Deutsche�Post�AG��Market share: 15.7%

WWW.IBISWORLD.COM� Public�Storage�&�Warehousing�in�the�US April 2011 21
Major�Companies
Player�Performance United Parcel Services (UPS) Supply Chain Solutions is a third-party logistics provider with 38 million square feet of warehouse space under its control globally. Supply Chain Solutions was formed from a number of acquisitions and operates from more than 750 facilities in 125 countries and territories worldwide. The division is part of UPS’ supply chain group, which also includes UPS Ground Freight, UPS Capital, UPS
Consulting, UPS Mail Innovations and postal store franchising. Services provided in its logistics and distribution activity include supply chain management, order and inventory management, service parts logistics and distribution center management.
Over the five years to 2011, company revenue is expected to increase 0.2% annually to $48.1 billion. The recession and falling demand, especially from
Player�Performancecontinued
sites throughout the United States, Canada and Latin America. In the United States, Exel offers 75 million
square feet of warehouse space and operates from 386 facilities through 22,000 associates.
Deutsche�Post�AG�(warehousing�segment)��–�fi�nancial�performance
YearRevenue�
($ million) (% change)Net�Income�
($ million) (% change)
2006 2,085 8.1 588 3.7
2007 2,131 2.2 591 0.5
2008 2,167 1.7 586 -0.8
2009 2,010 -7.2 566 -3.4
2010 2,176 8.3 569 0.5
2011* 2,254 3.6 584 2.6
*EstimateSOURCE: IBISWORLD
United�Parcel�Service�Inc.�–�fi�nancial�performance
YearRevenue�
($ million) (% change)Net�Income�
($ million) (% change)
2006 47,547 11.7 4,202 8.6
2007 49,692 4.5 382 -90.9
2008 51,486 3.6 3,003 686.1
2009 45,297 -12.0 2,152 -28.3
2010 47,621 5.1 2,262 5.1
2011* 48,116 1.0 2,341 3.5
*Estimate
SOURCE: HOOVERS.COM
United�Parcel�Service�Inc.��Market share: 7.0%

WWW.IBISWORLD.COM� Public�Storage�&�Warehousing�in�the�US April 2011 22
Major�Companies
Other�Companies Caterpillar Logistics Services Inc.Estimated market share: 4.9%In 1987, Caterpillar Logistics Services Inc. (Cat Logistics) is a wholly owned subsidiary of Caterpillar Inc. The subsidiary was formed to build on the global distribution experience of its parent company to help businesses lower their distribution costs while improving customer service and brand loyalty. Cat Logistics is a technology-based company that provides customized solutions to help create competitive advantages through distribution. It does this by providing integrated solutions from managing transportation, inventory and distribution centers to sophisticated forecasting, information management and network consulting services.
Currently, Cat Logistics services more than 60 client companies in an array of different market sectors worldwide. In the United States, Cat Logistics has 105 warehousing facilities that offer an estimated 27 million square feet of total warehouse space.
IBISWorld estimates that Caterpillar generated about $703.1 million from the general warehousing industry in 2011, down from $939 million in 2008. Its US warehouse facility generated an estimated $660 million in 2007. Consolidated revenue has been
increasing steadily for Caterpillar, with growth in all major product segments (machinery, engines and financial products). Notably, international demand drove growth, with revenue from international operations increasing to 67.0% of total revenue in 2008 from 54.0% in 2004. North America, however, remained the largest market, generating $20.2 billion in 2008; although this number is still below 2006 levels. Revenue from Europe, Africa and the Middle East increased 16.0%, but was doubled by the Asia-Pacific region over the same year. Strong growth in the Asia-Pacific region was supported by strong demand from the resources sector, especially in Australia, new operations in Japan and strong demand for construction equipment in India and China.
CEVA Group PLCEstimated market share: 4.8%CEVA was formed as a result of a 2007 merger between TNT Logistics and EGL. The origin of its contract logistics business is with TNT, which was founded in Australia in 1946. In 1996, TNT was acquired by postal and telecommunications company KPN in the Netherlands. In 1998, the telecom and postal divisions of KPN were separated.
Player�Performancecontinued
corporate customers, resulted in company revenue declining sharply in 2009. Despite lower transport and fuel costs, net income declined even more sharply due to customers switching from premium and express services to surface transport. Company revenue grew by 3.6% in 2008, though, to $51.49 billion, supported by higher freight rates and fuel surcharges. Total freight movements decreased marginally through the year, and profit jumped by 686.1% to $3 billion despite higher fuel
costs. The boost in profit reflects unusually low profit in 2007, arising from the withdrawal from the central states, Southeast and Southwest. Industry revenue hit $700 million in 2007, increasing from $430 million in 2003. In 2006, UPS built 10 warehouses in China to offer its US clients cost effective supply chain solutions by bypassing US warehouses for goods destined to the United States from China. It added another 50 warehouses in 2005.

WWW.IBISWORLD.COM� Public�Storage�&�Warehousing�in�the�US April 2011 23
Major�Companies
Other�Companiescontinued
The resulting company, TNT NV, was then organized into three divisions: TNT Logistics, TNT Express and TNT Post.
At the end of 2005, TNT announced its intention to sell its contract logistics activities as the result of a revised strategic focus. In 2006, affiliates of Apollo Management LP bought TNT Logistics and rebranded it CEVA Logistics in December of that year. CEVA Logistics US Inc. operates as a regional unit. Together with its affiliates, the US entity specializes in managing the supply chains of companies in industries including automotive, consumer goods, electronics, manufacturing and technology. In the United States, it manages and operates 145 facilities that offer about 26 million square feet of warehouse space.
IBISWorld estimates that CEVA Logistics generated about $688.7 million in 2011 from the general warehousing industry, down from $722.0 million in 2008. In 2007, revenue amounted to $507 million.
DSC LogisticsEstimated market share: 1.9%Privately owned DSC Logistics had its beginnings as Dry Storage Corporation in 1960, and it controlled 15 million square feet of warehouse space in the United States in 2007. DSC Logistics is a third-party logistics provider that specializes in warehousing, transportation and packaging for its clients, which include General Mills and Kimberley-Clarke.
Revenue decreased to an estimated $272.6 million in 2011 from $491 million in 2008. Despite the decline in revenue, which was caused by the recession, revenue remains well above the $244 million earned in 2003 following expansion of capacity and increased uptake of warehouse outsourcing activity
In August 2005, DSC struck a three-
year deal to supply logistics and transportation management services for Kramer Labs out of DSC’s Des Plaines Logistics Center. This deal included centralized warehouse services, inbound transportation of over-the-counter pharmaceuticals from Kramer Labs’ manufacturing plants to DSC’s Des Plaines Logistics Center and outbound transportation from the logistics center to selected customers across the United States. DSC also provides international shipping, parcel and small package shipping, display building and other value-added services.
Supervalu Inc.Estimated market share: 1.8%Supervalu acquired Total Logistics Control (TLC) in 2005 for $233 million, including total assumed debt for TLC. Supervalu is a grocery retailer and distributor, while Total Logistics Control provided a full range of integrated third-party logistic services and operated a number of dedicated facilities in the Midwest.
TLC directly operates public warehouses with total storage space of 1.12 million square feet. The company contracts with various dry warehouse facilities to provide warehousing and order-fulfillment services on behalf of its clients under long-term logistics management services contracts. TLC also contracts to manage customer-owned distribution facilities. TLC’s customers consist of international, national, regional and local firms that are engaged in food and beverage manufacturing, consumer and industrial product manufacturing, wholesale distribution and retailing. The TLC acquisition helped build Supervalu’s third-party logistics business. IBISWorld estimates that Supervalu earned $258.3 million in revenue from general warehousing in 2011, up from $150 million in 2003.
WWW.IBISWORLD.COM� Public�Storage�&�Warehousing�in�the�US April 2011 24
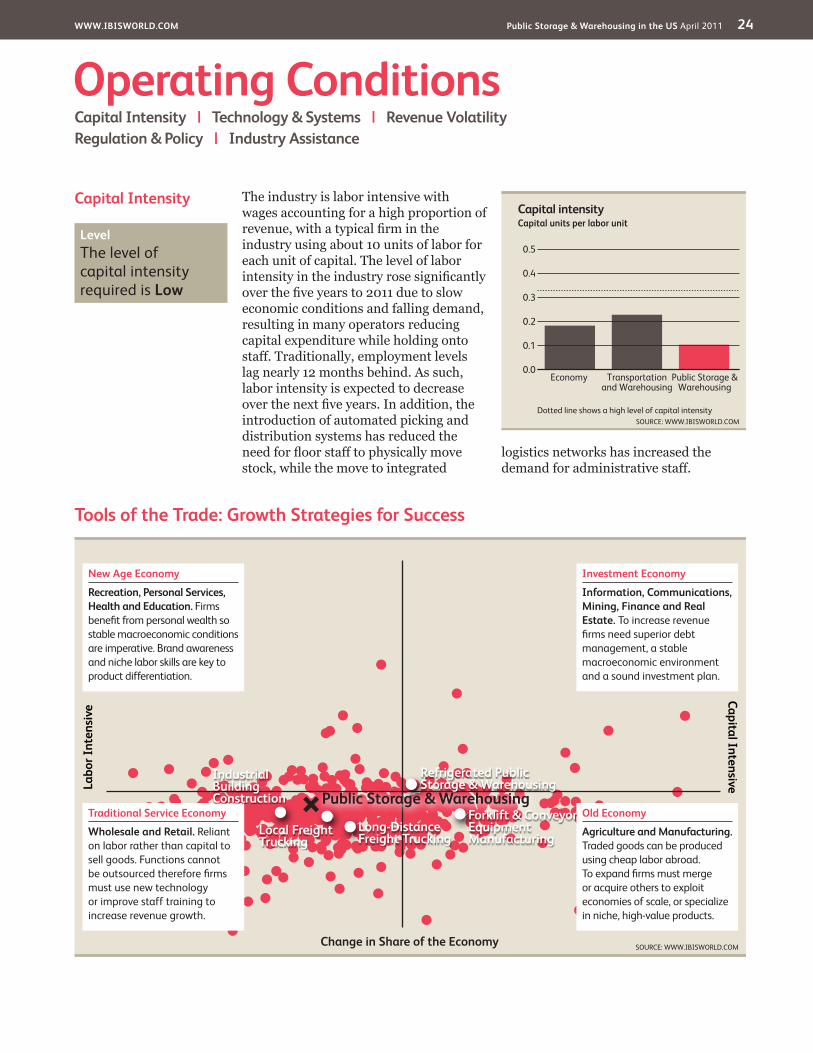
Capital�Intensity The industry is labor intensive with wages accounting for a high proportion of revenue, with a typical firm in the industry using about 10 units of labor for each unit of capital. The level of labor intensity in the industry rose significantly over the five years to 2011 due to slow economic conditions and falling demand, resulting in many operators reducing capital expenditure while holding onto staff. Traditionally, employment levels lag nearly 12 months behind. As such, labor intensity is expected to decrease over the next five years. In addition, the introduction of automated picking and distribution systems has reduced the need for floor staff to physically move stock, while the move to integrated
logistics networks has increased the demand for administrative staff.
�Operating�ConditionsCapital�Intensity�� |�� Technology�&�Systems�� |�� Revenue�VolatilityRegulation�&�Policy�� |�� Industry�Assistance
Tools�of�the�Trade:�Growth�Strategies�for�Success
SOURCE: WWW.IBISWORLD.COM
Labo
r�Int
ensi
veCapital�Intensive
Change�in�Share�of�the�Economy
New�Age�Economy
Recreation,�Personal�Services,�Health�and�Education. Firms benefi t from personal wealth so stable macroeconomic conditions are imperative. Brand awareness and niche labor skills are key to product differentiation.
Traditional�Service�Economy
Wholesale�and Retail. Reliant on labor rather than capital to sell goods. Functions cannot be outsourced therefore fi rms must use new technology or improve staff training to increase revenue growth.
Old�Economy
Agriculture�and�Manufacturing.�Traded goods can be produced using cheap labor abroad. To expand fi rms must merge or acquire others to exploit economies of scale, or specialize in niche, high-value products.
Investment�Economy
Information,�Communications,�Mining,�Finance�and�Real�Estate.�To increase revenue fi rms need superior debt management, a stable macroeconomic environment and a sound investment plan.
Local�Freight�Trucking
Industrial�Building�Construction
Long-Distance�Freight�Trucking
Forklift�&�Conveyor�Equipment�Manufacturing
Refrigerated�Public�Storage�&�Warehousing
Public�Storage�&�Warehousing
Capital intensity
0.5
0.0
0.1
0.2
0.3
0.4
SOURCE: WWW.IBISWORLD.COMDotted line shows a high level of capital intensity
Capital units per labor unit
Public Storage & Warehousing
Transportation and Warehousing
Economy
Level��The level of capital intensity required is Low

WWW.IBISWORLD.COM� Public�Storage�&�Warehousing�in�the�US April 2011 25
Operating�Conditions
Technology&�Systems
The use of information technology in the general warehousing industry has been on the rise, with companies using supply-chain management (SCM) applications to improve their operational performance, especially with regard to lowering costs and reducing inventory. Companies continue to use SCM applications to improve their performance in terms of execution rather than planning, which has taken a back seat. In the near future, interest in execution will continue, with supply chain event management (SCEM) becoming one of the most sought-after functionalities to help companies achieve greater visibility in their increasingly fragmented supply chains. SCEM functionality is becoming increasingly important as companies outsource more of their supply chain operations. Also, security issues will continue to drive companies toward SCEM-oriented applications as they seek to accurately track goods around the globe. In this regard, radio frequency identification (RFID) technology, in addition to other wireless supply chain technologies, will experience greater use over time in warehousing facilities. RFID tags contain a small chip that carries much more information than a bar code. Readers located inside the warehouse and on trucks and trailers scan the tags, which then conveys tracking information, such as product movement, time in transit and temperature fluctuations.
There has been an increasing trend in cross-docking, where typically high-turnover, high-volume palletized products move through the warehouse
without being received into inventory. Instead, the pallets are received on the dock and assigned to a staging zone that is destined for a final delivery location along with pallets from the warehouse itself. The trend of cross-docking mixed pallet loads is pushing suppliers and manufacturers that handle significant volumes to implement more automated equipment to help build these mixed pallets of products. Equipment introduced includes automatic bar coding, automated storage and retrieval system and automatic guided vehicles.
The requirement of flexibility in product picking has driven an interest in systems, such as pick-to-light and voice-directed picking. New technology has been developed to help make product picking more efficient, including the convergence of voice and RFID technology. The benefits of voice-directed systems include increased productivity in cases picked per hour, eliminating language barriers that may have hindered productivity, while the portability of voice makes it easy to install in a new or expanded facility.
Voice has become more affordable in recent years, varying in price from $4,200 to $8,500 per picker and including the cost of the headset, RF device, software, implementation and training. Voice recognition is a warehouse technology that has come of age and can drive dramatic gains in picking productivity. Voice is being combined with scanning in multimodal applications at a higher rate than a few years ago.
Level��The level of Technology Change is High

WWW.IBISWORLD.COM� Public�Storage�&�Warehousing�in�the�US April 2011 26
Operating�Conditions
Industry�Assistance Although the industry is not directly affected by tariffs, lowered tariffs have increased import penetration, thereby increasing the number of consumable
and durable products entering the United States. The increased number in variety of products provides demand for warehousing activities.
Regulation�&�Policy There are a number of licensing laws that affect a warehouse operator, depending on the type of goods to store. For example, a food warehousing operator would need the appropriate licenses from the relevant health authorities, and a hazardous goods operator would need licensing by the relevant state government. The costs of these licenses are not significant barriers to entry. For instance, Maryland’s Storage Warehouse License fees vary from $30 to
$150 per year, depending on population sizes of each municipal corporation within Maryland.
Importers of goods are subject to regulations imposed by the United States Customs Service Treasury, whereby bonded goods are stored and inspected in bonded warehouses. The United States Customs Service Treasury Act, Title 19, Chapter 4, is the relevant legislation that covers bonded warehouses.
Level�&�Trend��The level of Regulation is Light and the trend is Steady
Level�&�Trend��The level of Industry Assistance is Low and the trend is Steady
SOURCE: WWW.IBISWORLD.COM
Volatility�vs�Growth
Reve
nue�
vola
tility
*�(%
)�
1000
100
10
1
0.1
Five�year�annualized�revenue�growth�(%)�–30 –10 10 30 50 70
Hazardous
Stagnant
Rollercoaster
Blue�Chip
* Axis is in logarithmic scale
Public�Storage�&�Warehousing
A higher level of revenue volatility implies greater industry risk. Volatility can negatively affect long-term strategic decisions, such as the time frame for capital investment.
When a fi rm makes poor investment decisions it may face underutilized capacity if demand suddenly falls, or capacity constraints if it rises quickly.
Revenue�Volatility There has been a growing trend in contract distribution. Manufacturers and wholesalers are increasingly using third-party logistics providers to manage supply chains, which has led to a gradual increase in warehousing activity. Most of
the products warehoused are nonbulk items – mainly consumables and durables whose demand varies. Over the past five years, revenue has fluctuated between growth of 3.3% in 2010 and a contraction of 6.8% in 2009.
Level��The level of Volatility is Medium

WWW.IBISWORLD.COM� Public�Storage�&�Warehousing�in�the�US April 2011 27
�Key�StatisticsRevenue�
($m)
Industry�Value�Added�
($m)Establish-
ments Enterprises Employment Exports ImportsWages�($m)
Domestic�Demand
Per�Capita�Disposable�Income�($)
2002 12,581.1 5,357.1 4,893 3,152 94,316 -- -- 3,444.7 N/A 29,9762003 13,100.9 5,853.7 5,199 3,285 107,333 -- -- 3,862.5 N/A 30,4422004 12,453.1 5,691.7 5,398 3,369 115,066 -- -- 3,813.1 N/A 31,1932005 12,864.4 5,572.2 5,327 3,340 113,580 -- -- 3,575.2 N/A 31,3182006 13,905.8 5,993.6 5,540 3,429 125,274 -- -- 3,906.9 N/A 32,2712007 14,204.1 6,241.0 5,675 3,591 134,526 -- -- 4,314.1 N/A 32,6482008 14,445.7 6,504.0 5,712 3,637 137,808 -- -- 4,503.4 N/A 32,5142009 13,460.3 6,314.9 5,742 3,673 135,698 -- -- 4,484.3 N/A 32,5002010 13,900.0 6,180.8 5,616 3,518 124,501 -- -- 4,290.5 N/A 32,5822011 14,348.6 6,182.4 5,658 3,568 127,467 -- -- 4,231 N/A 32,7782012 14,914.7 6,482.5 5,735 3,662 133,095 -- -- 4,454.1 N/A 33,3022013 15,361.4 6,570.2 5,803 3,746 130,167 -- -- 4,481.1 N/A 33,8782014 15,967.5 6,805.7 5,855 3,811 135,873 -- -- 4,634.1 N/A 34,5292015 16,701.6 7,239.0 5,924 3,898 143,555 -- -- 4,967.6 N/A 35,2642016 17,272.8 7,636.4 6,006 4,002 149,817 -- -- 5,287.3 N/A 25,980Sector�Rank 15/37 16/37 16/37 15/37 14/37 N/A N/A 15/37 N/A N/AEconomy�Rank 395/698 336/698 335/697 353/695 234/698 N/A N/A 267/697 N/A N/A
IVA/Revenue�(%)
Imports/Demand�
(%)
Exports/Revenue�
(%)
Revenue�per�Employee�
($’000)Wages/Revenue�
(%)Employees�
per�Est.Average�Wage�
($)
Share�of�the�Economy�
(%)2002 42.58 N/A N/A 133.39 27.38 19.28 36,522.97 0.052003 44.68 N/A N/A 122.06 29.48 20.64 35,986.14 0.052004 45.71 N/A N/A 108.23 30.62 21.32 33,138.37 0.052005 43.31 N/A N/A 113.26 27.79 21.32 31,477.37 0.042006 43.10 N/A N/A 111.00 28.10 22.61 31,186.84 0.052007 43.94 N/A N/A 105.59 30.37 23.71 32,068.89 0.052008 45.02 N/A N/A 104.82 31.17 24.13 32,678.80 0.052009 46.92 N/A N/A 99.19 33.32 23.63 33,046.18 0.052010 44.47 N/A N/A 111.65 30.87 22.17 34,461.57 0.052011 43.09 N/A N/A 112.57 29.49 22.53 33,192.90 0.052012 43.46 N/A N/A 112.06 29.86 23.21 33,465.57 0.052013 42.77 N/A N/A 118.01 29.17 22.43 34,425.78 0.052014 42.62 N/A N/A 117.52 29.02 23.21 34,106.11 0.052015 43.34 N/A N/A 116.34 29.74 24.23 34,604.16 0.052016 44.21 N/A N/A 115.29 30.61 24.94 35,291.72 0.05Sector�Rank 20/37 N/A N/A 24/37 12/37 13/37 28/37 16/37Economy�Rank 265/698 N/A N/A 542/698 165/697 254/697 477/697 336/698
Figures are inflation-adjusted 2011 dollars. Rank refers to 2011 data.
Revenue�(%)
Industry�Value�Added�
(%)
Establish-ments�
(%)Enterprises�
(%)Employment�
(%)Exports�
(%)Imports�
(%)Wages�
(%)
Domestic�Demand�
(%)
Per�Capita�Disposable�Income�(%)
2003 4.1 9.3 6.3 4.2 13.8 N/A N/A 12.1 N/A 1.62004 -4.9 -2.8 3.8 2.6 7.2 N/A N/A -1.3 N/A 2.52005 3.3 -2.1 -1.3 -0.9 -1.3 N/A N/A -6.2 N/A 0.42006 8.1 7.6 4.0 2.7 10.3 N/A N/A 9.3 N/A 3.02007 2.1 4.1 2.4 4.7 7.4 N/A N/A 10.4 N/A 1.22008 1.7 4.2 0.7 1.3 2.4 N/A N/A 4.4 N/A -0.42009 -6.8 -2.9 0.5 1.0 -1.5 N/A N/A -0.4 N/A 0.02010 3.3 -2.1 -2.2 -4.2 -8.3 N/A N/A -4.3 N/A 0.32011 3.2 0.0 0.7 1.4 2.4 N/A N/A -1.4 N/A 0.62012 3.9 4.9 1.4 2.6 4.4 N/A N/A 5.3 N/A 1.62013 3.0 1.4 1.2 2.3 -2.2 N/A N/A 0.6 N/A 1.72014 3.9 3.6 0.9 1.7 4.4 N/A N/A 3.4 N/A 1.92015 4.6 6.4 1.2 2.3 5.7 N/A N/A 7.2 N/A 2.1
2016 3.4 5.5 1.4 2.7 4.4 N/A N/A 6.4 N/A -26.3Sector�Rank 18/37 32/37 20/37 16/37 13/37 N/A N/A 33/37 N/A N/AEconomy�Rank 293/698 594/698 305/697 180/695 156/698 N/A N/A 616/697 N/A N/A
Annual�Change
Key�Ratios
Industry�Data
SOURCE: WWW.IBISWORLD.COM

WWW.IBISWORLD.COM� Public�Storage�&�Warehousing�in�the�US April 2011 28
Jargon�&�Glossary
BARRIERS�TO�ENTRY Barriers to entry can be High, Medium or Low. High means new companies struggle to enter an industry, while Low means it is easy for a firm to enter an industry.
CAPITAL/LABOR�INTENSITY An indicator of how much capital is used in production as opposed to labor. Level is stated as High, Medium or Low. High is a ratio of less than $3 of wage costs for every $1 of depreciation; Medium is $3 – $8 of wage costs to $1 of depreciation; Low is greater than $8 of wage costs for every $1 of depreciation.
DOMESTIC�DEMAND The use of goods and services within the US; the sum of imports and domestic production minus exports.
EARNINGS�BEFORE�INTEREST�AND�TAX�(EBIT)� IBISWorld uses EBIT as an indicator of a company’s profitability. It is calculated as revenue minus expenses, excluding tax and interest.
EMPLOYMENT The number of working proprietors, partners, permanent, part-time, temporary and casual employees, and managerial and executive employees.
ENTERPRISE A division that is separately managed and keeps management accounts. The most relevant measure of the number of firms in an industry.
ESTABLISHMENT The smallest type of accounting unit within an Enterprise; usually consists of one or more locations in a state or territory of the country in which it operates.
EXPORTS The total sales and transfers of goods produced by an industry that are exported.
IMPORTS The value of goods and services imported with the amount payable to non-residents.
INDUSTRY�CONCENTRATION IBISWorld bases concentration on the top four firms. Concentration is identified as High, Medium or Low. High means the top four players account for over 70% of revenue; Medium is 40 –70% of revenue; Low is less than 40%.
INDUSTRY�REVENUE The total sales revenue of the industry, including sales (exclusive of excise and sales tax) of goods and services; plus transfers to other firms of the same business; plus subsidies on production; plus all other operating income from outside the firm (such as commission income, repair and service income, and rent, leasing and hiring income); plus capital work done by rental or lease. Receipts from interest royalties, dividends and the sale of fixed tangible assets are excluded.
INDUSTRY�VALUE�ADDED The market value of goods and services produced by an industry minus the cost of goods and services used in the production process, which leaves the gross product of the industry (also called its Value Added).
INTERNATIONAL�TRADE The level is determined by: Exports/Revenue: Low is 0 –5%; Medium is 5 –20%; High is over 20%. Imports/Domestic Demand: Low is 0 –5%; Medium is 5 –35%; and High is over 35%.
LIFE�CYCLE All industries go through periods of Growth, Maturity and Decline. An average life cycle lasts 70 years. Maturity is the longest stage at 40 years with Growth and Decline at 15 years each.
NON-EMPLOYING�ESTABLISHMENT Businesses with no paid employment and payroll are known as non-employing establishments. These are mostly set-up by self employed individuals.
VOLATILITY The level of volatility is determined by the percentage change in revenue over the past five years. Volatility levels: Very High is greater than ±20%; High Volatility is between ±10% and ±20%; Moderate Volatility is between ±3% and ±10%; and Low Volatility is less than ±3%.
WAGES The gross total wages and salaries of all employees of the establishment.
Industry�Jargon
IBISWorld�Glossary
BIG-BOX�RETAILERS A retail store that is differentiated by its sheer size and large range of products, including electronics, households goods and other consumer products.
INTEGRATED�LOGISTICS�NETWORKS A vertically merged supply chain.
JUST-IN-TIME�(JIT)� A strategy implemented to improve profitability by reducing inventory and purchasing the raw materials that are needed for the immediate term only.
RADIO�FREQUENCY�IDENTIFICATION�(RFID)� A technology that continuously releases signals from a chip to track products from the time they leave the assembly line to the time they leave the store.
THIRD-PARTY�LOGISTICS�PROVIDERS An operator that provides warehousing, transport, distribution and other logistics services to third parties, usually under contract.

Disclaimer
This product has been supplied by IBISWorld Inc. (‘IBISWorld’) solely for use by its authorized licenses strictly in accordance with their license agreements with IBISWorld. IBISWorld makes no representation to any other person with regard to the completeness or accuracy of the data or information contained herein, and it accepts no responsibility and disclaims all liability (save for liability which cannot be lawfully disclaimed) for loss or damage whatsoever suffered or incurred by any other person resulting from the use
of, or reliance upon, the data or information contained herein. Copyright in this publication is owned by IBISWorld Inc. The publication is sold on the basis that the purchaser agrees not to copy the material contained within it for other than the purchasers own purposes. In the event that the purchaser uses or quotes from the material in this publication – in papers, reports, or opinions prepared for any other person – it is agreed that it will be sourced to: IBISWorld Inc.
At IBISWorld we know that industry intelligence is more than assembling factsIt is combining data with analysis to answer the questions that successful businesses askIdentify�high�growth,�emerging�&�shrinking�marketsArm�yourself�with�the�latest�industry�intelligenceAssess�competitive�threats�from�existing�&�new�entrantsBenchmark�your�performance�against�the�competitionMake�speedy�market-ready,�profit-maximizing�decisions
Who�is�IBISWorld?We are strategists, analysts, researchers, and marketers. We provide answers to information-hungry, time-poor businesses. Our goal is to provide real world answers that matter to your business in our 700 US industry reports. When tough strategic, budget, sales and marketing decisions need to be made, our suite of Industry and Risk intelligence products give you deeply-researched answers quickly.
IBISWorld�MembershipIBISWorld offers tailored membership packages to meet your needs.
Copyright 2011 IBISWorld Inc
www.ibisworld.com��|��1800-330-3772��| ��[email protected]