ibisworld industry report 42469 chemical wholesaling in the us
TRANSCRIPT
WWW.IBISWORLD.COM Chemical Wholesaling in the US December 2019 1
IBISWorld Industry Report 42469Chemical Wholesaling in the USDecember 2019 Griffin Holcomb
Chemical makeup: Strong demand from the manufacturing sector will boost industry revenue
2 About this Industry2 Industry Definition
2 Main Activities
2 Similar Industries
3 Additional Resources
4 Industry at a Glance
5 Industry Performance5 Executive Summary
5 Key External Drivers
7 Current Performance
9 Industry Outlook
11 Industry Life Cycle
13 Products and Markets13 Supply Chain
14 Products and Services
15 Demand Determinants
15 Major Markets
16 International Trade
17 Business Locations
19 Competitive Landscape19 Market Share Concentration
19 Key Success Factors
19 Cost Structure Benchmarks
21 Basis of Competition
22 Barriers to Entry
22 Industry Globalization
23 Major Companies23 Air Liquide USA
23 Univar USA Inc.
24 Nexeo Solutions Holdings LLC
25 Operating Conditions25 Capital Intensity
26 Technology and Systems
26 Revenue Volatility
27 Regulation and Policy
28 Industry Assistance
29 Key Statistics29 Industry Data
29 Annual Change
29 Key Ratios
30 Industry Financial Ratios
31 Jargon & Glossary
www.ibisworld.com | 1-800-330-3772 | [email protected]
WWW.IBISWORLD.COM Chemical Wholesaling in the US December 2019 2
This industry wholesales chemicals and related products, including compressed gas, chemical additives and synthetic rubber, to the manufacturing,
construction and mining industries. This industry does not wholesale agricultural or medicinal chemicals, paints or varnishes, fireworks or plastics materials.
The primary activities of this industry are
Wholesaling acids
Wholesaling chemical additives (e.g. concrete, food, fuel and oil)
Wholesaling compressed gases, except liquefied petroleum gas
Wholesaling explosives, except ammunition and fireworks
Wholesaling industrial chemicals
Wholesaling laundry soap, chips and powder
Wholesaling oil additives
Wholesaling resins and synthetic rubber
Wholesaling sulfuric acid
Wholesaling synthetic rubber
42392 Toy & Craft Supplies Wholesaling in the USThis industry wholesales fireworks.
42421 Drug, Cosmetic & Toiletry Wholesaling in the USThis industry wholesales biological and medical products, botanical drugs and herbs and pharmaceutical products.
42461 Plastics Wholesaling in the USThis industry wholesales plastic materials and resins and unsupported plastic film, sheet, sheeting, rods and tubes.
42472 Gasoline & Petroleum Wholesaling in the USThis industry wholesales lubricating oils and greases.
42491 Farm Supplies Wholesaling in the USThis industry wholesales farm supplies, including animal feeds, fertilizers, agricultural chemicals, pesticides, seeds and plant bulbs.
Industry Definition
Main Activities
Similar Industries
About this Industry
The major products and services in this industry are
Adhesives, automotive chemicals
Alkalis and chlorine
Biofuels
Detergents and soaps
Industrial gases
Other chemicals
WWW.IBISWORLD.COM Chemical Wholesaling in the US December 2019 3
About this Industry
42495 Paint Wholesaling in the USThis industry wholesales paints, varnishes, pigments, wallpaper and supplies such as paint brushes and rollers.
Similar Industriescontinued
IBISWorld writes over 1000 US industry reports, which are updated up to four times a year. To see all reports, go to www.ibisworld.com
For additional information on this industry
www.ihs.com IHS Markit
www.nacd.com National Association of Chemical Distributors
www.naw.org National Association of Wholesaler-Distributors
Additional Resources
WWW.IBISWORLD.COM Chemical Wholesaling in the US December 2019 4
% c
hang
e
10
-2
0
2
4
6
8
2513 15 17 19 21 23Year
Demand from construction
SOURCE: WWW.IBISWORLD.COM
% c
hang
e
15
-10
-5
0
5
10
2511 13 15 17 19 21 23Year
Revenue Employment
Revenue vs. employment growth
Products and services segmentation (2019)
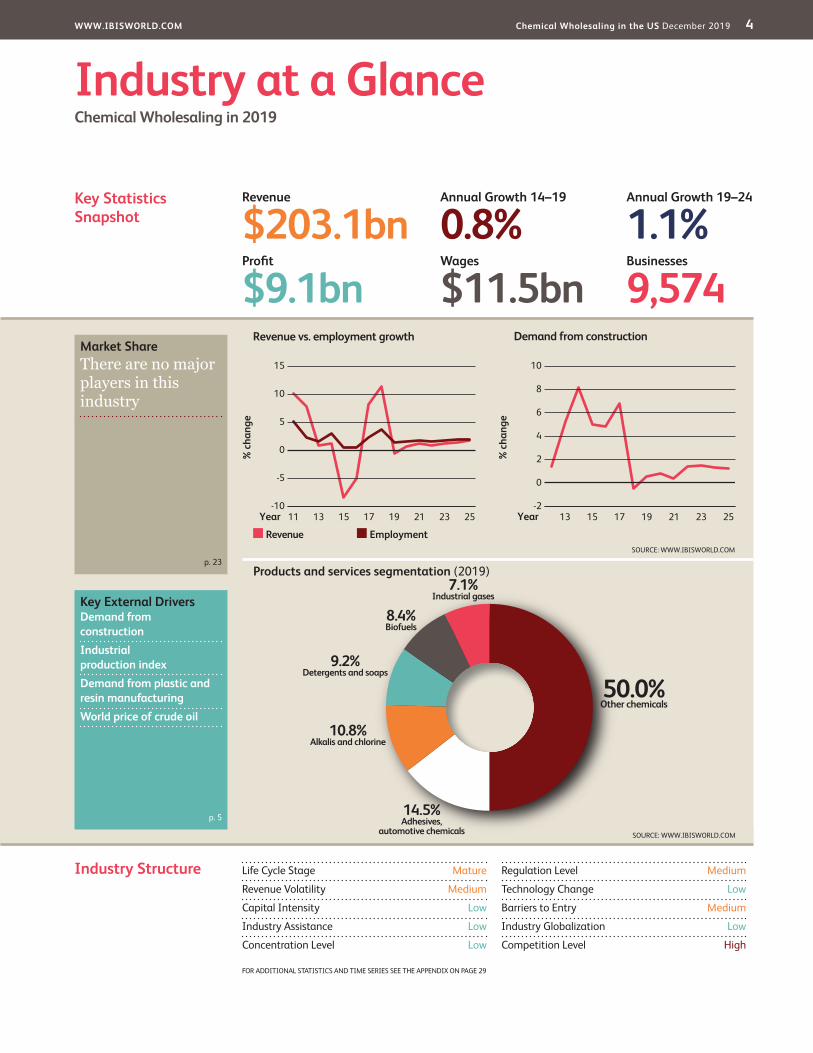
50.0%Other chemicals
7.1%Industrial gases
14.5%Adhesives,
automotive chemicals
10.8%Alkalis and chlorine
9.2%Detergents and soaps
8.4%Biofuels
Key Statistics Snapshot
Industry at a GlanceChemical Wholesaling in 2019
Industry Structure Life Cycle Stage Mature
Revenue Volatility Medium
Capital Intensity Low
Industry Assistance Low
Concentration Level Low
Regulation Level Medium
Technology Change Low
Barriers to Entry Medium
Industry Globalization Low
Competition Level High
Revenue
$203.1bnProfit
$9.1bnWages
$11.5bnBusinesses
9,574
Annual Growth 19–24
1.1%Annual Growth 14–19
0.8%
Key External DriversDemand from constructionIndustrial production indexDemand from plastic and resin manufacturingWorld price of crude oil
Market ShareThere are no major players in this industry
p. 23
p. 5
FOR ADDITIONAL STATISTICS AND TIME SERIES SEE THE APPENDIX ON PAGE 29
SOURCE: WWW.IBISWORLD.COM
WWW.IBISWORLD.COM Chemical Wholesaling in the US December 2019 5
Key External Drivers Demand from constructionThe construction sector uses various products that are distributed to them by chemical wholesalers. Therefore, activity in the construction sector drives demand for the Chemical Wholesaling industry. Demand from the construction sector is expected to increase in 2019, representing a potential opportunity for the industry.
Industrial production indexThe industrial production index (IPI) measures output from the mining, manufacturing, electric and gas industries. Chemicals supplied by chemical wholesalers are used in many of these industries. Therefore, the IPI is a leading indicator for the level of domestic demand for chemical wholesalers, with an increase in the IPI typically meaning an increase in
Executive Summary Operators in the Chemical Wholesaling industry buy chemicals from manufacturers and redistribute them as raw materials to manufacturers of products that require chemical inputs. The construction and manufacturing sectors are the key customers for chemical wholesalers and, as a result, their production levels largely determine industry demand. The construction sector uses chemicals such as adhesives, epoxies and sealants. Residential construction increased at an annualized rate of 1.4% over the five years to 2019. Consequently, the Plastic and Resin
Manufacturing (IBISWorld report 32521) and Paint Manufacturing (32551) industries, have also increased their demand for chemicals.
Furthermore, consumer spending has contributed to growth in the industry. Consumer spending has increased at an annualized rate of 2.6%, leading many manufacturing-related industries to increase production and purchase more chemicals. However, a drastic decrease in crude oil prices beginning in late 2014 led to operators reducing top-line selling prices of industry products. Since oil is a major input cost for chemical
manufacturers, the resulting reduction in industry input prices were passed down the supply chain, reducing the selling prices of industry products during the middle of the five-year period. This reduction led to an overall decrease in revenue between 2015 and 2016. However, between 2017 and 2018, crude oil rebounded before falling again in 2019. Consequently, industry revenue is expected to rise at an annualized rate of 0.8% to $203.1 billion over the five years to 2019. Nevertheless, due to volatile input prices, industry revenue is expected to decrease 0.6% in 2019 alone. Despite this, profit margin has remained stagnant, accounting for 4.5% of industry revenue in 2019, down slightly from 4.9% in 2014.
The industry is projected to experience strong demand from the manufacturing and construction sectors, which, in conjunction with recovering oil prices, will drive up revenue. Industry revenue is forecast to grow at an annualized rate of 1.1% to $214.1 billion over the five years to 2024. This growth is expected to encourage more companies to enter the industry, although some consolidation is expected, as industry players can experience greater returns of scale by spreading out costs, such as regulatory compliance. Overall, strengthening downstream markets are anticipated to bolster industry performance over the five years to 2024.
Industry PerformanceExecutive Summary | Key External Drivers | Current Performance Industry Outlook | Life Cycle Stage
Consumer spending has contributed to growth in the industry

WWW.IBISWORLD.COM Chemical Wholesaling in the US December 2019 6
Industry Performance
Key External Driverscontinued
demand for industrial chemicals. The IPI is expected to rise in 2019.
Demand from plastic and resin manufacturingThis industry manufactures resins, plastic materials, such as polymers, and synthetic rubber. This includes thermosetting resins, thermoplastic resins and synthetic rubber. Raw material inputs are sourced from chemical industries and industries involved in the production of petroleum-based feedstock which the Chemical Wholesaling Industry provides. Demand
from plastic and resin manufacturing is expected to increase in 2019.
World price of crude oilSeveral key raw material inputs are derived from petrochemical feedstock, so changes in the price of oil can greatly affect the industry’s cost structure. The world price of oil is expected to decrease in 2019. Volatile prices will pass on some risk to operators that must be adept at managing supply contracts. Therefore, the volatility in world price of crude oil poses a potential threat to the industry.
Inde
x125
95
100
105
110
115
120
2612 14 16 18 20 22 24Year
Industrial production index
SOURCE: WWW.IBISWORLD.COM
% c
hang
e
10
-2
0
2
4
6
8
2513 15 17 19 21 23Year
Demand from construction
WWW.IBISWORLD.COM Chemical Wholesaling in the US December 2019 7
Industry Performance
Current Performance
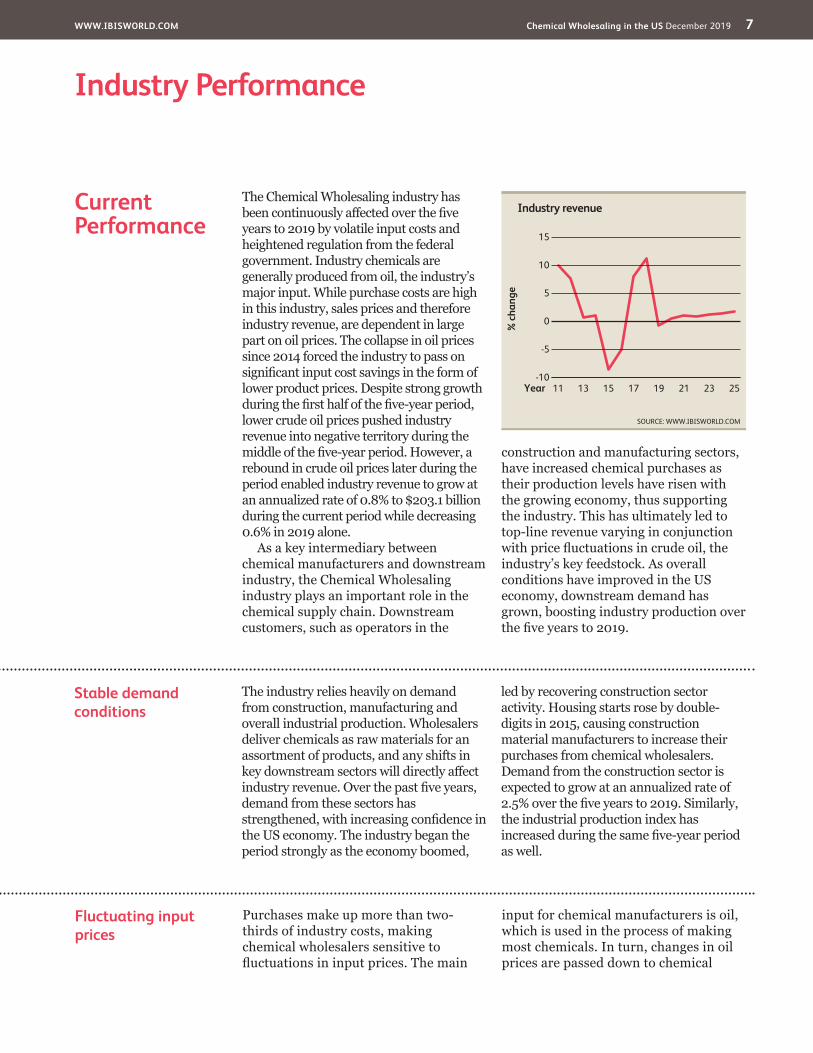
The Chemical Wholesaling industry has been continuously affected over the five years to 2019 by volatile input costs and heightened regulation from the federal government. Industry chemicals are generally produced from oil, the industry’s major input. While purchase costs are high in this industry, sales prices and therefore industry revenue, are dependent in large part on oil prices. The collapse in oil prices since 2014 forced the industry to pass on significant input cost savings in the form of lower product prices. Despite strong growth during the first half of the five-year period, lower crude oil prices pushed industry revenue into negative territory during the middle of the five-year period. However, a rebound in crude oil prices later during the period enabled industry revenue to grow at an annualized rate of 0.8% to $203.1 billion during the current period while decreasing 0.6% in 2019 alone.
As a key intermediary between chemical manufacturers and downstream industry, the Chemical Wholesaling industry plays an important role in the chemical supply chain. Downstream customers, such as operators in the
construction and manufacturing sectors, have increased chemical purchases as their production levels have risen with the growing economy, thus supporting the industry. This has ultimately led to top-line revenue varying in conjunction with price fluctuations in crude oil, the industry’s key feedstock. As overall conditions have improved in the US economy, downstream demand has grown, boosting industry production over the five years to 2019.
% c
hang
e
15
-10
-5
0
5
10
2511 13 15 17 19 21 23Year
Industry revenue
SOURCE: WWW.IBISWORLD.COM
Stable demand conditions
The industry relies heavily on demand from construction, manufacturing and overall industrial production. Wholesalers deliver chemicals as raw materials for an assortment of products, and any shifts in key downstream sectors will directly affect industry revenue. Over the past five years, demand from these sectors has strengthened, with increasing confidence in the US economy. The industry began the period strongly as the economy boomed,
led by recovering construction sector activity. Housing starts rose by double-digits in 2015, causing construction material manufacturers to increase their purchases from chemical wholesalers. Demand from the construction sector is expected to grow at an annualized rate of 2.5% over the five years to 2019. Similarly, the industrial production index has increased during the same five-year period as well.
Fluctuating input prices
Purchases make up more than two-thirds of industry costs, making chemical wholesalers sensitive to fluctuations in input prices. The main
input for chemical manufacturers is oil, which is used in the process of making most chemicals. In turn, changes in oil prices are passed down to chemical
WWW.IBISWORLD.COM Chemical Wholesaling in the US December 2019 8
Industry Performance
Fluctuating input pricescontinued
wholesalers, which must adjust their prices accordingly.
Since this industry sells many chemicals derived from oil, chemical wholesalers experienced higher operating costs from up to mid-2014 as oil prices reached historic highs. To better manage these rising costs, many operators increased product prices. For example, former industry player Ashland Global Specialty Chemicals Inc. raised prices 7.0% to offset higher input costs. Conversely, the world price of oil collapsed in late 2014. Due to competitive pressures, a portion of these cost savings were passed downstream, and many wholesalers sold chemicals at lower prices than earlier during the period. Despite strong demand, decreased unit prices caused industry revenue to fall between 2015 and 2016, but brighter economic outlook and a rebound in crude oil prices
from 2017 and onward helped the industry offset the subsequent declines in revenue in. This is expected to continue in 2019 as well.
Changes in input prices had a significant effect on profit margin. Early during the period, rising prices resulted in a squeeze on margins. Since changes in cost structures cannot always be anticipated accurately, many players were unable to raise prices rapidly or high enough to offset the increased costs of goods and regulation. For example, even with cost-reduction programs, major companies state that they were unable to completely offset the increases in raw material costs. With the more recent rise in oil prices, many wholesalers relinquished earlier cost savings, and profit margin is expected to fall to 4.5% of revenue in 2019, down from 4.9% in 2014.
Industry consolidation
Due to higher operating costs during much of the period, the industry has been consolidating. Many companies are using acquisitions to improve efficiency and economies of scale. For example, industry player Airgas Inc. has strengthened its market share by acquiring 400 companies over the past two decades, and the company merged with Air Liquide SA in 2016. The number of operators is expected
to rise at an annualized rate of 1.5% to 9,574 operators over the five years to 2019.
However, consolidation has not affected employment and wage growth. Employment has grown at an annualized rate of 1.7% to 137,215 workers over the five years to 2019. Wage growth has also been relatively strong, rising at an annualized rate of 2.6% to an estimated $11.5 billion during the same period.
Increasing regulation In addition, the industry is highly regulated due to the dangers associated with chemicals. Consequently, chemical distributors must follow specific laws regarding the transport of their products. For instance, if a company is transporting a chemical that is not on the federal government’s Toxic Substance Control Act inventory, a list of chemicals already existing in US commerce, it must submit a notification to the Environmental Protection Agency (EPA) prior to moving
the chemical. After the notification is reviewed, the EPA may limit the substance if it finds the product poses an unreasonable risk to human health or the
The industry is highly regulated due to the dangers associated with chemicals
WWW.IBISWORLD.COM Chemical Wholesaling in the US December 2019 9
Industry Performance
Industry Outlook
Over the five years to 2024, IBISWorld expects the Chemical Wholesaling industry to benefit from a growing economy and recovering oil prices. Demand from downstream customers will continue to increase, especially from the construction sector, which will boost industry revenue. Furthermore, rebounding crude oil prices, albeit with expected volatility, will aid in an increase in sales prices of the industry’s products.
This trend will help operators realize higher top-line revenue. Consequently, overall industry revenue is projected to rise at an annualized rate of 1.1% to reach $214.1 billion over the five years to 2024. This growth will include an increase of 0.6% in 2020 alone, as industry operators adjust to new input price conditions, causing the industry to rebound after a challenging 2015 and 2016.
environment. Complying with regulations has increased operating costs for chemical wholesalers over the five years to 2019.
Increasing regulation continued
Demand conditions strengthen further
Demand from downstream customers will strengthen as the US economy continues to grow steadily. Over the next five years, housing starts and the value of private nonresidential construction are expected to increase. This expansion will cause the construction sector to demand more chemicals, such as alkalis and chlorides. Manufacturing levels are also anticipated to increase as consumers spend more in response to rising employment and higher disposable incomes. The industrial production index
(IPI), which measures output from the mining, manufacturing, electric and gas industries, is projected to rise as well over the next five years. The chemical inputs supplied by chemical wholesalers are used abundantly within these industries. Therefore, this index can serve as an indication of the level of domestic demand for chemical wholesalers. Although demand is expected to grow, the industry is expected to experience some volatility as input prices may fluctuate.
Fluctuating input prices
Chemical wholesalers purchase goods from manufacturers that price these goods according to the cost of raw materials. Oil prices have been volatile over the five years to 2019, reaching record highs during much of the period, before crashing in 2014. Volatility is slated to continue during the outlook period as the oil and gas market continues the process of rebalancing global supply and demand levels. Changes in oil prices affect this industry significantly because oil is a large
component in chemical production and, therefore, a substantial determinant of costs for wholesalers.
As prices remain low in the coming years, most operators will attempt to limit profit margin by passing on elevated
Most operators will attempt to limit profit margin by passing on elevated sales prices
WWW.IBISWORLD.COM Chemical Wholesaling in the US December 2019 10
Industry Performance
Industry consolidation
Similar to the current five-year period, the industry will continue to consolidate. Companies will seek to expand distribution networks by acquiring regional players. IBISWorld expects some companies to take over other enterprises that are placed strategically near suppliers and customers. This strategy is important because it is costly to transport some products, such as industrial gases. Meanwhile, other operators will seek to increase economies of scale and improve efficiency, which can be achieved through mergers and acquisitions. Notably, major player Airgas
Inc. merged with French multinational Air Liquide SA, creating an industry leader in the supply of industrial gases.
However, the pace of industry entry is expected to outpace this activity. Consequently, the number of companies is forecast to rise at an annualized rate of 1.4% to 10,254 wholesalers over the five years to 2024. Although companies are consolidating, employment is anticipated to grow at an annualized rate of 1.7% to 148,969 workers over the five years to 2024, driven by the need for additional labor at consolidated and new facilities.
sales prices rather than maintaining lower operating costs through to their customers. Profit is therefore forecast to remain stagnant over the five years to 2024.
Nevertheless, volatility in the price of oil will lead to price risks throughout the economy and cause fluctuations in demand, which will keep profit margin in check.
Fluctuating input prices continued
Increasing regulation In June 2016, the US Senate passed the Chemical Safety for the 21st Century Act, legislation to reform the Toxic Substances Control Act (TSCA). As a result, regulation of chemical distribution processes will rise over the next five years. Reform of the TSCA will require chemical manufacturers to report the chemicals in their inventories and the destination of these chemicals. Manufacturers will need to include the specific facilities or customers to which the chemicals are being sent. These regulations will increase costs for wholesalers. If chemical manufacturers
need to report more information, they will likely pass higher operating costs to industry operators. Additionally, industry operators will require more workers to document their activity, increasing labor costs. IBISWorld expects wages to rise at an annualized rate of 1.5% to $12.5 billion over the five years to 2024.
Regulation of chemical distribution processes will rise over the next five years
WWW.IBISWORLD.COM Chemical Wholesaling in the US December 2019 11
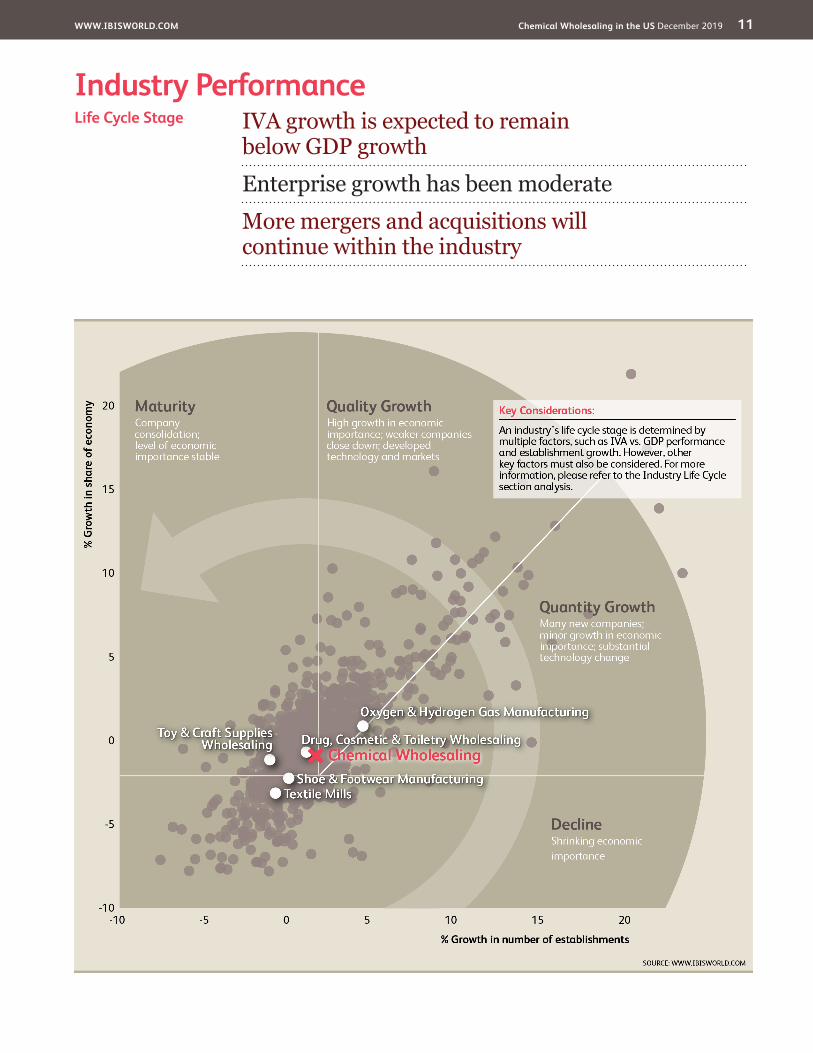
Industry PerformanceIVA growth is expected to remain below GDP growth
Enterprise growth has been moderate
More mergers and acquisitions will continue within the industry
Life Cycle Stage
WWW.IBISWORLD.COM Chemical Wholesaling in the US December 2019 12
Industry Performance
Industry Life Cycle Clearly defined product segments and user industries, in addition to wide market acceptance, indicate that the Chemical Wholesaling industry is in a mature phase of its life cycle. While newer technologies enable a more efficient distribution process, there are few new developments that could push the industry back into a growth phase. Additionally, the industry’s key buying markets remain in the manufacturing sector (e.g. chemical and construction material manufacturers). Industry value added (IVA), which measures an industry’s contribution to the overall economy, is expected to increase at an annualized rate of 1.3% over the 10 years to 2024. GDP is expected to increase an
annualized 2.1% during the same period, indicating that the industry is growing at a slightly slower rate than the economy as a whole. However, it is a mature industry with sizeable downstream users.
A further sign of maturity is the increasing tendency of the industry toward consolidation. Larger companies have regularly acquired smaller operators over the five years to 2019, and this trend is expected to continue. The number of enterprises is expected to increase at an annualized rate of 1.4% to 10,254 companies over the 10 years to 2024. IBISWorld expects consolidation and acquisition activity to continue as companies seek to build economies of scale to increase profit margin.
This industry is Mature
WWW.IBISWORLD.COM Chemical Wholesaling in the US December 2019 13
Products & MarketsSupply Chain | Products and Services | Demand Determinants Major Markets | International Trade | Business Locations
KEY BUYING INDUSTRIES
31310 Textile Mills in the US Fabric mills purchase adhesives and sealants from this industry.
31621 Shoe & Footwear Manufacturing in the US Footwear manufacturers purchase adhesives and sealants from this industry.
32111 Sawmills & Wood Production in the US Sawmills and wood production companies purchase adhesives and sealants from this industry for use as inputs into manufactured wood products.
32121 Wood Paneling Manufacturing in the US Wood paneling manufacturers purchase adhesives and sealants from this industry for use as inputs into manufactured wood products.
32212 Paper Mills in the US Paper mills purchase adhesives and sealants from the industry for use as inputs into paper and paper related products.
32511 Petrochemical Manufacturing in the US Petrochemical manufacturers purchase industry gases.
32532 Pesticide Manufacturing in the US Manufacturers of pesticide and agricultural chemical products buy soap and detergent sold by the industry.
32562 Cosmetic & Beauty Products Manufacturing in the US Cosmetic and beauty product manufacturers purchase soap and detergent products sold by this industry.
33441a Semiconductor & Circuit Manufacturing in the US Semiconductor and circuit manufacturers purchase industry gases for use in their manufacturing processes.
KEY SELLING INDUSTRIES
32512 Oxygen & Hydrogen Gas Manufacturing in the US The Oxygen and Hydrogen Gas Manufacturing industry supplies chemical wholesalers with industrial gases.
32513 Dye & Pigment Manufacturing in the US The Dye and Pigment Manufacturing industry supplies chemical wholesalers with synthetic dyes and pigments.
32518 Inorganic Chemical Manufacturing in the US The Inorganic Chemical Manufacturing industry supplies chemical wholesalers with alkalis and chlorides.
32519 Organic Chemical Manufacturing in the US The Organic Chemical Manufacturing industry supplies cyclic crude to chemical wholesalers.
32552 Adhesive Manufacturing in the US The Adhesive Manufacturing industry supplies chemical wholesalers with adhesives.
32561 Soap & Cleaning Compound Manufacturing in the US The Soap and Cleaning Compound Manufacturing industry supplies chemical wholesalers with cleaning agents.
32592 Explosives Manufacturing in the US The Explosives Manufacturing industry supplies chemical wholesalers with explosives to sell.
Supply Chain
WWW.IBISWORLD.COM Chemical Wholesaling in the US December 2019 14
Products & Markets
Products and Services
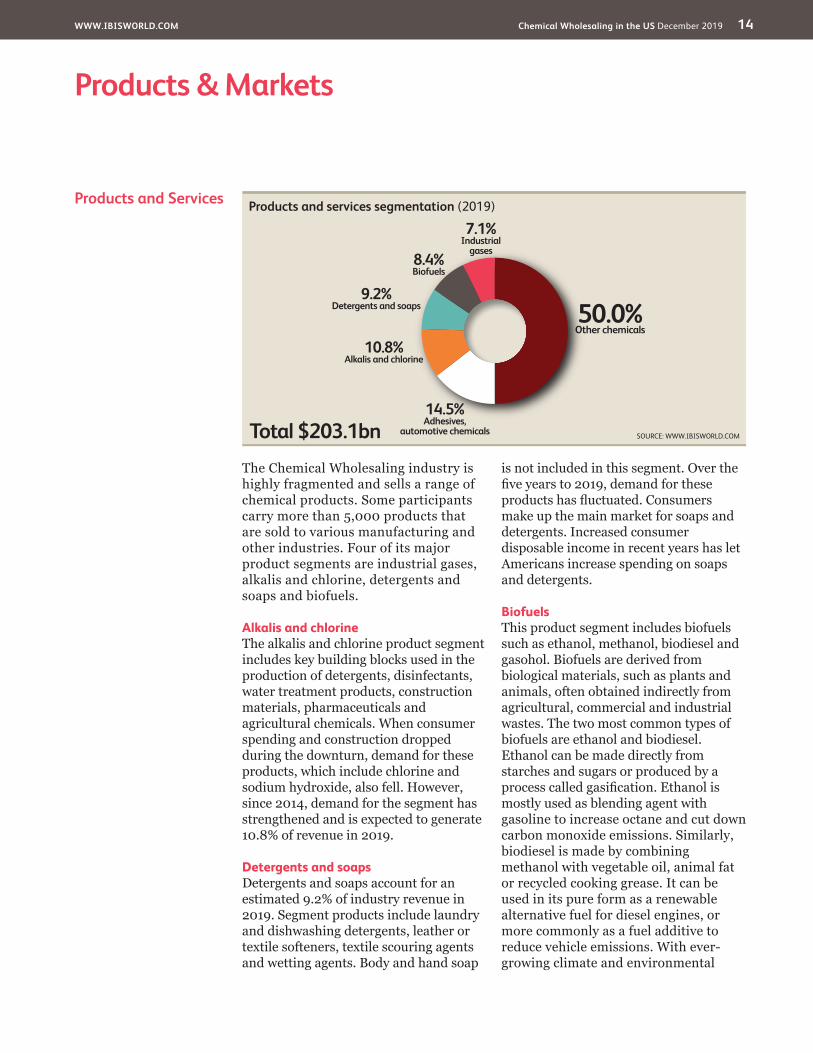
The Chemical Wholesaling industry is highly fragmented and sells a range of chemical products. Some participants carry more than 5,000 products that are sold to various manufacturing and other industries. Four of its major product segments are industrial gases, alkalis and chlorine, detergents and soaps and biofuels.
Alkalis and chlorineThe alkalis and chlorine product segment includes key building blocks used in the production of detergents, disinfectants, water treatment products, construction materials, pharmaceuticals and agricultural chemicals. When consumer spending and construction dropped during the downturn, demand for these products, which include chlorine and sodium hydroxide, also fell. However, since 2014, demand for the segment has strengthened and is expected to generate 10.8% of revenue in 2019.
Detergents and soapsDetergents and soaps account for an estimated 9.2% of industry revenue in 2019. Segment products include laundry and dishwashing detergents, leather or textile softeners, textile scouring agents and wetting agents. Body and hand soap
is not included in this segment. Over the five years to 2019, demand for these products has fluctuated. Consumers make up the main market for soaps and detergents. Increased consumer disposable income in recent years has let Americans increase spending on soaps and detergents.
BiofuelsThis product segment includes biofuels such as ethanol, methanol, biodiesel and gasohol. Biofuels are derived from biological materials, such as plants and animals, often obtained indirectly from agricultural, commercial and industrial wastes. The two most common types of biofuels are ethanol and biodiesel. Ethanol can be made directly from starches and sugars or produced by a process called gasification. Ethanol is mostly used as blending agent with gasoline to increase octane and cut down carbon monoxide emissions. Similarly, biodiesel is made by combining methanol with vegetable oil, animal fat or recycled cooking grease. It can be used in its pure form as a renewable alternative fuel for diesel engines, or more commonly as a fuel additive to reduce vehicle emissions. With ever-growing climate and environmental
Products and services segmentation (2019)
Total $203.1bn
50.0%Other chemicals
7.1%Industrial
gases
14.5%Adhesives,
automotive chemicals
10.8%Alkalis and chlorine
9.2%Detergents and soaps
8.4%Biofuels
SOURCE: WWW.IBISWORLD.COM
WWW.IBISWORLD.COM Chemical Wholesaling in the US December 2019 15
Products & Markets
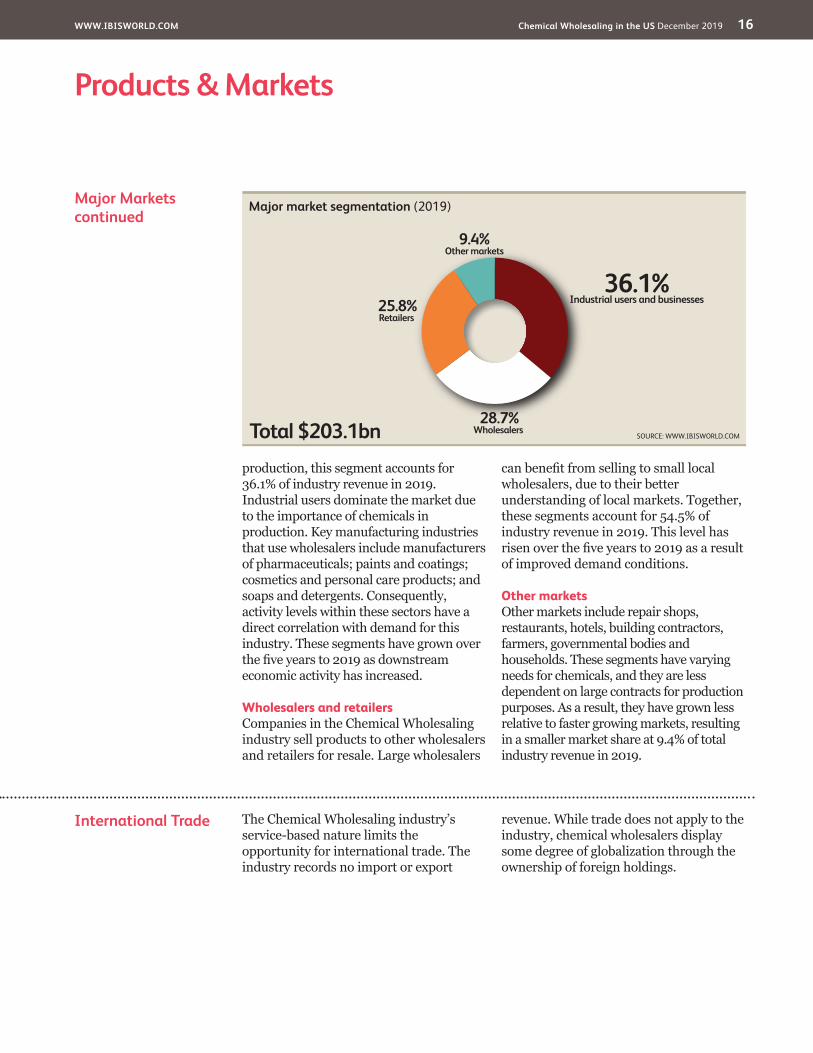
Major Markets The Chemical Wholesaling industry distributes chemical products, with the majority used as inputs in the manufacturing, construction and mining industries.
Industrial users and businessesManufacturing and mining industrial users form the largest market segment of the industry. Alongside other businesses that use chemicals in operations and
Demand Determinants
In the Chemical Wholesaling industry, wholesalers distribute chemical products that various manufacturing industries use as raw materials or commodity inputs to manufacture final downstream products. For example, chlorine is used in 60.0% of all commercial chemistry, 85.0% of all pharmaceutical chemistry and 95.0% of all crop protection chemistry. It is a raw material used to produce an estimated 15,000 products, including detergents, disinfectants, water treatment products, plastics, pharmaceuticals and agricultural chemicals. Consequently, developments in the US manufacturing sector have a key bearing on demand for products wholesaled by the industry. In essence, there is a strong correlation between the
level of activity within the industrial sector and the level of demand for various chemical and allied products.
The industrial sector was exposed to cyclical forces over the five years to 2019, which have led to strong variations in the level of demand for chemicals. Consumers responded to worsening economic conditions by reducing purchasing activity; as a result, producers decreased production and inventories. Changes in the level of economic growth, interest rates and future financial and economic expectations also influence demand from consumers. IBISWorld expects that downstream demand will improve as manufacturing and industrial consumers increase production levels over the five years to 2024.
Products and Servicescontinued
concerns, the use of biofuels is expected to experience ongoing growth. This segment is expected to generate 8.4% of revenue in 2019.
Industrial gasesOtherwise known as specialty gases, industrial gases are manufactured for a wide range of uses in industry. The industry distributes nitrogen, oxygen, carbon dioxide, argon, hydrogen, helium and acetylene, among many others. Uses are broad, ranging from welding gas to medical oxygen, and from refrigerator gas to carbonation for soft drinks. Industrial gases are used by a plethora of industries, including oil and gas, petrochemicals, mining, steelmaking, biotechnology, electronics and aerospace.
In 2019, this segment is expected to make up 7.1% of industry revenue.
Other chemical productsThe other product segment includes a variety of chemical products that are not classified elsewhere. This includes explosives, sealants, gum and wood chemicals, metal cyanide, liquefied gases, synthetic rubber, paint, paint supplies, farm supplies and turpentine. Many of these products are used in the manufacturing of consumer goods, there is a direct correlation between consumer spending and industry demand and revenue. For instance, when consumer spending decreased during the downturn, this segment’s share of revenue slightly declined. In 2019, this segment is expected to account for 50.0% of revenue.
WWW.IBISWORLD.COM Chemical Wholesaling in the US December 2019 16
Products & Markets
International Trade The Chemical Wholesaling industry’s service-based nature limits the opportunity for international trade. The industry records no import or export
revenue. While trade does not apply to the industry, chemical wholesalers display some degree of globalization through the ownership of foreign holdings.
Major Marketscontinued
production, this segment accounts for 36.1% of industry revenue in 2019. Industrial users dominate the market due to the importance of chemicals in production. Key manufacturing industries that use wholesalers include manufacturers of pharmaceuticals; paints and coatings; cosmetics and personal care products; and soaps and detergents. Consequently, activity levels within these sectors have a direct correlation with demand for this industry. These segments have grown over the five years to 2019 as downstream economic activity has increased.
Wholesalers and retailersCompanies in the Chemical Wholesaling industry sell products to other wholesalers and retailers for resale. Large wholesalers
can benefit from selling to small local wholesalers, due to their better understanding of local markets. Together, these segments account for 54.5% of industry revenue in 2019. This level has risen over the five years to 2019 as a result of improved demand conditions.
Other marketsOther markets include repair shops, restaurants, hotels, building contractors, farmers, governmental bodies and households. These segments have varying needs for chemicals, and they are less dependent on large contracts for production purposes. As a result, they have grown less relative to faster growing markets, resulting in a smaller market share at 9.4% of total industry revenue in 2019.
Major market segmentation (2019)
Total $203.1bn
36.1%Industrial users and businesses
28.7%Wholesalers
25.8%Retailers
9.4%Other markets
SOURCE: WWW.IBISWORLD.COM
WWW.IBISWORLD.COM Chemical Wholesaling in the US December 2019 17
Products & Markets
Business Locations 2019
MO2.2
West
West
West
Rocky Mountains Plains
Southwest
Southeast
New England
VT0.1
MA1.4
RI0.4
NJ4.3
DE0.5
NH0.5
CT1.2
MD1.0
DC0.0
1
5
3
7
2
6
4
8 9
Additional States (as marked on map)
AZ1.7
CA9.8
NV0.7
OR1.1
WA1.9
MT0.5
NE0.6
MN1.8
IA0.9
OH4.5 VA
1.6
FL6.0
KS1.3
CO1.7
UT0.9
ID0.4
TX11.4
OK2.0
NC3.3
AK0.2
WY0.5
TN2.1
KY1.2
GA3.7
IL4.6
ME0.2
ND0.5
WI1.9 MI
2.8 PA3.9
WV0.7
SD0.2
NM0.7
AR0.9
MS0.7
AL1.1
SC1.5
LA2.0
HI0.3
IN2.3
NY4.6 5
67
8
321
4
9
SOURCE: WWW.IBISWORLD.COM
Mid- Atlantic
Establishments (%)
Less than 3% 3% to less than 10% 10% to less than 20% 20% or more
Great Lakes
WWW.IBISWORLD.COM Chemical Wholesaling in the US December 2019 18
Products & Markets
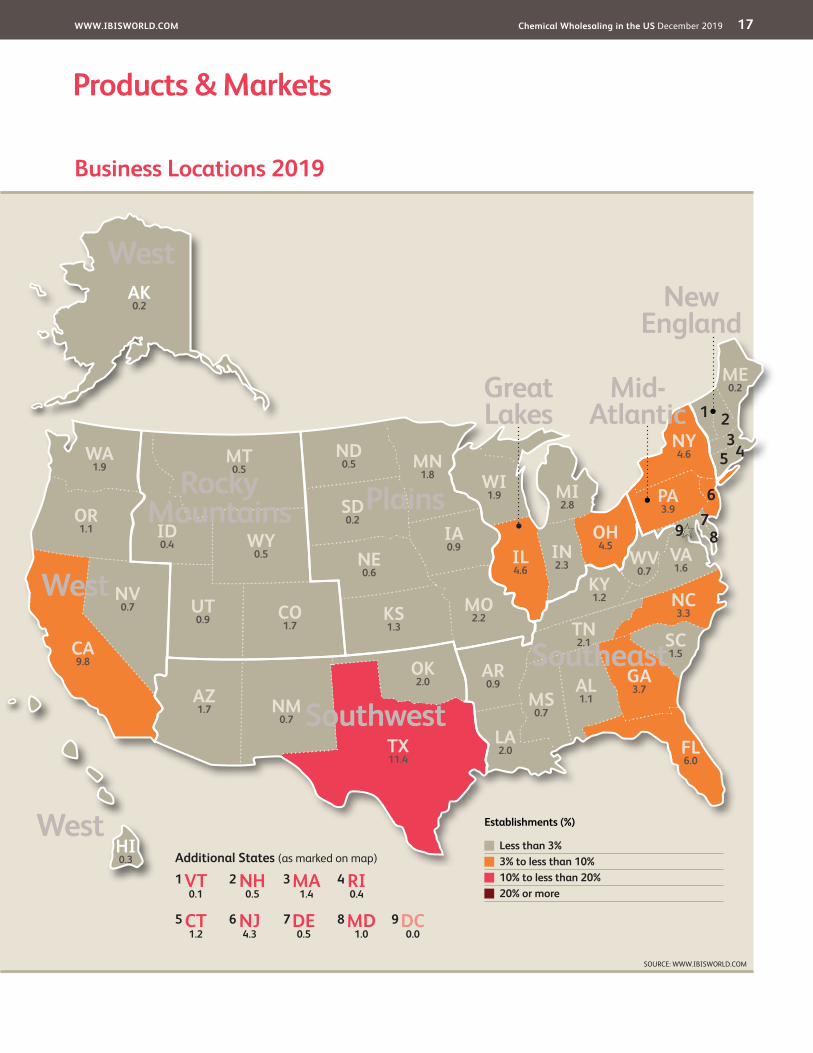
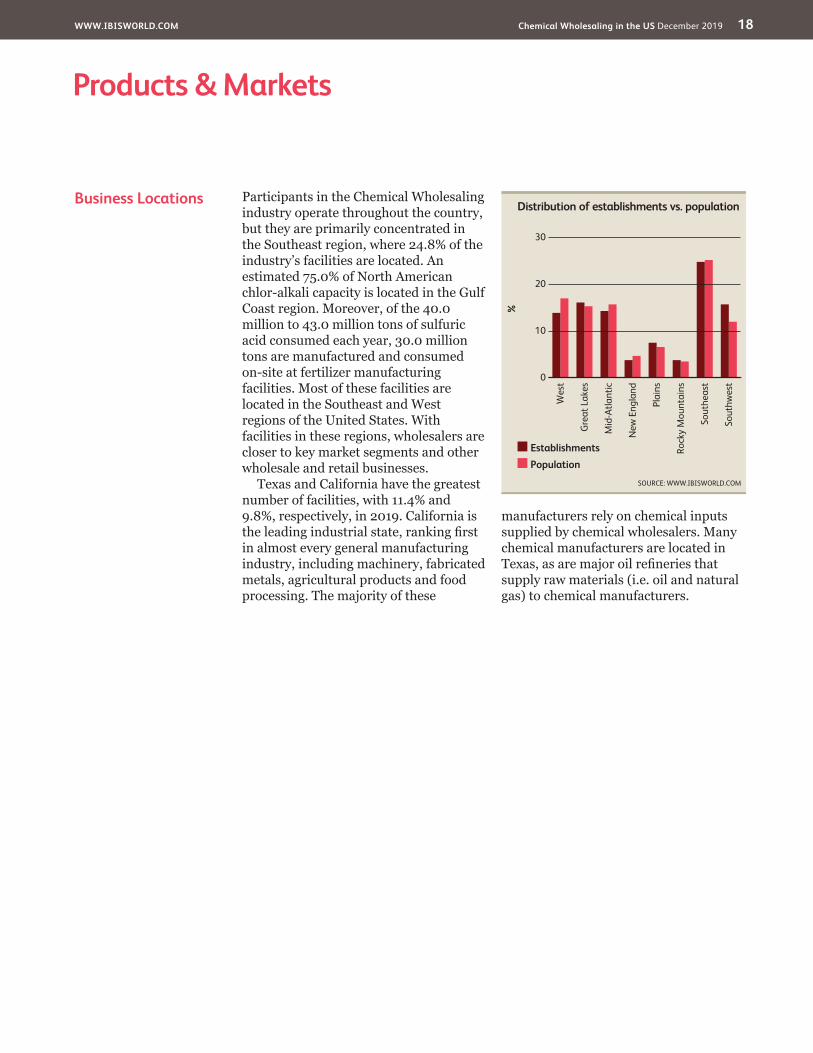
Business Locations Participants in the Chemical Wholesaling industry operate throughout the country, but they are primarily concentrated in the Southeast region, where 24.8% of the industry’s facilities are located. An estimated 75.0% of North American chlor-alkali capacity is located in the Gulf Coast region. Moreover, of the 40.0 million to 43.0 million tons of sulfuric acid consumed each year, 30.0 million tons are manufactured and consumed on-site at fertilizer manufacturing facilities. Most of these facilities are located in the Southeast and West regions of the United States. With facilities in these regions, wholesalers are closer to key market segments and other wholesale and retail businesses.
Texas and California have the greatest number of facilities, with 11.4% and 9.8%, respectively, in 2019. California is the leading industrial state, ranking first in almost every general manufacturing industry, including machinery, fabricated metals, agricultural products and food processing. The majority of these
manufacturers rely on chemical inputs supplied by chemical wholesalers. Many chemical manufacturers are located in Texas, as are major oil refineries that supply raw materials (i.e. oil and natural gas) to chemical manufacturers.
%
30
0
10
20
Sout
hwes
t
Wes
t
Gre
at L
akes
Mid
-Atla
ntic
New
Eng
land
Plai
ns
Rock
y M
ount
ains
Sout
heas
t
EstablishmentsPopulation
Distribution of establishments vs. population
SOURCE: WWW.IBISWORLD.COM
WWW.IBISWORLD.COM Chemical Wholesaling in the US December 2019 19
Cost Structure Benchmarks
The cost structure in the Chemical Wholesaling industry is dominated by a large amount of purchase costs similar to other wholesaling industries. Purchase costs vary based on the upstream manufacturers’ main feedstock, such as crude oil. Purchase costs have decreased slightly over the five years to 2019, but profitability has continued to remain volatile. Other costs in the industry have remained relatively steady.
WagesThe use of technology in packaging, sorting, storing and transporting merchandise is an important part of
ensuring merchandise ordered by retailers is delivered accurately and on time. However, the industry’s production and distribution processes heavily rely on manual labor. While advances in technology and design have made the ordering and delivery process from wholesalers to retailers more efficient, wages remain a major cost component for this industry. In 2019, wages are projected to account for 5.7% of revenue, up from 5.2% in 2014. This level is forecast to taper downward over the five years to 2024 as industry revenue becomes more stable.
Key Success Factors Having a loyal customer baseRepeat customer sales are a key success factor in this industry.
Having an extensive distribution/collection networkStrong distribution networks minimize distribution costs and maximize market penetration.
Ability to control stock on handWholesalers carry inventory in anticipation of future orders, making
efficient warehousing and distribution systems essential.
Having links with suppliersHaving links with a diverse range of suppliers enables industry wholesalers to sell a variety of product types.
Guaranteed supply of key inputsThere is a high degree of trust and interdependence between manufacturers and wholesalers due to the latter’s reliance on manufactured goods.
Market Share Concentration
Industry participants in the Chemical Wholesaling industry have diversified product offerings, however no operator holds a dominant share of the market. Consequently, the top three operators generate less than 10.0% of industry revenue. As a result, this industry is highly competitive, with wholesalers competing on storage efficiency and distribution. Additionally, most operators have fewer than 50 employees, indicating low concentration.
Over the five years to 2019, the number of industry enterprises is projected to rise at a similar rate as
revenue, along with the number of industry establishments. This indicates a stability in market consolidation.
In May 2016, the Federal Trade Commission scrutinized an upcoming merger between industry leader Airgas Inc. and French multinational Air Liquide SA. Subsequently, the merger was approved with the FTC mandating some divestitures. Furthermore, Nexeo Solutions, Inc. was acquired by Univar Inc. in March of 2019. Consolidation by major industry players is set to increase concentration particularly in the market for industrial gas products over the five years to 2019.
Competitive LandscapeMarket Share Concentration | Key Success Factors | Cost Structure Benchmarks Basis of Competition | Barriers to Entry | Industry Globalization
Level Concentration in this industry is Low
IBISWorld identifies 250 Key Success Factors for a business. The most important for this industry are:
WWW.IBISWORLD.COM Chemical Wholesaling in the US December 2019 20
Competitive Landscape
Cost Structure Benchmarkscontinued
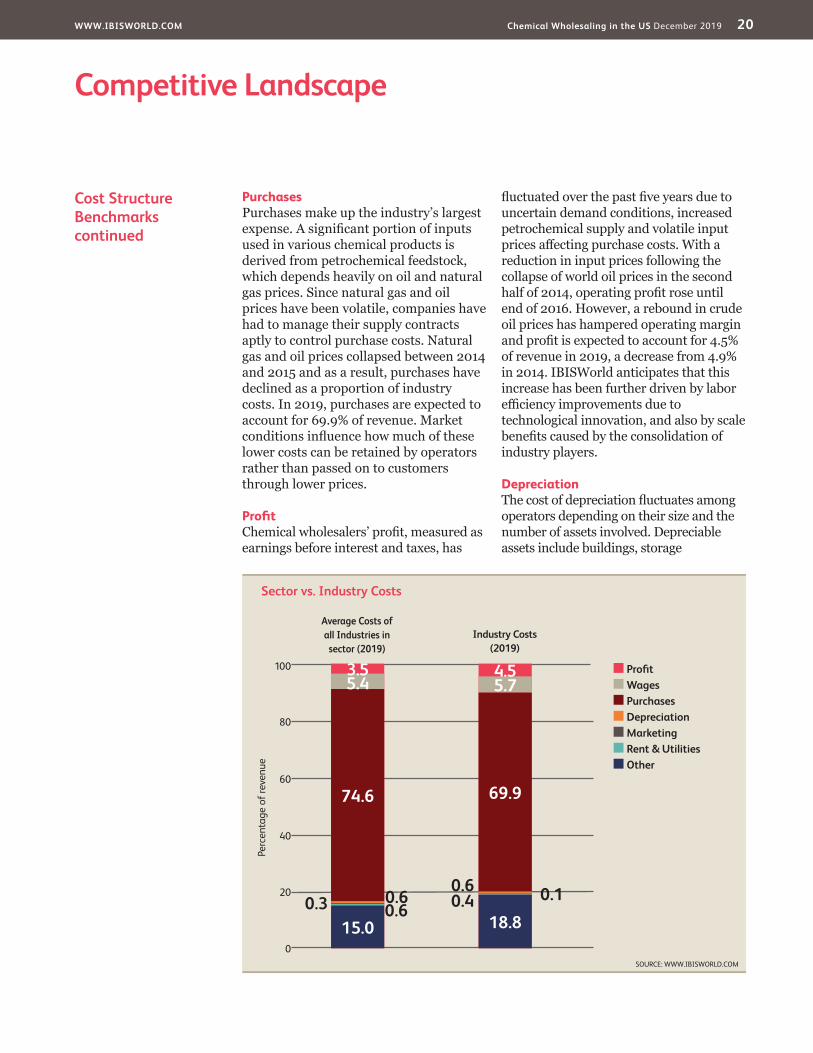
PurchasesPurchases make up the industry’s largest expense. A significant portion of inputs used in various chemical products is derived from petrochemical feedstock, which depends heavily on oil and natural gas prices. Since natural gas and oil prices have been volatile, companies have had to manage their supply contracts aptly to control purchase costs. Natural gas and oil prices collapsed between 2014 and 2015 and as a result, purchases have declined as a proportion of industry costs. In 2019, purchases are expected to account for 69.9% of revenue. Market conditions influence how much of these lower costs can be retained by operators rather than passed on to customers through lower prices.
ProfitChemical wholesalers’ profit, measured as earnings before interest and taxes, has
fluctuated over the past five years due to uncertain demand conditions, increased petrochemical supply and volatile input prices affecting purchase costs. With a reduction in input prices following the collapse of world oil prices in the second half of 2014, operating profit rose until end of 2016. However, a rebound in crude oil prices has hampered operating margin and profit is expected to account for 4.5% of revenue in 2019, a decrease from 4.9% in 2014. IBISWorld anticipates that this increase has been further driven by labor efficiency improvements due to technological innovation, and also by scale benefits caused by the consolidation of industry players.
DepreciationThe cost of depreciation fluctuates among operators depending on their size and the number of assets involved. Depreciable assets include buildings, storage
Sector vs. Industry Costs
n Profi tn Wagesn Purchasesn Depreciationn Marketingn Rent & Utilitiesn Other
Average Costs of all Industries in sector (2019)
Industry Costs (2019)
0
20
40
60
Perc
enta
ge o
f rev
enue
80
100
SOURCE: WWW.IBISWORLD.COM
3.5 4.5
18.80.4 0.10.6
69.9
5.7
15.00.60.3 0.6
74.6
5.4
WWW.IBISWORLD.COM Chemical Wholesaling in the US December 2019 21
Competitive Landscape
Basis of Competition Internal competitionThe Chemical Wholesaling industry is highly competitive. At the wholesale level, price and service are the principal factors that drive competition. With a high level of price competition, operators seek to protect or expand their market share within their particular operating regions. Due to slower revenue growth within the industrial sector and sluggish domestic demand, competition for market share has heightened. These conditions have also caused a gradual shift in the basis of competition to a greater emphasis on cost and service.
Chemical wholesalers buy supplies from several upstream industrial chemical manufacturers, often via long-term distribution agreements that specify quantities and price formulas. Purchased bulk products are then sold in smaller quantities to downstream customers. Given the industry’s competitive nature and the cyclical nature of demand, profit depends on having an efficient distribution system
and the ability to compete with a large number of rivals.
The range and quality of products for distribution are also important bases of competition. Industry participants aim to stock a range of chemical supplies, giving them the ability to sell and service a greater number of products more effectively. For example, Univar USA Inc. carries more than 8,000 products, making it one of the top chemical distributors in North America.
External competitionIndustry operators contend with external competition from manufacturers. Some manufacturers sell chemical products directly to customers, thus bypassing the need for wholesaler enterprises. Over the five years to 2019, this trend of wholesaler bypass has been increasing as more industry operators consolidate and seek to vertically integrate operations. Nonetheless, the industry is anticipated to continue conducting the majority of chemical distribution services over the five years to 2024.
Cost Structure Benchmarkscontinued
equipment, machinery used to move products and computer inventory systems. In 2019, depreciation will account for an estimated 0.6% of revenue.
MarketingMarketing is expected to account for 0.1% of total industry revenue in 2019, and has remained relatively steady over the past five years.
RentRent is expected to account for 0.3% of total industry revenue in 2019, and has
remained relatively steady over the past five years.
UtilitiesUtilities is expected to account for a minimal share of industry revenue at 0.1% in 2019.
OtherOther expenditures include sales commissions, transportation, professional fees and insurance. These costs are expected to account for 18.6% of total industry revenue in 2019.
Level & Trend Competition in this industry is High and the trend is Steady
WWW.IBISWORLD.COM Chemical Wholesaling in the US December 2019 22
Competitive Landscape
Industry Globalization
The majority of operators in the Chemical Wholesaling industry are small- or medium-sized companies that sell to industrial users and other wholesalers located throughout the United States. However, the wholesaling industry, as part of the wider chemical industry, is exposed to international forces, which have increased in intensity in recent years in line with the chemical industry’s increasingly global nature. Since a large
number of chemical products are commodities, prices are often influenced by global market forces.
The industry also distributes products that have been sourced internationally. The largest and most technically advanced chemical manufacturers are located in countries such as the United States, Japan, France, Germany and Canada, while China and Mexico are rapidly becoming major players with imports into the United States.
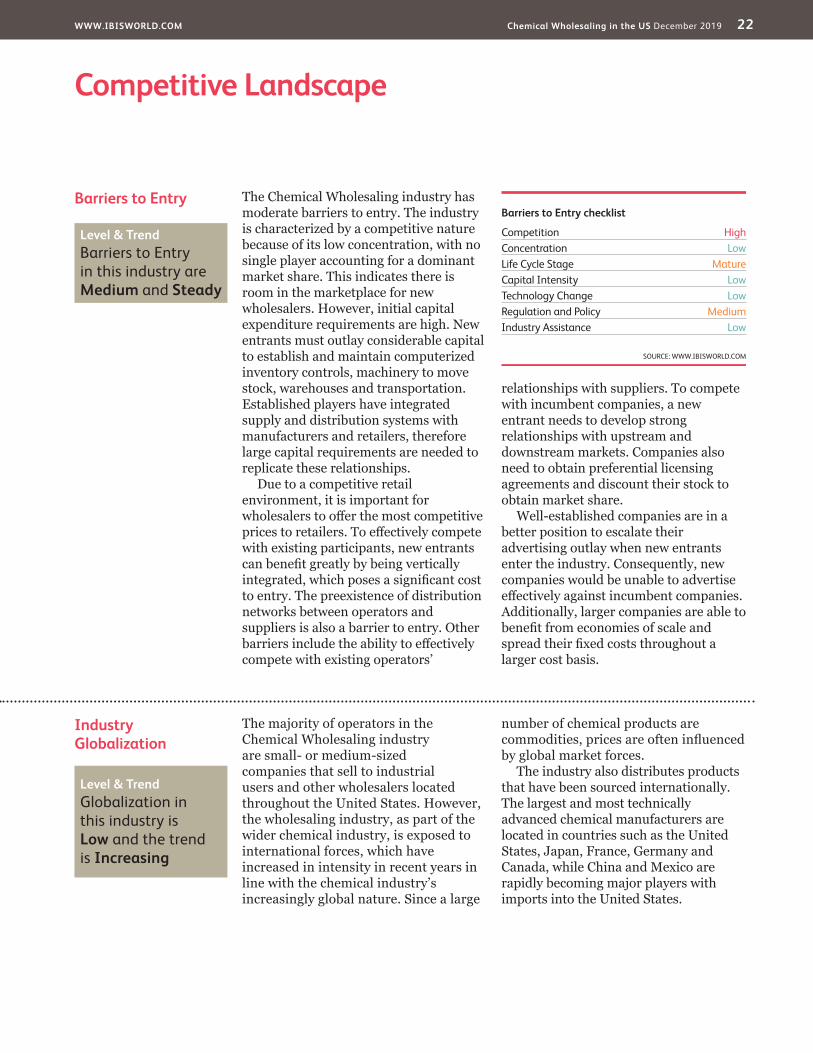
Barriers to Entry The Chemical Wholesaling industry has moderate barriers to entry. The industry is characterized by a competitive nature because of its low concentration, with no single player accounting for a dominant market share. This indicates there is room in the marketplace for new wholesalers. However, initial capital expenditure requirements are high. New entrants must outlay considerable capital to establish and maintain computerized inventory controls, machinery to move stock, warehouses and transportation. Established players have integrated supply and distribution systems with manufacturers and retailers, therefore large capital requirements are needed to replicate these relationships.
Due to a competitive retail environment, it is important for wholesalers to offer the most competitive prices to retailers. To effectively compete with existing participants, new entrants can benefit greatly by being vertically integrated, which poses a significant cost to entry. The preexistence of distribution networks between operators and suppliers is also a barrier to entry. Other barriers include the ability to effectively compete with existing operators’
relationships with suppliers. To compete with incumbent companies, a new entrant needs to develop strong relationships with upstream and downstream markets. Companies also need to obtain preferential licensing agreements and discount their stock to obtain market share.
Well-established companies are in a better position to escalate their advertising outlay when new entrants enter the industry. Consequently, new companies would be unable to advertise effectively against incumbent companies. Additionally, larger companies are able to benefit from economies of scale and spread their fixed costs throughout a larger cost basis.
Barriers to Entry checklist
Competition HighConcentration LowLife Cycle Stage MatureCapital Intensity LowTechnology Change LowRegulation and Policy MediumIndustry Assistance Low
SOURCE: WWW.IBISWORLD.COM
Level & Trend Barriers to Entry in this industry are Medium and Steady
Level & Trend Globalization in this industry is Low and the trend is Increasing
WWW.IBISWORLD.COM Chemical Wholesaling in the US December 2019 23
Other Company Performance
Established in 1924, Univar USA Inc. (Univar) is the world’s second-largest chemicals distributor and the leading chemical distributor in the United States, with more than 125 locations throughout the country in addition to a delivery fleet of nearly 2,600 vehicles. The company distributes chemical products including acids, alcohols, catalysts, chlor-alkali, food additives, inorganics, ketones, pigments, polyglycols, solvents and surfactants. Univar buys its products in bulk from chemical manufacturing companies, which include the Dow Chemical Company, BASF Corporation, the Monsanto Company and Uniqema Americas, then distributes these products in smaller quantities. Univar employed 8,500 people as of 2018 and generated $8.6 billion in total revenue.
Until 2015, Univar was controlled by private equity firms Clayton, Dubilier & Rice LLC and CVC Capital Partners as a private company. In 2015, Univar completed an initial public offering,
listing itself on the New York Stock Exchange. Over the five years to 2019, the company has acquired several transportation, leasing and wholesaling companies, primarily in Brazil, Mexico, Canada and the United Kingdom. However, in the United States, the company has made some acquisitions such as Arrow Chemical Inc., a distributor of pharmaceutical ingredients. The company also acquired Chemical Associates Inc., a marketer and manufacturer of oleochemicals. However, the acquisition of Key Chemical Inc., one of the largest companies involved in the fluoride distribution to municipalities, will help Univar generate revenue from the municipal and industrial markets. In March of 2019, Univar completed the acquisition of another industry operator, Nexeo Solutions Holdings LLC for an estimated $2.0 billion. Post-acquisition, the company announced that it divested its plastics distribution business for an estimated $640.0 million to solely focus on its core
Other Company Performance
Air Liquide USA (Air Liquide) operates in this industry through its acquisition of Airgas Inc. (Airgas). Airgas is a distributor of industrial, medical and specialty gases; hard goods, such as welding equipment and supplies; and ammonia products. The company also produces atmospheric gases, carbon dioxide, dry ice and nitrous oxide. Since its founding in 1982, the company has completed an estimated 400 acquisitions of local and regional industrial gas distributors, providing it the largest national distribution network in the packaged gas market. Headquartered in Radnor, PA, Airgas has limited operations in Mexico, Russia and the United Arab Emirates. The company employs 17,000 workers. Airgas’ distribution of industrial gases, which is most relevant to the Chemical Wholesaling industry, accounts for three-quarters of the company’s revenue.
In 2015, Airgas proposed a $13.4 billion merger with its current parent company. In May 2016, the US Federal Trade Commission (FTC) approved the merger, with conditions that the companies sell assets used to produce bulk oxygen, bulk nitrogen, bulk argon and other products in certain markets. As of January 2017, the company divested 16 sales units, two nitrogen and six carbon-dioxide plants and is in further negotiations to divest two more carbon-dioxide plants to comply with the FTC’s regulations.
The combined entity generated more than $23.8 billion in total company revenue in 2018. Industry-relevant gas services sales are expected to account for 42.0% of the entire US gas distribution market. IBISWorld expects Airgas to generate $8.3 billion in industry-relevant revenue in 2019.
Major CompaniesThere are no Major Players in this industry | Other Companies
Air Liquide USA Market Share: 4.1%
Univar USA Inc. Market Share: 2.5%
WWW.IBISWORLD.COM Chemical Wholesaling in the US December 2019 24
Major Companies
Other Company Performance
Nexeo Solutions Holdings LLC (Nexeo Solutions) began industry-specific operations in 2011 upon the purchase of Ashland Global Holdings Inc.’s (Ashland) chemical distribution business. Ashland was founded in 1924 as a regional petroleum refinery based in Lexington, KY, and the company exited the industry when it sold its chemical distribution business. Currently, Nexeo Solutions is headquartered in The Woodlands, TX. The company reported total revenue of $4.0 billion in fiscal year 2018 and employed 2,760 people worldwide with 2,190 people employed in the United States.
Over the five years to 2019, the company has done well, barring when the company suffered due to a drop in crude oil and natural gas prices. The company
operates three lines of business, which include chemicals, plastics and environmental services, having sold a fourth line of business, composites, in 2019. The chemicals segment is most relevant to the industry and, in 2017, IBISWorld estimates that the company derives close to 50.0% of its revenue from this segment. The company sells an estimated 76.9% of its products in the United States.
On March 1, 2019, Nexeo Solutions completed an acquisition by Univar USA Inc. for an estimated $2.0 billion. Combined entity financial information is still not available, therefore estimates for 2019 are still separate. In fiscal 2019, the company is anticipated to generate industry-specific revenue of $4.1 billion.
Other Company Performancecontinued
business operations. In 2019, IBISWorld expects the company to generate $5.0 billion in industry-relevant revenue.
Nexeo Solutions Holdings LLC Market Share: 0.0%
WWW.IBISWORLD.COM Chemical Wholesaling in the US December 2019 25
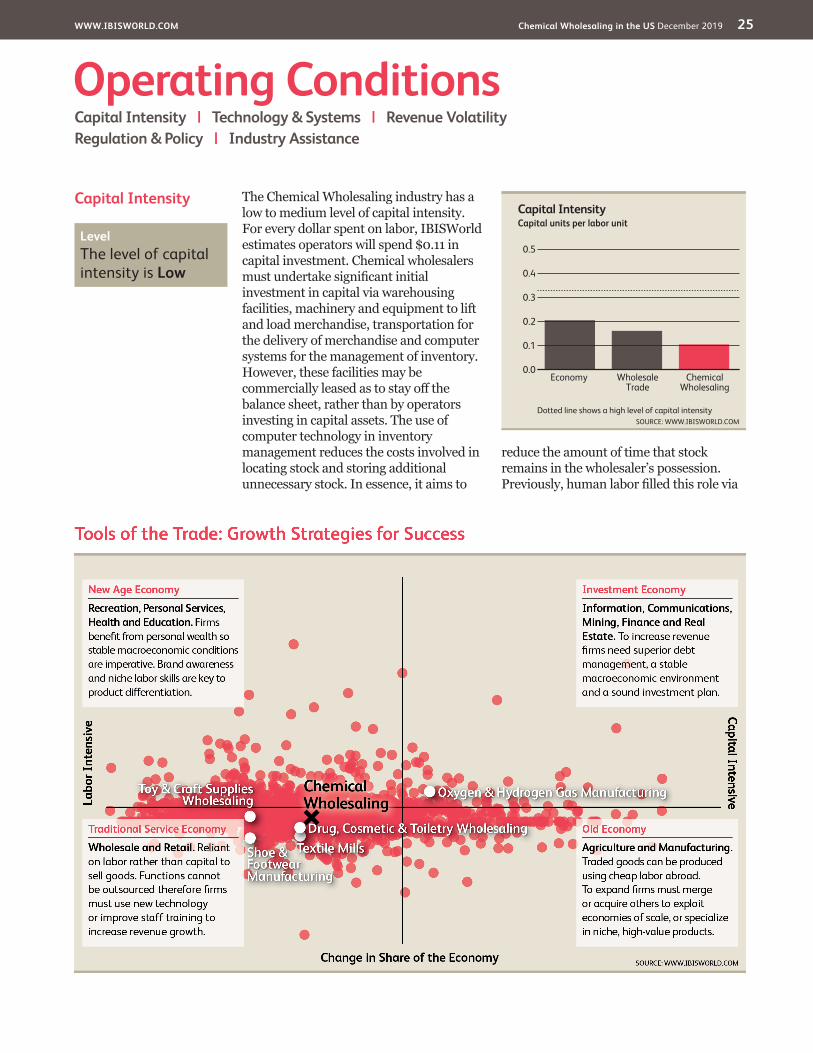
Capital Intensity The Chemical Wholesaling industry has a low to medium level of capital intensity. For every dollar spent on labor, IBISWorld estimates operators will spend $0.11 in capital investment. Chemical wholesalers must undertake significant initial investment in capital via warehousing facilities, machinery and equipment to lift and load merchandise, transportation for the delivery of merchandise and computer systems for the management of inventory. However, these facilities may be commercially leased as to stay off the balance sheet, rather than by operators investing in capital assets. The use of computer technology in inventory management reduces the costs involved in locating stock and storing additional unnecessary stock. In essence, it aims to
reduce the amount of time that stock remains in the wholesaler’s possession. Previously, human labor filled this role via
Operating ConditionsCapital Intensity | Technology & Systems | Revenue VolatilityRegulation & Policy | Industry Assistance
Capital Intensity
0.5
0.0
0.1
0.2
0.3
0.4
SOURCE: WWW.IBISWORLD.COMDotted line shows a high level of capital intensity
Capital units per labor unit
Chemical Wholesaling
Wholesale Trade
Economy
Level The level of capital intensity is Low
WWW.IBISWORLD.COM Chemical Wholesaling in the US December 2019 26
Operating Conditions
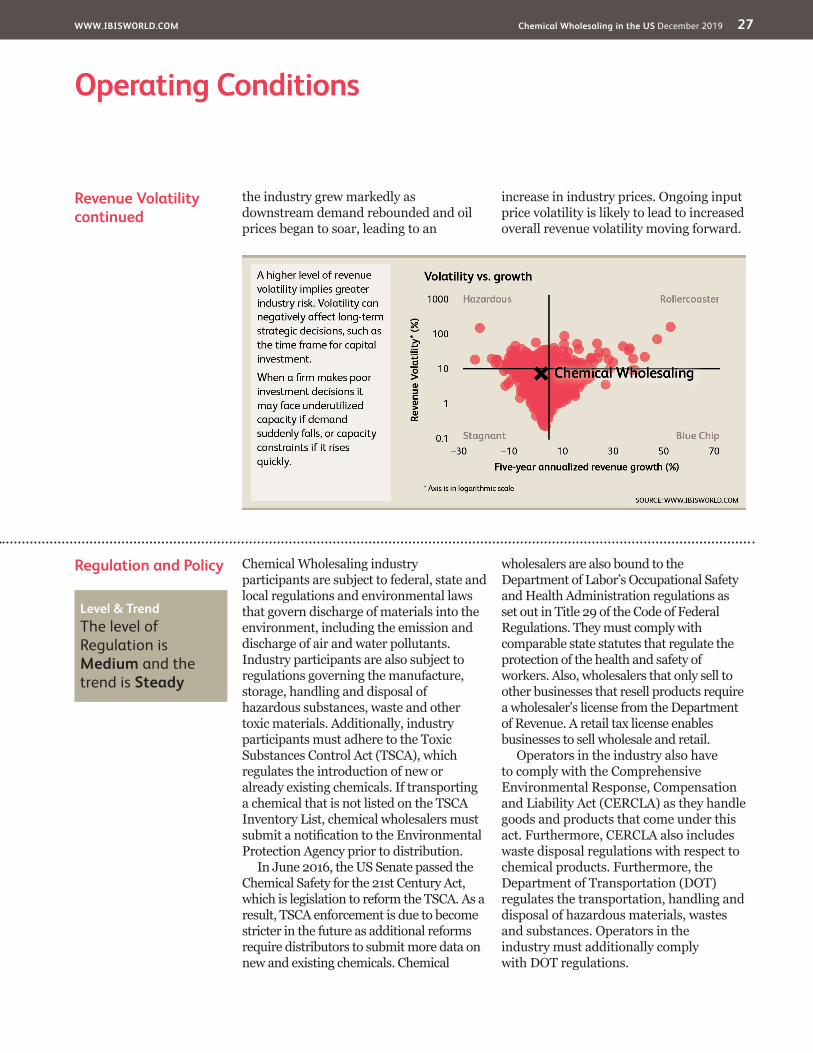
Revenue Volatility The Chemical Wholesaling industry exhibits a low to moderate level of revenue volatility. Downstream demand from the construction and manufacturing sectors greatly affect industry sales volumes, while the price of the industry’s major input, specifically oil, greatly affects sales prices.
Variations in the level of demand from construction and manufacturing customers is often due to variations of the business cycle. When economic conditions are weak, industrial activity decreases, thereby decreasing
downstream demand and industry revenue. As economic conditions have improved, demand for industry products has stabilized. However, operators in the industry have long-term and stable contractual terms with their customers helping moderate commodity volatility.
Fluctuations in raw material costs also contribute to the industry’s revenue volatility. Between 2017 and 2018, industry revenue stymied due to the recent collapse in the world oil price, forcing industry operators to pass on input price savings to customers. In contrast,
Technology and Systems
Within the Chemical Wholesaling industry, the major types of capital improvements have converged with the introduction and upgrade of communications technology, including online services that enable customers to search inventory lists, check pricing, place and print orders and receive bills via e-mail. Recent developments in information technology (IT) systems have enabled operators to revolutionize procurement by changing ordering procedures and facilitating better supply chain management practices to suppliers and customer markets. In some cases, a company’s product technology influences the product and process technology of customers, and vice versa.
Wholesalers have also increasingly adopted communications technology.
An equally strong trend in the wider wholesale trade division has been manufacturers adopting communications technology in an attempt to bypass wholesalers and sell directly to the end customer. In recent years, industry participants have argued that industry consolidation has been driven by the cost of IT. While IT connects transactions with producers and customers, costs are better spread throughout larger organizations.
Furthermore, operators in the industry have started using data-gathering and analytics tools such as ERP to better streamline processes and systems, estimating demand and volume to better anticipate their customers’ needs.
Capital Intensitycontinued
manual records and stock counts, but computer technology is faster and more cost efficient.
Despite the industry’s need for capital, labor is an integral part of daily operations. The level of labor is reflected in the industry’s need for salespeople, stock employees and apprentices for the sales and distribution of products. The wholesaling industry’s primary function
is to transport merchandise into the market, which involves marketing products and taking, preparing, checking and shipping orders to customers. While the industry increasingly relies on computer technology, there will always be a need for human labor to oversee the ordering and dispatch of merchandise and to provide additional customer service to manufacturers and retailers.
Level The level of technology change is Low
Level The level of volatility is Medium
WWW.IBISWORLD.COM Chemical Wholesaling in the US December 2019 27
Operating Conditions
Regulation and Policy Chemical Wholesaling industry participants are subject to federal, state and local regulations and environmental laws that govern discharge of materials into the environment, including the emission and discharge of air and water pollutants. Industry participants are also subject to regulations governing the manufacture, storage, handling and disposal of hazardous substances, waste and other toxic materials. Additionally, industry participants must adhere to the Toxic Substances Control Act (TSCA), which regulates the introduction of new or already existing chemicals. If transporting a chemical that is not listed on the TSCA Inventory List, chemical wholesalers must submit a notification to the Environmental Protection Agency prior to distribution.
In June 2016, the US Senate passed the Chemical Safety for the 21st Century Act, which is legislation to reform the TSCA. As a result, TSCA enforcement is due to become stricter in the future as additional reforms require distributors to submit more data on new and existing chemicals. Chemical
wholesalers are also bound to the Department of Labor’s Occupational Safety and Health Administration regulations as set out in Title 29 of the Code of Federal Regulations. They must comply with comparable state statutes that regulate the protection of the health and safety of workers. Also, wholesalers that only sell to other businesses that resell products require a wholesaler’s license from the Department of Revenue. A retail tax license enables businesses to sell wholesale and retail.
Operators in the industry also have to comply with the Comprehensive Environmental Response, Compensation and Liability Act (CERCLA) as they handle goods and products that come under this act. Furthermore, CERCLA also includes waste disposal regulations with respect to chemical products. Furthermore, the Department of Transportation (DOT) regulates the transportation, handling and disposal of hazardous materials, wastes and substances. Operators in the industry must additionally comply with DOT regulations.
Revenue Volatilitycontinued
the industry grew markedly as downstream demand rebounded and oil prices began to soar, leading to an
increase in industry prices. Ongoing input price volatility is likely to lead to increased overall revenue volatility moving forward.
Level & Trend The level of Regulation is Medium and the trend is Steady
WWW.IBISWORLD.COM Chemical Wholesaling in the US December 2019 28
Operating Conditions
Industry Assistance No specific tariffs apply to the Chemical Wholesaling industry, and it does not receive any other form of government assistance. The most prominent association covering operators in this industry is the National Association of Chemical Distributors (NACD). Established in 1971, NACD is an international association of chemical distributors and their supply chain partners. Member companies process, formulate, blend, repackage, warehouse, transport and market chemical
products exclusively for industrial customers. Furthermore, NACD provides advocacy services on behalf of its members for several legislative and regulatory issues that affect the industry. The Association also conducts meetings and trade shows for operators in the industry. The National Association of Wholesaler-Distributors is a trade group for wholesalers, providing research and advocacy for members on issues affecting the wholesale distribution industry.
Level & Trend The level of Industry Assistance is Low and the trend is Steady
WWW.IBISWORLD.COM Chemical Wholesaling in the US December 2019 29
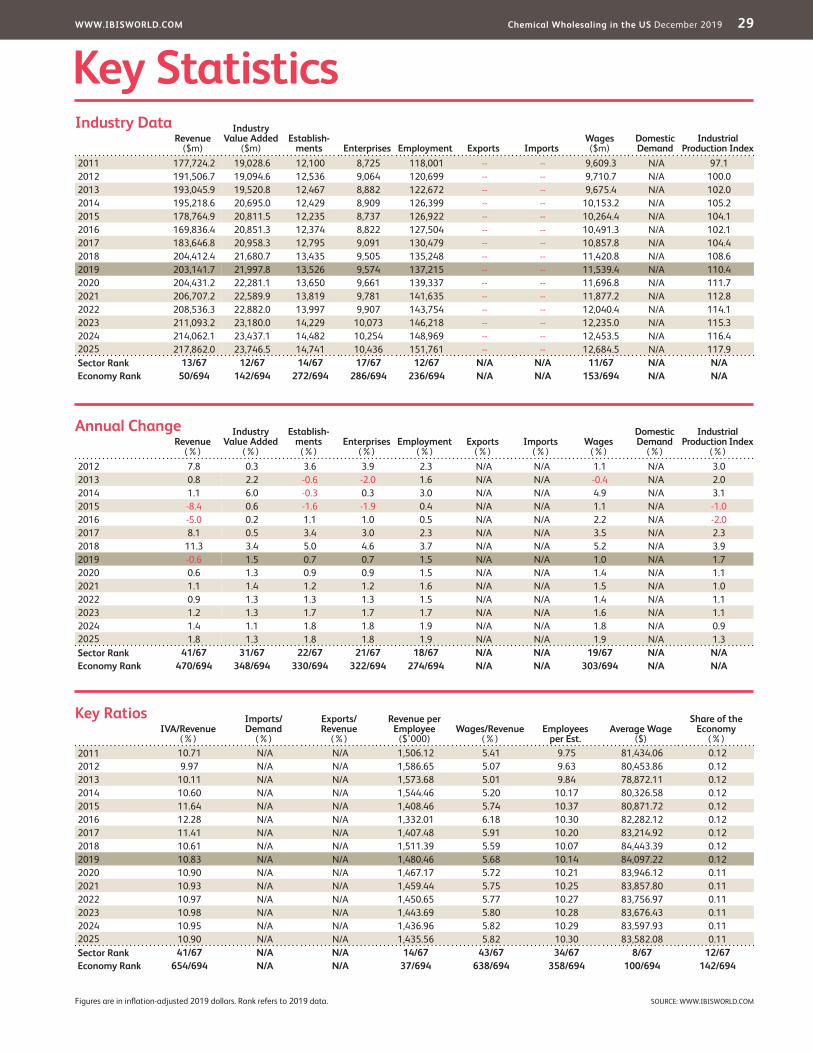
Key StatisticsRevenue
($m)
Industry Value Added
($m)Establish-
ments Enterprises Employment Exports ImportsWages ($m)
Domestic Demand
Industrial Production Index
2011 177,724.2 19,028.6 12,100 8,725 118,001 -- -- 9,609.3 N/A 97.12012 191,506.7 19,094.6 12,536 9,064 120,699 -- -- 9,710.7 N/A 100.02013 193,045.9 19,520.8 12,467 8,882 122,672 -- -- 9,675.4 N/A 102.02014 195,218.6 20,695.0 12,429 8,909 126,399 -- -- 10,153.2 N/A 105.22015 178,764.9 20,811.5 12,235 8,737 126,922 -- -- 10,264.4 N/A 104.12016 169,836.4 20,851.3 12,374 8,822 127,504 -- -- 10,491.3 N/A 102.12017 183,646.8 20,958.3 12,795 9,091 130,479 -- -- 10,857.8 N/A 104.42018 204,412.4 21,680.7 13,435 9,505 135,248 -- -- 11,420.8 N/A 108.62019 203,141.7 21,997.8 13,526 9,574 137,215 -- -- 11,539.4 N/A 110.42020 204,431.2 22,281.1 13,650 9,661 139,337 -- -- 11,696.8 N/A 111.72021 206,707.2 22,589.9 13,819 9,781 141,635 -- -- 11,877.2 N/A 112.82022 208,536.3 22,882.0 13,997 9,907 143,754 -- -- 12,040.4 N/A 114.12023 211,093.2 23,180.0 14,229 10,073 146,218 -- -- 12,235.0 N/A 115.32024 214,062.1 23,437.1 14,482 10,254 148,969 -- -- 12,453.5 N/A 116.42025 217,862.0 23,746.5 14,741 10,436 151,761 -- -- 12,684.5 N/A 117.9Sector Rank 13/67 12/67 14/67 17/67 12/67 N/A N/A 11/67 N/A N/AEconomy Rank 50/694 142/694 272/694 286/694 236/694 N/A N/A 153/694 N/A N/A
IVA/Revenue (%)
Imports/Demand
(%)
Exports/Revenue
(%)
Revenue per Employee
($’000)Wages/Revenue
(%)Employees
per Est.Average Wage
($)
Share of the Economy
(%)2011 10.71 N/A N/A 1,506.12 5.41 9.75 81,434.06 0.122012 9.97 N/A N/A 1,586.65 5.07 9.63 80,453.86 0.122013 10.11 N/A N/A 1,573.68 5.01 9.84 78,872.11 0.122014 10.60 N/A N/A 1,544.46 5.20 10.17 80,326.58 0.122015 11.64 N/A N/A 1,408.46 5.74 10.37 80,871.72 0.122016 12.28 N/A N/A 1,332.01 6.18 10.30 82,282.12 0.122017 11.41 N/A N/A 1,407.48 5.91 10.20 83,214.92 0.122018 10.61 N/A N/A 1,511.39 5.59 10.07 84,443.39 0.122019 10.83 N/A N/A 1,480.46 5.68 10.14 84,097.22 0.122020 10.90 N/A N/A 1,467.17 5.72 10.21 83,946.12 0.112021 10.93 N/A N/A 1,459.44 5.75 10.25 83,857.80 0.112022 10.97 N/A N/A 1,450.65 5.77 10.27 83,756.97 0.112023 10.98 N/A N/A 1,443.69 5.80 10.28 83,676.43 0.112024 10.95 N/A N/A 1,436.96 5.82 10.29 83,597.93 0.112025 10.90 N/A N/A 1,435.56 5.82 10.30 83,582.08 0.11Sector Rank 41/67 N/A N/A 14/67 43/67 34/67 8/67 12/67Economy Rank 654/694 N/A N/A 37/694 638/694 358/694 100/694 142/694
Figures are in inflation-adjusted 2019 dollars. Rank refers to 2019 data.
Revenue (%)
Industry Value Added
(%)
Establish-ments
(%)Enterprises
(%)Employment
(%)Exports
(%)Imports
(%)Wages
(%)
Domestic Demand
(%)
Industrial Production Index
(%)2012 7.8 0.3 3.6 3.9 2.3 N/A N/A 1.1 N/A 3.02013 0.8 2.2 -0.6 -2.0 1.6 N/A N/A -0.4 N/A 2.02014 1.1 6.0 -0.3 0.3 3.0 N/A N/A 4.9 N/A 3.12015 -8.4 0.6 -1.6 -1.9 0.4 N/A N/A 1.1 N/A -1.02016 -5.0 0.2 1.1 1.0 0.5 N/A N/A 2.2 N/A -2.02017 8.1 0.5 3.4 3.0 2.3 N/A N/A 3.5 N/A 2.32018 11.3 3.4 5.0 4.6 3.7 N/A N/A 5.2 N/A 3.92019 -0.6 1.5 0.7 0.7 1.5 N/A N/A 1.0 N/A 1.72020 0.6 1.3 0.9 0.9 1.5 N/A N/A 1.4 N/A 1.12021 1.1 1.4 1.2 1.2 1.6 N/A N/A 1.5 N/A 1.02022 0.9 1.3 1.3 1.3 1.5 N/A N/A 1.4 N/A 1.12023 1.2 1.3 1.7 1.7 1.7 N/A N/A 1.6 N/A 1.12024 1.4 1.1 1.8 1.8 1.9 N/A N/A 1.8 N/A 0.92025 1.8 1.3 1.8 1.8 1.9 N/A N/A 1.9 N/A 1.3Sector Rank 41/67 31/67 22/67 21/67 18/67 N/A N/A 19/67 N/A N/AEconomy Rank 470/694 348/694 330/694 322/694 274/694 N/A N/A 303/694 N/A N/A
Annual Change
Key Ratios
Industry Data
SOURCE: WWW.IBISWORLD.COM
WWW.IBISWORLD.COM Chemical Wholesaling in the US December 2019 30
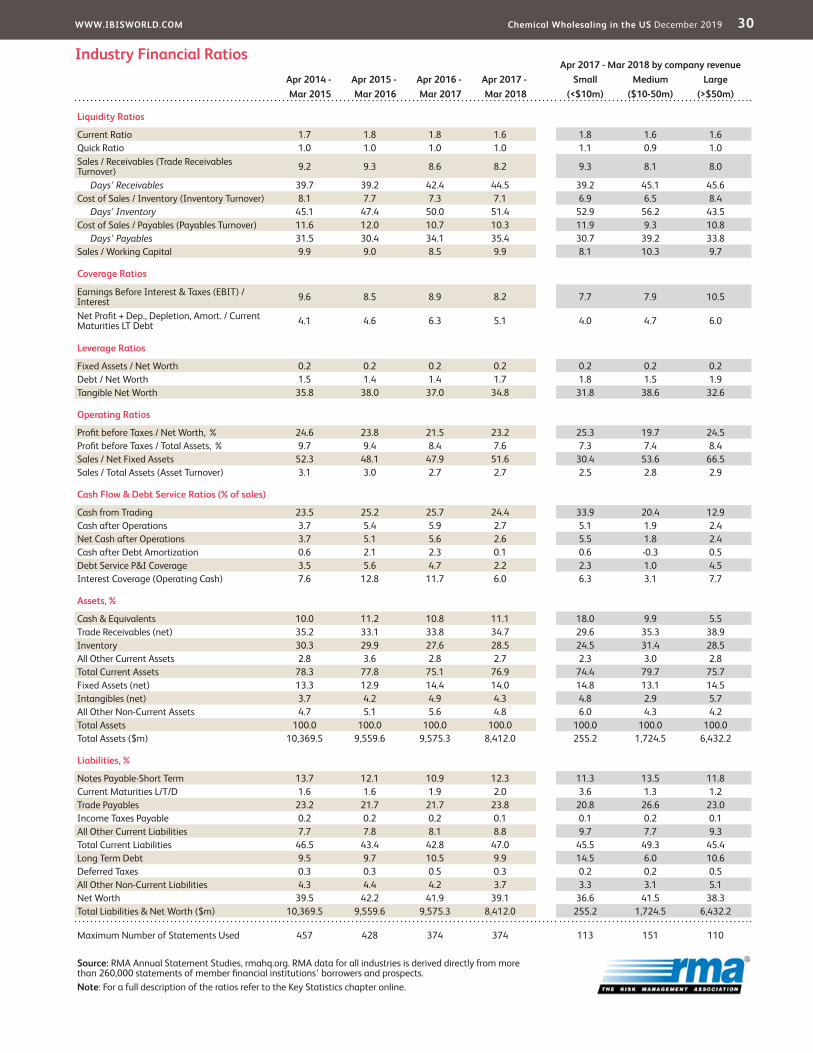
Apr 2017 - Mar 2018 by company revenueApr 2014 - Apr 2015 - Apr 2016 - Apr 2017 - Small Medium LargeMar 2015 Mar 2016 Mar 2017 Mar 2018 (<$10m) ($10-50m) (>$50m)
Liquidity Ratios
Current Ratio 1.7 1.8 1.8 1.6 1.8 1.6 1.6Quick Ratio 1.0 1.0 1.0 1.0 1.1 0.9 1.0Sales / Receivables (Trade Receivables Turnover) 9.2 9.3 8.6 8.2 9.3 8.1 8.0
Days’ Receivables 39.7 39.2 42.4 44.5 39.2 45.1 45.6Cost of Sales / Inventory (Inventory Turnover) 8.1 7.7 7.3 7.1 6.9 6.5 8.4
Days’ Inventory 45.1 47.4 50.0 51.4 52.9 56.2 43.5Cost of Sales / Payables (Payables Turnover) 11.6 12.0 10.7 10.3 11.9 9.3 10.8
Days’ Payables 31.5 30.4 34.1 35.4 30.7 39.2 33.8Sales / Working Capital 9.9 9.0 8.5 9.9 8.1 10.3 9.7
Coverage Ratios
Earnings Before Interest & Taxes (EBIT) / Interest 9.6 8.5 8.9 8.2 7.7 7.9 10.5
Net Profit + Dep., Depletion, Amort. / Current Maturities LT Debt 4.1 4.6 6.3 5.1 4.0 4.7 6.0
Leverage Ratios
Fixed Assets / Net Worth 0.2 0.2 0.2 0.2 0.2 0.2 0.2Debt / Net Worth 1.5 1.4 1.4 1.7 1.8 1.5 1.9Tangible Net Worth 35.8 38.0 37.0 34.8 31.8 38.6 32.6
Operating Ratios
Profit before Taxes / Net Worth, % 24.6 23.8 21.5 23.2 25.3 19.7 24.5Profit before Taxes / Total Assets, % 9.7 9.4 8.4 7.6 7.3 7.4 8.4Sales / Net Fixed Assets 52.3 48.1 47.9 51.6 30.4 53.6 66.5Sales / Total Assets (Asset Turnover) 3.1 3.0 2.7 2.7 2.5 2.8 2.9
Cash Flow & Debt Service Ratios (% of sales)
Cash from Trading 23.5 25.2 25.7 24.4 33.9 20.4 12.9Cash after Operations 3.7 5.4 5.9 2.7 5.1 1.9 2.4Net Cash after Operations 3.7 5.1 5.6 2.6 5.5 1.8 2.4Cash after Debt Amortization 0.6 2.1 2.3 0.1 0.6 -0.3 0.5Debt Service P&I Coverage 3.5 5.6 4.7 2.2 2.3 1.0 4.5Interest Coverage (Operating Cash) 7.6 12.8 11.7 6.0 6.3 3.1 7.7
Assets, %
Cash & Equivalents 10.0 11.2 10.8 11.1 18.0 9.9 5.5Trade Receivables (net) 35.2 33.1 33.8 34.7 29.6 35.3 38.9Inventory 30.3 29.9 27.6 28.5 24.5 31.4 28.5All Other Current Assets 2.8 3.6 2.8 2.7 2.3 3.0 2.8Total Current Assets 78.3 77.8 75.1 76.9 74.4 79.7 75.7Fixed Assets (net) 13.3 12.9 14.4 14.0 14.8 13.1 14.5Intangibles (net) 3.7 4.2 4.9 4.3 4.8 2.9 5.7All Other Non-Current Assets 4.7 5.1 5.6 4.8 6.0 4.3 4.2Total Assets 100.0 100.0 100.0 100.0 100.0 100.0 100.0Total Assets ($m) 10,369.5 9,559.6 9,575.3 8,412.0 255.2 1,724.5 6,432.2
Liabilities, %
Notes Payable-Short Term 13.7 12.1 10.9 12.3 11.3 13.5 11.8Current Maturities L/T/D 1.6 1.6 1.9 2.0 3.6 1.3 1.2Trade Payables 23.2 21.7 21.7 23.8 20.8 26.6 23.0Income Taxes Payable 0.2 0.2 0.2 0.1 0.1 0.2 0.1All Other Current Liabilities 7.7 7.8 8.1 8.8 9.7 7.7 9.3Total Current Liabilities 46.5 43.4 42.8 47.0 45.5 49.3 45.4Long Term Debt 9.5 9.7 10.5 9.9 14.5 6.0 10.6Deferred Taxes 0.3 0.3 0.5 0.3 0.2 0.2 0.5All Other Non-Current Liabilities 4.3 4.4 4.2 3.7 3.3 3.1 5.1Net Worth 39.5 42.2 41.9 39.1 36.6 41.5 38.3Total Liabilities & Net Worth ($m) 10,369.5 9,559.6 9,575.3 8,412.0 255.2 1,724.5 6,432.2
Maximum Number of Statements Used 457 428 374 374 113 151 110
Industry Financial Ratios
Source: RMA Annual Statement Studies, rmahq.org. RMA data for all industries is derived directly from more than 260,000 statements of member financial institutions’ borrowers and prospects.Note: For a full description of the ratios refer to the Key Statistics chapter online.

WWW.IBISWORLD.COM Chemical Wholesaling in the US December 2019 31
Jargon & Glossary
BARRIERS TO ENTRY High barriers to entry mean that new companies struggle to enter an industry, while low barriers mean it is easy for new companies to enter an industry.
CAPITAL INTENSITY Compares the amount of money spent on capital (plant, machinery and equipment) with that spent on labor. IBISWorld uses the ratio of depreciation to wages as a proxy for capital intensity. High capital intensity is more than $0.333 of capital to $1 of labor; medium is $0.125 to $0.333 of capital to $1 of labor; low is less than $0.125 of capital for every $1 of labor.
CONSTANT PRICES The dollar figures in the Key Statistics table, including forecasts, are adjusted for inflation using the current year (i.e. year published) as the base year. This removes the impact of changes in the purchasing power of the dollar, leaving only the “real” growth or decline in industry metrics. The inflation adjustments in IBISWorld’s reports are made using the US Bureau of Economic Analysis’ implicit GDP price deflator.
DOMESTIC DEMAND Spending on industry goods and services within the United States, regardless of their country of origin. It is derived by adding imports to industry revenue, and then subtracting exports.
EMPLOYMENT The number of permanent, part-time, temporary and seasonal employees, working proprietors, partners, managers and executives within the industry.
ENTERPRISE A division that is separately managed and keeps management accounts. Each enterprise consists of one or more establishments that are under common ownership or control.
ESTABLISHMENT The smallest type of accounting unit within an enterprise, an establishment is a single physical location where business is conducted or where services or industrial operations are performed. Multiple establishments under common control make up an enterprise.
EXPORTS Total value of industry goods and services sold by US companies to customers abroad.
IMPORTS Total value of industry goods and services brought in from foreign countries to be sold in the United States.
INDUSTRY CONCENTRATION An indicator of the dominance of the top four players in an industry. Concentration is considered high if the top players account for more than 70% of industry revenue. Medium is 40% to 70% of industry revenue. Low is less than 40%.
INDUSTRY REVENUE The total sales of industry goods and services (exclusive of excise and sales tax); subsidies on production; all other operating income from outside the firm (such as commission income, repair and service income, and rent, leasing and hiring income); and capital work done by rental or lease. Receipts from interest royalties, dividends and the sale of fixed tangible assets are excluded.
INDUSTRY VALUE ADDED (IVA) The market value of goods and services produced by the industry minus the cost of goods and services used in production. IVA is also described as the industry’s contribution to GDP, or profit plus wages and depreciation.
INTERNATIONAL TRADE The level of international trade is determined by ratios of exports to revenue and imports to domestic demand. For exports/revenue: low is less than 5%, medium is 5% to 20%, and high is more than 20%. Imports/domestic demand: low is less than 5%, medium is 5% to 35%, and high is more than 35%.
LIFE CYCLE All industries go through periods of growth, maturity and decline. IBISWorld determines an industry’s life cycle by considering its growth rate (measured by IVA) compared with GDP; the growth rate of the number of establishments; the amount of change the industry’s products are undergoing; the rate of technological change; and the level of customer acceptance of industry products and services.
NONEMPLOYING ESTABLISHMENT Businesses with no paid employment or payroll, also known as nonemployers. These are mostly set up by self-employed individuals.
PROFIT IBISWorld uses earnings before interest and tax (EBIT) as an indicator of a company’s profitability. It is calculated as revenue minus expenses, excluding interest and tax.
VOLATILITY The level of volatility is determined by averaging the absolute change in revenue in each of the past five years. Volatility levels: very high is more than ±20%; high volatility is ±10% to ±20%; moderate volatility is ±3% to ±10%; and low volatility is less than ±3%.
WAGES The gross total wages and salaries of all employees in the industry. The cost of benefits is also included in this figure.
Industry Jargon
IBISWorld Glossary
ENVIRONMENTAL PROTECTION AGENCY (EPA) A government agency designed to protect human health and safeguard the natural environment.
SURFACTANT Compounds that lower the surface tension between two liquids or between a liquid and a solid. A surfactant may act as detergents, wetting agents and foaming agents.
WHOLESALE The sale and resale of goods without transformation to retailers, commercial customers and other wholesalers.

Disclaimer
This product has been supplied by IBISWorld Inc. (‘IBISWorld’) solely for use by its authorized licenses strictly in accordance with their license agreements with IBISWorld. IBISWorld makes no representation to any other person with regard to the completeness or accuracy of the data or information contained herein, and it accepts no responsibility and disclaims all liability (save for liability which cannot be lawfully disclaimed) for loss or damage whatsoever suffered or incurred by any other person resulting from the use
of, or reliance upon, the data or information contained herein. Copyright in this publication is owned by IBISWorld Inc. The publication is sold on the basis that the purchaser agrees not to copy the material contained within it for other than the purchasers own purposes. In the event that the purchaser uses or quotes from the material in this publication – in papers, reports, or opinions prepared for any other person – it is agreed that it will be sourced to: IBISWorld Inc.
At IBISWorld we know that industry intelligence is more than assembling factsIt is combining data with analysis to answer the questions that successful businesses askIdentify high growth, emerging & shrinking marketsArm yourself with the latest industry intelligenceAssess competitive threats from existing & new entrantsBenchmark your performance against the competitionMake speedy market-ready, profit-maximizing decisions
Who is IBISWorld?We are strategists, analysts, researchers, and marketers. We provide answers to information-hungry, time-poor businesses. Our goal is to provide real world answers that matter to your business in our 700 US industry reports. When tough strategic, budget, sales and marketing decisions need to be made, our suite of Industry and Risk intelligence products give you deeply-researched answers quickly.
IBISWorld MembershipIBISWorld offers tailored membership packages to meet your needs.
Copyright 2020 IBISWorld Inc
www.ibisworld.com | 1-800-330-3772 | [email protected]