iact f tbacc ta icreases a iustr rici si behaiurs a
TRANSCRIPT

Journals Library
DOI 10.3310/phr08060
Impact of tobacco tax increases and industry pricing on smoking behaviours and inequalities: a mixed-methods study Timea R Partos, Rosemary Hiscock, Anna B Gilmore, J Robert Branston, Sara Hitchman and Ann McNeill
Public Health ResearchVolume 8 • Issue 6 • April 2020
ISSN 2050-4381


Impact of tobacco tax increases andindustry pricing on smoking behavioursand inequalities: a mixed-methods study
Timea R Partoso ,1 Rosemary Hiscocko ,2
Anna B Gilmoreo ,2 J Robert Branstono ,3
Sara Hitchmano1 and Ann McNeillo 1*
1National Addiction Centre, Institute of Psychiatry, Psychology & Neuroscience,King’s College London, London, UK
2Department for Health, University of Bath, Bath, UK3Centre for Governance and Regulation, School of Management,University of Bath, Bath, UK
*Corresponding author
Declared competing interests of authors: Ann McNeill is a National Institute for Health ResearchSenior Investigator.
Published April 2020DOI: 10.3310/phr08060
This report should be referenced as follows:
Partos TR, Hiscock R, Gilmore AB, Branston JR, Hitchman S, McNeill A. Impact of tobacco tax
increases and industry pricing on smoking behaviours and inequalities: a mixed-methods study.
Public Health Res 2020;8(6).


Public Health Research
ISSN 2050-4381 (Print)
ISSN 2050-439X (Online)
This journal is a member of and subscribes to the principles of the Committee on Publication Ethics (COPE) (www.publicationethics.org/).
Editorial contact: [email protected]
The full PHR archive is freely available to view online at www.journalslibrary.nihr.ac.uk/phr. Print-on-demand copies can be purchased from thereport pages of the NIHR Journals Library website: www.journalslibrary.nihr.ac.uk
Criteria for inclusion in the Public Health Research journalReports are published in Public Health Research (PHR) if (1) they have resulted from work for the PHR programme, and (2) they are of asufficiently high scientific quality as assessed by the reviewers and editors.
Reviews in Public Health Research are termed ‘systematic’ when the account of the search, appraisal and synthesis methods(to minimise biases and random errors) would, in theory, permit the replication of the review by others.
PHR programmeThe Public Health Research (PHR) programme, part of the National Institute for Health Research (NIHR), is the leading UK funder of publichealth research, evaluating public health interventions, providing new knowledge on the benefits, costs, acceptability and wider impactsof non-NHS interventions intended to improve the health of the public and reduce inequalities in health. The scope of the programme ismulti-disciplinary and broad, covering a range of interventions that improve public health.
For more information about the PHR programme please visit the website: https://www.nihr.ac.uk/explore-nihr/funding-programmes/public-health-research.htm
This reportThe research reported in this issue of the journal was funded by the PHR programme as project number 13/43/58. The contractual startdate was in September 2014. The final report began editorial review in September 2018 and was accepted for publication in July 2019.The authors have been wholly responsible for all data collection, analysis and interpretation, and for writing up their work. The PHR editorsand production house have tried to ensure the accuracy of the authors’ report and would like to thank the reviewers for their constructivecomments on the final report document. However, they do not accept liability for damages or losses arising from material published inthis report.
This report presents independent research funded by the National Institute for Health Research (NIHR). The views and opinions expressed byauthors in this publication are those of the authors and do not necessarily reflect those of the NHS, the NIHR, NETSCC, the PHR programmeor the Department of Health and Social Care. If there are verbatim quotations included in this publication the views and opinions expressedby the interviewees are those of the interviewees and do not necessarily reflect those of the authors, those of the NHS, the NIHR, NETSCC,the PHR programme or the Department of Health and Social Care.
© Queen’s Printer and Controller of HMSO 2020. This work was produced by Partos et al. under the terms of a commissioningcontract issued by the Secretary of State for Health and Social Care. This issue may be freely reproduced for the purposes ofprivate research and study and extracts (or indeed, the full report) may be included in professional journals provided thatsuitable acknowledgement is made and the reproduction is not associated with any form of advertising. Applications forcommercial reproduction should be addressed to: NIHR Journals Library, National Institute for Health Research, Evaluation,Trials and Studies Coordinating Centre, Alpha House, University of Southampton Science Park, Southampton SO16 7NS, UK.
Published by the NIHR Journals Library (www.journalslibrary.nihr.ac.uk), produced by Prepress Projects Ltd, Perth, Scotland(www.prepress-projects.co.uk).

NIHR Journals Library Editor-in-Chief
Professor Ken Stein Professor of Public Health, University of Exeter Medical School, UK
NIHR Journals Library Editors
Professor John Powell Chair of HTA and EME Editorial Board and Editor-in-Chief of HTA and EME journals. Consultant Clinical Adviser, National Institute for Health and Care Excellence (NICE), UK, and Senior Clinical Researcher, Nuffield Department of Primary Care Health Sciences, University of Oxford, UK
Professor Andrée Le May Chair of NIHR Journals Library Editorial Group (HS&DR, PGfAR, PHR journals) and Editor-in-Chief of HS&DR, PGfAR, PHR journals
Professor Matthias Beck Professor of Management, Cork University Business School, Department of Management and Marketing, University College Cork, Ireland
Dr Tessa Crilly Director, Crystal Blue Consulting Ltd, UK
Dr Eugenia Cronin Senior Scientific Advisor, Wessex Institute, UK
Dr Peter Davidson Consultant Advisor, Wessex Institute, University of Southampton, UK
Ms Tara Lamont Director, NIHR Dissemination Centre, UK
Dr Catriona McDaid Senior Research Fellow, York Trials Unit, Department of Health Sciences, University of York, UK
Professor William McGuire Professor of Child Health, Hull York Medical School, University of York, UK
Professor Geoffrey Meads Professor of Wellbeing Research, University of Winchester, UK
Professor John Norrie Chair in Medical Statistics, University of Edinburgh, UK
Professor James Raftery Professor of Health Technology Assessment, Wessex Institute, Faculty of Medicine, University of Southampton, UK
Dr Rob Riemsma Reviews Manager, Kleijnen Systematic Reviews Ltd, UK
Professor Helen Roberts Professor of Child Health Research, UCL Great Ormond Street Institute of Child Health, UK
Professor Jonathan Ross Professor of Sexual Health and HIV, University Hospital Birmingham, UK
Professor Helen Snooks Professor of Health Services Research, Institute of Life Science, College of Medicine, Swansea University, UK
Professor Ken Stein Professor of Public Health, University of Exeter Medical School, UK
Professor Jim Thornton Professor of Obstetrics and Gynaecology, Faculty of Medicine and Health Sciences, University of Nottingham, UK
Professor Martin Underwood Warwick Clinical Trials Unit, Warwick Medical School, University of Warwick, UK
Please visit the website for a list of editors: www.journalslibrary.nihr.ac.uk/about/editors
Editorial contact: [email protected]
NIHR Journals Library www.journalslibrary.nihr.ac.uk

Abstract
Impact of tobacco tax increases and industry pricing onsmoking behaviours and inequalities: a mixed-methodsstudy
Timea R Partoso ,1 Rosemary Hiscocko ,2 Anna B Gilmoreo ,2
J Robert Branstono ,3 Sara Hitchmano 1 and Ann McNeillo 1*
1National Addiction Centre, Institute of Psychiatry, Psychology & Neuroscience, King’s CollegeLondon, London, UK
2Department for Health, University of Bath, Bath, UK3Centre for Governance and Regulation, School of Management, University of Bath, Bath, UK
*Corresponding author [email protected]
Background: Increasing tobacco prices through taxation is very effective for reducing smoking prevalenceand inequalities. For optimum effect, understanding how the tobacco industry and smokers respond isessential. Tobacco taxation changes occurred in the UK over the study period, including annual increases,a shift in structure from ad valorem to specific taxation and relatively higher increases on roll-your-owntobacco than on factory-made cigarettes.
Objectives: Understanding tobacco industry pricing strategies in response to tax changes and the impactof tax on smokers’ behaviour, including tax evasion and avoidance, as well as the effect on smokinginequalities. Synthesising findings to inform how taxation can be improved as a public health intervention.
Design: Qualitative analysis and evidence synthesis (commercial and Nielsen data) and longitudinal andaggregate cross-sectional analyses (International Tobacco Control Policy Evaluation Project data).
Setting: The UK, from 2002 to 2016.
Data sources and participants: Data were from the tobacco industry commercial literature and retailtobacco sales data (Nielsen, New York, NY, USA). Participants were a longitudinal cohort (with replenishment)of smokers and ex-smokers from 10 surveys of the International Tobacco Control Policy Evaluation Project(around 1500 participants per survey).
Main outcome measures: (1) Tobacco industry pricing strategies, (2) sales volumes and prices by segmentsover time and (3) smokers’ behaviours, including products purchased, sources, brands, consumption, quitattempts, success and sociodemographic differences.
Review methods: Tobacco industry commercial literature was searched for mentions of tobacco productsand price segments, with 517 articles extracted.
Results: The tobacco industry increased prices on top of tax increases (overshifting), particularly onpremium products, and, recently, the tobacco industry overshifted more on cheap roll-your-own tobaccothan on factory-made cigarettes. Increasingly, price rises were from industry revenue generation ratherthan tax. The tobacco industry raised prices gradually to soften impact; this was less possible with largertax increases. Budget measures to reduce cheap product availability failed due to new cheap factory-madeproducts, price marking and small packs. In 2014, smokers could buy factory-made (roll-your-own tobacco)cigarettes at real prices similar to 2002. Exclusive roll-your-own tobacco and mixed factory-made cigarettes
DOI: 10.3310/phr08060 PUBLIC HEALTH RESEARCH 2020 VOL. 8 NO. 6
© Queen’s Printer and Controller of HMSO 2020. This work was produced by Partos et al. under the terms of a commissioning contract issued by the Secretary of State for Healthand Social Care. This issue may be freely reproduced for the purposes of private research and study and extracts (or indeed, the full report) may be included in professionaljournals provided that suitable acknowledgement is made and the reproduction is not associated with any form of advertising. Applications for commercial reproduction shouldbe addressed to: NIHR Journals Library, National Institute for Health Research, Evaluation, Trials and Studies Coordinating Centre, Alpha House, University of Southampton SciencePark, Southampton SO16 7NS, UK.
v

and roll-your-own tobacco use increased, whereas exclusive factory-made cigarette use decreased, alongsideincreased cheap product use, rather than quitting. Quitting behaviours were associated with higher taxes.Smokers consumed fewer factory-made cigarettes and reduced roll-your-own tobacco weight over time.Apparent illicit purchasing did not increase. Disadvantaged and dependent smokers struggled with tobaccoaffordability and were more likely to smoke cheaper products, but disadvantage did not affect quit success.
Limitations: Different for each data set; triangulation increased confidence.
Conclusions: The tobacco industry overshifted taxes and increased revenues, even when tax increaseswere high. Therefore, tobacco taxes can be further increased to reduce price differentials and recouppublic health costs. Government strategies on illicit tobacco appear effective. Large, sudden tax increaseswould reduce the industry’s ability to manipulate prices, decrease affordability and increase quittingbehaviours. More disadvantaged, and dependent, smokers need more help with quitting.
Future work: Assessing the impact of tax changes made since 2014; changing how tax changes areintroduced (e.g. sudden intermittent or smaller continuous); and tax changes on tobacco initiation.
Funding: This project was funded by the National Institute for Health Research (NIHR) Public HealthResearch programme and will be published in full in Public Health Research; Vol. 8, No. 6. See the NIHRJournals Library website for further project information.
ABSTRACT
NIHR Journals Library www.journalslibrary.nihr.ac.uk
vi

Contents
List of tables xiii
List of figures xv
List of supplementary material xvii
Glossary xix
List of abbreviations xxi
Plain English summary xxiii
Scientific summary xxv
Chapter 1 Introduction and aims 1Background 1
Health and economic impacts of tobacco 1The importance of tobacco tax and price 1The UK tobacco industry 1Tobacco industry segmentation and pricing strategies 1UK smokers’ behavioural responses to price increases 2Affordability 3Illicit tobacco: tobacco industry complicity and UK government strategies 3UK government tobacco taxation 4European Union tax changes 4
Rationale for current study 5Roll-your-own pricing strategies 6Tobacco industry pricing strategies and socioeconomic inequalities 6The prevalence of illicit tobacco use 6
Research objectives 6Objectives 6
Patient and public involvement 7
Chapter 2 General methodology 9Introduction 9Commercial literature 9
Sources 9Analyses 9Limitations and strengths 10Studies using the commercial literature 10
Nielsen data 10Source 10Analyses 11Limitations and strengths 14Studies using the Nielsen data set 14
ITC data 15Data source and sampling characteristics 15Measures 16
DOI: 10.3310/phr08060 PUBLIC HEALTH RESEARCH 2020 VOL. 8 NO. 6
© Queen’s Printer and Controller of HMSO 2020. This work was produced by Partos et al. under the terms of a commissioning contract issued by the Secretary of State for Healthand Social Care. This issue may be freely reproduced for the purposes of private research and study and extracts (or indeed, the full report) may be included in professionaljournals provided that suitable acknowledgement is made and the reproduction is not associated with any form of advertising. Applications for commercial reproduction shouldbe addressed to: NIHR Journals Library, National Institute for Health Research, Evaluation, Trials and Studies Coordinating Centre, Alpha House, University of Southampton SciencePark, Southampton SO16 7NS, UK.
vii

Analyses 21Limitations 22Studies using ITC data 22
Structure of report 22
Chapter 3 Tobacco industry pricing strategies and price segmentation of the UKtobacco market 25Introduction 25Commercial literature study 1: what were the tobacco industry actions to maintainprofitability? 25
Background: UK market conditions reported to be facing tobacco companies in thecommercial literature 25Findings: tobacco industry actions undertaken to maintain profitability 26Commercial literature study 1 conclusions 34
Commercial literature study 2: how does the tobacco industry segment its products on price? 34Nielsen data study 1: allocation of stock-keeping units to segments 36
Segmentation of stock-keeping units for factory-made cigarettes 37Segmentation of stock-keeping units for roll-your-own tobacco 39Generalisation and final segments 39Segmentation allocation of extra stock-keeping units based on industry pricing analyses 42
Summary 44
Chapter 4 What smokers pay for their tobacco 45Introduction 45ITC data study 1: prices paid for tobacco by smokers over time 45
Introduction 45Methods 45Results 46Limitations 47Implications 48Summary of ITC data on tobacco prices 48
Nielsen data study 2: tobacco industry pricing strategies 48Analysis 48Results 49Tobacco industry pricing conclusions 52
Nielsen data study 3: what proportion of price increases by segment are explained bytobacco industry price increases compared with tax increases? 52
Methods 52Results 56
Summary 62
Chapter 5 Changes in the affordability of tobacco products over time 63Introduction 63
Background: affordability in the commercial literature 63ITC data study 2: changes in tobacco affordability over time among smokers 63
Methods 63Results 65Limitations 69Implications 69
Summary 70
CONTENTS
NIHR Journals Library www.journalslibrary.nihr.ac.uk
viii

Chapter 6 The impact of tobacco tax increases, as moderated by tobacco industrypricing, on smokers’ legal purchasing patterns 71Introduction 71
Background: evidence of down-trading in the commercial literature 71Nielsen data study 4: what are sales volumes overall and by tobacco type over time? 72ITC data study 3: smokers’ tobacco purchasing behaviours by product and store type(licit purchases) 72
Methods 73Results 73
Nielsen data study 5: what are sales volumes by differently priced segments over time? 75Results 75Implications 75
ITC data study 4: impact of tobacco pricing changes on smokers’ purchasing patternsand product choices (cross-sectional and longitudinal analyses) 76
Methods 76Measures 77Analyses 78Results 78Limitations 82Conclusions 82
Summary 82
Chapter 7 The impact of tobacco tax increases, as moderated by tobacco industrypricing, on smoking behaviour via quitting and reducing tobacco consumption 87Introduction 87ITC data study 5: impact of tobacco pricing changes on quitting behaviours(longitudinal analyses) 87
Methods 87Results 88Limitations 89Implications 89
ITC data study 6: weight of roll-your-own tobacco cigarettes, analysis over time andinternational comparison 89
Methods 89Analyses 90Results 90Limitations 92Implications 93
Summary 93
Chapter 8 Purchasing tobacco products that are likely to constitute tax avoidanceor evasion 95Introduction 95ITC data studies 1 and 3: tobacco obtained via tax avoidance or evasion – smokers’purchasing patterns, sources and prices paid 95
Methods 95Results 95Implications 98
DOI: 10.3310/phr08060 PUBLIC HEALTH RESEARCH 2020 VOL. 8 NO. 6
© Queen’s Printer and Controller of HMSO 2020. This work was produced by Partos et al. under the terms of a commissioning contract issued by the Secretary of State for Healthand Social Care. This issue may be freely reproduced for the purposes of private research and study and extracts (or indeed, the full report) may be included in professionaljournals provided that suitable acknowledgement is made and the reproduction is not associated with any form of advertising. Applications for commercial reproduction shouldbe addressed to: NIHR Journals Library, National Institute for Health Research, Evaluation, Trials and Studies Coordinating Centre, Alpha House, University of Southampton SciencePark, Southampton SO16 7NS, UK.
ix

ITC data study 2: changes in tobacco affordability over time among smokers(purchases from non-UK/non-store sources) 98
Methods 98Results 99
ITC data study 4: how does purchasing illicit tobacco influence products purchased(cross-sectional and longitudinal analyses)? 100
Methods 100Results 100
Analysis 4a: product type 100Analysis 4b: changes in smoking behaviour 100Implications 101
ITC study 5: how does purchasing illicit tobacco influence reducing and quittingbehaviours (longitudinal analysis)? 101
Methods 101Results 101
Implications 101Summary 101
Chapter 9 Sociodemographic disadvantage, taxes, pricing and smoking behaviour 103Introduction 103ITC study 2: changes in tobacco affordability over time (sociodemographics anddependence) 103
Methods 103Results 103Implications 107
ITC study 4: impact of tobacco pricing changes on smokers’ purchasing patterns andproduct choices (sociodemographics and dependence) 107
Methods 107Results 107Implications 107Limitations 112
ITC study 5: impact of tobacco pricing changes and product choices on smokers’quitting behaviours (sociodemographics and dependence) 112
Methods 112Results 112Implications 112
ITC study 6: weight of roll-your-own tobacco cigarette analysis over time andinternational comparison (sociodemographics and dependence) 114
Methods 114Results 114Implications 114
Summary: were tobacco industry price strategies and tax structures influencinginequalities? 114
Chapter 10 Overall synthesis of findings 117Introduction 117Industry pricing and what smokers pay for their tobacco (see Chapters 3 and 4) 117
Industry pricing and profit maximisation suggests scope for further tax increases 117Industry pricing undermining the impact of tax increases 118Approaches the tobacco industry uses to keep some products cheap 119Importance of both pack and unit price to smokers and governments 119The prices smokers pay 119
CONTENTS
NIHR Journals Library www.journalslibrary.nihr.ac.uk
x

Changes in the affordability of tobacco over time (see Chapter 5) 120Impact of tobacco tax increases, as moderated by tobacco industry pricing on smokers’purchasing patterns (see Chapter 6) 120
Purchase source: UK store-based sources 120Product switching 120Down-trading 121
Impact of tobacco tax increases, as moderated by tobacco industry pricing, on smokingbehaviour via quitting and reducing tobacco consumption (see Chapter 7) 121Purchasing tobacco likely to constitute tax avoidance and/or evasion (see Chapter 8) 122
Non-UK/non-store purchases 122Inequalities (see Chapter 9) 123Implications outside the UK 123Further research 124
Acknowledgements 125
References 127
DOI: 10.3310/phr08060 PUBLIC HEALTH RESEARCH 2020 VOL. 8 NO. 6
© Queen’s Printer and Controller of HMSO 2020. This work was produced by Partos et al. under the terms of a commissioning contract issued by the Secretary of State for Healthand Social Care. This issue may be freely reproduced for the purposes of private research and study and extracts (or indeed, the full report) may be included in professionaljournals provided that suitable acknowledgement is made and the reproduction is not associated with any form of advertising. Applications for commercial reproduction shouldbe addressed to: NIHR Journals Library, National Institute for Health Research, Evaluation, Trials and Studies Coordinating Centre, Alpha House, University of Southampton SciencePark, Southampton SO16 7NS, UK.
xi


List of tables
TABLE 1 Tobacco duty rates for FM cigarettes and RYO tobacco: UK 2001–15 5
TABLE 2 Comparison of hierarchical brand classification typologies 11
TABLE 3 Nielsen data: comparison of number of valid FM cigarette SKUs usingNielsen’s suggested distribution criteria (distributed to ≥ 10% of stores) vs. ourestimations using varying minimum market shares based on volume of sticks sold(> 0.02% to > 0.06%) 13
TABLE 4 UK survey dates and sample sizes for the ITC data 15
TABLE 5 Commercial literature study 2: segment names mentioned in thecommercial literature, sorted by approximate price group 35
TABLE 6 Nielsen data study 1: final allocation of FM cigarette brand families andRYO tobacco brand variants from the Nielsen data to price segments 42
TABLE 7 International Tobacco Control Policy Evaluation Project data study 1:unweighted sample characteristics by survey wave 46
TABLE 8 Nielsen data study 2: annual volumes of pack sales (millions) andmarket share for FM cigarettes and RYO tobacco, by price segment and pack size 51
TABLE 9 Nielsen data study 2: weighted average real prices (base year= 2014)per pack over time for FM cigarettes and RYO tobacco, by price segment andpack size 53
TABLE 10 Nielsen data study 3: percentage weighted real (base year= 2014)price changes in pack industry net revenue and tax, for popular pack sizes,by price segment 61
TABLE 11 International Tobacco Control Policy Evaluation Project study 2: samplecharacteristics for the combined sample and separately by tobacco format(FM cigarettes or RYO tobacco) 66
TABLE 12 International Tobacco Control Policy Evaluation Project data study 2:linear random-effects clustered regression analyses of individualised affordabilityregressed on time (tax year) and other covariates (fully adjusted), separately forFM cigarette and RYO tobacco smokers 68
TABLE 13 International Tobacco Control Policy Evaluation Project data study 3:usual tobacco product, product last purchased and source of last purchase(weighted data), with tests for linear trends over time 74
TABLE 14 International Tobacco Control Policy Evaluation Project data study 4:classification matrix for product purchase changes from baseline to outcome surveys 77
DOI: 10.3310/phr08060 PUBLIC HEALTH RESEARCH 2020 VOL. 8 NO. 6
© Queen’s Printer and Controller of HMSO 2020. This work was produced by Partos et al. under the terms of a commissioning contract issued by the Secretary of State for Healthand Social Care. This issue may be freely reproduced for the purposes of private research and study and extracts (or indeed, the full report) may be included in professionaljournals provided that suitable acknowledgement is made and the reproduction is not associated with any form of advertising. Applications for commercial reproduction shouldbe addressed to: NIHR Journals Library, National Institute for Health Research, Evaluation, Trials and Studies Coordinating Centre, Alpha House, University of Southampton SciencePark, Southampton SO16 7NS, UK.
xiii

TABLE 15 International Tobacco Control Policy Evaluation Project study 4:descriptives for the cross-sectional sample (aggregate data from four surveys)used in analysis 4a, by product type 79
TABLE 16 International Tobacco Control Policy Evaluation Project data study 4(analysis 4a): fully adjusted clustered, multinomial logistic regression of tobaccoproduct type (premium FM cigarettes is reference, with 25.0% using thisproduct) on individual-level predictors (tax increase rates, brand and productloyalty) (n= 2418, observations= 4339) 83
TABLE 17 International Tobacco Control Policy Evaluation Project data study 4(analysis 4b): fully adjusted clustered, multinomial logistic regression of tobaccopurchase changes (trading up/staying the same is reference, with 72.0%achieving this outcome) on individual-level predictors (tax increase rates, brandand product loyalty) (n= 854, observations= 1397) 84
TABLE 18 International Tobacco Control Policy Evaluation Project data study 5:fully adjusted clustered logistic regression of making a quit attempt andachieving at least 6 months’ sustained abstinence 88
TABLE 19 International Tobacco Control Policy Evaluation Project data study 6:sample characteristics by country 91
TABLE 20 International Tobacco Control Policy Evaluation Project data study 3:source of last purchase and product last purchased (weighted data), with testsfor linear trends over time 96
TABLE 21 International Tobacco Control Policy Evaluation Project data study 2:linear random-effects clustered regression analyses of individualised affordabilityregressed on sociodemographic and other covariates (fully adjusted), separatelyfor FM cigarette and RYO tobacco smokers 104
TABLE 22 International Tobacco Control Policy Evaluation Project data study 4(analysis 4a): fully adjusted clustered, multinomial logistic regression of tobaccoproduct type (premium FM cigarettes is reference, with 25.0% using thisproduct) on individual-level predictors (dependence and sociodemographics)(n= 2418, observations= 4339) 108
TABLE 23 International Tobacco Control Policy Evaluation Project data study 4(analysis 4b): fully adjusted clustered, multinomial logistic regression of tobaccopurchase changes (trading up/staying the same is reference, with 72.0%achieving this outcome) on individual-level predictors (dependence andsociodemographics) (n= 854, observations= 1397) 110
TABLE 24 International Tobacco Control Policy Evaluation Project data study 5:fully adjusted clustered logistic regression of making a quit attempt andachieving at least 6 months’ sustained abstinence 113
TABLE 25 International Tobacco Control Policy Evaluation Project data study 6:clustered linear regression predicting the weight of tobacco per RYO cigarette(n= 1349, observations= 2705) 115
LIST OF TABLES
NIHR Journals Library www.journalslibrary.nihr.ac.uk
xiv

List of figures
FIGURE 1 International Tobacco Control Policy Evaluation Project surveyquestions and response categorisation for tobacco product purchases 18
FIGURE 2 Nielsen data study 1: Berkeley FM cigarette SKUs alongside preliminaryprice segments, illustrating how anomalous SKUs were used to understandsegmentation 38
FIGURE 3 Nielsen data study 1: Mayfair FM cigarette SKUs alongside preliminaryprice segments, illustrating the dramatic discounting of some SKUs being phasedout of production, as new SKUs were introduced 40
FIGURE 4 Nielsen data study 1: RYO SKUs compared with Amber Leaf SKUs,showing the pattern that was observed when other RYO SKUs were pricedconsistently above (e.g. Golden Virginia SKUs; blue lines), in-line with (e.g.Golden Virginia Smooth SKUs; light green lines) or below (e.g. Gold Leaf SKUs;dark green lines) the more traditional RYO brand Amber Leaf (black lines) 41
FIGURE 5 Nielsen price boundaries used for ITC brand allocation of FM cigarettesto price segments (used in ITC studies 3–5) 43
FIGURE 6 International Tobacco Control Policy Evaluation Project data study 1:weighted median prices (black lines) and 95% ranges (shaded areas: top andbottom 2.5% excluded) of (a) FM-P and RYO tobacco; and (b) FM-C purchasedfrom UK store-based sources only 47
FIGURE 7 Nielsen data study 2: weighted average real prices (base year= 2014) 50
FIGURE 8 Nielsen data study 2: percentage of packs price marked by (a) segmentfor FM cigarettes and RYO tobacco; and (b) pack size for RYO tobacco 54
FIGURE 9 Nielsen data study 3: net real (base year= 2014) TI revenue per pack(most popular pack sizes) for FM cigarettes and RYO tobacco, by price segment 57
FIGURE 10 Nielsen data study 3: change in net real (base year= 2014) revenueper pack (£) post Budget [difference in revenue per pack in each post-Budgetmonth compared with Budget month (last month of previous tax year)] forpopular pack sizes of FM cigarettes and RYO tobacco, by price segment: (a) 2009tax year; (b) 2010 tax year; (c) 2011 tax year; (d) 2012 tax year; (e) 2013 tax year;(f) 2014 tax year; and (g) 2015 tax year 58
FIGURE 11 International Tobacco Control Policy Evaluation Project data study 2:measures of affordability (individualised and aggregate versions) and theirconstituent components (income and tobacco prices) over time 67
FIGURE 12 Nielsen data study 4: monthly tobacco sales volumes (millions of stickssold) for FM cigarettes and RYO tobacco 72
FIGURE 13 Nielsen data study 5: monthly tobacco sales volumes (millions of stickssold) for FM cigarettes and RYO tobacco, by price segments 76
DOI: 10.3310/phr08060 PUBLIC HEALTH RESEARCH 2020 VOL. 8 NO. 6
© Queen’s Printer and Controller of HMSO 2020. This work was produced by Partos et al. under the terms of a commissioning contract issued by the Secretary of State for Healthand Social Care. This issue may be freely reproduced for the purposes of private research and study and extracts (or indeed, the full report) may be included in professionaljournals provided that suitable acknowledgement is made and the reproduction is not associated with any form of advertising. Applications for commercial reproduction shouldbe addressed to: NIHR Journals Library, National Institute for Health Research, Evaluation, Trials and Studies Coordinating Centre, Alpha House, University of Southampton SciencePark, Southampton SO16 7NS, UK.
xv

FIGURE 14 International Tobacco Control Policy Evaluation Project data study 4:percentage of participants using each product type over time (tax year) withtobacco tax increase rates (per cent above inflation) in brackets 82
FIGURE 15 International Tobacco Control Policy Evaluation Project data study 6:changes in the mean weight of tobacco (in grams) per RYO cigarette over timefor the UK and Australia (AU) 92
FIGURE 16 International Tobacco Control Policy Evaluation Project data study 1:weighted median prices of different product types purchased from UK store-basedand non-UK/non-store-based sources 97
FIGURE 17 International Tobacco Control Policy Evaluation Project study 2:individualised tobacco affordability over time for (a) FM cigarette smokers; and(b) RYO tobacco smokers, for purchases made from all sources and separately fornon-UK/non-store sources only 99
FIGURE 18 ITC data study 2: individualised affordability for FM cigarette smokers,showing female smokers, those with high levels of education and moredependent smokers, compared with overall affordability 105
FIGURE 19 International Tobacco Control Policy Evaluation Project data study 2:individualised affordability for RYO tobacco smokers, showing female smokers,those with high levels of education and more dependent smokers, comparedwith overall affordability 105
FIGURE 20 International Tobacco Control Policy Evaluation Project data study 2:individualised affordability in 2014, for two theoretical smokers by age [based onregression coefficients for the fully adjusted model 2 for RYO tobacco (high) andFM cigarette (low) smokers; see Report Supplementary Material 2] 106
FIGURE 21 International Tobacco Control Policy Evaluation Project data study 6:mean model-predicted weight of tobacco (in grams) per RYO cigarette overtime, for different age groups (pooled data from Australia and the UK) 115
FIGURE 22 International Tobacco Control Policy Evaluation Project data study 6:mean model-predicted weight of tobacco (in grams) per RYO cigarette overtime, for different income groups (pooled data from Australia and the UK) 116
FIGURE 23 The inter-relationship between tobacco control and tax policy, TI andsmokers’ behaviour 117
LIST OF FIGURES
NIHR Journals Library www.journalslibrary.nihr.ac.uk
xvi

List of supplementary material
Report Supplementary Material 1 Adjusting the annual household income in the ITC4-country UK data set
Report Supplementary Material 2 Supplementary tables
Report Supplementary Material 3 Supplementary figures
Supplementary material can be found on the NIHR Journals Library report page(https://doi.org/10.3310/phr08060).
Supplementary material has been provided by the authors to support the report and any filesprovided at submission will have been seen by peer reviewers, but not extensively reviewed. Anysupplementary material provided at a later stage in the process may not have been peer reviewed.
DOI: 10.3310/phr08060 PUBLIC HEALTH RESEARCH 2020 VOL. 8 NO. 6
© Queen’s Printer and Controller of HMSO 2020. This work was produced by Partos et al. under the terms of a commissioning contract issued by the Secretary of State for Healthand Social Care. This issue may be freely reproduced for the purposes of private research and study and extracts (or indeed, the full report) may be included in professionaljournals provided that suitable acknowledgement is made and the reproduction is not associated with any form of advertising. Applications for commercial reproduction shouldbe addressed to: NIHR Journals Library, National Institute for Health Research, Evaluation, Trials and Studies Coordinating Centre, Alpha House, University of Southampton SciencePark, Southampton SO16 7NS, UK.
xvii


Glossary
Big Mac® Index The number of cigarettes that can be purchased for the price of one McDonald’s BigMac hamburger (McDonald’s Corporation, San Bernardino, CA, USA).
Cigar Roll of tobacco wrapped in a tobacco leaf.
Cigarette Roll of tobacco inserted into a cigarette paper tube.
Cigarillos Small cigars.
Combipacks Roll-your-own tobacco packs sold with papers and filters included.
Down-trading Shifting to a cheaper product.
Factory-made cigarette A mass-produced cigarette, inclusive of tobacco, filter and paper.
Illicit tobacco Tobacco products that are counterfeit and smuggled, commonly to evade tax.
Make your own Referring to machine-assembled cigarettes using smoker-owned machinery.
Net revenue The money the industry retains after sale (in this study, this refers only to the moneyretained after taxes, but before other costs, such as production, distribution and marketing, have beendeducted).
Nielsen (New York, NY, USA) A global market research company that measures market share, salesvolumes, distribution, pricing and promotion, with particular strengths in consumer packaged goods.
Nielsen Scantrack Nielsen’s electronic point-of-sale database.
Overshifting Increasing the price of products by more than any tax increase.
Price marking Packs of cigarettes or tobacco with the price printed on them.
Roll-your-own cigarette A hand-assembled cigarette containing tobacco, filter and paper. Also knownas hand-rolled tobacco.
Stock-keeping unit A retail product generally identifiable through a unique barcode.
Undershifting A strategy used by the tobacco industry to keep some tobacco prices low by absorbingthe tax increases on some tobacco products, such that their price does not increase as intended and mayeven fall, while increasing prices of other products by more than the tobacco taxes (‘overshifting’), hencemaintaining profitability.
DOI: 10.3310/phr08060 PUBLIC HEALTH RESEARCH 2020 VOL. 8 NO. 6
© Queen’s Printer and Controller of HMSO 2020. This work was produced by Partos et al. under the terms of a commissioning contract issued by the Secretary of State for Healthand Social Care. This issue may be freely reproduced for the purposes of private research and study and extracts (or indeed, the full report) may be included in professionaljournals provided that suitable acknowledgement is made and the reproduction is not associated with any form of advertising. Applications for commercial reproduction shouldbe addressed to: NIHR Journals Library, National Institute for Health Research, Evaluation, Trials and Studies Coordinating Centre, Alpha House, University of Southampton SciencePark, Southampton SO16 7NS, UK.
xix


List of abbreviations
ASH Action on Smoking and Health
BAT British American Tobacco
CAGE Competitive Advantage in theGlobal Economy
CI confidence interval
CPD cigarettes per day
CPI Consumer Price Index
EPOS electronic point of sale
EU European Union
FM factory made
FM-C factory-made (cigarettes sold in)cartons
FM-P factory-made (cigarettes sold in)packs
GDP gross domestic product
GEE generalised estimating equation
HMRC Her Majesty’s Revenue andCustoms
HSI Heaviness of Smoking Index
ITC International Tobacco ControlPolicy Evaluation Project
JPS John Player Special
JTI Japan Tobacco International
L&B Lambert & Butler
MCT minimum consumption tax
MET minimum excise tax
MPPC most popular price category
OR odds ratio
PMI Philip Morris International
PoS point of sale
PPACTE Pricing Policies And Control ofTobacco in Europe
QIC quasi-likelihood under theindependence model criterion
RIP relative income price
RPI Retail Price Index
RRP recommended retail price
RRR relative risk ratio
RYO roll your own
SD standard deviation
SE standard error
SES socioeconomic status
SKU stock-keeping unit
STG Scandinavian Tobacco Group
TI tobacco industry
TPD Tobacco Products Directive
TTFC time to first cigarette
UKCTAS UK Centre for Tobacco and AlcoholStudies
ULP ultra-low price
VAT value-added tax
WAP weighted average price
DOI: 10.3310/phr08060 PUBLIC HEALTH RESEARCH 2020 VOL. 8 NO. 6
© Queen’s Printer and Controller of HMSO 2020. This work was produced by Partos et al. under the terms of a commissioning contract issued by the Secretary of State for Healthand Social Care. This issue may be freely reproduced for the purposes of private research and study and extracts (or indeed, the full report) may be included in professionaljournals provided that suitable acknowledgement is made and the reproduction is not associated with any form of advertising. Applications for commercial reproduction shouldbe addressed to: NIHR Journals Library, National Institute for Health Research, Evaluation, Trials and Studies Coordinating Centre, Alpha House, University of Southampton SciencePark, Southampton SO16 7NS, UK.
xxi


Plain English summary
Smoking causes more deaths in the UK than all other preventable causes. A very effective way to reducesmoking is to increase tobacco taxes. However, many factors affect how smokers respond to these,
including how big the tax increases are and whether or not they apply to roll-your-own tobacco as well asfactory-made cigarettes, and how the tobacco industry responds. We investigated these issues.
We examined three information sources: (1) tobacco industry and retailer reports and magazines (2008–14),(2) the amount of tobacco sold in shops and the prices smokers paid (2008–16) and (3) a survey of smokers(2002–14).
When tax changed, the tobacco industry raised prices slowly over a few months so that smokers would notnotice. Overall, the industry dramatically increased prices of expensive packs while keeping cheapest packsabout the same. It did this by cutting numbers of cigarettes in packs, introducing smaller roll-your-ownpacks and new, cheaper brands, often with the price printed on the pack, which shopkeepers had tochange. Over time, the industry made larger price increases on top of the increases required for tax.
Smokers could buy tobacco in 2014 at the same price as in 2002. Some smokers attempted to stop andsome succeeded, particularly when bigger tax increases were implemented. However, instead, moresmokers switched to cheaper brands or roll your own, cut down, or used less tobacco when rollingcigarettes. Poorer smokers struggled most to afford tobacco, but smoked cheap products and were notmore likely to quit. Buying smuggled or duty-free tobacco did not increase.
Sudden, large tax rises could stop the industry increasing prices slowly, and seeing a large price jumpmight encourage more smokers to quit. Preventing the industry from introducing new brands, havingplain, standardised packaging and sizes, and providing support for smokers trying to quit would be likelyto reduce smoking.
DOI: 10.3310/phr08060 PUBLIC HEALTH RESEARCH 2020 VOL. 8 NO. 6
© Queen’s Printer and Controller of HMSO 2020. This work was produced by Partos et al. under the terms of a commissioning contract issued by the Secretary of State for Healthand Social Care. This issue may be freely reproduced for the purposes of private research and study and extracts (or indeed, the full report) may be included in professionaljournals provided that suitable acknowledgement is made and the reproduction is not associated with any form of advertising. Applications for commercial reproduction shouldbe addressed to: NIHR Journals Library, National Institute for Health Research, Evaluation, Trials and Studies Coordinating Centre, Alpha House, University of Southampton SciencePark, Southampton SO16 7NS, UK.
xxiii


Scientific summary
Background
Since 2010, the UK government has introduced various tobacco tax changes. The aim of this study was toevaluate the effectiveness of these on tobacco use and inequalities in tobacco use, and the extent to whichthese were influenced by tobacco industry pricing strategies.
Objectives
l Provide up-to-date knowledge of tobacco industry pricing and the extent to which this modifies theimpact of tobacco taxation on public health, by examining:
¢ how the tobacco industry segments factory-made and roll-your-own cigarettes by price¢ the extent to which the tobacco industry undershifts, overshifts or fully shifts tobacco tax increases
to consumers, whether or not this varies by product, price segment and over time, and whatproportion of price increases by segment is explained by tobacco industry price increases versustax increases.
l Explore the impact of tobacco tax increases, as moderated by tobacco industry pricing, on smokers’behaviour, by examining:
¢ the impact of price changes and the price range (the difference in price between the most and leastexpensive products) on quitting, or switching between products/price segments
¢ the impact of the price range and price changes on consumption¢ whether or not these behaviours differ by smokers’ previous product/price choice.
l Increase understanding of trends in, and the nature of, tax avoidance and evasion, by examining:
¢ trends in smokers’ tobacco tax avoidance and evasion, their socioeconomic status and othercharacteristics, and where they acquire tobacco
¢ whether or not tax/price increases, particularly larger increases, are linked to tax avoidanceand/or evasion
¢ products most frequently acquired via tax avoidance/evasion and from which sources.
l Explore the impact of tobacco tax increases, as moderated by tobacco industry pricing, on inequalitiesin smoking, by examining:
¢ smokers’ characteristics by product/price segment¢ whether or not behaviours (quitting, switching between segments and reducing consumption) differ
by socioeconomic status¢ if the proportion of change in smoking inequalities over time is attributable to cheap tobacco use.
l Synthesise findings and develop recommendations to improve the effectiveness of tobacco taxation.
Methods
There were three main data sources.
DOI: 10.3310/phr08060 PUBLIC HEALTH RESEARCH 2020 VOL. 8 NO. 6
© Queen’s Printer and Controller of HMSO 2020. This work was produced by Partos et al. under the terms of a commissioning contract issued by the Secretary of State for Healthand Social Care. This issue may be freely reproduced for the purposes of private research and study and extracts (or indeed, the full report) may be included in professionaljournals provided that suitable acknowledgement is made and the reproduction is not associated with any form of advertising. Applications for commercial reproduction shouldbe addressed to: NIHR Journals Library, National Institute for Health Research, Evaluation, Trials and Studies Coordinating Centre, Alpha House, University of Southampton SciencePark, Southampton SO16 7NS, UK.
xxv

Commercial literature (2008–14)This comprised tobacco industry reports and presentations, analyst reports and trade magazines. A totalof 517 articles were identified, providing 1892 extracts: 1700 concerned 347 brands/variants, usedfor segmentation. Qualitative analyses of 557 quotes explored how the tobacco industry maintainsprofitability, smokers’ reactions and the wider context facing the tobacco industry.
Nielsen data (2008–16)Nielsen provided tobacco sales data. Nielsen’s Scantrak data are based on information obtained whentobacco products are sold (electronic point-of-sale system). Nielsen models the whole UK market usingelectronic point-of-sale data from 87% of the UK’s supermarkets, 15% of its convenience stores and 17%of Northern Ireland stores with grocery sales. The data cover different factory-made and roll-your-ownproducts: the number of units sold, price/unit, total value and volume.
International Tobacco Control Policy Evaluation Project data (2002–14)This was a longitudinal cohort survey of UK smokers at recruitment, retained for as long as possible evenif participants had quit, with replenishment, and administered via computer-aided telephone interviewingor online. Data were mostly from surveys 1–10 (2002–14). For roll-your-own tobacco weight calculations,a comparison was made with three other International Tobacco Control Policy Evaluation Project countries’surveys (2002–15). Stratified random sampling and weights are used to obtain broadly nationallyrepresentative samples. Validity checks were carried out and analyses examined prices paid, affordability,purchasing behaviours and consumption, and, when appropriate, examined differences by dependenceand socioeconomic status.
Results
Objective 1
SegmentationOur analysis of the commercial literature and Nielsen data analysis demonstrated four factory-madecigarette price segments (premium, mid-price, value and, from 2012, subvalue) and three roll-your-owntobacco price segments (premium, mid-price and value).
Tobacco industry pricing strategies and what smokers pay for their tobaccoThe commercial literature reported smokers down-trading because of increased prices (due to tax/profitgeneration) and the recession. The tobacco industry implemented various strategies to maintain profitability,including innovation; launching more products in lower price segments, often of the same brand as higherpriced products; and using a variety of techniques to promote cheaper products, such as price marking andsmaller pack sizes.
The International Tobacco Control Policy Evaluation Project 2002–14 data (6169 participants, 15,812responses) show that the real price paid for tobacco products purchased from licit sources (supermarketsand convenience stores) increased significantly over time. The median price per stick for factory-made(cigarettes sold in) packs increased by £0.10 (2002–14), factory-made (cigarettes sold in) cartons weretypically £0.01–0.02 cheaper per stick and the median price per stick for roll-your-own tobacco increasedby £0.05 (2006–14). Changing between product types saved money, with roll-your-own tobacco perstick being typically less than half the price of one factory-made pack cigarette. Changing within producttypes (to different brands) also saved money. The price range between the cheapest and most expensiveproducts within each category [factory-made (cigarettes sold in) packs, factory-made (cigarettes sold in)cartons and roll-your-own tobacco] was consistently wide and, for some products, widening since 2010.Thus, smokers in 2014 could buy the same type of product at real prices similar to 2002 for factory-madecigarettes and 2006 for roll-your-own tobacco. There was a greater increase in prices since 2011, whenduty was higher than in previous years, but this did not prevent the widening range between the cheapestand most expensive products.
SCIENTIFIC SUMMARY
NIHR Journals Library www.journalslibrary.nihr.ac.uk
xxvi

Nielsen data corroborated these findings. From 2013 to 2015, real prices of premium factory-made androll-your-own packs increased by £1.09 and £1.16, respectively (overshifting, i.e. raising prices above theneed to meet taxes), whereas subvalue packs fell by £0.06 and roll-your-own tobacco packs only increasedby £0.02 (undershifting). Prices of all three roll-your-own tobacco segments increased by the highest amountpost the 2011 Budget, and the range between factory-made premium and value cigarette segments declined.However, subvalue products were then introduced, with falling real prices per pack subsequently leading to awidening of the range between premium and subvalue segments.
Smaller packs (17–19 sticks) were introduced to an increasing number of brands and market share of20-stick packs declined over the study period. For roll-your-own tobacco, smaller (10-g) packs increasedtowards the end of the study period and the 50-g pack market share grew slightly. Price increases perstick were seen in every segment, suggesting that the fall in price of subvalue packs was due to thedeclining number of sticks per pack. Cheaper segments were more likely to be price marked and pricemarking appeared to increase gradually over time.
Nielsen data indicated that net real revenue was considerably greater for higher than for lower priced segments,with a more marked gap within factory-made than roll-your-own segments. At the 2011 Budget, a cyclicalpattern emerged involving a drop in revenue immediately post Budget with increases thereafter, with differentpatterns across segments and progressively more differentiation in revenue between segments. A significantproportion of price rises was from industry revenue generation, rather than tax increases, with different patternsaccording to tax increases. Sudden, large tax increases appeared to compromise the tobacco industry’s ability tomanipulate prices.
AffordabilityThe commercial literature suggested that tobacco products were becoming less affordable. InternationalTobacco Control Policy Evaluation Project data (4062 current daily smokers, 8943 observations) indicatedan average annual decrease in incomes over the study period. There was an average annual increase of2.6% in the price of factory-made cigarettes and individualised affordability decreased annually by 0.24%(2002–14). There was an average annual increase of 4.5% in the price of roll-your-own cigarettes andindividualised affordability decreased annually by 0.31% (2006–14). Roll-your-own tobacco wassignificantly more affordable than factory-made cigarettes.
Objective 2
Smokers’ responses to taxation and tobacco industry pricing strategiesNielsen data indicated that although the overall volume of factory-made cigarettes and roll-your-owntobacco sold declined markedly, this was made up of a 17% decline in factory-made cigarettes and a46% increase in roll-your-own tobacco, although the latter stabilised post 2012. This was reflected in theInternational Tobacco Control Policy Evaluation Project data (2002–14; 6169 participants, 15,812 responses),which indicated that exclusive roll-your-own tobacco use increased and exclusive factory-made cigaretteuse decreased. Mixed factory-made cigarettes and roll-your-own tobacco did not show a statistical lineartrend across 2002–14, but increased significantly in 2010–13, from 10.2% to 18.2%. Further evidence ofdown-trading was evident from Nielsen data, which showed that annual volumes of premium and mid-pricefactory-made products declined over the study period, whereas value factory-made products increased.Similarly, premium roll-your-own tobacco sales declined, whereas roll-your-own mid-price tobacco and valuetobacco sales grew, although growth slowed around 2012–13.
International Tobacco Control Policy Evaluation Project data from 2008 to 2014 (2418 participants, 4339observations) demonstrated that, overall, the use of cheap tobacco (mid-price factory made, value factorymade and roll your own) increased modestly from 72.4% to 77.6%, with a corresponding drop in premiumfactory-made tobacco. Value factory-made cigarettes and/or roll-your-own cigarettes were more likely to beused than premium factory-made cigarettes when there was a higher tobacco tax increase rate.
DOI: 10.3310/phr08060 PUBLIC HEALTH RESEARCH 2020 VOL. 8 NO. 6
© Queen’s Printer and Controller of HMSO 2020. This work was produced by Partos et al. under the terms of a commissioning contract issued by the Secretary of State for Healthand Social Care. This issue may be freely reproduced for the purposes of private research and study and extracts (or indeed, the full report) may be included in professionaljournals provided that suitable acknowledgement is made and the reproduction is not associated with any form of advertising. Applications for commercial reproduction shouldbe addressed to: NIHR Journals Library, National Institute for Health Research, Evaluation, Trials and Studies Coordinating Centre, Alpha House, University of Southampton SciencePark, Southampton SO16 7NS, UK.
xxvii

In longitudinal analyses (1304 participants, 2202 observations), the most common outcome between thebaseline and outcome surveys was trading up (5.5%) and no change (66.5%), 13.5% traded down tocheaper factory-made cigarettes, 6.2% switched from factory-made cigarettes to roll-your-own cigarettesand 8.3% stopped purchasing tobacco products for at least 6 months. A high tobacco tax increase atthe outcome survey was the only significant predictor of all these behaviours. We also assessed quitattempts (1304 participants, 2202 observations) and 6 months’ sustained quitting (1194 participants,2017 observations). Just over one-third (39.4%) of smokers made a quit attempt: overall, baseline tobaccotype was a predictor of attempting to quit, with those smoking mid-price factory-made cigarettes and valuefactory-made cigarettes significantly more likely to try quitting than those using roll-your-own cigarettes.Quit attempts at outcome survey were also more likely with a 2% tax increase rate above inflation than 1%(5% consistent with 2% but non-significant). Just under 1 in 10 smokers (9.7%) sustained quitting for atleast 6 months and this outcome was significantly more likely among smokers of mid-price factory-madecigarettes, value factory-made cigarettes and roll-your-own cigarettes compared with premium factory-madecigarettes at baseline, and higher tax increase rate at the outcome survey.
In the International Tobacco Control Policy Evaluation Project affordability analysis (4062 current daily smokers,8943 observations), factory-made cigarette smokers slightly, but significantly, reduced their cigaretteconsumption over time; there was no significant change for roll-your-own tobacco smokers. InternationalTobacco Control Policy Evaluation Project data (2006–15) assessed the weight of roll-your-own tobacco/cigarettes and changes over time, in the UK, the USA, Canada and Australia (1639 participants, 3176observations). Just over one-quarter of UK participants (25.8%) smoked roll-your-own tobacco/cigarettes(compared with 3.5% in the USA, 6.0% in Canada and 13.8% in Australia). Mean roll-your-own tobacco/cigarettes weight was lowest in the UK [0.51 g (standard deviation 0.32 g)] and Australia [0.53 g (standarddeviation 0.28 g)], compared with Canada [0.76 g (standard deviation 0.45 g)] and the USA [1.07 g (standarddeviation 0.51 g)]. For the UK and Australia (1349 participants, 2705 observations) there was a significantdecrease equivalent to a 2% per year decrease in average weight per cigarette. Thus, for both factory-madecigarette smokers and roll-your-own tobacco smokers in the UK, tobacco consumption was reducing over time,implying that the decrease in affordability was not attributable to increasing cigarette consumption.
Objective 3
Purchasing from possible tax evasion/tax avoidance sourcesPurchasing from non-UK/non-store sources (6169 participants, 15,812 responses) constituted ≤ 20% ofpurchases and reduced significantly over time (2002–14). If missing data were assumed to be non-UK/non-store, then the decrease was no longer significant, but there was no evidence of an increase.
Among non-UK/non-store purchases, purchasing outside the UK was most common (≥ 40%), although thisdecreased significantly over time, as did purchasing from informal sellers (≤ 17%). Purchasing from duty-freeoutlets and friends/relatives significantly increased over time. Factory-made cigarettes in cartons were themost popular purchase from non-UK/non-store sources, followed by roll-your-own cigarettes, with very fewfactory-made cigarettes sold in packs. Median prices for factory-made cigarettes in cartons and roll-your-owncigarettes from non-UK/non-store sources significantly increased during the study. For all product types,median prices from non-UK/non-store sources were often lower than the lowest prices in UK store-basedsources. Thus, factory-made cigarettes and roll-your-own cigarettes were significantly more affordable whenpurchased from non-UK/non-store sources than from UK stores [International Tobacco Control PolicyEvaluation Project affordability analysis (4062 current daily smokers, 8943 observations)].
In longitudinal International Tobacco Control Policy Evaluation Project analyses (854 participants, 1397observations), overall, 7.6% reported a high frequency of buying from sources likely to be illicit. Those reportinga high frequency of illicit purchases were significantly less likely to use mid-price or value factory-made cigarettes,and significantly more likely to use roll-your-own cigarettes than premium factory-made cigarettes, than thosewith a low frequency. There was no significant difference in trading down, switching to roll-your-own cigarettesor in quit attempts/success between high- and low-frequency illicit purchasers.
SCIENTIFIC SUMMARY
NIHR Journals Library www.journalslibrary.nihr.ac.uk
xxviii

Objective 4
Socioeconomic status differencesIn the International Tobacco Control Policy Evaluation Project individualised affordability analysis(4062 current daily smokers, 8943 observations), women, older smokers, more disadvantaged smokers(as measured by education and region) and more dependent smokers, found smoking less affordable.This was similar for factory-made cigarette and roll-your-own cigarette smokers, although roll-your-owncigarettes were uniformly cheap and there was less differentiation by socioeconomic factors anddependence compared with factory-made cigarette smokers.
In the International Tobacco Control Policy Evaluation Project data, overall, more disadvantaged smokerswere more likely to smoke cheap products. In the longitudinal analyses, younger smokers, single smokersand smokers with low levels of education were more likely to trade down to cheaper factory-made products.Switching to roll-your-own cigarettes was significantly more common among younger and low-incomesmokers. More dependent, more disadvantaged and younger smokers were more likely to roll cigaretteswith less tobacco. After controlling for price segment and product smoked, there was no clear relationshipbetween socioeconomic status and quit attempts or quitting. Thus, low socioeconomic status smokers andother vulnerable groups may have been avoiding quitting by taking advantage of the availability of cheaptobacco products.
Conclusions
Overall, the tobacco industry continues to be able to overshift taxes, thereby increasing its revenues,even when tax increases are high. Recently, in the cheapest price segments, the tobacco industry has beenovershifting to a greater extent and making more revenue on roll-your-own tobacco than cheap factory-made cigarettes. There is therefore scope to increase tobacco taxes further, particularly for roll-your-owncigarettes, to reduce price differentials and recoup the public health costs of smoking. We found noevidence of illicit increases, suggesting that the government’s anti-illicit strategies have been successful andneed maintaining. The tobacco industry smooths the impact of tax increases by cutting profits initially andthen increasing profits thereafter, but large, sudden tax increases reduce the tobacco industry’s ability tomanipulate prices. The tobacco industry has a variety of strategies to keep some products cheap. Some ofthese (e.g. price marking, small pack sizes) are now outlawed by recent legislation, but the tobaccoindustry can still introduce much cheaper variants for its brands (unlike in Uruguay, for example).
High above-inflation tax rises decreased affordability and increased quitting behaviours. However, thegrowing availability of cheap tobacco products encourages trading down to cheap factory-made productsand switching to roll-your-own cigarettes rather than quitting. Thus, despite more disadvantaged smokersstruggling with affordability, they were not more likely to quit than other smokers. The ability of thetobacco industry to bring cheap products to the market therefore undermined the public health gains.
Research recommendations
1. Impact of changing how tax changes are introduced (e.g. sudden intermittent or smaller continuous) onsmoking prevalence and illicit sales.
2. The effectiveness of minimum pack sizes, price-marking ban and a minimum excise tax in limitingcheap products.
3. Impact of tax on initiation.4. Impact of novel nicotine products on prices.
DOI: 10.3310/phr08060 PUBLIC HEALTH RESEARCH 2020 VOL. 8 NO. 6
© Queen’s Printer and Controller of HMSO 2020. This work was produced by Partos et al. under the terms of a commissioning contract issued by the Secretary of State for Healthand Social Care. This issue may be freely reproduced for the purposes of private research and study and extracts (or indeed, the full report) may be included in professionaljournals provided that suitable acknowledgement is made and the reproduction is not associated with any form of advertising. Applications for commercial reproduction shouldbe addressed to: NIHR Journals Library, National Institute for Health Research, Evaluation, Trials and Studies Coordinating Centre, Alpha House, University of Southampton SciencePark, Southampton SO16 7NS, UK.
xxix

Funding
This project was funded by the National Institute for Health Research (NIHR) Public Health Researchprogramme and will be published in full in Public Health Research; Vol. 8, No. 6. See the NIHR JournalsLibrary website for further project information.
SCIENTIFIC SUMMARY
NIHR Journals Library www.journalslibrary.nihr.ac.uk
xxx

Chapter 1 Introduction and aims
Background
Health and economic impacts of tobaccoSmoking remains the leading preventable cause of death, disease and health inequalities in the UK.1
Over 100,000 people in the UK are killed by smoking every year.2 Smokers lose an average of 10 years oflife expectancy, and exposure to other people’s smoke also causes death and disease among non-smokers.In England, the annual cost to the economy is estimated to exceed £11B a year, including cost to theNHS, employers and to the wider economy.3 In 2017, 14.9% of the adult population in England werecurrent smokers, but this figure masks large disparities in smoking across socioeconomic groups (e.g. 26%smoking prevalence among routine and manual vs. 10% among managerial and professional occupations).4
Any public health intervention that reduces tobacco use or prevents uptake will lead to significant benefitsby reducing premature mortality and morbidity and, consequently, lower NHS costs and increasedeconomic output.
The importance of tobacco tax and priceTobacco tax increases have been shown to be the most effective and cheapest way of reducing tobaccosmoking prevalence,5–13 consumption,14,15 initiation16,17 and inequalities in smoking.18–21 Tobacco tax has beenidentified by the World Health Organization as a critically important tobacco control intervention22 and the UKhas real tobacco prices that are among the highest in the world.23,24 The public health impact of tobaccotaxation can, however, be reduced by the availability of cheap tobacco. The tobacco industry (TI) is aware ofthe importance of price and its internal documents show that pricing and price promotions are among itsmost important marketing tools25–28 in order to reduce the effectiveness of tobacco tax increases.29,30 Hence,research needs to assess the extent to which the effectiveness of tobacco tax increases is influenced by TIpricing strategies and the effect this has on smokers’ behaviour and socioeconomic inequalities in smoking.
The UK tobacco industryThe main tobacco companies involved in the UK market are Imperial Tobacco (now Imperial Brands)and Japan Tobacco International (JTI).31 In 2008, JTI became a major player in the UK market throughpurchasing Gallaher. British American Tobacco (BAT) and Philip Morris, also known as Philip MorrisInternational (PMI), have smaller shares.31 PMI’s main contribution to the UK market is its iconic brandMarlboro (Philip Morris, New York, NY, USA). Scandinavian Tobacco Group (STG) (Copenhagen, Denmark)was previously involved in the UK through its distribution of Natural American Spirit [chiefly roll your own(RYO)], and currently via sales of cigars and cigarillos. The annual profits generated by the UK TI have beenestimated to be £1.5B in 2012 and 2013, with profit margins estimated at approximately 50%.31
Tobacco industry segmentation and pricing strategiesThe TI offers a variety of different tobacco products, including factory-made (FM) or manufacturedcigarettes, RYO tobacco, cigars, cigarillos and waterpipes. FM cigarettes and RYO tobacco are by far themost popular tobacco products, particularly in the UK. For each tobacco product, the industry offers anumber of different brands and it also segments the market into different price categories. Our previouswork reviewed the industry literature and sales data on FM segments and identified four price segments:premium, mid-price, economy and ultra-low-price (ULP) brands.32
When tax increases are announced in the Budget each year, tobacco companies can do one of threethings: (1) increase prices on top of tax increases, so that both the price and tax increase are passed onto consumers (known as overshifting), (2) absorb the tax increase so it is not passed on to consumers(undershifting) or (3) pass the tax increase on to consumers in full (fully shifting).33 The extent of
DOI: 10.3310/phr08060 PUBLIC HEALTH RESEARCH 2020 VOL. 8 NO. 6
© Queen’s Printer and Controller of HMSO 2020. This work was produced by Partos et al. under the terms of a commissioning contract issued by the Secretary of State for Healthand Social Care. This issue may be freely reproduced for the purposes of private research and study and extracts (or indeed, the full report) may be included in professionaljournals provided that suitable acknowledgement is made and the reproduction is not associated with any form of advertising. Applications for commercial reproduction shouldbe addressed to: NIHR Journals Library, National Institute for Health Research, Evaluation, Trials and Studies Coordinating Centre, Alpha House, University of Southampton SciencePark, Southampton SO16 7NS, UK.
1

‘tax pass-through’ to consumers will reflect economic conditions, competition in the market and the extentto which manufacturers are willing to adjust their profits in order to absorb some of the tax increases.
We previously revealed that, between 2000 and 2009 in the UK, the TI undershifted taxes and cut priceson cigarettes in the cheapest segments to keep them cheap, while overshifting taxes on more expensivecigarettes to maximise profits.32,34,35 Approximately, only half of the price increases were needed to meettobacco taxation increases, consistent with evidence from Ireland between 2000 and 2010.36 The rangebetween the cheapest and most expensive cigarettes (the ‘price gap’) therefore increased. Similar TI pricingstrategies have now been confirmed in other jurisdictions,37–39 where tobacco companies have also beenintroducing increasing numbers of lower priced products.37–39 Smokers are therefore incentivised todown-trade from expensive to cheap cigarettes, rather than quitting smoking.
UK smokers’ behavioural responses to price increasesWhen faced with a tobacco tax and price increase, smokers may do nothing, quit, reduce consumption orengage in price-minimising behaviours by switching to one of a number of cheaper sources of tobacco.This might include:
l cheaper legal products (e.g. cheaper manufactured/FM and/or RYO cigarettes12,40–44)l tax avoidance – travellers returning from other European Union (EU) countries (which typically have
lower tobacco duties) can legally purchase tobacco for personal use in line with guidelines forreasonable personal use,45 or smokers can purchase tobacco in duty-free shops46
l tax evasion – changing to illicit sources,47 including purchases of a genuine TI product that has enteredthe illicit market or of counterfeit or ‘illicit whites’
l purchasing larger quantities which afford economies by buying in bulk (e.g. by the carton, rather thanthe pack).40,41
The growing availability of legal cheap cigarettes in the UK is therefore a major public health concern, as itprovides options to smokers other than changing their smoking behaviour. If this differentially affectedsmokers in lower socioeconomic groups, it would drive smoking inequalities further.32,34,35 The use ofcheaper tobacco products has indeed increased, particularly by the poorest.10,12,42–44,48 The same concernsapply to tobacco tax evasion, also used more frequently by lower socioeconomic groups.49–52 By contrast,tax avoidance is more common among higher socioeconomic groups consistent with their greaterpropensity to travel.46 However, self-reported tax avoidance and evasion by UK smokers declined from2002 to 2011,53 in contrast to TI arguments that they would increase in response to higher tobacco taxes(see Illicit tobacco: tobacco industry complicity and UK government strategies).
It is, however, unclear whether the decline in use of expensive FM cigarettes is due to a decline in uptake,users quitting or trading down to cheaper products.12 Evidence indicates that the availability of cheaptobacco reduces motivation to quit and quit success.54–59 Our work, to date, had used repeat cross-sectional data to examine cheap cigarette use in the UK and could therefore not directly determine theimpact that tax and industry price changes had on smokers’ behaviour. Two US studies40,60 found mixedresults: one60 found smokers using cheaper FM cigarettes were less likely than those using premium brandsto quit or reduce smoking between 1988 and 1993, and the second, more recent, study40 found no directassociation between use of cheap FM brands or RYO tobacco in 2009 and quitting outcomes in 2010.Evidence from the International Tobacco Control Policy Evaluation Project (ITC), using data prior to 2008,across four countries (Canada, Australia, the USA and the UK), found a lower likelihood of successfulquitting among smokers of cheaper compared with more expensive FM cigarettes.56 However, incomparison with these other countries, the use of cheap tobacco has been found to be significantly higherin the UK.57
INTRODUCTION AND AIMS
NIHR Journals Library www.journalslibrary.nihr.ac.uk
2

Factors that might influence smokers’ inclinations to switch to cheaper products rather than quitting alsoremain largely unexplored. For instance, smokers who are brand-loyal,61,62 or loyal to a specific producttype (FM cigarettes or RYO tobacco, rather than smoking both63) might be less likely to switch to a cheaperproduct. To the best of our knowledge, existing research has provided only limited insights into thepurchasing patterns among UK smokers of tobacco on which UK tobacco duties have not been paid,46 andno studies have examined trends in tax evasion separately from tax avoidance, or how these purchasingpatterns might change in response to tobacco tax increases.
AffordabilityThe impact of price rises is also modified by changes in incomes and inflation rates, and, hence, it isimportant to measure affordability (i.e. smokers’ purchasing power for tobacco in relation to their realincomes). There are many different types of ‘aggregate’ tobacco affordability measures: the ‘Big Mac®
index’ representing the number of cigarettes purchased for the price of one McDonald’s Big Mac hamburger(McDonald’s Corporation, San Bernardino, CA, USA);64 the ‘minutes of labour’ needed to purchase a packof 20 Marlboro cigarettes or an equivalent local brand;65 the ‘relative income price’ (RIP), representingthe percentage of per capita gross domestic product (GDP) required to purchase 100 packs of cigarettes(Marlboro or local brand);66 and the cigarette price–daily income ratio, which divides the price of one packof cigarettes (Marlboro or local brand) by daily income.67 These measures have different strengths andweaknesses and their merits, particularly when compared across high-, middle- and low-income countries,have been discussed elsewhere.68
Studies using these methods indicate that cigarettes in the UK have became less affordable since the1990s, although the rate of decline in affordability appears to be slowing. Between 1991 and 2002 theannual decrease in tobacco affordability was around 5.5%,65 but only around 2–3% between 2003 and2009.69 Similarly, estimates using the RIP indicate an annual decrease in affordability of around 2.5–3%between 1990 and 2001,66 but only 1–2% between 2004 and 2010.70 No studies have examined tobaccoaffordability in the UK since 2010.
A major limitation of aggregate affordability measures is that they rely on average cigarette prices, usuallyderived from a small number of brands, and on average national income estimates. However, there arewide income inequalities observed within many countries, including the UK, and, as shown in Tobacco industrysegmentation and pricing strategies, a large range of prices between and within different tobacco products.In addition, aggregate measures do not capture the strategies that smokers use to minimise costs, such asbuying from cheaper sources or buying in bulk.
Illicit tobacco: tobacco industry complicity and UK government strategiesThere is overwhelming evidence of the TI’s historical involvement in the global illicit tobacco trade.47,71–73
In the UK in the 1990s, tobacco companies were accused of facilitating smuggling by deliberatelyoversupplying their brands to countries with no demand for them.74 Although the nature of the illicittobacco market has since changed substantially and the TI now claims that it has addressed the problem,evidence suggests that the TI has continued to be involved in illicit trade and failed to control their supplychain,73,75,76 despite signing legal agreements to address both these issues.47 In the UK, Her Majesty’sRevenue and Customs (HMRC) estimated that in 2011 the aggregate supply of certain brands of RYOtobacco to some countries exceeded legitimate demand by 240%.77 Similarly, massive TI overproduction ofcigarettes in the Ukraine has been shown to fuel the illicit market in Europe,78 a finding supported by ourpan-European survey, which showed that illicit tobacco use was greatest for those living in countries thatshared a land or sea border with the Ukraine, Russia, Moldova or Belarus.52 Furthermore, PMI’s own datasuggest that in 2010 around one-quarter of illicit cigarettes in Europe were genuine PMI brands.79
Despite this, the TI continues to use the threat of increases in illicit tobacco use to argue against keytobacco control policies, including tax increases.33,79–81 Although these arguments are intuitive and price isone driver of illicit tobacco use, it is not the main driver; supply-side issues (such as levels of corruption andTI complicity) are more important and are key to controlling illicit trade.82 Nevertheless, the industry has
DOI: 10.3310/phr08060 PUBLIC HEALTH RESEARCH 2020 VOL. 8 NO. 6
© Queen’s Printer and Controller of HMSO 2020. This work was produced by Partos et al. under the terms of a commissioning contract issued by the Secretary of State for Healthand Social Care. This issue may be freely reproduced for the purposes of private research and study and extracts (or indeed, the full report) may be included in professionaljournals provided that suitable acknowledgement is made and the reproduction is not associated with any form of advertising. Applications for commercial reproduction shouldbe addressed to: NIHR Journals Library, National Institute for Health Research, Evaluation, Trials and Studies Coordinating Centre, Alpha House, University of Southampton SciencePark, Southampton SO16 7NS, UK.
3

used these arguments extensively in the UK, despite evidence that much of the price increases is directlyattributable to industry price increases rather than tax increases, no observed association between tobaccoprices and illicit tobacco use across countries in Europe,52 and an observed overall decline in levels of illicittobacco in the UK despite continued tax increases.83
The UK government implemented a number of strategies to reduce illicit tobacco use during the studyperiod. In 2000, the UK launched its first illicit tobacco strategy, including £201M of additional funding,new customs staff, freight scanners, stronger penalties for tobacco smuggling and new ‘UK duty paid’markings on tobacco packs. Government co-operated with tobacco companies to reduce illicit tobacco andimplemented a publicity campaign to raise awareness of illicit tobacco use dangers.84 In 2006, 2011 and2015, the strategy was updated and refreshed. A regional programme in the north of England, launchedin 2009, also aimed to reduce demand for illicit tobacco.85
UK government tobacco taxationIn the UK, three types of tax are applied to tobacco: (1) specific tax (a fixed amount per 1000 cigarettes or1000 grams of RYO tobacco); (2) ad valorem tax (set as a percentage of the retail price and only applied toFM cigarettes); and (3) value-added tax (VAT) (another ad valorem tax applied to most goods and servicesand applied to both FM cigarettes and RYO tobacco). Compared with ad valorem taxes, specific taxestend to narrow the price range between expensive and cheaper brands, maximise the impact of tobaccotaxes24,86,87 and raise more revenue.88
Since our previous work, UK tobacco taxes have increased annually, their structure has changed somewhatand the rate of VAT has varied [Table 1, and for further details see the fact sheet published by Action onSmoking and Health (ASH) England89 and UK Budget documents90–98]. Two significant changes occurredin March 2011. For FM cigarettes, there was a shift away from ad valorem taxes,99,100 which were reducedfrom 24% to 16.5% of the retail price. Instead, specific taxes on FM cigarettes were increased from£119 to £155 per 1000 sticks. Ad valorem taxes generally increase the price range between cheap andexpensive products and this move was intended to narrow the price range between different FM brands.For RYO tobacco, there was a sudden increase of 10% above the Retail Price Index (RPI) in tax from£130 to £152 per kilogram. This was intended to narrow the price range between RYO and FM products.A third significant change occurred in March 2012, when the tax escalator (which was otherwise setbetween 0% and 2% above RPI throughout the study period) increased to 5% above RPI for 1 year.It should be noted that, although the RPI (a measure of private household spending from survey data) isstill employed in relation to tobacco taxation changes,101 it was de-designated as a national statistic inMarch 2013 and replaced with the Consumer Price Index (CPI), which meets international standards andis comparable with other European countries.90 The RPI, unlike the CPI, includes housing costs, is morevolatile than the CPI and rises more quickly.102 We used the CPI to adjust our FM and RYO prices forinflation (see Chapter 2).
European Union tax changesSince the 1970s, tobacco product regulations have been introduced in European countries.103 Two piecesof legislation were introduced in the last decade that are relevant to this study: EU Council Directives2008/118/EC and 2011/64/EU, which define categories for tobacco and tax structures, including minimumtobacco tax rates. Of relevance here are cigarettes (Article 3), cigars and cigarillos (Article 4) and RYOtobacco (Article 5). The regulations require countries to apply a specific excise tax and an ad valorem taxon cigarettes, as well as a minimum excise duty. Countries have more flexibility for other tobacco productcategories and can apply specific and/or ad valorem tax. Mandatory minimum tax rates are set out.104 TheEuropean Commission also changed the price benchmark from the most popular price category (MPPC) toa weighted average price (WAP) in each member state in January 2011.
INTRODUCTION AND AIMS
NIHR Journals Library www.journalslibrary.nihr.ac.uk
4

Rationale for current study
The increased use of cheap legal tobacco products coinciding with the widening price range betweenexpensive and cheap manufactured cigarettes in the UK, and the relatively high (although declining)use of illicit tobacco, raised concerns that tax increases in the UK were perhaps not as effective asassumed, particularly for smokers with low socioeconomic status (SES). An additional concern was thatthe government’s willingness to increase tobacco taxes was constrained by fear that tax and price riseswould fuel the illicit tobacco trade. There was a clear need, therefore, for greater understanding of theeffectiveness of tobacco tax increases, the extent to which their public health impact is undermined by TIpricing and whether or not the threat of the illicit trade is a genuine concern that needs to be consideredwhen setting tobacco duties. There were three inter-related issues that we identified as evidence gaps.
TABLE 1 Tobacco duty rates for FM cigarettes and RYO tobacco: UK 2001–15
Time point
Specific dutya
Ad valoremb
(%) (FM only) VATc (%)
Taxescalator(%)
Inflationd
£/1000 FMcigarettes
£/kg of RYOtobacco CPI RPI
March 2001 92.25 96.81 22.0 17.5 0
April 2002 94.24 98.66 22.0 17.5 0
April 2003 96.88 101.42 22.0 17.5 0
March 2004 99.80 104.47 22.0 17.5 0
April 2005 102.39 107.18 22.0 17.5 0
March 2006 105.10 110.02 22.0 17.5 0
March 2007 108.65 113.74 22.0 17.5 0 2.8 4.6
March 2008 112.07 117.32 22.0 17.5 0 2.5 3.8
November/Decembere 2008
112.07 122.01 24.0 15.0 0 4.5 4.2
April 2009 114.31 124.45 24.0 15.0 0 2.3 –1.2
January 2010 17.5
March 2010 119.03 129.59 24.0 17.5 1 3.4 4.4
January 2011 20.0
Marchf 2011 154.95 (25% > RPI) 151.90 (12% > RPI) 16.5f 20.0 2 4.0 5.3
March 2012 167.41 164.11 16.5 20.0 5 3.5 3.6
March 2013 176.22 172.74 16.5 20.0 2 2.8 3.3
March 2014 184.10 180.46 16.5 20.0 2 1.6 2.5
March 2015 189.49 185.74 16.5 20.0 2 0.0 0.9
a Specific duty is set in fixed cash terms as an amount per 1000 FM cigarettes or per kilogram of RYO tobacco.b Ad valorem duty is set as a percentage of the retail price and is applied only to FM cigarettes.c VAT is set as a percentage of the retail price and is applied to all consumer goods (so both FM and RYO).d The rates quoted are the 12-month inflation rates in the month prior to the Budget month.e In November 2008, tobacco duties (specific for RYO and ad valorem) were increased to ensure that the overall level of
taxation remained broadly unchanged following the temporary VAT reduction on 1 December 2008.f In March 2011 there was an overall 2% increase above inflation, but a major restructure of FM taxation meant that ad
valorem duty on cigarettes decreased to 16.5% and specific duty increased by 25% above inflation. Duty on RYOtobacco increased by 12% above inflation (i.e. an extra 10% on the 2% above inflation).
DOI: 10.3310/phr08060 PUBLIC HEALTH RESEARCH 2020 VOL. 8 NO. 6
© Queen’s Printer and Controller of HMSO 2020. This work was produced by Partos et al. under the terms of a commissioning contract issued by the Secretary of State for Healthand Social Care. This issue may be freely reproduced for the purposes of private research and study and extracts (or indeed, the full report) may be included in professionaljournals provided that suitable acknowledgement is made and the reproduction is not associated with any form of advertising. Applications for commercial reproduction shouldbe addressed to: NIHR Journals Library, National Institute for Health Research, Evaluation, Trials and Studies Coordinating Centre, Alpha House, University of Southampton SciencePark, Southampton SO16 7NS, UK.
5

Roll-your-own pricing strategiesTo the best of our knowledge, no studies had examined TI pricing of RYO tobacco in the UK, despite itsgrowing market share. Furthermore, the work on FM cigarette pricing dated only to 2009. Up-to-date dataon RYO tobacco and cigarette pricing were essential, because TI pricing strategies could evolve over time toreflect market, economic and policy developments, and should be considered when setting tobacco duties.
Tobacco industry pricing strategies and socioeconomic inequalitiesThere was limited evidence on the impact of TI pricing on levels of cheap tobacco use in the UK. Evidencewas also limited on differences in smoking outcomes (including quit attempts and success) among thoseusing expensive compared with cheap cigarettes and the extent to which this explains inequalities insmoking. Further research was therefore needed to examine how UK smokers respond to TI pricingstrategies, including the extent to which they engage in price-minimising behaviours, reduce consumptionor quit, and whether or not these responses vary by SES.
The prevalence of illicit tobacco useAlthough the argument that the TI most frequently uses to prevent tobacco tax increases is the claim thatthey will lead to an increase in the illicit tobacco trade,105 to the best of our knowledge no study haddirectly examined links between tax increases and trends in tax evasion or avoidance by smokers in theUK. Furthermore, as the TI uses the illicit trade to argue against tobacco tax increases and other tobaccocontrol measures using its own data,47,81,105 it is important that assessments of the level and nature of illicituse in the UK are conducted independently of the TI. The only recent, independent studies estimating illicituse in the UK covered only England, or regions therein, and did not provide a measure of uncertainty withthe estimate.49,50,52 Some also did not break the data down by FM and RYO.49 Further independent studieswere therefore essential.
Research objectives
The main intended public health impacts of tobacco taxation are, first, to reduce tobacco smoking and,second, to raise revenue to deal with the public health costs attributable to smoking. Central to this is theintent that taxation-based interventions are socially equitable, that is, they do not widen (and ideally helpto reduce) the sociodemographic disparities associated with smoking. This study aimed to evaluate theeffectiveness of tobacco tax increases in reducing tobacco use and minimising inequalities in tobacco usein the UK, and the extent to which this was influenced (undermined or enhanced) by TI pricing strategies.
Objectives
l Provide up-to-date knowledge of TI pricing and the extent to which this modifies the impact of tobaccotaxation on public health, by examining:
¢ how the TI segments manufactured cigarettes and RYO tobacco on price¢ the extent to which the TI undershifts, overshifts or fully shifts tobacco tax increases on to
consumers, whether or not this varies by product, price segment and over time, and whatproportion of price increases by segment is explained by TI price increases versus tax increases.
l To explore the impact of tobacco tax increases, as moderated by TI pricing strategies, on smokers’behaviour, by examining:
¢ the impact of the price range (the difference in price between the most and least expensive products)and price changes (annual tax increases modified via TI pricing) on quitting or switching betweenproducts or price segments
¢ the impact of the price range and price changes on tobacco consumption¢ whether these behaviours differ by smokers’ previous product or price choices.
INTRODUCTION AND AIMS
NIHR Journals Library www.journalslibrary.nihr.ac.uk
6

l To explore the impact of tobacco tax increases, as moderated by TI pricing strategies, on inequalities insmoking, by examining:
¢ the characteristics (socioeconomic, geographic, etc.) of smokers using each product/price segment¢ whether or not behavioural choices (quitting, switching between price segments and reducing
consumption) differ by smokers’ SES¢ the proportion of change in smoking inequalities over time attributable to cheap (legal) tobacco use.
l To explore whether or not cheap (legal) products are a means of market entry for the young,by examining:
¢ the age of smokers using each product or price segment¢ trends in youth usage of cheap products¢ whether or not young people initiate smoking via cheap products, later upgrading to more
expensive products.
l To increase understanding of trends in and the nature of tax avoidance and evasion, by examining:
¢ trends in the proportion of smokers engaging in tax avoidance and evasion and their socioeconomicand other characteristics (where they acquire their tobacco and trends therein)
¢ whether or not tax/price increases, particularly larger tax increases, are linked to tax avoidanceand/or evasion
¢ which products are most frequently acquired via tax avoidance and evasion, and fromwhich sources.
l To synthesise findings and develop recommendations to improve the effectiveness of tobacco taxationas a public health intervention.
Once the project was under way, we realised that it was not possible to address the fourth objective[to explore whether or not cheap (legal) products are a means of market entry for the young], asinsufficient numbers of young people were enrolled in the ITC. Instead, the ITC data were useful forsupplementary analyses on tobacco affordability and weight of RYO cigarettes, which enhanced ourunderstanding of the public health effectiveness of tobacco tax increases.
Patient and public involvement
We did not initially plan patient and public involvement, as the research focused on secondary dataanalysis. However, we did set up a Stakeholder Group for the project (see Acknowledgements), consistingof stakeholders, including Her Majesty’s Treasury, Public Health England and ASH, which met annuallyduring the project, and we also invited two lay members to join the group. The lay members were tworepresentatives from the then current UK Centre for Tobacco and Alcohol Studies (UKCTAS) Smokers’Panel: Matthew Alford and Dan Griffin. The UKCTAS Smokers’ Panel is a group of both active smokersand those trying to quit, or recent quitters, who provide lay input into the work of the UKCTAS. At thetime our project started, the Panel was recruited from the Bath area. The Stakeholder Group reviewed andcommented on preliminary findings and directed the focus of ongoing work so that it was relevant topolicy and smokers’ lives. Our two lay members provided critically important and useful input, whichhelped us to interpret our research findings. In particular, they helped us to assess affordability issues,alerted us to new tobacco packs being marketed and also stimulated us to address the weight of RYOtobacco used. We were enormously grateful for their input.
DOI: 10.3310/phr08060 PUBLIC HEALTH RESEARCH 2020 VOL. 8 NO. 6
© Queen’s Printer and Controller of HMSO 2020. This work was produced by Partos et al. under the terms of a commissioning contract issued by the Secretary of State for Healthand Social Care. This issue may be freely reproduced for the purposes of private research and study and extracts (or indeed, the full report) may be included in professionaljournals provided that suitable acknowledgement is made and the reproduction is not associated with any form of advertising. Applications for commercial reproduction shouldbe addressed to: NIHR Journals Library, National Institute for Health Research, Evaluation, Trials and Studies Coordinating Centre, Alpha House, University of Southampton SciencePark, Southampton SO16 7NS, UK.
7


Chapter 2 General methodology
Introduction
This chapter describes the three main data sources used for our programme of research: (1) tobaccosector commercial literature (hereafter ‘commercial literature’), (2) Nielsen tobacco sales data (hereafter‘Nielsen data’) and (3) the ITC data. Nielsen is a retail measurement service providing sales data on a rangeof consumer goods. The ITC conducts longitudinal cohort surveys in 29 countries (including the UK), aimedat systematic evaluation of key tobacco control policies, including assessing the impact of tobacco prices[see URL: www.itcproject.org (accessed 25 August 2019)].
Commercial literature
The commercial literature was used to give a comprehensive overview on the TI pricing strategy for tobaccoproducts and to describe how the industry segmented FM and RYO markets (also identifying brand namesin each identified segment).
SourcesThe commercial literature included TI documents, industry monitoring reports and trade magazines, fromthe years 2008 to 2014, with a few articles from early 2015 included when they were reviews of 2014.TI documents included annual reports from BAT, Imperial Tobacco, JTI and PMI, and presentations from BAT,Imperial Tobacco and PMI (JTI does not make presentations available). Industry monitoring reports were fromEuromonitor International Ltd (London, UK), Mintel (London, UK) and Keynote (Google Inc., Mountain View,CA, USA), and for 2014 only from Bank of America (Charlotte, NC, USA)/Merrill Lynch (New York, NY, USA)(Imperial Tobacco bought some American brands from Reynolds American at this time). Trade magazinesincluded Retail News (online as Talkingretail.com), The Grocer, Wholesale News and Tobacco JournalInternational (including the supplement Tobacco Profiles). Online and/or paper copies of trade magazineswere searched, depending on availability. Additional trade magazines (2014 editions of Forecourt Trader,Convenience Store and Asian Trader), available from a related literature review for a previous project, werealso searched. One article on Imperial Tobacco price segmentation from the Scottish Grocer, found via apost hoc Google (Google Inc., Mountain View, CA, USA) search for segment names, was also included.
AnalysesFrom articles mentioning tobacco products, we collated the following information in a database: segmentname, tobacco company, brand name, pack size, price, price type [recommended retail price (RRP) or pricemarked], date referred to, date of article, source of article, title of article, reporter, geography and relevantquotations. The number of articles/reports extracted was 517. Each article was searched for mentionsof brands and brand variants, alongside segment information and any text relevant to understandingsegmentation. An article could mention one or several brands and brand variants and/or could provideone or more quotations regarding segmentation. This resulted in 1892 entries in the final main database,of which 1700 concerned 347 brand and brand variants. The remainder of the entries were articles thatdiscussed price segmentation generally without referring to specific brands.
We also conducted a qualitative analysis to explore how the industry maintained profitability throughbrand segmentation, in the context of other price-limiting strategies, between 2008 and 2014. For this,557 quotations about brand segments and tobacco pricing were collected from the commercial literatureand analysed. The quotations were imported into NVivo 10 (QSR International, Warrington, UK) and codedat various nodes. There were two super-nodes: ‘market conditions that the TI was experiencing’ and ‘TIactions and responses to these market conditions’. Within each super-node, subnodes were developediteratively during data collection. Queries for each subnode by year were used to assess patterns over time.
DOI: 10.3310/phr08060 PUBLIC HEALTH RESEARCH 2020 VOL. 8 NO. 6
© Queen’s Printer and Controller of HMSO 2020. This work was produced by Partos et al. under the terms of a commissioning contract issued by the Secretary of State for Healthand Social Care. This issue may be freely reproduced for the purposes of private research and study and extracts (or indeed, the full report) may be included in professionaljournals provided that suitable acknowledgement is made and the reproduction is not associated with any form of advertising. Applications for commercial reproduction shouldbe addressed to: NIHR Journals Library, National Institute for Health Research, Evaluation, Trials and Studies Coordinating Centre, Alpha House, University of Southampton SciencePark, Southampton SO16 7NS, UK.
9

Limitations and strengthsStrengths of the commercial literature are that it can provide unique insights into industry attempts tomaintain and enhance profitability. This was also the only data source available which included cigars andcigarillos. However, this literature may also obscure the TI’s real intentions (e.g. to promote sales) and fears(e.g. of declining premium sales and profits), and it will tend to report industry rather than public healthviewpoints. The flip side of this is that as this literature is aimed at current and potential investors, ratherthan government and regulatory bodies that seek to regulate its promotional activities, it often containsilluminating examples of TI efforts to promote sales, sales figures and profitability.
Studies using the commercial literatureThe commercial literature was often used as a background to inform our investigations, but three specificstudies were also conducted.
1. Study 1 (see Chapter 3): what were the TI actions to maintain profitability?2. Study 2 (see Chapter 3): how does the TI segment products on price?3. Study 3 (see Chapter 6): was there any evidence of smokers down-trading to cheaper brands in the
commercial literature?
Nielsen data
These sales data were primarily used to finalise the allocation of FM and RYO brands to price segments[a process that was begun in the commercial literature study 2, building on our earlier Pricing Policies andControl of Tobacco in Europe (PPACTE) project32], and then to identify trends in the price, sales volumesand TI revenue of FM cigarettes and RYO tobacco by price segment. We were also interested in the extentto which the TI was overshifting or undershifting tax increases by segment.
SourceNielsen’s Scantrak data were based on electronic point-of-sale (EPOS) system data (i.e. information obtainedwhen tobacco products are scanned at the till in sales outlets).106 Data are collated by Nielsen on grocerysales, which include sales in supermarkets and convenience stores. Nielsen collates 100% of sales data fromfour supermarkets [Tesco (Welwyn Garden City, UK), Sainsbury’s (London, UK), Morrisons (Bradford, UK) andAsda (Leeds, UK)] and conducts stratified random sampling with replacement from other outlets [e.g. Co-op(Manchester, UK)].107 For remaining retail outlets, sales could only be modelled. As an example, in November2015, Nielsen collected EPOS data from 87% of the UK’s supermarkets, 15% of its convenience stores(including 83% supermarket-owned convenience stores, 59% petrol station shops, 6% convenience storechains and 4% independents) and 17% of Northern Ireland stores with grocery sales (Northern Irelandrepresents 2.8% of the UK population).107 The outlets that provide Nielsen data vary over time and changesto the cigarettes being sold by the outlets may also mean that databases need adjusting. Nielsen updatesits market coverage and thus its estimation of prices and volumes twice a year. In the UK, Nielsen collatesEPOS data on grocery sales from 15,000 shops across all food and drink trade channels, and the total grocerymarket measured was £145B in 2015.108 Other estimates of the total UK grocery market vary from £99.2B109
to £179.1B;110 thus, Nielsen’s estimate is consistent with these.
Nielsen data consists of a list of stock-keeping units (SKUs). A SKU is identified through an individualelectronic barcode. Each SKU comprises seven different descriptors:
1. product type (e.g. RYO tobacco vs. FM cigarettes)2. trading company (e.g. BAT)3. house (e.g. Pall Mall)4. brand (e.g. Pall Mall Blue king size)5. pack size (e.g. the number of FM sticks or grams of RYO per pack)6. sales unit contents – the number of packs sold together (e.g. in a carton)7. packaging type – whether or not price promoted (i.e. sold in a price-marked pack).
GENERAL METHODOLOGY
NIHR Journals Library www.journalslibrary.nihr.ac.uk
10

Stock-keeping units are thus the lowest level element within a hierarchical classification system. We comparedthis Nielsen hierarchical brand typology with other alternatives,111,112 producing one to be used for our study(Table 2). Nielsen provides monthly sales data and for this study we used data from November 2008 toFebruary 2016.
AnalysesNielsen provided six overlapping data sets of monthly data: 1 (November 2008–October 2011),2 (January 2009–December 2011), 3 (August 2011–July 2013), 4 (July 2012–December 2014), 5 (January2013–November 2015) and 6 (March 2013–February 2016). Nielsen updates its estimates (marketcoverage and thus sales volumes and prices) twice yearly. Hence, the most recent data sets are likely toreflect the market most accurately, so when data for a month were available from multiple data sets,we used the most recent (e.g. we took data for November 2008–December 2008 from data set 1, January2009–July 2011 from data set 2). We thus created a data set with the most recently provided monthlydata, spanning from November 2008 to February 2016.
Up to five types of sales information were provided by Nielsen for each SKU every month:
1. number of units (usually packs) sold2. price of each unit3. total value of SKUs sold4. total volume sold (sticks of FM or kilograms of RYO)5. percentage of sampled stores to which each SKU was distributed.
TABLE 2 Comparison of hierarchical brand classification typologies
LevelGeneric brandhierarchya
Nielsen(UK data) PMI Australiab Our study
1 Family brand(e.g. Buick)
Parent anchoringbrand (e.g.Marlboro)
Brand family(e.g. JPS)
Brand [e.g. (1) Marlboroand (2) Benson & Hedges]
2 Individual brand(e.g. Buick Regal)
Housec
(e.g. MarlboroBright Leaf)
Brand family(e.g. MarlboroFresh)
Brand/brandextension(e.g. JPS Duo)
Brand family [e.g.(1) Marlboro Bright Leafand (2) Benson & HedgesBlue]
3 Modifier (e.g.Buick Regal GS)
Brand(e.g. MarlboroBright LeafPlatinum)
Brand variant(e.g. MarlboroFresh Ice Blast orMarlboro FreshKretek Mint)
Products (e.g.JPS Duo Gold)
Brand variant [e.g.(1) Marlboro Bright LeafPlatinum and (2) Benson& Hedges Sky BlueSuperkings]
4 Productdescription (e.g.mid-size luxurysport sedanautomobile)
SKU(e.g. MarlboroBright LeafPlatinum 10scarton, notprice marked)
SKU (e.g. JPSDuo Gold 20s)
SKU [e.g. (1) MarlboroBright Leaf Platinum 10scarton not price markedand (2) Benson & HedgesSky Blue Superkings19-stick price-markedsingle pack]
JPS, John Player Special.a Some analysts also discuss ‘brand extensions’ defined as when a brand is extended to a new type of product. In terms
of tobacco, an example of this would be when a FM brand is extended to RYO (e.g. Marlboro’s RYO extension: MarlboroGold Fine Cut Hand Rolling Tobacco).
b Obtained from an anonymous reviewer of our published paper on this work.c Unlike other classifications, for FM, Nielsen develops a new house only when there is a brand variant at a different price
point. Thus, although PMI differentiates Marlboro into three brand families (Red, Gold and Fresh), Nielsen in the UK doesnot differentiate between these three as they were introduced at the same price point. Only Marlboro Touch and BrightLeaf, for which SKUs have lower prices, were listed as being in different houses by Nielsen. RYO was not alwaysdifferentiated in this way by Nielsen.
DOI: 10.3310/phr08060 PUBLIC HEALTH RESEARCH 2020 VOL. 8 NO. 6
© Queen’s Printer and Controller of HMSO 2020. This work was produced by Partos et al. under the terms of a commissioning contract issued by the Secretary of State for Healthand Social Care. This issue may be freely reproduced for the purposes of private research and study and extracts (or indeed, the full report) may be included in professionaljournals provided that suitable acknowledgement is made and the reproduction is not associated with any form of advertising. Applications for commercial reproduction shouldbe addressed to: NIHR Journals Library, National Institute for Health Research, Evaluation, Trials and Studies Coordinating Centre, Alpha House, University of Southampton SciencePark, Southampton SO16 7NS, UK.
11

Sometimes tobacco companies change the names of brands. We used this sales information, together withthe commercial literature and Google searches, to check whether an apparent new brand, family or variantin a data set previously existed under a different name. Thus, SKU behaviour over the entire analysis periodwas identifiable.
It should be noted that not all five types of sales information were provided for all the data sets. Volumeswere not provided for data sets 1 and 2 (used for our estimates between November 2008 and July 2011),so we imputed volume based on number of units sold. When provided, the volume variable showedevidence of modelling by Nielsen, so there may be some discrepancy between earlier and later data setshere. Distribution data were provided only for data sets 5 and 6 (used for our estimates between January2013 and February 2016).
Data validity and exclusionsNielsen state that data are valid only when a SKU is distributed to ≥ 10% of retailers in its sample. However,given that distribution data were not available for the earlier data sets, this could not be used as our exclusioncriterion. Thus, we instead attempted to model 10% distribution using market share (dividing volume of sticksor 0.5-g RYO stick equivalents sold for each SKU by total volume) for conducting our FM segmentation (seeChapter 3). We did this using a selection of months for which we had distribution information available,namely January 2013, February 2013, March 2013, January 2016 and February 2016 (January 2013 andFebruary 2016 were the first and last months, respectively, for which we had distribution information). For ourmodelling we explored market shares for FM SKUs between 0.02% and 0.06%, and compared these toNielsen’s ≥ 10% distribution criteria (Table 3). We wanted to identify the market share value that minimisedthe number of SKUs misclassified (see Table 3, ‘F’ rows) and provided a number of valid SKUs as close aspossible to that using Nielsen’s ≥ 10% distribution criterion (see Table 3, comparison of ‘A’ and ‘E’ rows). Theresulting optimal outcome was a market share of > 0.05%, which we therefore applied uniformly over ourentire data set as the criterion for identifying valid SKUs for brand segmentation each month (we ended ourmodelling with 0.06 because the number of misclassified SKUs was rising). Given that the 10% distributioncriterion was also suggested by Nielsen for RYO products, we used the same criterion of > 0.05% marketshare for conducting our RYO segmentation.
For the segmentation development, the FM and RYO data sets were kept separate, but for the price analyses,these data sets were merged so that we could compare market share changes of RYO tobacco and FMcigarettes. On merging these data sets, the exclusion criterion of 0.05% market share was no longerapplicable because the total number of SKUs was larger. We found that changing the criterion to 0.008%market share allowed all SKUs that were valid in the separate FM and RYO data sets to be also valid in thecombined data set. However, other SKUs now reached sufficient market share to be included that had notdone so for the segmentation process. To prevent random fluctuations from being influential, new SKUswere included only if they reached sufficient market share for 3 months. To avoid incorrectly excluding SKUsthat were present for < 3 months because they were arriving on or leaving the market at the beginning orend of the data series, respectively (rather than due to random fluctuations), the price analyses using themerged data sets were restricted to January 2009–December 2015. The allocation of these extra SKUs tosegments is described in Chapter 3.
To identify consistent pricing patterns, some atypically priced and/or rare SKUs were excluded. Retailer andwholesaler brands and cartons (sometimes known as ‘multipacks’) were excluded from all analyses becausethey rarely reached valid distribution during the time period that distribution data were available. We alsoexcluded make your own (when smokers purchase empty cigarette tubes and a small machine that fillsthese tubes with tobacco) and combi-packs (packs of RYO tobacco sold together with rolling papers and/orfilters) from all analyses, as they were consistently priced higher than other SKUs in their brand family.From the segmentation analyses only, we excluded price-marked packs and FM packs containing < 17 or> 20 sticks, due to their rarity (e.g. 14 stick packs) or consistently different pricing than other SKUs in theirsegment (e.g. 10 sticks packs were priced higher), and RYO packs of uncommon sizes (we included only10-g, 12.5-g, 25-g and 50-g packs). From the pricing analyses only, we excluded Berkeley and Swan brands
GENERAL METHODOLOGY
NIHR Journals Library www.journalslibrary.nihr.ac.uk
12

TABLE 3 Nielsen data: comparison of number of valid FM cigarette SKUs using Nielsen’s suggested distributioncriteria (distributed to ≥ 10% of stores) vs. our estimations using varying minimum market shares based on volumeof sticks sold (> 0.02% to > 0.06%)
Market shares for FM SKUs
Time point
January2013
February2013
March2013
January2016
February2016
Total number of SKUs available 221 221 218 387 387
A. Valid SKUs based on distribution (B + D)(Nielsen criterion: distributed to ≥ 10% of stores)
87 88 88 102 98
1. Market share > 0.02%
B. Only distribution valid 0 0 0 0 0
C. Only market share valid 28 29 29 39 43
D. Distribution and market share valid 87 88 88 102 98
E. Any market share valid (C + D) 115 117 117 141 141
F. Total misclassified (B + C) 28 29 29 39 43
2. Market share > 0.03%
B. Only distribution valid 1 1 2 3 0
C. Only market share valid 14 15 18 26 29
D. Distribution and market share valid 86 87 86 99 98
E. Any market share valid (C + D) 100 102 104 125 127
F. Total misclassified (B + C) 15 16 20 29 29
3. Market share > 0.04%
B. Only distribution valid 3 4 3 4 0
C. Only market share valid 12 12 12 18 24
D. Distribution and market share valid 84 84 85 98 98
E. Any market share valid (C + D) 96 96 97 116 122
F. Total misclassified (B + C) 15 16 15 22 24
4. Market share > 0.05%
B. Only distribution valid 6 6 7 7 4
C. Only market share valid 7 6 7 13 15
D. Distribution and market share valid 81 82 81 95 94
E. Any market share valid (C + D) 88 88 88 108 109
F. Total misclassified (B + C) 13 12 14 20 19
5. Market share > 0.06%
B. Only distribution valid 9 13 12 10 8
C. Only market share valid 6 6 6 10 14
D. Distribution and market share valid 78 75 76 92 90
E. Any market share valid (C + D) 84 81 82 102 104
F. Total misclassified 15 19 18 20 22
NotesData from this table were used to determine the approximate equivalent volume market share that was comparable toNielsen’s validity criterion of distribution to ≥ 10% of stores. We wanted to maximise the similarity between the numbervalid via distribution vs. market share (rows B and E) and to minimise the total misclassified (row F). This led us to select> 0.05% market share as the best estimate of Nielsen’s distribution to ≥ 10% of stores validity criterion, to be appliedconsistently to all data sets.
DOI: 10.3310/phr08060 PUBLIC HEALTH RESEARCH 2020 VOL. 8 NO. 6
© Queen’s Printer and Controller of HMSO 2020. This work was produced by Partos et al. under the terms of a commissioning contract issued by the Secretary of State for Healthand Social Care. This issue may be freely reproduced for the purposes of private research and study and extracts (or indeed, the full report) may be included in professionaljournals provided that suitable acknowledgement is made and the reproduction is not associated with any form of advertising. Applications for commercial reproduction shouldbe addressed to: NIHR Journals Library, National Institute for Health Research, Evaluation, Trials and Studies Coordinating Centre, Alpha House, University of Southampton SciencePark, Southampton SO16 7NS, UK.
13

due to idiosyncratic pricing. Unless otherwise noted (e.g. for revenue analyses; see Chapter 4) and unlike thesegmentation analyses, price-marked packs, 10-stick FM packs and RYO packs of all sizes were included inthe pricing analyses.
Prices per stick and roll-your-own ‘stick equivalents’After literature review and analysis of consumption patterns in the ITC data (see Chapter 7), we definedone RYO cigarette (‘stick equivalent’) as containing 0.5 g of tobacco. Price per stick (one FM cigarette or0.5-g RYO stick equivalent) was calculated by dividing the price per unit (pack) by the number of sticks orstick equivalents per pack. It is worth reiterating here that, in the UK, specific duty on FM cigarettes iscalculated per 1000 cigarettes, whereas on RYO tobacco it is calculated per 1000 g of tobacco, and theserates are comparable (e.g. in 2015, specific duty was £189.49 for 1000 FM sticks and £185.74 for 1000 gof RYO tobacco, see Table 1). Implicit in this, is the notion that one FM cigarette is comparable to 1 g ofRYO tobacco; however, our data indicate that 1 g of RYO tobacco is more comparable to two FMcigarettes, which means that specific duty on RYO tobacco is effectively half that on FM cigarettes.
Limitations and strengthsNielsen tobacco data are increasingly being used for academic, as well as commercial, research.14,113–116 Theyhave also been validated for policy evaluation.117 Only legal grocery store sales are included, but such sales(including supermarkets and convenience stores) represent up to 80% of the total market [see Chapter 6,ITC data study 3: smokers’ tobacco purchasing behaviours by product and store type (licit purchases)] and,as we shall see, illicit and non-grocery store sales are declining (see Chapter 8).81,118 In this project, we didnot differentiate Nielsen sales data in terms of the percentage of tobacco sales that came from supermarketscompared with convenience stores; thus, although Nielsen samples overall grocery sales from around 87% ofUK supermarkets and 15% of its convenience stores, we do not have the data to determine what percentageof the tobacco sales came from those supermarkets compared with convenience stores. However, in morerecent work (covering the period from May 2015 to April 2018), we have found that about 80% of tobaccosales were from convenience stores (data not shown). This was higher than in this study using the ITC data(41% of legal tobacco sales were from convenience stores; see Chapter 6). Thus, assuming that conveniencestores have higher tobacco prices, it might be the case that our Nielsen analyses would provide slightly higherestimates of tobacco prices than our ITC data; however, given that we can triangulate the findings from thesetwo sources, we are confident that we will obtain an accurate estimate of tobacco prices in this project.
Only RYO tobacco prices are included, not papers or filters (which currently cost between £0.002 and£0.006 and between £0.002 and £0.008 each, respectively),119,120 which would add between £0.004 and£0.014 per cigarette.
Wider changes in the competitive landscape may also have contributed to price changes, but this seemsunlikely: the e-cigarette market in 2015 was only a twentieth of the size of the tobacco market in theUK121 and four transnational tobacco companies collectively accounted for > 90% of the market, with onlyrelatively small changes in their respective market shares.122
Studies using the Nielsen data set
l Study 1 (see Chapter 3): allocation of SKUs to segments.l Study 2 (see Chapter 4): TI pricing strategies.l Study 3 (see Chapter 4): what proportion of price increases by segment are explained by TI price
increases versus tax increases?l Study 4 (see Chapter 6): what are sales volumes overall and by tobacco type over time?l Study 5 (see Chapter 6): what are sales volumes by differently priced segments over time?
GENERAL METHODOLOGY
NIHR Journals Library www.journalslibrary.nihr.ac.uk
14

ITC data
The ITC was used to explore the impact of tobacco taxation and TI pricing strategies on smokers’ behaviour.This included the extent to which smokers were switching between different products (FM and RYO) orFM brand families (e.g. trading up or trading down), purchasing from different sources (e.g. licit/illicit), orchanging their consumption patterns (e.g. reducing cigarettes smoked or quitting smoking). We were alsoable to explore differences by smoking dependence and sociodemographics.
Data source and sampling characteristicsThis research predominantly used the UK data from the ITC. This includes Canada, the USA, the UK andAustralia. It is a longitudinal cohort study of adult smokers (aged ≥ 18 years) who are initially recruitedas smokers (at least 100 cigarettes smoked in their lifetime and smoking at least monthly at the time ofthe survey). They are subsequently retained in the study for as long as possible, even if they quit smoking.At each survey, a new ‘replenishment’ sample of smokers are also recruited to compensate for those lostto follow-up (ranging for the UK between 22% and 34%), maintaining sample sizes at around 1500for each country at each survey. This research mostly used the first 10 surveys or ‘waves’ of the UK ITC,conducted approximately annually between 2002 and 2014 (Table 4) (for some analyses, a subset ofthese surveys was used). More recent data were excluded because the methodology, sampling andquestionnaires changed.
The ITC surveys were administered via computer-aided telephone interviewing or online (the online versionwas piloted at survey 7 in 2008 and then introduced gradually from survey 8 in 2010 onwards). Stratifiedrandom sampling was used to obtain samples broadly representative of national distributions of age, sexand geographical region for each of the four countries at the time of each survey. At each survey, cross-sectional sampling weights were also calculated to be representative of these characteristics, as well aslongitudinal weights that were adjusted for attrition. Detailed methodological information about the ITChas been published elsewhere.123,124
TABLE 4 UK survey dates and sample sizes for the ITC data
Survey Start date End date
Sample (n)
Recontact Replenishment Total
1 21 October 2002 9 December 2002 2401 2401
2 17 May 2003 5 August 2003 1865 255 2120
3 12 June 2004 21 December 2004 1494 586 2080
4 11 October 2005 30 January 2006 1540 503 2043
5 19 October 2006 17 February 2007 1406 613 2019
6 27 September 2007 13 February 2008 1484 523 2007
7 30 October 2008 29 March 2009 1453 370 1823
8 13 July 2010 13 January 2011 1325 1325
9 7 February 2013 9 September 2013 870 533 1403
10 28 August 2014 14 December 2014 1018 452 1470
NotesSurveys = ITC ‘waves’.No replenishment sample was collected for the UK at survey 8 owing to lack of funds.
DOI: 10.3310/phr08060 PUBLIC HEALTH RESEARCH 2020 VOL. 8 NO. 6
© Queen’s Printer and Controller of HMSO 2020. This work was produced by Partos et al. under the terms of a commissioning contract issued by the Secretary of State for Healthand Social Care. This issue may be freely reproduced for the purposes of private research and study and extracts (or indeed, the full report) may be included in professionaljournals provided that suitable acknowledgement is made and the reproduction is not associated with any form of advertising. Applications for commercial reproduction shouldbe addressed to: NIHR Journals Library, National Institute for Health Research, Evaluation, Trials and Studies Coordinating Centre, Alpha House, University of Southampton SciencePark, Southampton SO16 7NS, UK.
15

MeasuresNot all studies used all measures and details will be provided in subsequent chapters when appropriate.
Sample design control variablesA variable was included to differentiate between the recontact sample (those who had been recruitedin a previous ITC survey) and the replenishment sample (those who were completing their first ITC survey).A variable to indicate the survey mode (telephone or online) was also included.
DemographicsDemographic data were stratified to contain logical subgroups that were also large enough for analysis.
SexSex was dichotomised as male or female.
AgeAll participants were asked their age, in years, at the time of their recruitment survey. Their age at eachsubsequent survey was estimated by adding the number of days that had elapsed between their recruitmentsurvey and the survey in question (based on survey dates) to their age at recruitment. Implicit in thismethodology was the assumption that all participants were surveyed on their birthdays. This was notconsidered to be problematic as it was consistently applied to all participants and the margins of errorwere < 1 year. As age was usually stratified for analysis, the impact of this assumption on our findingswas considered to be negligible. Unless otherwise noted, age was stratified into three groups: 18–39 years,40–54 years and ≥ 55 years.
Geographical region of residenceUK analyses: London, Northern (Yorkshire and The Humber, North East and North West), Midlands and Eastern(East Midlands, West Midlands and Eastern), Southern (South East and South West) and outside England(Wales, Scotland and Northern Ireland). Four-country analyses: Australia, Canada, the UK and the USA.
EthnicityEthnicity was dichotomised as white or not white.
Relationship statusRelationship status was dichotomised as single (separated, divorced, widowed or single) or partnered(married or de facto).
EducationParticipants’ highest level of education was coded as low (secondary school/vocational level 3 or less),moderate (some college or university, but no degree) or high (completed university or post graduate degree).
IncomeThe ITC asks about income and household composition. Gross annual household income is assessed inranges (£0–6499, £6500–15,000, £15,001–30,000, £30,001–40,000, £40,001–50,000, £50,001–65,000,£65,001–95,000 and ≥ £95,001). For the affordability calculation (ITC study 2), the mid-point of eachrange was used and £95,001 for the highest value. Participants also reported their household composition,which was used to derive ‘equivalised’ annual income (adjusted for household composition) using themodified Organisation for Economic Co-operation and Development (mOECD) scale.125 Equivalisationweights were modified slightly because children’s ages in the ITC questionnaire were stratified somewhatdifferently to the mOECD strata. Income was converted to 2014 values for all ITC studies, using CPI datafrom the Office for National Statistics.126 For some analyses, income was stratified to low, moderate, highor not disclosed. Further details on income equivalisation are available in Report Supplementary Material 1.
GENERAL METHODOLOGY
NIHR Journals Library www.journalslibrary.nihr.ac.uk
16

Nicotine dependence measures
Time to first cigarette after wakingThis was stratified to within 5 minutes (most dependent), 6–30 minutes, 31–60 minutes and after60 minutes (least dependent).
Cigarettes per dayThis ranged between 1 and 100 [mean around 16 cigarettes per day (CPD) and standard deviation (SD)around 8.5 CPD] for the daily smokers in our UK sample.
Heaviness of Smoking IndexThis was a combination of time to first cigarette (TTFC) and CPD.127 This was slightly modified to minimiseexclusions due to missing data. For participants who had valid data on both CPD and TTFC (constituting95.7% of observations), the Heaviness of Smoking Index (HSI) was computed as normal and then stratifiedto low (0–2), moderate (3–4) and high (5–6). Participants with valid data on CPD only (3.8%) wereclassified as low (0–20), moderate (21–30) and high (≥ 31), and participants with valid data on TTFC only(0.5%) were classified as low (≥ 31 minutes), moderate (6–30 minutes) and high (within 5 minutes).
Tobacco use and purchase measures
Usual tobacco product type (product loyalty)This was measured by asking ‘Do you now smoke . . . (packet/FM cigarettes only, RYO cigarettes only, orboth)?’. For the measure of product loyalty, those who responded ‘both’ were classified as non-product-loyal ‘mixed’ users; and those who responded as ‘FM cigarettes only’ or ‘RYO tobacco only’ were classifiedas product-loyal ‘non-mixed’ users.
Last tobacco purchase typeThis was coded as factory-made (cigarettes sold in) packs (FM-P); factory-made (cigarettes sold in) cartons(FM-C) or RYO (Figure 1). For participants who reported having a usual brand of tobacco, they were askedif this was the same as their last purchase. Those purchasing other products may be less brand-loyal andpotentially more influenced by price promotions or discounts.
Brand loyaltyParticipants were asked ‘Do you have a regular brand and variety of cigarettes (yes/no)?’.
Purchase source (differentiating full duties paid, tax avoidance and tax evasion)In the ITC, we use a number of different measures to assess tax evasion and avoidance in relation totobacco purchases, depending on what aspect of this we are interested in. When we are interested inthe price smokers pay for their tobacco products, we need to determine tax evasion/avoidance using thesource of the last tobacco product they purchased, as ITC ascertains only prices paid for the last productpurchased. The ITC also asks about the frequency of tobacco purchases likely to be illicit, and when we arenot interested in assessing the price of products from different sources, we are able to use this more directmeasure as an indicator of likely illicit use instead.
Purchase sources (UK store based vs. non-UK/non-store)We devised a novel way of assessing potentially illicit tobacco purchases, via categorising the purchasesources of participants’ most recent tobacco purchase into two categories. Purchases from conveniencestores, supermarkets and tobacconists were classified as ‘UK store-based sources’ (deemed likely to belicit tobacco with full UK duties paid), and purchases from overseas or duty free (deemed likely to be taxavoidance), friends/relatives or informal sellers (deemed likely to be tax evasion, although see furtherdiscussion in Chapter 8) and the internet were classified as ‘non-UK/non-store’ sources. Remaining sourcesthat we were unable to code into one of these two categories (e.g. ‘do not know’ or ‘from work’), wereclassified as ‘other’ (see Figure 1).
DOI: 10.3310/phr08060 PUBLIC HEALTH RESEARCH 2020 VOL. 8 NO. 6
© Queen’s Printer and Controller of HMSO 2020. This work was produced by Partos et al. under the terms of a commissioning contract issued by the Secretary of State for Healthand Social Care. This issue may be freely reproduced for the purposes of private research and study and extracts (or indeed, the full report) may be included in professionaljournals provided that suitable acknowledgement is made and the reproduction is not associated with any form of advertising. Applications for commercial reproduction shouldbe addressed to: NIHR Journals Library, National Institute for Health Research, Evaluation, Trials and Studies Coordinating Centre, Alpha House, University of Southampton SciencePark, Southampton SO16 7NS, UK.
17

Do yousmoke?
Usual tobacco product
FM Both (mixed) RYO
No YesLast purchase = usual brand
YesDo you
have a regularbrand and variety of
cigarettes?
Where did you LAST buycigarettes/RYO tobacco
for yourself?
Where did you LAST buycigarettes/RYO tobacco
for yourself?
Wasit your current
brand?No
Source of last purchase
UK store-based
‘Convenience stores’• Petrol stations• News stands• News agents• Kiosks
‘Outside the UK’
‘Duty free’
Non-UK/non-store Other• Don’t know• Missing responses• Could not classify (e.g. ‘from work’)
‘Supermarkets’
‘UK store-based other’• Discount stores• Off-licenses• Bars/pubs• Entertainment venues• Vending machines• Tobacconists• Discount tobacco outlets
‘Informal sellers’
‘From a friend/relative’
‘Non-UK/non-storeother’
Not at a store, shop orother mainstream
establishment, sellingcigarettes independentlyand/or illegally, perhaps
at local markets,delivery service,
door to door or justin the street
• Military commissary• Free phone number• Internet• Refusals to answer*
FM RYO
This lastpurchase: was itFM cigarettes orRYO tobacco?
Did you buy[your last purchase] by
the carton, the pack or assingle cigarettes?
Singlecigarettes/baggies(excluded: 0.6%
of responses) Product last purchased
Pack(FM-P)
Carton(FM-C)
RYO
Price calculations
RYO
FIGURE 1 International Tobacco Control Policy Evaluation Project survey questions and response categorisation fortobacco product purchases.
GENERAL METHODOLOGY
NIHR Journals Library www.journalslibrary.nihr.ac.uk
18

Frequency of purchasing from cheap (probably illicit) sourcesIn a series of questions, participants were asked directly whether or not, in the past 6 months, they hadpurchased cigarettes from (1) the internet, (2) phone order, (3) mail order or (4) people selling independently(e.g. door to door, in the street or at local markets) and, if yes, how often (only once, a few times, many timesor all of the time). In addition, in surveys 9 and 10 only, participants were also asked if and how often in thelast 6 months they had purchased tobacco that had been (5) smuggled, lacked proper health warnings or didnot have all government taxes paid (no, once or twice a year, every few months, a couple of times a monthor at least once a week). Anyone who responded ‘no/never’, ‘only once/once or twice a year’ or ‘a few times/every few months’ to all of the above sources was classified as having a low frequency of cheap purchases,whereas anyone who responded ‘many times/a couple of times a month’ or ‘all of the time/at least once aweek’ to any of the above five sources was classified as having a high frequency of cheap purchases.
Weight of tobacco in roll-your-own cigarettesWe used participants’ last reported tobacco purchase (because the relevant data were available only for lastrather than usual purchase) to derive the average weight of tobacco per RYO cigarette for each participant.We felt that this was justified as 95.4% of our sample of RYO users indicated that their last purchase wasthe same as their usual purchase. Using the reported weight of the pouch of RYO tobacco they had lastpurchased, the reported days it usually took them to smoke this amount and how many cigarettes, onaverage, they smoked per day (CPD), we then calculated their average weight per RYO cigarette, in grams,by dividing the total pouch weight by the days taken to smoke it and by their CPD. The average grams oftobacco per RYO cigarette over the survey period for which these data were available (from survey 5 in2005 to survey 10 in 2014) ranged between 0.45 g and 0.55 g (data not shown). We therefore chose themid-point (0.50 g) for use throughout this project as the RYO ‘stick equivalent’ to one FM cigarette.
Tobacco priceThe price per stick (for both FM and RYO) was also calculated using last purchase data. The price of FMcigarettes was available for all ITC surveys, the price of RYO was available only from survey 5 (2006)onwards. A series of questions was asked, depending on the tobacco product type (e.g. how many cartonspurchased, packs per carton, cigarettes per pack, or RYO weight and number of packs). Participants couldgive the price they paid for a single carton, pack or pouch, or the total they paid. Prices were convertedinto 2014 values using CPI126 data (see Equation 1).
Real Price2014 = PriceYearX × CPI2014 ÷ CPIYearX. (1)
The CPI values we used in Equation 1 for each ITC survey year were 95.4 (2002), 96.7 (2003), 98 (2004),100.0 (2005), 102.3 (2006), 104.7 (2007), 108.5 (2008), 114.5 (2010), 126.1 (2013), and 128 (2014)(see also Report Supplementary Material 1 for more information relating to the calculation of real prices).We then calculated the median reported price for each product type last purchased within each sourceand, for UK store-based sources only, the ‘price range’ for each product type was also calculated. Someexclusions were agreed on a priori to remove improbable responses from the data and this was done priorto converting to 2014 values, these were any prices per FM stick or 1.0 g of RYO tobacco obtained fromany source > £0.50 (before survey 6) or > £0.80 (survey 6 onwards); prices per FM stick or 1.0 g of RYOobtained from UK store-based sources only < £0.07 (before survey 6) or < £0.10 (survey 6 onwards); andany FM packs containing > 50 cigarettes obtained from UK store-based sources only. We also truncatedthe price range from UK store-based sources to lie between the 2.5th and 97.5th percentiles, in orderto have a more representative range by capturing 95% of all prices (thus excluding the extreme,low-frequency cases).
Annual tobacco spendAnnual tobacco spend for all participants was calculated by multiplying the price per stick (0.5-g RYO stickequivalent) by CPD and by 365. As before, we felt it reasonable to extrapolate annual expenditure fromparticipants’ most recent purchase, as the large majority of our sample (92.2% of FM users and 95.4% ofRYO users) indicated that their most recent purchase was their usual brand.
DOI: 10.3310/phr08060 PUBLIC HEALTH RESEARCH 2020 VOL. 8 NO. 6
© Queen’s Printer and Controller of HMSO 2020. This work was produced by Partos et al. under the terms of a commissioning contract issued by the Secretary of State for Healthand Social Care. This issue may be freely reproduced for the purposes of private research and study and extracts (or indeed, the full report) may be included in professionaljournals provided that suitable acknowledgement is made and the reproduction is not associated with any form of advertising. Applications for commercial reproduction shouldbe addressed to: NIHR Journals Library, National Institute for Health Research, Evaluation, Trials and Studies Coordinating Centre, Alpha House, University of Southampton SciencePark, Southampton SO16 7NS, UK.
19

Time (tobacco tax year)The ITC survey collection periods occurred at differing times of year and spanned varying numbers of monthsfor each survey (see Table 4), whereas UK tobacco tax changes were usually enacted during the annualBudget update, typically in March (sometimes April) of each year (see Table 1). For certain analyses, wetherefore assigned participants to the appropriate ‘tobacco tax year’, corresponding to the timing of theirsurvey responses relative to when the tobacco tax changes were implemented. No ITC survey data werecollected in the 2009 or 2011 tobacco tax years.
Tobacco taxation increase ratesFor some analyses involving surveys 7–10 of the ITC data (see Table 4), we were interested in the impact ofdifferent tobacco taxation increase rates. Using a similar strategy as for tobacco tax year [see Time (tobaccotax year)], tobacco taxation increase rates based on tax changes outlined in annual Budget statements(see Chapter 1 and Table 1) were allocated to these ITC surveys as follows: 0% (equivalent to inflation)for all data from survey 7 (October 2008–March 2009); 1% above inflation for all data from survey 8 (July2010–January 2011); 2% above inflation for the majority of data from survey 9 (February 2013–September2013) and all data from survey 10 (August 20 –December 2014); and 5% above inflation for the remainderof the data from survey 9 (February 2013). Tobacco taxation increase rates for longitudinal analyses werethose applicable at the follow-up (not baseline) surveys.
AffordabilityWe developed a new individualised affordability measure: the percentage of a smoker’s annual gross incomeremaining after subtracting their annual tobacco spend (see Equation 2), with higher values representingmore affordable tobacco. Values theoretically ranged between 0% and 100%, but after excluding outliers(the top and bottom percentile of the data), affordability ranged between 35.3% and 99.9%.
Individualised Affordability =(Income −Annual Tobacco Spend)
Income× 100%. (2)
For comparison, an aggregate version of this affordability measure was also calculated (see Equation 3),based on average tobacco prices and national estimates of income, but this was possible only for FMcigarettes. An existing methodology was adapted, the RIP,66 which is the percentage of per-capita GDPrequired to purchase 100 packs of 20 FM cigarettes (2000 cigarettes). We made two adjustments to makecomparable with our individualised method, in magnitude and direction: (1) we tripled the number ofcigarettes (to 6000 cigarettes or 300 packs of 20), which corresponded more closely to the average annualcigarette consumption of our sample (mean 6074 cigarettes, SD 2913 cigarettes); and (2) we inverted theequation so that higher values would indicate more affordable cigarettes (as in the individualised measure).It should be noted that our new methodology for calculating affordability (both the individualised andaggregate versions) also differed from traditional measures, such as the RIP, in that we incorporatedconsumption into our measure, whereas traditional measures usually assess only the ratio of price toincome (see Chapter 7 for a more detailed discussion of this issue). UK FM cigarette prices for our aggregateversion of affordability were based on the MPPC from 2002 to 2010 or the WAP from 2011 to 2014, asthese were the European Commission published data128 on which UK tobacco taxes were based. Cigaretteprices and yearly GDP figures were adjusted for inflation to 2014 values using the CPI. GDP and CPI datawere obtained from the Office for National Statistics.126,129 For income, we took the mid-point of each rangeand £95,001 for the highest value. Owing to the complexities and slight deviations from the publishedmethodologies involved in equivalising income (see Report Supplementary Material 1), sensitivity analyseswere carried out using a version of income that was not equivalised for household composition. The resultsof these analyses did not deviate substantially from the results presented using equivalised income and didnot alter the conclusions drawn from the data (data not shown).
Aggregate Affordability =(GDP − Tobacco Spend6000 cigarettes)
GDP× 100%. (3)
GENERAL METHODOLOGY
NIHR Journals Library www.journalslibrary.nihr.ac.uk
20

AnalysesThe ITC data analyses were conducted using the Stata® software package, Stata SE version 12.1 (StataCorpLP, College Station, TX, USA), unless otherwise indicated. When relevant, more detailed analytical plansare discussed for each study in the relevant chapters. In general, for analyses in which we were interestedin simple overall population trends (e.g. in prices paid for different products over time, or changes in theproportions of participants purchasing tobacco from different sources), we used generalised estimatingequations (GEEs) with population-weighted data. However, the estimates provided by GEE analyses are notwell suited for predictive modelling (e.g. for simulating or predicting responses of individuals or differentgroups of individuals),130 so for analyses in which we were interested in examining the role of other factors(e.g. nicotine dependence, sociodemographics or taxation rates) on our outcomes from our particularsample, we instead used random-effects regression analyses with unweighted data.
The ITC data are hierarchical, in that the same individual can provide multiple responses by participatingin more than one survey, so the data are responses clustered within individuals, with a large number ofsmall clusters (an average of around two responses per individual) and even some ‘clusters’ of size 1. GEEsrequire that the nature of the correlation between responses in the same cluster (in the ITC data that is thecorrelation between responses made by the same individual in different surveys) be specified. Stata allowsfor seven different types of correlation structure (independent, exchangeable, unstructured, autoregressive,stationary, non-stationary and fixed). From the outset, the autoregressive, stationary and non-stationaryoptions were ruled out for our data, as these rely on equally spaced timing of observations with no gaps,which was not the case for our data. For the remaining options, we made our selection using a theory-driven, rather than a data-driven, approach. The fixed option allows for the user to specify a correlationmatrix; however, we had no theoretical basis for producing such a matrix, so this option was also ruledout. The independent option assumes that responses provided by the same individual at different timepoints are independent (uncorrelated). We felt that this was highly unlikely and thus ruled out theindependent correlation structure also. The likeliest scenario for our data, we felt, was that participants’responses at different time points would be related in such a way that responses made closer togetherwould be more closely related than those made further apart. The exchangeable correlation structureimposes the same relationship at all time points and does not allow for this scenario. This left only theunstructured correlation option, in which correlations are estimated for each time point from the datathemselves. We thought that, theoretically, this was the best option to fit our data and therefore used thisas the default option (the exchangeable structure was the next best option and, thus, we used this whenthe unstructured method failed to converge). In addition, the standard errors (SEs) provided by GEE arequite robust to mis-specification of the correlation structure if robust SEs are specified, which we didroutinely. However, we did also use a data-driven method to compare model fit of the unstructuredcompared with exchangeable options, using the quasi-likelihood under the independence criterion (QIC),and the results of this are presented in Table S1 in Report Supplementary Material 2. The QIC statisticindicated an equivalent or better fit using the unstructured correlation matrix in all cases, with oneexception, and the implications of this are discussed in Chapter 8.
Our reasons for choosing random- (and not fixed-) effects regression were both practical and theoretical.Our objective was to make inferences at the group level, controlling for the correlation of responses providedby the same individual (e.g. exploring the effect of time or age on tobacco affordability). Fixed-effectsregression focuses on cluster-level analysis, in which the clusters themselves are of interest (e.g. in data inwhich pupils are clustered in schools, looking at the effect of different schools on academic outcomes), andclusters of large sizes are desirable. Random-effects regression is more focused on the group-level effectsand can handle large numbers of small clusters and clusters of 1 (as in our data). Fixed-effects regressiontherefore also requires a higher degree of within-cluster variability than was present in our data. Furthermore,we were also often interested in the effects of time-invariant variables (e.g. sex, ethnicity), and fixed-effectsregression does not allow for this.130
DOI: 10.3310/phr08060 PUBLIC HEALTH RESEARCH 2020 VOL. 8 NO. 6
© Queen’s Printer and Controller of HMSO 2020. This work was produced by Partos et al. under the terms of a commissioning contract issued by the Secretary of State for Healthand Social Care. This issue may be freely reproduced for the purposes of private research and study and extracts (or indeed, the full report) may be included in professionaljournals provided that suitable acknowledgement is made and the reproduction is not associated with any form of advertising. Applications for commercial reproduction shouldbe addressed to: NIHR Journals Library, National Institute for Health Research, Evaluation, Trials and Studies Coordinating Centre, Alpha House, University of Southampton SciencePark, Southampton SO16 7NS, UK.
21

We note also that we have not, in any of our analyses, adjusted our alpha levels for multiple comparisons,as we agree with others that this is not a meaningful or useful strategy.131 We have, however, providedp-values throughout the report, enabling interested readers to make their own adjustments if so desired.
LimitationsThe ITC data are based on self-reported details of smoking behaviour, so the results are dependent on theaccuracy of that reporting. In general, several steps are taken to minimise bias and maximise responserates (e.g. through using different times of the day and days of the week for recruitment calls). Multiplecontact information is collected to minimise attrition, with up to 25 attempts at follow-up, using differentmethods. Demographic profiles of the unweighted samples are compared with benchmark surveys andweights calculated, so that weighted data are consistent with corresponding national benchmarks. Fulldetails of methods and weighting are given elsewhere.123,124 Data from single countries can be used toexamine how smoking behaviour changes over time in response to specific policies. Given the commonalityof methods, study design and questionnaires across different countries, comparisons across countries canalso be made using other countries as controls. The ITC conceptual model123 focuses on how single policiesaffect behaviour, rather than how combinations of policies and other factors interact to influence behaviour.
Similarly to the limitations discussed with the Nielsen data, the ITC survey did not ascertain whether or notRYO pouches were purchased as part of a bundle, including filters and/or rolling papers. However, theimpact of this on our price estimates is likely to be minimal, with papers and filters contributing onlybetween £0.004 to £0.014 to the prices per RYO cigarette, and any resulting biases would be consistentlyapplicable over the study period, thus not affecting time-related trends.
A particular strength of the ITC is that it has been subject to consideration by ethics committees in multipleorganisations and the hundreds of outputs from ITC data have been subjected to extensive peer review. Asan international collaboration, all the processes and practices are subject to ongoing quality improvement.Specific limitations pertaining to particular analyses and subsamples are described in the relevant chapters.
Studies using ITC data
l Study 1 (see Chapters 4 and 8): prices paid for tobacco by smokers over time from both licit and taxavoidance/tax evasion sources.
l Study 2 (see Chapters 5–9): changes in tobacco affordability over time among smokers.l Study 3 (see Chapters 6 and 8): smokers’ tobacco purchasing behaviours by product and store type,
for both licit and tax avoidance/evasion sources.l Study 4 (see Chapters 6, 8 and 9): impact of tobacco pricing changes on smokers’ purchasing patterns
and product choices (analysis 4a) and smoking behaviour (analysis 4b).l Study 5 (see Chapters 7–9): impact of tobacco pricing changes and product choices on smokers’ quit
attempts (analysis 5a) and sustained abstinence (analysis 5b).l Study 6 (see Chapter 7): weight of RYO tobacco cigarettes, analysis over time and international comparison.
Structure of report
The chapters that follow discuss the research in relation to the objectives set out in the Introduction and thestudies set out above. Chapter 3 assesses TI pricing strategies and how the industry segments its tobaccomarket for FM and RYO cigarettes using commercial literature and Nielsen data. Chapter 4 uses ITC datafor an analysis of how much smokers pay for their tobacco and have paid between 2002 and 2014, andhow prices paid differed by the type of product purchased. Nielsen data are also used to assess the price ofproducts by price segment and then to analyse what proportion of price increases by segment are explainedby TI price increases compared with tax increases. Chapter 5 uses the commercial literature and ITC datato assess changes in tobacco affordability over time among smokers, using a new individualised measureof affordability. Chapter 6 examines the impact of tobacco tax increases, as moderated by TI pricing, on
GENERAL METHODOLOGY
NIHR Journals Library www.journalslibrary.nihr.ac.uk
22

smokers’ legal purchasing patterns. Commercial and Nielsen data are used to examine patterns of productuse and sales volumes over time. We then use ITC data to examine purchasing behaviours by product andstore type. Then, using Nielsen data, we assess sales volumes of differently priced segments over time.Utilising ITC data, we then examine the impact of tobacco pricing changes (taxation) on product choicesand purchasing patterns. In Chapter 7, we analyse the impact of tobacco tax increases, as moderated by TIpricing, on smokers’ quitting and reducing behaviours. We examine quit attempts and 6-month abstinenceusing ITC data and then the impact of tobacco pricing changes on cigarette consumption over time. Assmokers of RYO cigarettes can reduce either the number of cigarettes or the amount of tobacco in theircigarettes, we also examine the weight of RYO tobacco cigarettes over time and in comparison with othercountries that have different RYO taxation strategies. Chapter 8 examines tax avoidance and evasionusing smokers’ sources for their cigarettes. We look at the proportion of tobacco purchases that are fromnon-UK/non-store sources and the prices paid from different sources. The impact of tax and price onsociodemographic inequalities is assessed in Chapter 9. Finally, we synthesise all the results with implicationsfor practice in Chapter 10.
DOI: 10.3310/phr08060 PUBLIC HEALTH RESEARCH 2020 VOL. 8 NO. 6
© Queen’s Printer and Controller of HMSO 2020. This work was produced by Partos et al. under the terms of a commissioning contract issued by the Secretary of State for Healthand Social Care. This issue may be freely reproduced for the purposes of private research and study and extracts (or indeed, the full report) may be included in professionaljournals provided that suitable acknowledgement is made and the reproduction is not associated with any form of advertising. Applications for commercial reproduction shouldbe addressed to: NIHR Journals Library, National Institute for Health Research, Evaluation, Trials and Studies Coordinating Centre, Alpha House, University of Southampton SciencePark, Southampton SO16 7NS, UK.
23


Chapter 3 Tobacco industry pricing strategies andprice segmentation of the UK tobacco market
Introduction
Our previous work34 demonstrated that tobacco companies produced low-priced products to provide analternative to cessation for price-conscious smokers. This was possible because they could offset lowerprofits on these cheaper products by overshifting taxes on their more expensive products, such that thegap between cheap and expensive products was widening. We had, however, previously examined onlyFM cigarette data up until 2009. RYO pricing had not been studied, nor what other pricing approachesthe TI had utilised since. Our other research12 also suggested that TI pricing strategies might play a key rolein driving inequalities in smoking and compromising declines in population smoking prevalence. In thischapter, we build on this work using a qualitative approach (commercial literature study 1) to assess ifthe TI was able to continue producing low-priced FM products in the period between 2008 and 2014 and,if so, how this was achieved. We also extend this work by assessing the pricing of RYO tobacco duringthis time.
A key objective of our research was to understand how the TI segmented its FM and RYO tobacco productsand how the price of these segments changed over time. In the second part of this chapter (commercialliterature study 2), we describe the methods used to categorise the TI’s brands into segments. We didnot use statistical techniques to understand segmentation, in case this led to oversimplification and/orobfuscated deliberate TI pricing strategies. Moreover, TI pricing strategies are linked to brand marketing.Thus, consumer perceptions, rather than statistical groupings, influence consumer choices. Instead, oursegmentation was based on an approach used successfully in the PPACTE study.35 We reviewed thecommercial literature to understand the industry’s approach to segmentation and combined this withan analysis of relative price positions of SKUs in the Nielsen data to categorise brands into segments.
Commercial literature study 1: what were the tobacco industry actions tomaintain profitability?
Background: UK market conditions reported to be facing tobacco companies in thecommercial literatureThe TI strategies undertaken to maintain profitability during the review period (2008–14) were reportedwithin the context of two main price-impacting tax changes that were also reported in the commercialliterature. These were (1) the EU-wide plans to increase taxes and (2) to begin to equalise tobacco taxes(and thus prices) between different tobacco products to reduce the price differential between cigarettesand other forms of tobacco.132 These changes were often discussed in emotive terms:
The government is mounting an assault on the downtrading trend in tobacco sales . . .Hayward133
The commercial literature reported detailed implications of proposed changes, such as the removal ofcertain loopholes:
The proposal would also remove loopholes which allow some cigarettes made from fine cut tobaccoto be sold as cigars, cigarillos or pipe tobacco and therefore to benefit from a lower tax rate.
Euromonitor International Ltd132
DOI: 10.3310/phr08060 PUBLIC HEALTH RESEARCH 2020 VOL. 8 NO. 6
© Queen’s Printer and Controller of HMSO 2020. This work was produced by Partos et al. under the terms of a commissioning contract issued by the Secretary of State for Healthand Social Care. This issue may be freely reproduced for the purposes of private research and study and extracts (or indeed, the full report) may be included in professionaljournals provided that suitable acknowledgement is made and the reproduction is not associated with any form of advertising. Applications for commercial reproduction shouldbe addressed to: NIHR Journals Library, National Institute for Health Research, Evaluation, Trials and Studies Coordinating Centre, Alpha House, University of Southampton SciencePark, Southampton SO16 7NS, UK.
25

The banning of small pack sizes as a result of the revised EU Tobacco Products Directive (TPD) in 2016was also reported.134 Additionally, analysts noted that EU tax policy aimed to reduce the range in pricesbetween different EU countries, although its ability to do this was limited:
. . . the mainly ad valorem (i.e. as tax as a percentage of price) mechanism of setting tax levels in thetobacco market means that equalising taxes and duties would not, by any means, make for equalprices, though the cross-border gaps would be narrowed.
Euromonitor International Ltd132
The commercial literature therefore revealed that tobacco analysts and vendors were expecting taxincreases in this period and that tax structure changes were intended to reduce the price range betweendifferent products.
Findings: tobacco industry actions undertaken to maintain profitability
Price risesIncreasing taxes on tobacco raises its price, which has the effect of reducing volumes of tobacco sold.Euromonitor International Ltd suggested that reduced volumes did not reduce TI profits because ‘volumesfall by less than the rise in retail prices’.132 However, Euromonitor International Ltd also predicted that‘there will come a point at which prices are perceived as so high by the consumer that the elastic in theelasticity snaps’, which they predicted would be in the 2020s.132 Thus, during the review period, the TI wasable to make profits from tax rises because (overall) they increased their prices above what was required tomeet government taxes, sufficiently to compensate for loss of sales.
Price segmentsIt was noted that higher priced and more profitable premium products were crucial for industry profitability:
The investment bank [Citigroup] says the tobacco industry is profitable only because smokers arewilling to pay a significant premium for some brands and as a consequence mix [relative distributionof price segments sold in a market] is at least as important as volumes.
Tobacco Journal International135
Thus, price segments were a vital tool for tobacco companies in their quest to make profits. In 2008,price segmentation of cigarette brands was already a global phenomenon:
Most cigarette markets broadly consist of a premium band, a mid-price band and a value/budget/economyband. Though these bands are not directly comparable between countries because of -often extreme-differences in mean prices, they are similar in that at premium level [the same brands will appear].
Tobacco Journal International136
In 2009, it was noted that there was also price segmentation within RYO tobacco:
The RYO market can now be split into two distinct segments – premium RYO (41% share) and valueRYO (59% share) (JTI EPOS Estimates November 2009).
Talking Retail137
In 2011, three RYO segments were noted:
JTI’s Blackburn says . . . RYO brands can now be categorised as premium, sub premium and value.Wood138
TOBACCO INDUSTRY PRICING STRATEGIES AND PRICE SEGMENTATION OF THE UK TOBACCO MARKET
NIHR Journals Library www.journalslibrary.nihr.ac.uk
26

Tobacco manufacturers discussed the importance of having products available in every segment, ‘creating aproposition to suit every pocket’,139 and sometimes adapted their price segmentation. For example, by the end ofthe period it appeared that Imperial Tobacco had stopped using (or at least referring to) the mid-price segment.Andrew Miller, head of independent retail at Imperial Tobacco, was quoted in The Scottish Grocer as saying:
. . . the firm segments the factory-made cigarette [FMC] market into five price sectors: premium,sub-premium, value, economy and sub-economy.
The Scottish Grocer140
New products were also created when there was a gap in the price segments.141
Strengthening the image of economy brands for smokers and investorsTobacco company spokespersons noted that smokers want ‘quality brands that offer value for money’(Christopher Street, Head of Grocery Channel at Imperial Tobacco, quoted in The Grocer).142 To this end,some cheap brands were given premium style packaging or makeovers:
Economy brand Windsor Blue is changing its packaging to a more vibrant blue style with silverlettering to give the brand a premium feel.
Talking Retail143
The John Player Special (JPS) brand in the economy sector and the linked Player’s brand in the subeconomysector were targeted towards those with an interest in higher priced brands:
The Player’s brand name holds a lot of heritage in the tobacco category and using this as a launch padfor new formats Player’s smooth king size and Superkings 19s is Imperial Tobacco’s way of providing aproduct that fits into the subeconomy market while maintaining its heritage of quality.
Gockelen-Kozlowski144
In a presentation to financial analysts, Imperial Tobacco referred to JPS as ‘premium on everything exceptthe price’ [Imperial Tobacco presentation to the CAGE (Competitive advantage in the Global Economy)conference 2011].145 Investors were reminded of JPS’s association with Formula One racing, despite thepassage of time since sports sponsorship was banned:
. . . a unique value brand asset . . . anchored in style and sophistication due to its F1 [Formula One]heritage, its understated packing style plus its overall premium image.
Wouda Kuipers146
In tobacco company presentations to investors it appears there was increasing ambiguity around the pricesegment a brand was in. For example, Imperial Tobacco had a confusing explanation of ‘value’:
[One of] two key areas of growth [is] in value – and this isn’t shorthand for cheap – this may be agood price but its about more than price.
Cooper et al.145
Moreover, although at the beginning of the review period Imperial Tobacco presented results by pricesegment,147 by the end its annual reports classified brands as either ‘growth’ or ‘specialist’. Growth brandsincluded (premium) Davidoff, (mid-price) Lambert & Butler (L&B) and (economy) JPS – all described as‘high-quality brands with strong consumer appeal’148 and specialist brands ‘which appeal to specificconsumer groups’,148 such as RYO brands and cigars.
DOI: 10.3310/phr08060 PUBLIC HEALTH RESEARCH 2020 VOL. 8 NO. 6
© Queen’s Printer and Controller of HMSO 2020. This work was produced by Partos et al. under the terms of a commissioning contract issued by the Secretary of State for Healthand Social Care. This issue may be freely reproduced for the purposes of private research and study and extracts (or indeed, the full report) may be included in professionaljournals provided that suitable acknowledgement is made and the reproduction is not associated with any form of advertising. Applications for commercial reproduction shouldbe addressed to: NIHR Journals Library, National Institute for Health Research, Evaluation, Trials and Studies Coordinating Centre, Alpha House, University of Southampton SciencePark, Southampton SO16 7NS, UK.
27

Innovation and promoting premium brandsPremium brands provided the highest profit margins.142 Hence, efforts were made to protect and promotethe share of premium brands. Jeremy Blackburn, JTI head of communications, was quoted in The Groceras saying:
The premium brands have been affected but we are continuing to look to shore up this part of thesector and it still represents a big chunk.
The Grocer149
This occurred through the use of innovations, although it was also suggested that the tobacco in premiumbrands was better quality150 and also:
Charcoal filters, flavour capsules etc have been means by which manufacturers have sought toincrease the proportion of premium brands in the sales mix to enable value sales to rise even whenvolumes fall.
Hedley151
Innovations grow the top line. When used to reinforce ‘premiumness’ they lock consumers in thepremium segment. If the consumer trades down, the consumer must sacrifice something. They alsoprovide consumers with the incentive to trade up.
Stevens152
Near the beginning of the review period, innovations (including capsules, flavours and taste, cigarette sizeand packaging) were aimed at the premium sector; later on, however, they became more ubiquitous:
Innovation is now present in all price bands (premium, mid price and economy) and many of theinnovation trends are common to each (pack colour coding, lower tar variants, super slims, carbonfilters, pack size variants, cigarette length, limited editions, flavour capsules. Shifting sub-brandsbetween price bands, presence across all price bands [and] launching sub brand extensions ofinternational brands in different price bands, using pack type pack size cigarette length, tobaccoblend etc.
Euromonitor International Ltd153
Types of innovation
CapsulesCapsule technology utilises a liquid-filled ball placed in the cigarette filter that smokers have the option ofcrushing to obtain a menthol taste.154,155 They were initially intended to promote premium brands:
. . . capsules etc have been means by which manufacturers have sought to increase the proportion ofpremium brands in the sales mix to enable value sales to rise even when volumes fall.
Hedley151
It was 2012 when ‘capsule technology took off in the premium segment’ (Melanie Mills, communicationsmanager at JTI, quoted in Retail Newsagent156). However, in 2014 it was noted that there had been a‘proliferation [of capsule cigarettes within] many different price segments’.157
FlavoursTwo types of flavours were mentioned, most notably in terms of target groups, particularly women. Thesewere an added menthol flavour and a smooth (in contrast to original) tobacco flavour. Menthol cigaretteswere said to appeal to women smokers due to ‘perceptions that they are a transition between full strength
TOBACCO INDUSTRY PRICING STRATEGIES AND PRICE SEGMENTATION OF THE UK TOBACCO MARKET
NIHR Journals Library www.journalslibrary.nihr.ac.uk
28

and lower tar cigarettes’.158 Golden Virginia Yellow RYO was developed with a smooth flavour to appeal tosmokers of cheap cigarette brands who might be finding manufactured cigarettes too expensive.159 In2014, 38% of variants in the subeconomy cigarette sector were smooth,160 and Golden Virginia Smoothwas aimed at women and younger people.161
Additive freeIt was suggested that ‘UK smokers [are] looking for a more natural flavour. Natural American Spirit (NAS) isthe main brand to have capitalised on this trend’.162 However, tobacco companies were usually unable tocertify their products as organic because they could not find certification bodies that would work withthem.163 Natural American Spirit was promoted as a premium RYO product.150
Cigarette sizeCigarettes can be varied in their length and circumference. Slim cigarettes can be known as super slims ordemi slims. These ‘slimmer variants . . . target value-conscious smokers and women’.164 However, in 2012,unisex packaging was introduced for these products.165
Longer, so-called ‘super king-sized’, cigarettes were often associated with lower priced segments:
Currently over 48% of cigarettes in the economy priced sectors sold by retailers are above king size.This reflects the increasing number of consumers who are seeking better value for money from theirtobacco purchases. L&B Blue Superkings provides consumers with a longer cigarette at a great valueprice as well as capturing the increasing number of adult smokers who are down trading.
Asian Trader166
Our ongoing research shows consumers are increasingly seeking lower priced, quality products frombig brands. Superking size cigarettes currently account for around 30% of the cigarette market. L&BBlue Superkings are designed to appeal to those long time value-seeking smokers who previouslyhaven’t been able to afford a product from the Lambert & Butler family.
Rebecca Ivey, brand manager for L&B, quoted in Forecourt Trader167
From the above, tobacco companies appeared to be innovating with cigarette size in order to preventsmokers down-trading to less profitable segments or even quitting, and women and low-income smokerswere targeted.
Packaging updatesMany articles addressed packaging changes. These could be introduced to indicate a premium product168
(whether or not it actually was) or to appeal to a particular demographic. For example, for women, ‘Thetraditional packaging shorthand tends to be pink or pastel graphics on a white or pastel background withfloral imagery’,165 or ‘aimed at young adult smokers, the striking pack features the distinctive Rastafarilivery of red, yellow and green and carries the on-pack description “chill tobacco”’.169
Packaging innovation aiming to imply membership of higher priced segments included ‘a metallic finish topromote the premium quality of the product’170 and ‘round corner kingsize packs and more tactile packs[packs with embossed designs]’ (Imperial Tobacco presentation to the 2012 CAGE conference). Lowerpriced segments were indicated through ‘soft packs and big boxes’ (Imperial Tobacco presentation 2012to the CAGE conference) or ‘urban designs . . . a modern alternative for those choosing to down trade outof premium’ (Jeremy Blackburn, head of communications, JTI, quoted in Wholesale News171).
However, there were stated to be limits to the efficacy of packaging, The Grocer’s annual top productssurvey revealed that price – far more than bright shiny packaging – determines purchasing decisions.172
Thus, the retailer literature suggested that packaging was useful but not sufficient for success.
DOI: 10.3310/phr08060 PUBLIC HEALTH RESEARCH 2020 VOL. 8 NO. 6
© Queen’s Printer and Controller of HMSO 2020. This work was produced by Partos et al. under the terms of a commissioning contract issued by the Secretary of State for Healthand Social Care. This issue may be freely reproduced for the purposes of private research and study and extracts (or indeed, the full report) may be included in professionaljournals provided that suitable acknowledgement is made and the reproduction is not associated with any form of advertising. Applications for commercial reproduction shouldbe addressed to: NIHR Journals Library, National Institute for Health Research, Evaluation, Trials and Studies Coordinating Centre, Alpha House, University of Southampton SciencePark, Southampton SO16 7NS, UK.
29

Expanding brands across price segmentsIn the past, ‘umbrella brands normally [sat] in a specific price band . . . across regions to retain brandintegrity and image’.153 However, more recently brand variants were created in different price segmentsfor that brand. This could be either in a higher or in a lower priced segment. Analysts reported that it ispossible to change the brand price segment through changing the ‘pack type, pack size cigarette length,tobacco blend etc’.153
Brand was also important for launching new innovations, such as capsules:
The solid bedrock of a strong established brand is particularly helpful for the launching of newproducts in the tobacco category . . . a product can arrive in store and gain immediate familiarity andfrom that instant sales.
Gockelen-Kozlowski173
On some occasions a new variant could be launched in a higher priced segment: in 2008, Kent Nanotechwas established ‘at a premium relative to the Kent main range’ (BAT 2008 Annual Report).174 Additive-freebrands were popular, so additive-free variants were launched for established RYO brands, such as Drumand Golden Virginia (Imperial Tobacco 2013 Annual General Meeting).
New value productsNew, cheaper products were being launched over the study period, in response to specific policy developmentswithin both manufactured cigarettes and RYO tobacco. In 2009, BAT noted a ‘stronger mix of value-for-moneyofferings across Western Europe’ (BAT Annual Report 2009). In 2010, with an impending point-of-sale (PoS)display ban, there were ‘four major launches at the value end of the increasingly popular roll your own (RYO)category’.175 As former FM smokers began to smoke RYO, new RYO products were devised that were moresimilar to cigarettes.176 By 2012, the move to value products was obvious:
‘The future of the tobacco market is not premium’ so said British American Tobacco brand manager. . .The growing number of value for money brands shows the determination of tobacco firms to makethis sector a success.
Lambert177
This trend continued to the end of the review period.166 It was described as reassuring to smokers if a newlow-priced product (whether FM or RYO) was a variant of another brand:
Having a cigarette brand on the label is very reassuring. Smokers see JPS tobacco as a naturalprogression if they move into roll your own from cigarettes.
Retail Newsagent178
For the industry, this approach would also serve ‘to encourage smokers of their brands to remain loyal whentrading down’.179 Hence, expanding the brand into cheaper segments would retain customers who no longerwanted to, or were unable to, pay for higher priced products. Examples include Marlboro Bright Leaf, whichwas launched in 2009 in the mid-price range, whereas all other Marlboro variants were premium products.This was seen as a ‘logical move in a market where none of the leading brands are in the premium band’.180
PMI said they would ‘maintain the quality of the brand, but at a lower price point’.181
New RYO variants of manufactured cigarette brands also appeared182 and variants of existing RYO brandswere placed in the RYO value segment:
Imperial Tobacco recently reacted to changing consumer preferences by launching Golden VirginiaYellow to reflect smokers’ propensity towards high-quality, smoother, value for money tobacco
TOBACCO INDUSTRY PRICING STRATEGIES AND PRICE SEGMENTATION OF THE UK TOBACCO MARKET
NIHR Journals Library www.journalslibrary.nihr.ac.uk
30

brands. Building on the renowned heritage of Golden Virginia this brand extension has beenextremely successful.
Mike Laney from Imperial Tobacco, quoted in Wholesale News159
In the later years of the review period, more and more iconic brands were subject to variant launches atlower price ranges. Two examples include the super premium brand Davidoff where Davidoff iD waslaunched at a premium price band in the UK (Imperial Tobacco presentations 2013 Annual GeneralMeeting)183 and Marlboro Gold Touch ‘a slightly thinner variant of the core brand [which could belaunched at a] more affordable price point’.156
Innovation in cheap tobacco productsThere was a plethora of ways that cheap tobacco products were made available during the review period.
Price markingPrice-marked packs reduce the opportunity for retailers to increase their margins by charging more thanthe RRP.184 Price-marked packs were popular with tobacco companies because they ‘give adult smokersconfidence that they are getting a fair deal’ (Andreas Nicolaou, Head of Trade at BAT, quoted in RetailNewsagent185) and were particularly used in convenience stores. Tobacco companies encouraged retailersto sell price-marked packs on the basis that it increased footfall, despite lower profit margins.186 If true,it is possible that price marking increases industry profits by increasing sales volume.
Price marking grew over time, playing an increasingly important role in price reduction during the studyperiod. At the beginning, price marking was used to signal a downgrading of brands between price sectors,such as Sterling in 2008 between economy and super value187 and Berkeley in 2010 to the mid-price sector.159
In 2011, the popularity of price-marked packs among convenience store RYO shoppers was noted:
. . . no fewer than six of the top 10 are price-marked packs, indicating a price sensitive market.Retail Newsagent188
Similarly, among the top-selling cheap manufactured cigarettes ‘eight [are] price-marked products all ofwhich are mid-priced or economy brands’.188 In 2012, Andreas Nicolaou, Head of Trade at BAT, noted thatnearly half of tobacco sales (47.5%) in UK convenience stores were in price-marked packs.185 The increasein popularity was due to ‘[t]he growing number of value seeking smokers’ (Mike Lancey Head of Convenience atImperial Tobacco quoted in Retail Newsagent189).
In 2013, it was noted that ‘price marking dominates RYO sales with seven of the top 10 lines carryingflashes on packaging’.190 By 2014, it was noted that ‘most brands and nearly all new products (particularlythose at the economy or ‘value’ end of the market) are now available to retailers in price-marked packs’.191
The only exception was additive-free cigarettes:
NAS [Natural American Spirit] isn’t price-marked as price tends not to matter to the adult smokers whobuy it. These tend to be wealthy urbanites.
Alan Graham from Scandinavian Tobacco, quoted in Convenience Store150
Downgrades and price cutsProducts were sometimes downgraded to a lower priced segment by cutting their price in order to preventsmokers from switching to another company’s product or quitting. This happened to Sterling in 2008,ostensibly to ‘help retailers at a time of economic instability and when adult smokers will be looking formore value for their money’.187 However, another reason for the move may have been a new brand from arival company competing with Sterling.192 The price cut was reported to be a success (in the three monthsfollowing the price cut its share of the overall market climbed from 5.2% to 6.1%)193 and the pricesegment downgrade was later confirmed as permanent.194
DOI: 10.3310/phr08060 PUBLIC HEALTH RESEARCH 2020 VOL. 8 NO. 6
© Queen’s Printer and Controller of HMSO 2020. This work was produced by Partos et al. under the terms of a commissioning contract issued by the Secretary of State for Healthand Social Care. This issue may be freely reproduced for the purposes of private research and study and extracts (or indeed, the full report) may be included in professionaljournals provided that suitable acknowledgement is made and the reproduction is not associated with any form of advertising. Applications for commercial reproduction shouldbe addressed to: NIHR Journals Library, National Institute for Health Research, Evaluation, Trials and Studies Coordinating Centre, Alpha House, University of Southampton SciencePark, Southampton SO16 7NS, UK.
31

In 2010, Berkeley was downgraded to the mid-price sector in order to ‘meet demand’159 and SamsonRYO tobacco was downgraded to the value segment for similar reasons.195 In 2012, Berkeley was furtherdowngraded to the value sector196 and, in 2014, the price of Berkeley cigarettes was lowered,197 as wasthat of Holborn RYO.198
Reduced marginsPricing affected profit margins, which varied over time and by product for both tobacco companies and retailers.PMI launched Marlboro Bright Leaf in the mid-market price sector, which was viewed as an attempt ‘to gainmarket share at the expense of margin’.180 Although Imperial Tobacco claimed that ‘profit per pack hadsteadily increased since 1989’, figures seen by The Grocer suggested that retailer and wholesaler margins onImperial Tobacco’s best-selling brand variant had ‘almost halved’ in the same period (from 11% to 6% orfrom 71p to 40p).199 Thus, declining margins appeared to lead to profit falls not for tobacco companies butfor other elements in the supply chain.
Thus, government taxation, rather than tobacco company actions, was blamed in the commercial literaturefor falling retailer margins.
Added valueAt the beginning of the review period, it was noted that RYO tobacco provided opportunities for retailersto sell accessories. In 2012 and 2013, tobacco companies were including papers with RYO tobacco. Theprice of these packs was cheaper for smokers, rather than buying each element separately.200 RYO packs,which included papers, therefore ‘added value’ by providing smokers with less to pay for each cigarettesmoked.
Make your ownMake your own was launched in the UK in 2011 and was claimed to reduce the pack price of JPS Silver by20% (£3.80 compared with £5), after the initial outlay of a make-your-own cigarette maker at £3.09 anda £0.99 pack of 100 tubes.201
Segments consisting of very cheap productsThe term ULP, which was used frequently during our previous review of the retail literature, is little used inthis review and was either used by analysts or for cigarillos. However, such a segment was mentionedunder different names, at the beginning and end of the review period. In 2008, it was noted that cheaptobacco was being made available through the creation of a new, very cheap segment:
. . . the new lower priced cigarettes entering the market, Sterling and Windsor have added to thesector movements by creating a new pricepoint below the usual value for money level.
Lewis202
Japan Tobacco International called the segment ‘super value’ in 2009.194
In 2011, a retailer noticed that ‘some customers seem to be ditching traditional economy brands andswitching to even cheaper ones’203 and, in 2012, Imperial Tobacco announced the creation of a newsegment:
Imperial Tobacco is launching Player’s a new ‘sub-value’ priced cigarette brand. Sue Transter consumermarketing manager at Imperial Tobacco commented: ‘Imperial Tobacco has chosen to position Player’s justbelow the value priced sector, making it the first ‘sub-value’ priced cigarette brand available in the UK.
Wholesale News204
TOBACCO INDUSTRY PRICING STRATEGIES AND PRICE SEGMENTATION OF THE UK TOBACCO MARKET
NIHR Journals Library www.journalslibrary.nihr.ac.uk
32

By the end of the period (2014), Imperial Tobacco referred to this segment as ‘subeconomy’,140 and it wasestimated that Imperial Tobacco’s brands in this sector ‘account[ed] for 7.67% of the entire cigarettemarket by the end of 2013’.160 Imperial Tobacco stated that margins in the sector were increasing.205
CigarillosIn 2010, it was noted that in the UK, unlike some other countries, cigarillos were more expensive thanpremium cigarettes, so they were not part of the creation of cheap tobacco options.206 Nevertheless, in2010, cigarillos were being designed to suit women and those with low incomes:
. . . in order to appeal to this incoming consumer (also increasingly female) manufacturers havedeveloped their products to appeal to squeezed wallets with smaller pack sizes. With lighter tastes,often with flavours/aromas and with a filter: the cigarette style cigarillo.
Euromonitor International Ltd206
In 2011, Alistair Williams, STG’s UK trade marketing manager, stated that ‘a value for money segment hasclearly developed in the cigar category in the past few months’; the sales from this were ‘impressive [and] sawthe variant soon outsell competitor brands in store’ and this was thought to ‘point to the value-for-moneytrend as being important in the cigar sector as elsewhere’.207 In 2013, Alan Graham (also of STG) noticed that‘even the cigar market . . . is suffering from down trading . . . although not to the same extent as the rest ofthe category’.142
In 2014, a product (Break Little Cigars) was launched that could compete with cigarettes on price:
[STG] launches an ultra low price product next month . . . a filter cigarillo product packed in a cigarettestyle box . . . aimed at price conscious smokers willing to alter taste and category preferences . . .‘This is the lowest out of pocket price for a ready-made smoke anywhere’ said Alan Graham head ofmarketing at STG . . . ‘ because the EU sees this type of product as cigars and not cigarettes Break willbe exempt from restrictions on flavour enhancements and minimum pack sizes.
Wholesale News208
Cigars were therefore being moved into the lowest priced sector because they were not subject to some ofthe EU restrictions. From the retail literature, it appears that the cigar market was being subjected to thedown-trading pressures found in manufactured cigarettes and RYO. Tobacco manufacturers were takingadvantage of loopholes in legislation to launch low-priced cigars.
Pack size
Varying the numbers of cigarettes per packCigarette packs were historically sold with 20 sticks or 10 sticks per pack. An innovation during the periodwas cutting the number of sticks in order to ‘maintain reasonable price points’.209
For example, BAT created a Pall Mall 19-stick pack, which was 23p cheaper than the 20-stick pack, inorder to stop smokers ‘down[-trading from] the premium category [in a way that] didn’t affect value forconsumers or profitability for retailers’ (Henry Lewis from BAT, quoted in Retail News).210
The small change in pack size could go unnoticed by smokers:
Increasingly our customers are buying on price even to the point that sometimes they don’t realisethey are buying 19s – all they see is the price.
Wholesaler Paul Ford, quoted in Wholesale News211
Changing pack size could therefore be a successful way of retaining smokers in brands with higherprofit margins.
DOI: 10.3310/phr08060 PUBLIC HEALTH RESEARCH 2020 VOL. 8 NO. 6
© Queen’s Printer and Controller of HMSO 2020. This work was produced by Partos et al. under the terms of a commissioning contract issued by the Secretary of State for Healthand Social Care. This issue may be freely reproduced for the purposes of private research and study and extracts (or indeed, the full report) may be included in professionaljournals provided that suitable acknowledgement is made and the reproduction is not associated with any form of advertising. Applications for commercial reproduction shouldbe addressed to: NIHR Journals Library, National Institute for Health Research, Evaluation, Trials and Studies Coordinating Centre, Alpha House, University of Southampton SciencePark, Southampton SO16 7NS, UK.
33

Roll-your-own tobacco pack sizesSmall pack sizes quoted tended to be 12.5 g and 10 g (or even, on occasion, 8 g), larger pack sizes tendedto be 20 g (or sometimes 50 g). Large pack sizes could be advantageous to smokers with a lower price pergram, whereas smaller pack sizes gave a lower purchase price; thus, manufacturers launched both.144
Supporting retailersRetailers are more likely to stock products and to make more effort to sell products if they receive supportfrom manufacturers. This support could be in terms of profit margins or other practical support. Particularlywhen launching a new product, higher margins might be made available.212 Other incentives to stock newvariants included competitions for retailers to win a prize (e.g. a trip to New York)213 and visits fromtobacco company representatives for promoting special offers.214
In 2014, with preparations for the PoS display ban, stores were also getting more visits from manufacturersto help them.205 Additionally, manufacturers provided advice in trade magazines as to how best to stocktheir gantry.215 However, the PoS display ban was seen as perhaps changing the power distributionbetween manufacturer and retailer slightly:
[One retailer] speaks for many retailers when he says manufacturers must work even harder to getnew products on his two metre gantry.
Lambert216
Commercial literature study 1 conclusionsDuring the review period (2008–14), the commercial literature reported that smokers were continuing todown-trade to lower priced tobacco options for two main reasons: (1) increased prices (generally blamedin the commercial literature on tax increases) and (2) the recession reducing smokers’ disposable incomes(see Chapter 5).
The TI responded in a number of ways. First, innovations (capsules, flavours, etc.) were used to promotepremium products and signal their greater attractiveness. However, as the trend to down-trade grew,tobacco companies appeared to blur the boundaries between price segments and innovations, in that bothproduct and packaging were increasingly used in lower price segments. Growing numbers of productswere launched in cheaper price segments, often within the same brand/brand family (e.g. cheaper variantsor RYO tobacco versions of known FM cigarette brands). Additionally, a variety of techniques were used topromote cheaper products and help maintain their lower prices, most notably price marking and smallerpack sizes (e.g. packs with < 20 cigarettes or low-weight RYO packs).
The compensation mechanism of premium brands offsetting the lowered profit margins of cheaper productswas forecast, by Euromonitor International Ltd, to stop working in the UK in the 2020s. Indeed, many of thepromotional approaches noted during the review period are now restricted in the UK (see Chapter 10).
Commercial literature study 2: how does the tobacco industry segmentits products on price?
This literature review was used to inform our segmentation of brands from the other data sources.Through preliminary analysis of the commercial literature, it became apparent that the same brand mightbe priced differently (and thus be in a different price segment) in different countries. Analysis of brandand segment links in the literature was therefore restricted to those mentioned in a UK context. We foundthat cigarettes, RYO tobacco and cigars/cigarillos were discussed in terms of price segmentation, but noreferences to pipe tobacco, waterpipes or smokeless tobacco being differentiated in this way were found.Segment names present in the commercial literature, sorted by approximate price group, are provided inTable 5. Segment names were fairly consistent across the three tobacco types (FM cigarettes, RYO tobaccoand cigars/cigarillos), although there were more segment names applied to FM cigarettes, probably due tohigher volumes of sales.
TOBACCO INDUSTRY PRICING STRATEGIES AND PRICE SEGMENTATION OF THE UK TOBACCO MARKET
NIHR Journals Library www.journalslibrary.nihr.ac.uk
34

TABLE 5 Commercial literature study 2: segment names mentioned in the commercial literature, sorted byapproximate price group
FM RYO Cigars/cigarillos
Super premium
Above premium
Luxury
Luxury or prestige
Luxury and premium Luxury
Premium and super premium Luxury and premium
Premium and above premium Super premium
Super premium and premium
Premium
Higher price segments Targeting higher end of the market
Higher priced
Subpremium
Mid-price/premium
Mid to high
More affordable
Mid-price
Mainstream
Mid-market
Mid-priced
Mid-range
Mid-tier
Mid-price/economy
Mid/value
Mid-price/economy
Mid-price/value for money
Economy/value
Budget
Discount
Economy
Economy/budget
Low margin value brand
Low price
Low priced
Lower priced
Lower value
Lowest price sectors
continued
DOI: 10.3310/phr08060 PUBLIC HEALTH RESEARCH 2020 VOL. 8 NO. 6
© Queen’s Printer and Controller of HMSO 2020. This work was produced by Partos et al. under the terms of a commissioning contract issued by the Secretary of State for Healthand Social Care. This issue may be freely reproduced for the purposes of private research and study and extracts (or indeed, the full report) may be included in professionaljournals provided that suitable acknowledgement is made and the reproduction is not associated with any form of advertising. Applications for commercial reproduction shouldbe addressed to: NIHR Journals Library, National Institute for Health Research, Evaluation, Trials and Studies Coordinating Centre, Alpha House, University of Southampton SciencePark, Southampton SO16 7NS, UK.
35

Very high-priced products were often termed ‘luxury’, but the most common segment name for high-priced products was ‘premium’. The prefix ‘mid’ was often used as part of the segment name for productsin the middle of the market (middle price range). There were many names for low-priced products withvariations of ‘economy’ and ‘value’ being common. Particularly, low-priced FM and RYO products weresometimes referred to as being in a segment with the prefix ‘sub’. Cigar products with this pricing werereferred to as ‘ULP’.
Explicit provision of names of the price segments used by tobacco companies were rare. During the analysisperiod, Imperial Tobacco stopped talking about price segments in its annual reports. In 2014, however,an article named the price segments used by Imperial Tobacco to be (from highest to lowest price range)premium, subpremium, value, economy and subeconomy.140 Imperial Tobacco brands labelled as ‘value’were actually mid-market brands, yet generally in the commercial literature ‘value’ was used interchangeablywith ‘economy’.
Nielsen data study 1: allocation of stock-keeping units to segments
Taking the findings from the commercial literature (study 2) as a starting point, this study undertooka detailed allocation of brands to segments. This analysis was restricted to non-price-marked packscontaining 17–20 FM sticks or 10 g, 12.5 g, 25 g or 50 g of RYO tobacco (not combi-packs) per pack,and to SKUs with sufficient market share (see Chapter 2).
TABLE 5 Commercial literature study 2: segment names mentioned in the commercial literature, sorted byapproximate price group (continued )
FM RYO Cigars/cigarillos
More budget focused
Value and economy
Value for money or VFM
Value line extensions
Value price point
Value – sub £6
Subvalue/subeconomya
Cheapest product on the market Own label
Even cheaper than economy
Own label
Own brand
Subvalue
Super value
ULP
Super value for money
ULP
a Analysts also used the terms ‘ULP’, ‘ultra-discount’ and ‘deep discount’ to refer to very low-priced FM products, particularlynear the beginning of the data series. Such products were not lowest price during most of our data series.
NoteIn addition to price segments, there were also mentions of a ‘natural’ segment and segments associated with sales toyoung people, older people, women, men and unisex/urban.
TOBACCO INDUSTRY PRICING STRATEGIES AND PRICE SEGMENTATION OF THE UK TOBACCO MARKET
NIHR Journals Library www.journalslibrary.nihr.ac.uk
36

Segmentation of stock-keeping units for factory-made cigarettesFor the first month of data, using the list of SKUs for each price segment which was developed in ourPPACTE study32 (premium, mid-price, economy and ULP), we allocated FM SKUs to segments (exceptthat the PPACTE economy segment was split into ‘subpremium’ and ‘value’ segments based on commonsegment naming of two subgroups of brands in this segment; see Table 5). All SKUs sold in the first monthwere listed in order of increasing price per stick, alongside their PPACTE segment. If there was no PPACTEsegment, we allocated the SKU to the segment within which its price fell. There were a few brand families,generally that arose towards the end of the PPACTE data series, where the segment once the brand wasestablished, as shown in the new data set, had moved. Segments for such brand families were revised. Wethen could calculate a price range for each segment and establish price boundaries for each segment thatdid not overlap.
For subsequent months, we again listed all SKUs sold by price per stick, alongside their segment from theprevious month. New brand families were added to the segment within which their price fell. ProblemSKUs, which appeared to cross segment boundaries, were flagged and addressed separately. Theseproblem SKUs were not included in the boundary designation for that and subsequent months until theirprice had stabilised within the designated boundary. If a new SKU emerged or reached valid market shareand its price was in between two segments, it was classified with the closest segment, unless in the futureit was persistently in the other segment, and the commercial literature suggested that segment or theemergence of a new segment.
Our PPACTE work, the updated commercial literature review and an initial analysis of the data, showedthat all SKUs within a FM brand family tended to be within the same price segment and that brandfamilies tended to stay in the same price segment over time. Originally, we had believed that brandvariants in the same brand family would be located at different price segments because the commercialliterature (study 1) had suggested that brand variants were being introduced at different price points totheir main brand family. When this occurred, however, Nielsen generally split the lower priced variants intoa different brand family. For example, L&B Blue was presented as a different brand family to L&B. The finalallocation of FM SKUs was thus always consistent with their brand family.
Seven FM segments were originally identified from the Nielsen data and literature: (1) premium; (2) vestigialmid-price (brands identified as being in the mid-price segment in the PPACTE study, which mostly eitherdisappeared or were repriced during the data series); (3) subpremium; (4) value; (5) original ULP (brandfamilies in this segment at, or near to, the beginning of the data series); (6) new ULP (brand families thatappeared from 2011 onwards that were priced generally within the original ULP bracket); and (7) sub-ULP(brand families that appeared from 2012 onwards and were consistently priced below the ULP brandfamilies). Two researchers analysed in detail all flagged SKUs, to ascertain why they were not in the expectedsegment. When possible, rules were then developed for allocating flagged SKUs. Reasons for SKUs not beingin the expected segment (based both on data observations and on the literature review) included (1) delayedprice increases (e.g. Dunhill); (2) high-priced SKUs within one segment overlapping with low-priced brandfamilies within another segment (e.g. JPS Black, Sovereign Black and Vogue Perle were priced between mainsubpremium brand families and value brand families for long periods); (3) low introductory pricing (e.g.Marlboro Bright Leaf Platinum); (4) very low exit pricing, particularly in 2014 when the number of sticks perpack was changing from 20 sticks to 19 sticks (e.g. Richmond, Mayfair) and the old 20-stick packs were soldoff very cheaply; (5) repricing a brand family into a different segment (e.g. Superkings moved from vestigialmid-price to premium, or Berkeley, where the segment declined several times); and (6) gimmicks (e.g. clickon or menthol, which often led to higher priced SKUs).
We produced graphs of SKUs within brand families and segments over time to understand the segmentationbetter. Two examples are provided to illustrate the utility to our allocation process of visualising the data.Figure 2 shows the atypical brand Berkeley for which repricing changed the segment several times. The threeBerkeley superking SKUs (SKUs 1–3; black lines in Figure 2) present at the beginning of the data series droppedfrom vestigial mid-price to value around May 2010 and from value pricing to original ULP pricing around
DOI: 10.3310/phr08060 PUBLIC HEALTH RESEARCH 2020 VOL. 8 NO. 6
© Queen’s Printer and Controller of HMSO 2020. This work was produced by Partos et al. under the terms of a commissioning contract issued by the Secretary of State for Healthand Social Care. This issue may be freely reproduced for the purposes of private research and study and extracts (or indeed, the full report) may be included in professionaljournals provided that suitable acknowledgement is made and the reproduction is not associated with any form of advertising. Applications for commercial reproduction shouldbe addressed to: NIHR Journals Library, National Institute for Health Research, Evaluation, Trials and Studies Coordinating Centre, Alpha House, University of Southampton SciencePark, Southampton SO16 7NS, UK.
37

Januar
y 200
9
Januar
y 201
2Ja
nuary 2
013
Januar
y 201
0 VAT c
hange
Mar
ch 20
10 b
udgetM
arch
2011
budget
Mar
ch 20
12 b
udgetM
arch
2013
budget
Januar
y 201
4
Mar
ch 20
14 b
udgetJa
nuary 2
015
Mar
ch 20
15 b
udget
July
2009
July
2010
July
2011
July
2012
July
2013
July
2014
Febru
ary 2
016
July
2015
Januar
y 201
1 VAT c
hange
April 20
09 b
udget
Pric
e p
er s
tick
(£)
0.55
0.50
0.45
0.40
0.35
0.30
0.25
0.20
PremiumVestigial mid-priceSubpremiumValueOriginal ULPNew ULPSub-ULPSKU 1: Berkeley Superkings 20sSKU 2: Berkeley Blue Superkings 20sSKU 3: Berkeley Green Superkings 20sSKU 4: Berkeley Blue king size 19sSKU 5: Berkeley Yellow king size 19s
FIGURE 2 Nielsen data study 1: Berkeley FM cigarette SKUs alongside preliminary price segments, illustrating how anomalous SKUs were used to understand segmentation.All SKUs are single packs with no price marking. Prices are not weighted for volumes.
TOBA
CCOINDUSTRY
PRICINGSTRA
TEGIES
ANDPRICE
SEGMEN
TATIO
NOFTH
EUKTO
BACCO
MARKET
NIHRJournals
Librarywww.journalslibrary.nihr.ac.uk
38

December 2011. Berkeley king size 19-stick packs (SKUs 4 and 5; grey lines in Figure 2) showed the oppositepattern and increased from subULP in late 2014 (when they arrived on the market) to original ULP pricing bythe end of the data series.
Mayfair was a key brand in the value segment. However, there were some anomalous SKUs (Figure 3).Mayfair Menthol SKUs could sometimes be priced higher than expected and for many months the greenSKU illustrated (SKU 5 in Figure 3) was priced in the subpremium segment. Dramatic falls in price of 20-stickMayfair packs in 2014 when the 19-stick packs were introduced are also shown. Note, that one of thereplacement 19-stick packs was actually priced higher than the 20-stick pack, at the border between valueand subpremium pricing.
Our visual analysis of flagged brands showed that although some SKUs might temporarily be priced within aneighbouring segment, this generally occurred only for short periods and in the margins of the unexpectedsegment. As such, it was simple to allocate each SKU to the segment where it spent most time. There weretwo exceptions: (1) there was considerable overlap in price between the original ULP and new ULP segments(these were therefore merged, see Figure 2); and (2) it was impossible to allocate a clear segment to Berkeleybrand families due to several marked price changes. Berkeley was therefore excluded (see Generalisation andfinal segments).
Segmentation of stock-keeping units for roll-your-own tobaccoStock-keeping unit prices were listed and graphed separately by pack size, as these were priced differently,with heavier packs cheaper per gram. Initial graphical analysis of the RYO SKUs revealed only three mainprice segments and that these were priced consistently above, in line with or below one of the maintraditional RYO brands (Amber Leaf) (Figure 4). RYO SKUs were therefore listed by price per gram togetherwith their segment, based on their pricing relative to Amber Leaf. If SKUs appeared to move segments,flags were used in the same way as for the FM SKUs.
Generalisation and final segmentsNielsen did not always differentiate FM and RYO SKUs at the same point in the brand classificationhierarchy (see Chapter 2 and Table 2). For FM SKUs, Nielsen differentiated brand families (their ‘houses’)when they were introduced at different price points, for example Marlboro Red and Marlboro Gold werein the same brand family, whereas Marlboro Bright Leaf, which had lower prices, was differentiated. ForRYO SKUs, this was not always the case. For example, Amber Leaf Signature Blend SKUs were in the samebrand family as the other Amber Leaf SKUs, despite being more expensive. This difference may flow fromthere being fewer RYO SKUs (e.g. in 2015 there were 934 FM SKUs and 226 RYO SKUs). Thus, for FM,SKUs in different brand families were reliably likely to have different price points, so we allocated FM SKUsto price segments at the brand family level. As this was not clearly the case for RYO SKUs, these wereallocated to price segments at the more specific brand variant level.
The segment allocations, which were initially determined using the restricted pack types and sizes describedin Segmentation of stock-keeping units for factory-made cigarettes and Segmentation of stock-keepingunits for roll-your-own tobacco, were then extended to all other relevant pack sizes, cartons and price-marked SKUs. For simplicity and for consistency between FM and RYO, the vestigial mid-price, subpremiumand value segments were merged into a ‘mid-price’ segment, the original and new ULP segments weremerged into a ‘value’ segment and the subULP became the ‘subvalue segment’. Thus, for analysis, thesegments for FM were premium, mid-price, value and subvalue; and the segments for RYO were premium,mid-price and value. The final list of FM brand families and RYO brand variants allocated to these pricessegments is provided in Table 6.
To explore convergent validity, FM brand families and RYO brand variants were listed within their allocatedprice segments, together with associated price-related terms used in the commercial literature (see Tables S2and S3 in Report Supplementary Material 2). In general, there was good consistency between segmentsand literature terms; this was especially true for FM families in the premium segment, which were clearly
DOI: 10.3310/phr08060 PUBLIC HEALTH RESEARCH 2020 VOL. 8 NO. 6
© Queen’s Printer and Controller of HMSO 2020. This work was produced by Partos et al. under the terms of a commissioning contract issued by the Secretary of State for Healthand Social Care. This issue may be freely reproduced for the purposes of private research and study and extracts (or indeed, the full report) may be included in professionaljournals provided that suitable acknowledgement is made and the reproduction is not associated with any form of advertising. Applications for commercial reproduction shouldbe addressed to: NIHR Journals Library, National Institute for Health Research, Evaluation, Trials and Studies Coordinating Centre, Alpha House, University of Southampton SciencePark, Southampton SO16 7NS, UK.
39
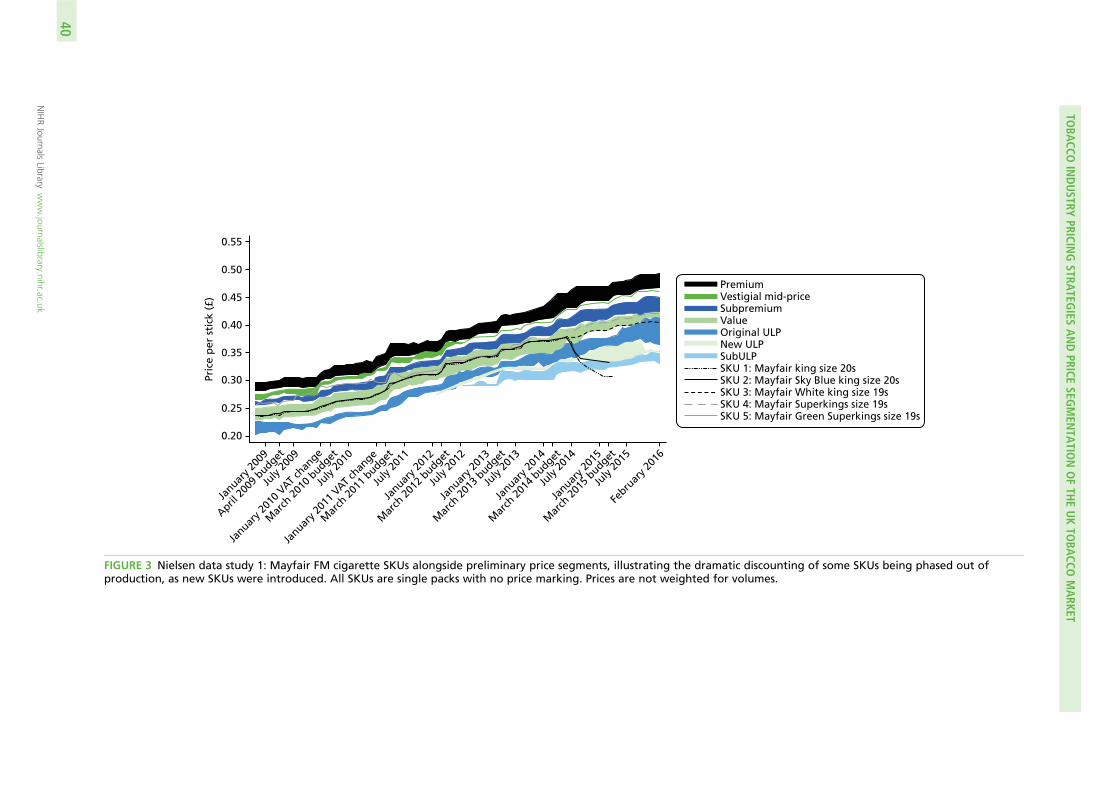
Januar
y 200
9
Januar
y 201
2Ja
nuary 2
013
Januar
y 201
0 VAT c
hange
Mar
ch 20
10 b
udgetM
arch
2011
budget
Mar
ch 20
12 b
udgetM
arch
2013
budget
Januar
y 201
4
Mar
ch 20
14 b
udgetJa
nuary 2
015
Mar
ch 20
15 b
udget
July
2009
July
2010
July
2011
July
2012
July
2013
July
2014
Febru
ary 2
016
July
2015
Januar
y 201
1 VAT c
hange
April 20
09 b
udget
Pric
e p
er s
tick
(£)
0.55
0.50
0.45
0.40
0.35
0.30
0.25
0.20
PremiumVestigial mid-priceSubpremiumValueOriginal ULPNew ULPSubULPSKU 1: Mayfair king size 20sSKU 2: Mayfair Sky Blue king size 20sSKU 3: Mayfair White king size 19sSKU 4: Mayfair Superkings size 19sSKU 5: Mayfair Green Superkings size 19s
FIGURE 3 Nielsen data study 1: Mayfair FM cigarette SKUs alongside preliminary price segments, illustrating the dramatic discounting of some SKUs being phased out ofproduction, as new SKUs were introduced. All SKUs are single packs with no price marking. Prices are not weighted for volumes.
TOBA
CCOINDUSTRY
PRICINGSTRA
TEGIES
ANDPRICE
SEGMEN
TATIO
NOFTH
EUKTO
BACCO
MARKET
NIHRJournals
Librarywww.journalslibrary.nihr.ac.uk
40

Novem
ber 20
08Ju
ly 20
09Ja
nuary 2
010
July
2010
Januar
y 201
1Ju
ly 20
11Ja
nuary 2
012
July
2012
Januar
y 201
3Ju
ly 20
13Ja
nuary 2
014
July
2014
Januar
y 201
5Ju
ly 20
15Fe
bruar
y 201
6
Pric
e p
er g
ram
(£)
0.40
0.35
0.30
0.25
0.20
0.15
0.10
Amber leaf 50 gAmber leaf 25 gAmber leaf 12.5 gGold leaf 50 gGold leaf 25 gGold leaf 12.5 gGolden virginia 50 gGolden virginia 25 gGolden virginia 12.5 gGolden virginia smooth 50 gGolden virginia smooth 25 gGolden virginia smooth 12.5 g
FIGURE 4 Nielsen data study 1: RYO SKUs compared with Amber Leaf SKUs, showing the pattern that was observed when other RYO SKUs were priced consistently above(e.g. Golden Virginia SKUs; blue lines), in-line with (e.g. Golden Virginia Smooth SKUs; light green lines) or below (e.g. Gold Leaf SKUs; dark green lines) the more traditionalRYO brand Amber Leaf (black lines). Note, all SKUs displayed were single, non-price-marked packs.
DOI:10.3310/phr08060
PUBLIC
HEA
LTHRESEA
RCH2020
VOL.8
NO.6
©Queen
’sPrinter
andController
ofHMSO
2020.This
work
was
producedby
Partoset
al.under
theterm
sof
acom
missioning
contractissued
bythe
Secretaryof
Statefor
Health
andSocialC
are.This
issuemay
befreely
reproducedfor
thepurposes
ofprivate
researchand
studyand
extracts(or
indeed,the
fullreport)may
beincluded
inprofessional
journalsprovided
thatsuitable
acknowledgem
entismade
andthe
reproductionisnot
associatedwith
anyform
ofadvertising.
Applications
forcom
mercialreproduction
shouldbe
addressedto:
NIHRJournals
Library,NationalInstitute
forHealth
Research,Evaluation,
Trialsand
StudiesCoordinating
Centre,
Alpha
House,
University
ofSoutham
ptonScience
Park,Southam
ptonSO
167N
S,UK.
41

differentiated. For FM families in the mid-price segment, the literature terms used could depend on whetherthe family was positioned as desirable because of cheaper pricing (resulting in some overlap with terms usedfor brand families in the value and subvalue segments), or for being more sophisticated than cheaper brands(resulting in the use of the term ‘premium’ in the literature). The greatest variation in literature terms wasseen for the FM brand families in the value and subvalue segments (although there was no overlap withterms used for the premium segment). For RYO tobacco, brand variants allocated to the premium and valueprice segments were clearly differentiated by price-related descriptors in the commercial literature. RYOvariants in the mid-price segment, however, could be described by low- or high-price terms, or a mixture.This often occurred when they were being compared with a differently priced brand variant in the samebrand family (e.g. Golden Virginia Smooth is ‘low priced’ compared with the original Golden Virginia brandvariant). By contrast, Marlboro RYO was described with high-priced descriptors, perhaps as a reflection of thepremium nature of the Marlboro brand overall.
Segmentation allocation of extra stock-keeping units based on industry pricing analysesSome additional SKUs that did not meet the inclusion criteria for the original segmentation analysis (seeTable 3), due to low market share, became valid when the Nielsen data sets were merged for the industrypricing analyses described in the following chapter (see also Chapter 2). These extra SKUs were allocatedto either the same price segment as their brand family (FM) or their brand variant (RYO). If this was notpossible, they were allocated to the segment that their price was closest to for the majority of the timethat the SKU was valid (e.g. FM Lucky Strike and RYO Turner SKUs). One brand, Swan, was excluded dueto extremely low pricing. It is possible that there was some confusion by retailers, given that some SwanRYO accessories are sold in packaging similar to cigarette packs; thus, Swan filter tips or rolling papers,for example, could have incorrectly been given a tobacco brand SKU (see Figures S1–S3 in ReportSupplementary Material 3 for illustrations of this allocation process).
TABLE 6 Nielsen data study 1: final allocation of FM cigarette brand families and RYO tobacco brand variants fromthe Nielsen data to price segments
Price segment FM cigarette brand families RYO tobacco brand variants
Premium Dunhill, Rothmans, Vogue Superslims, Embassy,Regal, B&H Gold, Camel, Park Drive, Silk Cut,Marlboro, Superkings (originally John PlayerSuperkings), Consulate, Rothmans, Solo,Superkings, More, Peter Stuyvesant, Players NavyCut, Senior Service, St Moritz, Woodbine
Amber leaf signature, B&H Gold, Drum, DrumAdditive Free, Drum Gold, Golden Virginia,Natural American Spirit, Old Holborn
Mid-price Club, Raffles, Natural American Spirit, L&B, B&HDual, B&H Silver, B&H White, B&H Black, VoguePerle, Craven A, Royals, Richmond, Mayfair,Sovereign (Black), Marlboro Bright Leaf, JPS Black,JPS White, Dorchester
Amber leaf, Amber Leaf Blonde, B&H Silver,Cutters Choice, Cutters Choice Extra Smooth,Cutters Choice Gold, Cutters Choice ExquisiteBlend, Cutters Choice A True Blend, GoldenVirginia Smooth, Marlboro Gold, Old HolbornYellow, Samson Virginia
Value Pall Mall, All JPS (except Black and White),Windsor (Blue), Ronson, Sterling, Winston,Specials, Maxim, B&H Blue, Sovereign Blue,L&B Blue, Chesterfield, Marlboro Touch
Ashford Gold Bright Virginia, Carlton, Gold Leaf,Holborn Smooth Taste, JPS Silver, Pall Mall, PlayersGold Leaf, Salsa (Virginia Blend), Sterling, ManitouGold, Pueblo, Rol, The Turner, Urban, PlayersVolume Tobacco
Subvalue Rothmans of London, Carlton, Players, Allure,Rothmans Blend 55
Wholesaler orretailer brands
Balmoral, Beaumont, Goldmark, Kingsmen,Londis, No. 3, Park Road, Red Band, Select,Silver Strand, Sky
Private Label, Red Band
B&H, Benson & Hedges.
TOBACCO INDUSTRY PRICING STRATEGIES AND PRICE SEGMENTATION OF THE UK TOBACCO MARKET
NIHR Journals Library www.journalslibrary.nihr.ac.uk
42

Allocation of factory-made cigarette brands in the ITC data to price segmentsAnalysis of the ITC data set included exploring how smokers moved between FM cigarette price segments(see Chapter 6). Thus, we needed to know the price segment of the brands that ITC respondents reportedsmoking. For ITC participants surveyed prior to November 2008 (see Table 4), when Nielsen data fromthis current study became available, we used PPACTE classifications to allocate brands to price segments.Some brands recorded by ITC respondents did not appear in the Nielsen data and were allocated to thesegment in which their price fell (i.e. allocated by price not brand). Price boundaries for each segmenthad to be recalculated slightly for this purpose, because ITC does not differentiate between price-markedand non-price-marked packs. It was necessary to develop some new exclusion criteria to recalculate theprice boundaries. In addition to the usual exclusions (SKUs with market share ≤ 0.05%, packs containing< 17 sticks or > 20 sticks, retailer and wholesaler brands, cartons and all Berkeley SKUs), we excluded allChesterfield, Marlboro Touch and Mayfair Green superking 20-stick pack SKUs when recalculating the priceboundaries. Some further SKUs were partially excluded in some months only, due to anomalous pricingin visual analysis of the boundaries (see Table S4 in Report Supplementary Material 2). Unlike the originalNielsen segment analyses, we included price-marked packs. Wholesaler and retailer brands could not beincluded in the Nielsen analysis because they were distributed only to a small selection of stores. Suchbrands appeared in the ITC data, so tentative boundaries from the Nielsen data were also provided forthese (they tended to be priced lower than other products). The final price segment boundaries used forITC brand allocation are provided in Figure 5.
0.50
0.45
0.40
Time point
Price segment
0.35
Pric
e p
er s
tick
(£)
0.30
0.25
0.20
Januar
y 200
9
April 20
09 b
udget
July
2009
Januar
y 201
0 VAT c
hange
Januar
y 201
1 VAT c
hange
Mar
ch 20
10 b
udget
Mar
ch 20
11 b
udget
Mar
ch 20
12 b
udget
July
2010
July
2011
July
2012
July
2013
July
2014
July
2015
Febru
ary 2
016
Januar
y 201
2
Mar
ch 20
13 b
udget
Januar
y 201
3
Mar
ch 20
15 b
udget
Januar
y 201
5
Mar
ch 20
14 b
udget
Januar
y 201
4
PremiumMid-priceValueSubvalue
FIGURE 5 Nielsen price boundaries used for ITC brand allocation of FM cigarettes to price segments (used in ITCstudies 3–5). Note, that for some ITC analyses the value and subvalue segments were combined.
DOI: 10.3310/phr08060 PUBLIC HEALTH RESEARCH 2020 VOL. 8 NO. 6
© Queen’s Printer and Controller of HMSO 2020. This work was produced by Partos et al. under the terms of a commissioning contract issued by the Secretary of State for Healthand Social Care. This issue may be freely reproduced for the purposes of private research and study and extracts (or indeed, the full report) may be included in professionaljournals provided that suitable acknowledgement is made and the reproduction is not associated with any form of advertising. Applications for commercial reproduction shouldbe addressed to: NIHR Journals Library, National Institute for Health Research, Evaluation, Trials and Studies Coordinating Centre, Alpha House, University of Southampton SciencePark, Southampton SO16 7NS, UK.
43

Summary
To the best of our knowledge, this is the first study to provide a comprehensive overview of TI pricingstrategies in both the FM and RYO markets. The commercial literature review indicated that low-priced FMand RYO tobacco products remained available throughout the study period via various pricing strategies,including launching new cheaper products; locking down the price of certain products through price marking;introducing smaller packs; and undershifting to ensure smaller price increases in the cheaper segments.
Our analysis of TI price segmentation indicated that, although the industry employed numerous price-relatedterms for its products, for practical purposes these could be summarised in four segments for FM cigarettes(namely, premium, mid-price, value and subvalue) and three segments for RYO tobacco (premium, mid-priceand value). This information was used in our subsequent ITC studies to allocate smokers’ FM cigarettes toprice segments.
TOBACCO INDUSTRY PRICING STRATEGIES AND PRICE SEGMENTATION OF THE UK TOBACCO MARKET
NIHR Journals Library www.journalslibrary.nihr.ac.uk
44

Chapter 4 What smokers pay for their tobacco
Introduction
In this chapter we examine patterns of use of cheap, legal tobacco products by smokers. Our analysescomprise an assessment of what smokers pay for their tobacco using ITC data (2002–14 for FM and2005–14 for RYO) and an examination of Nielsen data (2009–15).
ITC data study 1: prices paid for tobacco by smokers over time
IntroductionHere we assess UK smokers’ store-based tobacco purchase costs over time. As described in Chapter 2(see also Chapter 6), these are assumed to be legal, fully taxed purchases. During the study period,2002–14, ITC data suggested that most (≥ 80%) tobacco purchases were from UK store-based sources.The most common source of tobacco purchases changed from convenience stores to supermarkets overthe study period, which presumably conferred price savings. We compare purchase costs of FM-P, FM-Cand RYO tobacco in order to understand possibilities for price savings, which could be undertaken as analternative to quitting.
Methods
DataWe used the first 10 surveys of the ITC UK data (2002–14) for FM purchases and six surveys for RYOtobacco purchases (surveys 5–10, spanning 2005–14). At each survey, we included only responses fromparticipants who were smoking at least monthly at the time. Participants were excluded if they had datamissing on any variables relating to their last tobacco purchase (Table 7). This was generally minimal;however, a relatively large proportion of responses were excluded due to missing (2.3–5.2% per survey)or improbable (1.0–3.7% per survey, see Chapter 2) responses for price. Data were pooled over all surveys,so participants who had provided valid data on some surveys were excluded from other surveys if they hadstopped smoking (8.0%), had missing data (0.6%) or were lost to follow-up (25.5%). This resulted in afinal sample size of 6169 participants who provided 15,812 responses overall [each individual participatedin, on average, 2.6 surveys (SD 2.0 surveys)].
Sample characteristics are shown in Table 7. A comparison of the included sample with the excludedsample indicated some differences. Those excluded were more likely to use cheap tobacco, suggestingthat prices, particularly for the non-UK/non-store sources, may be overestimates.
AnalysesGeneralised estimating equations were used to test for linear trends in the prices paid for each producttype, via clustered linear regression analyses, using a Gaussian distribution with an identity link function andunstructured correlation matrix (or exchangeable if unstructured failed to converge). We pooled responsesfrom all surveys and GEE controls for correlated responses resulting from the same individual providing dataat multiple surveys. Data were weighted using ITC cross-sectional weights for representativeness of age, sexand geographical region, as the intention was to observe population trends rather than conduct predictiveanalyses. All prices were adjusted to 2014 values using CPI data.126
DOI: 10.3310/phr08060 PUBLIC HEALTH RESEARCH 2020 VOL. 8 NO. 6
© Queen’s Printer and Controller of HMSO 2020. This work was produced by Partos et al. under the terms of a commissioning contract issued by the Secretary of State for Healthand Social Care. This issue may be freely reproduced for the purposes of private research and study and extracts (or indeed, the full report) may be included in professionaljournals provided that suitable acknowledgement is made and the reproduction is not associated with any form of advertising. Applications for commercial reproduction shouldbe addressed to: NIHR Journals Library, National Institute for Health Research, Evaluation, Trials and Studies Coordinating Centre, Alpha House, University of Southampton SciencePark, Southampton SO16 7NS, UK.
45

ResultsThe real price (base year 2014) of all product types purchased increased significantly during the study period:prices remained relatively unchanged up until 2010, but increased thereafter (Figure 6). The real price perstick for both FM-P and FM-C increased by only £0.10 from 2002 to 2014. For FM-P, median prices per stickincreased from £0.27 to £0.37. FM-C were typically £0.01 to £0.02 cheaper per stick. The median price perstick of RYO tobacco increased by only £0.05, from £0.12 in 2005 to £0.17 in 2014.
TABLE 7 International Tobacco Control Policy Evaluation Project data study 1: unweighted sample characteristicsby survey wave
Participant characteristics
ITC UK survey number
1 2 3 4 5 6 7 8 9 10
Met selection criteria (n) 2367 1914 1831 1727 1690 1636 1474 960 1096 1117
Sex (%)
Female 56.6 55.4 55.8 57.2 57.2 57.4 55.8 55.3 51.0 52.9
Male 43.4 44.6 44.2 42.9 42.8 42.6 44.2 44.7 49.0 47.1
Age group (years) (%)
18–24 8.5 6.4 5.0 4.4 4.7 4.8 3.7 2.6 4.2 3.0
25–39 32.2 29.6 27.7 26.0 24.6 24.4 20.8 14.4 21.4 21.6
40–54 33.9 36.3 37.8 38.6 36.6 36.7 35.7 37.0 34.0 33.4
≥ 55 25.4 27.6 29.5 31.0 34.1 34.2 39.8 46.0 40.3 42.1
Geographical region (%)
London 13.4 13.3 12.3 12.1 13.3 13.1 11.5 11.8 10.3 10.8
Yorkshire and The Humber 8.8 8.6 8.6 8.9 8.1 7.1 6.7 7.0 7.5 7.6
East Midlands 6.8 7.0 7.7 7.1 7.0 7.3 8.0 7.2 6.7 6.8
Eastern 8.5 8.3 8.8 8.9 7.9 8.2 7.6 8.9 9.6 9.8
North East 4.7 4.6 4.6 5.0 4.9 4.6 4.3 4.1 4.3 4.5
South East 13.7 14.0 13.9 13.1 13.3 13.2 13.1 14.3 13.1 13.5
South West 7.7 8.1 7.4 8.1 8.4 8.3 9.4 8.4 7.9 8.2
West Midlands 8.5 8.9 8.7 8.1 7.7 8.7 8.6 8.3 9.5 8.0
North West 10.6 10.6 10.9 10.9 10.1 9.7 9.4 9.2 11.0 11.5
Wales 5.0 4.7 4.6 5.3 5.9 5.9 6.7 6.5 5.8 5.9
Scotland 9.9 10.0 10.2 10.1 10.9 10.7 11.5 12.0 11.0 10.7
Northern Ireland 2.3 2.0 2.5 2.5 2.6 3.2 3.2 2.5 3.5 2.8
Missing data (%)
Usually smokes FM or RYO 0.04 0.21 0.05 0.23 0.00 0.00 0.14 1.98 0.00 0.18
Carton purchases 2.15 2.09 0.82 0.69 0.47 3.73 0.95 4.48 2.55 2.24
Purchase source 0.46 0.78 0.16 0.17 0.53 0.79 0.61 0.21 1.55 1.52
Price missing/excluded 7.73 4.86 3.77 5.44 5.21 8.13 6.17 8.75 16.97 17.64
All valid (complete cases) 90.5 93.8 96.0 94.3 94.0 91.1 93.6 91.0 82.2 81.7
NoteMissing data + complete cases do not sum to 100% because it was possible for participants to have data missing on morethan one variable.
WHAT SMOKERS PAY FOR THEIR TOBACCO
NIHR Journals Library www.journalslibrary.nihr.ac.uk
46

The range of prices differed by product type, but FM-P/FM-C and RYO smokers in 2014 were able to buythe same type of product at real prices similar to 2002 and 2005, respectively. The price range for FM-Pwas relatively narrow and changed little over time: £0.12 per stick in 2002 to £0.13 in 2010; then £0.16in 2013 to £0.23 in 2014, when an increase in the highest price and a decrease in the lowest price wasevident. The price range for FM-C was wider and more variable, despite median prices being similar toFM-P, ranging between £0.19 and £0.27 per stick in most years, but £0.37 in 2007 and £0.45 in 2014.The price range for RYO tobacco changed little over time, from £0.10 per stick in 2005 to £0.12 in 2014.FM-P prices were evenly distributed over the range, whereas RYO prices were negatively skewed, withgreater variation at the cheaper (below median) end.
LimitationsNo data were collected for most of 2011 and all of 2012. Hence, we are unable to comment on changesspecific to this period and this might overestimate the linear nature of the trends observed over time.However, the large size of the data set does give some confidence in the observations reported. Somestore-based purchases might be ‘under the counter’ and hence tax evasion, but we minimised thispossibility by excluding very low prices paid from UK store-based sources. To be included in the study,participants had to be current smokers, so our procedure meant that quitters were progressively excluded
Pric
e p
er s
tick
(0.
50 g
of
tob
acco
per
RY
O s
tick
) (£
) 0.60
0.50
0.40
0.30
0.20
0.10
0.00
2002 2003 2004
Time point
2005 2006 2007 2008 2009a 2010 2011a 2012a 2013 2014
FM-P
RYO
(a)
(b)
2002 2003 2004 2005 2006 2007 2008 2009a 2010 2011a 2012a 2013 2014
0.60
0.50
0.40
0.30
Pric
e p
er s
tick
(£)
0.20
0.10
0.00
Time point
FIGURE 6 International Tobacco Control Policy Evaluation Project data study 1: weighted median prices (black lines)and 95% ranges (shaded areas: top and bottom 2.5% excluded) of (a) FM-P and RYO tobacco; and (b) FM-C purchasedfrom UK store-based sources only. Blue lines indicate 25th and 75th percentiles. All prices are adjusted to 2014 values(base year= 2014) and based on the most recent reported tobacco purchase. a, No data collected for this year.
DOI: 10.3310/phr08060 PUBLIC HEALTH RESEARCH 2020 VOL. 8 NO. 6
© Queen’s Printer and Controller of HMSO 2020. This work was produced by Partos et al. under the terms of a commissioning contract issued by the Secretary of State for Healthand Social Care. This issue may be freely reproduced for the purposes of private research and study and extracts (or indeed, the full report) may be included in professionaljournals provided that suitable acknowledgement is made and the reproduction is not associated with any form of advertising. Applications for commercial reproduction shouldbe addressed to: NIHR Journals Library, National Institute for Health Research, Evaluation, Trials and Studies Coordinating Centre, Alpha House, University of Southampton SciencePark, Southampton SO16 7NS, UK.
47

from the analysis. However, the missing data analysis also suggested that users of cheap tobacco (whoother research has shown may be less likely to quit54–56,59) were more likely to be excluded. Thus, it ispossible that these two effects balance each other to some extent. The ITC survey is replenished at eachwave with a representative sample of current smokers, to minimise attrition effects. We therefore think it isunlikely that the observed trends are due to attrition.
ImplicationsChanging between product types would have saved money (e.g. purchasing FM-C rather than FM-P wouldtypically confer a saving of £0.01–0.02 per stick on the median price). Switching to RYO conferred thelargest savings, a 0.5-g stick being typically less than half the price (around £0.18 cheaper) of one FM-Pcigarette. This means that a saving of about £750 per year could be made for the average UK smokersmoking around 11.4 CPD,217 by switching from FM-P to RYO.
Changing within product types (to different brands) also saved money. The price range between the cheapestand most expensive FM-C products purchased was consistently wide and, from around 2010 onwards, theprice range of FM-P products also widened markedly. These findings suggest that the TI strategy of overshiftingprices on premium and undershifting prices on cheaper products was becoming more aggressive in the UK.In contrast, the observed price range for RYO tobacco was disproportionate, due to more variation in thecheap prices, suggesting that TI undershifting may be particularly relevant within the RYO tobacco market.
In relation to the influence of tobacco taxation, from 2011 onwards, when tobacco duty was higher than inprevious years (at 2–5% above inflation; see Table 1), there was a greater increase in the prices of purchasedtobacco products. However, even when assuming that this was a causal relationship, these tax increasesdid not substantially impact real prices, did not prevent a widening price range between cheapest and mostexpensive FM-P products, and made little impact on the lowest price paid for RYO tobacco. Hence, althoughthere was a statistically significant increase in real price paid over the study period, this was not substantial.
Summary of ITC data on tobacco pricesThe real price paid by smokers changed little over time, despite taxation changes. For some smokers, it waspossible that the prices they were paying for their tobacco from licit sources in 2014 had not changed inreal terms compared with 2002. Tobacco taxation had not prevented the success of the TI strategy ofwidening the price range between expensive and cheap products.
Although the ITC data were able to tell us about the range of available prices, there were too few cases tobreak down tobacco products into detailed price segments for both FM and RYO. In addition, insufficientdetail was available on products purchased to understand fully how the wide variation in prices wasachieved. Nielsen tobacco sales data were used for these purposes.
Nielsen data study 2: tobacco industry pricing strategies
The more detailed data from the Nielsen sales data set, compared with ITC, allowed both FM and RYOto be split into price segments. SKUs were allocated to price segments, and price segment labels wereidentified based on the commercial literature review and an analysis of their relative pricing each month,as outlined in Chapter 3. As stated in Chapter 2, cartons had to be excluded from the analysis, as theywere not sufficiently widely sold for Nielsen to provide reliable estimates of pricing.
Analysis
Weighted average real pricesFor theses analyses, monthly weighted average real prices (base year 2014) were calculated by weighting forvolumes (FM sticks or 0.5-g stick equivalents of RYO tobacco) sold and adjusting for inflation using the CPI.218
We used volumes of sticks, rather than packs, sold because pack sizes varied by SKUs and changed over time.
WHAT SMOKERS PAY FOR THEIR TOBACCO
NIHR Journals Library www.journalslibrary.nihr.ac.uk
48

For every month, for each SKU that reached valid market share (see Chapter 2), we multiplied the real priceper stick by the volume sold. We then summed these amounts [Σ(real prices × volumes)] for all SKUs within asegment and divided by the total volume of all SKU sold within that segment, to obtain a weighted averagereal price for that segment in that month. This basic procedure could be adapted, for example to create WAPsper pack instead of per segment, or to create prices for different pack sizes or compare price-marked SKUswith non-price-marked SKUs within each segment.
Pack size and price markingTo examine changes in pack size over time, we identified popular pack sizes and calculated the marketshare by pack size for each segment annually over the study period. We explored patterns in the useof price marking by calculating the percentage of price-marked packs by segment and pack size eachmonth. We also calculated real WAPs (as above), and the percentage difference between the prices ofprice-marked and non-price-marked packs in each segment.
Impact of the 2011 Budget on roll-your-own tobacco pricingTo understand whether or not the 2011 Budget was successful in its objective of raising RYO tobaccoprices (via an additional 10% increase in RYO tobacco taxation, as well as a shift towards greater specifictaxation; see Chapter 1), we compared the median monthly price rise in each RYO segment immediatelyafter the 2011 Budget enactment with median monthly price rises immediately following the other Budgetenactments, and across the data series as a whole.
Results
Price per stickWhen comparing prices per stick, RYO sticks were considerably cheaper than FM sticks (Figure 7, and seealso Table S5 in Report Supplementary Material 2). Over the study period, the price range between cheapestand most expensive price segments widened. For RYO sticks, from £0.02 to £0.03 per stick and for FM sticksfrom £0.07 to £0.10 per stick. This reflected smaller price increases in the cheaper segments. However, priceincreases were seen in every segment, suggesting that the fall in price of subvalue packs (see Price per pack)was attributable to the declining number of sticks per pack. Prices per stick also increased much faster amongFM cigarettes than RYO tobacco, with the exception of the subvalue FM segment.
Price per packThe prices per pack of FM and RYO products in the premium and mid-price segments were similar (see Figure 7and see also Table S5 in Report Supplementary Material 2), whereas the price of the value RYO packs wasconsiderably lower than that of value FM packs. Around the time of the 2011 RYO tobacco tax increase, theprice per pack of the RYO premium and mid-priced segments began to follow the respective FM pack prices,rather than being cheaper. The gap between value FM and RYO packs also narrowed at this time, but hadwidened again by the end of the data series. Overall, the range between the pack prices in the highest(FM premium) and lowest (RYO value) priced segments grew over time (£1.74 in January 2009 to £2.48 inDecember 2015).
Across the data series as a whole, the range in prices per pack between the most and least expensiveproducts within both FM cigarettes and RYO tobacco increased. This was particularly so since 2012/13 andwas largely due to stagnation in the price of the cheapest products. From January 2013 to December 2015,the real prices of the FM subvalue products fell £0.07 and RYO value packs increased by only £0.02, whereasthe prices of premium FM and RYO products increased by £1.09 and £1.16, respectively.
Impact of the 2011 Budget on roll-your-own tobacco pricingAfter the 2011 Budget, the gap between the FM premium and FM value segments declined from a high of£0.08 per stick in January 2011 to £0.07 in February 2012. At this point, the subvalue segment brandsbegan to be introduced. Moreover, prices per stick of all three RYO segments increased by their highestamount after the 2011 Budget: premium increased £0.72, mid-price increased £0.65 and value increased£0.42 in April 2011, compared with median monthly rises of £0.03, £0.04 and £0.03, respectively, overall,and median monthly post-Budget rises of £0.20, £0.19 and £0.07, respectively, in the rest of the data period.
DOI: 10.3310/phr08060 PUBLIC HEALTH RESEARCH 2020 VOL. 8 NO. 6
© Queen’s Printer and Controller of HMSO 2020. This work was produced by Partos et al. under the terms of a commissioning contract issued by the Secretary of State for Healthand Social Care. This issue may be freely reproduced for the purposes of private research and study and extracts (or indeed, the full report) may be included in professionaljournals provided that suitable acknowledgement is made and the reproduction is not associated with any form of advertising. Applications for commercial reproduction shouldbe addressed to: NIHR Journals Library, National Institute for Health Research, Evaluation, Trials and Studies Coordinating Centre, Alpha House, University of Southampton SciencePark, Southampton SO16 7NS, UK.
49

Factory-made cigarette pack sizeThe variety of FM pack sizes increased over the study period, with the introduction of increasingly smallerpack sizes (17- to 19-stick packs) to an increasing number of brands (Table 8 and see also Figure S4 inReport Supplementary Material 3). Market share of traditional FM 20-stick packs declined in all segments,but most markedly in the value and subvalue segments, in which, by 2015, only 1% and 0% of volume,respectively, were 20-stick packs. By 2015, the pack size with the largest share was 18 sticks for thesubvalue segment (46% FM share), 19 sticks for the value segment (45%) and 10 sticks for the mid-pricesegment (45%).
0.50
Time point
(a)
0.45
0.40
0.35
0.30Pr
ice
per
sti
ck (
£)
0.25
0.20
0.15
0.10
0.05
0.00
Novem
ber 20
08
June 2
009
Januar
y 201
0
August 20
10
Mar
ch 20
11
October
2011
May
2012
Decem
ber 20
12
July
2013
Febru
ary 2
014
Septe
mber
2014
April 20
15
Novem
ber 20
15
FM premiumFM mid-priceFM valueFM subvalueRYO premiumRYO mid-priceRYO value
(b)
Pric
e p
er p
ack
(£)
8.00
7.00
6.00
5.00
4.00
3.00
2.00
1.00
Time point
0.00
Novem
ber 20
08
June 2
009
Januar
y 201
0
August 20
10
Mar
ch 20
11
October
2011
May
2012
Decem
ber 20
12
July
2013
Febru
ary 2
014
Septe
mber
2014
April 20
15
Novem
ber 20
15
FM premiumFM mid-priceFM valueFM subvalueRYO premiumRYO mid-priceRYO value
FIGURE 7 Nielsen data study 2: weighted average real prices (base year= 2014). (a) Per stick; and (b) per pack forFM cigarettes and RYO tobacco in different price segments, over time. Data are for all pack sizes combined (cartonsexcluded). Note, the price of FM subvalue packs appears unstable initially as different pack sizes were introduced.
WHAT SMOKERS PAY FOR THEIR TOBACCO
NIHR Journals Library www.journalslibrary.nihr.ac.uk
50

TABLE 8 Nielsen data study 2: annual volumes of pack sales (millions) and market share for FM cigarettes and RYOtobacco, by price segment and pack size
Price segmentand pack size
Pack sales (millions) Market share (%)a
2009 2010 2011 2012 2013 2014 2015 2009 2010 2011 2012 2013 2014 2015
FM cigarettes
Premium
10 sticks 215 187 171 154 140 130 108 36 35 37 38 38 39 39
20 sticks 386 341 291 254 225 201 171 64 65 63 62 62 61 61
Mid-price
10 sticks 504 468 428 376 338 290 227 41 42 43 45 46 46 45
19 sticks 112 166 0 0 0 0 0 18 33
20 sticks 728 658 565 467 404 227 112 59 58 57 55 54 36 22
Value
10 sticks 79 122 185 220 236 253 231 27 28 32 34 35 35 33
17 sticks 18 0 0 0 0 0 0 3
18 sticks 1 5 135 0 0 0 0 0 1 19
19 sticks 12 43 60 75 107 324 316 4 10 10 11 16 45 45
20 sticks 197 264 336 357 329 140 8 68 61 58 55 49 19 1
Subvalue
10 sticks 3 17 39 67 20 24 23 25
18 sticks 14 122 0 0 8 46
19 sticks 18 106 77 0 26 64 29
20 sticks 13 35 7 < 1 80 49 4 0
RYO tobacco
Premium
10 g < 1 1 0 0 0 0 0 1 1
12.5 g 79 73 67 58 51 44 37 62 60 60 60 59 57 54
25 g 39 37 33 29 26 24 23 30 31 30 30 30 32 34
50 g 10 11 10 9 9 8 7 8 9 9 10 10 11 11
Mid-price
10 g 1 2 2 4 6 13 25 1 2 2 2 4 8 17
12.5 g 70 86 102 107 110 98 76 72 69 68 66 64 60 51
25 g 20 28 36 39 42 40 37 21 23 24 24 25 25 25
50 g 6 8 11 13 13 12 12 6 7 7 8 8 7 8
Value
10 g 5 13 9 0 0 0 0 9 24 21
12.5 g < 1 8 20 28 32 28 17 82 77 75 71 61 50 42
25 g < 1 2 6 10 13 12 11 2 21 22 24 24 22 28
50 g < 1 < 1 1 2 3 3 4 16 3 3 5 5 5 9
a Market share is calculated within each tobacco type (FM or RYO), not total tobacco market share.
DOI: 10.3310/phr08060 PUBLIC HEALTH RESEARCH 2020 VOL. 8 NO. 6
© Queen’s Printer and Controller of HMSO 2020. This work was produced by Partos et al. under the terms of a commissioning contract issued by the Secretary of State for Healthand Social Care. This issue may be freely reproduced for the purposes of private research and study and extracts (or indeed, the full report) may be included in professionaljournals provided that suitable acknowledgement is made and the reproduction is not associated with any form of advertising. Applications for commercial reproduction shouldbe addressed to: NIHR Journals Library, National Institute for Health Research, Evaluation, Trials and Studies Coordinating Centre, Alpha House, University of Southampton SciencePark, Southampton SO16 7NS, UK.
51

Roll-your-own tobacco pack sizeThe most notable change in the RYO tobacco segment was the gradual advent of smaller, 10-g packs(see Table 8 and see also Figure S5 in Report Supplementary Material 3), particularly in the mid-price andvalue segments. For example, RYO mid-price 10-g packs increased from a 1% to a 17% RYO tobaccomarket share between 2009 and 2015. Throughout the study period, 12.5-g packs held the largest marketshare in all RYO tobacco segments, but over time this fell (e.g. RYO premium 12.5-g tobacco packs declinedfrom 62% market share in 2009 to 54% in 2015). Generally, the market share of the largest pack size(50 g) grew slightly over the study period. For example, RYO premium 50-g tobacco packs increased from8% RYO tobacco market share in 2009 to 11% in 2015.
Prices by pack size (Table 9) demonstrate higher increases in the higher price segments and that the growth insmaller packs enabled price-conscious smokers to choose to spend a smaller amount on tobacco rather than quit.
Price markingCheaper segments were more likely to be price marked than expensive segments (Figure 8 and see alsoTable S6 in Report Supplementary Material 2). For example, between 60% and 100% of subvalue FMproducts were price marked compared with a negligible proportion of premium FM products. Patterns forRYO products were similar, although a higher proportion of premium RYO products were price markedthan premium FM products (36% in 2012 and about 25% thereafter). Half of RYO value products wereprice marked.
For RYO tobacco, but not FM cigarettes, smaller packs were also more likely to be price marked than largerpacks (see Figure 8 and see also Table S7 in Report Supplementary Material 2). For most segments and packsizes, price marking appeared to increase gradually over time. However, there were notable exceptions to thispattern. When the new subvalue FM brands were introduced in early 2012, 100% were price marked but thisthen fell rapidly to between 60% and 70%. There was substantial price marking of 10-g RYO packs prior togrowth in the mid-price segment (2011) and when 10-g packs were introduced into the value segment (2013).In addition, price marking on premium brands in both FM and RYO segments fell.
Differences between the prices of price-marked and standard packs varied over time and between segments;however, price-marked packs were typically cheaper (see Table S8 in Report Supplementary Material 2).Overall, the increasing availability of price-marked products enabled the TI to sell products at lower prices,albeit compromising convenience store profit margins.
Tobacco industry pricing conclusionsTobacco sales and ITC data indicated that, although overall tobacco prices increased, the cheapest productsdid not increase in price in real terms. The data sets also revealed types of tobacco products with cheaperpricing: RYO tobacco (all data sets); cartons (ITC data); and mid-price, value and subvalue FM cigarettes,mid-price and value RYO tobacco, price-marked packs and small packs (Nielsen data). The availability ofcheap tobacco products that did not increase in price in real terms helps explain why smokers could stillpurchase their tobacco at prices similar to those at the beginning of our study period in 2002 and alsothe role of RYO tobacco in keeping the cost of smoking low. In the following section, we explore how theTI uses its pricing strategies to respond to tobacco taxation changes.
Nielsen data study 3: what proportion of price increases by segment areexplained by tobacco industry price increases compared with tax increases?
Methods
Calculation of net revenueNet revenue per pack (the money the industry retains after tax) was calculated by deducting the sum ofthe tobacco taxes (specific plus, for FM only, ad valorem) and VAT applicable to each pack from thenominal pack price and then adjusting for inflation using the CPI (base year = 2014). We note that ‘net’
WHAT SMOKERS PAY FOR THEIR TOBACCO
NIHR Journals Library www.journalslibrary.nihr.ac.uk
52

revenue in this study refers only to the revenue after taxes are paid, but other costs (e.g. production,distribution and marketing costs) have not been deducted.
The three taxes (value-added, specific and ad valorem) were calculated as follows. An example value-addedtax calculation for each month is provided for months during which the value-added tax was 20%:
Pack price� (pack price/1.2). (4)
TABLE 9 Nielsen data study 2: weighted average real prices (base year = 2014) per pack over time for FM cigarettesand RYO tobacco, by price segment and pack size
Price segmentand pack size
Time point, price per pack (£)
Mean yearly percent changea
January2009
January2010
January2011
January2010
January2013
January2014
January2015
December2015
FM cigarettes
Premium
10 sticks 3.02 3.12 3.25 3.41 3.63 3.86 4.23 4.39 5.80
17–20 sticks 5.75 5.95 6.18 6.47 6.89 7.33 7.93 8.18 5.52
Mid-price
10 sticks 2.61 2.69 2.81 3.03 3.25 3.43 3.69 3.85 5.96
17–20 sticks 4.97 5.14 5.37 5.76 6.16 6.49 6.69 6.91 5.09
Value
10 sticks 2.28 2.25 2.39 2.68 2.93 3.08 3.31 3.44 6.49
17–20 sticks 4.32 4.40 4.62 5.13 5.52 5.77 5.89 5.87 5.35
Subvalue
10 sticks 2.71 2.80 2.87 2.89 2.91
17–20 sticks 5.24 5.23 5.26 5.33 0.19
RYO tobacco
Premium
10 g 3.21 3.33
12.5 g 2.95 3.06 3.17 3.47 3.68 3.87 4.15 4.31 5.87
25 g 5.80 5.96 6.15 6.73 7.13 7.49 7.91 8.16 5.33
50 g 11.29 11.22 12.02 13.13 14.00 14.69 15.52 16.00 5.49
Mid-price
10 g 2.23 2.37 2.30 2.60 2.71 2.91 3.08 3.26 5.64
12.5 g 2.70 2.79 2.89 3.24 3.44 3.61 3.84 3.98 6.09
25 g 5.25 5.40 5.60 6.25 6.66 6.99 7.38 7.60 5.88
50 g 10.21 10.54 10.97 12.21 13.04 13.71 14.51 14.96 6.06
Value
10 g 2.57 2.70 2.77 5.06
12.5 g 2.69 2.56 2.70 2.99 3.14 3.24 3.46 3.54 4.39
25 g 5.21 5.79 6.05 6.24 6.58 6.69 6.05
50 g 7.49 9.43 10.55 11.63 12.18 12.83 13.02 11.62
a For comparability across product types, price segments and pack sizes, mean yearly per cent changes were obtainedby first calculating each year-on-year per cent change for the time-period when the product was available, and thendividing by the total number of changes (note, the January 2015 to December 2015 change was excluded becauseit did not encompass an entire year).
DOI: 10.3310/phr08060 PUBLIC HEALTH RESEARCH 2020 VOL. 8 NO. 6
© Queen’s Printer and Controller of HMSO 2020. This work was produced by Partos et al. under the terms of a commissioning contract issued by the Secretary of State for Healthand Social Care. This issue may be freely reproduced for the purposes of private research and study and extracts (or indeed, the full report) may be included in professionaljournals provided that suitable acknowledgement is made and the reproduction is not associated with any form of advertising. Applications for commercial reproduction shouldbe addressed to: NIHR Journals Library, National Institute for Health Research, Evaluation, Trials and Studies Coordinating Centre, Alpha House, University of Southampton SciencePark, Southampton SO16 7NS, UK.
53

For the months during which the value-added tax was 17.5% or 15%, the pack price was divided by 1.175 or1.15, respectively. Specific taxes were calculated as the applicable rate per FM stick or gram of RYO tobacco(reported rates divided by 1000; see Table 1) each month, multiplied by the pack size (FM sticks or RYOtobacco grams). The HMRC calculate one ad valorem rate for each FM brand,111 which is calculated using theRRP of 20-stick packs and then applied proportionately to different pack sizes.93 Price-marked packs do notattract a separate tax rate.99 This raised some issues when using the Nielsen data, particularly from 2014onwards. First, some 20-stick packs were being sold very cheaply (cheaper than 19-stick packs), implying thatthe sales price was well below the RRP. Second, 43 (12%) FM brands in the data set never had a recorded20-stick variant and others lost their 20-stick variant (it was possible that a 20-stick variant might have existedbut had been excluded due to insufficient market share). For our ad valorem calculation, we thereforerestricted the analysis to the most common pack sizes (10 sticks and 17–20 sticks) and, hence, 20 sticks shouldhave been the most expensive if they were sold at the RRP. We then identified which was the most expensivebrand variant each month for each brand and pack size, and if this was the 20-stick pack then we used thisprice to calculate ad valorem. If not the 20-stick pack, but there was a 20-stick variant available within the
100
(a)Pe
rcen
tag
e
80
60
40
20
0
August 20
11
Novem
ber 20
11
Febru
ary 2
012
Novem
ber 20
12
Febru
ary 2
013
May
2012
August 20
12
Novem
ber 20
15
Febru
ary 2
016
May
2015
August 20
15
Febru
ary 2
014
Novem
ber 20
14
Febru
ary 2
015
May
2014
August 20
14
Novem
ber 20
13
May
2013
August 20
13
FM premiumFM mid-priceFM valueFM subvalueRYO premiumRYO mid-priceRYO value
100
(b)
Perc
enta
ge
80
60
40
20
0
August 20
11
Novem
ber 20
11
Febru
ary 2
012
Novem
ber 20
12
Febru
ary 2
013
May
2012
August 20
12
Novem
ber 20
15
Febru
ary 2
016
May
2015
August 20
15
Febru
ary 2
014
Novem
ber 20
14
Febru
ary 2
015
May
2014
August 20
14
Novem
ber 20
13
May
2013
August 20
13
RYO 10 gRYO 12.5 gRYO 25 gRYO 50 g
FIGURE 8 Nielsen data study 2: percentage of packs price marked by (a) segment for FM cigarettes and RYOtobacco; and (b) pack size for RYO tobacco. Nielsen data on price marking was only available from August 2011.
WHAT SMOKERS PAY FOR THEIR TOBACCO
NIHR Journals Library www.journalslibrary.nihr.ac.uk
54

data, we imputed the pack price of an imaginary 20-stick variant using the price of the highest pricedavailable variant and used this imputed price to calculate the ad valorem tax. Each brand’s ad valorem taxwas then calculated by the pack price multiplied by the applicable monthly ad valorem rate. For packs with< 20 sticks, ad valorem tax was calculated pro rata to the 20-stick equivalent.
Tax pass through by segmentNet revenue (in pence) for all pack sizes was plotted graphically by year and segment to examine patternsover time. Similar patterns were observed across the different pack sizes; hence, only changes in revenuefor popular pack sizes (20 sticks for FM premium and mid-price FM cigarettes, 19 sticks for FM value andsubvalue FM cigarettes, and 12.5 g for RYO tobacco) are discussed.
To assess the extent to which taxes were passed to consumers following each Budget and how this variedin relation to segment and size of tax increase, we estimated the change in net revenue. The net revenueper pack for the month immediately prior to the tax increase was subtracted from the net revenue for thesubsequent months (up to the next Budget).
Calculating source of price risesWe calculated [by product type (RYO or FM) and price segment] the proportion of the pack price changeattributable to tax increases compared with industry pricing for two 3-year time periods: 2010–12 and2013–15. The former time period included unexpected large tax increases and a change in tax structuretowards specific taxes, whereas in the latter time period there were regular but smaller tax increases thatwere set years in advance.
January 2013–December 2015We calculated percentages of the total price change that were due to government tax rises and industryrevenue for the popular pack types used in the analysis of tax undershifting and overshifting. We determinedthe increase in WAPs across the time period by subtracting the real weighted price in January 2013 from theprice in December 2015. The difference between the change in price and the change in tax liability was thechange in industry net revenue. We were then able to calculate the percentage of the total price increasethat was from government tax and industry revenue.
For example, in January 2013 the overall WAP for a FM premium 20-stick pack was £6.89 and byDecember 2015 the price had increased to £8.18; thus, the price increased by £1.29. The associated taxliability increased by £0.71 during this period (from £5.96 in January 2013 to £5.24 in December 2015;small difference due to rounding), meaning that net revenue per pack increased by £0.58 (from £1.65 inJanuary 2013 to £2.22 in December 2015; small difference due to rounding). Thus, 55% of the pack priceincrease was due to increases in tax and 45% was due to increases in industry revenue.
To calculate WAP for FM cigarettes we multiplied total price increases for each FM pack type by theirpercentage market share. We then summed these to create a total price change for FM. We repeated theprocedure for the associates tax liabilities. The same approach was adopted for RYO tobacco pack types tocreate statistics for RYO tobacco.
January 2010–December 2012Popular pack sizes were the same as for the latter period, with the exception that the subvalue segmentwas not established during this period so was not included, and substantial numbers of value packscontained 20 sticks so proportions were additionally calculated from 20-stick value packs. All othercalculations were the same as for the latter time period.
Calculations for both periods were verified by following price and tax changes for one popular Marlboro SKU.
DOI: 10.3310/phr08060 PUBLIC HEALTH RESEARCH 2020 VOL. 8 NO. 6
© Queen’s Printer and Controller of HMSO 2020. This work was produced by Partos et al. under the terms of a commissioning contract issued by the Secretary of State for Healthand Social Care. This issue may be freely reproduced for the purposes of private research and study and extracts (or indeed, the full report) may be included in professionaljournals provided that suitable acknowledgement is made and the reproduction is not associated with any form of advertising. Applications for commercial reproduction shouldbe addressed to: NIHR Journals Library, National Institute for Health Research, Evaluation, Trials and Studies Coordinating Centre, Alpha House, University of Southampton SciencePark, Southampton SO16 7NS, UK.
55

ResultsNet real revenues were considerably greater for higher than for lower priced segments, although the gap wasmore marked for FM than RYO segments (Figure 9; see also Table S9 in Report Supplementary Material 2).A cyclical pattern of a drop in revenue immediately post Budget, followed by an increase thereafter, emergedwith the 2011 Budget and from this point there was progressively more differentiation in revenue betweensegments. Within the premium segment, revenue was greater on FM than RYO products, whereas in thevalue segment this pattern reversed and net revenues in the cheapest FM segment changed little throughoutthe whole period.
Declines in net revenue at times of tax (VAT or tobacco tax) increases can be seen more clearly usingchanges in net revenue post Budget (Figure 10 and see also Table S10 in Report Supplementary Material 2).Every year and in every segment, in the month after the Budget, net revenues fell. Thus, tobacco taxchanges were not passed straight on to consumers, but were initially absorbed by tobacco companies(indicating slightly lower profits per pack). In general, the extent and duration of the undershifting wasgreatest in the lowest segments, whereas in higher priced segments the undershifting was less marked andoften short-lived with profits recovering to and then exceeding pre-Budget levels (indicating overshifting)within 1–3 months each year. For example, in 2014, revenue on premium FM products recovered topre-Budget levels by May and by the end of the Budget year was up by £0.23. By contrast, revenues onsubvalue FM products fell in 2014 until August and, although they increased thereafter, never recoveredto pre-Budget levels (see Figure 10).
Patterns varied somewhat by year, reflecting the different tax changes. Unlike for other tax years, inJanuary 2010 and January 2011 there were VAT increases. The declines in revenue at both these pointsindicate these VAT increases were absorbed by tobacco companies. The years 2011 and 2012 saw themost marked tax changes (see Table 1). In line with this, after the 2011 tax system changes, a moremarked pattern of initial undershifting and greater differentiation in revenue change by segment emerged,consistent with the widening revenue gap between segments.
Tax or industry revenue as reason for price increasesThe proportion of total price increases attributable to government taxes compared with TI revenue ispresented in Table 10. In 2010–12, price, tax and revenue increases did not differ substantially by pricesegment (although tax and price increases were greater for FM cigarettes than RYO tobacco). For both FMcigarettes and RYO tobacco, increases in industry revenue accounted for about one-fifth of the total priceincrease, with little variation (20–26%), and government revenues for the remainder (up to 80%).
In 2013–15, however, the patterns were quite different in a number of ways. First, government tax, industryrevenue and total price increases varied more substantially by price segment, with greater increases seen inhigher price segments for both FM cigarettes and RYO tobacco. The impact of the differential tax increaseson price was exacerbated by industry pricing, with industry adding £0.58 to the price of FM premium brandcigarettes but cutting subvalue brands by £0.04; and in RYO tobacco, adding £0.36 to RYO premiumtobacco, but only £0.16 to RYO value tobacco. Consequently, a twofold difference in tax (£0.41 for FMsubvalue cigarettes to £0.71 for FM premium cigarettes) increase translates to a threefold difference in priceincrease (£0.37 to £1.29, respectively) between FM cigarette segments. The percentage increase in totalprice attributable to increases in industry revenue was higher in this period than in the previous period. Onaverage, about one-third of the price increase for FM cigarettes was industry revenue (compared with 23%in the previous period) and about half of the increase for RYO tobacco was industry revenue (comparedwith less than one-third in the previous period).
This analysis indicates that a significant proportion of the price increase was from industry revenuegeneration, rather than tax increases. The TI was overshifting taxes for all segments (apart from the FMsubvalue segment from 2013 to 2015), indicating that it was not sufficiently concerned about the allegedthreat of illicit tobacco to limit the price increases. This implies that they themselves do not believe in theirown argument that higher taxes encourage illicit tobacco purchasing. This is further supported by a higher
WHAT SMOKERS PAY FOR THEIR TOBACCO
NIHR Journals Library www.journalslibrary.nihr.ac.uk
56

Net
rea
l rev
enu
e p
er p
ack
(£)
2.50
2.00
1.50
Time point
1.00
0.50
0.00
FM premium 20 stickFM mid-price 20 stickFM value 19 stickFM subvalue 19 stickRYO premium 12.5 gRYO mid-price 12.5 gRYO value 12.5 g
Jan
uar
y 20
09Fe
bru
ary
2009
Feb
ruar
y 20
10
Mar
ch 2
009
Ap
ril 2
009
bu
dg
et
Ap
ril 2
010
Mar
ch 2
010
bu
dg
et
May
200
9
May
201
0
Jun
e 20
09Ju
ly 2
009
Au
gu
st 2
009
Sep
tem
ber
200
9O
cto
ber
200
9N
ove
mb
er 2
009
Dec
emb
er 2
009
Jun
e 20
10Ju
ly 2
010
Au
gu
st 2
010
Sep
tem
ber
201
0O
cto
ber
201
0N
ove
mb
er 2
010
Dec
emb
er 2
010
Feb
ruar
y 20
11
Feb
ruar
y 20
12
Ap
ril 2
011
Mar
ch 2
011
bu
dg
et
May
201
1Ju
ne
2011
July
201
1A
ug
ust
201
1Se
pte
mb
er 2
011
Oct
ob
er 2
011
No
vem
ber
201
1D
ecem
ber
201
1
Ap
ril 2
012
Mar
ch 2
012
bu
dg
et
May
201
2Ju
ne
2012
July
201
2A
ug
ust
201
2Se
pte
mb
er 2
012
Oct
ob
er 2
012
No
vem
ber
201
2D
ecem
ber
201
2
Jan
uar
y 20
10 V
AT
chan
ge
Jan
uar
y 20
11 V
AT
chan
ge
Jan
uar
y 20
12
Feb
ruar
y 20
13
Ap
ril 2
013
Mar
ch 2
013
bu
dg
et
May
201
3Ju
ne
2013
July
201
3A
ug
ust
201
3Se
pte
mb
er 2
013
Oct
ob
er 2
013
No
vem
ber
201
3D
ecem
ber
201
3
Jan
uar
y 20
13
Feb
ruar
y 20
14
Ap
ril 2
014
Mar
ch 2
014
bu
dg
et
May
201
4Ju
ne
2014
July
201
4A
ug
ust
201
4Se
pte
mb
er 2
014
Oct
ob
er 2
014
No
vem
ber
201
4D
ecem
ber
201
4
Jan
uar
y 20
14
Feb
ruar
y 20
15
Ap
ril 2
015
Mar
ch 2
015
bu
dg
et
May
201
5Ju
ne
2015
July
201
5A
ug
ust
201
5Se
pte
mb
er 2
015
Oct
ob
er 2
015
No
vem
ber
201
5D
ecem
ber
201
5
Jan
uar
y 20
15
FIGURE 9 Nielsen data study 3: net real (base year = 2014) TI revenue per pack (most popular pack sizes) for FM cigarettes and RYO tobacco, by price segment.Vertical reference lines indicate tax changes. Net revenue refers to revenue after tax only (other costs, e.g. distribution, production, etc., have not been deducted).
DOI:10.3310/phr08060
PUBLIC
HEA
LTHRESEA
RCH2020
VOL.8
NO.6
©Queen
’sPrinter
andController
ofHMSO
2020.This
work
was
producedby
Partoset
al.under
theterm
sof
acom
missioning
contractissued
bythe
Secretaryof
Statefor
Health
andSocialC
are.This
issuemay
befreely
reproducedfor
thepurposes
ofprivate
researchand
studyand
extracts(or
indeed,the
fullreport)may
beincluded
inprofessional
journalsprovided
thatsuitable
acknowledgem
entismade
andthe
reproductionisnot
associatedwith
anyform
ofadvertising.
Applications
forcom
mercialreproduction
shouldbe
addressedto:
NIHRJournals
Library,NationalInstitute
forHealth
Research,Evaluation,
Trialsand
StudiesCoordinating
Centre,
Alpha
House,
University
ofSoutham
ptonScience
Park,Southam
ptonSO
167N
S,UK.
57

–0.30
Month
–0.20
–0.10
0.00
0.10
0.20
0.30(a)
May
June
July
August
Septe
mber
October
Novem
ber
Decem
ber
Januar
y VAT c
hange
Febru
ary
Mar
ch
Ch
ang
e in
net
rea
l rev
enu
ep
er p
ack
(£)
FM premium 20 stickFM mid-price 20 stickFM value 19 stickFM subvalue 19 stickRYO premium 12.5 gRYO mid-price 12.5 gRYO value 12.5 g
FM premium 20 stickFM mid-price 20 stickFM value 19 stickFM subvalue 19 stickRYO premium 12.5 gRYO mid-price 12.5 gRYO value 12.5 g
–0.30
Month
–0.20
–0.10
0.00
0.10
0.20
0.30(b)
Ch
ang
e in
net
rea
l rev
enu
ep
er p
ack
(£)
May
AprilJu
neJu
ly
August
Septe
mber
October
Novem
ber
Decem
ber
Januar
y VAT c
hange
Febru
ary
Mar
ch
FIGURE 10 Nielsen data study 3: change in net real (base year= 2014) revenue per pack (£) post Budget [differencein revenue per pack in each post-Budget month compared with Budget month (last month of previous tax year)] forpopular pack sizes of FM cigarettes and RYO tobacco, by price segment: (a) 2009 tax year; (b) 2010 tax year; (c) 2011 taxyear; (d) 2012 tax year; (e) 2013 tax year; (f) 2014 tax year; and (g) 2015 tax year. Budgets were held in April 2019 andMarch in subsequent years. A negative change indicates undershifting and a positive change indicates overshifting:when values cross the £0.00 reference line in any tax year, it indicates that revenue has reached the same level (in realterms) as in the last month of the previous tax year, just prior to when the Budget was enacted. Note that, in 2009,FM value packs are 20 sticks, not 19 sticks, as 19 stick packs were not available at this time. Note that the FM subvaluesegment was introduced in 2012, so this is shown from 2013. Net revenue refers to revenue after tax only (other costs,e.g. distribution, production, etc., have not been deducted). (continued )
WHAT SMOKERS PAY FOR THEIR TOBACCO
NIHR Journals Library www.journalslibrary.nihr.ac.uk
58

FM premium 20 stickFM mid-price 20 stickFM value 19 stickFM subvalue 19 stickRYO premium 12.5 gRYO mid-price 12.5 gRYO value 12.5 g
–0.30
Month
–0.20
–0.10
0.00
0.10
0.20
0.30(c)
Ch
ang
e in
net
rea
l rev
enu
ep
er p
ack
(£)
May
AprilJu
neJu
ly
August
Septe
mber
October
Novem
ber
Decem
ber
Januar
y
Febru
ary
Mar
ch
FM premium 20 stickFM mid-price 20 stickFM value 19 stickFM subvalue 19 stickRYO premium 12.5 gRYO mid-price 12.5 gRYO value 12.5 g
–0.30
Month
–0.20
–0.10
0.00
0.10
0.20
0.30(d)
Ch
ang
e in
net
rea
l rev
enu
ep
er p
ack
(£)
May
AprilJu
neJu
ly
August
Septe
mber
October
Novem
ber
Decem
ber
Januar
y
Febru
ary
Mar
ch
FIGURE 10 Nielsen data study 3: change in net real (base year= 2014) revenue per pack (£) post Budget [differencein revenue per pack in each post-Budget month compared with Budget month (last month of previous tax year)] forpopular pack sizes of FM cigarettes and RYO tobacco, by price segment: (a) 2009 tax year; (b) 2010 tax year; (c) 2011 taxyear; (d) 2012 tax year; (e) 2013 tax year; (f) 2014 tax year; and (g) 2015 tax year. Budgets were held in April 2019 andMarch in subsequent years. A negative change indicates undershifting and a positive change indicates overshifting:when values cross the £0.00 reference line in any tax year, it indicates that revenue has reached the same level (in realterms) as in the last month of the previous tax year, just prior to when the Budget was enacted. Note that, in 2009,FM value packs are 20 sticks, not 19 sticks, as 19 stick packs were not available at this time. Note that the FM subvaluesegment was introduced in 2012, so this is shown from 2013. Net revenue refers to revenue after tax only (other costs,e.g. distribution, production, etc., have not been deducted). (continued )
DOI: 10.3310/phr08060 PUBLIC HEALTH RESEARCH 2020 VOL. 8 NO. 6
© Queen’s Printer and Controller of HMSO 2020. This work was produced by Partos et al. under the terms of a commissioning contract issued by the Secretary of State for Healthand Social Care. This issue may be freely reproduced for the purposes of private research and study and extracts (or indeed, the full report) may be included in professionaljournals provided that suitable acknowledgement is made and the reproduction is not associated with any form of advertising. Applications for commercial reproduction shouldbe addressed to: NIHR Journals Library, National Institute for Health Research, Evaluation, Trials and Studies Coordinating Centre, Alpha House, University of Southampton SciencePark, Southampton SO16 7NS, UK.
59

FM premium 20 stickFM mid-price 20 stickFM value 19 stickFM subvalue 19 stickRYO premium 12.5 gRYO mid-price 12.5 gRYO value 12.5 g
April
May
June July
Augu
stSe
ptem
ber
Oct
ober
Nove
mbe
rDe
cem
ber
Janu
ary
Febr
uary
Mar
ch
–0.20
–0.30
–0.10
0.00
0.10
0.20
0.30(e)
Ch
ang
e in
net
rea
l rev
enu
e p
er p
ack
(£)
Month
FM premium 20 stickFM mid-price 20 stickFM value 19 stickFM subvalue 19 stickRYO premium 12.5 gRYO mid-price 12.5 gRYO value 12.5 g
–0.30
–0.20
–0.10
0.00
0.10
0.20
0.30(f)
Ch
ang
e in
net
rea
l rev
enu
ep
er p
ack
(£)
Month
May
AprilJu
neJu
ly
August
Septe
mber
October
Novem
ber
Decem
ber
Januar
y
Febru
ary
Mar
ch
FIGURE 10 Nielsen data study 3: change in net real (base year= 2014) revenue per pack (£) post Budget [differencein revenue per pack in each post-Budget month compared with Budget month (last month of previous tax year)] forpopular pack sizes of FM cigarettes and RYO tobacco, by price segment: (a) 2009 tax year; (b) 2010 tax year; (c) 2011 taxyear; (d) 2012 tax year; (e) 2013 tax year; (f) 2014 tax year; and (g) 2015 tax year. Budgets were held in April 2019 andMarch in subsequent years. A negative change indicates undershifting and a positive change indicates overshifting:when values cross the £0.00 reference line in any tax year, it indicates that revenue has reached the same level (in realterms) as in the last month of the previous tax year, just prior to when the Budget was enacted. Note that, in 2009,FM value packs are 20 sticks, not 19 sticks, as 19 stick packs were not available at this time. Note that the FM subvaluesegment was introduced in 2012, so this is shown from 2013. Net revenue refers to revenue after tax only (other costs,e.g. distribution, production, etc., have not been deducted). (continued )
WHAT SMOKERS PAY FOR THEIR TOBACCO
NIHR Journals Library www.journalslibrary.nihr.ac.uk
60

FM premium 20 stickFM mid-price 20 stickFM value 19 stickFM subvalue 19 stickRYO premium 12.5 gRYO mid-price 12.5 gRYO value 12.5 g
(g)
–0.30
–0.20
–0.10
0.00
0.10
0.20
0.30
Ch
ang
e in
net
rea
l rev
enu
ep
er p
ack
(£)
Month
May
AprilJu
neJu
ly
August
Septe
mber
October
Novem
ber
Decem
ber
FIGURE 10 Nielsen data study 3: change in net real (base year= 2014) revenue per pack (£) post Budget [differencein revenue per pack in each post-Budget month compared with Budget month (last month of previous tax year)] forpopular pack sizes of FM cigarettes and RYO tobacco, by price segment: (a) 2009 tax year; (b) 2010 tax year; (c) 2011 taxyear; (d) 2012 tax year; (e) 2013 tax year; (f) 2014 tax year; and (g) 2015 tax year. Budgets were held in April 2019 andMarch in subsequent years. A negative change indicates undershifting and a positive change indicates overshifting:when values cross the £0.00 reference line in any tax year, it indicates that revenue has reached the same level (in realterms) as in the last month of the previous tax year, just prior to when the Budget was enacted. Note that, in 2009,FM value packs are 20 sticks, not 19 sticks, as 19 stick packs were not available at this time. Note that the FM subvaluesegment was introduced in 2012, so this is shown from 2013. Net revenue refers to revenue after tax only (other costs,e.g. distribution, production, etc., have not been deducted).
TABLE 10 Nielsen data study 3: percentage weighted real (base year= 2014) price changes in pack industry netrevenue and tax, for popular pack sizes, by price segment
Pack sizes and price segments
Increase (£) % of price change that is
Total price Government tax TI revenue Government tax TI revenue
January 2010–December 2012
FM premium cigarettes (20 sticks) 0.91 0.67 0.24 74 26
FM mid-price cigarettes (20 sticks) 0.96 0.74 0.22 77 23
FM value cigarettes (20 sticks) 1.12 0.87 0.25 78 22
FM value cigarettes (19 sticks) 0.95 0.87 0.19 80 20
Total FM cigarettesa 77 23
RYO premium tobacco (12.5 g) 0.58 0.43 0.14 75 25
RYO mid-price tobacco (12.5 g) 0.60 0.43 0.17 72 81
RYO value tobacco (12.5 g) 0.55 0.42 0.13 76 24
Total RYO tobaccoa 73 71
continued
DOI: 10.3310/phr08060 PUBLIC HEALTH RESEARCH 2020 VOL. 8 NO. 6
© Queen’s Printer and Controller of HMSO 2020. This work was produced by Partos et al. under the terms of a commissioning contract issued by the Secretary of State for Healthand Social Care. This issue may be freely reproduced for the purposes of private research and study and extracts (or indeed, the full report) may be included in professionaljournals provided that suitable acknowledgement is made and the reproduction is not associated with any form of advertising. Applications for commercial reproduction shouldbe addressed to: NIHR Journals Library, National Institute for Health Research, Evaluation, Trials and Studies Coordinating Centre, Alpha House, University of Southampton SciencePark, Southampton SO16 7NS, UK.
61

proportion of the total price increase being attributable to industry revenue increases for RYO tobacco(rather than FM cigarettes), despite illicit sales of RYO tobacco being substantially higher.
There was less overshifting in a period with sudden large tax increases (January 2010–December 2012)than with a period of planned steady, smaller tax increases (January 2013–December 2015). This impliesthat sudden large tax increases compromise the TI’s ability to manipulate prices.
Summary
Both the ITC and Nielsen data indicate that although real prices per stick of tobacco have increased, realprices of the cheapest FM and RYO products remained static since 2012. Nielsen data indicated that realpack prices (and hence the price the consumer pays) have also remained static, largely due to the declinein pack sizes. Ten-gram packs accounted for a greater proportion of the cheapest RYO tobacco segmentsand were more likely to be price marked; hence, the combination of small packs and price markingappeared to be reinforcing. The price range between FM cigarettes and RYO tobacco was more complex:the range in pack price appears to have narrowed between 2009 and 2012, particularly in the lowestsegment (i.e. between FM value cigarettes and RYO value tobacco), signalling some success in using the2011 tax changes to close the price range. However, in terms of price per stick, the price range increasedacross the data set as a whole. Within RYO tobacco and FM cigarettes, the range between cheapest andmost expensive products has increased, reflecting the differential shifting of taxes between segments.Hence, the opportunities for down-trading have continued to increase and volumes of the cheapestsegments have grown in both FM cigarettes and RYO tobacco.
Tobacco industry pricing appears to be designed to deliberately undermine the public health impact of taxincreases. Each year, immediately post Budget, the TI cuts its profits by absorbing the tax increases andthus preventing any sudden increase in price the consumer would face, instead smoothing that increasethroughout the year. The degree and duration of undershifting is, in general, most marked in the cheapestprice segments and in recent years more marked in FM cigarettes than RYO tobacco. The industry thendrives up profits later in the year, with the extent of overshifting most marked in the more expensive pricesegments. This approach to pricing means that tobacco prices in the lowest segments are kept artificiallylow and leads to the growing range in price between the most expensive and cheapest products.
In subsequent chapters we examine the impact of these strategies on quitting and whether or not theyaffect sociodemographic groups differentially.
TABLE 10 Nielsen data study 3: percentage weighted real (base year= 2014) price changes in pack industry netrevenue and tax, for popular pack sizes, by price segment (continued )
Pack sizes and price segments
Increase (£) % of price change that is
Total price Government tax TI revenue Government tax TI revenue
January 2013–December 2015
FM premium cigarettes (20 sticks) 1.29 0.71 0.58 55 45
FM mid-price cigarettes (20 sticks) 1.08 0.66 0.42 61 39
FM value cigarettes (19 sticks) 0.83 0.60 0.23 73 27
FM subvalue cigarettes (19 sticks) 0.37 0.41 –0.04 112 –12
Total FM cigarettesa 64 36
RYO premium tobacco (12.5 g) 0.64 0.28 0.36 44 56
RYO mid-price tobacco (12.5 g) 0.55 0.26 0.28 48 52
RYO value tobacco (12.5 g) 0.39 0.24 0.16 61 39
Total RYO tobaccoa 48 52
a Totals are weighted for volumes. Net revenue refers to revenue after tax only (other costs, e.g. distribution, production,etc., have not been deducted).
WHAT SMOKERS PAY FOR THEIR TOBACCO
NIHR Journals Library www.journalslibrary.nihr.ac.uk
62

Chapter 5 Changes in the affordability of tobaccoproducts over time
Introduction
Tobacco taxes are intended to reduce the affordability of tobacco over time. In this chapter, we considerwhether or not there were any other developments in addition to taxes that might have influencedaffordability in the time period we studied. We also studied whether or not there were changes in theaffordability of tobacco products over time.
Background: affordability in the commercial literatureThe ‘Great Recession’ was alluded to in the commercial literature, the effect of which was seen asproducing down-trading via reduced incomes and welfare freezes, affecting the disposable income of(particularly low-income) smokers. In 2009, and still in 2012, the recession was seen as a driver pushingsmokers to switch to RYO tobacco, at least partially:
‘Dualling’ is [. . .] a trend identified by Imperial Tobacco towards smoking both roll-ups and factorymade cigarettes [. . .] partial down-trading [. . .] More and more UK smokers, and particularly, youngerwomen, are turning to roll-ups. Part of the reason is the recession.
Euromonitor International Ltd219
The RYO market continues to expand as people feel the pinch from government cuts and wage freezes.220
In 2010, Watkins from Imperial Tobacco did not think that ‘convincing smokers to trade back up will be anissue’ after the recession,169 but down-trading was still apparent in 2014 despite the end of the recession:
. . . while there appear to be the early signs of a wider economic recovery, many smokers are stillfeeling the pinch and so growth remains the preserve of the value for money subsector of cigarettes,RYO and even value for money RYO.
Hegarty221
Thus, in 2014, there were still stated to be affordability problems. Wholesaler Paul Ford was quoted inWholesale News, stating ‘consumers cannot afford to smoke, drink, drive a car’.211
Hence, the commercial literature suggested that tobacco products were becoming less affordable partlydue to reduced incomes via the government response to the recession.
ITC data study 2: changes in tobacco affordability over timeamong smokers
Methods
Notable methodological differences between our measure and existing measures oftobacco affordabilityAs noted in Chapter 1, existing aggregate measures of affordability use average national estimates ofincome and average cigarette prices to make cross-country comparisons of tobacco affordability over time.For this project, we wanted to capture what individual smokers were actually spending on tobacco, takinginto consideration the specific products (FM cigarettes vs. RYO tobacco), price segments and purchase
DOI: 10.3310/phr08060 PUBLIC HEALTH RESEARCH 2020 VOL. 8 NO. 6
© Queen’s Printer and Controller of HMSO 2020. This work was produced by Partos et al. under the terms of a commissioning contract issued by the Secretary of State for Healthand Social Care. This issue may be freely reproduced for the purposes of private research and study and extracts (or indeed, the full report) may be included in professionaljournals provided that suitable acknowledgement is made and the reproduction is not associated with any form of advertising. Applications for commercial reproduction shouldbe addressed to: NIHR Journals Library, National Institute for Health Research, Evaluation, Trials and Studies Coordinating Centre, Alpha House, University of Southampton SciencePark, Southampton SO16 7NS, UK.
63

sources they were using to potentially minimise costs: something that cannot be captured using averageestimates of cigarette prices based only on a few popular brands. The ITC data allowed us to do this andalso to use participants’ actual reported incomes to calculate affordability, the advantage of this beinga more sensitive measure to explore the associations between affordability and individual differences.Capturing individual incomes is particularly important for smokers, as smokers are over-represented amonglow-SES groups whose incomes would be overestimated by national averages. At the time of conductingthis research,222 we were aware of only one other study223 to have used individual reported tobacco pricesto calculate tobacco affordability and no other studies using individual incomes (but see the recent work ofNargis and colleagues224). Thus, ours, to the best of our knowledge, was the first study to adopt a completelyindividualised measure of tobacco affordability and the only one to consider the impact of RYO tobaccoon affordability.
There is another important point of difference between our new measure and traditional measure ofaffordability. Traditional measures, regardless of whether they use aggregate or individual-level data onincomes and tobacco prices, are based on a simple ratio of price to income. However, our measure usesthe ratio of expenditure to income (expenditure being consumption × price) (see also Chapter 2). This addsa level of complexity to our measure because it incorporates three moving parts (consumption × price/income) rather than two (price/income), one of which (consumption) is endogenous to the individual.In our view, incorporating consumption in this way provides valuable extra information. Our aim was toevaluate whether or not tobacco taxes have led to smokers paying more for their tobacco, in a way thattakes into account that they might respond by changing purchasing behaviour to mitigate increased packprices. Owing to its addictiveness, the relationship between tobacco price and demand is less elastic thansome other products, so we think it is helpful to incorporate elasticity and examine smokers’ response toprice increases via changes in expenditure, rather than just the price change itself. The ability of smokersto minimise costs by reducing consumption (and by our new metric potentially keeping smoking equallyor even more affordable, despite an increase in absolute prices relative to incomes) is an important publichealth concern. This is because, for RYO tobacco, purchasing less tobacco does not necessarily translateto fewer cigarettes (see Chapter 7) and, even when it does, the health benefits of reducing the numberof cigarettes smoked without quitting altogether are debatable.225 We also felt that it was important tomonitor and illustrate to policy-makers that beyond the negative health consequences there are financialconsequences of smoking. Rather than reducing demand, price increases prompt some smokers to spendmore of their income on tobacco and we hoped that seeing this in a straightforward metric would beuseful for policy-makers. Thus, although we feel that our novel individual-level affordability measure isan alternative way of conceptualising ‘affordability’, given its departure from traditional measures ofaffordability via the inclusion of consumption, it might also be helpful to think of our new measure as‘tobacco budget share’.
Data and exclusionsThe first 10 waves of the ITC UK surveys (2002–14) were analysed. We excluded non-daily smokers (n = 394)and ‘mixed’ smokers of both FM cigarettes and RYO tobacco throughout (n = 636), and exclusive RYOsmokers from waves 1–4 (n = 420) because relevant questions needed to calculate affordability were notincluded. Invalid responses on tobacco price were excluded as previously defined (n = 186) (see Chapter 2),as well as the top and bottom one percentile of responses on the affordability variable (see Chapter 2)to minimise outliers (n = 480, of which 94% were improbable responses such as spending none or > 100%of income on tobacco), and anyone with missing data on the included covariates (n = 58). The resultingsample included 4062 current daily smokers, providing 8943 observations over the 10 surveys (average of2.2 observations per individual).
AnalysesWe calculated changes over time for both the individualised and aggregate (FM cigarettes only) versionsof our ‘Budget-share’ affordability measures (using the equations described in Chapter 2; see Equations 2and 3). We also calculated the changes over time of the constituents of affordability (tobacco price andincome) to examine their relative contributions.
CHANGES IN THE AFFORDABILITY OF TOBACCO PRODUCTS OVER TIME
NIHR Journals Library www.journalslibrary.nihr.ac.uk
64

We used random-effects linear regression analyses with maximum likelihood estimation, clustered overindividuals (to control for correlations between multiple observations provided by the same individual indifferent surveys), in order to examine changes in individualised affordability over time and the associationswith individual differences. We analysed the affordability of FM cigarettes (2002–14) separately to RYOtobacco (2006–14). Our individualised measure of affordability was the dependent variable. Independentvariables were tobacco tax year (using the 2002 tobacco tax year as reference and testing for linear trends,and also conducting reverse adjacent contrasts to examine whether or not each successive survey periodresulted in a change in affordability that was statistically significant from the last), sex, age and agesquared (to test for non-linear associations with age), ethnicity, region, education, TTFC and purchasesource (UK store-based or non-UK/non-store-based sources). We used a random-effect regression model(rather than fixed effect) because of the emphasis on population-level effects rather than cluster-leveleffects of random-effects modelling, the ability to utilise small clusters (including clusters of one) as presenthere and the ability to model-time-invariant variables (e.g. sex, ethnicity) on the outcome. In our data set,tax changes overlapped with the time variable and, hence, tax changes were a confound that we couldnot include in our regression model.
We computed three regression models. In model 1, affordability was regressed separately on eachindependent variable, unadjusted for other covariates, in order to identify any simple associationsbetween each independent variable and affordability. In model 2, all independent variables were includedconcurrently, in order to identify which independent variable was a significant predictor of affordabilityafter controlling for all other variables. In model 3, we repeated model 2 but excluded participantspurchasing from non-UK/non-store sources. This allowed us to observe changes in affordability only forpurchases when full duties were likely to have been paid (see Chapter 8). Our SES indicator was level ofeducation, as we could not include income because it was used to derive the affordability measure itself;tobacco consumption (CPD) was excluded for the same reason. A sensitivity analysis was also conductedto examine how smokers changed their tobacco consumption over the survey period and the degree towhich any observed changes in affordability were due to changes in tobacco consumption. This analysisregressed CPD onto all the independent variables included in model 2. Demographic and smoking-relatedaffordability differences between FM cigarette and RYO tobacco smokers are discussed in Chapter 9.
As our method of equivalising income (see Chapter 2 and Report Supplementary Material 1) differedslightly from published methodologies, we also ran sensitivity analyses using income not equivalised forhousehold composition. The results did not differ substantially from the results or conclusions presented(data not shown).
ResultsThe characteristics of the included sample are given in Table 11. There were slightly more females (58%)than males, the mean age was 49 years (SD 14.2 years) and the majority were white with low to moderatelevels of education. Most smoked their first cigarette within 30 minutes of waking and average cigaretteconsumption was 16.8 CPD (SD 8.2 CPD).
There was an average annual decrease of 1.6% in incomes for our sample of smokers over the studyperiod (Figure 11). This deviated considerably from national annual per capita GDP, which increased from£26,206 to £30,299 between 2002 and 2007, when mean income in our sample decreased from £32,202to £29,423. From 2007, incomes in our sample continued to decrease at a more marked rate than GDP, toa low in 2012 of £24,976 (GDP declined to £27,196). From 2012, both income in our sample and annualper capita GDP modestly increased (see Figure S6 in Report Supplementary Material 3).
There was an average annual increase of 2.6% in the price of FM cigarettes (see Figure 11), which,combined with the decrease in income, contributed to an average annual decrease in the affordability of FMcigarettes of 0.24%, from 91.5% [± 95% confidence interval (CI) 91.0% to 91.9%] in 2002 to 87.8%(± 95% CI 87.0% to 88.5%) in 2014 (see Figure 11, model 1 unadjusted). Similarly, the average annualincrease of 4.5% in the price of RYO tobacco (see Figure 11) and the decrease in income contributed to an
DOI: 10.3310/phr08060 PUBLIC HEALTH RESEARCH 2020 VOL. 8 NO. 6
© Queen’s Printer and Controller of HMSO 2020. This work was produced by Partos et al. under the terms of a commissioning contract issued by the Secretary of State for Healthand Social Care. This issue may be freely reproduced for the purposes of private research and study and extracts (or indeed, the full report) may be included in professionaljournals provided that suitable acknowledgement is made and the reproduction is not associated with any form of advertising. Applications for commercial reproduction shouldbe addressed to: NIHR Journals Library, National Institute for Health Research, Evaluation, Trials and Studies Coordinating Centre, Alpha House, University of Southampton SciencePark, Southampton SO16 7NS, UK.
65

TABLE 11 International Tobacco Control Policy Evaluation Project study 2: sample characteristics for the combinedsample and separately by tobacco format (FM cigarettes or RYO tobacco)
Sample characteristics Combined sample
Smokers
FM RYO
Total observations, n (%) 8943 (100.0) 7475 (100.0) 1468 (100.00)
Individualised affordability, mean (SD) 91.4 (9.7) 90.6 (10.1) 95.5 (5.9)
Annual income (£), mean (SD) 29,347 (21,832) 30,277 (22,464) 24,608 (17,534)
Price per cigarette (£), mean (SD) 0.265 (0.080) 0.273 (0.075) 0.227 (0.092)
CPD, mean (SD) 16.8 (8.2) 16.7 (8.1) 17.0 (9.1)
Sex, n (%)
Female 5196 (58.1) 4647 (62.2) 549 (37.4)
Male 3747 (41.9) 2828 (37.8) 919 (62.6)
Age (years), mean (SD) 49 (14.2) 48 (14.4) 50 (12.9)
Region, n (%)
London 1094 (12.2) 964 (12.9) 130 (8.9)
Yorkshire and The Humber 729 (8.2) 645 (8.6) 84 (5.7)
East Midlands 634 (7.1) 513 (6.9) 121 (8.2)
Eastern 753 (8.4) 601 (8.0) 152 (10.4)
North East 393 (4.4) 340 (4.6) 53 (3.6)
South East 1139 (12.7) 930 (12.4) 209 (14.2)
South West 657 (7.6) 478 (6.4) 197 (13.4)
West Midlands 797 (8.9) 679 (9.1) 118 (8.0)
North West 951 (10.6) 819 (11.0) 132 (9.0)
Wales 479 (5.4) 368 (4.9) 111 (7.6)
Scotland 1009 (11.3) 882 (11.8) 127 (8.7)
Northern Ireland 290 (3.2) 256 (3.4) 34 (2.3)
Ethnicity, n (%)
White 8534 (95.4) 7094 (94.9) 1440 (98.1)
Not white 409 (4.6) 381 (5.1) 28 (1.9)
Education, n (%)
Low 5236 (58.6) 4389 (58.7) 847 (57.7)
Moderate 2380 (26.6) 1998 (26.7) 382 (26.0)
High 1327 (14.8) 1088 (14.6) 239 (16.3)
TTFC, mean (SD)
Least addicted (> 60 minutes) 1218 (13.6) 1066 (14.3) 152 (10.4)
31–60 minutes 1879 (21.0) 1593 (21.3) 286 (19.5)
6–30 minutes 4407 (49.3) 3667 (49.1) 740 (50.4)
Most addicted (within 5 minutes) 1439 (16.1) 1149 (15.4) 290 (19.8)
Purchase source, n (%)
UK store based 7495 (83.8) 6439 (86.1) 1056 (71.9)
Non-UK/non-store 1448 (16.2) 1036 (13.9) 412 (28.1)
NoteTotal n = 4062 (observations = 8943).
CHANGES IN THE AFFORDABILITY OF TOBACCO PRODUCTS OVER TIME
NIHR Journals Library www.journalslibrary.nihr.ac.uk
66

average annual decrease in the affordability of RYO tobacco of 0.31%, from 96.3% (± 95% CI 95.7% to96.9%) in 2006 to 93.7% (± 95% CI 93.0% to 94.4%) in 2014 (see Figure 11, model 1 unadjusted). RYOtobacco was significantly more affordable than FM cigarettes.
The aggregate version of affordability (fully taxed FM cigarettes only) also decreased (see Figure 11). Therewas an increase in aggregate affordability between 2010 and 2011, which coincided with the change incalculation of cigarette prices from the MPPC to the WAP and, hence, marks the switch between thesetwo data series. When MPPC was used, aggregate affordability decreased at an average annual rate of0.13% between 2002 (93.4%) and 2010 (92.5%); when using the WAP, an average annual rate of0.40% between 2011 (93.7%) and 2014 (92.5%) was observed.
For FM cigarettes, focusing on the fully adjusted regression (model 2), there was a significant linear decrease,χ2(1) = 59.8 (p < 0.0001), in individualised affordability over time (Table 12). However, as indicated by thereverse adjacent contrasts, none of the year-to-year decreases were significant, except for the two instanceswhen there was a 2-year interval between surveys: 2008–10, χ2(1) = 5.4 (p < 0.05) and 2010–12 χ2(1) = 4.3(p < 0.05), a period that also coincided with tax increases greater than the rate of inflation. The same patternof results was obtained for the fully adjusted model 2. For model 3, when non-UK/non-store sources wereexcluded, a significant linear decrease in affordability was still observed over time, χ2(1) = 54.3 (p < 0.0001).
36.0
Annual income in £1000 Price per 100 FM cigarettes (£)Price per 100 RYO cigarettes (£)
34.0
32.0
30.0
28.0
26.0
24.0
22.0
20.0
Pou
nd
s (£
)
2002 2003 2004 2005 2006 2007
Tobacco tax year2008
(a)
2009a 2010 2011a 2012 2013 2014
96.0
94.0
92.0
Aff
ord
abili
ty
90.0
80.0
(b)
2002 2003 2004 2005 2006 2007 2008 2009a 2010 2011a 2012 2013 2014
Tobacco tax year
Aggregate affordability (FM only)Individualised affordability (FM)Individualised affordability (RYO)
FIGURE 11 International Tobacco Control Policy Evaluation Project data study 2: measures of affordability(individualised and aggregate versions) and their constituent components (income and tobacco prices) over time.(a) Annual gross income and tobacco prices for FM cigarettes and RYO tobacco (values are adjusted for inflationusing CPI with 2014 as the base year); and (b) individualised measures of affordability (for FM cigarettes and RYOtobacco) and the aggregate version of affordability (FM only). Individualised measures are unadjusted and inclusiveof all purchase sources. The aggregate version of affordability is based on annual per capita GDP and meancigarette prices from annual sales in the MPPC (prior to 2011) or WAP (2011 onwards) for FM cigarettes from fullytaxed UK sources only. Note, shaded areas indicate 95% confidence intervals. a, No ITC data collected for this year.
DOI: 10.3310/phr08060 PUBLIC HEALTH RESEARCH 2020 VOL. 8 NO. 6
© Queen’s Printer and Controller of HMSO 2020. This work was produced by Partos et al. under the terms of a commissioning contract issued by the Secretary of State for Healthand Social Care. This issue may be freely reproduced for the purposes of private research and study and extracts (or indeed, the full report) may be included in professionaljournals provided that suitable acknowledgement is made and the reproduction is not associated with any form of advertising. Applications for commercial reproduction shouldbe addressed to: NIHR Journals Library, National Institute for Health Research, Evaluation, Trials and Studies Coordinating Centre, Alpha House, University of Southampton SciencePark, Southampton SO16 7NS, UK.
67

However, the adjacent contrasts indicated that none of year-to-year decreases remained statistically significant.Model 3 was the most similar to the generalised affordability measure, but was around 3–6% lower each yearand showed a more marked decline. In both models 2 and 3, 2010 was the first year that FM cigarettes becamesignificantly less affordable than they had been in 2002. Full results for FM cigarettes for all three models andincluding all covariates can be found in Table S11 in Report Supplementary Material 2.
For RYO tobacco, the changes in individualised affordability over time were similar to FM cigarettes(see Table 12). The fully adjusted model 2 indicated a significant linear decreasing trend, χ2(1) = 39.45(p < 0.0001) in affordability over time; however, there were no significant year-to-year changes indicated inthe reverse adjacent contrasts. Findings were similar for the unadjusted model 1 [except the decrease from
TABLE 12 International Tobacco Control Policy Evaluation Project data study 2: linear random-effects clusteredregression analyses of individualised affordability regressed on time (tax year) and other covariates (fully adjusted),separately for FM cigarette and RYO tobacco smokers
Time (tax year)
FM cigarettes (n= 3420, observations= 7475) RYO tobacco (n= 734, observations= 1468)
β SE p-value β SE p-value
χ2(1) = 59.84; p < 0.0001 χ2(1) = 39.45; p < 0.0001
2002 Ref
2003 –0.05 0.23 0.842
2004 –0.44 0.40 0.267
2005 –0.07 0.27 0.806
2006 –0.36 0.28 0.208 Ref
2007 –0.54 0.30 0.069 0.26 0.30 0.388
2008 –0.38 0.31 0.224 0.18 0.32 0.568
2010 –1.11 0.35 0.002 –0.36 0.34 0.305
2012 –2.45 0.66 < 0.001 –0.92 0.63 0.141
2013 –2.56 0.44 < 0.001 –1.94 0.41 < 0.001
2014 –2.82 0.42 < 0.001 –1.80 0.40 < 0.001
Reverse adjacent contrasts
χ2(10) = 78.73; p <0.0001 χ2(6) = 48.45; p < 0.0001
2003 vs. 2002 –0.05 0.23 0.842
2004 vs. 2003 –0.40 0.40 0.326
2005 vs. 2004 0.38 0.38 0.314
2006 vs. 2005 –0.29 0.26 0.264
2007 vs. 2006 –0.18 0.27 0.495 0.26 0.30 0.388
2008 vs. 2007 0.16 0.28 0.561 –0.08 0.31 0.799
2010 vs. 2008 –0.73 0.31 0.020 –0.54 0.33 0.100
2012 vs. 2010 –1.33 0.65 0.039 –0.57 0.62 0.354
2013 vs. 2012 –0.11 0.71 0.873 –1.01 0.67 0.128
2014 vs. 2013 –0.25 0.45 0.575 0.13 0.41 0.745
Ref, reference.NotesAnalyses are fully adjusted for tobacco tax year, sex, age, age squared, region, ethnicity, education, TTFC andpurchase source.Chi-squared statistics are for overall effects of linear trends (time) and any variables with three or more categories.Values in bold are significant.
CHANGES IN THE AFFORDABILITY OF TOBACCO PRODUCTS OVER TIME
NIHR Journals Library www.journalslibrary.nihr.ac.uk
68

2008 to 2010, χ2(1) = 5.3 (p < 0.05), was statistically significant] and model 3, excluding purchases fromnon-UK/non-store sources. Full results for RYO tobacco for all three models and including all covariates canbe found in Table S12 in Report Supplementary Material 2.
Results of the sensitivity analysis looking at changes in tobacco consumption showed that FM cigarettesmokers made a slight reduction in their CPD from 17.5 (95% CI 17.2 to 17.9) cigarettes in 2002 to 16.1(95% CI 15.6 to 16.7) cigarettes in 2014, with a statistically significant linear trend: χ2(1) = 40.9 (p < 0.0001).The consumption of RYO tobacco smokers changed from 16.8 g (95% CI 16.0 g to 17.6 g) in 2006 to 17.3 g(95% CI 16.4 g to 18.3 g) in 2014, but the linear trend was not statistically significant: χ2(1) = 1.7 (p = 0.20).Given that tobacco became less affordable during this period, this decrease cannot be attributed to theseobserved decreases in CPD (an increase in CPD would result in a decrease in affordability). However, it ispossible that the decreases in consumption (especially for FM cigarettes) attenuated the magnitude of theobserved decrease in affordability and we might have observed a greater reduction in affordability hadsmokers not reduced their consumption to compensate.
LimitationsAs we included only current smokers, some recent ex-smokers may have quit because they could notafford tobacco, which would mean that our data somewhat underestimated the decrease in affordability.We also excluded non-daily smokers and those who usually smoked both FM cigarettes and RYO tobaccobecause of insufficient data, which may have slightly underestimated affordability, as these groups mightbe particularly adept at controlling their tobacco expenditure by smoking less or switching as necessary.We also used repeat cross-sectional, rather than longitudinal data. Finally, we had data only on gross(before tax) rather than net (after tax) income. Individuals in the UK with higher incomes are taxed atprogressively higher rates, so their net income (what is actually available to spend on tobacco) will bereduced by relatively more than those on lower incomes. For the high-income groups, affordability willtherefore be slightly overestimated; we do not expect this to cause a large bias in our estimates, as justover two-thirds of our sample (68%) had gross incomes < £30,000, which was below the threshold formoving beyond the lowest tax rate in all years analysed, except the 2002–3 tax year in which the thresholdwas £29,000. Income differences between our sample and national figures are probably reflective ofsmokers being more disadvantaged overall.
ImplicationsOur new individualised measure of tobacco affordability provided a more sensitive and nuanced insightinto the impact of tobacco taxes compared with aggregate measures based on national estimates ofincome and average tobacco prices. In the UK, tobacco was significantly less affordable in 2014 thanin 2002, although the rate of decrease (0.24% annually) was low and year-to-year declines were notsignificant, and potentially attenuated by slight reductions in consumption. Affordability was modifiedby larger tax increases and RYO tobacco was considerably more affordable than FM cigarettes.
We have developed a novel measure of affordability which, beyond using individual reported tobaccoprices and incomes, departs from traditional price/income conceptualisations of affordability by alsoincorporating tobacco consumption. The two other studies223,224 of which we are aware that have adoptedindividualised224 or partly individualised223 measures of tobacco affordability, although they did notincorporate consumption directly into their calculation of affordability, weighted their estimatesof tobacco prices by consumption. It is therefore necessary to discuss the implications of this.
Owing to the inclusion of (or weighting for) consumption, it is possible for these analyses to indicate thattobacco has become more affordable, even if prices have increased relative to incomes. This would onlyoccur only if smokers reduced their consumption by more than what is necessary to compensate for theprice increase. We think this is unlikely. The more likely scenario is that they have reduced consumptionjust enough to compensate for the price increase (we have observed exactly this with users of RYOtobacco; see Chapter 7), in which case our measure would indicate no change in affordability. It isalso possible, as we observed in this case, that smokers reduce their consumption, but not enough to
DOI: 10.3310/phr08060 PUBLIC HEALTH RESEARCH 2020 VOL. 8 NO. 6
© Queen’s Printer and Controller of HMSO 2020. This work was produced by Partos et al. under the terms of a commissioning contract issued by the Secretary of State for Healthand Social Care. This issue may be freely reproduced for the purposes of private research and study and extracts (or indeed, the full report) may be included in professionaljournals provided that suitable acknowledgement is made and the reproduction is not associated with any form of advertising. Applications for commercial reproduction shouldbe addressed to: NIHR Journals Library, National Institute for Health Research, Evaluation, Trials and Studies Coordinating Centre, Alpha House, University of Southampton SciencePark, Southampton SO16 7NS, UK.
69

compensate for the price increases, which would lead to smaller than expected (based solely on pricesrelative to incomes) reductions in affordability. It is important to examine this interrelationship amongprice, income and consumption, because the health gains of reducing consumption without quitting arelimited,226 but small reductions in consumption (e.g. by 1.4 FM cigarettes over the 12-year study periodwe observed here) might be just enough to offset tobacco price increases to a satisfactory level to detersmokers from quitting, thereby undermining the effectiveness of tobacco tax increases. For researchersusing our measure, we therefore recommend that, as we have done here, that our measure be examinedalongside the separate trends in prices, incomes and consumption, to gain a more comprehensiveunderstanding of how smokers are adjusting their behaviour to keep tobacco affordable.
Summary
Both the commercial literature and ITC data indicated a decrease in tobacco affordability over the studyperiod. Using our individualised method of affordability, tobacco was significantly less affordable for UKsmokers in 2014 than it had been in 2002. Using an aggregate version of affordability for FM cigarettespurchased in UK stores only (and therefore likely to be fully taxed), affordability also decreased over timeThe individualised method of affordability indicated that FM cigarette smokers retained 87.8% of theirincome after paying for tobacco in 2014, compared with 91.5% in 2002. For RYO tobacco smokers,tobacco was more affordable, but this also decreased significantly, and they retained 93.7% of theirincome after paying for tobacco in 2014, compared with 96.3% in 2006 (the years for which data wereavailable). Decreases in the income of smokers (1.6% annually) and increases in mean cigarette prices(2.6% and 4.5% annually for FM cigarettes and RYO tobacco, respectively) contributed to the decreasein affordability. However, the decrease in affordability was lower (0.24% and 0.31% annually for FMcigarettes and RYO tobacco, respectively) than would be expected from the observed changes in incomeand cigarette prices. It is possible that the potential magnitude of this decrease was attenuatedby slight reductions in consumption, especially among FM smokers. It is also likely that individualcharacteristics are playing a role, a subject we explore in Chapter 9.
However, year-to-year changes in affordability were not statistically significant, except when the gapbetween surveys was 2 years rather than 1 year. This suggests that it was probably not large enough toprompt smokers, especially the more dependent ones, to quit smoking. The largest decrease in affordabilitywas from 2008 to 2012. Across the study period, it was only from 2009 that taxes increased over the rateof inflation, and in 2011 a sharp increase in RYO tobacco prices occurred (see Table 1) and we observedthat FM cigarettes became significantly less affordable only from 2010 onwards compared with 2002.Incomes were also observed to reduce most sharply from 2010 onwards, probably due to the recession.As our surveys did not occur in 2009 and 2011, we are unable to determine the strength of the relativecontributions of these changes to affordability.
CHANGES IN THE AFFORDABILITY OF TOBACCO PRODUCTS OVER TIME
NIHR Journals Library www.journalslibrary.nihr.ac.uk
70

Chapter 6 The impact of tobacco tax increases, asmoderated by tobacco industry pricing, on smokers’legal purchasing patterns
Introduction
Smokers can take a number of steps to minimise the cost of their smoking behaviour. They can alter theproducts that they purchase, such as buying cheaper brands or variants of the same product, purchase acheaper product (e.g. RYO tobacco or an illicit product), or alter their smoking behaviour (e.g. reduceconsumption or quit). This chapter explores what smokers purchase from legal sources and how this isimpacted by price increases. In Chapter 7, we focus on changes in smoking behaviour (reducingconsumption and quitting) and in Chapter 8 we assess whether or not there are changes in purchasesconstituting potential tax avoidance or evasion.
Background: evidence of down-trading in the commercial literatureFor industry, down-trading from expensive products to cheaper products was interpreted as a consequenceof tax increases136 and the recession:227
The one concession [rather than quitting] smokers are likely to make to tougher times [Watkins fromImperial Tobacco claims] is to save money where possible: there is already a trend to down trade andthis is likely to be accelerated over the coming months.
Hegarty169
In 2008, PMI, with a limited share of the UK market and a predominance of premium brands (notablyMarlboro), claimed to be unaware of down-trading in the UK:
The down-trading that everyone is referring to or afraid of, we have just not seen.Hermann Waldemar, Chief Financial Officer from PMI, quoted in The Grocer228
However, spokespeople from both JTI and Imperial Tobacco described evidence of smokers down-trading.229
Imperial Tobacco had noticed similar trends:
Increasing numbers of adult smokers are moving down through the cigarette price sectors into theeconomy sector.
Iain Watkins, trade communications manager at Imperial Tobacco quoted in Wholesale News230
Dual use of manufactured cigarettes and RYO was later reported to be a growing trend.139 Furthermore,even RYO tobacco users were noted to be trading down from more expensive to cheaper RYO tobaccobrands.169
In 2014, 90% of smokers switching brands were now switching to a lower priced brand,231 causing a ‘fullblown subprime crisis in the heart of the global cigarette market’.232 Down-trading became increasinglyessential because ‘consumers cannot afford to smoke, drink, drive a car – something has to give; althoughtobacco is the last thing some people will give up, they will down-trade’ (wholesaler Paul Ford, quoted inWholesale News)211 and possible because ‘Smokers used to be embarrassed to buy the cheaper brands,but the culture has changed radically’ (retailer quoted in Retail Newsagent).233
DOI: 10.3310/phr08060 PUBLIC HEALTH RESEARCH 2020 VOL. 8 NO. 6
© Queen’s Printer and Controller of HMSO 2020. This work was produced by Partos et al. under the terms of a commissioning contract issued by the Secretary of State for Healthand Social Care. This issue may be freely reproduced for the purposes of private research and study and extracts (or indeed, the full report) may be included in professionaljournals provided that suitable acknowledgement is made and the reproduction is not associated with any form of advertising. Applications for commercial reproduction shouldbe addressed to: NIHR Journals Library, National Institute for Health Research, Evaluation, Trials and Studies Coordinating Centre, Alpha House, University of Southampton SciencePark, Southampton SO16 7NS, UK.
71

Thus, there was evidence from the commercial literature to suggest that down-trading was smokers’behavioural response to the reduced affordability discussed in the previous chapter. Down-trading wasdiscussed as an issue in the commercial literature throughout the time period studied (2008–14) and wasseen as a more likely response to financial pressures than smoking cessation.
Nielsen data study 4: what are sales volumes overall and by tobacco typeover time?
Overall, the total volume of FM and RYO stick equivalents sold declined markedly in the UK: from50.5 billion sticks in 2009 to 42.6 billion sticks in 2015 (a 13% decline) (Figure 12 and see also Figure S13in Report Supplementary Material 2). However, the overall decline consisted of a 17% decline in FM sticksales but a 46% increase for RYO tobacco sales, although RYO tobacco sales stabilised post 2012. Seasonaleffects are apparent in both FM cigarettes and RYO tobacco (e.g. New Year’s resolutions and/or post-Christmas penury affect tobacco sales).
These data imply that smokers were moving from FM cigarettes to RYO tobacco. However, sales data donot provide information on smokers’ behaviour, so it is necessary to use the ITC data to assess this.
ITC data study 3: smokers’ tobacco purchasing behaviours by productand store type (licit purchases)
In this study, rather than using commercial data on product sales, we turn the question around and asksmokers what they purchased. These two approaches help to triangulate our results. Using ITC data,in addition to looking at overall RYO tobacco and FM cigarettes purchases, we were also able to breakdown FM cigarettes purchases into single packs and cartons. In this chapter, we are concerned with legal
5000
4500
4000
3500
3000
2500
Time point
2000
1500
1000
500
Nu
mb
er o
f st
icks
so
ld (
mill
ion
s)Ja
nuar
y 20
09Ju
ly 2
009
Mar
ch 2
010
budg
et
Janu
ary
2010
VAT
chan
geJu
ly 2
010
Mar
ch 2
011
budg
et
Janu
ary
2011
VAT
chan
geJu
ly 2
011
Mar
ch 2
012
budg
et
Janu
ary
2012
July
201
2M
arch
201
3 bu
dget
Janu
ary
2013
July
201
3M
arch
201
4 bu
dget
Janu
ary
2014
July
201
4M
arch
201
5 bu
dget
Janu
ary
2015
Decem
ber 2
015
July
201
5
April
2009
bud
get
FM cigarettesRYO tobaccoTotal FM + RYO
FIGURE 12 Nielsen data study 4: monthly tobacco sales volumes (millions of sticks sold) for FM cigarettes and RYOtobacco. Vertical reference lines are for December each year, marking the beginning of the Christmas/New Yearholiday period.
THE IMPACT OF TOBACCO TAX INCREASES ON SMOKERS’ LEGAL PURCHASING PATTERNS
NIHR Journals Library www.journalslibrary.nihr.ac.uk
72

purchases likely to be from legal sources, that is, UK store-based sources (using the same definitions as inITC data study 1, described in Chapter 4). Potential tax avoidance and evasion purchasing patterns areassessed in Chapter 8.
MethodsThe population-weighted proportion of smokers using cheap tobacco (types and sources) at each surveywas calculated. To test for linear trends in these proportions, clustered logistic regression analyses usingGEEs were employed. These analyses used a binomial distribution with a logit link function and anunstructured correlation matrix (or exchangeable when the unstructured failed to converge). In theseanalyses, covariates are not controlled for.
Results
Product typeOver the course of the study, exclusive RYO tobacco use increased significantly (main increase from 2002to 2010 then plateauing) and exclusive FM cigarette use decreased significantly (in 2014, 55% wereexclusive FM cigarette smokers, 30% were exclusive RYO tobacco users and 15% were a mix) (Table 13).Mixed FM cigarette and RYO tobacco use did not show a statistically significant linear trend, although theincrease from 10.2% in 2010 (± 95% CI 7.2% to 13.1%) to 18.2% in 2013 (± 95% CI 15.3% to 21.2%)coincided with the plateauing of exclusive RYO tobacco use.
There was also a significant linear increase over time in the proportion reporting that their last purchasewas their usual brand for exclusive FM cigarettes users, exclusive RYO tobacco users and mixed users.Typically, > 90% of exclusive FM cigarette or RYO tobacco smokers in each wave reported that their lastpurchase was their usual brand, compared with between 66.0% (± 95% CI 58.0% to 74.1%) in 2003 and83.8% (± 95% CI 74.9% to 92.8%) in 2010 for mixed users. This pattern suggests that exclusive FMcigarette or RYO tobacco smokers are most brand loyal, whereas brand loyalty among mixed users islower, although increasing with time.
Based on the last product purchased, FM cigarette purchases (both FM-P and FM-C) also declined significantlyas RYO tobacco purchases increased. In 2014, just under half (45.9%) reported purchasing a FM-P as theirlast purchase, one in six (16.9%) FM-C and 35% RYO tobacco.
Purchase sourceConsistently throughout the study period, most (≥ 80%) purchases were from UK store-based sources,mostly from convenience stores and supermarkets. Our GEE analysis (using an unstructured correlationmatrix; see Chapter 2) did not indicate any significant linear trends over time for UK purchase sourcesoverall (β = 0.019, 95% CI –0.002 to 0.041; p = 0.081); however, the QIC model fit comparison indicateda slightly better fit using an exchangeable correlation matrix (QIC = 15,014) when compared with anunstructured correlation matrix (QIC = 15,020) (see Table S1 in Report Supplementary Material 2). Theresults, using an exchangeable correlation matrix, did indicate a statistically significant increase over time inthe proportion of tobacco purchases, overall, from UK store-based sources (β = 0.018, 95% CI 0.0025 to0.033; p = 0.023). However, given our theoretical preference for the unstructured correlation matrix (seediscussion in Chapter 2) and the very small magnitude of difference between the QIC statistics, our focushere will remain on the findings using the unstructured correlation matrix (however, see the discussion inChapter 8 relating to purchases from non-UK/non-store sources).
With respect to the different tobacco types, at each survey, at least 97% of FM-P purchases were madefrom UK store-based sources. These ceiling effects precluded carrying out a statistical test for linear trend.Between 45% and 71% of FM-C purchases were from UK store-based sources, a significant linear increaseover time. RYO purchases from UK store-based sources also increased significantly over time (see Table 13).
DOI: 10.3310/phr08060 PUBLIC HEALTH RESEARCH 2020 VOL. 8 NO. 6
© Queen’s Printer and Controller of HMSO 2020. This work was produced by Partos et al. under the terms of a commissioning contract issued by the Secretary of State for Healthand Social Care. This issue may be freely reproduced for the purposes of private research and study and extracts (or indeed, the full report) may be included in professionaljournals provided that suitable acknowledgement is made and the reproduction is not associated with any form of advertising. Applications for commercial reproduction shouldbe addressed to: NIHR Journals Library, National Institute for Health Research, Evaluation, Trials and Studies Coordinating Centre, Alpha House, University of Southampton SciencePark, Southampton SO16 7NS, UK.
73

TABLE 13 International Tobacco Control Policy Evaluation Project data study 3: usual tobacco product, product last purchased and source of last purchase (weighted data),with tests for linear trends over time
Product purchased and source
ITC UK survey number (year)
Beta (95% CI)a for timetrends
1(2002)
2(2003)
3(2004)
4(2005)
5(2006)
6(2007)
7(2008) 8 (2010)
9(2013)
10(2014)
Usual tobacco product, %
FM cigarettes only 69.6 68.0 68.8 67.2 62.6 62.2 61.5 57.7 53.5 55.0 –0.044*** (–0.054 to –0.034)
Last purchase = usual 82.6 94.1 91.4 95.2 89.6 89.4 92.9 93.9 94.3 93.2 0083*** (0.055 to 0.111)
RYO tobacco only 17.5 19.3 20.3 22.5 25.0 26.5 24.7 30.0 28.3 30.3 0.057*** (0.042 to 0.072)
Last purchase = usual 78.9 90.2 86.7 98.3 90.1 95.0 94.2 95.5 87.1 95.9 0.104*** (0.060 to 0.149)
Mixed (combo of FM cigarettesand RYO tobacco)
12.9 12.5 10.9 10.2 12.4 11.2 13.7 10.2 18.2 14.5 0.014 (–0.002 to 0.030)
Last purchase = usual 69.1 66.0 75.4 81.7 73.2 78.3 73.8 83.8 77.1 83.0 0.048** (0.016 to 0.080)
Product last purchased, %
FM-P 59.4 58.0 58.3 57.1 52.4 47.6 51.6 45.2 49.0 45.9 –0.034*** (–0.044 to –0.023)
UK, store based 97.0 97.2 97.5 97.3 99.2 98.9 98.9 98.9 96.8 98.2 N/A
FM-C 21.4 20.5 20.2 19.6 17.8 18.4 17.1 16.7 15.2 16.9 –0.039*** (–0.04 to –0.025)
UK, store based 55.8 45.1 49.8 54.5 54.3 50.2 57.9 61.5 70.7 55.0 0.025* (0.003 to 0.048)
RYO tobacco 17.3 19.0 20.7 22.5 29.5 30.0 30.5 32.2 33.2 35.0 0.066*** (0.053 to 0.080)
UK, store based 71.7 64.9 68.1 65.6 69.4 78.1 66.7 74.2 82.9 80.0 0.045** (0.016 to 0.074)
Source of last purchase, %
UK, store based 83.7 79.9 81.6 81.8 82.4 83.3 81.5 83.2 87.1 83.7 0.019 (–0.002 to 0.041)
Convenience store 51.2 49.7 50.5 46.4 45.0 50.1 48.0 44.2 40.0 41.0 –0.033*** (–0.044 to –0.022)
Supermarket 41.4 42.4 44.5 49.8 50.6 47.4 47.9 52.4 54.1 54.2 0.040*** (0.028 to 0.051)
UK, store based otherb 7.4 7.9 5.0 3.9 4.4 2.6 4.0 3.4 5.9 4.8 –0.038** (–0.066 to –0.010)
*p < 0.05; **p < 0.01; ***p < 0.001. N/A, not applicable.a Tests for trend were not conducted (N/A) when floor or ceiling effects were apparent.b ‘UK, store based other’ category includes discount stores, tobacconists, bars/entertainment venues, off-licenses, vending machines and unclassified UK store-based responses.
THEIM
PACT
OFTO
BACCO
TAXINCREA
SESONSM
OKERS
’LEGALPU
RCHASIN
GPA
TTERNS
NIHRJournals
Librarywww.journalslibrary.nihr.ac.uk
74

Over the course of the study period, within purchases made from UK store-based sources, those made fromconvenience stores significantly decreased with a corresponding increase in purchases from supermarkets.By 2014, there were significantly more purchases from supermarkets (54.1%, ± 95% CI 50.0% to 58.1%)compared with convenience stores (40.0%, ± 95% CI 36.0% to 44.0%). The economic recession thatoccurred in the UK in the last quarter of 2008 may have contributed to this, as it was around this timethat supermarkets overtook convenience stores as the most popular purchase source.
LimitationsAs previously discussed, we cannot rule out the trading of illicit tobacco products from UK store-basedsources, such as ‘under-the-counter’ purchases. To mitigate this, we excluded purchases which had verylow prices, as described in Chapter 4.
ImplicationsUK smokers most commonly purchased from UK stores, but changed their purchasing patterns duringthe study period. Exclusive RYO tobacco use significantly increased, whereas exclusive FM cigarette usesignificantly decreased, with around one in six smokers smoking both FM cigarettes and RYO tobacco.Supermarkets also became more popular than convenience stores. Both these changes would haveconferred price reductions.
We have thus far (from commercial literature and ITC data) illustrated that FM cigarette sales and purchasesdeclined, whereas those for RYO tobacco grew. This suggests that reduced affordability of tobacco wasleading to changes in smokers’ behaviour, but was not necessarily stopping them buying tobacco products. Inthe next sections, FM cigarette and RYO tobacco sales are broken down to see if there is sales differentiationbetween high- and low-priced FM and RYO products to provide further evidence of down-trading.
Nielsen data study 5: what are sales volumes by differently pricedsegments over time?
Similar patterns of sales and purchasing of FM and RYO products, overall, were revealed using Nielsen andITC data. Nielsen data allow both FM and RYO products to be grouped into price segments. If down-tradingwas occurring, as reported in the commercial literature, we would expect to see volume decline in expensiveprice segments and volume growth in the cheap price segments.
ResultsChanges in volumes of FM and RYO sticks sold varied by segment (Figure 13 and see also Table S14in Report Supplementary Material 2). Among FM cigarettes, annual volumes of premium and mid-priceproducts declined markedly throughout the period (54% and 61% declines, respectively). Volumes ofFM value cigarettes grew by 126% over the study period, although growth slowed from mid-2011. Fromtheir introduction in 2012, volumes of FM subvalue cigarettes increased to 4.3 billion sticks in 2015.
Within the RYO tobacco segment, from 2009 to 2015, premium sales declined by 43%, whereas mid-pricevolumes grew by 78% overall, although they have stagnated since 2013. RYO value tobacco grew to2.3 billion stick equivalents, but growth slowed after 2012.
ImplicationsThe market share of price segments varied considerably over the study period. FM mid-price cigarettes andRYO premium tobacco were the most popular of each type of product at the beginning, whereas at theend of the study period FM value cigarettes and RYO mid-price tobacco were most popular. Tobacco salesdata therefore provide further evidence of down-trading, as sales of expensive FM and RYO productsdeclined, but sales of cheap FM and RYO products grew.
DOI: 10.3310/phr08060 PUBLIC HEALTH RESEARCH 2020 VOL. 8 NO. 6
© Queen’s Printer and Controller of HMSO 2020. This work was produced by Partos et al. under the terms of a commissioning contract issued by the Secretary of State for Healthand Social Care. This issue may be freely reproduced for the purposes of private research and study and extracts (or indeed, the full report) may be included in professionaljournals provided that suitable acknowledgement is made and the reproduction is not associated with any form of advertising. Applications for commercial reproduction shouldbe addressed to: NIHR Journals Library, National Institute for Health Research, Evaluation, Trials and Studies Coordinating Centre, Alpha House, University of Southampton SciencePark, Southampton SO16 7NS, UK.
75

ITC data study 4: impact of tobacco pricing changes on smokers’purchasing patterns and product choices (cross-sectional andlongitudinal analyses)
Although the Nielsen data can tell us that volumes changed, they cannot tell us about the behaviour ofindividual smokers over time. The longitudinal ITC study was set up for such analyses. We have alreadyestablished that smokers had ample opportunities to access cheap tobacco from legal sources. It is alsoevident that smokers could access tobacco in 2014 at 2002 prices and that there had been little changeover time in the prices smokers were paying for their tobacco, although overall affordability decreased.The aim of this study was to examine the extent to which smokers were taking the opportunity to buycheaper sources of tobacco, rather than stopping purchasing altogether.
The analyses presented here update and extend previous research by examining cross-sectional patterns inthe prevalence of cheap tobacco use between 2008 and 2014 (analysis 4a), and the longitudinal impactof tobacco pricing on purchase patterns among FM cigarette smokers at baseline over the same period(analysis 4b). All cheap purchases, licit and illicit, were included in this study, although frequency ofpurchasing illicit tobacco was controlled for (see Chapter 2).
Methods
DataParticipants were current adult smokers from the ITC UK surveys between 2008 and 2014 (four surveys,surveys 7–10) (see Table 4). Of the 2808 individuals who took part in at least one of these surveys, weexcluded 275 (9.8%) who were not smoking at least monthly when first surveyed, 44 (1.6%) who hadmissing data on their tobacco product type and 71 (2.5%) who had missing data on any of the othervariables of interest (see below), leaving a final cross-sectional sample (analysis 4a) of 2418 participantswho provided 4339 observations over the four surveys.
2000
1500
1000
Time point
500
0
Nu
mb
er o
f st
icks
so
ld (
mill
ion
s)Ja
nuar
y 20
09Ju
ly 2
009
Mar
ch 2
010
budg
et
Janu
ary
2010
VAT
chan
geJu
ly 2
010
Mar
ch 2
011
budg
et
Janu
ary
2011
VAT
chan
geJu
ly 2
011
Mar
ch 2
012
budg
et
Janu
ary
2012
July
201
2M
arch
201
3 bu
dget
Janu
ary
2013
July
201
3M
arch
201
4 bu
dget
Janu
ary
2014
July
201
4M
arch
201
5 bu
dget
Janu
ary
2015
Febr
uary
201
6
July
201
5
April
2009
bud
get
FM premiumFM mid-priceFM valueFM subvalueRYO premiumRYO mid-priceRYO value
FIGURE 13 Nielsen data study 5: monthly tobacco sales volumes (millions of sticks sold) for FM cigarettes and RYOtobacco, by price segments.
THE IMPACT OF TOBACCO TAX INCREASES ON SMOKERS’ LEGAL PURCHASING PATTERNS
NIHR Journals Library www.journalslibrary.nihr.ac.uk
76

A subset of this group was also included in longitudinal analyses if they were present in at least twoconsecutive surveys, thereby creating a ‘survey pair’ between the baseline and follow-up surveys. Eachindividual included in the longitudinal analyses provided at least one item of longitudinal data involvingone survey pair. Individuals could have taken part in more than one survey pair; for example, if anindividual had completed all four surveys they would have three longitudinal pieces of data [survey 7(baseline) to survey 8 (follow-up), survey 8 (baseline) to survey 9 (follow-up), and survey 9 (baseline) tosurvey 10 (follow-up)]. Thus, the maximum number of survey pairs that an individual could be involved inwas three, if they completed all four surveys.
MeasuresThe variable of primary interest was tobacco product type. Participants provided the specific brand variantof FM cigarettes they usually (if they indicated having a regular brand) or currently smoked. These wereclassified into one of three price segments: premium, mid-price or value, as described in Chapter 3. Thetwo cheapest FM segments (value and subvalue) were combined because of the low prevalence ofsubvalue brands in our ITC sample, a segment that only appeared on the market from 2012. RYO tobaccowas a fourth category.
We also examined the tobacco taxation increase rate, brand and product loyalty, when appropriate, toassess degree of adherence to particular brands/products, the HSI to assess level of tobacco dependenceand frequency of purchases from cheap (probably illicit) sources. Sociodemographic variables (sex, age,education, income, region of residence, relationship status and ethnicity) were also included, as were thesample design control variables of recruitment type (replenishment vs. recontacted samples) and surveymode (telephone vs. online). More details relating to these variables are provided in Chapter 2. The influenceof tobacco dependence and sociodemographics is discussed in Chapter 9, and of frequency of purchasesfrom cheap sources in Chapter 8; however, these variables were all controlled for in the present analyses.
For the longitudinal analysis (analysis 4b), we assessed the prevalence of product switching by examiningthe relationship between tobacco product type at baseline and product type at outcome. Baseline RYOtobacco smokers were excluded as they were not able to trade down. This resulted in the baseline–outcomematrix presented in Table 14, which we used to classify participants to one of four outcomes: (1) traded up/nochange, that is participants who remained smoking FM cigarettes from the same price segment or traded upto a more expensive segment (trading up was combined with no change because of its low prevalence of n = 74,comprising 5.4% of the sample); (2) traded down FM cigarettes, that is participants changed to a cheaper FMcigarette; (3) switch to RYO tobacco, that is participants switched from FM cigarettes to RYO tobacco; and(4) stop purchasing (having quit for at least 6 months with no relapse recorded at the time of the outcomesurvey). As the length of their quit attempt could not be determined, participants recorded as quit for < 6 monthsat outcome were excluded from analysis 4b.
TABLE 14 International Tobacco Control Policy Evaluation Project data study 4: classification matrix for productpurchase changes from baseline to outcome surveys
Baselinesurvey
Outcome survey
Premium FMcigarettes
Mid-price FMcigarettes
Value FMcigarettes RYO tobacco
Stoppurchasinga
Premium FMcigarettes
1. Traded up/nochange
2. Traded downFM cigarettes
2. Traded downFM cigarettes
3. Switch to RYOtobacco
4. Stop purchasing
Mid-price FMcigarettes
1. Traded up/nochange
1. Traded up/nochange
2. Traded downFM cigarettes
3. Switch to RYOTobacco
4. Stop purchasing
Value FMcigarettes
1. Traded up/nochange
1. Traded up/nochange
1. Traded up/nochange
3. Switch to RYOtobacco
4. Stop purchasing
a Stop purchasing defined as quitting for at least 6 months with no reported relapse at outcome survey.
DOI: 10.3310/phr08060 PUBLIC HEALTH RESEARCH 2020 VOL. 8 NO. 6
© Queen’s Printer and Controller of HMSO 2020. This work was produced by Partos et al. under the terms of a commissioning contract issued by the Secretary of State for Healthand Social Care. This issue may be freely reproduced for the purposes of private research and study and extracts (or indeed, the full report) may be included in professionaljournals provided that suitable acknowledgement is made and the reproduction is not associated with any form of advertising. Applications for commercial reproduction shouldbe addressed to: NIHR Journals Library, National Institute for Health Research, Evaluation, Trials and Studies Coordinating Centre, Alpha House, University of Southampton SciencePark, Southampton SO16 7NS, UK.
77

AnalysesInitially, patterns in the prevalence of cheap tobacco product use over time were assessed descriptively,then two analyses performed.
Analysis 4aAnalysis 4a (2418 participants providing 4339 observations) was a cross-sectional analysis usingaggregated data from all four surveys. Given the categorical outcome (premium FM cigarettes, mid-priceFM cigarettes, value FM cigarettes or RYO tobacco), we used multinomial logistic regression analyses ofsurvey responses clustered over individuals.
Analysis 4bAnalysis 4b (854 participants providing 1397 observations) was longitudinal, using aggregated data fromthe three consecutive baseline–outcome survey pairs, with only smokers of FM cigarettes at baselineincluded. Similarly, multinomial logistic regression analyses (survey response clustered over individuals) wereconducted. Characteristics were measured at baseline, with the exception of the tobacco tax increase rate,which was measured at outcome.
For both analyses, only participants with valid data on all covariates were included. Analyses were checkedfor variable multicollinearity and fully adjusted results are reported (for all covariates, including thosedescribed in later chapters).
ResultsSample characteristics for the cross-sectional sample (analysis 4a) are presented in Table 15 and arebroadly similar to the characteristics of the longitudinal subsample in analysis 4b (data not shown). Overall,25.0% of participants smoked premium FM cigarettes, 25.6% smoked mid-price FM cigarettes, 19.0%smoked value FM cigarettes and 30.4% smoked RYO tobacco. Only 4.2% of observations were made inan interval in which the tobacco tax increase rate was 5%. The vast majority (93.2%) were brand andproduct loyal (87.6%).
Patterns in the prevalence of cheap tobacco product use over timeOverall, the use of cheap tobacco (mid-price FM cigarettes, value FM cigarettes and RYO tobacco) in oursample increased modestly, but significantly, from 72.4% (95% CI 70.1% to 74.7%) in 2008 to 77.6%(95% CI 75.0% to 80.2%) in 2014, with a corresponding drop in premium FM cigarettes from 27.6%(95% CI 25.3% to 29.9%) in 2008 to 22.4% (95% CI 19.8% to 25.0%) in 2014 (Figure 14). The greatestincrease (17 percentage points) was observed for value FM cigarettes and there was actually a decreaseof 15 percentage points in mid-price FM cigarette use. These time-related trends were interrupted in the2012 tax year, when the rate of tobacco tax increase was highest (5% above inflation) and there was anapparent marked dip in premium and mid-price FM cigarettes and a spike in value FM cigarette and RYOtobacco use. These patterns mirror those in the Nielsen tobacco sales data.
Analysis 4a: aggregate cross-sectional predictors of product choiceIn the aggregated data, analysis 4a (Table 16), value FM cigarettes and/or RYO tobacco were more likely tobe used than premium FM cigarettes when there was a higher tobacco tax increase rate. In addition, RYOtobacco was more likely to be smoked than premium FM cigarettes by smokers who were not brand-loyal.
Analysis 4b: aggregate longitudinal predictors of changing smoking behaviourAnalysis 4b (Table 17) examined the predictors of changing smoking behaviour among baseline smokers ofFM cigarettes only (trading down to cheaper FM cigarettes, switching to RYO tobacco or stopping purchasing)compared with traded up/no change. Traded up/no change between the baseline and outcome surveyswas most common at 72.0%, comprising not changing (66.5%) and traded up (5.5%). A further 13.5%traded down to cheaper FM cigarettes, 6.2% switched from FM cigarettes to RYO tobacco and 8.3%stopped purchasing tobacco products for at least 6 months. Large tobacco tax increases were the only
THE IMPACT OF TOBACCO TAX INCREASES ON SMOKERS’ LEGAL PURCHASING PATTERNS
NIHR Journals Library www.journalslibrary.nihr.ac.uk
78

TABLE 15 International Tobacco Control Policy Evaluation Project study 4: descriptives for the cross-sectional sample (aggregate data from four surveys) used in analysis 4a,by product type
Sample characteristics
Total (100%)
FM cigarettes
RYO tobacco (30.4%)Premium (25.0%) Mid-price (25.6%) Value (19.0%)
Observations(n) %
Observations(n) %
Observations(n) %
Observations(n) %
Observations(n) %
Total 4339 100 1085 100 1111 100 824 100 1319 100
Tobacco tax increase rate (%)a
0 1424 32.8 393 36.2 490 44.1 139 16.9 402 30.5
1 892 20.6 234 21.6 238 21.4 134 16.3 286 21.7
2 1841 42.4 425 39.2 359 32.3 493 59.8 564 42.8
5 182 4.2 33 3.0 24 2.2 58 7.0 67 5.1
Dependence (HSI)
Low 1893 43.6 539 49.7 493 44.4 330 40.0 531 40.3
Moderate 2124 49.0 472 43.5 551 49.6 435 52.8 666 50.5
High 322 7.4 74 6.8 67 6.0 59 7.2 122 9.2
Sex
Female 2345 54.0 565 52.1 718 64.6 541 65.7 521 39.5
Male 1994 46.0 520 47.9 393 35.4 283 34.3 798 60.5
continued
DOI:10.3310/phr08060
PUBLIC
HEA
LTHRESEA
RCH2020
VOL.8
NO.6
©Queen
’sPrinter
andController
ofHMSO
2020.This
work
was
producedby
Partoset
al.under
theterm
sof
acom
missioning
contractissued
bythe
Secretaryof
Statefor
Health
andSocialC
are.This
issuemay
befreely
reproducedfor
thepurposes
ofprivate
researchand
studyand
extracts(or
indeed,the
fullreport)may
beincluded
inprofessional
journalsprovided
thatsuitable
acknowledgem
entismade
andthe
reproductionisnot
associatedwith
anyform
ofadvertising.
Applications
forcom
mercialreproduction
shouldbe
addressedto:
NIHRJournals
Library,NationalInstitute
forHealth
Research,Evaluation,
Trialsand
StudiesCoordinating
Centre,
Alpha
House,
University
ofSoutham
ptonScience
Park,Southam
ptonSO
167N
S,UK.
79

TABLE 15 International Tobacco Control Policy Evaluation Project study 4: descriptives for the cross-sectional sample (aggregate data from four surveys) used in analysis 4a,by product type (continued )
Sample characteristics
Total (100%)
FM cigarettes
RYO tobacco (30.4%)Premium (25.0%) Mid-price (25.6%) Value (19.0%)
Observations(n) %
Observations(n) %
Observations(n) %
Observations(n) %
Observations(n) %
Age (years)
18–39 1002 23.1 255 23.5 312 28.1 129 15.7 306 23.2
40–54 1803 41.6 470 43.3 416 37.4 420 51.0 497 37.7
≥ 55 1534 35.4 360 33.2 383 34.5 275 33.4 516 39.1
Education
Low 2298 53.0 458 42.2 602 54.2 511 62.0 727 55.1
Moderate 1210 27.9 317 29.2 334 30.1 205 24.9 354 26.8
High 831 19.2 310 28.6 175 15.8 108 13.1 238 18.0
Income
Low 1043 24.0 189 17.4 251 22.6 241 29.2 362 27.4
Moderate 1636 37.7 365 33.6 442 39.8 339 41.1 490 37.1
High 1286 29.6 446 41.1 329 29.6 186 22.6 325 24.6
Not disclosed 374 8.6 85 7.8 89 8.0 58 7.0 142 10.8
Region
London 474 10.9 180 16.6 100 9.0 75 9.1 119 9.0
Northern 929 21.4 185 17.1 286 25.7 220 26.7 238 18.0
Midlands and Eastern 1067 24.6 280 25.8 257 23.1 173 21.0 357 27.1
Southern 967 22.3 234 21.6 176 15.8 188 22.8 369 28.0
Outside England 902 20.8 206 19.0 292 26.3 168 20.4 236 17.9
THEIM
PACT
OFTO
BACCO
TAXINCREA
SESONSM
OKERS
’LEGALPU
RCHASIN
GPA
TTERNS
NIHRJournals
Librarywww.journalslibrary.nihr.ac.uk
80

Sample characteristics
Total (100%)
FM cigarettes
RYO tobacco (30.4%)Premium (25.0%) Mid-price (25.6%) Value (19.0%)
Observations(n) %
Observations(n) %
Observations(n) %
Observations(n) %
Observations(n) %
Relationship status
Single 2147 49.5 485 44.7 526 47.3 443 53.8 693 52.5
Partnered 2192 50.5 600 55.3 585 52.7 381 46.2 626 47.5
Ethnicity
White 4095 94.4 973 89.7 1062 95.6 788 95.6 1272 96.4
Not white 244 5.6 112 10.3 49 4.4 36 4.4 47 3.6
Brand loyalty
No 293 6.8 55 5.1 55 5.0 66 8.0 117 8.9
Yes 4046 93.2 1030 94.9 1056 95.0 758 92.0 1202 91.1
Product loyalty
No 540 12.4 143 13.2 133 12.0 101 12.3 163 12.4
Yes 3799 87.6 942 86.8 978 88.0 723 87.7 1156 87.6
Recruitment type
Replenish 1245 28.7 327 30.1 333 30.0 252 30.6 333 25.2
Recontact 3094 71.3 758 69.9 778 70.0 572 69.4 986 74.8
Survey mode
Telephone 2853 65.8 705 65.0 813 73.2 443 53.8 892 67.6
Online 1486 34.2 380 35.0 298 26.8 381 46.2 427 32.4
a Tobacco tax increase rate was determined on the basis of the date surveyed rather than individual survey responses or baseline characteristics.NotePercentage distributions were comparable for the longitudinal analysis.
DOI:10.3310/phr08060
PUBLIC
HEA
LTHRESEA
RCH2020
VOL.8
NO.6
©Queen
’sPrinter
andController
ofHMSO
2020.This
work
was
producedby
Partoset
al.under
theterm
sof
acom
missioning
contractissued
bythe
Secretaryof
Statefor
Health
andSocialC
are.This
issuemay
befreely
reproducedfor
thepurposes
ofprivate
researchand
studyand
extracts(or
indeed,the
fullreport)may
beincluded
inprofessional
journalsprovided
thatsuitable
acknowledgem
entismade
andthe
reproductionisnot
associatedwith
anyform
ofadvertising.
Applications
forcom
mercialreproduction
shouldbe
addressedto:
NIHRJournals
Library,NationalInstitute
forHealth
Research,Evaluation,
Trialsand
StudiesCoordinating
Centre,
Alpha
House,
University
ofSoutham
ptonScience
Park,Southam
ptonSO
167N
S,UK.
81

significant predictor of all these behaviours. Smokers were significantly more likely to alter their smokingbehaviour at the highest tax increase rate (5%) than at the lowest tax increase rate (1%).
LimitationsOwing to survey timings, only 4.2% of observations across the data set experienced the highest tobaccotax increase rate (of 5%), which could be allocated only to participants surveyed during February 2013and, hence, there is the possibility that this is a seasonal effect only. Our analysis of Nielsen data indicatedthat price increases in response to taxation changes occurred throughout the year (see Chapter 4), ratherthan all at once, which would make it less likely that there were seasonal patterns for switching anddown-trading.
ConclusionsCheaper tobacco products (mid-price FM cigarettes, value FM cigarettes and RYO tobacco) were usedby 72% of our sample in 2008, consistent with the 71% reported in our earlier work.12 This increasedby six percentage points by 2014; a modest increase in comparison to prior years (15 percentage pointsincrease from 2001 to 200812), although use of the cheapest type of FM cigarettes (value FM cigarettes)rose by 17 percentage points during the period. Continuing with the same products and down-tradingto a cheaper FM product were more common outcomes for smokers than stopping purchasing tobacco.Switching to RYO tobacco was a similar proportion to stopping.
Summary
Commercial literature and ITC data indicate that smokers changed their purchasing patterns in response totobacco price increases and changes in affordability. Although store-based purchases remained the mostcommon source, supermarkets became more popular than convenience stores, which would have conferreda price reduction.
Premium FM Mid-price FM Value FM RYO
40.0
Time point
35.0
30.0
25.0
20.0
15.0
10.0
5.0
0.0
Perc
enta
ge
usi
ng
pro
du
ct
2008
(0%
)
2010
(1%
)
2012
(5%
)
2013
(2%
)
2014
(2%
)
2008
(0%
)
2010
(1%
)
2012
(5%
)
2013
(2%
)
2014
(2%
)
2008
(0%
)
2010
(1%
)
2012
(5%
)
2013
(2%
)
2014
(2%
)
2008
(0%
)
2010
(1%
)
2012
(5%
)
2013
(2%
)
2014
(2%
)
FIGURE 14 International Tobacco Control Policy Evaluation Project data study 4: percentage of participants usingeach product type over time (tax year) with tobacco tax increase rates (per cent above inflation) in brackets. Notethat these data are from the cross-sectional sample (analysis 4a, n= 2418, observations = 4339). Error bars represent95% CIs.
THE IMPACT OF TOBACCO TAX INCREASES ON SMOKERS’ LEGAL PURCHASING PATTERNS
NIHR Journals Library www.journalslibrary.nihr.ac.uk
82

TABLE 16 International Tobacco Control Policy Evaluation Project data study 4 (analysis 4a): fully adjusted clustered, multinomial logistic regression of tobacco product type(premium FM cigarettes is reference, with 25.0% using this product) on individual-level predictors (tax increase rates, brand and product loyalty) (n= 2418, observations= 4339)
Individual-level predictors
FM cigarettes
Mid-price (25.6%) Value (19.0%) RYO tobacco (30.4%)
RRR 95% CI p-value RRR 95% CI p-value RRR 95% CI p-value
Tobacco tax increase rate (%) Overall effect for tobacco tax increase rate: χ2(9) = 187.43; p < 0.0001
0 Ref Ref Ref
1 0.92 0.76 to 1.12 0.401 1.58 1.25 to 2.00 < 0.001 1.36 1.15 to 1.61 < 0.001
2 0.83 0.64 to 1.08 0.160 4.17 3.13 to 5.54 < 0.001 2.24 1.75 to 2.86 < 0.001
5 0.81 0.47 to 1.38 0.434 5.39 3.36 to 8.67 < 0.001 3.60 2.32 to 5.58 < 0.001
Brand loyalty
No Ref Ref Ref
Yes 1.00 0.65 to 1.55 0.988 0.64 0.41 to 1.01 0.053 0.62 0.41 to 0.92 0.017
Product loyalty
No Ref Ref Ref
Yes 0.95 0.70 to 1.30 0.762 0.94 0.67 to 1.32 0.731 0.81 0.60 to 1.10 0.173
Recruitment type
Replenish Ref Ref Ref
Recontact 0.87 0.70 to 1.08 0.210 1.05 0.83 to 1.33 0.707 1.38 1.11 to 1.72 0.004
Survey mode
Telephone Ref Ref Ref
Online 0.91 0.80 to 1.03 0.145 1.04 0.91 to 1.19 0.592 0.81 0.71 to 0.92 0.001
Ref, reference; RRR, relative risk ratio.NotesTobacco tax increase rates are presented as per cent above inflation.RRRs are for the fully adjusted model.
DOI:10.3310/phr08060
PUBLIC
HEA
LTHRESEA
RCH2020
VOL.8
NO.6
©Queen
’sPrinter
andController
ofHMSO
2020.This
work
was
producedby
Partoset
al.under
theterm
sof
acom
missioning
contractissued
bythe
Secretaryof
Statefor
Health
andSocialC
are.This
issuemay
befreely
reproducedfor
thepurposes
ofprivate
researchand
studyand
extracts(or
indeed,the
fullreport)may
beincluded
inprofessional
journalsprovided
thatsuitable
acknowledgem
entismade
andthe
reproductionisnot
associatedwith
anyform
ofadvertising.
Applications
forcom
mercialreproduction
shouldbe
addressedto:
NIHRJournals
Library,NationalInstitute
forHealth
Research,Evaluation,
Trialsand
StudiesCoordinating
Centre,
Alpha
House,
University
ofSoutham
ptonScience
Park,Southam
ptonSO
167N
S,UK.
83

TABLE 17 International Tobacco Control Policy Evaluation Project data study 4 (analysis 4b): fully adjusted clustered, multinomial logistic regression of tobacco purchasechanges (trading up/staying the same is reference, with 72.0% achieving this outcome) on individual-level predictors (tax increase rates, brand and product loyalty)(n= 854, observations = 1397)
Individual-level predictors
Trade down to FM cigarettes (13.5%) Switch to RYO tobacco (6.2%) Stop purchasinga (8.3%)
RRR 95% CI p-value RRR 95% CI p-value RRR 95% CI p-value
Tobacco tax increase rate (%) Overall effect for tobacco tax increase rate: χ2(6) = 40.36; p < 0.0001
1 Ref Ref Ref
2 1.15 0.78 to 1.71 0.481 1.48 0.84 to 2.61 0.179 1.42 0.88 to 2.30 0.151
5 4.13 2.33 to 7.35 < 0.001 5.87 2.66 to 12.98 < 0.001 2.89 1.38 to 6.01 0.005
Brand loyalty
No Ref Ref Ref
Yes 0.96 0.47 to 1.96 0.915 0.99 0.36 to 2.71 0.983 1.15 0.43 to 3.06 0.782
Recruitment type
Replenish Ref Ref Ref
Recontact 1.58 1.00 to 2.51 0.052 1.00 0.55 to 1.83 0.991 0.96 0.58 to 1.56 0.857
Survey mode
Telephone Ref Ref Ref
Online 0.88 0.71 to 1.09 0.247 0.76 0.55 to 1.03 0.077 0.90 0.70 to 1.17 0.443
Ref, reference; RRR, relative risk ratio.a Not purchasing because currently (at time of outcome survey) had quit for at least 6 months.NotesValues in bold are significant.Tobacco tax increase rates are presented as per cent above inflation.RRRs are for the fully adjusted model.All predictors are measured at baseline, except for tobacco tax rates, which were measured at the outcome survey.Participants smoking RYO tobacco at baseline were excluded. Participants who were currently quit at outcome but for under 6 months are excluded.
THEIM
PACT
OFTO
BACCO
TAXINCREA
SESONSM
OKERS
’LEGALPU
RCHASIN
GPA
TTERNS
NIHRJournals
Librarywww.journalslibrary.nihr.ac.uk
84

There was evidence of down-trading in both the ITC and Nielsen data: exclusive RYO tobacco usesignificantly increased, whereas exclusive FM cigarette use significantly decreased and around one insix smokers smoked both FM cigarettes and RYO tobacco. Furthermore, the market share of FM and RYOproduct segments varied considerably over the study period. FM mid-price cigarettes and RYO premiumtobacco were the most popular of each product type at the outset, but at the end FM value cigarettes andRYO mid-price tobacco were most common.
The ITC data from 2008 to 2014 indicated that cheap (non-premium FM cigarettes and RYO tobacco)were used by > 70% of smokers and consistent with the Nielsen data, there were some changes in thedifferent types of cheap tobacco products over time, which seemed to be related to tobacco tax increases.Despite the tax rises that took place over this period, smokers were more likely to continue to purchase thesame product or down-trade to a cheaper product than they were to stop purchasing tobacco products.
DOI: 10.3310/phr08060 PUBLIC HEALTH RESEARCH 2020 VOL. 8 NO. 6
© Queen’s Printer and Controller of HMSO 2020. This work was produced by Partos et al. under the terms of a commissioning contract issued by the Secretary of State for Healthand Social Care. This issue may be freely reproduced for the purposes of private research and study and extracts (or indeed, the full report) may be included in professionaljournals provided that suitable acknowledgement is made and the reproduction is not associated with any form of advertising. Applications for commercial reproduction shouldbe addressed to: NIHR Journals Library, National Institute for Health Research, Evaluation, Trials and Studies Coordinating Centre, Alpha House, University of Southampton SciencePark, Southampton SO16 7NS, UK.
85


Chapter 7 The impact of tobacco tax increases,as moderated by tobacco industry pricing, onsmoking behaviour via quitting and reducingtobacco consumption
Introduction
In Chapter 4 we showed how TI pricing strategies, tobacco taxes and the recession reduced the affordability oftobacco. In Chapter 6 we showed how this reduced affordability led to changes in smokers’ purchase patterns,with many tobacco smokers trading down to cheaper products, such as subvalue FM cigarettes and RYOtobacco, particularly cheap RYO tobacco. These cheap products were still available in a high-tax environmentthrough the introduction of cheaper brand variants by the TI, smaller packs and price-marked packs (seeChapters 4 and 6). In this chapter, using the ITC data, we consider smoking behaviours (quitting and smokingsmaller RYO cigarettes). Although quitting leads to health gains, smoking fewer or smaller cigarettes does notnecessarily do so. This is because smokers can smoke their smaller cigarettes more intensively, thus being exposedto similar levels of carcinogens. In addition, much of the negative health impact, particularly the cardiovascularimpacts, occur at low doses of exposure.226 For unequivocal health gains smoking cessation is required.
ITC data study 5: impact of tobacco pricing changes on quittingbehaviours (longitudinal analyses)
The analyses presented here extend those presented in Chapter 6 (ITC data study 4). Here, our researchquestion is whether or not smoking different products is associated with quit attempts and 6-month quitsuccess over time.
Methods
Data and analysesThe samples were taken from the same four ITC surveys (surveys 7–10) as the ITC data study 4 describedin Chapter 6. Analyses were longitudinal, so only participants who remained in the study for at least twoconsecutive surveys were included. As previously, we included only current (at baseline) at least monthlysmokers who had valid data on all variables of interest. Data were aggregated across the three survey pairsand we assessed two quitting outcomes. Analysis 5a focused on quit attempts: whether or not participantsreported having made any quit attempts between the baseline and outcome surveys (n = 1304 participantsproviding 2202 observations). Analysis 5b focused on 6-month sustained quitting: whether or notparticipants had achieved at least 6 months’ sustained smoking abstinence at any point between thebaseline and outcome surveys, regardless of status at the outcome survey (n = 1194 participants providing2017 observations). As with analysis 4b of ITC data study 4, participants who had quit at the time of theoutcome survey but for < 6 months (8.4% of potentially valid observations) were excluded, as it could notbe determined if this quit attempt eventually lasted for at least 6 months.
Both analyses had binary outcomes and used logistic regression, with odds ratios (ORs) reported. Theregressions clustered survey pairs within individuals. Models were checked for variable multicollinearity andfully adjusted results are reported.
MeasuresIndependent variables were the same as in Chapter 6: tobacco tax increase rate, product choice at baseline(premium FM cigarettes, mid-price FM cigarettes, value FM cigarettes or RYO tobacco), brand and product
DOI: 10.3310/phr08060 PUBLIC HEALTH RESEARCH 2020 VOL. 8 NO. 6
© Queen’s Printer and Controller of HMSO 2020. This work was produced by Partos et al. under the terms of a commissioning contract issued by the Secretary of State for Healthand Social Care. This issue may be freely reproduced for the purposes of private research and study and extracts (or indeed, the full report) may be included in professionaljournals provided that suitable acknowledgement is made and the reproduction is not associated with any form of advertising. Applications for commercial reproduction shouldbe addressed to: NIHR Journals Library, National Institute for Health Research, Evaluation, Trials and Studies Coordinating Centre, Alpha House, University of Southampton SciencePark, Southampton SO16 7NS, UK.
87

loyalty, tobacco dependence (HSI), frequency of cheap purchases, sociodemographic variables (sex, age,education, income, region of residence, relationship status and ethnicity) and sample design variables (seeChapter 2 for more details). Characteristics were measured at baseline, with the exception of the tobaccotax increase rate, which was measured at outcome. Results pertaining to frequency of cheap purchases arediscussed in Chapter 8, and to tobacco dependence and sociodemographics in Chapter 9.
ResultsIn analysis 5a (Table 18), a quit attempt was made by 39.4% of smokers. Overall, baseline tobacco producttype significantly predicted making a quit attempt. However, those using cheaper tobacco (mid-price FMcigarettes, value FM cigarettes or RYO tobacco) did not significantly differ from users of premium FM
TABLE 18 International Tobacco Control Policy Evaluation Project data study 5: fully adjusted clustered logisticregression of making a quit attempt and achieving at least 6 months’ sustained abstinence
Predictors
Analysis
5a: making a quit attempt (n= 1304,observations= 2202)
5b: achieving at least 6 months’ quit(n= 1194, observations= 2017)
OR 95% CI p-value OR 95% CI p-value
Tobacco product type χ2(3) = 7.95; p < 0.05 χ2(3) = 8.78; p < 0.05
Premium FM cigarettes Ref Ref
Mid-price FM cigarettes 1.28 0.90 to 1.82 0.167 2.31 1.17 to 4.55 0.016
Value FM cigarettes 1.31 0.89 to 1.94 0.174 2.81 1.35 to 5.88 0.006
RYO tobacco 0.83 0.59 to 1.18 0.308 2.22 1.15 to 4.29 0.018
Tobacco tax increase rate (%) χ2(2) = 7.79; p < 0.05 χ2(2) = 6.29; p < 0.05
1 Ref Ref
2 1.47 1.11 to 1.93 0.006 1.96 1.07 to 3.62 0.030
5 1.45 0.93 to 2.26 0.100 2.66 1.16 to 6.08 0.020
Brand loyalty
No Ref Ref
Yes 0.66 0.40 to 1.09 0.108 0.89 0.38 to 2.07 0.784
Product loyalty
No Ref Ref
Yes 1.46 0.98 to 2.17 0.062 1.08 0.54 to 2.18 0.824
Recruitment type
Replenish Ref Ref
Recontact 0.89 0.67 to 1.20 0.462 1.35 0.75 to 2.42 0.3112
Survey mode
Telephone Ref Ref
Online 1.01 0.86 to 1.18 0.932 0.92 0.72 to 1.20 0.552
Ref, reference.NotesIn analysis 5a, 39.4% made a quit attempt and, in analysis 5b, 9.7% achieved sustained abstinence for at least 6 months,between baseline and outcome surveys.Tobacco tax increase rates are presented as per cent above inflation.ORs are for the fully adjusted model.Chi-squared statistics are for overall effects of any variables with three or more categories.All predictors are measured at baseline, except for tobacco tax rates, which are measured at the outcome survey.Achieving at least 6 months’ quit is defined as achieving at least 6 months’ sustained abstinence between the baseline andoutcome surveys, regardless of status at the outcome survey. Participants currently quit for < 6 months at the outcomesurvey were excluded from analysis 5b.Values in bold are significant.
THE IMPACT OF TOBACCO TAX INCREASES ON QUITTING AND REDUCING TOBACCO CONSUMPTION
NIHR Journals Library www.journalslibrary.nihr.ac.uk
88

cigarettes in their likelihood of trying to quit. To help understand the overall significant finding better, whenRYO tobacco was used as the reference category, those smoking mid-price FM cigarettes (OR 1.54, 95% CI1.08 to 2.18) and value FM cigarettes (OR 1.57, 95% CI 1.07 to 2.31) were significantly more likely to tryto quit (data not shown). Quit attempts were more likely at the higher tax increase rate of 2% rather than1% above inflation (OR for 5% was consistent with the 2% tax increase rate, but non-significant). Nosignificant associations were observed between quit attempts and brand or product loyalty.
In analysis 5b, sustaining a quit attempt of at least 6 months was achieved by 9.7% of participants andwas significantly more likely among smokers of mid-price FM cigarettes, value FM cigarettes and RYOtobacco, compared with premium FM cigarettes (see Table 18). Quitting was more likely the higher thetobacco tax increase rate at the outcome survey. Neither brand nor product loyalty was significantlyassociated with sustained quitting.
LimitationsAs described in Chapter 6, only 4.2% of observations across the data set experienced the highest tobaccotax increase rate (of 5%) in February 2013 and, hence, it is possible that this is a seasonal effect only.However, smokers surveyed in February 2013 could have begun their quit attempt any time betweenJuly 2010 (if they were interviewed at the beginning of the second survey) and July 2012 in order tohave achieved a minimum of 6 months quit by the time they were reinterviewed for the third survey inFebruary 2013; this would mean that there were a number of months over which the March 2012 5% taxincrease could have had an impact on the findings (March 2012–July 2012), thus reducing the chances ofa seasonal effect being responsible. Our assessment of quitting for at least 6 months meant that thosewho had quit for < 6 months at the follow-up surveys were excluded. As most smokers relapse soon afterquitting, our interest was in those who were able to sustain a quit attempt for a longer period of time.
ImplicationsOverall, baseline tobacco product type significantly predicted making a quit attempt and the likelihoodof achieving at least 6 months’ abstinence at follow-up. Those smoking mid-price or value FM cigaretteswere more likely to make a quit attempt than those smoking RYO tobacco. Six months’ abstinence wassignificantly more likely among smokers of mid-price FM cigarettes, value FM cigarettes and RYO tobaccothan among premium FM cigarette smokers. Quit attempts and success were also more likely duringperiods of higher tobacco tax increase rates. Whether smokers had a usual brand, were exclusive or weremixed users was also not associated with the quitting outcomes.
ITC data study 6: weight of roll-your-own tobacco cigarettes, analysisover time and international comparison
In this study, we assessed how the weight of RYO tobacco changed among UK users over time and bydemographic groups (see Chapter 9). We were interested in whether or not the weight of tobacco usedin RYO cigarettes reduced as prices increased. We also compared these data with three other countries:Australia, Canada and the USA, which were also included in the ITC four-country study and used similarmethodologies, but had different tobacco tax environments. There were some differences in survey timingsin the other countries (see Table S15 in Report Supplementary Material 2).
Methods
DataData for this study were from surveys 5–10 (2006–15; see Table 4), as questions relating to the weightof RYO tobacco were not included in the earlier surveys. Over the four countries, there were 19,277participants providing 42,238 observations over these six surveys. The study focused only on currentexclusive daily RYO tobacco smokers, so 18,048 individuals who provided 38,445 observations weretherefore excluded [current quitters or of unknown smoking status (n = 5830, observations = 9594);
DOI: 10.3310/phr08060 PUBLIC HEALTH RESEARCH 2020 VOL. 8 NO. 6
© Queen’s Printer and Controller of HMSO 2020. This work was produced by Partos et al. under the terms of a commissioning contract issued by the Secretary of State for Healthand Social Care. This issue may be freely reproduced for the purposes of private research and study and extracts (or indeed, the full report) may be included in professionaljournals provided that suitable acknowledgement is made and the reproduction is not associated with any form of advertising. Applications for commercial reproduction shouldbe addressed to: NIHR Journals Library, National Institute for Health Research, Evaluation, Trials and Studies Coordinating Centre, Alpha House, University of Southampton SciencePark, Southampton SO16 7NS, UK.
89

exclusive FM cigarette smokers (n = 12,813, observations = 25,573); those smoking a mixture of FMcigarettes and RYO tobacco, as the RYO tobacco questions needed to derive weight were not askedconsistently (n = 2121, observations = 2919); those who did not report what type of tobacco they smoked(n = 192, observations = 202); and non-daily smokers (n = 114, observations = 157)]. Of the remaining1924 individuals (providing 3793 observations), we excluded a further 410 observations for missinginformation (86 observations for incomplete data on other variables of interest and 121 observations forlikely misreporting of RYO tobacco weights). For the latter, we used the criteria reported by Gallus andcolleagues,234 by excluding anyone with a weight per cigarette of < 0.1 g or > 3.0 g. The final sampletherefore consisted of 1639 individuals who provided 3176 observations over the six surveys (averaging1.9 observations per participant). Characteristics for this sample are displayed in Table 19.
Sociodemographic measuresAcross all countries, age was grouped into 18–39 years (18–24 year olds comprised only 2.9% of observations),40–54 years and ≥ 55 years. There were some measurement differences for Australia, Canada and the USA,compared with the UK. In Australia, the ethnicity measure gauged whether participants spoke only English athome or English as a secondary language. Education was stratified slightly differently in each country due todiffering education systems, but broadly corresponded to low (high school or lower), moderate (trade school,technical or community college or some university but no degree) and high (completed university). Income wasbased on annual household income before tax and stratified as low [< US$30,000 (Canada, USA and Australia)or < £15,000 (UK)], moderate [US$30,000–59,000 (Canada, USA and Australia) or £15,000–40,000 (UK)]or high [≥ US$60,000 (Canada, USA and Australia) or ≥ £40,001 (UK)]. Participants who did not disclosetheir income (around 8.5% of the sample) were retained as a separate valid category.
Weight of tobaccoWe calculated the weight of tobacco per cigarette as described in Chapter 2, based on participants’ lastreported tobacco purchase.
AnalysesEach observation was allocated to the calendar year of the survey (see Table S15 in Report SupplementaryMaterial 2) and time was treated as a continuous variable in the analyses. TTFC was used as the indicatorof nicotine dependence and treated as a continuous variable (CPD and HSI were used to calculate tobaccoweights so could not be used).
There were too few observations for Canada and the USA (see Table 19) to enable reliable statisticalanalyses of trends. To compare the weight per cigarette across countries, we therefore pooled the dataacross all survey waves. A clustered linear regression analysis was carried out, with weight as outcome andcountry as predictor. We controlled for TTFC and the sociodemographic measures, and used maximumlikelihood estimation with a robust variance estimator.
To assess changes in weight of RYO tobacco over time, and the effects of sociodemographic differences,only the UK and Australia (n = 1349, observations = 2705) were included. We conducted multilevel linearregression analyses clustered over individuals, with maximum likelihood estimation and robust varianceestimators. The outcome variable was weight of tobacco per cigarette and the predictor variables were time(calendar year), country (UK vs. Australia), TTFC and the sociodemographic variables. We first examined theunadjusted univariate effects of each predictor variable and then looked at the fully adjusted multivariateeffects in which all predictors were included simultaneously. We report the sociodemographic findingsin Chapter 9.
ResultsSample characteristics are presented in Table 19. A missing data comparison between the 1924 individualssuitable for the RYO tobacco weight study and the final sample of 1639 individuals indicated that the finalsample featured participants who were significantly more likely to be from Australia or the UK, be male,
THE IMPACT OF TOBACCO TAX INCREASES ON QUITTING AND REDUCING TOBACCO CONSUMPTION
NIHR Journals Library www.journalslibrary.nihr.ac.uk
90

TABLE 19 International Tobacco Control Policy Evaluation Project data study 6: sample characteristics by country
Characteristic Total
Country
UK Australia Canada USA
Total sample size, n
Individuals 1639 821 498 168 122
Observations 3176 1770 935 296 175
Observations by year, n
2006 456 233 132 75 16
2007 702 412 197 70 23
2008 463 271 128 41 23
2009 171 104 26 29 12
2010 414 252 103 39 20
2011 42 0 25 4 13
2012 0 0 0 0 0
2013 461 252 167 21 21
2014 424 246 157 17 4
2015 43 0 0 0 43
Weight per cigarette (g), mean (SD) 0.57 (0.37) 0.51 (0.32) 0.53 (0.28) 0.76 (0.45) 1.07 (0.51)
Dependence (TTFC) in minutes, mean (SD) 46 (92) 47 (91) 48 (96) 44 (103) 32 (50)
CPD, mean (SD) 17.7 (9.7) 16.9 (9.4) 18.1 (10.0) 20.4 (9.7) 19.1 (10.1)
Sex, %
Female 38.1 38.9 35.4 38.9 42.9
Male 61.9 61.1 64.6 61.2 57.1
Age group (years), %
18–39 20.9 22.5 19.3 17.2 20.0
40–54 41.6 39.9 46.4 38.2 37.7
≥ 55 37.5 37.5 34.3 44.6 42.3
Ethnicity, %
White, English speaking 95.4 97.9 93.3 89.1 91.2
Not white/non-English speaking 4.6 2.2 6.7 10.9 8.8
Education, %
Low 58.0 58.6 57.5 57.8 53.7
Moderate 26.9 25.8 27.5 26.7 34.3
High 15.2 15.5 15.0 15.5 12.0
Income, %
Low 38.4 35.9 38.2 47.3 49.1
Moderate 32.5 33.6 30.0 31.8 36.0
High 20.7 20.1 25.7 16.5 12.6
Not disclosed 8.5 10.5 6.2 7.4 2.3
NotePercentages are percentage of observations, not individuals.
DOI: 10.3310/phr08060 PUBLIC HEALTH RESEARCH 2020 VOL. 8 NO. 6
© Queen’s Printer and Controller of HMSO 2020. This work was produced by Partos et al. under the terms of a commissioning contract issued by the Secretary of State for Healthand Social Care. This issue may be freely reproduced for the purposes of private research and study and extracts (or indeed, the full report) may be included in professionaljournals provided that suitable acknowledgement is made and the reproduction is not associated with any form of advertising. Applications for commercial reproduction shouldbe addressed to: NIHR Journals Library, National Institute for Health Research, Evaluation, Trials and Studies Coordinating Centre, Alpha House, University of Southampton SciencePark, Southampton SO16 7NS, UK.
91

younger, with a high income, and to be white with an English-speaking background and likely to havehigher nicotine dependence (shorter TTFC). These variables were controlled for in the statistical analysis.No significant differences between the samples were found on education level (see Table S16 in ReportSupplementary Material 2).
Just over one-quarter (25.8%) of UK smokers from 2006 to 2015 (six ITC surveys) used RYO tobaccoexclusively; this proportion was 3.5% in the USA, 6.0% in Canada and 13.8% in Australia. Pooled dataacross the survey period indicated that the mean weight of tobacco per RYO cigarette was lowest inthe UK (mean 0.51 g, SD 0.32 g) and Australia (mean 0.53 g, SD 0.28 g), intermediate in Canada (mean0.76 g, SD 0.45) and highest in the USA (mean 1.07 g, SD 0.51). All pairwise country differences (clusteredlinear regression results adjusted for TTFC and SES) were statistically significant, except for the UK andAustralia, as the weight of tobacco per RYO cigarette was comparable (see Table S17 in ReportSupplementary Material 2).
For the UK and Australia, there was a statistically significant decrease of approximately 0.01 g per RYOcigarette per year using clustered linear regression analysis of tobacco weights over time [β= –0.011(SE 0.0021); p < 0.001 for the unadjusted model]. This is roughly equivalent to a 2% decrease of theaverage weight per cigarette per year and persisted even after adjusting for TTFC and SES [β = –0.014(SE 0.0021); p < 0.001]. As may be seen in Figure 15, in the UK, the mean tobacco weight per cigarettedecreased from 0.59 g (SD 0.42 g) in 2006 to 0.46 g (SD 0.25 g) in 2014. In Australia, the comparablechange was 0.59 g (SD 0.29 g) to 0.48 g (SD 0.26 g). The differences in weights between the twocountries was not statistically significant [β = –0.026 (SE 0.014); p = 0.057 for the fully adjusted model].
LimitationsInternational Tobacco Control Policy Evaluation Project (ITC) data are self-reported and did not directlyreport on the weight of tobacco used in hand-rolled cigarettes, so that had to be calculated using severalother points of information. The resulting estimates could not be verified by independently ascertainingthe weight through a direct measurement process. It is possible that some participants might have sharedtheir pouches, although sharing between individuals might balance out over time, thus mitigating anybiasing effect.
0.60
0.58
0.56
0.54
0.52
0.50
0.48
0.46
0.44
2006 2007 2008 2009 2010 2011a 2012a 2013 2014Year
Mea
n w
eig
ht
(g)
of
RY
O t
ob
acco
per
cig
aret
te
UKAUModel UKModel AU
FIGURE 15 International Tobacco Control Policy Evaluation Project data study 6: changes in the mean weight oftobacco (in grams) per RYO cigarette over time for the UK and Australia (AU). Also shown are the model-predictedvalues from a fully adjusted clustered linear regression, controlling for TTFC, sex, age, ethnicity, level of educationand income. a, No data were collected from the UK in 2011 or from Australia in 2012. Sample sizes from Australiafor 2009 and 2011 were low (n= 26 and n= 25, respectively, see text and Table 19 for more details).
THE IMPACT OF TOBACCO TAX INCREASES ON QUITTING AND REDUCING TOBACCO CONSUMPTION
NIHR Journals Library www.journalslibrary.nihr.ac.uk
92

Although the ITC data set is larger than any other data set previously used to investigate the weight oftobacco in hand-rolled cigarettes, there were still not enough observations to consider how the weight oftobacco changed over time in Canada and the USA. This analysis was also limited because ITC surveywaves did not cover all countries on a yearly basis.
ImplicationsUK smokers reduced the weight of RYO tobacco over time, by about 2% per year. This will have offset,to some extent, the annual tax increases designed to make tobacco less affordable. Smokers in highertax/tobacco price countries, such as the UK and Australia, used less tobacco per RYO cigarette than thosein the USA and Canada, where taxes and prices were generally lower. This suggests, again, that theweight of tobacco is linked to price changes. Although the number of RYO cigarettes smoked per day wassimilar across the four countries, the UK had the lowest at 16.9 cigarettes and Canada had the highest at20.4 cigarettes, suggesting that smokers in high tobacco price countries also smoke fewer cigarettes.
Any reduction in the weight of tobacco used in RYO cigarettes is unlikely to benefit the health of smokers,as evidence to date indicates that thinner cigarettes do very similar damage to fatter ones.235–239
Applying the most recent weight of RYO tobacco in the UK we observed here (0.46 g per cigarette), wouldmean about 2174 cigarettes per kilogram of RYO tobacco. Using 2017 taxation rates, this means that ona per cigarette basis, a tax of £0.28 per FM cigarette would apply, compared with just £0.10 per RYOcigarette, just over one-third of the level.
Summary
In this chapter, we illustrated that smoking behaviour is changing: smokers are engaging in quit attemptsand RYO tobacco smokers are reducing consumption by reducing the weight of tobacco in their cigarettesover time. In the longitudinal analyses, between survey waves, over one-third of smokers made quitattempts and around 1 in 10 were managing 6 months’ abstinence. These quitting behaviours were lesslikely among premium smokers, which may reflect the numerous options available to them to reduce pricewithout quitting. This supports the idea that quitting is more likely among those with few options availableto reduce costs. In Chapter 8 we will examine how purchasing potentially illicit products affects thesebehaviours. Both quit attempts and quit success were associated with times of higher tax increases.
The decline in affordability, shown in Chapter 5, appears to have prompted a change in smokers’behaviour. However, this behaviour change was not necessarily quitting smoking; smokers also reducedtobacco consumption and, as we saw in Chapter 6, began to purchase cheaper products. These last twochanges make smoking more affordable and would offset, to some extent, any annual tax increasesdesigned to make tobacco less affordable. Changing to a cheaper product will not reduce the harm fromsmoking and even reducing consumption does not necessarily translate into meaningful health gains.
DOI: 10.3310/phr08060 PUBLIC HEALTH RESEARCH 2020 VOL. 8 NO. 6
© Queen’s Printer and Controller of HMSO 2020. This work was produced by Partos et al. under the terms of a commissioning contract issued by the Secretary of State for Healthand Social Care. This issue may be freely reproduced for the purposes of private research and study and extracts (or indeed, the full report) may be included in professionaljournals provided that suitable acknowledgement is made and the reproduction is not associated with any form of advertising. Applications for commercial reproduction shouldbe addressed to: NIHR Journals Library, National Institute for Health Research, Evaluation, Trials and Studies Coordinating Centre, Alpha House, University of Southampton SciencePark, Southampton SO16 7NS, UK.
93


Chapter 8 Purchasing tobacco products that arelikely to constitute tax avoidance or evasion
Introduction
It is difficult to assess the extent of tobacco purchases through illicit channels, similar to measuring otherillicit behaviours. Research participants might give socially desirable responses or be unaware that theyare purchasing illicit tobacco. Duty-free or overseas purchases are easier to ascertain. In this chapter,we explore those purchase sources classified as non-UK/non-store purchases (see Chapter 2), to gainan insight into the pricing of products that are likely to have been obtained via tax avoidance or evasion.These non-UK/non-store sources were broken down into purchases from friends/relatives or informal sellers(likely to be tax evasion), purchases from overseas and duty-free sources (likely to be tax avoidance) and‘other’ sources, such as the internet (see Figure 1). We will also explore the frequency of cheap (probablyillicit) purchases using the more direct measure that was available.
ITC data studies 1 and 3: tobacco obtained via tax avoidance or evasion –
smokers’ purchasing patterns, sources and prices paid
In Chapter 6 (see Table 13), using ITC data from 2002 to 2014 we noted that the most common (≥ 80%)purchase source of tobacco for UK smokers was UK stores, likely to represent legal, fully taxed purchases.We now use the same data set to explore products purchased from non-UK/non-store sources over thistime and the prices paid for them.
MethodsFirst, we assess the proportion of smokers purchasing from non-UK/non-store sources and, of these, whichsources were the most common over the study period [see ITC data study 3: smokers’ tobacco purchasingbehaviours by product and store type (licit purchases), Methods and Limitations in Chapter 6]. Then wecompare the price of products purchased through these sources with the prices of products purchasedthrough UK store-based sources (see ITC data study 1: prices paid for tobacco by smokers over time,Methods and Limitations in Chapter 4). Sample characteristics are shown in Table 7.
Results
Non-UK/non-store purchase sources (ITC study 3)Overall, non-UK/non-store purchases constituted ≤ 20% of purchases from 2002 to 2014 and reducedsignificantly over time (Table 20). This is consistent with the concomitant significant increase in purchases fromUK store-based sources observed in our GEE analysis when an exchangeable correlation matrix was specified(see Chapter 6). Despite the better model fit of an exchangeable correlation matrix indicated by the data-drivenQIC statistic, we felt that, as discussed in Chapter 2, on theoretical grounds an unstructured correlation matrixwas more appropriate for our data. However, our GEE analysis specifying an unstructured correlation matrixdid not indicate a concomitant significant increase in UK store-based purchases. Assuming that this is indeed atrue effect, it is probably accounted for by the proportion of participants with missing data on purchase source.It is likely that these participants were purchasing from non-UK/non-store sources, as those having missing dataon price showed a pattern of missing data consistent with using cheap tobacco. If the missing data categorywas assumed to be non-UK/non-store, the decreasing trend in non-UK/non-store sources was no longerstatistically significant (data not shown). Debates about correlation structures notwithstanding, and howeverthe missing data are treated, there was no indication from these data that the proportion of smokerspurchasing tobacco from non-UK/non-store sources was increasing over the study period.
DOI: 10.3310/phr08060 PUBLIC HEALTH RESEARCH 2020 VOL. 8 NO. 6
© Queen’s Printer and Controller of HMSO 2020. This work was produced by Partos et al. under the terms of a commissioning contract issued by the Secretary of State for Healthand Social Care. This issue may be freely reproduced for the purposes of private research and study and extracts (or indeed, the full report) may be included in professionaljournals provided that suitable acknowledgement is made and the reproduction is not associated with any form of advertising. Applications for commercial reproduction shouldbe addressed to: NIHR Journals Library, National Institute for Health Research, Evaluation, Trials and Studies Coordinating Centre, Alpha House, University of Southampton SciencePark, Southampton SO16 7NS, UK.
95

TABLE 20 International Tobacco Control Policy Evaluation Project data study 3: source of last purchase and product last purchased (weighted data), with tests for linear trendsover time
Product purchased and source
ITC UK survey number (year)
Beta (95% CI)a for time trends1(2002)
2(2003)
3(2004)
4(2005)
5(2006)
6(2007)
7(2008)
8(2010)
9(2013)
10(2014)
Source of last purchase, %
UK store-based sources 83.7 79.9 81.6 81.8 82.4 83.3 81.5 83.2 87.1 83.7 0.019 (–0.002 to 0.041)
Non-UK/non-store sources 15.9 19.6 18.3 18.1 17.4 16.1 17.9 16.5 11.5 14.3 –0.025** (–0.041 to –0.009)
Outside the UK 55.6 52.9 53.2 43.5 41.1 57.6 28.8 33.6 37.7 39.5 –0.077*** (–0.11 to –0.048)
Duty free 25.8 27.6 27.8 34.7 34.1 21.8 36.8 35.1 32.4 36.3 0.044** (0.015 to 0.072)
Informal sellers 16.1 16.4 7.2 6.6 5.9 5.8 13.9 7.8 11.5 6.4 –0.081** (–0.14 to –0.027)
Friends/relatives 2.2 0.4 9.8 13.9 15.2 14.2 19.3 23.6 11.5 13.4 0.12*** (0.086 to 0.14)
Non-UK/non-store otherb 0.2 2.7 2.0 1.3 3.7 0.6 1.2 0.0 6.9 4.4 N/A
Otherc sources (%) 0.4 0.5 0.1 0.2 0.2 0.6 0.6 0.3 1.4 2.0 N/A
Product last purchased, %
FM-P 59.4 58.0 58.3 57.1 52.4 47.6 51.6 45.2 49.0 45.9 –0.034*** (–0.044 to –0.023)
Non-UK/non-store 2.6 2.7 2.5 2.6 0.8 0.8 1.1 1.1 2.7 1.1 N/A
FM-C 21.4 20.5 20.2 19.6 17.8 18.4 17.1 16.7 15.2 16.9 –0.039*** (–0.04 to –0.025)
Non-UK/non-store 44.1 54.9 50.2 45.5 45.7 49.8 42.1 37.3 27.4 44.3 –0.032** (–0.054 to –0.009)
RYO tobacco 17.3 19.0 20.7 22.5 29.5 30.0 30.5 32.2 33.2 35.0 0.066*** (0.053 to 0.080)
Non-UK/non-store 27.9 34.5 31.3 34.0 30.0 21.7 33.3 25.8 16.8 17.6 –0.048** (–0.06 to –0.019)
**p < 0.01; ***p < .0001.a Tests for trend were not conducted (N/A) when floor or ceiling effects were apparent.b ‘Non-UK/non-store other’ category includes military commissaries, toll-free numbers, internet purchases and refusals to answer.c Other sources include missing responses or responses that could not be clearly classified as UK store or non-UK/non-store sources.NotesShaded figures were also presented in Chapter 6.Percentages in the subcategories are those within each super-category.
PURCH
ASIN
GTO
BACCO
PRODUCTS
THATARE
LIKELYTO
CONSTITU
TETA
XAVO
IDANCE
OREVA
SION
NIHRJournals
Librarywww.journalslibrary.nihr.ac.uk
96

Among non-UK/non-store purchases, purchasing outside the UK was most common (≥ 40% for mostwaves), although purchasing from this source decreased significantly over time, with the largest declineoccurring between 2007 and 2008. Purchasing from duty-free sources was the next most common sourceof non-UK/non-store purchases, and this and purchasing from friends or relatives significantly increasedover time. Purchasing from informal sellers decreased significantly over time and constituted ≤ 17% of allthe non-UK/non-store purchases throughout the period of study. Purchasing from online and telephonesources combined constituted < 3% of non-UK/non-store purchases over the study period.
Non-UK/non-store purchase prices (ITC study 1)Overall, the most common purchase bought from non-UK/non-store sources was FM-C (≈10%), followedby RYO tobacco (≈6%); very few were FM-P (< 2%). Given the small proportion of tobacco purchasesthat were non-UK/non-store FM-P and, hence, limited data to calculate median prices, trend analyses werenot conducted. Median prices for FM-P purchased from non-UK/non-store sources were consistently atleast £0.02 below that of FM-P from UK store-based sources from 2002 to 2014, although with largefluctuations (Figure 16). For FM-C and RYO tobacco purchases, more consistent price estimates could beobtained. Median prices for FM-C increased significantly from £0.11 per stick in 2002 to £0.16 in 2014
0.60
(a)
0.50
0.40
0.30
0.20
0.10
0.00
2002 2003 2004 2005 2006 2007
Time point
2008 2009a 2010 2011a 2012a 2013 2014
Pric
e p
er s
tick
(0.
50 g
of
tob
acco
per
RY
O s
tick
) (£
)
Non-UK/non-storemedian, FM-PNon-UK/non-storemedian, RYO
FM-P
RYO
0.60
(b)
0.50
0.40
0.30
0.20
0.10
0.00
2002 2003 2004 2005 2006 2007 2008 2009a 2010 2011a 2012a 2013 2014
Pric
e p
er s
tick
(£)
Non-UK/non-storemedian
Time point
FIGURE 16 International Tobacco Control Policy Evaluation Project data study 1: weighted median prices ofdifferent product types purchased from UK store-based and non-UK/non-store-based sources. (a) FM-P and RYOtobacco; and (b) FM-C. Medians for non-UK/non-store sources are superimposed on the UK store-based purchasesoriginally shown in Figure 6. For UK store-based sources, black lines represent medians, with shading for 95%ranges (top and bottom 2.5% excluded, blue lines are 25th and 75th percentiles). Dashed lines are medians fornon-UK/non-store sources. All prices are adjusted to 2014 values and based on the most recent reported tobaccopurchase. a, No data collected for these years.
DOI: 10.3310/phr08060 PUBLIC HEALTH RESEARCH 2020 VOL. 8 NO. 6
© Queen’s Printer and Controller of HMSO 2020. This work was produced by Partos et al. under the terms of a commissioning contract issued by the Secretary of State for Healthand Social Care. This issue may be freely reproduced for the purposes of private research and study and extracts (or indeed, the full report) may be included in professionaljournals provided that suitable acknowledgement is made and the reproduction is not associated with any form of advertising. Applications for commercial reproduction shouldbe addressed to: NIHR Journals Library, National Institute for Health Research, Evaluation, Trials and Studies Coordinating Centre, Alpha House, University of Southampton SciencePark, Southampton SO16 7NS, UK.
97

and were often less than half the price of FM-C from UK store-based sources. Median prices for RYOtobacco purchases from non-UK/non-store significantly increased from £0.05 per stick in 2005 to £0.08 in2014, considerably cheaper than RYO tobacco from UK store-based sources. For all product types, medianprices from non-UK/non-store sources were often cheaper than the cheapest products available from UKstore-based sources.
As already discussed, it is difficult to ascertain with any certainty which purchases were truly illicit andwhich were legal untaxed sources. When we examined the trends in prices from only the sources arguablymost likely to represent illicit purchases (i.e. from informal sellers, friends/relatives and non-UK/non-store‘other’ responses), median values were comparable to those presented in Figure 16 from all non-UK/non-store sources combined (see Figure S7 in Report Supplementary Material 3). However, sample sizes were lowand these findings should be interpreted with caution.
ImplicationsOverall, there was no evidence of an increase in the proportion of non-UK/non-store purchases, evenwhen using the most liberal assumptions. The majority of non-UK/non-store purchases appeared to be taxavoidance, constituting duty free (which significantly increased during the study) or sources outside the UK(which significantly decreased, most likely influenced by the UK ‘Great Recession’ that commenced at thestart of 2008). Typically, less than one-quarter of non-UK/non-store purchases and < 5% of all tobaccopurchases were from sources likely to constitute tax evasion (e.g. informal sellers or from friends or relatives).Purchasing tobacco from friends or relatives significantly increased from 2002 to 2014, peaking in 2010at just under one-quarter of all non-UK/non-store purchases. More research is required to understandwhether this constitutes a form of tax avoidance and/or evasion, or an effort to pool resources and buy inbulk. Purchases from informal sellers significantly decreased. Purchases from the internet and from toll-freetelephone lines together accounted for < 3% of all non-UK/non-store purchases. FM-C and RYO were theproducts most commonly purchased from non-UK/non-store sources, but purchase of both decreasedduring the period of study.
These data indicate that UK strategies aimed at reducing illicit tobacco supplies and use77,84,85 appear tohave been successful and hence we found no evidence to support TI arguments that illicit tobacco usagehas been increasing. The price analysis presented in Chapter 4 supports the theory that smokers have littleneed to turn to illicit products to obtain cheap tobacco, because large price differences exist betweendifferent types of products purchased legally (from UK store-based sources). Thus, although the medianprices for all product types (FM-P, FM-C and RYO tobacco) purchased from non-UK/non-store sources weretypically lower than the cheapest products from UK store-based sources, all three product types could bepurchased legally in 2014 below their median prices in 2002.
ITC data study 2: changes in tobacco affordability over time amongsmokers (purchases from non-UK/non-store sources)
In Chapter 5 (ITC data study 2), we analysed changes in the affordability of cigarettes for exclusive dailyFM cigarette (from 2002 to 2014) and RYO tobacco (from 2006 to 2014) smokers, focusing on UKstore-based sources. The impact of buying tobacco from non-UK/non-store sources on affordability(our new measure) is discussed here.
MethodsThis study uses the same sample, methods and limitations as described in Chapter 5, and samplecharacteristics are shown in Table 11. In brief, our new measure of tobacco affordability was regressedonto purchase sources, separately for FM cigarette and RYO tobacco smokers. The fully adjusted modelcontrolled for time (tobacco tax year), sex, age, region of residence, ethnicity, education and TTFC(see Chapters 2 and 5 for more details).
PURCHASING TOBACCO PRODUCTS THAT ARE LIKELY TO CONSTITUTE TAX AVOIDANCE OR EVASION
NIHR Journals Library www.journalslibrary.nihr.ac.uk
98

ResultsSixteen per cent of smokers included in this sample purchased from non-UK/non-store sources. RYOtobacco smokers were more likely to purchase tobacco from non-UK/non-store sources (28.1%) than FMcigarette smokers (13.9%) (see Table 11). FM cigarettes were significantly more affordable from non-UK/non-store sources [β = 4.15 (SE 0.25); p < 0.001 for the unadjusted and β = 4.10 (SE 0.25); p < 0.001 for thefully adjusted model]. Similarly, RYO tobacco was also significantly more affordable from non-UK/non-storesources, although the effect was not as strong [β = 2.50 (SE 0.31); p < 0.001 for the unadjusted andβ = 2.35 (SE 0.30); p < 0.001 for the fully adjusted model].
Purchasing FM cigarettes from non-UK/non-store sources rather than UK stores conferred a saving ofaround 5% of smokers’ annual incomes (Figure 17), which was approximately £1300 in 2014. A similarsaving was observed from purchasing RYO cigarettes from non-UK/non-store sources rather than UK stores.
Overall affordabilityNon-UK/non-store
96.0
(a)
94.0
92.0
90.0
88.0
86.0
2002 2003 2004 2005 2006 2007 2008 2009a 2010 2011a 2012 2013 2014
Tobacco tax year
Aff
ord
abili
ty (
% in
com
e re
mai
nin
g)
99.0
(b)
98.0
97.0
96.0
95.0
94.0
93.0
2006 2007 2008 2009a 2011a 2012 2013 20142010
Aff
ord
abili
ty (
% in
com
e re
mai
nin
g)
Tobacco tax year
Overall affordabilityNon-UK/non-store
FIGURE 17 International Tobacco Control Policy Evaluation Project study 2: individualised tobacco affordabilityover time for (a) FM cigarette smokers; and (b) RYO tobacco smokers, for purchases made from all sources andseparately for non-UK/non-store sources only. Affordability estimates are from the fully adjusted model 2(see Chapter 5), controlling for all covariates. a, No ITC data collected for this year.
DOI: 10.3310/phr08060 PUBLIC HEALTH RESEARCH 2020 VOL. 8 NO. 6
© Queen’s Printer and Controller of HMSO 2020. This work was produced by Partos et al. under the terms of a commissioning contract issued by the Secretary of State for Healthand Social Care. This issue may be freely reproduced for the purposes of private research and study and extracts (or indeed, the full report) may be included in professionaljournals provided that suitable acknowledgement is made and the reproduction is not associated with any form of advertising. Applications for commercial reproduction shouldbe addressed to: NIHR Journals Library, National Institute for Health Research, Evaluation, Trials and Studies Coordinating Centre, Alpha House, University of Southampton SciencePark, Southampton SO16 7NS, UK.
99

ImplicationsAs expected from the lower prices, non-UK/non-store-based sources of tobacco were more affordable thanthose purchased from UK store-based sources. This means that smokers can manage the affordability oftheir tobacco through purchasing from non-UK/non-store sources. This study did not differentiate thedifferent price segments of products purchased through UK store-based sources, so it is not possible tocompare the differences between the affordability of using cheaper legal tobacco products and usingproducts potentially purchased to avoid or evade tax.
ITC data study 4: how does purchasing illicit tobacco influence productspurchased (cross-sectional and longitudinal analyses)?
In this study, we explore the impact of frequency of illicit purchases on product choices.
Methods
Data and analysesThis study employs the same sample and analyses as described in Chapter 6, from four ITC surveysconducted between 2008 and 2014. As we were not looking at price, we were able to use the frequencyof cheap purchases measure (see Chapter 2) as a more direct indicator of illicit tobacco use. Frequency ofcheap purchases was dichotomised as low versus high. More detailed methodology and limitations areprovided in Chapter 6, and basic sample descriptives are presented in Table 15.
Briefly, we report here the results of analyses 4a and 4b of ITC data study 4 (see Chapter 6), pertaining onlyto the associations with frequency of cheap purchases. Analysis 4a (cross-sectional clustered multinomiallogistic regression, aggregated over four surveys, with 2148 participants providing 4339 observations)examined product choice (premium FM cigarettes, mid-price FM cigarettes, value FM cigarettes or RYOtobacco). Analysis 4b (longitudinal, clustered, multinomial, logistic regression, aggregated over threesurvey pairs, with 854 participants providing 1397 observations) examined changes in smoking behaviour(FM cigarettes trading up/no change, FM cigarettes trading down, switching to RYO tobacco or stoppingpurchasing) among only exclusive smokers of FM cigarettes at baseline. All regression analyses controlledfor tobacco tax increase rates, HSI, brand loyalty, sex, age, education, income, region of residence, relationshipstatus, ethnicity and survey design variables. Analysis 4a additionally controlled for product loyalty, which wasnot applicable for analysis 4b, which included only exclusive FM smokers at baseline. Results pertaining tosociodemographics and dependence will be discussed in Chapter 9.
Results
Analysis 4a: product typeOverall, 7.6% of our sample reported frequently purchasing from illicit sources. This figure was 8.4%among users of premium FM cigarettes, 3.6% for mid-price FM cigarettes, 3.6% for value FM cigarettesand 12.7% for RYO tobacco.
Smokers who reported a high frequency of illicit purchases were significantly less likely than those witha low frequency to use mid-price FM cigarettes [relative risk ratio (RRR) 0.45, 95% CI 0.29 to 0.67;p < 0.001] or value FM cigarettes (RRR 0.70, 95% CI 0.35 to 0.93; p = 0.023), and significantly morelikely to use RYO tobacco (RRR 1.68, 95% CI 1.22 to 2.33; p = 0.002) than to use premium FM cigarettes(see Table S18 in Report Supplementary Material 2 for full results).
Analysis 4b: changes in smoking behaviourTrading up (5.5%) or not changing (66.5%) between the baseline and outcome surveys was most common(72.0% combined); 13.5% traded down to cheaper FM cigarettes, 6.2% switched from FM cigarettes to
PURCHASING TOBACCO PRODUCTS THAT ARE LIKELY TO CONSTITUTE TAX AVOIDANCE OR EVASION
NIHR Journals Library www.journalslibrary.nihr.ac.uk
100

RYO tobacco and 8.3% achieved a current sustained quit attempt of at least 6 months. Frequency of illicitpurchases had no significant association with any of these measures, even after controlling for all includedcovariates (p-values for all RRRs > 0.05) (see Table S19 in Report Supplementary Material 2 for full results).
ImplicationsFactory-made cigarette smokers who have easy access to cheaper premium FM products, through sourceslikely to be illicit, appear to have less incentive to smoke cheaper, non-premium, FM brands. However, thisanalysis indicated that those who frequently purchased from potentially illicit sources were most likely tobuy RYO tobacco. In the longitudinal analysis, the frequency of purchasing illicit products did not affectsubsequent purchasing patterns (i.e. trading down, switching or sustained quitting).
ITC study 5: how does purchasing illicit tobacco influence reducing andquitting behaviours (longitudinal analysis)?
In this study, the association between frequent illicit tobacco purchases and quitting behaviours isexplored.
MethodsHere we report the results of longitudinal analyses 5a and 5b of ITC data study 5 (see Chapter 7), pertainingonly to associations with illicit purchases. Analysis 5a (1204 participants providing 2202 observations)examined making quit attempts and analysis 5b (1194 participants providing 2017 observations) examined6 months’ sustained quitting. Both analyses were longitudinal clustered (aggregated over three survey pairs)logistic regressions, controlling for product type (premium FM cigarettes, mid-price FM cigarettes, valueFM cigarettes or RYO tobacco), tobacco tax increase rates at outcome, HSI, brand loyalty, product loyalty,sex, age, education, income, region of residence, relationship status, ethnicity and survey design variables.Detailed methodology and limitations are provided in Chapter 7.
Results
No significant associations were observed between frequent purchasing from cheap (probably illicit)sources and quit attempts (analysis 5a), or sustained quitting (analysis 5b), with p-values for all ORs> 0.05 (see Table S20 in Report Supplementary Material 2 for full results).
ImplicationsFrequent purchasing from sources that were potentially used to avoid or evade tax did not appear toinfluence subsequent quit attempts or success.
Summary
We found no evidence of increasing engagement with tax avoidance or evasion, even when using themost liberal assumptions, despite TI arguments to the contrary. These data indicate that UK strategiesaimed at reducing illicit tobacco supplies and use appear to have been successful.
Most non-UK/non-store purchases appeared to be tax avoidance, constituting duty free (which significantlyincreased during the study) or sources outside the UK (which significantly decreased). Typically, less thanone-quarter of non-UK/non-store purchases and < 5% of all tobacco purchases were from sources likelyto constitute tax evasion (e.g. purchases from informal sellers, or from friends or relatives). Purchasingtobacco from friends or relatives significantly increased from 2002 to 2014, peaking in 2010 at justunder one-quarter of all non-UK/non-store purchases. More research is required to understand whetherthis constitutes a form of tax avoidance and/or evasion or an effort to pool resources and buy in bulk.
DOI: 10.3310/phr08060 PUBLIC HEALTH RESEARCH 2020 VOL. 8 NO. 6
© Queen’s Printer and Controller of HMSO 2020. This work was produced by Partos et al. under the terms of a commissioning contract issued by the Secretary of State for Healthand Social Care. This issue may be freely reproduced for the purposes of private research and study and extracts (or indeed, the full report) may be included in professionaljournals provided that suitable acknowledgement is made and the reproduction is not associated with any form of advertising. Applications for commercial reproduction shouldbe addressed to: NIHR Journals Library, National Institute for Health Research, Evaluation, Trials and Studies Coordinating Centre, Alpha House, University of Southampton SciencePark, Southampton SO16 7NS, UK.
101

Purchases from informal sellers significantly decreased. Purchases from the internet and from toll-freetelephone lines together accounted for < 3% of all non-UK/non-store purchases. FM-C and RYO tobaccowere the products most commonly purchased from non-UK/non-store sources, but both decreased duringthe period of study.
The most common type of product purchased from non-UK/non-store sources was FM-C followed by RYOtobacco. FM-P purchases were less common and the median price was consistently at least £0.02 belowthat of FM-P from UK store-based sources during the period of study. For FM-C and RYO tobacco,purchase price increased significantly during the study; however, both were purchased at prices well belowthose of UK store-based sources, often less than half the price. For all product types, median prices fromnon-UK/non-store sources were often cheaper than the cheapest products available from UK store-basedsources (see Figure 16).
As expected from the lower prices, non-UK/non-store based sources of tobacco were more affordable thanthose purchased from UK store-based sources. This means that smokers can manage the affordability oftheir tobacco through purchasing from non-UK/non-store sources. Indeed, purchasing FM cigarettes fromnon-UK/non-store sources, rather than UK store sources, conferred a saving of around 5% of smokers’annual incomes. However, this study did not break down the products purchased through UK store-basedsources, so it is not possible to compare the differences to affordability of using cheaper legal tobaccoproducts with using products purchased to avoid or evade tax. The price analysis presented in Chapter 3indicated that there was a large price difference between different types of products purchased legally(from UK store-based sources). Thus, although FM-P, FM-C and RYO tobacco purchased from non-UK/non-store sources typically cost less than the cheapest products from UK store-based sources, all threeproduct types could be purchased legally in 2014 below their median prices in 2002 (real prices adjustedto 2014 values).
Finally, there were no significant differences between sustained quitting, trading down or switching toRYO tobacco over time compared with no change/trading up in relation to frequency of illicit purchases.Similarly, there was no significant difference on quit attempts or sustained quitting over time by whetheror not participants frequently purchased illicit products.
PURCHASING TOBACCO PRODUCTS THAT ARE LIKELY TO CONSTITUTE TAX AVOIDANCE OR EVASION
NIHR Journals Library www.journalslibrary.nihr.ac.uk
102

Chapter 9 Sociodemographic disadvantage, taxes,pricing and smoking behaviour
Introduction
People who are socioeconomically disadvantaged are over-represented among smokers.240 Tobacco controlmethods generally reduce smoking least among socioeconomically disadvantaged groups, but tobacco taxeshave been shown to be the exception, as these are associated with larger reductions in smoking prevalenceand/or consumption in lower than higher SES groups.20 However, socioeconomically disadvantaged smokershave previously been found to be more likely to smoke cheap tobacco12 and, hence, the new cheap tobaccoproducts identified in our research may have prevented quitting among disadvantaged smokers. It is alsopossible that the recession and higher tobacco taxes in recent years may have stimulated more quittingamong such smokers. In this chapter, we therefore look at if socioeconomically disadvantaged smokersand other subpopulations of smokers who might be vulnerable to socioeconomic disadvantage, such asethnic minorities and more dependent smokers, were particularly affected by reductions in affordability,or were more likely to down-trade, reduce consumption or quit.
ITC study 2: changes in tobacco affordability over time(sociodemographics and dependence)
In our individualised affordability analyses, we explored sociodemographic differences in affordability andwhether or not affordability was affected by strength of dependence.
MethodsThis study uses the same sample and analyses as in ITC data study 2, described in Chapter 5, of daily FMcigarette smokers from surveys 1–10 (2002–14) and RYO tobacco smokers from surveys 6–10 (2006–10).We focus on the fully adjusted clustered linear regression analyses (model 2), regressing affordability ontoall predictor variables (tobacco tax year, smoking dependence, purchase source and sociodemographicvariables) concurrently, to identify any significant independent predictors. Here we report the findingspertaining only to the sociodemographic variables: sex, age (and age squared, to test for non-linearassociations with age), ethnicity, region, education and smoking dependence (TTFC). Detailed methodologyand limitations are provided in Chapter 5.
ResultsIn the overall sample, FM cigarette and RYO tobacco smokers were broadly comparable in age and education,but differed on other characteristics (see Table 11). FM cigarette smokers were less likely to be white (95% vs.98% RYO tobacco smokers) and male (38% FM vs. 63% RYO tobacco smokers) and there were regionaldifferences (e.g. more RYO tobacco smokers from the South West region). Cigarette consumption was similar(16.7 FM cigarettes vs. 17.0 RYO tobacco), but a higher proportion of RYO tobacco smokers were most addicted(19.8% of RYO tobacco smokers smoked within 5 minutes of waking vs. 15.4% of FM cigarette smokers).
Factory-made cigarettesIn the multilevel linear regression analyses, the following subpopulations were estimated to find smokingFM cigarettes less affordable (Table 21): women (vs. men); older smokers (but please note that there werevery few under 25s in the sample); socioeconomically disadvantaged smokers, as measured by educationand region (smokers living in Scotland, Northern Ireland and the north-east of England, areas whichinclude some of the poorest localities in the UK). Smokers who were more dependent (as assessed byTTFC) also found smoking less affordable. These sociodemographic and smoking dependence patternswere the same even when excluding non-UK/non-store purchases (see Table S11 in Report SupplementaryMaterial 2).
DOI: 10.3310/phr08060 PUBLIC HEALTH RESEARCH 2020 VOL. 8 NO. 6
© Queen’s Printer and Controller of HMSO 2020. This work was produced by Partos et al. under the terms of a commissioning contract issued by the Secretary of State for Healthand Social Care. This issue may be freely reproduced for the purposes of private research and study and extracts (or indeed, the full report) may be included in professionaljournals provided that suitable acknowledgement is made and the reproduction is not associated with any form of advertising. Applications for commercial reproduction shouldbe addressed to: NIHR Journals Library, National Institute for Health Research, Evaluation, Trials and Studies Coordinating Centre, Alpha House, University of Southampton SciencePark, Southampton SO16 7NS, UK.
103

TABLE 21 International Tobacco Control Policy Evaluation Project data study 2: linear random-effects clusteredregression analyses of individualised affordability regressed on sociodemographic and other covariates(fully adjusted), separately for FM cigarette and RYO tobacco smokers
Sample characteristics
FM cigarettes (n= 3420,observations= 7475)
RYO tobacco (n= 734,observations = 1468)
β SE p-value β SE p-value
Sex
Female Ref Ref
Male 1.93 0.31 < 0.001 0.90 0.39 0.021
Age (continuous)
Age 0.23 0.05 < 0.001 0.16 0.08 0.047
Age squared –0.0033 0.00060 < 0.001 –0.0023 0.00083 0.006
Region χ2(11) = 31.12; p = 0.0011 χ2(11) = 18.87; p = 0.064
London Ref Ref
Yorkshire and The Humber –0.45 0.64 0.481 –0.84 0.97 0.385
East Midlands –0.46 0.69 0.505 –0.64 0.88 0.465
Eastern –0.29 0.64 0.648 0.67 0.83 0.421
North East –1.82 0.81 0.024 –0.77 1.12 0.492
South East 0.19 0.55 0.729 0.41 0.79 0.600
South West –0.71 0.75 0.322 0.57 0.79 0.473
West Midlands –0.82 0.65 0.210 –0.82 0.88 0.350
North West –0.85 0.61 0.163 0.89 0.86 0.300
Wales –0.33 0.80 0.681 –1.94 0.93 0.037
Scotland –1.50 0.61 0.013 0.18 0.92 0.844
Northern Ireland –4.09 0.93 0.000 –0.38 1.32 0.771
Ethnicity
White Ref Ref
Not white –0.26 0.68 0.698 –0.08 1.13 0.947
Education χ2(2) = 95.14; p < 0.0001 χ2(2) = 17.15; p = 0.0002
Low Ref Ref
Moderate 1.45 0.35 < 0.001 1.49 0.43 < 0.001
High 4.23 0.44 < 0.001 1.75 0.54 0.001
TTFC (minutes) χ2(3) = 116.41; p < 0.0001 χ2(3) = 23.89; p < 0.0001
> 60 Ref Ref
31–60 –1.25 0.31 < 0.001 –0.05 0.48 0.913
6–30 –2.33 0.31 < 0.001 –1.10 0.40 0.019
Within 5 –3.78 0.38 < 0.001 –2.00 0.53 < 0.001
Ref, reference.NotesAnalyses are fully adjusted for tobacco tax year, sex, age, age squared, region, ethnicity, education, TTFC andpurchase source.Chi-squared statistics are for overall effects of linear trends (time) and any variables with three or more categories.Values in bold are significant.
SOCIODEMOGRAPHIC DISADVANTAGE, TAXES, PRICING AND SMOKING BEHAVIOUR
NIHR Journals Library www.journalslibrary.nihr.ac.uk
104

Figure 18 illustrates individualised affordability for FM cigarette smokers, showing female smokers, thosewith high levels of education and those who are more dependent (i.e. smoke their first cigarette within5 minutes of waking) compared with overall affordability. It is evident that these demographic and smokinggroups are spending relatively more of their income on tobacco.
Roll-your-own tobaccoThe same subpopulations were estimated to find RYO tobacco smoking less affordable (see Table 21 andsee also Table S12 in Report Supplementary Material 2), with one exception (Wales was the only area to findRYO tobacco smoking less affordable). Again, Wales has areas of particular socioeconomic disadvantage.However, the overlapping CIs in Figure 19 illustrate that RYO tobacco is uniformly cheap and, as yet,there is not as much differentiation by sociodemographic and dependence factors, compared with FMcigarette smokers.
Aff
ord
abili
ty (
% in
com
e re
mai
nin
g)
96.0
94.0
92.0
90.0
88.0
86.0
84.0
2002 2003 2004 2005 2006 2007 2008 2009a 2010 2012 2013 20142011a
Tobacco tax year
Overall affordability(FM)
High levels of education
FemalesTTFC < 5 minutes
FIGURE 18 ITC data study 2: individualised affordability for FM cigarette smokers, showing female smokers, thosewith high levels of education and more dependent smokers, compared with overall affordability. Shaded areasrepresent 95% CIs. Affordability estimates are from the fully adjusted model 2 for FM cigarette smokers only.More dependent smokers are those who smoke their first cigarette within 5 minutes of waking (TTFC < 5 minutes).a, No ITC data collected for this year.
Tobacco tax year
Aff
ord
abili
ty (
% in
com
e re
mai
nin
g)
2006
91.0
93.0
95.0
97.0
99.0
2007
Overall affordability(RYO)High levels of educationFemalesTTFC < 5 minutes
2009a2008 2010 2011a 2012 2013 2014
FIGURE 19 International Tobacco Control Policy Evaluation Project data study 2: individualised affordability forRYO tobacco smokers, showing female smokers, those with high levels of education and more dependent smokers,compared with overall affordability. Shaded areas represent 95% CIs. Affordability estimates are from the fullyadjusted model 2 for RYO smokers only (see text for details). More dependent smokers are those who smoke theirfirst cigarette within 5 minutes of waking (TTFC < 5 minutes). a, No ITC data collected for this year.
DOI: 10.3310/phr08060 PUBLIC HEALTH RESEARCH 2020 VOL. 8 NO. 6
© Queen’s Printer and Controller of HMSO 2020. This work was produced by Partos et al. under the terms of a commissioning contract issued by the Secretary of State for Healthand Social Care. This issue may be freely reproduced for the purposes of private research and study and extracts (or indeed, the full report) may be included in professionaljournals provided that suitable acknowledgement is made and the reproduction is not associated with any form of advertising. Applications for commercial reproduction shouldbe addressed to: NIHR Journals Library, National Institute for Health Research, Evaluation, Trials and Studies Coordinating Centre, Alpha House, University of Southampton SciencePark, Southampton SO16 7NS, UK.
105

To illustrate the differences in affordability across sociodemographic and smoking dependence factors,we used the fully adjusted regression coefficients from model 2 (see Tables S11 and S12 in ReportSupplementary Material 2 for a complete list of regression coefficients) to plot the affordability curves fortwo hypothetical groups of smokers by age in 2014, one group with low affordability and one with highaffordability. These plots were based on the fact that model-based estimates can be obtained for anytheoretical values of the included variables, using the regression equation (y = b0 + b1x1 + b2x2 + . . . + bnxn),where y is the outcome (in this case affordability), xn represents each predictor variable and bn is itscorresponding standardised regression coefficient (b0 is the constant or y-intercept). As we wanted to plotaffordability over different ages, we did not estimate values for age or age squared, so these were leftas x and x2 in our equations, respectively. For the remainder of the variables (all categorical), we chosethe values corresponding to the highest or lowest affordability. Categorical variables are dummy-coded,so x is set to 0 for all non-selected categories and set to 1 for the selected category (b for the referencecategory = 0). For example, for our low-affordability curve (based on FM cigarettes, as they are generallymore expensive than RYO tobacco), we selected TTFC to be within 5 minutes, as this was associated withthe lowest regression coefficient (–3.78) (see Table 21), so the part of our equation pertaining to TTFCwas [(0 × 0) + (–1.25 × 0) + (–2.33 × 0) + (–3.78 × 1)], which solves to –3.78. Thus, we selected thehigh-affordability group to be white, male, smoking RYO tobacco, residing in London, with high levelsof education, smoking their first cigarette after 60 minutes from waking and purchasing from non-UK/non-store sources. The low-affordability group was selected to be female, non-white, smoking FMcigarettes, living in Northern Ireland, with low levels of education, highly addicted (smoking their firstcigarette within 5 minutes of waking) and purchasing from UK store-based sources. Time was set to 2014for both groups. The curves are displayed in Figure 20, which shows how affordability decreases withage, but illustrates the large differences in affordability across all ages, with some groups, depending ontheir characteristics and product choices, potentially spending > 15% more of their incomes on tobaccothan others.
1870
75
80
85
90
95
100
24
High = 0.16(age) – 0.0023(age2) + 96.19 Low = 0.23(age) – 0.0033(age2) + 77.83
30 36 42 48 54
Age (years)
6660 72 78 84 90
Aff
ord
abilt
y (%
inco
me
rem
ain
ing
)
FIGURE 20 International Tobacco Control Policy Evaluation Project data study 2: individualised affordability in2014, for two theoretical smokers by age [based on regression coefficients for the fully adjusted model 2 forRYO tobacco (high) and FM cigarette (low) smokers; see Report Supplementary Material 2]. The high affordabilitysmoker is a white, male, RYO smoker, residing in London, with high levels of education, a TTFC > 60 minutes,and purchasing from a non-UK/non-store source. The low-affordability smoker is female, non-white, smokes FMcigarettes, resides in Northern Ireland, has low levels of education, is highly addicted (TTFC within 5 minutes ofwaking) and purchases from a UK store-based source.
SOCIODEMOGRAPHIC DISADVANTAGE, TAXES, PRICING AND SMOKING BEHAVIOUR
NIHR Journals Library www.journalslibrary.nihr.ac.uk
106

ImplicationsSocioeconomically disadvantaged groups, women and dependent smokers were more likely to struggle toafford smoking as tobacco prices increased. In theory, we would expect that this would make them morelikely to quit. However, from Chapters 6–8 we know that there were other options available: smokingcheaper products and smoking fewer CPD, or using less tobacco in RYO cigarettes. We now assesswhether or not there were differences in quitting or reducing behaviours related to sociodemographicsand dependence.
ITC study 4: impact of tobacco pricing changes on smokers’ purchasingpatterns and product choices (sociodemographics and dependence)
This study uses the same sample and analyses as in ITC study 4, described in Chapter 6, from the four ITCsurveys conducted between 2008 and 2014. Here we focus only on the results pertaining to sociodemographicsand tobacco dependence, and how these affect product choices (premium FM cigarettes, mid-price FMcigarettes, value FM cigarettes or RYO tobacco) and smoking behaviours (traded up to FM cigarettes/nochange, traded down to cheaper FM cigarettes, switching to RYO tobacco or stopping purchasing).
MethodsMethodological details and limitations are provided in Chapter 6, with basic sample characteristics inTable 15. Analyses were clustered, multinomial logistic regressions: analysis 4a was cross-sectional,whereas analysis 4b was longitudinal and included only exclusive FM cigarette smokers at baseline.
ResultsNotable characteristics of the cross-sectional aggregate data sample (see Table 15) include < 8% classifiedas being highly dependent and an under-representation of younger smokers (with over three-quarters ofthe sample being aged ≥ 40 years).
Analysis 4a (product choice)The results of analysis 4a (Table 22) indicated that white smokers were more likely to smoke any of thecheaper products than non-white smokers (building on our previous finding showing that those of whiteethnicity were more likely to smoke RYO tobacco). Value FM cigarettes and/or RYO tobacco were morelikely to be chosen than premium FM cigarettes by smokers with moderate dependence (HSI), low-SESsmokers (as measured by income and education), smokers living outside London and smokers who weresingle. In addition, RYO tobacco was more likely to be smoked than premium FM cigarettes by men,smokers aged < 40 years (compared with aged ≥ 55 years), and smokers living in the Midlands, eastand south of England. Women, however, were more likely to smoke cheap FM products. Mid-price FMcigarettes were significantly more likely to be smoked by those in northern regions and outside Englandthan in London.
Analysis 4b (smoking behaviours)The results of analysis 4b (Table 23) indicated that, compared with trading up to FM cigarettes/no change(the reference category) trading down to cheaper FM products was more likely among younger smokers(aged < 40 years), single smokers and smokers with low levels of education (vs. moderate levels ofeducation). Switching to RYO tobacco was significantly more common among males, younger smokers(aged < 55 years) and low-income smokers. The only significant predictor of stopping purchasing was notdisclosing income.
ImplicationsThe findings that men, but also younger smokers, were more likely to switch to RYO tobacco may be theresult of shifting perceptions among younger groups of the desirability of RYO tobacco smoking, whichhas been traditionally more common among men.12 Furthermore, RYO tobacco was marketed as a naturalproduct that may have particularly appealed to young environmentally conscious smokers.241
DOI: 10.3310/phr08060 PUBLIC HEALTH RESEARCH 2020 VOL. 8 NO. 6
© Queen’s Printer and Controller of HMSO 2020. This work was produced by Partos et al. under the terms of a commissioning contract issued by the Secretary of State for Healthand Social Care. This issue may be freely reproduced for the purposes of private research and study and extracts (or indeed, the full report) may be included in professionaljournals provided that suitable acknowledgement is made and the reproduction is not associated with any form of advertising. Applications for commercial reproduction shouldbe addressed to: NIHR Journals Library, National Institute for Health Research, Evaluation, Trials and Studies Coordinating Centre, Alpha House, University of Southampton SciencePark, Southampton SO16 7NS, UK.
107

TABLE 22 International Tobacco Control Policy Evaluation Project data study 4 (analysis 4a): fully adjusted clustered, multinomial logistic regression of tobacco product type(premium FM cigarettes is reference, with 25.0% using this product) on individual-level predictors (dependence and sociodemographics) (n= 2418, observations = 4339)
Predictors
FM cigarettes
RYO tobacco (30.4%)Mid-price (25.6%) Value (19.0%)
RRR 95% CI p-value RRR 95% CI p-value RRR 95% CI p-value
Dependence (HSI) Overall effect for HSI: χ2(6) = 16.19; p < 0.05
Low Ref Ref Ref
Moderate 1.20 0.96 to 1.49 0.101 1.46 1.15 to 1.86 0.002 1.42 1.13 to 1.78 0.002
High 0.90 0.57 to 1.41 0.636 1.08 0.65 to 1.79 0.761 1.38 0.90 to 2.12 0.143
Sex
Female Ref Ref Ref
Male 0.64 0.50 to 0.81 < 0.001 0.63 0.49 to 0.83 0.001 1.97 1.53 to 2.53 < 0.001
Age (years) Overall effect for age: χ2(6) = 47.40; p < 0.0001
18–39 Ref Ref Ref
40–54 0.73 0.55 to 0.96 0.024 1.30 0.94 to 1.80 0.108 1.00 0.74 to 1.34 0.975
≥ 55 0.54 0.41 to 0.72 < 0.001 1.29 0.92 to 1.80 0.135 0.59 0.43 to 0.82 0.001
Education Overall effect for education: χ2(6) = 33.30; p < 0.0001
Low Ref Ref Ref
Moderate 0.80 0.61 to 1.05 0.114 0.59 0.43 to 0.80 0.001 0.76 0.57 to 1.02 0.065
High 0.53 0.39 to 0.73 < 0.001 0.39 0.27 to 0.55 < 0.001 0.66 0.48 to 0.93 0.015
Income Overall effect for income: χ2(9) = 63.46; p < 0.0001
Low Ref Ref Ref
Moderate 1.00 0.74 to 1.35 0.998 0.79 0.57 to 1.08 0.142 0.66 0.49 to 0.88 0.005
High 0.77 0.55 to 1.06 0.107 0.43 0.30 to 0.61 < 0.001 0.36 0.26 to 0.50 < 0.001
Not disclosed 0.81 0.52 to 1.28 0.371 0.56 0.34 to 0.91 0.020 0.94 0.59 to 1.49 0.791
SOCIO
DEM
OGRA
PHIC
DISA
DVA
NTA
GE,TA
XES,PRICINGANDSM
OKIN
GBEH
AVIO
UR
NIHRJournals
Librarywww.journalslibrary.nihr.ac.uk
108

Predictors
FM cigarettes
RYO tobacco (30.4%)Mid-price (25.6%) Value (19.0%)
RRR 95% CI p-value RRR 95% CI p-value RRR 95% CI p-value
Region Overall effect for region: χ2(12) = 73.47; p < 0.0001
London Ref Ref Ref
Northern 2.38 1.55 to 3.65 < 0.001 2.64 1.43 to 3.58 < 0.001 1.50 0.95 to 2.36 0.079
Midlands and Eastern 1.40 0.93 to 2.11 0.108 1.19 0.77 to 1.85 0.440 1.57 1.04 to 2.38 0.033
Southern 1.13 0.74 to 1.70 0.574 1.63 1.04 to 2.55 0.032 2.03 1.33 to 3.10 0.001
Outside England 2.13 1.40 to 3.23 < 0.001 1.49 0.95 to 2.34 0.086 1.28 0.82 to 2.00 0.281
Relationship status
Single Ref Ref Ref
Partnered 0.85 0.68 to 1.07 0.161 0.62 0.48 to 0.80 < 0.001 0.70 0.55 to 0.89 0.003
Ethnicity
White Ref Ref Ref
Not white 0.82 0.32 to 0.84 0.007 0.51 0.31 to 0.83 0.006 0.33 0.20 to 0.54 < 0.001
Ref, reference.NotesTobacco tax increase rates are presented as per cent above inflation.RRRs are for the fully adjusted model, controlling for all variables listed.Values in bold are significant.
DOI:10.3310/phr08060
PUBLIC
HEA
LTHRESEA
RCH2020
VOL.8
NO.6
©Queen
’sPrinter
andController
ofHMSO
2020.This
work
was
producedby
Partoset
al.under
theterm
sof
acom
missioning
contractissued
bythe
Secretaryof
Statefor
Health
andSocialC
are.This
issuemay
befreely
reproducedfor
thepurposes
ofprivate
researchand
studyand
extracts(or
indeed,the
fullreport)may
beincluded
inprofessional
journalsprovided
thatsuitable
acknowledgem
entismade
andthe
reproductionisnot
associatedwith
anyform
ofadvertising.
Applications
forcom
mercialreproduction
shouldbe
addressedto:
NIHRJournals
Library,NationalInstitute
forHealth
Research,Evaluation,
Trialsand
StudiesCoordinating
Centre,
Alpha
House,
University
ofSoutham
ptonScience
Park,Southam
ptonSO
167N
S,UK.
109

TABLE 23 International Tobacco Control Policy Evaluation Project data study 4 (analysis 4b): fully adjusted clustered, multinomial logistic regression of tobaccopurchase changes (trading up/staying the same is reference, with 72.0% achieving this outcome) on individual-level predictors (dependence and sociodemographics)(n= 854, observations = 1397)
Predictors
Trade down to FM cigarettes (13.5%) Switch to RYO tobacco (6.2%) Stop purchasinga (8.3%)
RRR 95% CI p-value RRR 95% CI p-value RRR 95% CI p-value
Dependence (HSI) Overall effect for HSI: χ2(6) = 8.94; p = 0.18
Low Ref Ref Ref
Moderate 0.85 0.61 to 1.19 0.343 1.36 0.83 to 2.21 0.217 0.80 0.53 to 1.20 0.280
High 1.00 0.52 to 1.91 0.999 0.44 0.13 to 1.56 0.203 0.40 0.13 to 1.19 0.099
Sex
Female Ref Ref Ref
Male 0.98 0.72 to 1.35 0.918 2.30 1.44 to 3.68 0.001 1.12 0.74 to 1.71 0.591
Age (years) Overall effect for age: χ2(6) = 20.90; p < 0.005
18–39 Ref Ref Ref
40–54 0.80 0.52 to 1.23 0.315 0.55 0.31 to 0.53 0.043 0.65 0.36 to 1.16 0.145
≥ 55 0.63 0.41 to 0.98 0.041 0.28 0.15 to 1.49 <.001 0.84 0.48 to 1.47 0.594
Education Overall effect for education: χ2(6) = 6.60; p = 0.360
Low Ref Ref Ref
Moderate 0.64 0.45 to 0.91 0.013 0.87 0.50 to 1.49 0.605 1.03 0.64 to 1.66 0.896
High 0.86 0.55 to 1.32 0.487 1.09 0.54 to 2.19 0.806 0.99 0.53 to 1.83 0.972
Income Overall effect for income: χ2(9) = 17.82; p < 0.05
Low Ref Ref Ref
Moderate 1.10 0.75 to 1.61 0.617 0.57 0.31 to 1.02 0.059 1.12 0.61 to 2.04 0.717
High 0.90 0.58 to 1.40 0.649 0.47 0.24 to 0.91 0.026 1.83 0.98 to 3.42 0.058
Not disclosed 1.17 0.66 to 2.09 0.590 0.73 0.28 to 1.90 0.526 2.57 1.20 to 5.01 0.015
SOCIO
DEM
OGRA
PHIC
DISA
DVA
NTA
GE,TA
XES,PRICINGANDSM
OKIN
GBEH
AVIO
UR
NIHRJournals
Librarywww.journalslibrary.nihr.ac.uk
110

Predictors
Trade down to FM cigarettes (13.5%) Switch to RYO tobacco (6.2%) Stop purchasinga (8.3%)
RRR 95% CI p-value RRR 95% CI p-value RRR 95% CI p-value
Region Overall effect for region: χ2(12) = 12.32; p = 0.420
London Ref Ref Ref
Northern 1.58 0.89 to 2.80 0.116 2.03 0.81 to 5.09 0.129 1.36 0.67 to 2.75 0.352
Midlands and Eastern 1.13 0.62 to 2.06 0.691 2.34 0.97 to 5.63 0.057 1.11 0.75 to 1.66 0.840
Southern 1.52 0.85 to 2.74 0.161 2.01 0.79 to 5.11 0.143 0.62 0.22 to 1.75 0.742
Outside England 1.64 0.92 to 2.91 0.094 1.53 0.61 to 3.88 0.367 0.80 0.53 to 1.20 0.388
Relationship status
Single Ref Ref Ref
Partnered 0.71 0.52 to 0.97 0.031 0.64 0.40 to 1.03 0.068 1.11 0.75 to 1.66 0.596
Ethnicity
White Ref Ref Ref
Not white 0.55 0.20 to 1.47 0.234 0.44 0.17 to 1.13 0.088 0.62 0.22 to 1.75 0.365
Ref, reference.a Not purchasing because currently (at time of outcome survey) had quit for at least 6 months.NotesTobacco tax increase rates are presented as per cent above inflation.RRRs are for the fully adjusted model, controlling for all variables described in text.All predictors are measured at baseline, except for tobacco tax rates, which are measured at the outcome survey.Participants smoking RYO tobacco at baseline and those currently quit at outcome but for < 6 months are excluded.Values in bold are significant.
DOI:10.3310/phr08060
PUBLIC
HEA
LTHRESEA
RCH2020
VOL.8
NO.6
©Queen
’sPrinter
andController
ofHMSO
2020.This
work
was
producedby
Partoset
al.under
theterm
sof
acom
missioning
contractissued
bythe
Secretaryof
Statefor
Health
andSocialC
are.This
issuemay
befreely
reproducedfor
thepurposes
ofprivate
researchand
studyand
extracts(or
indeed,the
fullreport)may
beincluded
inprofessional
journalsprovided
thatsuitable
acknowledgem
entismade
andthe
reproductionisnot
associatedwith
anyform
ofadvertising.
Applications
forcom
mercialreproduction
shouldbe
addressedto:
NIHRJournals
Library,NationalInstitute
forHealth
Research,Evaluation,
Trialsand
StudiesCoordinating
Centre,
Alpha
House,
University
ofSoutham
ptonScience
Park,Southam
ptonSO
167N
S,UK.
111

Low-income smokers were more likely to switch to RYO tobacco than high-income smokers; and those withlow levels of education more likely than those with moderate levels of education to trade down to cheaperFM products. However, there were no other clear indications that down-trading was more common amongsocioeconomically disadvantaged smokers overall. This might be because socioeconomically disadvantagedsmokers were already smoking cheaper products and thus did not have down-trading as an option. However,the data also suggested that there was no socioeconomic difference in quitting. This explains why the over-representation of socioeconomic disadvantage among smokers has been perpetuated, despite high tobaccotaxes. If equal proportions of low-SES and high-SES smokers quit, there will still be more low SES smokersbecause there was a larger pool to start with.
LimitationsWe note that for this study, the first outcome survey was in 2010/11 and the largest tax increases werein 2011 and 2012, so it is possible that had the study started post 2012 then more socioeconomicdifferentiation would be apparent. We could not isolate the post-2012 period due to an insufficientnumber of cases. Another limitation was that the numbers for the highest dependence (HSI) group wererelatively low (see Table 15). This may have contributed to our lack of significant findings relating todependence, although we note that the ORs were in the expected direction, with trends for the highestHSI group to be more likely to use value FM cigarettes or RYO tobacco (than premium FM cigarettes) andless likely to achieve a sustained quit attempt. Future research needs to examine this further.
ITC study 5: impact of tobacco pricing changes and product choices onsmokers’ quitting behaviours (sociodemographics and dependence)
This study examines the impact of sociodemographics and dependence on smokers’ quitting behaviours,with methodological details and limitations discussed in Chapter 7.
MethodsHere we report the results of longitudinal analyses 5a and 5b of ITC data study 5, pertaining only tosociodemographics and dependence (HSI). Both analyses were longitudinal, clustered, logistic regressions,with analysis 5a predicting making quit attempts and analysis 5b predicting achieving at least 6 months’sustained abstinence from smoking. We focus our reporting on model 2 of these analyses, which fullycontrolled for all included predictors.
Results
Analysis 5a: quit attemptsAs may be seen in Table 24, smokers with moderate (vs. low) tobacco dependence (HSI scores) weresignificantly less likely to make a quit attempt. Those with high levels of education were more likely tomake a quit attempt, relative to those with low levels of education, but no effects of income wereobserved. Older smokers were less likely to make a quit attempt than those aged 18–39 years andpartnered smokers were more likely to make a quit attempt than single smokers.
Analysis 5b: sustained abstinenceThe overall effect of dependence (HSI) on sustained quitting did not quite reach significance (p = 0.069),although ORs were in the expected direction of abstinence being less likely with increasing dependence.There were no significant relationships between our sociodemographic measures and 6 months’ sustainedabstinence.
ImplicationsAfter taking account of dependence on tobacco, products smoked, loyalty to brand and product, andtobacco tax rate, we found no sociodemographic differences in quit success (achieving at least 6 months’sustained abstinence) and no consistent patterns in relations to sociodemographics and quit attempts.
SOCIODEMOGRAPHIC DISADVANTAGE, TAXES, PRICING AND SMOKING BEHAVIOUR
NIHR Journals Library www.journalslibrary.nihr.ac.uk
112

TABLE 24 International Tobacco Control Policy Evaluation Project data study 5: fully adjusted clustered logisticregression of making a quit attempt and achieving at least 6 months’ sustained abstinence
Predictors
Analysis
5a: making a quit attempt (n= 1304,observations= 2202)
5b: achieving at least 6 months’ quit(n= 1194, observations= 2017)
OR 95% CI p-value OR 95% CI p-value
Dependence (HSI) χ2(2) = 9.57; p < 0.01 χ2(2) = 5.36; p = 0.069
Low Ref Ref
Moderate 0.67 0.52 0.86 0.002 0.62 0.44 1.09 0.113
High 0.73 0.44 1.20 0.213 0.31 0.10 0.92 0.035
Sex
Female Ref Ref
Male 0.87 0.67 1.15 0.328 1.10 0.70 1.74 0.685
Age (years) χ2(2) = 8.91; p < 0.05 χ2(2) = 2.57; p = 0.276
18–39 Ref Ref
40–54 0.62 0.43 0.88 0.007 0.62 0.34 1.13 0.118
≥ 55 0.60 0.42 0.86 0.005 0.80 0.44 1.44 0.457
Education χ2(2) = 10.98; p < 0.005 χ2(2) = 3.38; p = 0.184
Low Ref Ref
Moderate 1.00 0.73 1.36 0.978 1.42 0.84 2.40 0.187
High 1.82 1.25 2.65 0.002 1.75 0.92 3.33 0.088
Income χ2(3) = 0.42; p = 0.935 χ2(3) = 3.63; p = 0.305
Low Ref Ref
Moderate 1.00 0.72 1.39 0.989 1.32 0.73 2.40 0.363
High 1.06 0.73 1.54 0.747 1.69 0.88 3.23 0.113
Not disclosed 1.14 0.69 1.89 0.607 1.99 0.85 4.68 0.115
Region χ2(4) = 1.4; p = 0.836 χ2(4) = 1.41; p = 0.842
London Ref Ref
Northern 1.16 0.71 1.90 0.542 0.85 0.38 1.92 0.693
Midlands and Eastern 1.08 0.67 1.73 0.746 0.99 0.45 2.15 0.973
Southern 0.94 0.59 1.51 0.805 0.72 0.32 1.62 0.434
Outside England 0.97 0.60 1.59 0.915 0.74 0.32 1.69 0.45
Relationship status
Single Ref Ref
Partnered 1.31 1.01 1.70 0.040 1.35 0.87 2.09 0.182
Ethnicity
White Ref Ref
Not white 1.43 0.74 2.77 0.284 1.50 0.50 4.50 0.470
Ref, reference.NotesIn analysis 5a, 39.4% made a quit attempt, and in analysis 5b 9.7% achieved sustained abstinence for at least 6 months,between baseline and outcome surveys.Tobacco tax increase rates are presented as per cent above inflation.ORs are for the fully adjusted model, controlling for all variables described in text.Chi-squared statistics are for overall effects of any variables with three or more categories.All predictors are measured at baseline, except for tobacco tax rates, which are measured at the outcome survey.Achieving at least 6 months’ quit is defined as achieving at least 6 months’ sustained abstinence between the baseline andoutcome surveys, regardless of status at the outcome survey. Participants currently quit for < 6 months at the outcomesurvey were excluded from analysis 5b.Values in bold are significant.
DOI: 10.3310/phr08060 PUBLIC HEALTH RESEARCH 2020 VOL. 8 NO. 6
© Queen’s Printer and Controller of HMSO 2020. This work was produced by Partos et al. under the terms of a commissioning contract issued by the Secretary of State for Healthand Social Care. This issue may be freely reproduced for the purposes of private research and study and extracts (or indeed, the full report) may be included in professionaljournals provided that suitable acknowledgement is made and the reproduction is not associated with any form of advertising. Applications for commercial reproduction shouldbe addressed to: NIHR Journals Library, National Institute for Health Research, Evaluation, Trials and Studies Coordinating Centre, Alpha House, University of Southampton SciencePark, Southampton SO16 7NS, UK.
113

Thus, future studies of smoking inequalities should take tobacco product smoked into account. Otherstudies may have found that socioeconomically disadvantaged smokers may be less likely to quit becausethey are willing to smoke cheap products (e.g. see Table 22). Thus, if the availability of cheap tobaccoproducts declined, socioeconomically disadvantaged smokers might be more willing to quit.
ITC study 6: weight of roll-your-own tobacco cigarette analysis over timeand international comparison (sociodemographics and dependence)
Here we examine the impact of sociodemographic differences and tobacco dependence, among exclusiveRYO tobacco smokers, on the weight of tobacco used in RYO cigarettes over time.
MethodsThis study uses the same sample and analyses as for ITC data study 6, with methodological details andlimitations reported in Chapter 7. Briefly, this was a cross-sectional study among exclusive RYO tobaccosmokers from the UK, USA, Canada and Australia, with data aggregated over the six ITC surveys (surveys 5–10),conducted between 2006 and 2015 (see Table 4). For data from Australia and the UK, clustered linearregression analyses were used to regress tobacco weights on the predictor variables (time, country, TTFC,sex, age, ethnicity, education and income). Here our focus is on the influence of tobacco dependence (TTFC)and sociodemographics.
ResultsSample characteristics are presented in Table 19. Results of the regression analyses are presented in Table 25,for the data from Australia and the UK. The weight of tobacco was significantly associated with TTFC,increasing by around 0.00024 g for every minute participants took to smoke their first cigarette after waking,and this persisted after controlling for time, country and sociodemographic variables. There was a significantassociation between weight and age, even after controlling for TTFC. Older participants used more tobaccothan younger participants (e.g. smokers aged ≥ 55 years used around 0.12 g more tobacco per cigarette thanthose aged < 40 years) (Figure 21). Although the unadjusted effects of income on weight were not significant,there was a significant effect after controlling for time, country, TTFC and other sociodemographic factors inthe fully adjusted model. Participants with moderate and high income used more tobacco per cigarette (anaverage of 0.033 g and 0.05 g, respectively), compared with low-income participants (Figure 22). Sex, ethnicityand level of education had no significant effects on weight in unadjusted or fully adjusted analyses.
ImplicationsSmokers who were more addicted, younger smokers and those with lower incomes were able to reducetobacco expenditure by rolling cigarettes with less tobacco.
Summary: were tobacco industry price strategies and tax structuresinfluencing inequalities?
Socioeconomically disadvantaged smokers and older smokers, particularly those smoking FM cigarettes,faced higher struggles with affordability of smoking in the period studied. Associations betweensociodemographic variables and making quit attempts but not with quit success (achieving at least6 months’ sustained abstinence) were inconsistent with previous research.240–242 Previous research has nottaken tobacco products used into account. There was a significant effect of dependence, as expected, withmore dependent smokers having a lower likelihood of quit success. Smoking Toolkit Study data243 suggestthat smoking prevalence declined by one-third among high-SES smokers (36%), but only one-quarteramong low-SES smokers (26%), between November 2006 and February 2018. From the present research,we suggest two reasons for lack of quitting among low-income smokers despite affordability concerns:(1) low-income smokers took the opportunity, like other smokers, to trade down to cheaper forms ofFM cigarettes or switch to RYO tobacco; and (2) they were more likely to use less tobacco when rollingRYO cigarettes.
SOCIODEMOGRAPHIC DISADVANTAGE, TAXES, PRICING AND SMOKING BEHAVIOUR
NIHR Journals Library www.journalslibrary.nihr.ac.uk
114

20072006
0.40
0.42
0.44
0.46
0.48
Mea
n w
eig
ht
(g)
of
RY
O t
ob
acco
per
cig
aret
te
0.50
0.52
0.54
0.56
0.58
0.62
0.60
2008 2009 2010Year
2011a 2012a 2013 2014
Age group (years)18–39
40–54≥ 55
FIGURE 21 International Tobacco Control Policy Evaluation Project data study 6: mean model-predicted weight oftobacco (in grams) per RYO cigarette over time, for different age groups (pooled data from Australia and the UK).The model-predicted values are from a fully adjusted clustered linear regression, controlling for country, TTFC, sex,age, ethnicity, level of education and income. No data were collected from the UK in 2011 and no data werecollected from the UK or Australia in 2012. The sample size from Australia for 2011 was low (n= 25). See Table 19for more details. a, No ITC data collected for this year.
TABLE 25 International Tobacco Control Policy Evaluation Project data study 6: clustered linear regressionpredicting the weight of tobacco per RYO cigarette (n= 1349, observations = 2705)
Predictors
Analysis
Univariate effects (unadjusted) Multivariate effects (fully adjusted)
β SE (β) p-value β SE (β) p-value
Dependence (TTFC in minutes) 0.00024 0.000089 < 0.01 0.00024 0.000083 < 0.005
Sex
Female Ref Ref
Male –0.0049 0.014 0.735 –0.020 0.014 0.175
Age group (years) χ2(2) = 26.6; p < 0.0001 χ2(2) = 42.3; p < 0.0001
18–39 Ref Ref
40–54 0.046 0.015 < 0.005 0.052 0.015 < 0.001
≥ 55 0.088 0.014 < 0.001 0.12 0.018 < 0.001
Ethnicity
White, English speaking Ref Ref
Not white/not English speaking 0.034 0.041 0.398 0.041 0.040 0.309
Education χ2(2) = 1.12; p = 0.573 χ2(2) = 0.18; p = 0.913
Low Ref Ref
Moderate –0.016 0.016 0.319 –0.0062 0.015 0.685
High 0.0007 0.018 0.969 –0.00022 0.019 0.991
Income χ2(3) = 4.93; p = 0.177 χ2(3) = 9.58; p = 0.023
Low Ref Ref
Moderate 0.016 0.015 0.289 0.033 0.015 0.032
High 0.043 0.020 0.029 0.060 0.021 0.004
Not disclosed 0.0079 0.024 0.741 0.019 0.024 0.428
NoteMultivariate analyses are fully adjusted for time, country, TTFC, sex, age group, ethnicity, education and income.
DOI: 10.3310/phr08060 PUBLIC HEALTH RESEARCH 2020 VOL. 8 NO. 6
© Queen’s Printer and Controller of HMSO 2020. This work was produced by Partos et al. under the terms of a commissioning contract issued by the Secretary of State for Healthand Social Care. This issue may be freely reproduced for the purposes of private research and study and extracts (or indeed, the full report) may be included in professionaljournals provided that suitable acknowledgement is made and the reproduction is not associated with any form of advertising. Applications for commercial reproduction shouldbe addressed to: NIHR Journals Library, National Institute for Health Research, Evaluation, Trials and Studies Coordinating Centre, Alpha House, University of Southampton SciencePark, Southampton SO16 7NS, UK.
115

These findings suggest that the tax system needs to reduce the ability for price differentiation within FMcigarettes by a further move towards specific taxation, and between FM cigarettes and RYO tobacco byequalising specific taxation rates. Introducing sales restrictions, as in Uruguay, where only one variant perbrand is allowed, would also reduce price differentiation. Low-income smokers have faced severe incomereductions since the recession, yet their higher dependence on tobacco244 means that they continue tosmoke. This will affect their spending power in other areas.245 Government funding for school meals, thepupil premium, extracurricular clubs and activities, and social services is important so that smokers’ childrencan reach their potential despite their parents’ dependence on tobacco. In addition, addressing the stressof income insecurity (via insecure employment, housing and benefits) is important so that low-incomesmokers find it easier to quit.246
20072006
0.44
0.46
0.48
0.50
0.52
0.54
0.56
0.58
0.60M
ean
wei
gh
t (g
) o
f R
YO
to
bac
co p
er c
igar
ette
2008 2009 2010Year
2011a 2012a 2013 2014
LowIncome group
ModerateHigh
FIGURE 22 International Tobacco Control Policy Evaluation Project data study 6: mean model-predicted weight oftobacco (in grams) per RYO cigarette over time, for different income groups (pooled data from Australia and theUK). The model-predicted values are from a fully adjusted multilevel linear regression, controlling for country,TTFC, sex, age, ethnicity, level of education and income. No data were collected from the UK in 2011 and no datawere collected from the UK or Australia in 2012. The sample size from Australia for 2011 was low (n= 25). See textand Table 19 for more details. a, No ITC data collected for this year.
SOCIODEMOGRAPHIC DISADVANTAGE, TAXES, PRICING AND SMOKING BEHAVIOUR
NIHR Journals Library www.journalslibrary.nihr.ac.uk
116

Chapter 10 Overall synthesis of findings
Introduction
Tobacco control and tobacco tax policies both influence and need to be informed by TI pricing andprofitability, and by smokers’ behaviour, including levels of cheap and illicit tobacco use (Figure 23).
This study brings together diverse evidence covering these inter-related issues to inform the developmentof maximally effective approaches to tobacco taxation and regulation. Specifically, it combines data onTI behaviour (from a review of the commercial literature from 2008 to 2014); analysis of Nielsen data(monthly data on tobacco sales and price from 2008 to 2016); and smokers’ behaviour (10 surveys of theITC data from 2002 to 2014), providing information on the purchase source of tobacco and price paid,smokers’ SES and behaviours, such as quitting and switching. In this chapter we summarise the key studyfindings and their implications.
Industry pricing and what smokers pay for their tobacco(see Chapters 3 and 4)
Industry pricing and profit maximisation suggests scope for further tax increases
1. Overall, the TI is overshifting taxes (increasing prices on top of tax increases) on FM cigarettes and RYOtobacco, thereby increasing its revenues on both products. This occurred throughout the study period,even when tax increases were high.There is scope to increase tobacco taxes further. The public health costs of smoking far outweightobacco tax revenues. Increasing taxes further would cover such revenue deficits, as we found noevidence to support TI rhetoric that price (tax) increases drive illicit trade.
2. Generally, a higher proportion of tobacco price rises has been to meet government taxes than forindustry revenue generation. However, tax increases have become a smaller proportion of priceincreases in recent years. Thus, more recently, a relatively larger proportion of the price rise has been forindustry revenue generation, as indicated by the increase in overshifting (see Table 10). The proportionof price rises for industry revenue rather than taxes has at least doubled for all RYO tobacco pricesegments and for premium FM cigarettes and mid-price FM cigarettes. There has been little change forvalue FM cigarettes, and subvalue FM cigarettes have undershifted. The high rate of overshifting onRYO tobacco indicates room for an added increase in RYO tobacco taxation.
ProfitsTobacco
control andtax policy
Smokers’behaviour
Illicit
TIpricing
FIGURE 23 The inter-relationship between tobacco control and tax policy, TI and smokers’ behaviour.
DOI: 10.3310/phr08060 PUBLIC HEALTH RESEARCH 2020 VOL. 8 NO. 6
© Queen’s Printer and Controller of HMSO 2020. This work was produced by Partos et al. under the terms of a commissioning contract issued by the Secretary of State for Healthand Social Care. This issue may be freely reproduced for the purposes of private research and study and extracts (or indeed, the full report) may be included in professionaljournals provided that suitable acknowledgement is made and the reproduction is not associated with any form of advertising. Applications for commercial reproduction shouldbe addressed to: NIHR Journals Library, National Institute for Health Research, Evaluation, Trials and Studies Coordinating Centre, Alpha House, University of Southampton SciencePark, Southampton SO16 7NS, UK.
117

Recently, supplementary RYO tobacco tax rises (March 2016 and November 2018) have occurred.However, these findings suggest that there is particular scope to increase taxes on RYO tobacco further.This would also serve to reduce the large difference in prices per cigarette between FM cigarettes andRYO tobacco (see finding 20), thereby discouraging smokers from saving money by switching from FMcigarettes to RYO tobacco.
Industry pricing undermining the impact of tax increases
3. As in finding 2, although the overall pattern is one of overshifting, detailed analysis shows that the TI isdifferentially shifting taxes between price segments. It overshifts taxes on the more expensive productswhile absorbing tax increases on the cheapest products, such that their real price per pack (in bothFM cigarette and RYO tobacco segments) has remained stagnant in recent years. This has increasedthe price range between the most and least expensive products both within and between FM cigarettesand RYO tobacco (e.g. Figure 7), and increased the opportunities for smokers to down-trade.Consequently, the volume of sales in the cheapest segments has grown in recent years (see Table 8).In May 2017, a minimum excise tax (MET) was introduced in the UK, with the aim of narrowing therange between the most and least expensive products. Although this is after our period of study, ourfindings suggest that the impact of this needs to be monitored carefully and that it will probably needto be regularly increased, at least in line with inflation. Indeed, steady increases in the MET above therate of inflation would start to reduce the ability of the industry to offer cheap FM cigarettes, so aformula for such regular adjustments should be developed [see also finding 15 for discussion of thepossibility of a minimum consumption tax (MCT), a variant of a MET].
4. We also observe that this pattern (differential shifting of taxes and price widening) has been nuancedby tobacco tax interventions. Most notably, (1) following the larger 2011 tax increase on RYO tobaccothan FM cigarettes, the price range between RYO tobacco and FM cigarette packs in each pricesegment narrowed (see Figure 7); (2) the shift towards specific tax on FM products in 2011 also appearsto have temporarily narrowed the price range between the most and least expensive FM products,which then widens again post 2012 (see Figure 7); (3) the industry was less able to game the system(by differential shifting of taxes) in the 2010–12 period, which saw sudden, larger tax increases comparedwith a period with planned, steady, smaller tax increases (see Table 10); and (4) there was a narrowerprice range (per stick) observed for RYO tobacco than for FM cigarettes (see Figures 6 and 7).Tax interventions designed to narrow the price gap (increasing taxes on RYO tobacco relative to FMcigarettes and increasing the proportion of tax on FM cigarettes that is specific rather than ad valorem)can be effective. Sudden, large tax increases reduce industry’s ability to game the system (see alsofinding 5). The narrower price range observed for RYO tobacco than for FM cigarettes is likely (at leastin part) to reflect the fully specific tax structure on RYO tobacco.
5. The TI seeks to reduce further the impact of tax increases on smokers by smoothing the impact of thetax increase through the year, by absorbing the tax increases (and cutting profits) in the immediatepost-Budget period and then gradually increasing prices (and profits) thereafter (see Figure 10). Theextent and duration of this tax absorption and smoothing is most marked in the cheapest segments andin recent years is more marked in FM cigarettes than in RYO tobacco, again reflecting the greater scopefor tax increases in RYO tobacco (see also finding 2).This minimises the public health impact of tax increases by ensuring that smokers never face a sudden,large price increase. Internal industry documents confirm that the TI is particularly fearful of sudden,large tax increases and evidence indicates that sudden, large price increases are most associated withquit attempts.59,247,248 Findings 4 and 5 therefore lend further weight to the benefit of sudden, large taxincreases. Consideration should be given to interlinked options: (1) implementing intermittent larger taxincreases on top of the tax escalator; (2) making the timing of such tax increases unpredictable andwith little notice so that industry has no time to game the system; and (3) limiting the number of timesper year that the industry is able to change its prices.
OVERALL SYNTHESIS OF FINDINGS
NIHR Journals Library www.journalslibrary.nihr.ac.uk
118

Approaches the tobacco industry uses to keep some products cheap
6. The TI has been doing a number of things to keep some products cheap. Specifically, it has beenintroducing new and cheaper FM and RYO products and price segments (e.g. a new ‘subvalue’ FMsegment was introduced in 2012 and the RYO tobacco market is now segmented like the FM cigarettemarket) (see Figure 7). The TI has also been using price marking, particularly on the cheapest products(see Figure 8), and cutting the number of sticks or weight of tobacco per pack, again particularly incheaper segments. For example, by the end of the study period, all subvalue FM brands were sold inpacks of < 20 cigarettes and 10-g RYO tobacco packs were introduced (see Table 8).Many of these issues, such as price marking, have now been addressed through the UK’s plainpackaging legislation and the EU TPD. The former prevents price marking, whereas the latter setsminimum pack sizes for both FM cigarettes (20 cigarettes) and RYO tobacco (30 g), which will lead tosignificant changes to the UK tobacco market (e.g. in 2015, 90% of RYO tobacco packs sold were< 30 g). However, larger pack sizes might also be employed by the TI to disrupt price signals (e.g. a24-stick pack being cheaper than a 25-stick pack), or to provide cheaper tobacco (potentially madepossible due to larger packs having lower production costs). Pack size ‘standardisation’ (allowing onlyone pack or pouch size), rather than just minimum pack sizes, would prevent this.A key remaining issue is the TI’s ability to continually introduce new products, including cheapervariants of existing products such as L&B Blue, a value priced version of L&B. This could be restricted byallowing only one variant per brand, as in the latest Uruguayan legislation, and/or freezing theintroduction of any new FM cigarette or RYO tobacco brands.
Importance of both pack and unit price to smokers and governments
7. Although government tax policy might increase the unit price of a product (e.g. the price per stick orgram), the TI minimises the price rises per pack that consumers face by cutting the number of sticks orthe weight of tobacco per pack. Although this might reassure smokers because the prices per packremain steady, the smoker is in fact gradually paying more per stick, thus ensuring industry profitabilityincreases (see Figure 7 and Table 8).Consideration by tax authorities is needed for both the pack and the stick price of products in designingtax policy. Minimum pack sizes (see finding 6) will help address this issue in jurisdictions where this isnot yet in place.
The prices smokers pay
8. The prices smokers end up paying for their tobacco reflect both the industry prices and the consumers’purchasing choices [see Impact of tobacco tax increases, as moderated by tobacco industry pricing onsmokers’ purchasing patterns (see Chapter 6)]. Analysis of 2002–14 ITC data on real (base year 2014)prices paid by smokers in UK stores showed how purchasing choices could affect price. Although thereal price of all product types had increased across the study period, changes were very small and therewas little change until 2010, reflecting the larger tax increases after that point. Smokers could accessFM cigarettes in 2014 at 2002 prices (and RYO tobacco at 2005 prices) because of the widening rangein prices, particularly in FM cigarettes, again more marked from the introduction of the tax escalator,suggesting that this was an industry response to tax policy. Approximately one in six smokers were buyingFM cigarettes by the carton rather than the pack, at £0.01–0.02 less per stick. Smokers could makesubstantial savings by switching their product choice. For example, smokers of RYO tobacco could savearound £0.18 a stick (a saving of £750 a year for an average consumer), compared with FM smokers.Changes since 2010 provide further evidence that the larger tax increases later in our study period hadgreatest impact (see also finding 9). Such large tax rises should be combined with the aforementionedmeasures to reduce the range of tobacco price points.Banning carton sales would remove one avenue for smokers to obtain cheaper tobacco.
DOI: 10.3310/phr08060 PUBLIC HEALTH RESEARCH 2020 VOL. 8 NO. 6
© Queen’s Printer and Controller of HMSO 2020. This work was produced by Partos et al. under the terms of a commissioning contract issued by the Secretary of State for Healthand Social Care. This issue may be freely reproduced for the purposes of private research and study and extracts (or indeed, the full report) may be included in professionaljournals provided that suitable acknowledgement is made and the reproduction is not associated with any form of advertising. Applications for commercial reproduction shouldbe addressed to: NIHR Journals Library, National Institute for Health Research, Evaluation, Trials and Studies Coordinating Centre, Alpha House, University of Southampton SciencePark, Southampton SO16 7NS, UK.
119

Changes in the affordability of tobacco over time (see Chapter 5)
9. Both the commercial literature and ITC data indicated a decline in tobacco affordability over the studyperiod (2002–14) in both FM and RYO products (see Figure 11). Yet declines in affordability weresmall and year-to-year changes in affordability were not significant (see Table 12). The greatestdecrease in affordability occurred when tax increases were greatest (from 2010 onwards).Large tax increases resulting in price rises greater than the rate of inflation are essential to reducingthe affordability of tobacco. This finding reinforces findings 1, 4, 5 and 8 that there is both need andscope for further tax increases, and that such increases need to be significant to reduce affordability.
10. Although price increases in RYO tobacco were greater than in FM cigarettes, RYO tobacco remainsmore affordable than FM cigarettes (RYO tobacco smokers retained 93.7% of their income afterpaying for tobacco in 2014, compared with 87.8% among FM cigarette smokers).In line with finding 2, this signals greater scope to increase taxes on RYO tobacco (see also finding 5).
11. In our sample of smokers, income declined from 2002 to 2012 (see Figure 11), yet among the UKpopulation as a whole, incomes were increasing from 2002 to 2008 (prior to the recession).This suggests that smoking is increasingly a hallmark of socioeconomic disadvantage and that it isincreasingly important to provide additional support for smokers to quit when tobacco tax andprices increase.
12. Declines in affordability were due to both increases in tobacco prices and declining incomes, and wereless than expected because smokers adjust their purchasing and smoking patterns (including slightreductions in consumption) [see finding 8 and Impact of tobacco tax increases, as moderated bytobacco industry pricing on smokers’ purchasing patterns (see Chapter 6)].
Impact of tobacco tax increases, as moderated by tobacco industrypricing on smokers’ purchasing patterns (see Chapter 6)
Purchase source: UK store-based sources
13. Over the study period, the proportion of smokers buying from a UK store remained steady. However,smokers switched significantly (albeit by a small proportion) from purchasing from convenience stores(51.2% of purchases in 2002 to 41% in 2014) to supermarkets (41.4% and 54.2%, respectively), themost marked change occurring around the time of the recession (see Table 13). This pattern probablyreflects cheaper prices in supermarkets.
Product switching
14. Nielsen and ITC data, supported by the commercial literature, show that there has been a shifttowards RYO tobacco from FM cigarettes. Nielsen data show that, although total tobacco sales overallhave fallen (13% decline in stick sales), this is explained by a marked decline in FM cigarette sales(17% decline in stick sales) accompanied by a 46% increase in sale volumes of RYO tobacco acrossthe whole study period (see Figure 12). In line with this, ITC data show that exclusive RYO tobaccouse increased significantly (mainly from 2002 to 2010), whereas exclusive FM cigarette use declinedsignificantly (see Table 13). In 2014, the latest year for which we have data, 55% were exclusive FMcigarette smokers and 30% were exclusive RYO tobacco smokers (15% smoked a mix). Both Nielsenand ITC survey data indicate that the increase in RYO use has now plateaued.This finding reinforces calls for equalising the tax on RYO tobacco to that on FM cigarettes, bearing inmind that UK smokers use around 0.5 g of tobacco in their RYO cigarettes, in order to reduce theprice differential and the incentive to switch (see also findings 2 and 10).
OVERALL SYNTHESIS OF FINDINGS
NIHR Journals Library www.journalslibrary.nihr.ac.uk
120

Down-trading
15. Commercial literature and Nielsen data indicate that both RYO tobacco and FM cigarette smokers aredown-trading to cheaper products, with sales in the higher price segments falling markedly and thosein the cheapest segments growing (see Figure 13). ITC survey data mirror those findings, showing thatnon-premium use increased from 72% to 78% (with the most marked increase of 17% occurring inthe value segment), whereas premium use fell (see Figure 14). Cheaper products were more likely tobe used when the tax increase was highest, at 5% above inflation (see Table 16).The MET introduced in 2017 (after our study) should help to narrow the price gap between segments,but this needs to be carefully evaluated and increased over time. Alternative measures that wouldhelp address this issue include a fully specific tax structure on FM cigarettes (which should be possiblepost Brexit) and price cap regulation.122,249 Another possibility is consideration of a MCT. The latter issimilar to a MET, but includes VAT (a general sales tax) so would affect both FM cigarette and RYOtobacco sales, unlike the MET, which applies only to FM cigarettes.
16. Longitudinal analysis of ITC data with baseline FM cigarette smokers only showed that, overall, 66.5%of smokers made no changes to their smoking behaviour: 5.5% traded up, 13.5% traded down fromone FM product to a cheaper one, 6.2% switched from FM cigarettes to RYO tobacco and stoppingpurchasing tobacco products for at least 6 months (i.e. quitting for a sustained period) was achievedby 8.3% (see Table 17).A more common outcome than quitting, in a context of growing taxes and reduced affordability, istrading down. This underlines the importance of both tax increases and narrowing the range in pricebetween cheap and expensive products.
Impact of tobacco tax increases, as moderated by tobacco industrypricing, on smoking behaviour via quitting and reducing tobaccoconsumption (see Chapter 7)
17. Longitudinal analysis of quit attempts and success showed that both were more likely with high taxes.However, these outcomes also varied by product used (price). Mid-price and value FM cigarette userswere more likely to attempt quitting than RYO tobacco users. Mid-price and value FM cigarette usersand RYO tobacco users enjoyed greater quit success than premium FM cigarette users.The association of high tax rises with quitting supports previous findings.59,247,248 Smokers of premiumproducts were the least likely to achieve a sustained quit attempt. This may reflect the numerous otheroptions available to them (trading down, switching) and suggests that quitting is more likely amongthose with fewer options available to reduce costs. More frequent purchasers of illicit tobacco werealso more likely to buy premium cigarettes (and RYO tobacco) than mid-price and value FM cigarettes,which may also be contributing to this finding (but see point 26, as frequency of purchasing illicitproducts did not predict quitting). As the availability of cheaper tobacco options offers smokers thepossibility of down-trading instead of quitting, policy measures should address the availability ofcheaper legal tobacco.
18. There was no link between brand loyalty or product loyalty and either quit attempts or success(see Table 18).
19. We identified a small, but significant, decline in cigarette consumption among FM cigarette smokersfrom 17.5 to 16.1 CPD, but no such decline among RYO tobacco users. We therefore concluded thatthe changes in cigarette consumption did not make a substantial contribution to the observed declinein tobacco affordability.The fact that consumption of RYO cigarettes did not decline may reflect the fact that RYO tobaccosmokers are instead reducing the weight of each RYO cigarette (see finding 20).
DOI: 10.3310/phr08060 PUBLIC HEALTH RESEARCH 2020 VOL. 8 NO. 6
© Queen’s Printer and Controller of HMSO 2020. This work was produced by Partos et al. under the terms of a commissioning contract issued by the Secretary of State for Healthand Social Care. This issue may be freely reproduced for the purposes of private research and study and extracts (or indeed, the full report) may be included in professionaljournals provided that suitable acknowledgement is made and the reproduction is not associated with any form of advertising. Applications for commercial reproduction shouldbe addressed to: NIHR Journals Library, National Institute for Health Research, Evaluation, Trials and Studies Coordinating Centre, Alpha House, University of Southampton SciencePark, Southampton SO16 7NS, UK.
121

20. In the UK, the weight per RYO cigarette has fallen significantly and by approximately 2% a year, from 0.59 gin 2006 to 0.46 g in 2014 (see Figure 15). Applying the 2014 tobacco weight (0.46 g) to 2017 tax rates,we estimate that the tax per cigarette was £0.10 per RYO cigarette, compared with £0.28 per FM cigarette.This decline will have offset, at least to some extent, the impact of tax increases on RYO tobacco.Taxation of RYO tobacco should therefore increase to a greater extent relative to FM cigarettes,to address the greater affordability of RYO cigarettes.
21. A comparison of RYO tobacco use and weights in the UK, Australia (both with high taxes and asignificant tax difference between RYO tobacco and FM cigarettes), the USA and Canada (both withlower taxes and more similar taxes on FM cigarettes and RYO tobacco) showed that in the higher taxjurisdictions there were higher levels of exclusive RYO tobacco use, less tobacco used when rolling acigarette and falling weights over time of tobacco used when rolling.Countries starting to increase taxes on tobacco need to carefully balance taxes on FM cigarettes andRYO tobacco, in order not to encourage product shifting. To do this, they will need to carefullymeasure weights of RYO cigarettes. In the UK, this finding reinforces the need to significantly increaseRYO tobacco taxation, in order to approximate taxes on RYO tobacco to FM cigarettes. Other findings(see findings 4 and 5) suggest that the best way to achieve this might be a sudden, large increase intax on RYO tobacco. It also underlines the need to carefully monitor RYO tobacco weights and adjusttax levels accordingly. Maintaining a fully specific tax structure on RYO tobacco is also important toavoid creating further price differentials. Just prior to the full implementation of the EU TPD, weobserved in the UK that the TI was supplying 30-g RYO tobacco packs with 60 rolling papers, implyingthat they were aware that smokers rolled approximately 0.5 g of tobacco per cigarette.
Purchasing tobacco likely to constitute tax avoidance and/or evasion(see Chapter 8)
Non-UK/non-store purchases
22. Non-UK/non-store purchases included overseas and internet purchases, duty free and purchases frominformal sellers (i.e. all sources that might involve tax evasion or avoidance). Across 2002 to 2014,one-fifth or less of all tobacco purchases were from non-UK/non-store sources.The UK government’s strategy to constrain illicit tobacco use appears to be successful and should continue.
23. Over the study period, despite regular claims from the TI that illicit tobacco use was increasing,we found no increase in non-UK/non-store purchases.Despite declining affordability, industry attempts to scaremonger over illicit products should be ignoredwhile continuing to reinforce efforts to address both the supply of, and demand for, illicit tobacco.250
24. The majority of non-UK/non-store-based sources appeared to be tax avoidance, constituting duty freeor sources outside the UK. Typically, less than one-quarter of non-UK/non-store purchases were fromsources likely to be tax evasion.Limits on duty-free sales could be considered and further limits based on cross-border sales, given theUK’s proximity to countries with lower taxes, and the TI’s documented overproduction of cigarettesin low-tax jurisdictions (such as Ukraine78) and overexport to low-tax jurisdictions (such as Belgium251),all likely to fuel the illicitly trade.252 It is important that sales of duty-free or low-duty-paid tobacco donot increase and will ideally decline.
25. The majority of non-UK/non-store tobacco products were FM-C, followed by RYO tobacco and veryfew were FM-P. The median prices for all product types were typically lower than the cheapest productsfrom UK store-based sources (see Figure 16). Purchasing FM cigarettes and RYO tobacco from non-UK/non-store sources conferred a saving of around 5% of smokers’ annual incomes (see Figures 17).Although non-UK/non-store purchases were on average cheaper, there appeared to be little additionalincentive to purchase illicitly, given legal tobacco products could be purchased at prices in 2014 similarto prices 12 years previously.Restrictions or bans on product bundling as a form of price-related promotion (from both UK store-based and duty-free sources) would reduce the attractiveness of buying cigarettes by the carton.
OVERALL SYNTHESIS OF FINDINGS
NIHR Journals Library www.journalslibrary.nihr.ac.uk
122

26. Using ITC data, 7.6% of smokers indicated that they had a high frequency of buying from cheapsources (likely to be illicit). Frequent purchasers were less likely to use mid-price or value FM cigarettesand more likely to use RYO tobacco than premium FM cigarettes. There was no significant differencebetween frequent and non-frequent cheap (probably illicit) purchases and trading down, switching orquitting over time.Those accessing cheaper premium FM cigarettes through sources that are likely to be illicit appeared tohave less incentive to smoke cheaper, non-premium FM brands.
Inequalities (see Chapter 9)
27. Socioeconomically disadvantaged groups, women and more dependent smokers were more likely tostruggle to afford smoking as tobacco prices increased. More disadvantaged smokers, and smokers ofwhite ethnicity, were more likely to smoke cheaper tobacco products. More dependent, disadvantagedand younger smokers were more likely to roll cigarettes with less tobacco.More disadvantaged groups struggle with the price of smoking and are more likely to use cheapertobacco products. This is consistent with earlier findings that more price-conscious smokers aresocioeconomically disadvantaged.12 Removing these cheap products might draw more disadvantagedsmokers into the quitting process, especially if smoking cessation attempts are well supported.
28. In multivariable longitudinal analyses using the ITC data, overall, there were no clear indications thatdown-trading, switching or sustained quitting were more common among the more disadvantaged.Quit attempts were more common among older, partnered and more educated smokers.After taking into account dependence, products smoked, brand and product loyalty, and tax rates,there were no SES differences in quit success. This suggests that future studies should take intoaccount the tobacco product smoked. This supports finding 27, that if the availability of cheaptobacco products declined, low-SES smokers might be more likely to be drawn into quitting.
29. Among FM cigarette smokers, dependence did not significantly predict trading down or switching toRYO tobacco. This was possibly because use of value FM cigarettes and RYO tobacco (vs. premium FMcigarettes) was already significantly more prevalent among moderately (vs. low) dependent smokers(trends were in the same direction for high dependence but were not statistically significant, probablybecause of low numbers). Smokers with moderate compared with low dependence were also lesslikely to make a quit attempt, and those with higher dependence tended towards reduced quit successthan those with lower dependence. More dependent smokers were also more likely to roll lesstobacco in their RYO cigarettes.Those with higher dependence need more support in quitting. In recent years, stop smoking serviceshave decreased. The cost-effectiveness of such services has been demonstrated and ways to protectthem could include ring-fencing funding.
Implications outside the UK
Although many of the findings and recommendations outlined above will be relevant outside the UK, afew results are of particular relevance. Our findings indicate that, in any country where the TI is overshiftingtaxes and its profits are increasing, there is scope for further tax increases to help recoup the public healthcosts attributable to smoking. This would ensure that government revenues rather than industry profitsincrease. Such countries can also dismiss the standard industry argument that tax and price increases drivethe illicit tobacco trade. Given that worldwide cigarette sales are declining, yet industry profits are increasing,this is globally relevant.
Our research highlights that standardised tobacco packaging with set pack sizes and bans on price markinghas additional benefits: it reduces the industry’s ability to use pack size changes and price marking to makeits products cheaper, and undermine the intended public health benefits of tax policy.
DOI: 10.3310/phr08060 PUBLIC HEALTH RESEARCH 2020 VOL. 8 NO. 6
© Queen’s Printer and Controller of HMSO 2020. This work was produced by Partos et al. under the terms of a commissioning contract issued by the Secretary of State for Healthand Social Care. This issue may be freely reproduced for the purposes of private research and study and extracts (or indeed, the full report) may be included in professionaljournals provided that suitable acknowledgement is made and the reproduction is not associated with any form of advertising. Applications for commercial reproduction shouldbe addressed to: NIHR Journals Library, National Institute for Health Research, Evaluation, Trials and Studies Coordinating Centre, Alpha House, University of Southampton SciencePark, Southampton SO16 7NS, UK.
123

Finally, our research suggests that product shifting could be discouraged by a careful balancing of taxes onFM cigarettes and RYO tobacco. Monitoring weights of RYO cigarettes can help to ensure that RYO tobaccotaxes are appropriate.
Further research
Our findings have clearly established that the TI responds strategically to tax increases; however, we wereunfortunately unable to explore the effects of this among a younger population. An exploration of howtax and pricing changes influence smoking initiation and uptake is critical for future research, in particularto gain an understanding of the extent to which these strategic responses induce people to start smoking,as opposed to switching products or brands.
There is also a need to monitor the impact of changes in minimum pack sizes for both FM cigarettes(20 cigarettes) and RYO tobacco (> 30 g), which our findings indicate will lead to significant changes to theUK tobacco market. We believe that qualitative research will be needed to explore this issue further, buildingon other research that indicates that smokers reducing the number of cigarettes they smoke (and hencepossibly buying smaller pack sizes) are more likely to attempt to quit and succeed in quitting.225 It is alsopossible that the availability of smaller RYO tobacco pouch sizes during our study period (in the UK andAustralia) contributed to rolling smaller cigarettes (smaller ‘serving sizes’), as might the restrictions onsmoking in workplaces and entertainment venues, making smaller (quicker) RYO cigarettes more attractive.Qualitative research would help to shed light on these factors. Furthermore, an unintended consequenceof the large minimum pack size for RYO tobacco might be that smokers end up using more tobacco, andthis will also need to be monitored.
The effects of plain packaging legislation (which also eliminates price-marked packs) and the MET(introduced simultaneously) on tobacco prices will also need to be explored. Determining how the TIestablishes and communicates pricing in the standardised packaging environment, and the continuing roleof segmentation in this process, is a priority for future research. In relation to the introduction of the MET,both how it affects the availability of cheaper FM cigarettes and if there is any growth in RYO tobaccosales that are not covered by a MET (but would be by a MCT) will need to be examined.
Future studies should also explore the impact of sudden, large tax increases compared with smaller,continuous tax increases.
The increasing availability and use of e-cigarettes and other novel vaping and nicotine-containing productscan potentially influence the trends examined in this report. As we noted in Chapter 2, we think that thelikely impact of e-cigarettes on our data was low, with the e-cigarette market being less than one-twentieththe size of the tobacco market in 2015121 (the end of our study period); however, future research will needto consider the influence of new products. Specifically, how e-cigarettes affect the prevalence over time ofparticular characteristics in the population of remaining smokers and the average number of cigarettesconsumed among dual users need to be monitored. It is also possible that the availability of novel nicotineproducts is putting downwards pressure on the prices of tobacco products.
Finally, it is likely that there exist significant interactions between sociodemographics, dependence andsmoking outcomes. Given the low numbers for some of our covariates, such as younger smokers andthose with the highest levels of dependence, we did not test for any interaction effect in this study. This isan important avenue for future research.
OVERALL SYNTHESIS OF FINDINGS
NIHR Journals Library www.journalslibrary.nihr.ac.uk
124

Acknowledgements
Stakeholder Group
We are enormously grateful to the following members of our Stakeholder Group who helped to guide theproject and aided data interpretation.
Academic Project AdvisorsRobert West, Professor of Health Psychology & Director of Tobacco Studies, Department of BehaviouralScience and Health, University College London, London, UK.
Frank Chaloupka, Research Professor, Health Policy and Administration, School of Public Health, Universityof Illinois at Chicago, Chicago, IL, USA.
Other Stakeholder Group membersDeborah Arnott, Chief Executive, ASH.
Martin Dockrell, Tobacco Control Lead, Public Health England.
Matthew Alford and Dan Griffin, UKCTAS Smokers’ Panel representatives.
Fiona Andrews, Chief Executive, Smokefree South West (since disbanded due to funding cuts).
Contributions of authors
Timea R Partos (https://orcid.org/0000-0002-4049-9200) (Postdoctoral Research Worker) led the finaldraft following reviewers’ comments; led on all ITC analyses; was co-investigator for the UK arm of theITC; contributed to interpretation of the data across the project; wrote Report Supplementary Material 1and revised the full report critically for important intellectual content and approved the final version tobe published.
Rosemary Hiscock (https://orcid.org/0000-0001-9741-9083) (Research Assistant) led the writing of thefirst draft of this report; led on commercial literature review and analysis, and all Nielsen analyses; contributedto interpretation of the data across the project; and revised the full report critically for important intellectualcontent and approved the final version to be published.
Anna B Gilmore (https://orcid.org/0000-0003-0281-1248) (Professor of Public Health) led the evidencesynthesis chapter (see Chapter 10); was responsible for overseeing all analyses; contributed to interpretation of thedata across the project; and revised the full report critically for important intellectual content and approved thefinal version to be published.
J Robert Branston (https://orcid.org/0000-0002-2332-2403) (Senior Lecturer/Associate Professor inBusiness Economics) provided input on all analyses; contributed to interpretation of the data across theproject; and revised the full report critically for important intellectual content and approved the final versionto be published.
Sara Hitchman (https://orcid.org/0000-0001-6155-6916) (Lecturer in Addictions) was co-investigatorfor the UK arm of the ITC; provided input on ITC analyses; contributed to interpretation of the data acrossthe project; and revised the full report critically for important intellectual content and approved the finalversion to be published.
DOI: 10.3310/phr08060 PUBLIC HEALTH RESEARCH 2020 VOL. 8 NO. 6
© Queen’s Printer and Controller of HMSO 2020. This work was produced by Partos et al. under the terms of a commissioning contract issued by the Secretary of State for Healthand Social Care. This issue may be freely reproduced for the purposes of private research and study and extracts (or indeed, the full report) may be included in professionaljournals provided that suitable acknowledgement is made and the reproduction is not associated with any form of advertising. Applications for commercial reproduction shouldbe addressed to: NIHR Journals Library, National Institute for Health Research, Evaluation, Trials and Studies Coordinating Centre, Alpha House, University of Southampton SciencePark, Southampton SO16 7NS, UK.
125

Ann McNeill (https://orcid.org/0000-0002-6223-4000) (Professor of Tobacco Addiction) led the writingof the first draft of this report; was the primary investigator for the UK arm of the ITC; was responsible foroverseeing all analyses; contributed to interpretation of the data across the project; and revised the fullreport critically for important intellectual content and approved the final version to be published.
Publications
Partos TR, Gilmore AB, Hitchman SC, Hiscock R, Branston JR, McNeill A. Availability and use of cheaptobacco in the UK 2002–2014: Findings from the International Tobacco Control Project. Nicotine Tob Res2017;20:714–24.
Branston RJ, McNeill A, Gilmore A, Hiscock R, Partos TR. Keeping smoking affordable in higher taxenvironments via smoking thinner roll-your-own cigarettes: findings from the International TobaccoControl Four-Country Survey 2006–15. Drug Alcohol Depend 2018;193:110–16.
Hiscock R, Branston JR, McNeill A, Hitchman SC, Partos TR, Gilmore AB. Tobacco industry strategiesundermine government tax policy: evidence from commercial data. Tob Control 2018;27:488–97.
Partos TR, Branston JR, Hiscock R, Gilmore AB, McNeill A. Individualised tobacco affordability in the UK2002–2014: findings from the International Tobacco Control Policy Evaluation Project. Tob Control2019;28:s9–19.
Related publication to which the authors of this report contributedKuipers MAG, Partos T, McNeill A, Beard E, Gilmore A, Brown J. Smokers’ strategies across social gradesto minimize the cost of smoking in a period with annual tax increases: evidence from a national survey inEngland. BMJ Open 2019;9:e26320.
Data-sharing statement
Our ITC data are from the UK arm of a much larger consortium encompassing multiple countries. Theprocedure and forms for requesting the data are available on the ITC website (URL: www.itcproject.org/forms).
Nielsen data are commercial and therefore not available for analysis.
All queries should be submitted to the corresponding author.
ACKNOWLEDGEMENTS
NIHR Journals Library www.journalslibrary.nihr.ac.uk
126

References
1. Royal College of Physicians. Hiding in Plain Sight: Treating Tobacco Dependency in the NHS.A Report by the Tobacco Advisory Group of the Royal College of Physicians. London: RoyalCollege of Physicians; 2018.
2. Office for National Statistics (ONS). Adult Smoking Habits in Great Britain: 2016. Newport:ONS; 2017.
3. Department of Health and Social Care. Towards a Smokefree Generation: A Tobacco Control Planfor England. London: Department of Health and Social Care; 2017.
4. NHS Digital. Statistics on Smoking – England 2018. Leeds: NHS Digital; 2018.
5. Joossens L, Raw M. The Tobacco Control Scale: a new scale to measure country activity.Tob Control 2006;15:247–53. https://doi.org/10.1136/tc.2005.015347
6. Levy DT, Boyle RG, Abrams DB. The role of public policies in reducing smoking: the MinnesotaSimSmoke tobacco policy model. Am J Prev Med 2012;43(Suppl. 5):179–86. https://doi.org/10.1016/j.amepre.2012.07.037
7. Nagelhout GE, Levy DT, Blackman K, Currie L, Clancy L, Willemsen MC. The effect of tobaccocontrol policies on smoking prevalence and smoking-attributable deaths. Findings from theNetherlands SimSmoke Tobacco Control Policy Simulation Model. Addiction 2012;107:407–16.https://doi.org/10.1111/j.1360-0443.2011.03642.x
8. Wilson LM, Avila Tang E, Chander G, Hutton HE, Odelola OA, Elf JL, et al. Impact of tobaccocontrol interventions on smoking initiation, cessation, and prevalence: a systematic review.J Environ Public Health 2012;2012:961724. https://doi.org/10.1155/2012/961724
9. Levy DT, Ellis JA, Mays D, Huang AT. Smoking-related deaths averted due to three years of policyprogress. Bull World Health Organ 2013;91:509–18. https://doi.org/10.2471/BLT.12.113878
10. Ekpu VU, Brown AK. The economic impact of smoking and of reducing smoking prevalence:review of evidence. Tob Use Insights 2015;8:1–35. https://doi.org/10.4137/TUI.S15628
11. Farley SM, Coady MH, Mandel-Ricci J, Waddell EN, Chan C, Kilgore EA, Kansagra SM. Publicopinions on tax and retail-based tobacco control strategies. Tob Control 2015;24:e10–13.https://doi.org/10.1136/tobaccocontrol-2013-051272
12. Gilmore AB, Tavakoly B, Hiscock R, Taylor G. Smoking patterns in Great Britain: the rise of cheapcigarette brands and roll your own (RYO) tobacco. J Public Health 2015;37:78–88. https://doi.org/10.1093/pubmed/fdu048
13. Mader EM, Lapin B, Cameron BJ, Carr TA, Morley CP. Update on performance in tobacco control:a longitudinal analysis of the impact of tobacco control policy and the US adult smoking rate,2011–2013. J Public Health Manag Pract 2016;22:E29–35. https://doi.org/10.1097/PHH.0000000000000358
14. Amato MS, Boyle RG, Brock B. Higher price, fewer packs: evaluating a tobacco tax increase withcigarette sales data. Am J Public Health 2015;105:e5–8. https://doi.org/10.2105/AJPH.2014.302438
15. MacLean JC, Kessler AS, Kenkel DS. Cigarette taxes and older adult smoking: evidence from theHealth and Retirement Study. Health Econ 2016;25:424–38. https://doi.org/10.1002/hec.3161
DOI: 10.3310/phr08060 PUBLIC HEALTH RESEARCH 2020 VOL. 8 NO. 6
© Queen’s Printer and Controller of HMSO 2020. This work was produced by Partos et al. under the terms of a commissioning contract issued by the Secretary of State for Healthand Social Care. This issue may be freely reproduced for the purposes of private research and study and extracts (or indeed, the full report) may be included in professionaljournals provided that suitable acknowledgement is made and the reproduction is not associated with any form of advertising. Applications for commercial reproduction shouldbe addressed to: NIHR Journals Library, National Institute for Health Research, Evaluation, Trials and Studies Coordinating Centre, Alpha House, University of Southampton SciencePark, Southampton SO16 7NS, UK.
127

16. van Hasselt M, Kruger J, Han B, Craballo RS, Penne MA, Loomis B, et al. The relation betweentobacco taxes and youth and young adult smoking: what happened following the 2009 USfederal tax increase on cigarettes? Addict Behav 2009;45:104–9. https://doi.org/10.1016/j.addbeh.2015.01.023
17. Lillard DR, Molloy E, Sfekas A. Smoking initiation and the iron law of demand. J Health Econ2013;32:114–27. https://doi.org/10.1016/j.jhealeco.2012.08.006
18. Bader P, Boisclair D, Ferrence R. Effects of tobacco taxation and pricing on smoking behavior inhigh risk populations: a knowledge synthesis. Int J Environ Res Public Health 2011;8:4118–39.https://doi.org/10.3390/ijerph8114118
19. Lorenc T, Petticrew M, Welch V, Tugwell P. What types of interventions generate inequalities?Evidence from systematic reviews. J Epidemiol Community Health 2013;67:190–3. https://doi.org/10.1136/jech-2012-201257
20. Brown T, Platt S, Amos A. Equity impact of population-level interventions and policies to reducesmoking in adults: a systematic review. Drug Alcohol Depend 2014;138:7–16. https://doi.org/10.1016/j.drugalcdep.2014.03.001
21. Hill S, Amos A, Clifford D, Platt S. Impact of tobacco control interventions on socioeconomicinequalities in smoking: review of the evidence. Tob Control 2014;23:e89–97. https://doi.org/10.1136/tobaccocontrol-2013-051110
22. World Health Organization (WHO). The Economic and Health Benefits of Tobacco Taxation.Geneva: WHO; 2016. URL: www.who.int/tobacco/publications/economics/post2015tobacco/en/(accessed 8 August 2016).
23. Joosens L, Raw M. The Tobacco Control Scale 2013 in Europe. Brussels: Association of EuropeanCancer Leagues; 2014.
24. Shang C, Chaloupka FJ, Zahra N, Fong GT. The distribution of cigarette prices under differenttax structures: findings from the International Tobacco Control Policy Evaluation (ITC) Project.Tob Control 2014;23(Suppl. 1):i23–9. https://doi.org/10.1136/tobaccocontrol-2013-050966
25. Bingham P. Note from Paul Bingham to DG Heywood Enclosing Minutes of 1992 Meeting. 1988.URL: www.industrydocumentslibrary.ucsf.edu/tobacco/docs/rxvv0194 (accessed 22 August 2011).
26. Anon. Brown and Williamson Tobacco Corporation Strategic Review. 1997. URL: www.industrydocumentslibrary.ucsf.edu/tobacco/docs/nlhv0135 (accessed 22 August 2011).
27. British American Tobacco. Southern Africa Area 1998 – 2000 Plan. 2000. URL: www.industrydocumentslibrary.ucsf.edu/tobacco/docs/pscd0211 (accessed 22 August 2011).
28. Chaloupka FJ, Cummings KM, Morley CP, Horan JK. Tax, price and cigarette smoking: evidencefrom the tobacco documents and implications for tobacco company marketing strategies.Tob Control 2002;11(Suppl. 1):I62–72. https://doi.org/10.1136/tc.11.suppl_1.i62
29. Moodie C, Hastings G. Tobacco packaging as promotion. Tob Control 2010;19:168–70.https://doi.org/10.1136/tc.2009.033449
30. Spanopoulos D, Ratschen E, McNeill A, Britton J. Retail price and point of sale display of tobaccoin the UK: a descriptive study of small retailers. PLOS ONE 2012;7:e29871. https://doi.org/10.1371/journal.pone.0029871
31. Branston JR, Gilmore AB. The Extreme Profitability of the UK Tobacco Market and the Rationalefor a New Tobacco Levy. Bath: University of Bath; 2015. URL: https://purehost.bath.ac.uk/ws/portalfiles/portal/128455728/The_extreme_profitability_of_the_UK_tobacco_market_and_levy_V4.6_final.pdf (accessed 18 March 2019).
REFERENCES
NIHR Journals Library www.journalslibrary.nihr.ac.uk
128

32. European Commission. Final Report – Pricing Policies and Control of Tobacco in Europe (PPACTE).2013. URL: https://cordis.europa.eu/project/rcn/90962/reporting/en (accessed 16 September 2019).
33. Smith K, Gilmore AB, Chaloupka FJ, Delipalia S. Chapter 3: Tobacco Industry Pricing, Price-RelatedMarketing and Lobbying Strategies. In IARC Handbooks of Cancer Prevention: Tobacco ControlVolume 14 – Effectiveness of Tax and Price Policies for Control of Tobacco. Lyon: InternationalAgency for Research on Cancer; 2011. pp. 31–90.
34. Gilmore AB, Tavakoly B, Taylor G, Reed H. Understanding tobacco industry pricing strategy andwhether it undermines tobacco tax policy: the example of the UK cigarette market. Addiction2013;108:1317–26. https://doi.org/10.1111/add.12159
35. Gallus S, Lugo A, La Vecchia C, Boffetta P, Chaloupka FJ, Colombo P, et al. Pricing Policies AndControl of Tobacco in Europe (PPACTE) project: cross-national comparison of smoking prevalencein 18 European countries. Eur J Cancer Prev 2014;23:177–85. https://doi.org/10.1097/CEJ.0000000000000009
36. Howell F. The Irish tobacco industry position on price increases on tobacco products. Tob Control2012;21:514–16. https://doi.org/10.1136/tobaccocontrol-2011-050146
37. Lee IC, Lin HC, Chiang TL. Area deprivation, socioeconomic status, and smoking behavior amongmale adults in Taiwan. Taiwan J Public Health 2003;22:1–6.
38. López-Nicolás Á, Cobacho MB, Fernández E. The Spanish tobacco tax loopholes and theirconsequences. Tob Control 2013;22:e21–4. https://doi.org/10.1136/tobaccocontrol-2011-050344
39. Ajmal A, U VI. Tobacco tax and the illicit trade in tobacco products in New Zealand. Aust N Z JPublic Health 2015;39:116–20. https://doi.org/10.1111/1753-6405.12389
40. Choi K, Hennrikus D, Forster J, St Claire AW. Use of price-minimizing strategies by smokers andtheir effects on subsequent smoking behaviors. Nicotine Tob Res 2012;14:864–70. https://doi.org/10.1093/ntr/ntr300
41. DeCicca P, Kenkel D, Liu F. Who pays cigarette taxes? The impact of consumer price search.The Rev Econ Stat 2013;95:516–29. https://doi.org/10.1162/REST_a_00303
42. Rothwell L, Britton J, Bogdanovica I. The relation between cigarette price and hand-rollingtobacco consumption in the UK: an ecological study. BMJ Open 2015;5:e007697. https://doi.org/10.1136/bmjopen-2015-007697
43. Tait P, Rutherford P, Saunders C. Do consumers of manufactured cigarettes respond differentlyto price changes compared with their roll-your-own counterparts? Evidence from New Zealand.Tob Control 2015;24:285–9. https://doi.org/10.1136/tobaccocontrol-2013-051010
44. Australian Institute of Health and Welfare. Tobacco Smoking 2017. Canberra, ACT: AustralianInstitute of Health and Welfare; 2017. URL: www.aihw.gov.au/reports/risk-factors/risk-factors-to-health/contents/tobacco-smoking (accessed 21 October 2019).
45. GOV.UK. Bringing Goods into the UK. 2018. URL: www.gov.uk/duty-free-goods/arrivals-from-outside-the-eu (accessed 18 March 2019).
46. Nagelhout GE, van den Putte B, Allwright S, Mons U, McNeill A, Guignard R, et al.Socioeconomic and country variations in cross-border cigarette purchasing as tobacco taxavoidance strategy. Findings from the ITC Europe Surveys. Tob Control 2014;23(Suppl. 1):i30–8.https://doi.org/10.1136/tobaccocontrol-2012-050838
47. Gilmore AB, Rowell A, Gallus S, Lugo A, Joossens L, Sims M. Towards a greater understanding ofthe illicit tobacco trade in Europe: a review of the PMI funded ‘Project Star’ report. Tob Control2014;23:e51–61. https://doi.org/10.1136/tobaccocontrol-2013-051240
DOI: 10.3310/phr08060 PUBLIC HEALTH RESEARCH 2020 VOL. 8 NO. 6
© Queen’s Printer and Controller of HMSO 2020. This work was produced by Partos et al. under the terms of a commissioning contract issued by the Secretary of State for Healthand Social Care. This issue may be freely reproduced for the purposes of private research and study and extracts (or indeed, the full report) may be included in professionaljournals provided that suitable acknowledgement is made and the reproduction is not associated with any form of advertising. Applications for commercial reproduction shouldbe addressed to: NIHR Journals Library, National Institute for Health Research, Evaluation, Trials and Studies Coordinating Centre, Alpha House, University of Southampton SciencePark, Southampton SO16 7NS, UK.
129

48. Brown AK, Nagelhout GE, van den Putte B, Willemsen MC, Mons U, Guignard R, Thompson ME.Trends and socioeconomic differences in roll-your-own tobacco use: findings from the ITC EuropeSurveys. Tob Control 2015;24(Suppl. 3):iii11–iii16. https://doi.org/10.1136/tobaccocontrol-2014-051986
49. Siggens G, Murray R. North East Illicit Tobacco Survey 2013. 2013. URL: www.illicit-tobacco.co.uk/wp-content/uploads/2014/03/NE_Illicit_Tobacco_Report_key_findings.pdf (accessed 18 March 2019).
50. Siggens G, Murray R. South West Illicit Tobacco Study, Regional Assessment & CampaignEvaluation 2013. 2013.
51. Stead M, Jones L, Docherty G, Gough B, Antoniak M, McNeill A. ‘No-one actually goes to ashop and buys them do they?’: attitudes and behaviours regarding illicit tobacco in a multiplydisadvantaged community in England. Addiction 2013;108:2212–19. https://doi.org/10.1111/add.12332
52. Joossens L, Lugo A, La Vecchia C, Gilmore AB, Clancy L, Gallus S. Illicit cigarettes and hand-rolledtobacco in 18 European countries: a cross-sectional survey. Tob Control 2014;23:e17–23.https://doi.org/10.1136/tobaccocontrol-2012-050644
53. Guindon GE, Driezen P, Chaloupka FJ, Fong GT. Cigarette tax avoidance and evasion:findings from the International Tobacco Control Policy Evaluation (ITC) Project. Tob Control2014;23(Suppl. 1):i13–22. https://doi.org/10.1136/tobaccocontrol-2013-051074
54. Hyland A, Laux FL, Higbee C, Hastings G, Ross H, Chaloupka FJ, et al. Cigarette purchase patternsin four countries and the relationship with cessation: findings from the International TobaccoControl (ITC) Four Country Survey. Tob Control 2006;15(Suppl. 3):iii59–64. https://doi.org/10.1136/tc.2005.012203
55. Li Q, Hyland A, Fong GT, Jiang Y, Elton-Marshall T. Use of less expensive cigarettes in six citiesin China: findings from the International Tobacco Control (ITC) China Survey. Tob Control2010;19(Suppl. 2):i63–8. https://doi.org/10.1136/tc.2010.035782
56. Licht AS, Hyland AJ, O’Connor RJ, Chaloupka FJ, Borland R, Fong GT, et al. How do priceminimizing behaviors impact smoking cessation? Findings from the International Tobacco Control(ITC) Four Country Survey. Int J Environ Res Public Health 2011;8:1671–91. https://doi.org/10.3390/ijerph8051671
57. Licht AS, Hyland AJ, O’Connor RJ, Chaloupka FJ, Borland R, Fong GT, et al. Socio-economicvariation in price minimizing behaviors: findings from the International Tobacco Control (ITC)Four Country Survey. Int J Environ Res Public Health 2011;8:234–52. https://doi.org/10.3390/ijerph8010234
58. Ross H, Blecher E, Yan L, Cummings KM. Predictors of what smokers say they will do in responseto future price increases. Findings from the International Tobacco Control (ITC) Four CountrySurvey. Nicotine Tob Res 2011;13:419–25. https://doi.org/10.1093/ntr/ntr015
59. Ross H, Blecher E, Yan L, Hyland A. Do cigarette prices motivate smokers to quit? New evidencefrom the ITC survey. Addiction 2011;106:609–19. https://doi.org/10.1111/j.1360-0443.2010.03192.x
60. Cummings KM, Hyland A, Lewit E, Shopland D. Use of discount cigarettes by smokers in20 communities in the United States, 1988–1993. Tob Control 1997;6(Suppl. 2):25–30.https://doi.org/10.1136/tc.6.suppl_2.S25
61. Cowie GA, Swift E, Borland R, Chaloupka FJ, Fong GT. Cigarette brand loyalty in Australia:findings from the ITC Four Country Survey. Tob Control 2014;23(Suppl. 1):i73–9. https://doi.org/10.1136/tobaccocontrol-2013-051071
REFERENCES
NIHR Journals Library www.journalslibrary.nihr.ac.uk
130

62. Betzner A, Boyle RG, St Claire AW. Price-minimizing behaviors in a cohort of smokers beforeand after a cigarette tax increase. Int J Environ Res Public Health 2016;13:E608. https://doi.org/10.3390/ijerph13060608
63. Salloum RG, Goma F, Chelwa G, Cheng X, Zulu R, Kaai SC, et al. Cigarette price and otherfactors associated with brand choice and brand loyalty in Zambia: findings from the ITC ZambiaSurvey. Tob Control 2015;24(Suppl. 3):iii33–iii40. https://doi.org/10.1136/tobaccocontrol-2014-051878
64. Scollo M. The Big Mac Index of cigarette affordability. Tob Control 1996;5:69. https://doi.org/10.1136/tc.5.1.69a
65. Guindon GE, Tobin S, Yach D. Trends and affordability of cigarette prices: ample room for taxincreases and related health gains. Tob Control 2002;11:35–43. https://doi.org/10.1136/tc.11.1.35
66. Blecher EH, van Walbeek CP. An international analysis of cigarette affordability. Tob Control2004;13:339–46. https://doi.org/10.1136/tc.2003.006726
67. Kan MY. Investigating cigarette affordability in 60 cities using the cigarette price–daily incomeratio. Tob Control 2007;16:429–32. https://doi.org/10.1136/tc.2007.020487
68. Blecher EH, van Walbeek CP. Cigarette affordability trends: an update and some methodologicalcomments. Tob Control 2009;18:167–75. https://doi.org/10.1136/tc.2008.026682
69. Bogdanovica I, Murray R, McNeill A, Britton J. Cigarette price, affordability and smokingprevalence in the European Union. Addiction 2012;107:188–96. https://doi.org/10.1111/j.1360-0443.2011.03588.x
70. Blecher E. Targeting the affordability of cigarettes: a new benchmark for taxation policy inlow-income and-middle-income countries. Tob Control 2010;19:325–30. https://doi.org/10.1136/tc.2009.030155
71. Gilmore AB, McKee M. Moving East: how the transnational tobacco industry gained entry to theemerging markets of the former Soviet Union-part I: establishing cigarette imports. Tob Control2004;13:143–50. https://doi.org/10.1136/tc.2003.005108
72. Joossens L, Raw M. From cigarette smuggling to illicit tobacco trade. Tob Control 2012;21:230–4.https://doi.org/10.1136/tobaccocontrol-2011-050205
73. Skafida V, Silver KE, Rechel BP, Gilmore AB. Change in tobacco excise policy in Bulgaria: the roleof tobacco industry lobbying and smuggling. Tob Control 2014;23:e75–84. https://doi.org/10.1136/tobaccocontrol-2012-050600
74. Abrams F, Rowell A. Britain is centre of European smuggling racket: export-for-import howbillions of smokes blow back to UK. Independent on Sunday, 9 December 2001.
75. Holland J, Jovanovic B, Dojcinovic S. Big Trouble at Big Tobacco: Organized Crime and CorruptionReporting Project (OCCRP). 2011. URL: https://reportingproject.net/troubles_with_big_tobacco(accessed 18 March 2019).
76. McKee M, Gilmore AB. European watchdog is failing to hold tobacco industry to account oversmuggling. BMJ 2015;351:h6973. https://doi.org/10.1136/bmj.h6973
77. National Audit Office. Progress in Tackling Tobacco Smuggling. 2013. URL: www.nao.org.uk/report/progress-in-tackling-tobacco-smuggling/ (accessed 21 October 2019).
78. Lavrov V. Ukraine’s ‘Lost’ Cigarettes Flood Europe. International Consortium of InvestigativeJournalists; 2009. URL: www.reportingproject.net/underground/index.php%3Foption%3Dcom_content%26view%3Darticle%26id%3D8:ukraineslost-cigarettes-flood-europe%26catid%3D3:stories%26Itemid%3D21 (accessed 21 October 2019).
DOI: 10.3310/phr08060 PUBLIC HEALTH RESEARCH 2020 VOL. 8 NO. 6
© Queen’s Printer and Controller of HMSO 2020. This work was produced by Partos et al. under the terms of a commissioning contract issued by the Secretary of State for Healthand Social Care. This issue may be freely reproduced for the purposes of private research and study and extracts (or indeed, the full report) may be included in professionaljournals provided that suitable acknowledgement is made and the reproduction is not associated with any form of advertising. Applications for commercial reproduction shouldbe addressed to: NIHR Journals Library, National Institute for Health Research, Evaluation, Trials and Studies Coordinating Centre, Alpha House, University of Southampton SciencePark, Southampton SO16 7NS, UK.
131

79. Gilmore AB, Reed H. The truth about cigarette price increases in Britain. Tob Control 2014;23:e15–6.https://doi.org/10.1136/tobaccocontrol-2013-051048
80. Fooks GJ, Peeters S, Evans-Reeves K. Illicit trade, tobacco industry-funded studies and policyinfluence in the EU and UK. Tob Control 2014;23:81–3. https://doi.org/10.1136/tobaccocontrol-2012-050788
81. Rowell A, Evans-Reeves K, Gilmore AB. Tobacco industry manipulation of data on and presscoverage of the illicit tobacco trade in the UK. Tob Control 2014;23:e35–43. https://doi.org/10.1136/tobaccocontrol-2013-051397
82. Joossens L, Raw M. Progress in combating cigarette smuggling: controlling the supply chain.Tob Control 2008;17:399–404. https://doi.org/10.1136/tc.2008.026567
83. Her Majesty’s Revenue and Customs (HMRC). Measuring Tax Gaps 2018 Edition. Tax GapEstimates for 2016–17. London: HMRC; 2018.
84. HM Customs and Excise, HM Treasury. Tackling Tobacco Smuggling. 2000. URL: http://tobacco.cleartheair.org.hk/wp-content/uploads/2010/02/433.pdf (accessed 23 January 2017).
85. McNeill A, Iringe-Koko B, Bains M, Bauld L, Siggens G, Russell A. Countering the demand for,and supply of, illicit tobacco: an assessment of the ‘North of England Tackling Illicit Tobacco forBetter Health’ Programme. Tob Control 2014;23:e44–50. https://doi.org/10.1136/tobaccocontrol-2013-050957
86. Chaloupka FJ, Kostova D, Shang C. Cigarette excise tax structure and cigarette prices: evidencefrom the global adult tobacco survey and the U.S. National Adult Tobacco Survey. Nicotine TobRes 2014;16(Suppl. 1):3–9. https://doi.org/10.1093/ntr/ntt121
87. Nargis N, Fong GT, Chaloupka FJ, Li Q. The choice of discount brand cigarettes: a comparativeanalysis of International Tobacco Control surveys in Canada and the USA (2002–2005).Tob Control 2014;23(Suppl. 1):i86–96. https://doi.org/10.1136/tobaccocontrol-2012-050851
88. Chaloupka FJ, Straif K, Leon ME, Working Group, International Agency for Research on Cancer.Effectiveness of tax and price policies in tobacco control. Tob Control 2011;20:235–8.https://doi.org/10.1136/tc.2010.039982
89. Action on Smoking and Health. Analysis of Tobacco Tax Increases in the United Kingdom. 2017.URL: http://ash.org.uk/files/documents/ASH_976.pdf (accessed 8 August 2016).
90. Office for National Statistics (ONS). Consumer Price Indices, December 2012, 2013. Newport:ONS; 2013.
91. HM Treasury. Budget 2009: Building Britain’s Future. 2009. URL: www.gov.uk/government/publications/budget-2009-building-britains-future (accessed 21 October 2019).
92. HM Treasury. Budget 2011. 2011. URL: www.gov.uk/government/news/budget-2011 (accessed21 October 2019).
93. HM Revenue and Customs. Overview of Tax Legislation and Rates. London: HM Revenue andCustoms; 2011.
94. HM Treasury. Budget 2012. 2012. URL: www.gov.uk/government/publications/budget-2012(accessed 21 October 2019).
95. HM Treasury. Budget 2013: Documents. 2013. URL: www.gov.uk/government/publications/budget-2013-documents (accessed 21 October 2019).
96. HM Treasury. Budget 2014: Documents. 2014. URL: www.gov.uk/government/publications/budget-2014-documents (accessed 21 October 2019).
REFERENCES
NIHR Journals Library www.journalslibrary.nihr.ac.uk
132

97. HM Treasury. Budget 2015: Documents. 2015. URL: www.gov.uk/government/publications/budget-2015-documents (accessed 21 October 2019).
98. Gauke D. Budget 2016. 2016. URL: www.gov.uk/government/uploads/system/uploads/attachment_data/file/508193/HMT_Budget_2016_Web_Accessible.pdf (accessed 22 September 2019).
99. Her Majesty’s Revenue and Customs (HMRC). Tobacco Bulletin. London: HMRC; 2016.
100. Action on Smoking and Health. 2016 Budget Submission to the Chancellor of the Exchequer.2016. URL: https://ash.org.uk/information-and-resources/reports-submissions/submissions/ash-tobacco-tax-in-the-2016-budget/ (accessed 18 March 2019).
101. Office for National Statistics (ONS). Users and Uses of Consumer Price Inflation Statistics 2016.Newport: ONS; 2016.
102. Champkin J. RPI Versus CPI: What’s the Difference? Why Does it Matter? Will it Make You Pooreror Richer? 2013. URL: www.statslife.org.uk/economics-and-business/33-rpi-versus-cpi-what-s-the-difference-why-does-it-matter-will-it-make-you-poorer-or-richer (accessed 28 August 2019).
103. Lopez-Nicolas A, Stoklosa M. Tax harmonisation and tobacco product prices in the European Union,2004–2015. Tob Control 2018;23:e44–e50. https://doi.org/10.1136/tobaccocontrol-2018-054342
104. European Commission. Excise Duties on Tobacco. 2018. URL: https://ec.europa.eu/taxation_customs/business/excise-duties-alcohol-tobacco-energy/excise-duties-tobacco_en (accessed23 January 2017).
105. Smith KE, Savell E, Gilmore AB. What is known about tobacco industry efforts to influencetobacco tax? A systematic review of empirical studies. Tob Control 2013;22:144–53. https://doi.org/10.1136/tobaccocontrol-2011-050098
106. Nielsen. Tobacco Samples. Oxford: Nielsen; 2017.
107. Nielsen. Retail Measurement Service Design Summary. Oxford: Nielsen; 2017.
108. Nielsen. Rugby World Cup Fails to Halt Falling Supermarket Sales 2015. 2015. URL: www.nielsen.com/uk/en/press-room/2015/rugby-world-cup-fails-to-halt-falling-supermarket-sales.html(accessed 21 March 2019).
109. Brown R. Grocery Data Explained: How do Kantar Worldpanel, Nielsen, and IRI Work? The Grocer;2018. URL: www.thegrocer.co.uk/buying-and-supplying/categories/grocery-data-explained-how-do-kantar-worldpanel-nielsen-and-iri-work/573939.article (accessed 21 March 2019).
110. Institute of Grocery Distribution. UK Grocer Retailing 2015. Institute of Grocery Distribution;2015. URL: www.igd.com/research/retail/article/t/uk-grocery-retailing/i/15513(accessed 16 September 2019).
111. Lane KK. Designing and implementing brand architecture strategies. J Brand Manage2014;21:702–15. https://doi.org/10.1057/bm.2014.38
112. Dewhirst T. Into the black: Marlboro brand architecture, packaging and marketingcommunication of relative harm. Tob Control 2018;27:240–2. https://doi.org/10.1136/tobaccocontrol-2016-053547
113. Quinn C, Lewis S, Edwards R, McNeill A. Economic evaluation of the removal of tobaccopromotional displays in Ireland. Tob Control 2011;20:151–5. https://doi.org/10.1136/tc.2010.039602
114. Harding M, Leibtag E, Lovenheim MF. The heterogeneous geographic and socioeconomicincidence of cigarette taxes: evidence from Nielsen Homescan Data. Am Econ J Econ Policy2012;4:169–98. https://doi.org/10.1257/pol.4.4.169
DOI: 10.3310/phr08060 PUBLIC HEALTH RESEARCH 2020 VOL. 8 NO. 6
© Queen’s Printer and Controller of HMSO 2020. This work was produced by Partos et al. under the terms of a commissioning contract issued by the Secretary of State for Healthand Social Care. This issue may be freely reproduced for the purposes of private research and study and extracts (or indeed, the full report) may be included in professionaljournals provided that suitable acknowledgement is made and the reproduction is not associated with any form of advertising. Applications for commercial reproduction shouldbe addressed to: NIHR Journals Library, National Institute for Health Research, Evaluation, Trials and Studies Coordinating Centre, Alpha House, University of Southampton SciencePark, Southampton SO16 7NS, UK.
133

115. Tynan MA, Ribisl KM, Loomis BR. Impact of cigarette minimum price laws on the retail price ofcigarettes in the USA. Tob Control 2013;22:e78–85. https://doi.org/10.1136/tobaccocontrol-2012-050554
116. Hall MG, Williams RS, Gammon DG, Ribisl KM. Internet cigarette vendors make tax-free claimsand sell cigarettes cheaper than retail outlets. Tob Control 2016;25:616–18. https://doi.org/10.1136/tobaccocontrol-2015-052359
117. Reid G, Robinson M, Mahal D, Arnot J. The Validity and Reliability of Retail Sales Data forMonitoring Cigarette Consumption in Scotland. Edinburgh: NHS Health Scotland; 2015.
118. Partos TR, Gilmore AB, Hitchman SC, Hiscock R, Branston JR, McNeill A. Availability and use ofcheap tobacco in the United Kingdom 2002–2014: Findings from the International TobaccoControl Project. Nicotine Tob Res 2018;20:714–24. https://doi.org/10.1093/ntr/ntx108
119. mySupermarket. Swan Extra Slim Filter Tips. 2017. URL: www.mysupermarket.co.uk/asda-compare-prices/Tobacconist/Swan_Extra_Slim_Filter_Tips_120.html (accessed 2 February 2017).
120. mySupermarket. Rizla Green Cigarette Papers. 2017. URL: www.mysupermarket.co.uk/asda-compare-prices/Tobacconist/Rizla_Green_Cigarette_Papers_50.html (accessed 2 February 2017).
121. CityA.M. The Global E-Cigarette Market is Set to be Worth $32bn by 2021, and the UK MarketWill Grow to $5.67bn. 2016. URL: www.cityam.com/255646/global-e-cigarette-market-set-worth-32bn-2021-and-uk-market (accessed 10 August 2017).
122. Branston JR, Gilmore AB. The case for Ofsmoke: the potential for price cap regulation of tobaccoto raise £500 million per year in the UK. Tob Control 2014;23:45–50. https://doi.org/10.1136/tobaccocontrol-2011-050385
123. Fong GT, Cummings KM, Borland R, Hastings G, Hyland A, Giovino GA, et al. The conceptualframework of the International Tobacco Control (ITC) Policy Evaluation Project. Tob Control2006;15(Suppl. 3):iii3–11. https://doi.org/10.1136/tc.2005.015438
124. Thompson ME, Fong GT, Hammond D, Boudreau C, Driezen P, Hyland A, et al. Methods of theInternational Tobacco Control (ITC) Four Country Survey. Tob Control 2006;15(Suppl. 3):iii12–8.https://doi.org/10.1136/tc.2005.013870
125. Hagenaars AJM, de Vos K, Zaidi MA. Poverty Statistics in the Late 1980s: Research Based onMicro-Data: Luxembourg: Office for Official Publications of the European Communities; 1994.
126. Office for National Statistics. Consumer Price Inflation, UK: June 2015. 2015. URL: www.ons.gov.uk/ons/rel/cpi/consumer-price-indices/june-2015/index.html (accessed 23 January 2017).
127. Heatherton TF, Kozlowski LT, Frecker RC, Rickert W, Robinson J. Measuring the heaviness ofsmoking: using self-reported time to the first cigarette of the day and number of cigarettessmoked per day. Br J Addict 1989;84:791–9. https://doi.org/10.1111/j.1360-0443.1989.tb03059.x
128. European Commission. Excise Duty Tables (REF 1.015, August 2002; REF 1.017, September 2003;REF 1.019, May 2004; REF 1.021, July 2005; REF 1.023, July 2006; REF 1.025, July 2007; REF 1.027,July 2008; REF 1.029 rev.1, July 2009; REF 1031 rev.1, July 2010; REF 1033 rev.3, July 2011;REF 1035 REV 1, July 2012; REF 1038 rev1, July 2013; REF 1041, July 2014). URL: https://circabc.europa.eu/w/browse/e42fab5d-cf41-4580-a9d0-2d40fa66dcc1 (accessed 8 June 2017).
129. Office for National Statistics. Gross Domestic Product (Average) Per Head, at Current MarketPrices: SA. 2017. URL: www.ons.gov.uk/economy/grossdomesticproductgdp/timeseries/ihxt/pn2(accessed 8 June 2017).
130. Rabe-Hesketh S, Skrondal A. Multilevel and Longitudinal Modeling Using Stata (Volumes I and II).3rd edn. College Station, TX: Stata Press; 2012.
REFERENCES
NIHR Journals Library www.journalslibrary.nihr.ac.uk
134

131. O’Keefe DJ. Colloquy: Should familywise alpha be adjusted?: against familywise alphaadjustment. Hum Commun Res 2003;29:431–47. https://doi.org/https://doi.org/10.1111/j.1468-2958.2003.tb00846.x
132. Euromonitor International Ltd. EU Plans Higher Cigarette Prices to Curb Smoking. London:Euromonitor International Ltd; 2008. URL: https://go.euromonitor.com/passport.html (accessed16 September 2019).
133. Hayward J. Downtrading smokers targeted by government. Retail Newsagent, 1 April 2011, p. 4.
134. Staff writer. UK rollout for Amber Leaf 3 in 1. Retail Newsagent, 25 October 2013, p. 10.
135. Staff writer. No future? Tobacco Journal International 2011;2/3:23.
136. Staff writer. Pricing remains a tricky equation. Tobacco Journal International (online). 2008.URL: www.tobaccojournal.com/Pricing_remains_a_tricky_equation.48883.0.html (accessed16 September 2019).
137. Staff writer. Benson & Hedges rolling tobacco. Talking Retail (Online). 2010. URL: www.talkingretail.com/products-news/tobacco/benson-a-hedges-rolling-tobacco-22-01-2010/(accessed 16 September 2019).
138. Wood J. A window of opportunity. Wholesale News, July 2011, pp. 27–32.
139. Whitlock K. Rolling rocks! Wholesale News, July 2013, p. 42.
140. Scottish Grocer. Tobacco: Still Searching for Good Value. 2014. URL: www.scottishgrocer.co.uk/2014/06/still-searching-for-good-value (accessed 19 March 2019).
141. Staff writer. Keeping retailers in the picture. Wholesale News (Online), 20 July 2009.URL: www.fwd.co.uk/wholesale-news/ (accessed March 2015).
142. Hegarty R. Tobacco going up in smoke. The Grocer (Online), 16 February 2013. URL: www.thegrocer.co.uk/tobacco/tobacco-going-upin-smoke/236545.article (accessed 16 September 2019).
143. Staff writer. Imperial tobacco gives brands a summer makeover. Talking Retail (Online),24th July 2008. URL: www.talkingretail.com/products-news/tobacco/imperial-tobacco-gives-brands-a-summer-makeover-24-07-2008/. (accessed 16 September 2019).
144. Gockelen-Kozlowski T. Innovators on innovation. Retail Newsagent, 26 July 2013. p. 30.
145. Cooper A, Gallagher G. Imperial Tobacco. What Consumers Want: a Portfolio Aligned withConsumer Trends. Presentation to the Consumer Analyst Group of Europe (CAGE) Conference,London, 29 March 2011. URL: www.imperialbrandsplc.com/content/dam/imperial-brands/corporate/investors/presentations/conferences/CAGE%20Conference_Mar%202011_Script.pdf.downloadasset.pdf (accessed 30 September 2019).
146. Wouda Kuipers T. Imperial Tobacco. JPS: Driving Growth Through Total Tobacco. Investor DayPresentations, 26 February 2013. URL: www.imperialbrandsplc.com/content/dam/imperial-brands/corporate/investors/presentations/investor-day/2013/Investor%20Day_4_JPS_Feb%202013_Script.pdf.downloadasset.pdf (accessed 30 September 2019).
147. Imperial Tobacco. UK cigarette sector trends [graph]. Imperial Tobacco Group (IMT) half yearlyresults [slides], Half Yearly Results Presentation, 12 May 2009.
148. Imperial Tobacco Group plc. 2013 Annual Report and Accounts. URL: www.imperialbrandsplc.com/content/dam/imperial-brands/corporate/investors/annual-report-and-accounts/annual_report_2013.pdf.downloadasset.pdf (accessed 21 October 2019).
149. Staff writer. Tobacco: NPD fails to stub out drift to cut price cigarettes. The Grocer (Online),17 December 2011. URL: www.thegrocer.co.uk/tobacco/tobacco-npd-fails-to-stub-out-drift-to-cut-price-cigarettes/224384.article (accessed 16 September 2019).
DOI: 10.3310/phr08060 PUBLIC HEALTH RESEARCH 2020 VOL. 8 NO. 6
© Queen’s Printer and Controller of HMSO 2020. This work was produced by Partos et al. under the terms of a commissioning contract issued by the Secretary of State for Healthand Social Care. This issue may be freely reproduced for the purposes of private research and study and extracts (or indeed, the full report) may be included in professionaljournals provided that suitable acknowledgement is made and the reproduction is not associated with any form of advertising. Applications for commercial reproduction shouldbe addressed to: NIHR Journals Library, National Institute for Health Research, Evaluation, Trials and Studies Coordinating Centre, Alpha House, University of Southampton SciencePark, Southampton SO16 7NS, UK.
135

150. Staff writer. Still rocking and rolling. Convenience Store (Online), 26 August 2014. URL: www.conveniencestore.co.uk/products-in-depth/tobacco-still-rocking-and-rolling-with-ryo/370870.article(accessed 16 September 2019).
151. Hedley D. Imponderables and X Factor – Forecasting the Tobacco Future. Tobacco JournalInternational 2011;8/9:30
152. Stevens B. British American Tobacco (BAT). Presented at the Morgan Stanley Consumer RetailConference, New York, NY, November 2010.
153. Euromonitor International Ltd. Global tobacco findings 2012: tobacco in a new era. Briefing,16 October 2012.
154. Hegarty R. BAT launches value capsule cigarettes. The Grocer (Online), 14 January 2012.URL: www.thegrocer.co.uk/tobacco/bat-launches-value-capsule-cigarettes/225104.article(accessed 16 September 2019).
155. Staff writer. Now B&H capsule cigs come in 10s. Retail Newsagent, 4 January 2013, p. 28.
156. Dinkovski N. Premium brands: tobacco. Retail Newsagent, 2 August 2013, p. 32.
157. Gockelen-Kozlowski T. Capsule cigarettes: cap in the market. Retail Newsagent, 21 February 2014,p. 38.
158. Barnes R. Richmond brings out menthol 10s. The Grocer (Online), 7 January 2008. URL: www.thegrocer.co.uk/richmond-brings-out-menthol-10s/123938.article (accessed 16 September 2019).
159. Staff writer. Defiant display. Wholesale News (Online), 14 July 2010. URL: www.fwd.co.uk/wholesale-news/ (accessed March 2015).
160. Staff writer. Tobacco: still the big footfall driver. Wholesale News (Retail Review), 2014, pp. 50–1.
161. Hegarty R. Imperial Tobacco gives golden brand smooth a female focus. The Grocer (Online),22 February 2013. URL: www.thegrocer.co.uk/tobacco/imperial-tobacco-gives-golden-brand-smooth-a-female-focus/236786.article (accessed 16 September 2019).
162. Euromonitor International Ltd. Cigarettes in the United Kingdom. London: EuromonitorInternational Ltd; 2014.
163. Hegarty R. JTI extends Amber Leaf range with organic signature blend. The Grocer (Online),25 July 2014. URL: www.thegrocer.co.uk/buying-and-supplying/jti-extends-amber-leaf-range-with-organic-signature-blend/369894.article (accessed 16 September 2019).
164. Staff writer. Imperial tobacco adopts ‘slimmer’ market trend. Retail Newsagent, 5 August 2011,p. 11.
165. Euromonitor International Ltd. New product development in cigarettes: innovate or fail – keepingprice in power. Briefing, 2 July 2012.
166. Staff writer. Tobacco: king in convenience. Asian Trader, 12 September 2014, pp. 37–40.
167. Wood J. Shop product news: L&B Blue Superkings 19s to launch. Forecourt Trader (Online),22 August 2014. URL: www.forecourttrader.co.uk/news/archivestory.php/aid/8760/SHOP_PRODUCT_NEWS:_L_B_Blue_Superkings_19s_to_launch.html (accessed 16 September 2019).
168. Staff writer. Top products 2008. The Grocer (Online), 20 December 2008. URL: www.thegrocer.co.uk/top-products-2008-tobacco/196299.article (accessed 16 September 2019).
169. Hegarty R. Focus on Tobacco 2009: tobacco sales on a roll. The Grocer, 21 February 2009,pp. 57–60.
170. Lambert S. Slimmer cigarettes will be big money earners. Retail Newsagent, 30 December 2011,p. 9.
REFERENCES
NIHR Journals Library www.journalslibrary.nihr.ac.uk
136

171. Staff writer. B&H slides into new packs. Wholesale News, January 2013, p. 4.
172. Craig T, Hegarty R. Consumers choose price over branding in tobacco. The Grocer, 18 December2010, p. 4.
173. Gockelen-Kozlowski T. Brand innovations. Retail Newsagent, 15 February 2013, p. 36.
174. British American Tobacco. Annual Report 2008. URL: www.bat.com/group/sites/uk__9d9kcy.nsf/vwPagesWebLive/DO9DCL3B/$FILE/medMD9G2L3K.pdf?openelement (accessed 10 February 2020).
175. Hegarty R. Focus on tobacco: do dark times lay ahead. The Grocer, 18 February 2011, p. 51.
176. Staff writer. A smooth move. Wholesale News, September 2013, p. 21.
177. Lambert S. Taking stock: value is key for smokers. Retail Newsagent, 3 February 2012, p. 37.
178. Staff writer. Another success story [advert]. Retail Newsagent, 1 July 2011, p. 31.
179. Euromonitor International Ltd. Smoking tobacco in the United Kingdom. 2014.
180. Euromonitor International Ltd. PMI launches Marlboro Virginia variant in the UK. Opinion,21 September 2009.
181. Staff writer. Marlboro introduces lower price point with Marlboro price point. Wholesale News(Online), August 2009.
182. Staff writer. Benson & Hedges makes RYO debut. The Grocer (Online), 20 June 2009.URL: www.thegrocer.co.uk/benson-and-hedges-makes-ryo-debut/200858.article (accessed17 September 2019).
183. Imperial Tobacco: Annual General Meeting, 30 January 2013. URL: www.imperialbrandsplc.com/content/dam/imperial-brands/corporate/investors/shareholder-centre/AGM/Annual%20General%20Meeting_Jan%202013_Script.pdf.downloadasset.pdf (accessed 30 September 2019).
184. Parfett S. Tobacco: who’s fooling who. The Grocer, 13 October 2012, p. 23.
185. Gockelen-Kozlowski T. Light up your tobacco profits. Retail Newsagent, 16 November 2012, p. 30.
186. Dinkovski N. Roll with it. Retail Newsagent, 1 July 2011, p. 29.
187. Staff writer. Gallaher introduces price-marked Sterling packs. Talking Retail (Online), 10 October2008. URL: www.talkingretail.com/products-news/tobacco/gallaher-introduces-price-marked-sterling-packs-10-10-2008/ (accessed 17 September 2019).
188. Staff writer. What to stock tobacco – RYO. Retail Newsagent, 18 November 2011, p. 58.
189. Staff writer. Tobacco firms answer margins question. Retail Newsagent, 5 October 2012, p. 20.
190. Staff writer. What to stock tobacco – RYO. Retail Newsagent, Spring/Summer 2013, p. 40.
191. Euromonitor International Ltd. Tobacco in Western Europe. Briefing, 18 February 2014.
192. Staff writer. Imperial and Gallaher – head to head. Talking Retail (Online), 23 October 2008.URL: www.talkingretail.com/opinion/talking-points/imperial-and-gallaher-head-to-head-23-10-2008/(accessed 17 September 2019).
193. Staff writer. Forward roll. Wholesale News (Online), 13 March 2009.
194. Staff writer. Sterling to stick with value move. The Grocer (Online), 28 February 2009. URL: www.thegrocer.co.uk/sterling-to-stick-with-value-move/197865.article (accessed 17 September 2019).
195. Staff writer. Samson offers even more value for money. Talking Retail (Online), 14 December2010. URL: www.talkingretail.com/products-news/samson-offers-even-more-value-for-money-14-12-2010/ (accessed 17 September 2019).
DOI: 10.3310/phr08060 PUBLIC HEALTH RESEARCH 2020 VOL. 8 NO. 6
© Queen’s Printer and Controller of HMSO 2020. This work was produced by Partos et al. under the terms of a commissioning contract issued by the Secretary of State for Healthand Social Care. This issue may be freely reproduced for the purposes of private research and study and extracts (or indeed, the full report) may be included in professionaljournals provided that suitable acknowledgement is made and the reproduction is not associated with any form of advertising. Applications for commercial reproduction shouldbe addressed to: NIHR Journals Library, National Institute for Health Research, Evaluation, Trials and Studies Coordinating Centre, Alpha House, University of Southampton SciencePark, Southampton SO16 7NS, UK.
137

196. Wood J. Display potential. Wholesale News, January 2012, p. 30.
197. Staff writer. Kings price drop. Retail Newsagent, 13 June 2014, p. 9.
198. Staff writer. JTI update Holborn smooth taste brand. Talking Retail (Online), 12 September 2014.URL: www.talkingretail.com/products-news/tobacco/jti-updates-holborn-smooth-taste-brand-12-09-2014/ (accessed 17 September 2019).
199. Zuke E. Indie tobacco profits hit by falling margins. The Grocer (Online), 10 September 2011.URL: www.thegrocer.co.uk/topics/indie-tobacco-profits-hit-by-falling-margins/220927.article(accessed 17 September 2019).
200. Lambert S. Natural American Spirit roll out with free papers. Retail Newsagent, 30 August 2013,p. 10.
201. Euromonitor International Ltd. Make-your-own cigarettes launch in the UK. Opinion, 12 May 2011.
202. Lewis R. Focus on tobacco. The Grocer, 23 February 2008, pp. 47–50.
203. Munro G. Smokers filter out higher costs. Retail Newsagent, 28 October 2011, p. 22.
204. Staff writer. Imperial Tobacco launches Player’s as a sub value cigarette brand. Wholesale News,February 2012, p. 42.
205. Gann C. Preparing for the future. Retail Newsagent, 31 January 2014, p. 20.
206. Euromonitor International Ltd. Tobacco: cigars niche or tomb. Briefing, 25 January 2010.
207. Staff writer. Tobacco in depth – make your display pay. Retail Newsagent, 25 November 2011, p. 40.
208. Staff writer. STG asks how low can you go? Wholesale News, April 2014, p. 5.
209. Mintel. Convenience stores – UK – April 2014. URL: https://store.mintel.com/convenience-stores-uk-april-2014 (accessed 16 September 2019).
210. Staff writer. Industry profile: BAT. Retail Newsagent, 4 February 2011, p. 28.
211. Staff writer. Wholesale view: guarded optimism. Wholesale News, February 2014, p. 34.
212. Staff writer. Could DIY cigarettes prove a £2bn market in the making? The Grocer, 2 April 2011,p. 14.
213. Dinkovski N. Make more of premium. Retail Newsagent, 14 May 2013, p. 24.
214. Staff writer. Reps in shops offer smokers cut price cigs. Retail Newsagent, 31 January 2014, p. 20.
215. Dinkovski N. Make your gantry work. Retail Newsagent, 12 April 2013, p. 32.
216. Lambert S. Taking stock: big moves for premium price. Retail Newsagent, 14 May 2013, p. 31.
217. Orchard C. Adult Smoking Habits in Great Britain: 2014. Newport: Office for National Statistics;2016. URL: www.ons.gov.uk/peoplepopulationandcommunity/healthandsocialcare/healthandlifeexpectancies/bulletins/adultsmokinghabitsingreatbritain/2014 (accessed 18 March 2019).
218. Office for National Statistics (ONS). Consumer Price Inflation Time Series Dataset. Newport: ONS;2016. URL: www.ons.gov.uk/economy/inflationandpriceindices/bulletins/consumerpriceinflation/dec2016 (accessed 10 February 2020).
219. Euromonitor International Ltd. UK roll up trend. Opinion, 16 April 2009.
220. Staff writer. What to stock tobacco RYO. Retail Newsagent, Spring/Summer 2012, p. 38.
221. Hegarty R. Focus on tobacco. The Grocer, 15 February 2014, pp. 47–49.
REFERENCES
NIHR Journals Library www.journalslibrary.nihr.ac.uk
138

222. Partos TR, Branston JR, Hiscock R, Gilmore AB, McNeill A. Individualised tobacco affordability inthe UK 2002–2014: findings from the International Tobacco Control Policy Evaluation Project.Tob Control 2019;28:s9–19. https://doi.org/10.1136/tobaccocontrol-2017-054027
223. Kostova D, Chaloupka FJ, Yurekli A, Ross H, Cherukupalli R, Andes L, Asma S, GATS CollaborativeGroup. A cross-country study of cigarette prices and affordability: evidence from the Global AdultTobacco Survey. Tob Control 2014;23:e3. https://doi.org/10.1136/tobaccocontrol-2011-050413
224. Nargis N, Stoklosa M, Drope J, Fong GT, Quah ACK, Driezen P, et al. Trend in the affordabilityof tobacco products in Bangladesh: findings from the ITC Bangladesh surveys. Tob Control2019;28:s20–30. https://doi.org/10.1136/tobaccocontrol-2017-054035
225. Begh R, Lindson-Hawley N, Aveyard P. Does reduced smoking if you can’t stop make anydifference? BMC Med 2015;13:257. https://doi.org/10.1186/s12916-015-0505-2
226. Centers for Disease Control and Prevention. How Tobacco Smoke Causes Disease: The Biologyand Behavioural Basis for Smoking-Attributable Disease. A Report for the Surgeon General.Atlanta, GA: Centers for Disease Control and Prevention; 2010.
227. Staff writer. Imperial Tobacco to launch economy JPS as credit crunch hits smokers. Talking Retail(Online), 7 October 2008. URL: www.talkingretail.com/products-news/tobacco/imperial-tobacco-to-launch-economy-jps-cigarettes-as-credit-crunch-hit-smokers-07-10-2008/ (accessed 21 October 2019).
228. Wright C. Tobacco giant posts third quarter sales rise. The Grocer (Online), 23 October 2008.
229. Staff writer. Tobacco sales are on a roll. Wholesale News (Online), 17 March 2008.
230. Staff writer. Imperial Tobacco unveils JPS Silver. Wholesale News (Online), 24 November 2008.
231. Dinkovski N. Tobacco focus on value. Retail Newsagent, 3 January 2014, p. 27.
232. Euromonitor International Ltd. Tobacco 2014: new insights and system refresher Briefing,9 September 2014.
233. Munro G. Pricewatch retail: tough times for smokers – smokers go for pricemarks. RetailNewsagent, 1 April 2011, p. 20.
234. Gallus S, Lugo A, Ghislandi S, La Vecchia C, Gilmore AB. Roll-your-own cigarettes in Europe:use, weight and implications for fiscal policies. Eur J Cancer Prev 2014;23:186–92. https://doi.org/10.1097/CEJ.0000000000000010
235. Darrall KG, Figgins JA. Roll-your-own smoke yields: theoretical and practical aspects. Tob Control1998;7:168–75. https://doi.org/10.1136/tc.7.2.168
236. Laugesen M, Epton M, Frampton CM, Glover M, Lea RA. Hand-rolled cigarette smoking patternscompared with factory-made cigarette smoking in New Zealand men. BMC Public Health2009;9:194. https://doi.org/10.1186/1471-2458-9-194
237. Shahab L, West R, McNeill A. The feasibility of measuring puffing behaviour in roll-your-owncigarette smokers. Tob Control 2008;17(Suppl. 1):i17–23. https://doi.org/10.1136/tc.2007.021824
238. Shahab L, West R, McNeill A. A comparison of exposure to carcinogens among roll-your-own andfactory-made cigarette smokers. Addict Biol 2009;14:315–20. https://doi.org/10.1111/j.1369-1600.2009.00157.x
239. Koszowski B, Rosenberry ZR, Viray LC, Potts JL, Pickworth WB. Make your own cigarettes:toxicant exposure, smoking topography, and subjective effects. Cancer Epidemiol Biomarkers Prev2014;23:1793–803. https://doi.org/10.1158/1055-9965.EPI-14-0280
240. Hiscock R, Bauld L, Amos A, Fidler JA, Munafò M. Socioeconomic status and smoking: a review.Ann N Y Acad Sci 2012;1248:107–23. https://doi.org/10.1111/j.1749-6632.2011.06202.x
DOI: 10.3310/phr08060 PUBLIC HEALTH RESEARCH 2020 VOL. 8 NO. 6
© Queen’s Printer and Controller of HMSO 2020. This work was produced by Partos et al. under the terms of a commissioning contract issued by the Secretary of State for Healthand Social Care. This issue may be freely reproduced for the purposes of private research and study and extracts (or indeed, the full report) may be included in professionaljournals provided that suitable acknowledgement is made and the reproduction is not associated with any form of advertising. Applications for commercial reproduction shouldbe addressed to: NIHR Journals Library, National Institute for Health Research, Evaluation, Trials and Studies Coordinating Centre, Alpha House, University of Southampton SciencePark, Southampton SO16 7NS, UK.
139

241. Kotz D, West R. Explaining the social gradient in smoking cessation: it’s not in the trying, but inthe succeeding. Tob Control 2009;18:43–6. https://doi.org/10.1136/tc.2008.025981
242. Kale D, Gilbert HM, Sutton S. Are predictors of making a quit attempt the same as predictors of3-month abstinence from smoking? Findings from a sample of smokers recruited for a study ofcomputer-tailored smoking cessation advice in primary care. Addiction 2015;110:1653–64.https://doi.org/10.1111/add.12972
243. West R, Brown J. Latest Trends on Smoking in England from the Smoking Toolkit Study:STS120720. 2018. URL: www.smokinginengland.info/latest-statistics (accessed 4 April 2018).
244. Pennanen M, Broms U, Korhonen T, Haukkala A, Partonen T, Tuulio-Henriksson A, et al.Smoking, nicotine dependence and nicotine intake by socio-economic status and marital status.Addict Behav 2014;39:1145–51. https://doi.org/10.1016/j.addbeh.2014.03.005
245. Guillaumier A, Bonevski B, Paul C. ‘Cigarettes are priority’: a qualitative study of how Australiansocioeconomically disadvantaged smokers respond to rising cigarette prices. Health Educ Res2015;30:599–608. https://doi.org/10.1093/her/cyv026
246. Stewart MJ, Greaves L, Kushner KE, Letourneau NL, Spitzer DL, Boscoe M. Where there is smoke,there is stress: low-income women identify support needs and preferences for smoking reduction.Health Care Women Int 2011;32:359–83. https://doi.org/10.1080/07399332.2010.530724
247. Jha P, Peto R. Global effects of smoking, of quitting, and of taxing tobacco. N Engl J Med2014;370:60–8. https://doi.org/10.1056/NEJMra1308383
248. Kotsopoulos N, Mergos G, Postma M, Connolly M. Assessing the net fiscal consequencesof tobacco use in a high consumption and high tobacco tax country: the case of Greece.Value Health 2015;18:A506. https://doi.org/10.1016/j.jval.2015.09.1448
249. Gilmore AB, Branston JR, Sweanor D. The case for OFSMOKE: how tobacco price regulation isneeded to promote the health of markets, government revenue and the public. Tob Control2010;19:423–30. https://doi.org/10.1136/tc.2009.034470
250. McNeill A, Russell A, Bains M, Bauld L, Britton J, Carro-Ripalda S, et al. Tackling Illicit Tobaccofor Better Health: Final Evaluation Report. UK Centre for Tobacco Control Studies; 2012.URL: https://dspace.stir.ac.uk/handle/1893/21677#.XYe_dvxKi7o (accessed 22 September 2019).
251. BBC News. HMRC Fines Cigarette Maker for Oversupplying Belgium. 2014. URL: www.bbc.co.uk/news/business-30038328 (accessed 10 February 2020).
252. Gilmore AB, Gallagher AWA, Rowell A. Tobacco industry’s elaborate attempts to control a globaltrack and trace system and fundamentally undermine the Illicit Trade Protocol. Tob Control2019;28:127–40. https://doi.org/10.1136/tobaccocontrol-2017-054191
REFERENCES
NIHR Journals Library www.journalslibrary.nihr.ac.uk
140


EMEHS&DRHTAPGfARPHRPart of the NIHR Journals Librarywww.journalslibrary.nihr.ac.uk
This report presents independent research funded by the National Institute for Health Research (NIHR). The views expressed are those of the author(s) and not necessarily those of the NHS, the NIHR or the Department of Health and Social Care
Published by the NIHR Journals Library