iab ireland and nielsen irish market vod research
TRANSCRIPT

IAB Ireland
Video On Demand | 2016
June 2016
In association with:

Agenda
2
REACH
What is the reach of
VOD & who is a VOD
user & how has this
changed in the past
year? (Market Reach & Profile)
TIME
How do VOD
viewers spend
their time viewing
VOD across
various platforms
and vs. TV?
TRENDS
What are the key
market trends for
VOD usage in the
past year?
REACTION
How do VOD
viewers react
to advertising?
Nielsen | Prepared For: IAB Ireland - Video On Demand 2016

Key Insights
3
Nielsen | Prepared For: IAB Ireland - Video On Demand 2016
Just under 3 in 4 Irish Adults (16+) viewed VOD in the last 6
months, slightly higher than this time last year
1 in 3 are viewing VOD content on a daily basis, with this
figure increasing to 1 in 2 for 16-24 year olds.
Use of portable devices, smartphones and tablets, to view
VOD has risen over the past year across all demographics
and all content types
63% of VOD viewers watched when “out & about” compared to
just 47% last year
Long form (over 10 mins) professional content continues to
have the greatest reach, but all demographics are watching
a wide variety of content across short vs long form and
professional vs user generated.
Advertising acceptance in & around VOD content is rising
amongst medium/heavy users – up from 48% to 54%

‘REACH’ What is the reach of VOD & who is a VOD user & how has this changed in the past year? (Market Reach & Profile)

Just under 3 in 4 Irish Adults viewed VOD in the last 6 months
5
Q1: Have you watched any of the following types of Video on Demand (VOD) content online in the last 6 months? Base: Population Representative Sample|All=800 Nielsen | Prepared For: IAB Ireland - Video On Demand 2016
VOD | Reach in Last 6 Months Adults 16+ IRE Population
67%
71%
71% of IRE pop. in
last 6 months
VOD
reached
Significant difference at 95% C.L. (2016 vs. 2015)
2016 2015

+7%
84%
91%
A16-24
6
VOD viewing is increasing amongst 16-24s and 45+
2016 2015
Q1: Have you watched any of the following types of Video on Demand (VOD) content online in the last 6 months? Base: Population Representative Sample|16-24=120; 16-34=272; 25-44=312; 45+=368; HSK=728; HSK+K=267 Nielsen | Prepared For: IAB Ireland - Video On Demand 2016
VOD | Reach in Last 6 Months Adults 16+ IRE Population
+1%
87%
88%
A16-34
-1%
84%
83%
A25-44
+7%
47%
54%
A45+
+3%
68%
71%
HSK
-2%
84%
82%
HSK+K
Significant difference at 95% C.L. (2016 vs. 2015)

Long-form professional continues to be the content with the greatest reach
7
Q1: Have you watched any of the following types of Video on Demand (VOD) content online in the last 6 months? Base: Population Representative Sample|All=800 Nielsen | Prepared For: IAB Ireland - Video On Demand 2016
VOD User Non-VOD User
Type of VOD Content | Reach in Last 6 Months Adults 16+ IRE Population
27%
46%
48%
41%
User-Generated: long form
User-Generated: short form
Professional: long form
Professional: short form
[2015: 43%]
[2015: 45%]
[2015: 38%]
[2015: 26%]
Significant difference at 95% C.L. (2016 vs. 2015)

8
Professionally produced content continues to have higher reach
Q1: Have you watched any of the following types of Video on Demand (VOD) content online in the last 6 months? Base: Population Representative Sample|All=800 Nielsen | Prepared For: IAB Ireland - Video On Demand 2016
Type of VOD Content | Reach in Last 6 Months Adults 16+ IRE Population
Source Duration
58% 52% 57% 54%
Any Professional Any User-Generated Short form Long form
[2015: 55%] [2015: 49%] [2015: 54%] [2015: 52%]
Significant difference at 95% C.L. (2016 vs. 2015)

All demographics are viewing a variety of content.
16-24s appear to be viewing more professionally produced
content than a year ago.
9
Q1: Have you watched any of the following types of Video on Demand (VOD) content online in the last 6 months? Base: Population Representative Sample| 16-24=120; 16-34=272; 25-44=312; 45+=368; HSK=728; HSK+K=267 Nielsen | Prepared For: IAB Ireland - Video On Demand 2016
Type of VOD Content | Reach in Last 6 Months Adults 16+ IRE Population
80%
75%
69%
42%
58%
66%
78%
69%
61%
37%
53%
62%
76%
72%
68%
42%
57%
66%
83%
74%
63%
36%
53%
63%
0%
20%
40%
60%
80%
100%
16-24 16-34 25-44 45+ HSK HSK+K
Any Professional Any User-Generated Short form Long form
[2015] [69%] [71%] [74%] [78%] [74%] [71%] [73%] [73%] [72%] [62%] [67%] [65%] [35%] [32%] [37%] [34%] [55%] [50%] [55%] [53%] [67%] [62%] [65%] [64%]
Significant difference at 95% C.L. (2016 vs. 2015)

10
Free services continue to have the greatest reach Growth in subscription platforms year on year
Q3. By which method do you access Video on Demand (VOD) content? Base: Population Representative Sample|All=800 Nielsen | Prepared For: IAB Ireland - Video On Demand 2016
Service Platforms used to access VOD | Reach in Last 6 Months Adults 16+ IRE Population
Free Services (Free Platforms, Peer to Peer)
55% [2015: 51%]
Paid Services (Subscription, Pay per View)
35% [2015: 30%]
53%
30%
13% 9%
0%
20%
40%
60%
Free platforms Subscription Peer-to-Peer (P2P) Pay Per View
[2015: 49%] [2015: 25%] [2015: 9%] [2015: 10%]
Significant difference at 95% C.L. (2016 vs. 2015)

45+ are watching more via both Free and Subscription
11
Q3. By which method do you access Video on Demand (VOD) content? Base: Population Representative Sample| 16-24=120; 16-34=272; 25-44=312; 45+=368; HSK=728; HSK+K=267 Nielsen | Prepared For: IAB Ireland - Video On Demand 2016
Service Platforms used to access VOD | Reach in Last 6 Months Adults 16+ IRE Population
64%
61%
59%
43%
53%
60%
48%
43%
38%
18%
30%
39%
24%
22%
18%
4%
13%
18%
9%
11%
15%
4%
10%
15%
0%
20%
40%
60%
80%
16-24 16-34 25-44 45+ HSK HSK+K
Free Platforms Subscription Peer-to-Peer Pay Per View
[2015] [68%] [47%] [9%] [21%] [64%] [39%] [13%] [21%] [60%] [31%] [14%] [15%] [35%] [12%] [5%] [4%]
[50%] [25%] [10%] [11%] [61%] [32%] [16%] [15%]
Significant difference at 95% C.L. (2016 vs. 2015)

Market Reach - Summary
Just under 3 in 4 Irish Adults (16+) viewed VOD in the last 6 months,
slightly higher than this time last year
There are indications that more Adults over 45 have viewed VOD
content versus 2015
Rise in usage of both free and subscription platforms in the past 6
months amongst A45+
12
Nielsen | Prepared For: IAB Ireland - Video On Demand 2016

TRENDS (Amongst VOD viewers) What are the key market trends for VOD usage in the past year?

A change of focus
Results in the first section were based on the national
adult population
In this section, the focus moves to VOD viewers, and
comparing responses to the previous survey wave.
14
Nielsen | Prepared For: IAB Ireland - Video On Demand 2016

Significant growth in VOD viewers who view on a daily basis
15
Q2. How often do you watch each of the following type of Video on Demand (VOD) content? Base: Viewed VOD content in last 6 months |All= 993; 16-24=178; 16-34=424; 25-44=526; 45+= 289; HSK= 907; HSK+K= 427 Nielsen | Prepared For: IAB Ireland - Video On Demand 2016
1 in 3
(33%) VOD viewers
watch content daily in 2016
Daily Usage of VOD content Adults 16+ who are VOD viewers
Significant difference at 95% C.L. (2016 vs. 2015)
0%
10%
20%
30%
40%
2014 2015 2016
28%
33% 28%

Significant growth of daily viewing for four of the key demographics
16
Q2. How often do you watch each of the following type of Video on Demand (VOD) content? Base: Viewed VOD content in last 6 months |All= 993; 16-24=178; 16-34=424; 25-44=526; 45+= 289; HSK= 907; HSK+K= 427 Nielsen | Prepared For: IAB Ireland - Video On Demand 2016
Daily Usage of VOD content Adults 16+ who are VOD viewers
Significant difference at 95% C.L. (2016 vs. 2015)
1 in 2
A16-24
2 in 5
A16-34
1 in 3
HSK
1 in 4
HSK+K
1 in 4
A45+
1 in 3
A25-44
[2015: 1 in 2] [2015: 2 in 5] [2015: 1 in 4] [2015: 1 in 5] [2015: 1 in 4] [2015: 1 in 5]

2 in 3 Adults 16+ viewed VOD for 1+ hours/day in the last 6 months – a similar proportion to that seen in 2015
17
Q26: Please think about your TV viewing (excluding viewing Video on Demand content if you use your TV set to do so) and then your Video on Demand viewing (on any device) across a typical day. On average how many hours a day do you spend watching each? Base: Viewed VOD content in last 6 months |All= 993; Nielsen | Prepared For: IAB Ireland - Video On Demand 2016
Daily Viewing of VOD content on a Typical Day Adults 16+ who are VOD viewers
2015 2016
67% 66%
66% watch VOD 1+
hours a day
Significant difference at 95% C.L. (2016 vs. 2015)
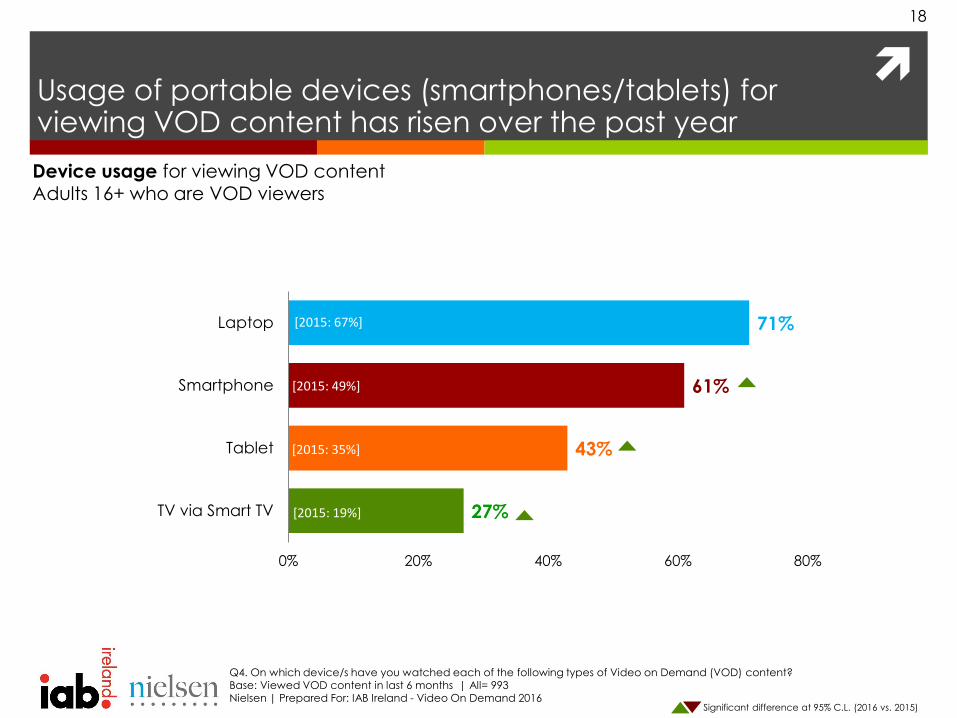
Usage of portable devices (smartphones/tablets) for viewing VOD content has risen over the past year
18
Device usage for viewing VOD content Adults 16+ who are VOD viewers
Q4. On which device/s have you watched each of the following types of Video on Demand (VOD) content? Base: Viewed VOD content in last 6 months | All= 993 Nielsen | Prepared For: IAB Ireland - Video On Demand 2016
27%
43%
61%
71%
0% 20% 40% 60% 80%
TV via Smart TV
Tablet
Smartphone
Laptop
[2015: 49%]
[2015: 35%]
[2015: 19%]
Significant difference at 95% C.L. (2016 vs. 2015)
[2015: 67%]

19
The increase in usage of smartphones is universal Significant increases in use of tablets and Smart TVs amongst A25+
2015 2016
30%
54%
60%
64%
45%
65%
70%
74%
0% 20% 40% 60% 80%
45+
25-44
16-34
16-24
Usage of Smartphone
Q4. On which device/s have you watched each of the following types of Video on Demand (VOD) content? Base: Viewed VOD content in last 6 months |16-24=178; 16-34=424; 25-44=526; 45+=289 Nielsen | Prepared For: IAB Ireland - Video On Demand 2016
35%
35%
35%
37%
43%
45%
40%
38%
0% 20% 40% 60%
Usage of Tablet
Device usage for viewing VOD content Adults 16+ who are VOD viewers
13%
21%
23%
23%
27%
28%
27%
24%
0% 20% 40% 60%
Usage of Smart TV
Significant difference at 95% C.L. (2016 vs. 2015)

20
Q1: Have you watched any of the following types of Video on Demand (VOD) content online in the last 6 months? Q4. On which device/s have you watched each of the following types of Video on Demand (VOD) content? Base: Viewed VOD content in last 6 months | A25+ (n= 190-215) Nielsen | Prepared For: IAB Ireland - Video On Demand 2016
Usage of smartphones for watching any content format Adults 25+ who are VOD viewers
Using smartphones to view VOD content has increased significantly across all content formats for Adults 25+
Significant difference at 95% C.L. (2016 vs. 2015)
2015 2016
42% 47% 49%
37%
50%
60% 60%
46%
0%
20%
40%
60%
80%
Any Professional Any User-Generated Any Short-Form Any Long-Form

21
Q1: Have you watched any of the following types of Video on Demand (VOD) content online in the last 6 months? Q4. On which device/s have you watched each of the following types of Video on Demand (VOD) content? Base: Viewed VOD content in last 6 months | A25+ (n= 190-215) Nielsen | Prepared For: IAB Ireland - Video On Demand 2016
Usage of tablets for watching any content format Adults 25+ who are VOD viewers
Usage of tablets to view VOD content has also increased significantly across all content formats amongst Adults 25+
Significant difference at 95% C.L. (2016 vs. 2015)
2015 2016
35% 32%
36%
31%
42% 41% 43% 41%
0%
20%
40%
60%
Any Professional Any User-Generated Any Short-Form Any Long-Form

22
Q1: Have you watched any of the following types of Video on Demand (VOD) content online in the last 6 months? Q4. On which device/s have you watched each of the following types of Video on Demand (VOD) content? Base: Viewed VOD content in last 6 months | A25+ (n= 190-215) Nielsen | Prepared For: IAB Ireland - Video On Demand 2016
Usage of Smart TV for watching any content format Adults 25+ who are VOD viewers
Usage of Smart TV for viewing VOD content also on the rise across all content formats amongst Adults 25+
Significant difference at 95% C.L. (2016 vs. 2015)
19%
11%
14%
20%
29%
15%
21%
27%
0%
20%
40%
Any Professional Any User-Generated Any Short-Form Any Long-Form
Rise in viewing any professional content via Smart TV amongst A45+ (30%) &
HSK (28%) A45+: [2015: 14%], HSK: [2015: 20%]
2015 2016

23
Preference for smartphones is also on the rise; it’s now the 2nd most preferred device for viewing VOD content
Preference for viewing VOD content Adults 16+ who are VOD viewers
Q5. On which device/s do you prefer MOST to watch Video on Demand (VOD) content? Base: Viewed VOD content in last 6 months | All= 993 Note: Any differences of +-1% are due to the round-up of decimals Nielsen | Prepared For: IAB Ireland - Video On Demand 2016
Significant difference at 95% C.L. (2016 vs. 2015)
2%
7%
8%
12%
14%
18%
40%
0% 10% 20% 30% 40% 50%
Games Console
TV via Set Top Box
TV via Smart TV
Desktop Computer
Tablet
Smartphone
Laptop
[2015: 2%]
[2015: 14%]
[2015: 14%]
[2015: 12%]
[2015: 43%]
[2015: 7%]
[2015: 8%]
24
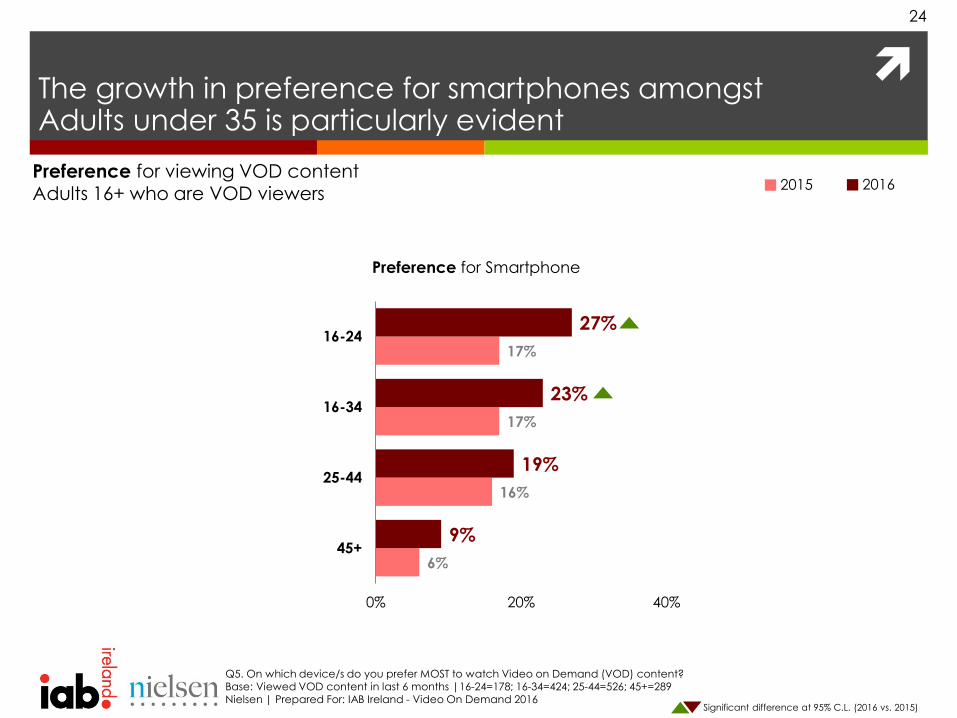
The growth in preference for smartphones amongst Adults under 35 is particularly evident
6%
16%
17%
17%
9%
19%
23%
27%
0% 20% 40%
45+
25-44
16-34
16-24
Preference for Smartphone
Q5. On which device/s do you prefer MOST to watch Video on Demand (VOD) content? Base: Viewed VOD content in last 6 months |16-24=178; 16-34=424; 25-44=526; 45+=289 Nielsen | Prepared For: IAB Ireland - Video On Demand 2016
Preference for viewing VOD content Adults 16+ who are VOD viewers
2015 2016
Significant difference at 95% C.L. (2016 vs. 2015)

The need for viewing VOD content when & where people want is helping to drive increased use of portable devices
25
Q8. Why do you watch Video on Demand (VOD) content? Q9. Why do you watch Video on Demand (VOD) content on each of the following devices? Base: Viewed VOD content in last 6 months (n= 309/475) Nielsen | Prepared For: IAB Ireland - Video On Demand 2016
Drivers of watching VOD content on smartphone/tablet Adults 16+ who are VOD viewers
38%
64%
41%
69%
0% 20% 40% 60% 80%
Tablet
Smartphone
View anywhere I want Watch in my own time
31%
41%
35%
47%
0% 20% 40% 60% 80%
2015 2016
Significant difference at 95% C.L. (2016 vs. 2015)

Viewing of VOD content is becoming more entrenched in various out-of-home locations
26
Q7: Where do you watch Video on Demand (VOD) content on each of these devices? Base: Viewed VOD content in last 6 months |All = 993 Nielsen | Prepared For: IAB Ireland - Video On Demand 2016
Location of watching VOD Adults 16+ who are VOD viewers
97% 63%
In Home Out of Home
[2015: 98%] [2015: 47%]
36% 34% 32%
24%
16% 11% 9%
0%
10%
20%
30%
40%
At work Commuting On
vacation
At
restaurant,
café, bar
At school,
college,
university
At the gym Other
2015 [28%] [23%] [22%] [18%] [14%] [8%] [7%]
Rise in out-of-home usage of Tablets (49% ) and Smartphones (78% ) in the past year [Tablet 2015: 36%] [Smartphone 2015: 67%]
Significant difference at 95% C.L. (2016 vs. 2015)
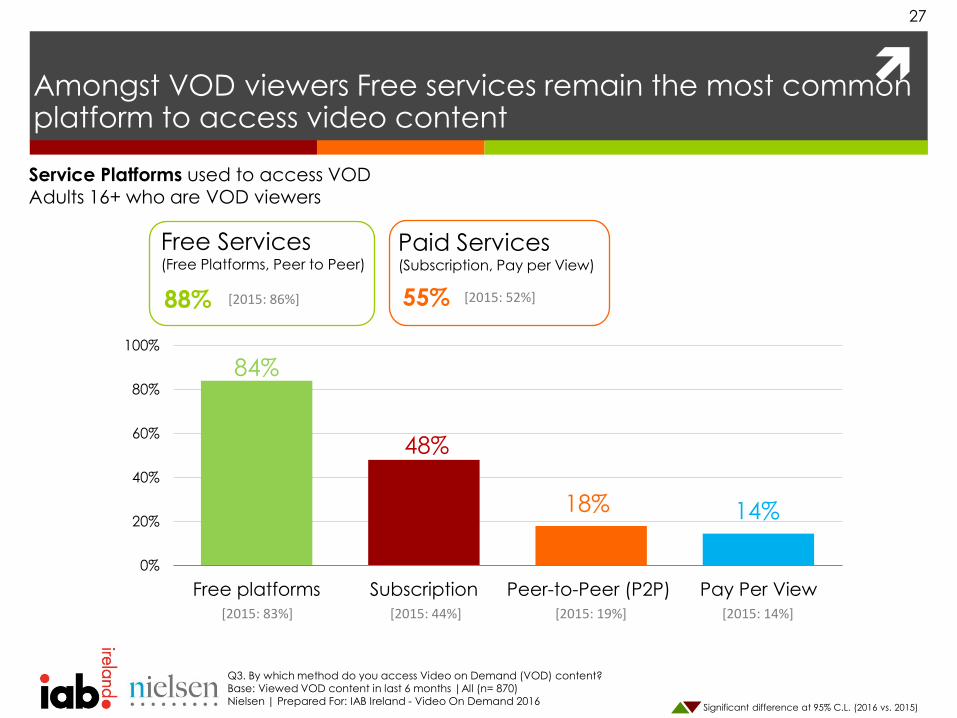
Amongst VOD viewers Free services remain the most common platform to access video content
27
Q3. By which method do you access Video on Demand (VOD) content? Base: Viewed VOD content in last 6 months |All (n= 870) Nielsen | Prepared For: IAB Ireland - Video On Demand 2016
Service Platforms used to access VOD Adults 16+ who are VOD viewers
84%
48%
18% 14%
0%
20%
40%
60%
80%
100%
Free platforms Subscription Peer-to-Peer (P2P) Pay Per View
Paid Services (Subscription, Pay per View)
55%
Free Services (Free Platforms, Peer to Peer)
88% [2015: 86%] [2015: 52%]
[2015: 83%] [2015: 44%] [2015: 19%] [2015: 14%]
Significant difference at 95% C.L. (2016 vs. 2015)

The proportion accessing content using both free and paid services has increased in the past year
28
Q3. By which method do you access Video on Demand (VOD) content? Base: Viewed VOD content in last 6 months|All (n= 870) Nielsen | Prepared For: IAB Ireland - Video On Demand 2016
Service Platforms used to access VOD Adults 16+ who are VOD viewers
Free Services (Free Platforms, Peer to Peer)
88% [2015: 86%]
Paid Services (Subscription, Pay per View)
55% [2015: 52%] 45% Free
Services Only
[2015: 48%]
12% Paid Services Only
[2015: 14%]
43% Free + Paid
Services
[2015: 38%]
Significant difference at 95% C.L. (2016 vs. 2015)

29
Live Streaming| Top 5
Q14 You mentioned that you watch full length TV programmes/series when viewing Video on Demand (VOD). Which of the following types of programmes do you watch via 'live streaming' and which do you watch via ‘On-Demand'? Base: Viewed VOD content in last 6 months & watch professional videos over 10 minutes n=677 Nielsen | Prepared For: IAB Ireland - Video On Demand 2016
Movies, drama & box sets are most popular via on-demand, whilst sports & news are engaged the most in the moment. On-demand viewing of children’s programmes is on the rise.
Top 5 Genre viewed via On-Demand vs. Live Streaming Adults 16+ who are VOD viewers
On Demand | Top 5
Movies 65%
Drama 54%
Comedy 49%
Box Sets 52%
Factual/Documentaries 42%
[2015: 64%]
[2015: 57%]
[2015: 52%]
[2015: 48%]
[2015: 44%]
Sport 45%
News & Current Affairs 43%
Comedy 32%
Music 32%
Movies 36%
[2015: 40%]
[2015: 40%]
[2015: 34%]
[2015: 34%]
[2015: 34%] Viewing of Children’s
Programmes (22% ) via On-Demand is on the rise [2015: 17%]
Significant difference at 95% C.L. (2016 vs. 2015)

30
Housekeepers with kids are becoming more active viewers of VOD content
Q1: Have you watched any of the following types of Video on Demand (VOD) content online in the last 6 months? Q4. On which device/s have you watched each of the following types of Video on Demand (VOD) content? Q14 You mentioned that you watch full length TV programmes/series when viewing Video on Demand (VOD). Which of the following types of programmes do you watch via 'live streaming' and which do you watch via ‘On-Demand'? Base (Q14): Viewed VOD content in last 6 months & watch professional videos over 10 minutes n=286 Base (Q1/Q4): Viewed VOD content in last 6 months | HSK+K (n= 427) Nielsen | Prepared For: IAB Ireland - Video On Demand 2016
Rise in viewing of children’s programmes
(36% ) amongst HSK+K in the past year [2015: 27%]
More HSK+K (30% ) engaged in daily viewing of VOD content in the past year. [2015: 22%]
Daily viewing of long form (21% ) and
short form (20% ) content has increased as has user-generated (20% ) content [Long Form 2015: 15%] [Short Form 2015: 13%] [User-Generated 2015: 11%]
Use of Laptops (69% ), Smartphones
(67% ), Tablets (52% ), and Smart TV (31% ) on the rise for HSK+K [Laptops 2015: 59%] [Smartphones 2015: 51%] [Tablets 2015: 42%] [Smart TV 2015:221%]
Significant difference at 95% C.L. (2016 vs. 2015)

Internet connectivity has become less of a barrier for viewing VOD content outside of Dublin in the past year
31
Nielsen | Prepared For: IAB Ireland - Video On Demand Q15 Now we would like you to think about the full length TV programmes/series that you watch when viewing Video on Demand (VOD) content. If on occasion you do not watch the full VOD content in one viewing, which of the following reasons explains why you only watch part of the content? Base: Viewed VOD content in last 6 months & watch professional video content > 10 minutes long (n= 233-444) Nielsen | Prepared For: IAB Ireland - Video On Demand 2016
Barriers to watching content in full (By Residence Area) Adults 16+ who are VOD viewers
10%
13%
25%
18%
32%
22%
30%
41%
12%
12%
20%
23%
31%
19%
28%
41%
0% 20% 40% 60%
I am distracted by content on my regular TV set
I only view the segments/clips of content that I am
most interested in
The quality of the content was not good enough
I am interrupted by advertising
I ran out of time (e.g. end of a commute)
Lost connection to the internet prevented me from
viewing the content in full
Downloading/buffering prevented me from viewing
the content in full
I am interrupted by someone around me (e.g. family,
friend)
Rest of Ireland Dublin
Why not viewed in full…
[2015: 35%]
[2015: 27%]
[2015: 28%]
[2015: 23%]
Significant difference at 95% C.L. (2016 vs. 2015)

Trends In The Past Year - Summary
In the past year…
There has been significant growth in viewing VOD content on a daily
basis across a range of demographics: 25-44, 45+, HSK and HSK+k
Use of portable devices, smartphones and tablets, to view VOD has
risen significantly
The increase in usage of smartphones is universal, with the increase in use of tablets and SmartTVs being more apparent amongst 25+
Significant increase in viewing of VOD content while out and about is
evident for all demographics – it’s becoming more entrenched
Free platforms remain the most common platforms to view VOD
content – the proportion watching both free and subscription has
increased
Internet connectivity is becoming less of a barrier for viewing VOD
content outside of Dublin
32
Nielsen | Prepared For: IAB Ireland - Video On Demand 2016
TIME (Amongst VOD viewers) How do VOD viewers spend their time viewing VOD
across various platforms?
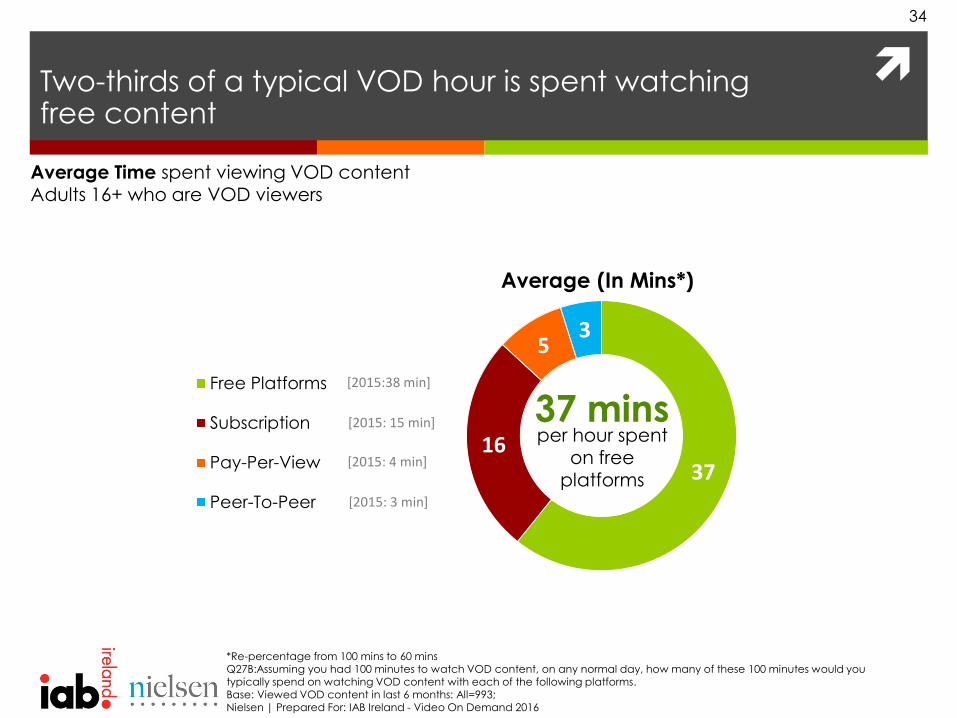
Two-thirds of a typical VOD hour is spent watching free content
34
*Re-percentage from 100 mins to 60 mins Q27B:Assuming you had 100 minutes to watch VOD content, on any normal day, how many of these 100 minutes would you typically spend on watching VOD content with each of the following platforms. Base: Viewed VOD content in last 6 months: All=993; Nielsen | Prepared For: IAB Ireland - Video On Demand 2016
Average Time spent viewing VOD content Adults 16+ who are VOD viewers
37 16
5 3
Free Platforms
Subscription
Pay-Per-View
Peer-To-Peer
Average (In Mins*)
37 mins per hour spent
on free platforms
[2015:38 min]
[2015: 15 min]
[2015: 4 min]
[2015: 3 min]

0%
20%
40%
60%
80%
100%
Mid
nig
ht
-
7a
m
Mo
rnin
g
(7a
m-
no
on
)
Aft
ern
oo
n
(no
on
-
6p
m)
Eve
nin
g
(6p
m-
mid
nig
ht)
0%
20%
40%
60%
80%
100%
Mid
nig
ht
-
7a
m
Mo
rnin
g
(7a
m-
no
on
)
Aft
ern
oo
n
(no
on
-
6p
m)
Eve
nin
g
(6p
m-
mid
nig
ht)
VOD viewing remains prominent during traditional prime-time TV hours (6pm-midnight)
35
Weekdays
% of VOD viewers
Weekends
% of VOD viewers
Q10. When during the week (Monday-Friday) do you watch the following types of Video on Demand (VOD) content? Q12. When during the weekend (Saturday-Sunday) do you watch the following types of Video on Demand (VOD) content? Base: VOD - All= 993 / TAM Data: Nielsen TV Audience Measurement Data )
Nielsen | Prepared For: IAB Ireland - Video On Demand 2016
Time of Day (Alternative Time Slots View): VOD Viewing Adults 16+ who are VOD viewers
Significant difference at 95% C.L. (2016 vs. 2015)
VOD 2016 vs. 2015: -3%
[VOD 2015: Follows similar pattern]
VOD TV

A third of VOD viewers claim to watch more VOD than TV, increasing to more than half amongst Adults 16-24
36
Q26: Please think about your TV viewing (excluding viewing Video on Demand content if you use your TV set to do so) and then your Video on Demand viewing (on any device) across a typical day. On average how many hours a day do you spend watching each? |All = 993; 16-24=178 Nielsen | Prepared For: IAB Ireland - Video On Demand 2016
Share of Daily Viewing (VOD vs. TV) Adults 16+ who are VOD viewers
32%
25%
43%
Share of Average Daily TV vs. Daily VOD Viewing %
1 in 3 watch more VOD than TV
Watch More
VOD Than TV
Watch Equally
VOD & TV
Watch More TV
Than VOD
Watch more VOD than TV
Significant difference at 95% C.L. (2016 vs. 2015)
0%
20%
40%
60%
80%
2014 2015 2016
A16-24
45%
56% 59%
[2015: 32%] [2014: 30%]

Use of on-demand viewing per typical hour amongst hard to reach light TV viewers increased in the past year
37
*Re-percentage from 100 mins to 60 mins Q28:Assuming you had 100 mins to watch full length TV programmes/series, any normal day, how many of these 100 mins would you typically spend watching via TV broadcast/live streaming & how many minutes watching in your own time/on-demand. Base: Viewed VOD content in last 6 months: Light=276; Medium=351; Heavy=366 Nielsen | Prepared For: IAB Ireland - Video On Demand 2016
Average Time spent viewing TV Broadcasts/Live Streaming vs. In Your Own Time/On-Demand (By level of TV viewing) Adults 16+ who are VOD viewers
15
24
28
45
36
32
Light TV Viewers
Medium TV Viewers
Heavy TV Viewers
TV Broadcasts/ Live Streaming
In Your Own Time/ On-Demand
Average VOD Viewing Time (Mins*)
(3+ hours per day)
(1-2 hours per day)
(Less than 1 hour per day)
2015 [On-Demand]
[32 min]
[36 min]
[42 min]
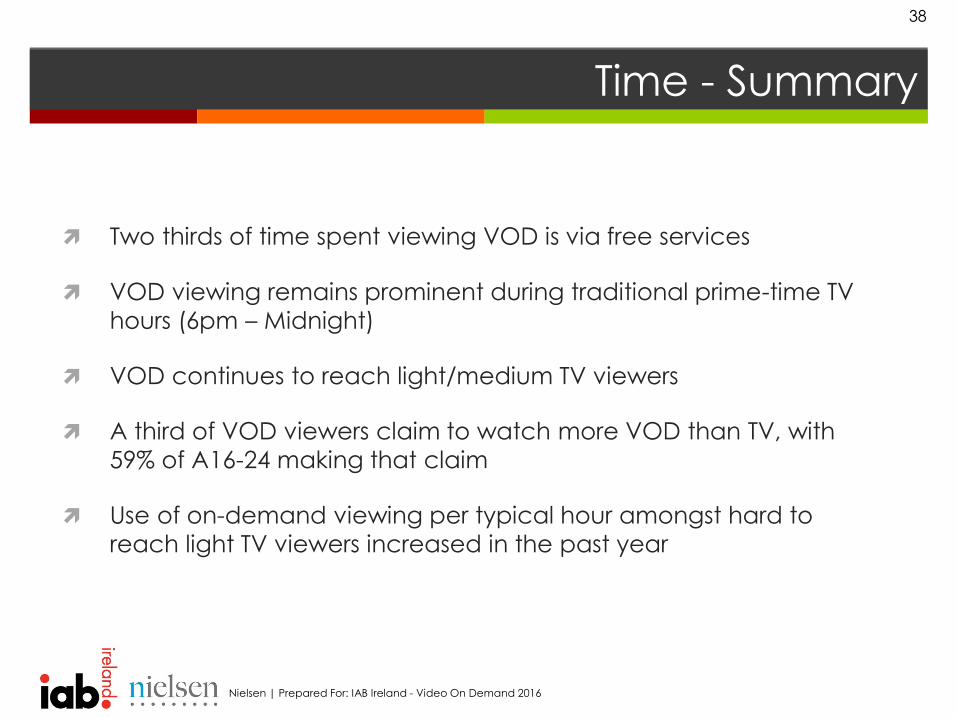
Time - Summary
Two thirds of time spent viewing VOD is via free services
VOD viewing remains prominent during traditional prime-time TV
hours (6pm – Midnight)
VOD continues to reach light/medium TV viewers
A third of VOD viewers claim to watch more VOD than TV, with
59% of A16-24 making that claim
Use of on-demand viewing per typical hour amongst hard to
reach light TV viewers increased in the past year
38
Nielsen | Prepared For: IAB Ireland - Video On Demand 2016

REACTION How do VOD viewers react to advertising?
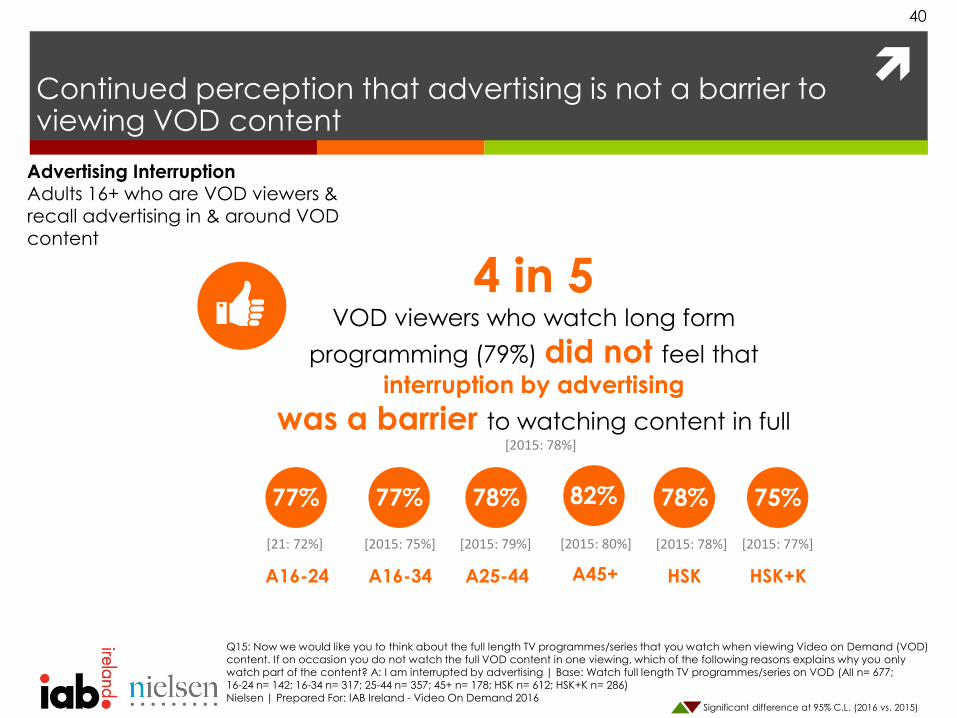
Continued perception that advertising is not a barrier to viewing VOD content
40
Q15: Now we would like you to think about the full length TV programmes/series that you watch when viewing Video on Demand (VOD) content. If on occasion you do not watch the full VOD content in one viewing, which of the following reasons explains why you only watch part of the content? A: I am interrupted by advertising | Base: Watch full length TV programmes/series on VOD (All n= 677; 16-24 n= 142; 16-34 n= 317; 25-44 n= 357; 45+ n= 178; HSK n= 612; HSK+K n= 286) Nielsen | Prepared For: IAB Ireland - Video On Demand 2016
Advertising Interruption Adults 16+ who are VOD viewers & recall advertising in & around VOD content
4 in 5 VOD viewers who watch long form
programming (79%) did not feel that
interruption by advertising
was a barrier to watching content in full
A16-24
77%
A16-34
77%
A25-44
78%
HSK
78%
HSK+K
75%
A45+
82%
[21: 72%] [2015: 75%] [2015: 79%] [2015: 80%] [2015: 78%] [2015: 77%]
[2015: 78%]
Significant difference at 95% C.L. (2016 vs. 2015)

1 in 2 continue to be happy to watch advertising in return for free content, with acceptance rising amongst medium/ heavy users
41
Q21: How happy are you to watch adverts in and around the following types of Video on Demand (VOD) content in order to be able to watch content for free? A; Very/Somewhat/Happy Base: Those who recall seeing advertising in & around VOD content (All n= 726; 16-24 n= 134; 16-34 n= 307; 25-44 n= 376; 45+ n= 216; HSK n= 684; HSK+K n= 334) Nielsen | Prepared For: IAB Ireland - Video On Demand 2016
Advertising Acceptance within any type of VOD content Adults 16+ who are VOD viewers & recall advertising in & around VOD content
1 in 2 VOD viewers are
very/somewhat happy to watch
advertising in order to consume content
for free (Any VOD content)
51%
A16-24
54%
A16-34
57%
A25-44
57%
HSK
51%
HSK+K
53%
A45+
37%
[2015: 49%] [2015: 51%] [2015: 51%] [2015: 37%] [2015: 47%] [2015: 52%]
[2015: 46%]
Rise in advertising acceptance amongst medium/heavy VOD users (54% ) in the past year. [Medium/Heavy Users 2015: 48%]
Significant difference at 95% C.L. (2016 vs. 2015)

42
Q25: As a result of seeing advertising whilst watching each of the following VOD content, have you done any of the following? Base: Those who recall seeing advertising in & around VOD content (n= 726) Nielsen | Prepared For: IAB Ireland - Video On Demand 2016
Actions ever done following exposure to advertising…
Advertising in & around Video On Demand content has led to similar levels of brand engagement
24% visited brand’s
website/physical
location
20% searched for the
brand/ product on
the internet
11% have bought the
brand
16% Clicked on the ad to
find more info about
the brand
16% Amplified message
about brand via
word of mouth
Advertising Reaction Adults 16+ who are VOD viewers & recall
advertising in & around VOD content
[2015: 23%]
[2015: 16%]
[2015: 20%]
[2015: 9%]
[2015: 19%]
Significant difference at 95% C.L. (2016 vs. 2015)

Video On Demand: Key Insights

Key Insights
44
Nielsen | Prepared For: IAB Ireland - Video On Demand 2016
Just under 3 in 4 Irish Adults (16+) viewed VOD in the last 6
months, slightly higher than this time last year
1 in 3 are viewing VOD content on a daily basis, with this
figure increasing to 1 in 2 for 16-24 year olds.
Use of portable devices, smartphones and tablets, to view
VOD has risen over the past year across all demographics
and all content types
63% of VOD viewers watched when “out & about” compared to
just 47% last year
Long form (over 10 mins) professional content continues to
have the greatest reach, but all demographics are watching
a wide variety of content across short vs long form and
professional vs user generated.
Advertising acceptance in & around VOD content is rising
amongst medium/heavy users – up from 48% to 54%

IAB Ireland
Video On Demand – Wave 3
June 2016
In association with: