contentsunstats.un.org/unsd/publication/seriesf/seriesf_83rev1e.pdf · chapter i. overall census...
TRANSCRIPT


iii
CONTENTS
Page
Preface ................................................................................................................................................................... ix
Chapter
I. OVERALL CENSUS MANAGEMENT ...................................................................................................... 1
A. The importance of relevance ................................................................................................................... 11. Introduction ...................................................................................................................................... 12. Relevance to user needs ................................................................................................................... 13. Public relations to reinforce relevance to ordinary population ....................................................... 24. Relevance to overall national strategies ........................................................................................... 25. Relevance to other elements of national statistical systems ............................................................ 2
B. Census planning ....................................................................................................................................... 31. Introduction ...................................................................................................................................... 32. Specifying the role of the census ..................................................................................................... 33. The role of Government ................................................................................................................... 54. Setting goals ..................................................................................................................................... 75. Developing project plans .................................................................................................................. 86. Monitoring project plans ................................................................................................................ 157. Developing a budget ....................................................................................................................... 16
C. Quality assurance ................................................................................................................................... 201. Introduction .................................................................................................................................... 202. The role of managers ...................................................................................................................... 213. Quality improvement and the census ............................................................................................. 22
D. Management structure ........................................................................................................................... 251. Introduction .................................................................................................................................... 252. Generic management structure ....................................................................................................... 253. Management of the operational aspects ......................................................................................... 28
E. Software and hardware evaluation and acquisition .............................................................................. 291. Introduction .................................................................................................................................... 292. Evaluating software ........................................................................................................................ 313. Acquiring software ......................................................................................................................... 314. Developing software applications in-house ................................................................................... 335. Evaluating hardware needs ............................................................................................................ 346. Acquiring hardware ........................................................................................................................ 34
F. Use of sampling ..................................................................................................................................... 361. Introduction .................................................................................................................................... 362. Tests before the census ................................................................................................................... 363. During the census ........................................................................................................................... 364. After the census .............................................................................................................................. 36

iv
G. Selecting and managing external consultants and outsourcing ............................................................ 361. Introduction .................................................................................................................................... 362. Differing objectives ........................................................................................................................ 373. Specification ................................................................................................................................... 374. Monitoring the outsourced project ................................................................................................. 37
II. PREPARATORY TASKS ............................................................................................................................ 39
A. Establishing the basis of enumeration ................................................................................................... 391. Introduction .................................................................................................................................... 392. Responsibility for the census enumeration .................................................................................... 393. Key goals ........................................................................................................................................ 404. Key stakeholders ............................................................................................................................ 405. Type of enumeration ....................................................................................................................... 406. Method of enumeration .................................................................................................................. 437. Timing of enumeration ................................................................................................................... 458. Census reference time .................................................................................................................... 469. Duration of enumeration ................................................................................................................ 47
10. Critical dates ................................................................................................................................... 48 11. Other major constraints .................................................................................................................. 48 12. Performance indicators ................................................................................................................... 49
B. Structure of the workforce ..................................................................................................................... 491. Introduction .................................................................................................................................... 492. Roles and responsibilities ............................................................................................................... 503. Time available ................................................................................................................................ 524. Staffing ratios ................................................................................................................................. 52
C. Mapping ................................................................................................................................................. 531. Introduction .................................................................................................................................... 532. Geographic classification ............................................................................................................... 533. Mapping technology ....................................................................................................................... 554. Undertaking the mapping program ................................................................................................ 57
D. Form design and testing ........................................................................................................................ 631. Introduction .................................................................................................................................... 632. Form design .................................................................................................................................... 643. Form testing .................................................................................................................................... 664. Census tests .................................................................................................................................... 685. Methods of testing .......................................................................................................................... 69
E. Instruction manuals ............................................................................................................................... 691. Introduction .................................................................................................................................... 692. Enumerators’ handbook .................................................................................................................. 693. Supervisors’ handbook ................................................................................................................... 714. Regional managers’/deputy regional managers’ handbook ........................................................... 73
Chapter Page
v
F. Printing of forms and other documents ................................................................................................. 751. Introduction .................................................................................................................................... 752. Planning and management of printing ........................................................................................... 753. Types of forms ................................................................................................................................ 764. Quality assurance ........................................................................................................................... 78
III. FIELD OPERATIONS .................................................................................................................................. 81
A. Publicity ................................................................................................................................................. 811. Introduction .................................................................................................................................... 812. Developing a publicity strategy ..................................................................................................... 813. Implementing a publicity strategy .................................................................................................. 834. Publicity support services .............................................................................................................. 875. Budget ............................................................................................................................................. 906. Evaluation ....................................................................................................................................... 90
B. Recruitment and remuneration .............................................................................................................. 901. Introduction .................................................................................................................................... 902. Recruitment .................................................................................................................................... 903. Remuneration ................................................................................................................................. 94
C. Field staff training ................................................................................................................................. 971. Introduction .................................................................................................................................... 972. Training programmes ..................................................................................................................... 973. Trainers ........................................................................................................................................... 974. Developing training material .......................................................................................................... 985. Training sessions ............................................................................................................................ 986. Training regional managers ............................................................................................................ 987. Training supervisors and enumerators ......................................................................................... 1008. Administration training ................................................................................................................ 1039. Health and safety training ............................................................................................................ 103
10. Computer systems training ........................................................................................................... 103
D. Distribution and return of materials .................................................................................................... 1031. Introduction .................................................................................................................................. 1032. Inputs ............................................................................................................................................ 1043. Material ......................................................................................................................................... 1044. Specifications ............................................................................................................................... 1045. Estimating quantities .................................................................................................................... 1076. Packing ......................................................................................................................................... 1087. Census agency management role ................................................................................................. 1098. Mail-out/mail-back census ........................................................................................................... 109
E. Monitoring field operations ................................................................................................................. 1091. Introduction .................................................................................................................................. 1092. Planning a management information system ............................................................................... 110
Chapter Page

vi
3. How to collect management information ..................................................................................... 1104. Where to start ............................................................................................................................... 1105. What to collect ...............................................................................................................................111
F. Quality assurance for field operations ................................................................................................. 1121. Introduction .................................................................................................................................. 1122. Role of supervisors ....................................................................................................................... 1123. Observing interviews .................................................................................................................... 1144. Checking households already enumerated ................................................................................... 1185. Checking coverage of the enumeration area ............................................................................... 1186. Checking completed census forms ............................................................................................... 118
G. Technology issues for field operations ................................................................................................ 1191. Introduction .................................................................................................................................. 1192. Types of technology ..................................................................................................................... 119
IV. DATA PROCESSING ................................................................................................................................. 121
A. Processing strategies ............................................................................................................................ 1211. Introduction .................................................................................................................................. 1212. Processing system......................................................................................................................... 121
B. Location of processing centres ............................................................................................................ 1231. Introduction .................................................................................................................................. 1232. Number of locations ..................................................................................................................... 1233. Selecting suitable premises .......................................................................................................... 124
C. Establishing the workforce structure and recruiting staff ................................................................... 1251. Introduction .................................................................................................................................. 1252. Establishing the workforce structure ........................................................................................... 1253. Estimating staff numbers .............................................................................................................. 1264. Recruiting managers ..................................................................................................................... 1305. Recruiting supervisors and processors ......................................................................................... 1316. Recruiting other specialist staff .................................................................................................... 1327. Timing of recruitment campaign .................................................................................................. 1328. Contingency planning .................................................................................................................. 1329. Remuneration ............................................................................................................................... 132
D. Processing operations .......................................................................................................................... 1331. Introduction .................................................................................................................................. 1332. Data-processing cycle .................................................................................................................. 1333. Controlling work flows ................................................................................................................ 1344. Management information system ................................................................................................. 135
E. Quality assurance for processing ......................................................................................................... 1401. Introduction .................................................................................................................................. 1402. Total quality management philosophy ......................................................................................... 1403. Quality management framework .................................................................................................. 140
Chapter Page

vii
4. Quality management system ........................................................................................................ 1405. Quality assurance points ............................................................................................................... 1426. Continuous quality improvement ................................................................................................. 1437. Validation ...................................................................................................................................... 145
F. Technology issues for processing ........................................................................................................ 1471. Introduction .................................................................................................................................. 1472. Processing platforms .................................................................................................................... 1473. Data-capture methods ................................................................................................................... 1474. Coding .......................................................................................................................................... 1525. Editing .......................................................................................................................................... 1536. Imputation ..................................................................................................................................... 1537. Data management ......................................................................................................................... 1548. Communications ........................................................................................................................... 154
V. CENSUS PRODUCTS ............................................................................................................................... 157
A. Broad dissemination strategy .............................................................................................................. 1571. Introduction .................................................................................................................................. 1572. Wholesale versus retail approach to dissemination ..................................................................... 1573. Pricing of census products ........................................................................................................... 1574. Timeliness of release compared to accuracy ................................................................................ 1585. Stages of data release ................................................................................................................... 1586. General or customized releases .................................................................................................... 1587. Integration of census results with other products ........................................................................ 158
B. User consultation process .................................................................................................................... 1591. Introduction .................................................................................................................................. 1592. Managing the process ................................................................................................................... 1593. Tools to be used ............................................................................................................................ 1594. The business plan ......................................................................................................................... 161
C. Product development ........................................................................................................................... 1621. Introduction .................................................................................................................................. 1622 Product planning ........................................................................................................................... 1623. Production strategy ....................................................................................................................... 1634. Quality assurance ......................................................................................................................... 1645. Development and testing of procedures ....................................................................................... 1656. Presentation guidelines ................................................................................................................. 1667. Storage issues ............................................................................................................................... 1668. Management of intellectual property .......................................................................................... 167
D. Marketing strategy ............................................................................................................................... 1671. Introduction .................................................................................................................................. 1672. The marketing strategy ................................................................................................................. 1673. Marketing activities ...................................................................................................................... 1684. The marketing plan ....................................................................................................................... 168
Chapter Page
viii
E. Sales strategy ....................................................................................................................................... 170 1. Introduction .................................................................................................................................. 173 2. The sales strategy ......................................................................................................................... 173 3. The sales plan ............................................................................................................................... 173 4. The selling process ....................................................................................................................... 174 5. Sales targets .................................................................................................................................. 175 6. Sales reporting/evaluation/performance indicators ..................................................................... 176 7. Sales team organization ................................................................................................................ 176 8. Sales territory management .......................................................................................................... 177 9. Sales roles and responsibilities .................................................................................................... 17710. Training ......................................................................................................................................... 177
VI. EVALUATION ........................................................................................................................................... 179
A. Introduction ......................................................................................................................................... 179
B. Basic measurements of overall quality ............................................................................................... 179
C. Detailed analysis .................................................................................................................................. 181
D. Changes to census processes ............................................................................................................... 181
E. Communicating quality issues ............................................................................................................. 182
ANNEXES
I. Composition and terms of reference of the national census committeeof Zambia for the 1990 census ............................................................................................................ 183
II. Example of a model census project timetable ..................................................................................... 187
III. Exmaple of a model project Gantt chart ............................................................................................. 201
IV. 1996 census processing: a practical exampleof a quality management strategy ........................................................................................................ 205
V. Time and equipment estimates for manual census date entryand scanner census data entry ............................................................................................................. 215
VI. Example of a table of contents of a model contract for the provisionof a census processing system ............................................................................................................. 223
VII. Examples of census questionnaire forms ............................................................................................ 231
Chapter Page

ix
PREFACE
The United Nations has, over the years, issued a series ofhandbooks and technical reports intended to assist coun-tries in carrying out population and housing censuses. Thesehandbooks and reports have been reviewed from time totime to reflect new developments and emerging issues incensus taking. The present handbook is part of a series ofhandbooks that have been developed to assist countries intheir preparation for the 2000 and future rounds of censuses.In addition to this handbook, other handbooks being pre-pared include the following:
(a) Handbook on a Geographic Information System andDigital Mapping for Population and Housing Censuses (ST/ESA/STAT/SER.F/79);
(b) Handbook on Population and Housing Census Ed-iting (ST/ESA/STAT/SER.F/82);
(c) Guide for the Collection of Economic Characteris-tics in Population Censuses (ST/ESA/STAT/SER.F/54 (PartIII)).
The present handbook is an update of and complementsthe previous Handbook of Population and Housing Cen-suses, Part I, Planning, Organization and Administrationof Population and Housing Censuses (ST/ESA/STAT/SER.F/54(Part I)) published in 1992.1
The purpose of the present publication is to assist coun-tries by providing a reference document that focuses on themanagement aspects of carrying out population and hous-ing censuses. In particular, the objectives of the publica-tion are to provide guidance to countries on:
(a) Structures that need to be put in place to manage thecensus planning and operational processes;
(b) Planning processes that need to be considered inestablishing a census;
(c) Control and monitoring processes;(d) The links between these structures and processes
(and with other elements of the census system).
The publication is divided into six chapters. Its structurereflects as closely as possible the census cycle. The initialchapters discuss the management aspects concerning the plan-ning and preparatory stages, followed by discussions on theoperational stages (that is, field operations and processing),dissemination of census results and, finally, evaluation.
When preparing a publication on such an important andcomplex topic, it is difficult to judge how much detail shouldbe included. Attempts have been made to be as comprehen-sive as possible without overloading the reader with toomuch detail, but at the same time reflecting current prac-tices in census management. The material is based on coun-tries’ practices in managing a census.
However, it is difficult to prepare material that is inclu-sive of the wide range of countries’ experiences. Countriesshould use the information in this publication that is rel-evant to their particular situation.
The international recommendations relating to a censusare contained in the publication Principles and Recommen-dations for Population and Housing Censuses (ST/ESA/STAT/SER.M/67/Rev.1), published in 1998.2 The objec-tives of the principles and recommendations are:
(a) To help in improving census operations and the util-ity of census results in national terms;
(b) To increase, to the extent possible, international com-parability.
The following publications issued by the regional com-missions will also provide useful guidance on census op-erations relevant to the countries of each region:
(a) Economic Commission for Europe, Recommenda-tions for the 2000 Censuses of Population and Housing inthe ECE Region, Statistical Standards and Studies, No 49;
(b) Economic and Social Commission for Asia and thePacific, Report of the Regional Working Group on the 1990World Population and Housing Census Programme (STAT/WPHCP/14);
(c) Economic Commission for Latin America and theCaribbean, Informe Final del Seminario sobre Contenido yDiseño de la Boleta Censal, Rio de Janeiro, Brazil, 13 al 16de marzo de 1989 (LC/L.508);
(d) Economic Commission for Africa, Report of theRegional Working Group on Recommendations for the 2000Round of Population and Housing Censuses in Africa (ECA/STAT/WG/PHC/95/21);
(e) Economic and Social Commission for Western Asia,Final Report and Recommendations of the Regional Semi-nar on Population and Housing Censuses in the ESCWARegion (E/ESCWA/STAT/85/WG.1/2).
The present publication was drafted by the staff of the Cen-sus, Demography and Geography Branch and TechnologyApplication Branch of the Australian Bureau of Statistics.
The Palestinian Central Bureau of Statistics has providedimportant contributions and inputs to the handbook, as havethe National Statistical Office of Kyrgystan, the Cambo-dian Ministry of Planning, together with the National Insti-tute of Statistics, the National Institute of Statistics ofMozambique and the Central Statistical Office of Zambia.
Other countries have provided examples of their censusexperiences, which have been included in the handbook.
Acknowledgement is also due to UNFPA for providingthe financial support that made the handbook possible.
NOTES1United Nations publication, Sales No. E.92.XVII.8.2United Nations publication, Sales No. E.98.XVII.8.

x

1
I. OVERALL CENSUS MANAGEMENT
Once the census agency has determined its position oncensus content, an information paper can be prepared. Theinformation paper can outline:
(a) The topics planned for inclusion in the forthcomingcensus;
(b) The topics planned for exclusion from the forthcom-ing census;
(c) Other topics, to assess user demand.
To assess the demand for data, the information papershould invite submissions from users on what topics shouldbe included in the census. If feasible, the release of the in-formation paper can be supported by seminars held withusers. Seminars provide the census agency with an oppor-tunity to meet the users of census data and to provide themwith an indication of what topics can and cannot be realisti-cally included in the census. In the majority of countries,other government ministries will be the major users of cen-sus data and these seminars provide an opportunity to edu-cate the staff from these ministries about the uses and limi-tations of census data.
However, many other elements of the census also need tobe considered in ensuring that the census is as relevant aspossible to users. The most important aspects of these ele-ments include:
(a) Design of enumeration areas
A key use of a census is to provide information for smallgeographic regions such as enumeration areas, villages orregions of similar characteristics within a province. Theextent to which this use can be satisfied will be determinedby, among many things, the design of the base areas (seechap. II, sect. C, for more detail);
(b) Design of operational tasks
Maintaining a focus on relevance to users is importantwhen designing the operational tasks to be undertaken byall census workers. This applies to all staff, whether an enu-merator deciding which type of form to use at a dwelling ora data processor considering how to resolve an edit failure;
(c) Training of field staff
This is especially important where a personal interviewapproach is used in collecting the information. However,even where self-enumeration is employed the actions andwords of field staff can greatly influence the nature, andthus the relevance, of the information reported;
A. THE IMPORTANCE OF RELEVANCE
1. Introduction
The census should produce statistics that are relevant todata users. This is the core statistical objective of undertak-ing a census. Every action in a census must be directed to-wards producing relevant output that meets the needs ofusers. There are several aspects to this attribute of relevanceas outlined in the following sections.
2. Relevance to user needs
The most obvious stakeholders of the census are the peopleand organizations who use the output of the census to assistthem to understand some aspect of the society from whichthe census information has been collected. Ensuring thatthe needs of this group of stakeholders are carefully consid-ered is an essential element of census planning.
A great deal of information about the users’ needs for in-formation will be gathered in content consultations with theusers and will be recognized in the form design.
A census is a particularly expensive exercise to under-take and creates a burden on respondents. Therefore, it iscrucial to ensure that any unmet demand for data is kept toa minimum and that topics for which there is little demandare not included on the census form. Consulting with usersof census data is a positive public relations undertaking andan efficient, transparent means of determining the demandfor potential census topics.
The first step in the user consultation process is to deter-mine the census agency’s position on census content. Al-though the intention of the consultation process is to satisfyuser requests as far as practical, it is necessary to first deter-mine which topics are suitable for inclusion in the census.When assessing potential census topics, the following broadcriteria could be used as a guide.
(a) Is the topic of major national importance?
(b) Is there a need for data on the topic for small groupsin the population or for small geographic areas?
(c) Is the topic suitable for inclusion in the census?
(d) Are there sufficient resources available to collect andprocess the data for that topic?
(e) Does it allow for international comparability?

2
(d) Census publicity campaign
The need for a publicity campaign close to the time of thecensus to support the collection work is widely accepted. Akey component of such a campaign is explaining to peoplehow the information they provide will be used. For such acampaign to be successful the relevance of the collection tousers’ needs must be clear and straightforward;
(e) Dissemination of data
The dissemination programme must deliver relevant prod-uct and services to users.
3. Public relations to reinforce relevanceto ordinary population
As well as the communications campaigns undertaken closeto the collection period, it is possible to use other public rela-tions activities throughout the period between censuses. Suchcampaigns can be focused on demonstrating to “ordinarypeople” that the census is relevant to them and should be sup-ported. Examples of such activities could include:
(a) Major releases of data from the previous census;
(b) Seizing opportunities for case studies; for example,opening of new public buildings, such as schools and hos-pitals, where the need for the buildings has been determinedby census data;
(c) Publicizing the development of census informationin forms easily accessible to the people (e.g., summary booksand pamphlets) and distributing them to places where theycan be accessed by people (e.g., schools, libraries, munici-pal offices and village and administration centres).
4. Relevance to overall national strategies
As well as being a key element of a national statisticalsystem a census can also provide opportunities to advanceother objectives relevant to a country. While these shouldremain subsidiary to the statistical purposes of the censusthey can be important considerations in assessing the ben-efits and costs of the census to the country. It is probablethat the range of additional benefits will differ markedlyfrom country to country, depending on such factors as:
(a) The stage of economic development of the country;
(b) The quantity and quality of existing infrastructurewithin the country (e.g., is electricity widely available?);
(c) The extent to which population characteristics are evenlydispersed across the country (e.g., are there particular areaswhere unemployment of clerical workers is an issue?).
Examples of these other objectives could include:
(a) An opportunity to acquire funding for improving andincreasing the stock of information technology equipmentwithin the country;
(b) Providing employment in economically depressedareas of the country;
(c) An opportunity to train a large number of people intasks such as data processing or census collection duties;
(d) Provision of improvement in the country’s mappingcapabilities, through the development of maps needed forthe census.
5. Relevance to other elements of nationalstatistical systems
Information from the census may be used in many ele-ments of a country’s statistical system in addition to the tabu-lations produced directly by the census. As well as the twoareas described in more detail below, information from thecensus can be analysed to fill in gaps in many statisticalseries. For example, employment in sectors of the economynot covered by specific statistical enquiries or informationabout rent paid for housing.
(a) Population estimates
A common use of the results of the census is to provide abasis for estimates of the population of a country. Such esti-mates will be required for years when a census is not heldand may also be used to adjust census results to overcomeproblems such as under-enumeration in the census.
In some countries large demographic surveys are con-ducted between censuses to update the population estimates.
As well as providing information of value for many policyand operational uses these estimates are frequently used toprovide benchmarks for a household survey programme.
(b) Household survey programme
Most countries conduct sample surveys between censusesas part of their household survey programme. The data fromthese surveys are usually more complex than the basic datacollected in the census and are used to expand on the char-acteristics of census topics (plus additional topics) and tomeasure change between censuses. The population estimatesdescribed above can provide benchmark data for measuringchange through the survey programme.
Moreover, detailed small area counts from the census maybe used directly in design of the sampling frame and selec-tion of the sampled units.
While the survey programme may collect information dif-ferent from that collected in the census, there are usually sev-eral topics that are common to both. Therefore, to maximizethe use of data from both sources, it is important that there isstandardization of concepts and definitions for these com-mon topics. These common data items may include age, sex,family relationship, occupation and so on. Apart from dataitems, there should also be common definitions regardinggeographic locations (e.g., definition of rural and urban).
The census can also provide the benefits of developinginformation technology and other infrastructure, and staffskills that can be utilized in the household surveyprogramme.

3
B. CENSUS PLANNING
1. Introduction
Census planning is the core process in linking the differ-ent phases of the census cycle. The figure below is one ap-proach to showing the links between different major phasesof the census cycle.
Planning can be regarded as the core of the census cycleand the process that is most critical to the completion of asuccessful census. The focus in the early stages of planningwill be on setting strategic directions for the entire censusprogramme. As can be seen in the above diagram, each phaseof the census cycle is dependent on a preceding phase. Thequality of the output from each phase has a direct effect onthe success of the next phase and other phases downstream.
In practice, it is likely (and desirable) that all phases in-teract with one another through an ongoing evaluation pro-cess. For example, this occurs when the people undertakingthe field operations phase observe something that will in-fluence the interpretation of the output products and passthis knowledge to the dissemination phase team. This couldalso be regarded as the use of a “living plan” techniquethrough which initial assumptions are continually updatedthroughout the census cycle. This is particularly importantin countries that conduct ad hoc or irregular censuses andmay not have access to evaluation reports from the previ-ous census.
The aim of the planning process is to ensure not only thateach phase is properly resourced and organized but also thatthe output of each phase is of sufficient quality for all sub-sequent phases and that all dependencies between the dif-ferent phases are identified. Because of the long duration ofthe census cycle, planning should not remain static but beflexible to take into account changes that occur.
There are a number of issues that require careful consid-eration when planning a census. These are:
(a) Specifying the role of the census;
(b) The role of Government;
(c) Setting goals;
(d) Developing project plans;
(e) Monitoring project plans;
(f) Developing a budget.
2. Specifying the role of the census
Before determining the need for a census, it is impor-tant that there is an understanding of the role of the censusboth in terms of what is possible through the selected cen-sus enumeration process (see chap. 2, sect. A) and how thecensus itself fits into the overall statistical framework ofthe country.
Preparation
Planning
Evaluation Field operations
Dissemination Processing
Figure I.1. The census cycle

4
Because of the high profile of the census compared with otherstatistical activities, many users may view the census either asthe sole source of statistics or the only reliable source of statis-tics about a particular topic. The key strength of a census com-
pared with many other statistical collections is the ability to pro-vide data for small geographic areas and for small populationgroups. It may be more cost-effective to collect data not requiredfor these purposes using other statistical methodologies.
Highcommittee
Regionalpublicitycampaigncommittee
Nationaldirector
Nationalcommittee
Publicity campaignsubcommittees
Governoratessubcommittee
Central securitycommittee
Executivedirector
Executivecommittee
Data processingdirector
Supervisors
Editors andcoders
Data keyerssupervisors
Data keyers
Computer editors
Governorates censusdirector
Deputy andassistants to
executive director
Administrativesupport staff
Assistants
Supervisors
Crew leaders
Enumerators
Census organizational structure for thePalestinian Central Bureau of Statistics

5
The prime role of a census is usually to provide an accu-rate count of the total population for each of the administra-tive regions of a country. Such counts are often required forequitable distribution of funds by Government and electoraldistribution. The extent to which the census goes beyond ahead count often depends on the demand for, and priorityof, data for particular topics at a small area or small popula-tion group basis.
Whatever the method of enumeration used (self-enumer-ated or by an interviewer), the costs of doing so generallymean that the nature of the questions that can be asked on acensus must be straightforward and readily understood byeither the person completing the form or by an interviewerwith only limited training. Therefore, the census is limitedin providing useful data on complex issues. This limits thetopics that may be suitable for collecting in a census.
There are other methodologies that may be used in con-junction with, or in place of, census collection to achievethe main aims of the census. These include sampling withinthe census itself (see sect. F below), sample surveys, civilpopulation registers and other administrative sources. Theadvantages of each of these are considered below.
Sample surveys provide great flexibility in regard to top-ics. Interviewer-based surveys using trained staff allow top-ics to be explored in depth and may be the only reliable wayto collect information about complex topics. Surveys arecost-effective and thus can generally be run more regularlythan a full census but cannot provide small area and smallpopulation group data.
Population registers and administrative sources can pro-vide a wealth of data for small areas but may be restrictedin terms of defining small population groups. The reliabil-ity of the data from administrative sources is dependent ona high level of administrative organization that may not bepresent in many countries. Other problems include the factthat the data are collected for non-statistical purposes andthe degree of consistency of classifications and processesand statistical rigour required for the purposes of the censusmay not be present.
The agency responsible for the census should ensure thatthese factors are well understood in planning for the cen-sus, in particular by those people and organizations who aredata users.
Stakeholders external to the statistical agency
The key group of stakeholders are the end-users of the cen-sus data. These groups can either be current users of censusdata or potential users of census data. As has been explainedin section A above, the needs of this group define the conceptof ‘relevance’ that underlies all aspects of the census.
Current users of census data may have well-articulatedneeds and generally are in a position to influence the direc-tions of census taking. However, their requirements need tobe monitored as to whether the topics continue to be neededor whether the census remains the most effective method ofcollecting the data. Quite often, users will request that par-
ticular topics continue to be included in the census, as theyhave built their planning models around these data items.However, there may well exist better sources for these dataitems than the census or these data items may have ceasedto have high social priority.
The census is a valuable resource that may be underutilizedand potential users are the hardest to engage in the censusprocess. This cannot be achieved through a single campaignas may be possible with current users. There is a need for anongoing education and communication effort to developcontinuing understanding of the nature of decisionmakingand the need for census data to support those decisions. Arange of tools such as meetings, seminars and publicitymaterial about the census data can be used on an ongoingbasis (see chap. 3, sect. A).
It is likely that many of the goods and services requiredby the statistical agency to undertake the census (includingtransport facilities, telecommunications, advertising, print-ing, cartography and specialized information technology)will be acquired from outside the statistical agency. In somecountries, these may be supplied as core functions of an-other government agency, while in others the functions willbe acquired on the open market. In either case the organiza-tion that supplies this functionality will become a stakeholderin the census.
3. The role of Government
There are three areas where the Government and its ad-ministration will need to be considered in planning a cen-sus. These are:
(a) Providing a legal framework for the conduct of thecensus;
(b) Providing funding for the census;
(c) Providing logistical support for census activities.
(a) Legal framework
Some legal authority will be needed to carry out a census.This will vary considerably from country to country but thefollowing may be covered by subsidiary legislation:
(a) The authority of the census agency to undertake cen-sus activities;
(b) Topics to be included in the census;
(c) The requirements of individuals to provide informa-tion;
(d) Provisions about confidentiality of information sup-plied by individuals;
(e) The role of other organizations (especially other gov-ernment ministries) in census taking.
Some of these matters may be covered by legislation,while others may require formal government approval, with-out requiring legislation, prior to each census. The legalframework needs to be clearly understood and incorporatedinto census planning. Due allowance should be made forthe significant elapsed time that may be required for theselegal processes.

6
Special care should be given to fixing the date of the cen-sus. The census date is normally covered by legislation andagencies should be completely certain that the date chosen isrealistic in that all planning and preparatory tasks can be com-pleted by that date. Amending legislation to change the dateof the census may prove to be difficult, if not impossible.
Ideally, the legal framework should allow for a great de-gree of operational flexibility so as to give the agency con-ducting the census the ability to continually improve meth-odologies and deal with problems as they arise. For example,the legal framework can be established to give the censusagency the authority to carry out the census and to choosethe topics to be incorporated on the census form. However,it should not prescribe the actual form design and questionwording to be included on the form. If that were the case,agencies might find themselves locked into a particular formdesign that testing has shown needs changing.
Willing public cooperation is essential to the successfulconduct of a census and will be assisted by non-legislatedprocesses such as a publicity campaign (see chap. 3, sect.A). However, there is a need for the census legislation toimpose penalties for non-compliance or obstruction. Theseshould be rarely invoked and it would be desirable if of-fences could be treated using summary procedures and notbe subject to lengthy judicial processes.
(b) Funding
In most countries, the Government provides specific fund-ing for the census. The census is unlike many other activi-ties of Government that receive ongoing and relatively pre-dictable allocations. The census budget is highly cyclical,with relatively low levels of spending through the prepara-tory and dissemination phases. There is a large peak duringthe enumeration and processing phases. Governments needto be aware well in advance of when the peak expenditureis likely to occur so that this can be planned for.
The cyclical nature of census costs requires that the cen-sus budgets are planned well in advance and cover all knownactivities. Agreement by Government on the level of fund-ing for the census is needed early in the cycle so that otheraspects of census planning can proceed. Census managerswill need to manage census funds and closely monitor thegovernment commitment to the census to ensure that theagreed funds are actually available when needed. There havebeen many cases of Governments initially agreeing to a cer-tain level of funding but eventually unable to meet thosecommitments owing to other fiscal pressures. This can havedisastrous effects on census planning. In some countries,other government ministries may provide funding for par-ticular topics (e.g., the Labour Ministry providing fundingfor labour force topics).
Establishing a legal framework
In the Principles and Recommendations for Population and HousingCensuses,a it is stated that:
“Legal authority for the census is required for fixing primaryadministrative responsibility, for obtaining the necessary funds, fordetermining the general scope and timing of the census, and for placing alegal obligation upon the public to cooperate and give truthful answersand a legal obligation upon the enumerator to record the responsesfaithfully. In a ddition, the confidentiality of the individual informationshould be strongly and clearly established in the census legislation andguaranteed by adequate sanctions so as to provide a b asis for t heconfident cooperation of the public. In countries that lack permanentlegal authority for t he taking of p eriodic censuses, i t is important to actearly to establish ad hoc legal authority for the taking of periodiccensuses, it is important to act early to establish ad hoc legal authority or,preferably, legislation calling for a system of periodic censuses.”
a Principles and Recommendations for Population and Housing Censuses, Revision 1(United Nations publication, Sales No. E.98.XVIII.8), para. 1.57.

7
(c) Logistical support
Many countries draw heavily upon other governmentagencies in the preparation and conduct of the census. Thissupport may be provided either as part of the ongoing workof these other agencies or may require the census agency toprovide funding.
In many countries, teachers are used for enumeration. Inthese cases, it is vital that the census agency obtain the com-mitment and ongoing support of the minister responsiblefor the appropriate government agency responsible for teach-ers (e.g., the Department of Education) and senior staffwithin that agency.
Where the support is provided as part of the ongoing workprogramme of the agency, census managers need to ensurethat these other agencies are aware of the requirements ofthe census. These agencies should have appropriate plansand have obtained the funding that will ensure that censusgoals can be met.
Some examples of other government agencies that maysupport census activities can include:
(a) Local or provincial Governments, which may permitor encourage staff of their agencies to work on the censusor provide infrastructure or services in regional centres ;
(b) Local or provincial steering committees made up ofstaff from a variety of government agencies specifically setup to oversee census operations in their region;
(c) Other government agencies that supply specialist ser-vices such as form printing, mapping, transport services ormedia liaison.
For more details, see annex I, which contains an examplefrom the Zambian census of 1990 that clearly outlines thecomposition and terms of reference of the National CensusCommittee.
4. Setting goals
Goals provide a framework within which the ongoingmanagement of the census can proceed and decisions canbe made. Without clear goals, it is difficult for staff to makedecisions and take responsibility for those decisions, and itis easy for the overall census process to deviate from whatwas originally envisaged. Without them, decision-makingbecomes centralized and autocratic, which, because of thesize and complexity of the process, will cause problems inimplementation. The first step in setting goals is to estab-lish the stakeholders and their requirements.
The term “stakeholder” is used to describe a group ofpeople who will be affected by a specified activity. For thecensus, the most important stakeholders are those peoplewho are either current or potential users of the census data,most of whom will be external to the statistical agency car-rying out the census. Other stakeholders may be involvedin the conduct of the census. These may be either externalor internal stakeholders. Given the broad scope of the cen-sus, its importance in planning and the need to involve aconsiderable proportion of the population to complete the
census questionnaire, the community as a whole is clearly astakeholder in the census.
(a) Stakeholders within the census programme
The census operation in any country involves the move-ment of the census questionnaire (or the data from it) througha series of phases including, but not limited to, field opera-tions, processing, dissemination and evaluation. In this sense,each phase is a key stakeholder of the one preceding it, withdissemination being a stakeholder of evaluation to close a“quality circle”.
Identifying stakeholders is a useful starting point for iden-tifying critical dependencies when planning the census.Good and effective communication with these stakeholdersis essential to ensure that each phase of the census meetsthe needs of the others and that the resources of the statisti-cal agency are used most effectively.
The stakeholder relationship is not just linear (or circular,as described in the census cycle diagram above), but alsohas consequential implications. For example, the followingpoints describe some of the potential stakeholders for thefield operations phase. This is not exhaustive but illustrateshow stakeholders may be identified:
(a) Census evaluation. The success of the census enu-meration operation has a considerable impact on data qual-ity which is a prime concern of census evaluation. The cen-sus evaluation area is often responsible for analysis of cen-sus data to determine where data quality can be improved.This includes areas of the census form completed by censusenumerators;
(b) Census processing. Census processing dependencyon field operations is considerable. Some processing rulesand procedures are partly determined by enumeration pro-cedures and it is essential that good communication existsbetween the areas;
(c) Census dissemination. From a data quality point ofview, census dissemination is dependent on the enumera-tion being complete and maintaining, if not improving, fun-damental indicators such as underenumeration rates and re-sponse rates. Some census enumeration procedures maydetermine the nature and quality of particular data items;
(d) Other areas of the statistical agency, in particular thearea responsible for inter censal population estimates.
Each phase also has “internal” stakeholders. For example,within the field operations phase, the packing and transportof materials into the field is a stakeholder of the printingprocess. The recruitment of field staff is a stakeholder ofthe process for determining salary rates and so on.
(b) Other stakeholders within the statistical agency
In many countries the statistical agency will have regionaloffices spread throughout the country. In these cases, theregional offices are a key stakeholder as they play a vitalrole in supporting the field operations phase in their par-ticular region.

8
Clearly, there will be boundary issues, where some coun-tries include all activities relating to the census within thecensus programme while others maintain separate units else-where within the statistical agency that perform functionson behalf of the census unit.
It could be expected that these functions would empha-size specialized skills for which it is not economic to recruitseparate staff for the census project. Examples of these func-tions could include:
(a) Statistical methodology (design of follow-up samples,advice of quality monitoring sampling rates and so on);
(b) Information technology (evaluation of processingsystems, hardware and software maintenance);
(c) Public relations (training and advice on public rela-tions strategies and advertising campaigns).
There will also be stakeholders within the statisticalagency who use the census results as part of their statisticaloperations. These could include:
(a) Statistical analysts preparing material by further analy-sis of the census results. These groups could include na-tional accountants incorporating information on householdincome or housing stock into the national accounts;
(b) Client services, sales and marketing units identifyingand satisfying external clients’ needs;
(c) The area responsible for household surveys using cen-sus small area counts to update sample frames.
(c) The community
The community at large may be expected to have only anoccasional interest in the census that generally peaks aroundthe time of the carrying out of the census, or when initialdata from the census are released. Public communicationsactivities that focus on the benefits of the census at the timeof census enumeration and those that provide for wide pub-licity of significant results at data release are ways of en-gaging public interest.
While the community at large does not have a direct in-put into the planning of the census, the need for continuedcooperation of the public should be kept in mind through-out the process. Key areas of public concern are around theissues of confidentiality and privacy, the sensitivity of par-ticular questions and the amount of time required to supplythe information on the census form or to the census enu-merator.
Ideally, the confidentiality of information provided on thecensus by individuals will be protected by law. Censusrecords should only be used for statistical purposes and notfor general administration. This means that other govern-ment agencies should not be able to access individual cen-sus records and that the records are protected from scrutinyby courts or other judicial processes.
Questions on the census must be publicly justifiable andnot be too intrusive. People may be reluctant to provide re-liable answers or to provide answers at all if there is noperceived benefit. The same situation applies for intrusivequestions.
Data quality declines with the length of time taken to com-plete the questionnaire. While the time that might be takenmay not be apparent in interview situations, the size of aquestionnaire booklet may be an immediate deterrent in aself-enumeration census.
The needs and requirements of stakeholders should beused to establish the goals of the census. The needs of cen-sus data users have the highest priority. However, they mustbe balanced against the cost, data quality considerations andthe logistics of undertaking the census as assessed by op-erational staff, and what may be required to maintain publiccooperation and confidence.
The goals of the census generally revolve around;
(a) The topics to be collected;
(b) Confidentiality;
(c) Timeliness of data release;
(d) Data quality;
(e) The nature of the output;
(f) Trade-off between what topics can be collected and costs;
(g) The total cost of the census.
These goals interact with one another, thus the goalsshould state where the priorities lie. For example, there maybe a trade-off between what topics can be collected and theassociated costs.
Once key goals are established for the census they needto be communicated to the staff who should be encouragedto devise goals and strategies compatible with the overallgoals for the part of the census project on which they areworking. For example, the key goal of maintaining the con-fidentiality of information supplied by individuals will re-quire strategies to achieve this in almost all phases of thecensus, from enumeration to dissemination.
5. Developing project plans
Once the goals have been established and strategies iden-tified to implement them, more detailed planning begins.The undertaking of a census can be regarded as a singleproject. However, given the size and complexity of the cen-sus, it can be broken down into a series of related projectsthat are dependent on one another (see table I.1). To achievea comprehensive list of projects a simple framework intowhich tasks will be listed and sorted should be developed.This framework should be hierarchical and something simi-lar will be found in most project management texts or soft-ware. For the purpose of this handbook, the following basicstructure is used:
(a) Projects. The total set of tasks needed to achieve aspecific goal;
(b) Phases. The major project components;
(c) Activities. The phase components;
(d) Tasks. The smallest identifiable amount of work lead-ing to a deliverable;
(e) Milestones. Specific points in time at which key out-comes are expected and which measure a project’s progress.

9
Given the basic framework, the job becomes one of identi-fying each level, starting at the top and working down. It willoften take a number of iterations to get it right. For example,something may be identified initially as an activity but be-comes a phase after the project is considered in more detail,or because it increases in priority or complexity once theproject plans become clearer. More often than not the originalproject plan will change owing to unforeseen circumstances.
As the levels in the framework are filled with detail, peoplecan be assigned responsibility, and reporting and review ar-rangements established. Assigning responsibility in this wayis the first step in giving staff ownership of the process.
(a) Projects
Identifying and scheduling the various projects of the totalcensus cycle provides the basis for planning. Initially, thisshould be done at the highest level of the census cycle (e.g.,planning, preparation, enumeration, processing, dissemina-tion and evaluation) and then further developed into the dif-ferent phases that make up each of these projects. These phasescan then be further broken down to activities and finally tasksto establish resource estimates, assign tasks and responsibili-ties and confirm dependencies and timing of interrelated tasks.
(b) Phases
As an example, the census project 3. Field operations,shown in the project table below (table I.1), can be brokendown into several phases. A possible list of phases is givenin the following table but is only provided as a guide. It willvary from country to country depending on the type of cen-sus, size, and so on.
Once the phases have been identified and agreed, some-one is assigned overall responsibility for each phase. Oneperson may be responsible for several major phases, theimportant point being that each major phase is representedwithin the census management structure.
Also at this point, it is useful to establish the broad time-frame of each phase. This helps to clarify the relationshipsbetween them but also provides guidance when identifyingand scheduling activities and then tasks.
Identified milestones (see sect. (e) below) are useful inestablishing the end dates for phases. For example, if it isknown that printing must be completed by a certain date toallow sufficient time for materials to be distributed, thenthat date would become the end date for phase 3.07 Materi-als, as shown in table I.2.
Project Includes
1. Planning Setting strategic directions for the entire census programme and developing
project plans.
2. Preparation Establishing the basis of enumeration, form design and testing, mapping,
and printing the census forms.
3. Field operations Recruiting and training field staff, public relations campaigns, form
distribution and return .
4. Data processing Recruiting and training data processors, selecting and managing premises,
processing forms.
5. Dissemination User consultation, product development, marketing and sales strategies.
6. Evaluation All evaluation plans and processes.
Table I.1. Project Definition
10
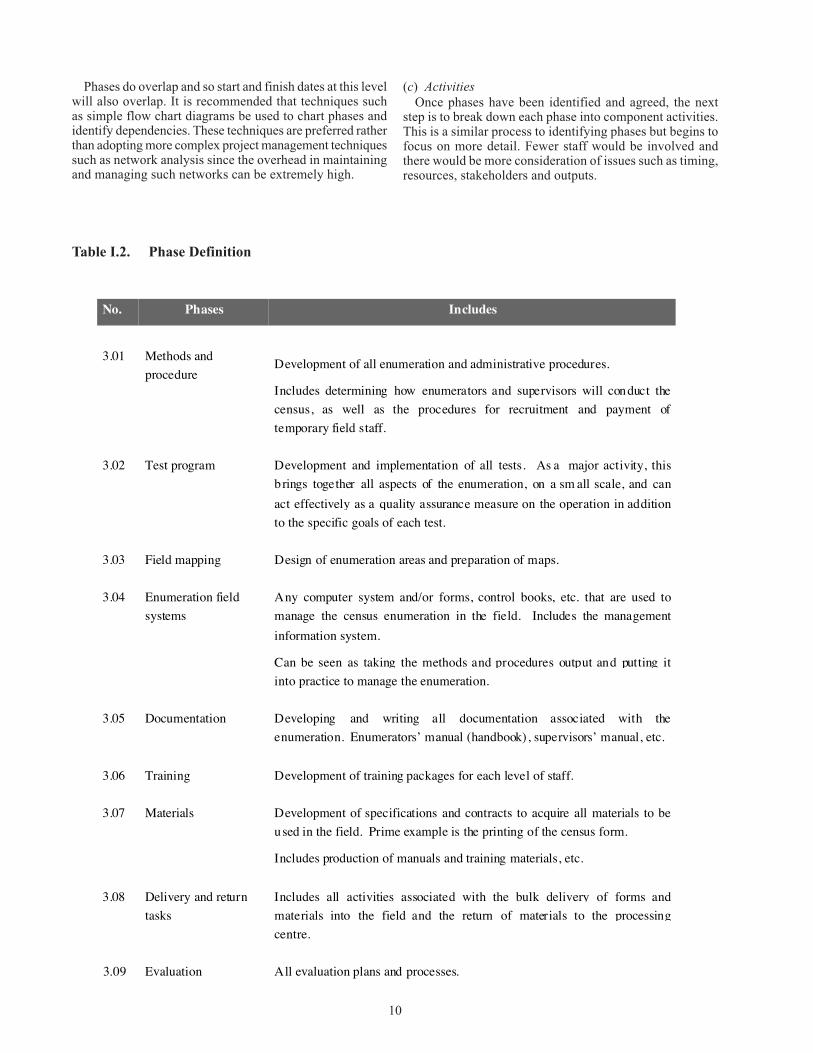
Phases do overlap and so start and finish dates at this levelwill also overlap. It is recommended that techniques suchas simple flow chart diagrams be used to chart phases andidentify dependencies. These techniques are preferred ratherthan adopting more complex project management techniquessuch as network analysis since the overhead in maintainingand managing such networks can be extremely high.
(c) ActivitiesOnce phases have been identified and agreed, the next
step is to break down each phase into component activities.This is a similar process to identifying phases but begins tofocus on more detail. Fewer staff would be involved andthere would be more consideration of issues such as timing,resources, stakeholders and outputs.
No. Phases Includes
3.01 Methods and
procedureDevelopment of all enumeration and administrative procedures.
Includes determining how enumerators and supervisors will conduct the
census, as well as the procedures for recruitment and payment of
temporary field staff.
3.02 Test program Development and implementation of all tests. As a major activity, this
brings together all aspects of the enumeration, on a sm all scale, and can
act effectively as a quality assurance measure on the operation in addition
to the specific goals of each test.
3.03 Field mapping Design of enumeration areas and preparation of maps.
3.04 Enumeration field
systems
Any computer system and/or forms, control books, etc. that are used to
manage the census enumeration in the field. Includes the management
information system.
Can be seen as taking the methods and procedures output and putting it
into practice to manage the enumeration.
3.05 Documentation Developing and writing all documentation associated with the
enumeration. Enumerators’ manual (handbook), supervisors’ manual, etc.
3.06 Training Development of training packages for each level of staff.
3.07 Materials Development of specifications and contracts to acquire all materials to be
used in the field. Prime example is the printing of the census form.
Includes production of manuals and training materials, etc.
3.08 Delivery and return
tasks
Includes all activities associated with the bulk delivery of forms and
materials into the field and the return of materials to the processing
centre.
3.09 Evaluation All evaluation plans and processes.
Table I.2. Phase Definition

11
Using the example given above, table I.3 shows the ac-tivities that may be identified in the phase of 3.03 Fieldmapping.
Each identified activity is assigned an activity leader whois responsible for identifying all the tasks associated withthe activity, liaison with other activity leaders, as necessary,and preparing detailed schedules and plans.
(d) Tasks
The last step is to identify specific tasks. By this stagemany tasks will have been identified as a result of develop-ing phases and activities, and it is now a case of insertingthe tasks into the appropriate activity.
However, it is still useful to go through a process similarto that undertaken with phases and activities, to ensure thatevery possible task is identified at this stage, and does notcome as a surprise further down the track.
Using the same example developed above, table I.4 showsthe tasks that may be identified for the activity Enumera-tion area design in the phase of Field mapping.
The list in table I.4 is not exhaustive but is used to illus-trate the idea of breaking down activities into tasks. Re-sponsibility for each task would be assigned, and items suchas start/finish dates, resources and outputs (e.g., a manualor computer process) identified.
For a more detailed and comprehensive model, see annexII, which contains a model census project timetable pro-vided by the Australian Bureau of Statistics.
Identifying and scheduling tasks (i.e.,, filling the frame-work with detail) cannot be done in an ad hoc manner. Thereneeds to be a planning process to ensure that all tasks areidentified in an orderly way and consistent with the overallmanagement of the census operation. The use of a frame-work such as the one described above provides a good andmethodical basis for this objective.
As mentioned above, each project, phase, activity and taskwould have someone responsible for it. However, there isalso a need for coordination and communication betweenthe various activities and this is where identifying and sched-uling tasks is linked with the census management structure(see sect. D below). The census management team needs toagree on how progress will be reported for each of the ma-jor activities and to what level of detail for the various steer-ing and/or planning committees that have been establishedto provide advice on aspects of census management (seesect. D).
At the project and task level, project leaders need to en-sure that their dependencies and successors are known andliaison established. For example, it does no good to haveclearly identified and scheduled the mapping tasks above ifthe map production will be too late for the maps to go intothe field.
No Phase Activity
3.03 Field mapping 3.03.01 Enumeration area design
3.03.02 Enumeration area file
3.03.03 Management area design
3.03.04 Map production
3.03.05 Enumerator record book preparation
Table I.3. List of activities

12
(e) Milestones
A milestone is a point in time that identifies when signifi-cant points of the project should have been reached. Mile-stones can equate to any part of the project although theyare generally associated with the completion of a set ofproject deliverables. Completion of all the tasks in an activ-ity may be considered a milestone, or the completion of anentire phase. The use of milestones provides focal dates forthe project team.
(f) Issues
There are issues associated with each activity and taskthat need to be taken into account in project planning. Ob-vious issues are timing and resources. Less obvious issuesinclude risk management and goals. As part of the planningprocess, it is useful to identify the issues associated withactivities and adopt a consistent approach in listing themfor all activities. Different project management approacheswill offer different ways of achieving this objective.
One method is to use an issues table, one of which is pre-pared for each activity. The issues table simply lists a num-ber of generic issues that each activity leader considersagainst his or her activity. The purpose of this table is toensure that issues such as evaluation and testing are not for-gotten and to provide a basic and uniform set of informa-tion about the project available to all staff.
Table I.5 is a sample issues table with descriptions of thetype of information that might be recorded. The last col-umn is presented as a list of questions that a typical projectleader might ask about a particular issue as it relates to theproject. The table may be a simple form on paper or it maybe done in a computer system. In some cases, the informa-tion for each issue may be recorded in the table itself or thetable may simply be used to tell readers where the informa-tion about that issue may be found. It is flexible.
Completing an activity table for each activity is substan-tially a one-time exercise. A complete set of activity tablesacts as a ready reference for the entire operation, as well asan index to where more detailed information can be found.
(g) Risk managementRisks are events that could occur and in some way have a
negative impact on the success of the census. An examplerisk event may be that sufficient enumerators for a particu-lar geographic area cannot be recruited. The risk event mightnot occur, but risks with significant likelihood should bemanaged explicitly by developing fully detailed plans par-allel to the census plan on the basis that the risk will eventu-ate. There may be more than one parallel plan for a particu-lar risk, depending on possible times of risk actualization.
Risk management is essential because of the importance ofthe census and the fact that it is an infrequent exercise. The suc-cess and/or failure of the census may depend on the implemen-tation of the plans associated with these risks if they eventuate.
No Activity Tasks
3.03.01 Enumeration area
design
3.03.01.01 Review previous census methods, procedures and
outcomes.
3.03.01.02 Establish or review enumeration area design
principles and criteria.
3.03.01.03 Prepare enumeration area design manual.
3.03.01.04 Establish enumeration area update methods,
procedures and processes.
3.03.01.05 Test enumeration area design processes.
3.03.01.06 Implement and monitor enumeration area design.
3.03.01.07 Evaluate enumeration area design.
Table I.4. List of tasks

13
No Item Name Description Questions
1. Overview Describe enough background to the
activity for people to quickly gather
where it fits in.
How would I describe this activity to
someone in 2 or 3 sentences?
2. Approval Note if there has been, or should be,
any formal approval for this activity.
Does this activity need to be approved
by anyone?
3. Goals/objectives Describe the goals of the activity. What is the purpose of this activity?
Why do it? Is it important? How
does this activity add value to what
we are doing?
4. Deliverables/output What the end result of the activity is.
This may be a specification
document, a manual, a computer
system, etc. They may be inputs to
other activities.
What is actually produced by this
activity?
5. Schedule/dates Start and finish dates as well as any
key dates along the way. This may
simply be a file that progress is shown
in or it may be a separate document.
What do people need to know about
the timing or scheduling of this
activity? Are there any critical dates
involved?
6. Stakeholders People relationships. The people or
areas, including outside the agency,
are important to this activity. They
may be dependent on this activity or
vice versa.
Who would I need to involve in
planning, developing or implementing
this activity? Who is the client?
7. Dependencies Process relationships. The activities
or tasks, including other areas, depend
on this activity or vice versa.
What inputs do I need? Where do the
outputs of this activity go?
8. Key tasks Describe the key tasks that make up
this activity.
What tasks have to be done for the
activity to be completed?
9. RisksDescribe the potential risks, their
likelihood and contingency plans.
What can go wrong and how likely is
it? What are the c ritical success
factors?
10. Specifications These may be technical specifications
as for an information technology
application or a description of what is
involved in this activity. Will depend
very much on the nature of the
activity.
What do I have to specify in order for
the activity to get done? What would
I have to tell someone about how to
go about it?
Table I.5. Activity issues

14
No Item Name Description Questions
11. Resources Staffing, budgets, costs, etc. Staffing costs
refer to people working on the activity and
do not have to be exact.
How much is this activity costing in terms
of people and money?
12. Training Training that may be required to enable
this activity to be done.
What skills would someone need to do this
activity? For example, software
(PageMaker, Freelance, etc.), acceptance
testing, negotiation and procurement.
13. Performance
measures
The performance measures against which
the success of this activity will be
measured.
How will I know if this activity has been
successful?
14. Management
information
Information that can be extracted from the
activity to inform people about progress,
etc. and also to provide data for analysis.
(number of people paid, number of urban
enumeration areas, etc.).
What information from this activity will
help people know how things are going or
assist in analysing the activity later?
15. Testing The testing plan for the activity. How will I test this activity to be confident
that it will work or that the right outcomes
will be achieved?
16. Evaluation The evaluation plan for the activity. How will this activity be evaluated? How
will other items in this table contribute to
the evaluation? How has previous
feedback been dealt with?
17. Reporting Information about the level and detail for
reporting on this activity. Name and
location of relevant project management
software file.
What do I have to report, and how often,
so that people know the status of this
activity?
18. Documentation Describe what documentation exists about
this activity. This may be other items in
the table such as specifications, etc.
What would I tell someone who wanted to
learn about this activity to read?
19. Service agreement Details of any service agreement
associated with this activity.
If other persons are doing some work on
this activity for me, what agreement
should I have in p lace with them?
20. Closure How the activity is closed. What occurs
when the activity is finished.
How do I know when this activity is
finished? Who needs to be told?
Table I.5. Activity issues (continued)

15
6. Monitoring project plans
Monitoring the census project plans as described aboveand managing the information flows is an important part ofcensus planning. It is imperative that the overall projectplan is monitored closely and that appropriate feedback isdelivered to all levels of management. More often than notthe original project plan will change owing to unforeseencircumstances (e.g., delays in arrival of equipment and tech-nical difficulties) or the identification of additional tasks.
It is therefore important that there is a feedback loop thatcompares actual results with the plan and assesses the im-pact of any deviations to target dates and costs. It is veryimportant that these feedback mechanisms are based on goodcommunication practices.
The results should be reviewed on a regular basis remem-bering that if these reviews are done too frequently the over-head becomes high. However, if done too infrequently, cor-rective actions may not be taken promptly enough.
As stated above, the project plans comprise projects,phases, activities, tasks and milestones.
The most important components to track are:
(a) The calendar time for completing a task;
(b) Resource usage per task;
(c) Cost per task;
(d) Milestones.
This can be done using a Gantt chart that graphically dis-plays schedule-related information. In the typical Ganttchart, activities or other project elements are listed downthe left side of the chart, dates are shown across the top andactivity durations are shown as date-placed horizontal bars.There are a variety of off-the-shelf software packages thatcan be used to produce Gantt charts. An example is shownbelow.
For a more descriptive example of a census project Ganttchart, which details all the relevant steps that can be takento ensure the effective monitoring of the census project, seeannex III, in which an example of a Gantt chart from theAustralian Bureau of Statistics is set out.
(a) What to review
Status information
Status information is typically recorded at periodic meet-ings attended by all key project participants. The informa-tion normally includes:
(a) Status of tasks (not started, started, or completed);
(b) status of important milestones;
(c) Progress (Percentage completed, or, preferably, esti-mated time to complete);
(d) Actual start and end dates.
( a ) Phase .
(b) Activity.( c ) Task – milestone.
Figure I.2. Gantt Chart

16
their day-to-day management of the project but they shouldalso be able to get down to the task level if necessary.
Executive officer
One of the roles of the executive officers is to oversee theprogramme through to the generation of target outcomes.Therefore they may only be interested in data at a level higherthan task or activity and only require concise status reportsthat answer the questions: “Are we ahead or behind sched-ule? By how much?” The executive officers require clear,succinct information showing just where the project standsand what actions, if any, are required of them.
7. Developing a budget
As mentioned earlier, the total budget for census opera-tions needs to be established early to enable other planningto go forward. The census is highly cyclical, with resourcerequirements peaking in the enumeration and processingyears. Also, countries with short census cycles (e.g., five-year intervals) may have some phases (e.g., evaluation forthe current census and planning for the next one) overlap-ping in some years and resources will need to be allocatedfrom different census budgets. An example of a census bud-get cycle is illustrated in figure I.3.
In this particular example, the census is held in 2000/01,with peak expenditure comprised mainly of salary costs forenumerators and data processors. The increase in the previ-ous year is mainly attributable to the cost of printing censusforms and equipment purchases. However, it should be notedthat there is ongoing expenditure in the other years to caterfor the planning, preparatory and dissemination phases.
In developing a census budget, sufficient resources need tobe allocated to each of the different phases (i.e., planning,preparation, field operations, processing, dissemination andevaluation). Funds allocated and used in an effective manneron planning and preparation will result in savings in efficientenumeration and processing operations. The resource needsof the dissemination phase need to be realistically assessedand quarantined from the impacts of other census operations.Whatever may have been the effectiveness of the enumera-tion and processing operations, the users will judge the cen-sus on the ability to deliver the data. Failure to deliver censusdata on time and in the way desired by users will reflect onthe census programme as a whole.
There are various ways of estimating budgets:
(a) Budgets may be based on the same allocations re-ceived for the previous census, brought up to current pricesby adjusting for:
(i) Inflators for increased costs (e.g., salary increases),
(ii) Deflators for efficiency gains (e.g., implementa-tion of new technology),
(iii) Policy changes,
(iv) Population increases.
Analysis of variations
After recording status information, the impact of any de-viations on project schedule, cost and resources should beanalysed. In particular, special attention should be given to:
(a) Slippage of critical tasks leading up to milestones;
(b) Critically late tasks, indicating that the estimated timeto complete is later than the planned finish date;
(c) An overcommitment of resources in the remainder ofthe project;
(d) Too many tasks appearing to be “nearly complete”,otherwise known as the “99 per cent complete” syndrome.Managers must be able to realistically estimate time tocompletion;
(e) Rebaselining. If it is estimated that the completiondate of a task cannot be met, then the task must be extendedon the Gantt chart and in other documentation. This mustbe a highly visible process, with rebaselined tasks clearlyidentified in the Gantt chart. Originally expected comple-tion dates should remain on the chart.
(b) What to report and to whom
The Gantt chart, which is generally a clear means of com-munication, can be used as the main reporting vehicle. Dif-ferent levels of management will require differing amountsof detail on project plans. A generic management structureis shown in section D of the present chapter. Listed beloware some of the levels outlined in that section and theamounts of detail on project plans they may require.
Project team
The project team is responsible for the completion ofproject tasks at the agreed timetable and acceptable levelsof quality. Therefore, they will need reports in the finestdetail that show the progress of each individual task. Theproject team should agree on what needs to be monitoredand the frequency of reviews that should be conductedthrough regular meetings. These regular meetings can pro-vide a formal mechanism through which reviews are con-ducted. However, it is important that the project team doesnot rely solely on these meetings to monitor progress. Main-taining regular contact and open communication channelsin their day-to-day activities with all stakeholders in theirown project team, and other dependent project teams, is criti-cal to successful project monitoring.
Project manager
Project managers are ultimately responsible for all tasksdefined in the project plans and are accountable for deliver-ing target outcomes and meeting the project budget and de-livery schedule. Therefore, they will need reports at all lev-els of the project plans (i.e., phase, activity and task). Theywill generally use reports at the phase and activity level for

17
(b) Budgets may be based on the previous expenditurepattern, again adjusted as above;
(c) Budgets may be zero based using costing models toestablish the requirements for each of the phases.
Usually, the largest component of the census budget issalary costs. Costs for field enumerators and data-process-ing staff make up a significant proportion of the overall sal-ary costs. Therefore, special attention should be given whencalculating the salary costs associated with these two ac-tivities. The methods for calculating these costs are coveredin more detail in chapter 3, section B, for enumerators, andchapter 4, section C, for data-processing staff.
Once the budget has been established, funds should beallocated to particular financial years in the census cycle.This should then be broken down into the different projectswithin the overall census programme (e.g., planning, enu-meration and processing) and itemized showing the variouscategories of expenditure.
Monitoring the budget
Once funding is received, it is necessary to monitor ex-penditure against funding for the current and future years.It is recommended that, while budgets may be compiled ona yearly basis, they be monitored on a quarterly or even amonthly basis, with projections of the total expenditure forthe current financial year.
Each project’s performance should be monitored againstbudgeted funds. Monthly reports should be produced foreach project, showing the annual budget, expenditure to dateand estimates of expenditure for the rest of the current fi-nancial year and future years in the census cycle.
It is important that a process of estimating expenditure infuture years is undertaken on a regular basis. This providesthe forum for the project managers to review plans for thecurrent and future years of the cycle and to bid for changesto resource levels.
It is recommended that forward estimates be prepared andreviewed on a yearly basis for all years of the census cycleand submitted to the project board for consideration. Whenpreparing forward estimates, project leaders should reviewprojected expenditure thoroughly and provide full justifica-tion for any variations they are seeking.
The forward estimates process can provide the facilitywhere:
(a) Managers can bid for increases or indicate savings inresources over time and/or reallocate expenditure betweendifferent financial years or items;
(b) Bids can be considered by senior census manage-ment, taking all bids for all years into account at one time.
0
20
40
60
80
100
120
Years
Cost
1995/96 1996/97 1997/98 1998/99 1999/00 2000/01 2001/02 2002/03 2003/04 2004/05
Figure I.3. Census budget cycle: expected expenditure patterns

18
As stated in the Principles and Recommendations,
“No universal system of census budgeting and cost control can besuggested since financial practices vary greatly among countries.However, a few generally accepted principles can be noted. Effectiveplanning and control of the various census operations are not possiblewithout a v ery careful financial estimate of t he cost of each censusoperation, including all of its components, no matter how small.
“The census plan as executed will certainly change in a number ofrespects after t he making of the original calculations. Consequently, aperfect correspondence between the estimates and the final costs is not tobe expected. Indeed, the development of the census budget is usually anincremental process in which rough initial estimates are replaced bymore detailed and precise statements of resource requirements.Throughout the period of census taking and compilation of censusresults, the budget will have to be re-examined and performancecompared with plans. With detailed information on expenditure, thegovernmental and census authorities will be better able to exercisecontrol over keeping the development of census operations within thecensus budget as well as to assess and control the effectiveness andefficiency of these operations. This information is also very useful forstudying possible (Principles and Recommendations for Population andHousing Censures (paragraph 1.59 and 1.63.)), improvements in censustechniques and census methodology.”
——— aPrinciples and Recommendations for Population and Housing Censuses, paras. 1.59 and1.63.
The estimates provide a formal mechanism for seniormanagement to be aware of shortfalls in funding or surplusfunding and for management to consider any significantchanges in planned resource use.
Table I.6 gives an example of the items that can be in-cluded in a census budget.
In the majority of countries, the largest costs in the cen-sus are those associated with the enumeration activity andsalary for data-processing staff. Table I.7 shows the approxi-mate breakdown of costs by major items. This breakdownwill vary between countries and depend on such factors aslabour costs but is included to give managers an indicationof what the major cost items are.

19
Item Includes
Salaries Salaries for both permanent staff from the census agency, and
temporary field operations and data-processing staff. These are
calculated separately and usually shown as separate items in
spreadsheets. They should include any allowances for overtimeand/or superannuating payments if appropriate.
Travel and subsistence All fares and per diem costs.
Vehicles Cost of purchase and/or hire of cars, boats or aircraft.
Office consumables Stationary, folders pens. Etc.
printing Questionnaire All printing costs (paper, printing) associated with the census
questionnaire.
Manuals All instructional manuals.
Mapping
Data maintenance Costs associated with maintaining and updating map data.
Equipment Computer hardware, etc.
Development and Software development costs.
Printing Map printing.
Form packing and transport Distribution and return of census forms and associated material for
field operations.
Enumerator equipment Satchels, pens, clipboards.
Public relations Publicity costs (e.g., pamphlets, posters).
Training Production of training aides (e.g., videos).
Consultants/contractors Cost of external consultants providing advice and/or services.
Publications Printing and development costs of publications containing census
results.
Product development Development costs for census output products.
Telephone and postage Ongoing telephone and postal costs.
Storage Storage costs for census forms and maps.
Security Costs associated with securing census forms and data.
Taxes Any applicable government taxes.
Furniture Office furniture.
Equipment purchases
Office machines Faxes, photocopiers, etc.
Computers Computers required for data processing and census agency staff.
Software licences Cost of purchasing off-the-shelf software.
Software development Cost of developing census-specific software.
Office lease Any rental costs of buildings required for data processing, etc.
Office running costs Fuel, electricity, cleaning, etc.
Office equipment expenses Cost of equipping offices.
Travel Cost associated with the travel of census personnel.
Table I.6. Items included in a census budget

20
C. QUALITY ASSURANCE
1. Introduction
In the census context, there are four attributes of qualityassurance:
(a) Relevance;
(b) Cost;
(c) Timeliness;
(d) Data quality (or accuracy).
The essential quality attribute of relevance of census out-put, and how to assure it, has been discussed in section Aabove. Clearly, meeting targets for cost, timeliness and ac-curacy will be hollow achievements if there is not a highdegree of national relevance in what the census produces.These three attributes (cost, timeliness and accuracy) areessentially trade-offs. Higher accuracy can be obtained forhigher cost and poorer timeliness and so on. Quality is rela-tive, and in the end is based on what is acceptable, or fit forthe purpose, rather than a concept of absolute perfection.
Quality is the outcome of processes, and deficiencies inquality (for example, delays in processing) are usually theresult of deficiencies in process rather than the actions ofindividuals working in that process. The key to quality as-surance and improvement is to be able to regularly measurethe cost, timeliness and accuracy of a given process so thatthe process can be improved when a fall in quality is indi-cated. The focus of quality assurance is to prevent errorsfrom reoccurring, to detect errors easily and inform theworkers so that they do not continue. This simple feedbackloop is represented in figure I.4.
Being iterative, the quality circle is particularly applicableto tasks that are highly repetitive such as the processing phaseof the census. However, the general principle applies to allprocesses. For example, there is less opportunity to evalu-
ate performance, identify problems and implement correc-tive actions in phases such as enumeration owing to timeconstraints, the once-only nature of some of the processesand communication issues. However, it still can be estab-lished with careful planning and documentation in advanceof the census.
It is important that a complete evaluation takes place atthe end of each phase of the census. This should be doneparticularly for phases such as enumeration, so that the or-ganizational learning inherent in the quality circle is carriedforward to the next census.
Since people play a key role in most census processes,they are in a good position to identify problems with qual-ity and provide solutions. Quality is therefore not just theoutcome of mechanistic applications of predetermined mea-sures but relies on a combination of:
(a) Established, documented processes;
(b) Systems to monitor the outcomes of these processes;
(c) Active encouragement by management to involve staffundertaking the processes in identifying and resolving defi-ciencies with quality.
While elements of the quality circle, such as mechanismsto monitor quality, may have some superficial resemblanceto some of the elements of traditional quality control ap-proaches, they are quite different. Traditional quality con-trol is based on correction of error after the event, whereasthe emphasis of the quality circle is on improving the pro-cess that caused the “error”, which may be any of the cost,timeliness or accuracy attributes falling below specified lev-els. A simple error correction process may suffer from anyof the following:
(a) It adds significantly to the cost of the operation;
(b) Errors in the inspection process can fail to detect trueerrors or falsely identify errors;
(c) The correction process can introduce errors into thedata;
Measure quality
Identify mostimportant
quality problem
Identify rootcauses ofproblem
Implementcorrective
action
Figure I.4. Quality assurance circle

21
(d) Operators take less responsibility for the quality oftheir work, believing it to be the responsibility of the in-spectors;
(e) Where a sample of units are inspected, the quality ofdata is only ensured for those units that are inspected.
The emphasis should be on process improvement ratherthan correction. Therefore an important aspect of qualitymanagement may not be to correct errors detected throughthe quality monitoring process unless they are of a severenature or are generally applicable. For example, a generallyapplicable error could be a systems error that miscodes ev-ery occurrence of a common event. Resources are thus bet-ter focused on improving processes and thus overall qual-ity. An example of how quality assurance can be applied tothe census can be found in annex IV, which shows the stepstaken by the Australian Bureau of Statistics to apply a qual-ity management strategy to the 1996 census.
2. The role of managers
Managers have a vital role in establishing quality. Thebiggest challenge to managers is first to establish a culturewithin the census agency that has a focus on quality issuesand to obtain the commitment of staff to strive to achievehigh-quality goals. At the same time, managers need to beaware that to achieve high-quality outcomes they need togive their staff responsibility to achieve these outcomes.Managers who do not delegate responsibility will find itdifficult, if not impossible, to establish teams that strive forhigh-quality outcomes.
Managers must ensure that staff understand the philoso-phy behind the approach to quality. As mentioned above,staff involvement is a vital ingredient to quality improve-ment. Therefore, an environment needs to be establishedwhere staff contributions are expected.
The second part of their role is to ensure that clients’ ex-pectations are known and that these expectations are builtinto planning objectives and into the systems that are todeliver them.
Thirdly, processes need to be documented and understoodby the staff implementing them. Systems and processes forimplementing the quality circle also need to be documentedand put in place. Questions such as how quality is going tobe measured, who is involved in identifying root causes ofproblems with quality, and how the process improvementsare going to be implemented need to be answered. Thesewill vary greatly depending on the nature of the process.Appropriate quality assurance techniques for each phase ofthe census are summarized below and dealt with in greaterdetail in other sections of the handbook.
The greatest test of management commitment to genuinequality improvement will occur in how management ap-proaches problem solving. Staff will monitor managementresponses closely and adjust their own behaviour accord-ingly. Staff will act in accordance with how they see man-agers behave rather than what they hear managers saying.
Managers who always react to problems by seeking outpeople to blame, or who establish systems that focus dis-proportionately on the merits or demerits of individuals at
Item Australia Kyrgyzstan Kazakhstan Cambodia
Salaries enumerators 24 16.3 29.06
Data processing 15 4.8 2.45
Census agency staff 14 15.5 2.95 25.3(for dataprocessing and
enumerators)
Hardware and softwarefor data processing
6 34.6 2.05 26.3
Form printing 3 6 5.38
Mapping 3 2.8 1.17 2.6
Office equipment 3 3.5 0.86 1.3
Building costs 3 1.5
Transport and per diempayments
12.8 19.9 6
Other costs 29 2.2 36.2 38.5
Table I.7. Percentage of costs spent on items

22
the expense of the team, are sending messages that are con-trary to the thrust of quality improvement. An environmentwhere the emphasis is on fault-finding, rather than on find-ing solutions to problems, or on excessive competition, willassure that staff cease to be part of the solution and becomepart of the problem. Managers need to take upon themselvesthe responsibility for problems, as they are ultimately re-sponsible for the systems that caused the problems. Theyshould not seek to transfer the problems to lower-level staff.
However, even in the best managed processes, there arecircumstances where individuals can be justifiably blamedfor impacting on quality. These may be individuals who areincapable of performing their duties, deliberately flaunt pro-cedures or even deliberately sabotage the process. Theseindividuals need to be dealt with by management and insome circumstances their employment should be terminated.Managers must deal quickly with these cases and act in aconsistent manner. By doing so, managers will demonstrateto all other staff their commitment to quality.
To be successful, it is necessary to create a culture in whicheveryone has the opportunity to contribute to quality im-provement. Most of the staff engaged in census operationalwork undertake routine tasks, and it is up to management tohelp them see the bigger picture, to motivate them and toencourage them to assume ownership of their work. Thiscan be done by promoting a commitment to quality improve-ment and by adopting a consistent approach to management.
3. Quality improvement and the census
The quality circle can be applied to the entire census cyclewith:
(a) Performance in the previous phase being evaluated atany given level of detail;
(b) Problems with quality ranked in order of importance;
(c) Root causes identified and corrective action imple-mented.
The dependencies in the census cycle are represented infigure I.5.
It is worth noting that it is equally feasible to invert allthe arrows in the diagram and read it in reverse order with-out significantly changing the outcome in terms of quality.Also, it is possible to start at any point in the diagram andachieve the same result.
The following sections outline the way in which the con-cept of a quality circle is superimposed over the census cycle.Much of the discussion on form design, enumeration, pro-cessing and dissemination is in terms of relevance and ac-curacy. However, these are subject to constraints of timeand cost that may be established prior to commencing thecensus cycle. These are discussed briefly below and ingreater detail in the relevant sections of the handbook.
(a) Topic selection
The first step in managing the quality of the product (i.e.,the statistics to be produced) is to ensure that the productwill be relevant. The key process is extensive consultationwith actual and potential users of census information. The
key success factor in this process is full, frank and opencommunication with users and all areas concerned with thecensus (in particular, subject matter and classification ex-perts).
As should be expected, users are reluctant to propose theirneeds for a future census until they have been able to assessthe extent to which their current needs have been satisfiedby the output from the previous census. This should be seenas an evaluation process feeding into the current cycle - thefirst step of quality management.
(b) Form Design and Testing
The next quality management task concerns the testingof each census question and the testing of the design of theform. Again, the quality circle approach is used, with theresults of each test being analysed and evaluated before be-ing fed into further design and testing.
The following areas are the key internal stakeholders ofthe form design process and their requirements need to betaken into account:
(a) The dissemination team, to ensure that the questionsasked will deliver the data to meet the needs of users;
(b) The subject matter specialist team;
(c) The team responsible for development of the pro-cessing system. For example, positioning of text and delin-eation of response areas will be dependent on data captureand the processing methodology to be adopted. It is criticalthat there is ongoing coordination between the form designand processing areas;
(d) The field operations team, which is responsible fortraining the enumeration workforce and printing the form.
(c) Field operations
The quality management process continues throughout thedesign of the census field operations. These are tested, asfar as possible, in conjunction with form designs testing.
The key internal client of field operations is processing.However, field operations can also impinge on other areassuch as dissemination and classification and subject matterareas where certain concepts such as what constitutes adwelling is implemented during the field operations phase.
Several components of field operations can be subject tospecific quality circle mechanisms as these are likely to takesome time and involve iterative processes. These compo-nents include:
(a) The demarcation of enumeration areas;
(b) The map production;
(c) Form printing, where a sample of forms is rigorouslytested for adherence to standards.
Quality monitoring should be established for each of thesecomponents and mechanisms put in place to ensure that theoutcomes of the monitoring are used to improve processes.

23
It is more difficult to implement the quality circle duringactual enumeration, owing to the very tight time constraints.However, this can be achieved by:
(a) Clearly establishing the aims of the field operationsphase;
(b) Applying thoroughly documented procedures;
(c) Ensuring that the enumerators understand their rolethrough appropriate training and providing inspection ofcorrupted forms;
(d) Providing opportunities for field staff to be observedoperating on the job so that feedback can be given and re-training undertaken.
However, it has to be acknowledged that during the ac-tual carrying out of the enumeration this approach tends toidentify “problem enumerators” rather than systemic or pro-cess errors. This means that evaluation following collectionis vital. The evaluation should attempt to capture the expe-riences and suggestions of a range of enumerators and otherfield staff so that improvements can be made to the subse-quent census.
A general overview of the quality of enumeration can beobtained through:
(a) The use of techniques such as post-enumeration sur-veys to gauge the level of under-enumeration of people anddwellings;
(b) Feedback from field staff;
(c) Measures of the quality of any coding undertaken byfield staff;
(d) Mechanisms that may be in place to handle queriesfrom the public.
The effectiveness of the public communication strategymay be assessed by the amount of press coverage (positiveand negative) of the census and follow-up surveys to testthe reaction to particular advertising.
(d) Processing
The key clients of processing are the dissemination areaand the areas of the country’s statistical agency responsiblefor maintaining standard classifications and those with spe-cialist subject matter knowledge.
Evaluation1. Data quality
2. Process3. Products/services
Dissemination Topic selection
Classificationand subject
matterspecialists
Data processing Form designand testing
Field operations
Figure I.5. Quality circle dependency chart

24
The dissemination area depends on the processing teamto obtain data in an agreed format, and compiled to agreedquality standards. This is necessary so that the data can beused in dissemination systems.
Since the census is part of an overall national statisticalsystem, data from the census are likely to be used in con-junction with data from other collections. Thus the classifi-cation and subject matter specialist areas, which are respon-sible for those other collections, need to be satisfied that thecoding, editing and other data transformation processes areconceptually sound and deliver data of acceptable quality.
Extensive testing of processing systems must be under-taken in advance of the census. Coding processes and train-ing packages need to be prepared and tested using the typeof staff likely to be involved in the operations. The process-ing phase gives the fullest scope for the use of quality im-provement techniques, as many of the processes in this phaseare repetitive and take a reasonable amount of time. Thisenables the quality circle to go through much iteration. It isvital that structures are put in place not only to monitor qual-ity but also to involve processing staff in the identificationof problems with quality and in proposing solutions.
It is generally not possible for processing to improve theaccuracy of census data. At best, processes such as editingmay reduce some inconsistencies within the data. However,in the end the data coming from the processing system willnot be of any better quality than the information suppliedon census forms. Much effort can be expended in correct-ing apparently inconsistent or inaccurate census data withno real improvement in the fitness for the purpose of thedata. It may be a better strategy to educate users to acceptslight inconsistencies in census data, rather than develop-ing highly complex procedures that may introduce othererrors and impose heavy costs in terms of delay in releaseof the data, and cost to the community.
(e) Dissemination
Census dissemination can easily be overlooked in the chainof providing a quality outcome for the census as manage-ment attention is diverted to the costly and risky enumera-tion and processing operations. The dissemination area isresponsible for the timely delivery of products and servicesto the census data users. Therefore insufficient planning andresources for this phase can have the effect of delaying therelease of the data and thus compromising the overallachievement of the census objectives. The disseminationphase should also be regarded as an ongoing process thatwill service the needs of users over a long period of time.
Management of the quality in census dissemination is drivenby concerns to (a) deliver relevant products and services while(b) maintaining accuracy of the data, and (c) timeliness andpredicability of data release within agreed cost constraints.
The first of these objectives is to provide relevant prod-ucts and services. This can only be done by reviewing theexperiences of the previous census products and services
and by user consultation processes with both current andpotential users of census data.
The second objective is to ensure that the data suppliedfrom the processing system is accurately transformed intooutput products. A quality assurance strategy to ensure thatdata tabulations and transformations are carried out accu-rately needs to be documented and followed. The qualitycircle approach to these processes needs to be applied andany gaps identified and corrected through extensive testingprior to the census and ongoing process improvement dur-ing the dissemination phase.
The third quality objective for dissemination is the timelyand predictable release of data from the census. While thisis the responsibility of all phases of the census programme,special responsibility resides with the dissemination area.The dissemination area needs to be realistic about releasedates and ensure that these are communicated to clients earlyso as to manage client expectations. The involvement ofstaff actually responsible for the dissemination phase indevising these dates is recommended where this is possible.Dissemination systems and processes need to be available,documented and tested prior to the release of data from theprocessing phase.
(f) Evaluation
In the present chapter, evaluation has been considered asthe last stage in the census cycle. However, it is also pos-sible to consider the evaluation of one census cycle as be-ing the first step in the following census cycle. Similarly,evaluation of one process within a census cycle could bethe first stage in the next process of the same census cycle.
All aspects of the census programme should be evaluated.The strengths and weaknesses of each task should be identi-fied and action points proposed for future census managers.
Evaluation of the accuracy of the census data should alsobe undertaken, to the extent possible, by comparing the cen-sus results with similar data from other sources. Thesesources can include surveys in a similar time-frame or pre-vious census results. The purposes of evaluating the accu-racy of the data are to inform users of the quality of thecurrent census data and to assist in future improvements.Future improvement may be achieved by (a) improving pro-cesses and (b) establishing performance benchmarks againstwhich the quality of the data from subsequent censuses canbe measured.
Evaluation of data accuracy may have two parts. Prelimi-nary evaluation will enable the identification of any prob-lem areas that have not been previously detected throughthe quality management processes in earlier phases of thecensus. More extensive evaluation should be undertaken ondata items where problems have been identified or wherenew questions or processes have been attempted.
The results of the evaluations should be made availableto census data users.

25
acquired in one census is utilized to the fullest extent pos-sible in future censuses. Also, there are some managementissues that are specific to a project with a long lead time. Toaddress these issues it should be expected that the manage-ment team leading the development of a census will changeover the course of the planning and preparation phases thatcomprise the census development process (see sect. B for adescription of the census cycle).
In the earliest stage, the principal activity will be identi-fying possible options for the various aspects of taking thecensus. It could be expected that at this time the team struc-ture will be based around a small group of experienced andrelatively senior staff. The team should be managed by aperson experienced in addressing strategic issues and withsome experience in census taking.
A generic structure of the area responsible for the census,defined in the present handbook as the census agency, isillustrated in figure I.5 and I.6. The roles and responsibili-ties of each level in the generic structure are also discussed.
The solid lines show lines of reporting, while the dottedlines show the flow of advice from a project board and vari-ous committees.
D. MANAGEMENT STRUCTURE
1. Introduction
In the majority of countries, the area responsible for thecensus will be part of that country’s statistical agency. There-fore, the management structures that can be put in place forthe census will largely depend on the established manage-ment structures in the statistical agency. There are manyreferences available on this subject and it is impossible todiscuss the full range of options available in a handbooksuch as this.
For the purposes of this handbook, a generic structure isdiscussed that can be adapted by countries to suit their ownparticular circumstances.
2. Generic management structure
Censuses of the population of a country are not taken fre-quently. In fact, for many countries they are only taken oncein 10 years. As a consequence, there is a need for a welldeveloped management process to ensure that information
Statisticalagency
executive
Census agencyexecutive
officerProject board
Deputyexecutive
officerAdvisory
committees
Deputyexecutive
officer
Project managerplanning and
administration
Project managerpreparations
Project managerfield
operations
Project managerprocessing
Project managerdissemination
Project managerevaluation
Figure I.6. Top-level management structure

26
The number of staff employed in each area of the dia-gram above will vary over the census cycle as differentproject teams are established in each phase. Also, the num-bers of levels in the management structure may also changethroughout the census cycle. For example, there may onlybe one project manager responsible for both processing anddissemination in the early stages of planning.
However, an important point to note is that each phase ofthe census cycle (as defined in sect. B) is represented in themanagement structure.
There will also be other areas within the statistical agencythat will have an input into the census project that are notrepresented in the diagram above. For example, these couldinclude the areas responsible for information technology andclassifications, or regional offices where they exist.
(a) Census agency executive officer
The executive officer is the person responsible for thecensus within the executive structure of the statistical agency.This person has ultimate line management responsibility forall aspects of the census and takes responsibility for the even-tual delivery of census goals. The executive officer will usu-ally report to the statistical agency executive.
The responsibilities of the executive officer can be de-fined as:
(a) Establishing strategic directions for the censusprogramme;
(b) Setting expectations and outcomes;
(c) Taking on responsibility for assessing and ratifyingthe census programme’s feasibility and achievement of out-comes;
(d) Ensuring that the census programme’s scope alignswith the requirements of the stakeholder groups;
(e) Providing those directly involved in the census withguidance on strategic issues;
(f) Ensuring that effort and expenditure are appropriateto stakeholder expectations;
(g) Keeping the census programme’s scope under con-trol as emerging issues force changes to be considered;
(h) Reconciling differences in opinion and approach be-tween stakeholders and resolving disputes arising from them;
(i) Communicating expectations and critical decisions tothe executive management of the statistical agency;
(j) Allocating project resources;
(k) Addressing any issue that has major implications forthe census programme.
(b) Deputy executive officers
The number of staff at this level largely depends on aparticular country’s circumstances and the size of the cen-sus project. These officers report directly to the executiveofficer and can be responsible for several of the phases inthe census cycle.
Their responsibilities can be defined as assisting the ex-ecutive officer in all areas of responsibility included in thelist above. Deputy executive offiers are a key link in thecommunications chain between project managers and thecensus agency executive and other areas within the statisti-cal agency. Their role is more “hands on” than the execu-tive officer and they are more closely involved with the day-to-day activities of the project teams.
(c) Project managers
In this structure, a project manager has been allocated toeach phase of the census. Project managers are responsiblefor several project teams that will be established for eachphase. They should schedule and monitor all activity ofproject team members and they should be separately identi-fied in the work plan.
The responsibilities of the project managers can be de-fined as:
(a) Developing and maintaining project plan(s);
(b) Managing and monitoring project activity throughthe use of detailed plans and schedules;
(c) Reporting to the deputy executive officers as required;
(d) Managing stakeholder expectations;
(e) Liaising with all project stakeholders;
(f) Fostering communication among all project stakehold-ers;
(g) Negotiating the resolution of technical issues;
(h) Completing the project on time and to budget;
(i) Ensuring the quality of the deliverables.
(d) Project teams
As options for the various strategic issues are established,the management structure should be refined so that seriesof project teams become established in parallel, each look-ing after broad areas of responsibility.
The top-level management structure (figure I.6) can befurther broken down for each project leader as shown infigure I.7.
Each project team should be responsible for maintainingcontact, at appropriate levels, with external stakeholders,including other areas of the census team, other areas of thenational statistical agency and stakeholders external to theagency (e.g., other government agencies).
The project teams are responsible for:
(a) Completion of project tasks to the agreed timetable;
(b) Completion of project tasks to agreed and acceptedlevels of quality;
(c) Peer group reviews of project outputs.

27
To ensure that there is the greatest possible scope for thecoordination of activities between the various project teams,it is recommended that these teams be co-located. If this isnot possible for some reason (for example, location of stake-holders with particular expertise or requirements remotefrom the main census development site), allowance must bemade for sufficient communications and face-to face meet-ings between members of the various project teams.
As the development work progresses, it should be ex-pected that the development project teams will increase insize, as the level of detail involved in their work increases.Eventually, these teams are likely to form the basis of thecore management teams undertaking the operational aspectsof the census, and the structure of the project teams shouldincorporate an element to facilitate this evolution.
(e) Project board
This board is a high-level group, comprising representa-tives of major stakeholders in the census programme, andother areas within the statistical agency. The project boardmay be chaired by the census agency executive officer.
The project board should be seen as an advisory bodythat provides advice to the executive officer on strategicdirections and issues. In the early stages of census plan-ning, it is vital to coordinate the disparate activities of theprogramme and recognize interdependencies. This will begreatly facilitated by the formation of a review body suchas a project board.
Representatives on the board from other areas of the sta-tistical agency may also be able to provide high-level spe-cialist advice to the executive officer. These representa-tives could be from specialist areas such as informationtechnology.
Once the operational phases begin, the role of the projectboard will be largely complete. However, the board can havean ongoing role in identifying strategic directions for thenext census.
(f) Use of advisory committees
The project board is only one of a number of mechanismsthat managers of a census can utilize to gain, through a for-mal process, access to levels of expertise and experienceaugmenting those of the team. It is to be emphasized thatthis is the key role of such committees. They cannot be seenas absolving the census managers from their responsibilityto manage the operation.
In many cases, the formal systems development method-ology adopted by the agency will indicate the review andadvisory boards that should be involved. It is suggested thatthe following groups are essential to ensure that the devel-opment process considers all key issues:
(a) An information technology review panel, to ensurethat the most effective use is made of technology, withoutrequiring the development team to be fully conversant withall aspects of this area;
(b) One or more system user review groups, to ensurethat the views of the people who will operate the system areconsidered;
(c) One or more client advisory groups to provide ad-vice on the need for statistical output in specific areas. Thesepanels are particularly useful as a means of addressingemerging areas of concern;
(d) Other technical advisory panels, where required (forexample, a panel of methodologists may be helpful in de-termining sampling rates; a panel of specialists on employ-ment conditions may be useful if the area of pay and condi-tions is complex).
Again, the most use should be made of these committeesin the planning and preparation phases and not in the opera-tional phases. This is because their main role is to provideadvice on strategic issues or particular technical issues. It isunlikely that such committees will be able to respond quicklyenough to resolve issues of detail that may arise during thebrief and intense operational stages of the census.
Project managerfield
operations
Project teamfield mapping
Project teamrecruitment
Project teamtraining
Project teamdispatch and
return
Figure I.7. Project team structure

28
(g) Differences between development and operationalphases
While the top-level management structure is establishedin principle for the entire census cycle, the extent to whichall parts of the structure are actually established will varyover the cycle. It is important to note that the detailed man-agement structures and approach will be quite different forthe operational phases of the census as compared to the de-velopment phases.
The development phases comprise planning and prepara-tion and detailed management structures are suited to thesephases. The operational phases comprise field operations,processing and dissemination. These require different man-agement approaches because the nature of the workforcesand the tasks performed are quite different. These are dis-cussed in the following sections.
3. Management of the operational aspects
During the operational phase, the census programme willbe concerned with operational management, driven by out-put from monitoring systems established in the developmentphase.
During the operational phase, the generic structure willbe expanded to cater for managing these operations. As anexample, the field operations management structure couldbe expanded, as indicated in figure I.8.
Details of the management of the three main operationalphases of the census (i.e., field operations, processing anddissemination) are given in the relevant chapters of thepresent publication. It is, however, worth considering keyelements of the specific structures required in an overallsense.
(a) Field operations phase
A key element of the field operation management struc-ture is that it will inevitably be geographically dispersed.This is needed to provide the local knowledge required toensure a high-quality enumeration and to ensure ready ac-cess to managerial advice and oversight for enumerators.
It is not possible to be prescriptive about the way in whichthis is achieved since the resources available to countrieswill differ greatly. Depending on the communication facili-ties and other infrastructure available in a country, it is com-mon for the basic management structure to involve three orfour layers of management in the field operations workforce,as follows:
(a) Regional manager;
(b) Deputy regional manager;
(c) Supervisor;
(d) Enumerator.
The first and second levels could be combined if it is pos-sible to obtain the communications and logistical objectiveswith three groups. It is desirable to minimize the number ofvertical stages in the hierarchy as described above in orderto facilitate direct communication between enumeration staffand more senior managers and to ensure that each level ofstaff is encouraged to accept responsibility for their ownwork rather than relying on actions of layers of supervisorystaff to cover up for errors.
It is equally important to maximize communication be-tween management units to ensure consistent adoption ofbest practices in all areas.
Typically, the field workforce will comprise mainly staffengaged for the specific task at hand. To ensure objectivesare met they will require management support from perma-nent staff of the census agency. This element of managementcan be provided effectively through regional offices wherethey exist. In other cases, it may be possible to use other man-agement structures (for example, those of the education de-partment, where it is considered effective in terms of nationalobjectives to utilize teachers as the enumerators).
In most countries, there will also be special sub-groupsof the population that require particular management ac-tions to ensure a successful enumeration. For example, thesegroups may comprise members of a specific cultural group(e.g., an indigenous minority), or people with some form ofdisability (e.g., visual impairment or poor reading skills) orwho live in specific situations (e.g., a nomadic minoritygroup). In each case, a specific strategy will be requiredincorporating the necessary management structures.
(b) Processing phase
The success of the census processing phase is determinedlargely by the structures established to manage the opera-tion. The structures that can be put in place at each process-ing centre is discussed in chapter 4, section C.
However, if the processing is conducted at a number ofdecentralized sites, an additional management layer will beneeded. In a decentralized scenario there is a strong needfor overall national coordination of operational and qualityassurance aspects of the processing task. Therefore, nationalmanagers will need to be engaged who are responsible forthese two aspects of processing.
(c) Dissemination phase
A number of options are possible for the managementstructure of the dissemination phase of the census. The over-riding requirements are that there should be:
(a) A great deal of attention paid to coordination with theenumeration and processing systems;
(b) Due attention given to the use of standard classifica-tions across the entire range of outputs;
(c) A process that is based on a clearly spelt out set ofuser objectives;
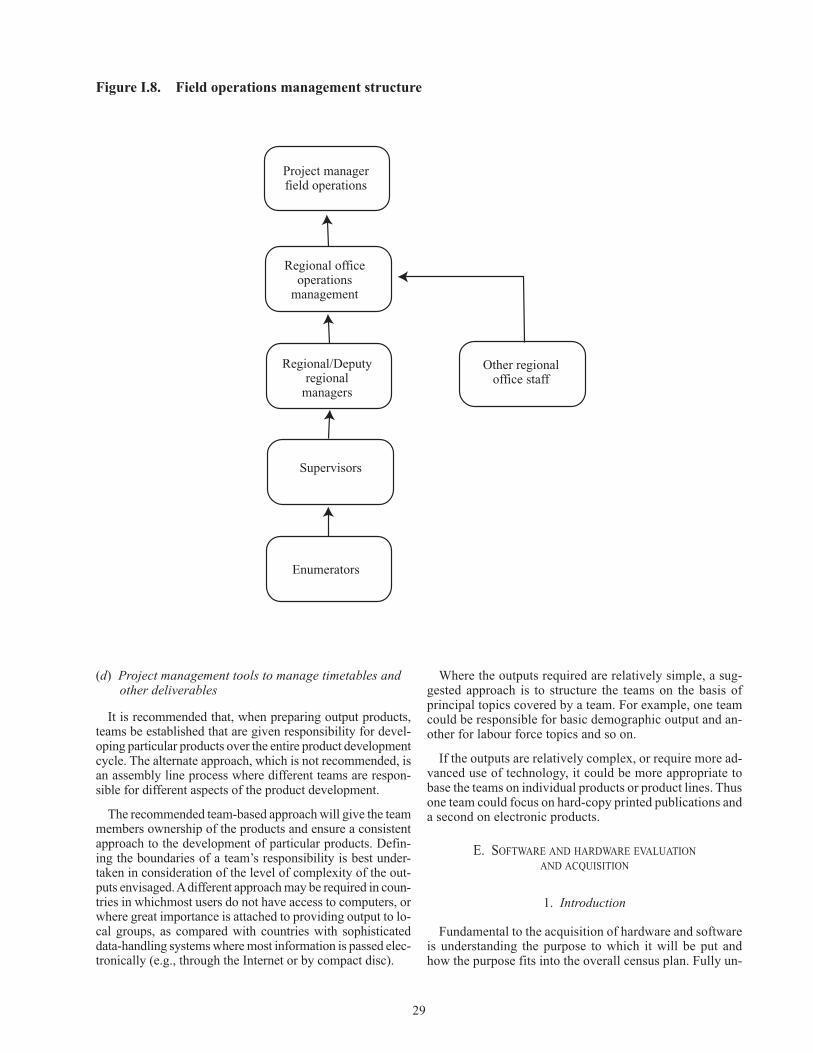
29
Project managerfield operations
Regional officeoperations
management
Regional/Deputyregional
managers
Supervisors
Enumerators
Other regionaloffice staff
(d) Project management tools to manage timetables andother deliverables
It is recommended that, when preparing output products,teams be established that are given responsibility for devel-oping particular products over the entire product developmentcycle. The alternate approach, which is not recommended, isan assembly line process where different teams are respon-sible for different aspects of the product development.
The recommended team-based approach will give the teammembers ownership of the products and ensure a consistentapproach to the development of particular products. Defin-ing the boundaries of a team’s responsibility is best under-taken in consideration of the level of complexity of the out-puts envisaged. A different approach may be required in coun-tries in whichmost users do not have access to computers, orwhere great importance is attached to providing output to lo-cal groups, as compared with countries with sophisticateddata-handling systems where most information is passed elec-tronically (e.g., through the Internet or by compact disc).
Where the outputs required are relatively simple, a sug-gested approach is to structure the teams on the basis ofprincipal topics covered by a team. For example, one teamcould be responsible for basic demographic output and an-other for labour force topics and so on.
If the outputs are relatively complex, or require more ad-vanced use of technology, it could be more appropriate tobase the teams on individual products or product lines. Thusone team could focus on hard-copy printed publications anda second on electronic products.
E. SOFTWARE AND HARDWARE EVALUATIONAND ACQUISITION
1. Introduction
Fundamental to the acquisition of hardware and softwareis understanding the purpose to which it will be put andhow the purpose fits into the overall census plan. Fully un-
Figure I.8. Field operations management structure

30
National Committee for the GeneralPopulation Census of Cambodia
Ministry of PlanningTechnical Committee
Provincial Census Committee
Director of Census
Census OfficePhnom Penh
Region/field
Regional officer
Assistant regional
Province directorProvince census officer
District chiefDistrict census officer
officer
Commune chiefCommune census officer
Supervisor1 for 4 enumerators
Enumerator
1. Administrative Division
2.
3. Cartography Division
4. Logistics Division
5. Printing Division
6.
7. Data-Processing Division
Planning and MonitoringDivision
Analysis and ResearchDivision
Census management structure chart for the Cambodia census of 1998

31
derstanding the system requirements will make the acquisi-tion decision and the trade-off between functionality andcost easier to establish.
For example, when developing the data-processing sys-tem, decisions on factors such as the data capture method tobe used, what editing and processing will be applied to thedata and how the data will be stored and disseminated needto be made. These decisions must be made early enough sothat sufficient time is available for the evaluation and ac-quisition of software and hardware.
The budget available to the project is also a vital factor inmaking decisions about hardware and software. Costs ofemploying data-entry staff and the level of the computinginfrastructure are also important considerations. For a low-budget project, it may not be feasible to acquire and deploysophisticated state-of the-art equipment, but the use of lessambitious information technology may offer overall sav-ings as well as greatly increase the utility of the output fromthe census.
Before agencies commence the formal processes of evalu-ating and acquiring software and hardware, they should takethe opportunity to research and investigate other organiza-tions’ experiences with similar systems. During this period,it may also be possible to acquire versions of software and/or hardware that can be used for testing purposes. This willallow agencies to become familiar with, and better under-stand, the potential and/or limitations of particular systems.This experience can be valuable when developing evalua-tion criteria as outlined in the sections below.
2. Evaluating software
Before acquiring and installing software, there are manyissues that need to be considered and it is necessary to evalu-ate the software against set criteria. Which criteria are criti-cal will depend on what the software is being used for andhow complex the function and the software are. The mostimportant criterion is to ensure that an application can bedeveloped that meets the required specifications.
Other possible criteria include whether:
(a) The software is easy to learn and use;
(b) It is an integrated tool that provides a common ap-proach;
(c) There is an easy development environment for userinterfaces;
(d) There is an easy-to-use programmemer developmentenvironment (workbench), including configuration manage-ment, testing and debugging facilities incorporatingbreakpoints and step-through capabilities;
(e) The software has the ability to display required ob-jects such as form images, if applicable;
(f) The software has strategic value to the organizationresponsible for the census, or other elements of the nationalinformation technology infrastructure;
(g) The software is compatible with current industrytrends;
(h) There is current expertise in the product in the orga-nization or externally:
(i) Are internal or external staff experienced with theproducts readily available?
(ii) What level of training and support is required?
(iii) What support is provided by the supplier?
(i) There is evidence of the current strength and longer-term viability of the supplier;
(j) The software will be sourced locally or internation-ally;
(k) It is a well-recognized and used business with well-known products:
(i) Is the product compatible with current industrytrends?
(ii) Is the supplier financially secure?
The test process for evaluating software should includeat least the following steps:
(a) Obtain test copies;
(b) Develop test prototypes, and test data packs to proveor disprove the software’s ability to satisfy key functional-ity requirements;
(c) Detail implications on and for the organization’s com-puting environment;
(d) Get access to reference sites and demonstrations re-lating to the supplier and its products and gauge user satis-faction. This can be augmented with access to bulletin boardsand discussion sites, if Internet access is available;
(e) If it is a strategic product, ensure that there is a viablesupport mechanism and that the information quality andresponsiveness are acceptable;
(f) Conduct tests according to previously established cri-teria;
(g) Assess and document upgrade policy;
(h) Determine full costing;
(i) Produce a report on the evaluation process.
3. Acquiring software
Software for census use in association with selected hard-ware can be acquired in a number of ways, such as:
(a) Purchasing complete off-the-shelf packages that re-quire no further development;
(b) Purchasing packages that can be further developedfor census-specific activities;

32
(c) Contracting out the provision of specific functional-ity for parts of systems;
(d) Contracting for externally developed software forcomplete systems;
(e) Obtaining free software such as IMPS (see below).
Table I.8 provides an example of some of the softwareapplications that may be used for census data processing.The software packages were evaluated according to theirperformance against the following criteria:
(a) Country size;
(b) Data entry;
(c) Editing;
(d) Fast tabulation;
(e) Tabulation;
(f) Camera ready.
(a) Package software
The use of package software, as opposed to developingtask-specific software, has become an established practicein many areas of the information systems industry. The majorreasons for this are:
(a) The reduced risk, cost and time-frame associated withthe implementation of proved solutions to recognized busi-ness needs;
(b) The reduced overhead involved in maintaining theresulting system by procuring packages from vendors com-mitted to their ongoing maintenance.
Although the rationale for using package software is clear,many agencies have been disappointed with the results ofpackage implementations. The most frequently encounteredproblems are:
(a) A mismatch between package functionality and agencyrequirements;
(b) The level of customization required to ensure suc-cessful implementation;
(c) Inflexibility of the package to meet the changing needsof the agency;
(d) The level of maintenance required;
(e) An inadequate level of vendor support;
(f) Poor vendor choice;
(g) The amount of effort required to interface a packageto existing systems.
Why Use the Integrated Microcomputer Processing System?
During the 1997 census, the Palestinian Central Bureau of Statist icsdecided to use the Integrated Microcomputer Processing System (IMPS)to process the census data. The decision was based on the followingcriteria:
(a) The software had been extensively tested in census environments;(b) It was designed mainly for data processing of censuses, but could be
used for other subjects;(c) It had been frequently tested and used in censuses;(d) It was continuously being upgraded by the responsible agency;(e) Technical support was available;(f) It was recommended by the UN;(g) It could be used for data entry, computer editing, forms tracking and
tabulation;(h) It was capable of embedding checks and controls into the data
processing systems;( i ) Documentation about the software was available;( j ) Data was portable;(k) It was user friendly.

33
The above problems are almost always attributable to aninadequate analysis of business needs, or a poor procedurefor the evaluation and selection of a package, or both.
Off-the-shelf packages would usually be acquired throughdirect negotiation with suppliers, after an evaluation studyhas been conducted to determine that these products willfulfil the stated requirements. There is a need to considerwhether a site licence is required or whether individual li-cences would be more appropriate. With software acquisi-tion, there is usually room for negotiation, and discountsmay be available for higher-volume purchases. A licencearrangement to allow many concurrent users should be con-sidered as this is usually a cheaper alternative, since fewerlicences need to be purchased than the total number of pos-sible users. There are other variants worth pursuing such asdifferential pricing, that is, limited developers’ licences andunlimited licences for run-time access.
(b) Contracting out specific functionality for parts ofsystems
Externally developed application-specific software mustbe tightly specified, developed and controlled and thereforeshould be subject to contracted conditions that are closelymonitored. This is usually based on a formal request fortender or statement of requirements and may be linked tothe acquisition of hardware. It is also essential to have goodcontract management practices in place, otherwise many ofthe benefits established in the planning processes will belost in the execution.
(c) Contracting out complete software systems
A simpler but perhaps more expensive method is to con-tract out specific functionality for specialized software.Broad requirements might be specified as “the requirementto deliver captured data from every form”, which leavescontractors to acquire and develop software themselves.While this is a simpler method for the organization, it willmost likely be more expensive and means that communica-tion with the contractor has to be very good to ensure ad-equate detailed specifications. It also means the organiza-tion has less control over the process.
4. Developing software applications in-house
If there is no suitable software available off-the-shelf, itmight be feasible to develop the required software in-house.The decision to take this action will depend on a number offactors, for example:
(a) The budget available;
(b) The technical skills available in the organization andthe ability to retain those skills (a growing problem in theinformation technology industry);
(c) The timetable for development;
(d) The complexity of the required software.
Whether software is developed in-house or contracted out,the same strict control over development issues (e.g., stan-dards, tools used, training of staff and adherence to time-tables) must be exercised.
A Regional Approach for Census Data Processing
In order to share the available expertise in a group of countriesand facilitate more cost-effective training a common approachfor census data processing can be adopted by a set of countriesthat have shared experiences in census taking. The small PacificIslands for their 2000 round of censuses have adopted anexample of this common approach. They have agreed to the useof harmonized software for data processing (IMPS). This led tothe development of a regional network to facilitate regionaltraining and the exchange of expertise among countries.

34
5. Evaluating hardware needs
The requirements for evaluating hardware will depend onthe nature of the hardware, its complexity and any links withexisting hardware or software. Strict evaluation criteria needto be drawn up before the hardware is acquired for evalua-tion. Many of these criteria will be the same as the ones setout in section 2 above. Before the evaluation takes place,specifications must have been drawn up to describe clearlythe requirements for the hardware, and suitable hardwareacquired on the basis of a tender or direct purchase, if thereis only one possible supplier.
An evaluation team should be set up to carry out theevaluation. The numbers of people involved in this teamwill depend on the complexity of the hardware, the num-ber of different hardware configurations to be evaluatedand the resources available. The members of the evalua-tion team must have the necessary knowledge to be ableto make a valid, consistent and unbiased assessment of theequipment—from both a technical skills perspective andthe ability to manage an objective evaluation process overtime. Technology often changes at a fast rate and there isthe possibility that updated or new hardware may becomeavailable after the evaluation has been completed. It isimportant to remember that, despite what performancepromises may be made by vendors, any decision to imple-ment this new hardware must be based on another fullevaluation. It should not be taken for granted that updatedhardware will necessarily perform better or be more suitedto the particular census application.
The evaluation should encompass a number of phases toensure that the hardware is thoroughly assessed, and it isimportant to test the operation of the equipment in the envi-ronment in which it is to be used, thus being sure that it willperform properly in the production environment.
Initial capital cost is only part of the total cost of the hard-ware to the agency. It is one factor, but not the only, or nec-essarily most important, factor in evaluating hardware. Thereis a relationship between savings and risk, which means thatcheaper equipment has the potential to cost more in the longterm if user requirements are not met or the equipment needsreplacement before it has done the required job.
Product quality is another issue. Some hardware systemscan be put together using a number of different off-the-shelfcomponents, but this requires extensive testing, includingsystems integration testing involving all components, andassurances that the supply of like products can be guaran-teed over time.
The establishment of a set of standards for deliverablesand a rigorous change management process is essential re-gardless of whether one has a single supplier with a propri-etary “box” or whether the build of the box is done in amodular fashion.
An important point to note when evaluating hardware is theperiod of warranty offered by the vendor. It is desirable thatthe warranty cover the time needed to carry out the census.
6. Acquiring hardware
Hardware is usually acquired on a similar basis as thatfor acquiring software. Where the hardware is new technol-ogy for the organization, there will normally be a tenderprocess to ensure that the hardware is the best solution, tech-nology-wise and financially, for the organization. The re-quest for tender must be compiled carefully, with due re-gard to the legal requirements of the organization and gov-ernment policies, including ethical and probity consider-ations. If there is an existing system of panels of suppliersfor specific types of hardware, and these are relevant to therequirements of the organization, then they should be usedto purchase or lease the hardware required. Ethical and pro-bity issues are of paramount importance in any acquisitionprocess and if not handled properly can be the cause of de-lays or other problems.
A detailed specification of requirements must be donebefore the tender document is released or panel suppliersare contacted. This specification will be required to formthe basis of the evaluation criteria (see section 5 above).
It is important to evaluate the real requirements of theorganization and to acquire hardware that is appropriate forthe job. There may be pressure to buy older technology tosave money, but this can be counter-productive if there is aneed to upgrade other components. On the other hand, it isimportant not to pay too much for hardware by buying equip-ment that delivers more performance and functionality thanis required. Careful planning is required to gain the mostbenefit from hardware purchases.
There are some basic rules that should be followed foracquisitions:
(a) Use requests for proposals or requests for tender tocontrol the process;
(b) Try to keep proposals simple;
(c) Purchase only what is required, but as much as pos-sible to encourage competitiveness in the evaluation pro-cess;
(d) Shortlist ruthlessly, focusing on the best technicalsolution and overall value for money;
(e) Negotiate the warranty period;
(f) Negotiate free training to be provided by the vendor;
(g) Consider the level of local maintenance support available;
(h) Consider the advantages and disadvantages of pur-chasing locally compared to internationally;
(i) Avoid being under any obligation to a vendor;
(k) Consider ethics and probity issues at all stages.
Annex 5 shows a framework that can be used to obtain anaccurate estimate of the equipment and manpower neededto capture and process the census information using bothmanual data entry and scanner technology.

35
Software Country size Data entry EditingFast
tabulation Tabulation Cameraready
IMPS a Small, mediumor large
Excellent Excellent,but needsto have
qualifiedEDP staff
Excellent Excellent,but needs to
havequalifiedEDP staff
Excellent
XTABLE/PCEdit
Small, mediumor large
Good Fair Excellent Good Fair
BLAISE b
Small, mediumExcellent,
but nodoubleentry
Excellent Excellent Good Poor
ISSA c Small, medium
Excellent Excellent Good Good Poor
EPI-INFO d
Small Good Fair GoodNot
applicable
Poor
WinR+ eSmall. ormedium
Notapplicable
Notapplicable
ExcellentGood
No
PC-AXISSmall, medium
or largeNot
applicableNot
applicableExcellent
GoodGood
—————Source: C. Ellis, “Census data processing Strategies” Seminar on Strategies for the 2000 Round of Censuses in the
Pacific, Nadi, Fiji, 8-12 December 1997. (PAC/SEM/97/6).
a Integrated microcomputer processing system.b Survey processing system.c Integrated system for survey analysis.d Epidemiology computer software.e Windows retrieval of data for small areas by microcomputer.
Table I.8. Census data processing software applications

36
F. USE OF SAMPLING
1. Introduction
Sampling can be used in different phases of the census.These include;
(a) In tests conducted before the census (e.g., pre-testsand pilot tests);
(b) During the census itself (i.e., using short and longforms);
(c) In quality control operations, such as for printing andreviewing questionnaires.
(d) After the census, to produce preliminary estimatesbefore tabulations are prepared and in the post-enumera-tion survey.
Using correct sampling methodologies is critical for allof the activities mentioned above. It is beyond the scope ofthe present handbook to discuss in detail the sampling meth-odologies that can be adopted. Countries that use samplingshould ensure that they seek expert advice on the method-ologies to be used.
However, some general issues that managers may need toconsider regarding sampling are discussed below.
2. Tests before the census
Generally, the testing programme before the census willinvolve sampling particular areas and a proportion of enu-meration areas within those areas. For the majority of tests,it is important that as far as possible the sample selected isrepresentative of the country as a whole. For example, thiswill require that areas in both urban and rural localities areselected. Tests that are conducted for specific purposes (e.g.,to test enumeration procedures for particular populationgroups) will need a sample selected that contains a highproportion of people in that particular population group.
3. During the census
Sampling during the census is undertaken where it is de-sired to reduce the costs of the census. Generally, this isachieved by asking a restricted set of questions of the entirepopulation (usually the basic demographic questions on a shortform), with only some proportion of households (usually about10 per cent) asked the full range of questions (long form).During the past three censuses taken in the United States ofAmerica, the sampling rate varied between 15 and 20 percent. In the 1980 census, there was a 17 per cent samplingrate; during the 1990 census, it was 20 per cent.
Cost savings are generally no more than 20 per cent ofthe total cost of the census, as the main cost of the census isin finding the households and the households within theenumeration areas. The major savings is in salaries for pro-cessing staff. In an interviewer-based census, savings canalso be made for enumeration costs because of the reducedtime needed to interview the majority of households.
However, careful consideration should be given beforeusing a short and long form approach. The major purposeof carrying out a census in the first place is to provide datafor the smallest geographic areas and for small populationgroups; sampling within a census is usually only consid-ered where the demand for the sampled data is mainly forlarger geographic regions. For example, the United StatesBureau of the Census does it for block groups, which is arelatively small area. The marginal savings have to beweighed carefully against the loss of reliable data.
It is recommended that countries with smaller populationsdo not adopt a short and long form approach.
4. After the census
Sampling can be used after the census to produce pre-liminary estimates before tabulations are prepared and inthe post-enumeration survey.
Some countries have initially processed a sample of enu-meration areas to enable them to produce preliminary re-sults before the bulk of the processing is completed. Whilethis method will enable an early release of data, it adds un-necessary complications to the processing of data and di-verts resources away from the task of producing final data(see chap. V, sect. A).
The post-enumeration survey must be representative ofthe entire country and of all population groups (see chap.VI). The sample selected may vary, with a small sampleallowing a national undercount figure to be calculated or alarger sample allowing an undercount figure to be calcu-lated by region. The size of the sample selected will largelydepend on the resources available to the census agency.
G. SELECTING AND MANAGING EXTERNALCONSULTANTS AND OUTSOUCING
1. Introduction
In many countries, the use of external consultants (includ-ing consultants provided through international developmentprogrammes) and outsourcing has increased greatly in recentyears. The use of such an approach to resourcing a censuscould be considered as a possible part of the total develop-ment of systems and facilities for census use. Traditionally anumber of countries have used other government agenciesfor form printing and the provision of mapping services.
However, outsourcing to other government agencies and/or private vendors for both information technology and non-information technology projects has increased, along withthe use of external consultants. The principles involved inmanaging these external consultants or the outsourcing ven-dors are the same in all cases regardless of whether they areanother government agency or a private vendor. Whether ornot a project is information technology-based, the desiredresult is the same, that is, that a successful census outcomeis achieved, with all requirements being met for an agreedcost to an agreed timetable.

37
Whether external consultants and/or outsourcing is useddepends on the requirements of the organization (includingrequirements for confidentiality and security), whether therequired skills are available in-house and whether projectscan be outsourced cost-effectively. Outsourcing decisionsshould be made within the context of a larger organizationalplan that identifies choices between both hiring and train-ing staff or using external service providers to augment orreplace resources for specific projects. There is not a clear-cut distinction between hiring consultants, the use of exter-nal service providers or outsourcing; quite often a systemwill contain elements of all of these working together within-house resources.
The agency may have limited skills of the type neededfor the implementation of a particular specialized system,or information technology may not be a core part of thebusiness. If this is the case, a solution in which a greaterproportion of the work is undertaken by resources outsidethe census agency could be considered. Instead of simplyacquiring hardware and software with which to assemble aprocessing system, a total solution would be requested, withthe successful tenderer taking responsibility for all infor-mation technology aspects of the processing system.
In many countries, bilateral agreements allow for the useof international consultants as technical advisers. In thesecases, census managers should take advantage of the op-portunity to assist in capacity-building within the censusagency.
In some countries, tenders committees have been formedwhich consist of the Ministry of Finance and a general con-trol association, as well as the Statistical Office. The com-mittee is usually responsible for calling tenders, require-ments and conditions, evaluation of tenders and selectingthe most suitable ones.
2. Differing objectives
It is inevitable that any external resource provider willhave additional or different objectives from those of thecensus agency. For example:
(a) A specialist mapping service provider may be moreinterested in producing maps to the highest standards ofcartography than in offering a service that allows enumera-tors to locate dwellings effectively;
(b) A private sector business will be obligated to providea return to shareholders rather than satisfying the publicpolicy needs that drive government agencies.
As a result of these differing objectives, in all cases whereexternal resources are employed, careful control is neededto ensure that the selected external provider delivers a cost-effective solution that meets the census agency’s needs. Theuse of external service providers should be carefully speci-fied, planned and monitored.
3. Specification
Successful outsourcing initially requires the census agencyto have a clear understanding of the requirements, as thesehave to be unambiguously specified to the service provid-ers. If the agency cannot express its expectations and pri-
orities clearly to service providers, the service providerscannot be expected to achieve them. It is also necessary toensure that any legal documents (e.g., conditions of tender)are fully understood by all parties.
The way in which this specification is passed on to theexternal providers will, to some extent, be determined bythe laws, rules and procedures that apply in a country. How-ever, a detailed written specification should be set out toserve as a benchmark against which performance can bemeasured later in the process.
Annex VI contains an example from the Australian Bu-reau of Statistics of a table of contents of a model contractand the issues that can be covered in writing a contract.
Preparation of specification
During the preparation of a specification for outsourcingor an external service provision, about half of the time shouldbe used in establishing the objectives of the project, theoutcome to be achieved and the procedures to be followedin attaining that outcome. The standards to which outcomesare to be achieved must also be specified (e.g., for a data-entry operation, an allowable proportion of erroneous key-strokes could be specified).
The next largest amount of time should be spent on docu-menting precise price and payment terms (where goods and/or services are to be purchased).
The specification must be designed to allow for require-ments changing over the life of the project. This should in-clude a clear method through which changes are agreed andapproved by both the census agency and the service provider.
Within this overall framework the specification should:
(a) Clearly state the scope of the project;
(b) Identify the deliverables and the associated scheduleof dates for completion of each deliverable (i.e., milestones);
(c) Identify key personnel by name and qualifications,and set out rules for their replacement, where necessary;
(d) Clearly define invoicing and payment specifications,as well as time-frames and methods for payment of penal-ties;
(e) Set out training programmes and documentation re-quirements.
4. Monitoring the outsourced project
It is important that outsourced projects are carefully moni-tored against the specification. This monitoring must includeearly identification of problems (milestones are importantin this process).
Particular care should be taken where the outsourced workis being developed and/or undertaken at a site remote fromthe location of the census office.
Regularly scheduled meetings (or other communicationssuch as telephone conferences or videoconferences) betweencensus agency and service provider staff are essential formanaging external relationships and ensuring that expectedcontract results are achieved. Compliance with scheduledcompletion should be specified as a contract requirement,

38
with listings of key attendees from all parties specified inthe contract. The frequency of the meetings should be speci-fied along with responsibility for recording and publishingdecisions made or items agreed to.
It is considered essential that a system of cascading meet-ings be established, with project team staff meeting theircounterparts frequently for routine monitoring. Reports, onan exceptional basis (i.e., restricted to the important issueson which decisions are required), would be made to lessfrequent meetings of more senior staff.
This is a key area, which might be neglected if not con-sidered early enough in the proceedings. Even if the re-quirements are clearly specified, it is still possible for prob-lems to arise in the delivery process, with the potential forthe outcomes to be achieved late or not at all.
Clear and open communication is a critical success factorin this element of managing a census. Care should be takento ensure that all negotiations with external providers aredone with a degree of common sense and appreciation ofall viewpoints and constraints, as well as rigorous contractpreparation.
While many forms of the specifications will include pen-alties for failure to meet deadlines or quality standards, theseare rarely effective in a census context. What is required isa census held successfully on a date specified months or, inmany cases, years in advance, not cash from penalty pay-ments. Attention to detail in the specification documents isa major step towards achieving this. It is also important todevelop and manage a good working relationship betweenthe service providers and the census agency.

39
A. ESTABLISHING THE BASIS OF ENUMERATION
1. Introduction
Establishing the basis of the enumeration provides aframework for proceeding with more detailed planning forfield operations. Basic issues that should be addressed in-clude:
(a) Responsibility for the census enumeration;
(b) Key goals;
(c) Key stakeholders;
(d) Type of enumeration (including population to be enu-merated);
(e) Method of enumeration;
(f) Timing of enumeration;
(g) Census referece time;
(h) Duration of enumeration;
(i) Critical dates;
(j) Other major constraints;
(k) Performance indicators.
Each of these issues is discussed in detail in the sectionsbelow.
2. Responsibility for the census enumeration
The responsibility for the census enumeration must bedetermined as part of the planning phase of the census.Evaluations and recommendations relating to the previouscensus should be reviewed when determining the enumera-tion responsibilities.
In most countries, the statistical office will be responsiblefor census enumeration and will establish a separate censusagency within the office.
However, in some countries, a separate agency will beestablished and a “census commissioner” appointed whomay report directly to a government minister (e.g., the Min-ister for Planning). A high-level inter-agency committee mayalso be established to coordinate activities between variousgovernment agencies. In many countries, the establishedadministrative structure, both centrally and in regions, isalso used to coordinate and undertake census enumeration.
In a census agency, the management of the census enu-meration will usually have two structures. One is internal tothe census agency, while the other is a temporary structure
set up specifically for the field operation. The role and re-sponsibilities of each structure and how they relate and com-municate with each other need to be taken into account.
Key factors to consider when establishing roles and re-sponsibility include the following:
(a) The structure of the census agency itself. Is it central-ized or decentralized? If there is more than one office, whatis the relationship between these offices and how do theyrelate to the statistical geography of the country? (see sect.C below);
(b) Which agency will undertake the enumeration? Forexample, this could be the census agency or some othergovernment agency that may be better placed, with somecore and experienced staff and/or infrastructure already inplace;
(c) The number of permanent staff in the statistical agencywho will be involved in the enumeration phase and on whatbasis. At a minimum (and taking account of the size of theoffice), there should be a permanent census unit, includingstaff responsible for enumeration, established at least threeyears before the census. There may be a need to recruit ad-ditional staff, apart from temporary field staff, into the cen-sus agency specifically for the duration of the enumerationphase.
In the majority of countries, there is a central statisticaloffice and regional offices located throughout the country.The relationship between, and functions of, these officesvary from country to country. In some cases, a regional of-fice may be responsible for all statistical activities in thatpart of the country. In other cases, a regional office may beresponsible for some economic and/or social collections forthe entire country, while the central office determines sta-tistical priorities and standards. In yet other cases, a regionaloffice may be responsible for processing, while another re-gional office is responsible for dissemination. There is nopreferred arrangement, but planning for the census shouldaim at taking advantage of existing office infrastructure. Itis also important to note that the scale of the census offershigh return in terms of economies of scale and use of stan-dardized procedures.
Depending on the structure of a country’s statisticalagency, responsibility for the operational aspects of censusenumeration may devolve to the head of each regional of-fice. In this case, the central office usually undertakes thedevelopment of procedures and arranges acquisition of ma-terials for use by the regional offices during the enumera-tion period. In this situation, the central office provides akey support role to regional offices during the enumerationperiod. Planning should take this into account in decidingwhat form the support will take and how it will be orga-nized.
II. PREPARATORY TASKS

40
3. Key goals
Initial planning for a census will have established broadgoals (see chap. I, sect. B). Planning for the census enu-meration should consider how it will contribute to achiev-ing the broad census goals and whether there are specificones related to enumeration.
Goals can be limited to a few important items or struc-tured to cover several aspects of the census enumeration.For some items, goals can be derived from asking questionssimilar to those relevant to management information datarequirements (see chap. III, sect. E). The following exampleabout training illustrates this.
For a variety of reasons, training of enumerators may bemore important in some countries than in others. Assumingthat training is very important, the question “Have all fieldstaff been trained?” may be used to establish the goal thatall field staff will be trained before the census enumerationbegins. Reporting the status or level of completion of fieldstaff training would contribute to assessing the success ofthis goal.
The following is a list of some broad topics for consider-ation as goals for the census enumeration. It is not an exhaus-tive list and some topics may not apply in some countries:
(a) Full coverage. Census enumeration procedures needto be designed to ensure that full coverage of the populationis achieved, while adhering to budget and timetable consid-erations;
(b) Confidentiality. Procedures are designed to ensureconfidentiality of census data. Examples of measures thatcan be taken to ensure confidentiality include enumeratorswearing identification passes and privacy envelopes beingprovided for people who request them and names and ad-dresses not being stored in computer files;
(c) Census publicity. Publicity and associated census in-quiry services are conducted to heighten public awarenessregarding the census. The goal is to have the public well in-formed about the need for, importance of, and benefits froma census. Thus, emphasis would be placed on key aspectssuch as the benefit of the census to the community and confi-dentiality and privacy. A good public relations campaign willalso contribute to response rates and data quality;
(d) Non-compliance. Minimizing non-compliance shouldbe considered a key goal of the census enumeration;
(e) Cost-effectiveness. All enumeration processes andprocedures are developed with a view to maximizing cost-effectiveness;
(f) Recruitment and training of field staff. An importantgoal for census enumeration is that the most efficient pro-cedures and processes are established to recruit and train ahigh-quality field workforce;
(g) Accountability. All materials should be accounted for.This can be reflected in a goal that all census forms are re-ceived at the processing centres and that there are no re-ports of lost census materials in the field;
(h) Availability of instruments (e.g., maps) necessary forenumeration;
(i) Involvement and cooperation of local leaders;
(j) Consistency of procedures across all regions withinthe country;
(k) Special enumeration. In some countries, the enumera-tion of particular sub-groups of the population can be morephysically, culturally or politically difficult than that of themainstream population. Where sub-groups are identified forspecial enumeration, a goal could be to ensure that proce-dures are in place and special strategies devised to ensuretheir inclusion in the census.
There are many other potential goals that may apply toparticular countries. During the planning phase of the enu-meration, the important question to ask is “What outcomesare we aiming at as a result of the enumeration”?
The goals could be expressed as absolute numbers. Forexample:
(a) A gross undercount rate of x per cent or less;
(b) A cost per capita of ‘y’ units of currency;
(c) Relative to a benchmark of x per cent, reduction inunderenumeration relative to the previous census.
4. Key stakeholders
The issue of stakeholders is covered in detail in chapter I,section B. For the census enumeration, the key stakeholderis the processing area. While the quality of completed ques-tionnaires will ultimately be reflected in the quality of cen-sus output, the more immediate impact will be during cen-sus processing. When developing census enumeration, de-cisions about procedures, and assumptions that will have aneffect on how the questionnaire is completed, should be dis-cussed with the processing area. This will help ensure thatprocessing systems can be completed, tested and imple-mented once questionnaires begin arriving from the field.Last-minute changes to processing systems and proceduresbecause of misunderstandings about what is happening inthe field can be costly and take time to correct.
5. Type of enumeration
Describing the total population of a country and its geo-graphical distribution within the country are common andessential elements of all censuses. However, the definitionof what constitutes the population of an area varies fromcountry to country and largely depends on the requirementsof users. The total population may be defined to include orexclude foreigners in the country and its own nationals inother countries. It may or may not include certain popula-tion groups within the country.
While the definitions of total population vary among coun-tries, those definitions are nevertheless categorized undereither of the two principal concepts commonly adopted fora census enumeration, namely:
(a) Place of enumeration (de facto);
(b) Place of usual residence (de jure).
To avoid confusion, and thus errors, it is important thatthe same principle is adopted across the entire country.

41
(a) Place of enumeration (de facto)
This category includes all persons physically foundpresent in a country on the date or time of the census. Thetotal population will comprise all persons present in thecountry when the census is taken and enumerated at the placewhere they are at census time, regardless of their usual placeof residence. In practice, and for operational convenience,the concept is applied to the place where the person slept onthe night preceding census day or was present at a definedcensus hour.
The procedures for enumerating people who may be trav-elling or away at work during the night preceding the cen-sus day must be specified. The practice generally adoptedis to enumerate persons who may have been travellingthroughout the night preceding census day at the place wherethey are found at a reasonably early hour on the morning ofcensus day.
Enumeration staff located at railway and bus stations,ports, ferry terminals and airports will enumerate such per-sons at daybreak, after making sure that they have not beenenumerated at an earlier travel stop. Where a self-enumera-tion form is used, census managers may arrange for censusforms to be delivered to the point of departure and collectedat the point of arrival.
Persons at work on the night preceding census day aregenerally enumerated in the place where they would other-wise have slept but for having been away at work.
(b) Place of usual residence (de jure)
This includes all usual residents. All persons present attheir place of usual residence will be enumerated, as well asthose who may be temporarily absent from their place ofusual residence, irrespective of where they are at the timeof the census. Enumeration is carried out on the basis ofplace of usual residence, irrespective of whether the personis, or is not, present at that place at census time.
The place of usual residence is where a person usuallyresides and may or may not be the person’s place of domi-cile or permanent residence. The latter terms are usuallydefined in the laws of most countries. They do not neces-sarily correspond to the concept of place of usual residencewhich, as employed in the census, is based on conventionalusage and relates to census time rather than other periods.
Although most people will have no difficulty in statingtheir place of usual residence, there may be some confusionin certain cases. The following and similar cases should beprovided for in the enumeration procedures:
(a) Persons who maintain more than one residence;
(b) Students who stay in hostels;
(c) Persons who sleep away from their homes during theweek for work-related reasons and only return home for afew days at the end of the week;
(d) Defence and other personnel who live in official ac-commodations but continue to maintain residences.
Precautions will have to be taken to avoid such peoplebeing counted twice, particularly in cases where the resi-dences or places of stay are located in different enumera-tion areas. The procedures will also have to provide for suchcases as:
(a) Persons who are out of the country temporarily andlikely to return;
(b) Persons within the country who are at places otherthan their usual residence for a brief period and are likely toreturn to their usual place of residence before the expiry ofthe enumeration period.
In these cases, it is usual to prescribe clear time limits ofpresence in, or absence from, a particular place to deter-mine the place that should be treated as that of usual resi-dence.
Care should also be taken that people in these situationsare enumerated consistently so as to avoid some of thesepeople being treated one way and others in a different way.This could give rise to inequities in distribution of resources;for example, if students in one area are recorded as beingresidents of that area but in another area students in the samesituation are recorded against their parents’ address.
(c) Obtaining both place of enumeration and usualresidence
If obtaining both populations is desired, the questionnairewill have to distinguish between the following persons withreference to census day:
(a) Usually resident and actually present;
(b) Usually resident but temporarily absent;
(c) Not usually resident but present in the household.
Information will also have to be obtained about the usualresidence of those who are only temporarily present for cod-ing to their place of usual residence. The collection of suchcomplete information, especially if an interviewer methodis used, has implications with regard to the workload placedon the enumerators and supervisors.
Special care should be taken if both place of enumerationand place of usual residence are obtained, otherwise poten-tial problems with double counting may occur.
If a self-enumeration method is used, particular careshould be taken in conveying the concepts to both the enu-merators and the public. The possibility of collecting suchcomplete information will have to be a matter of judgementfor each country.
The general practice has been to adopt either of the twoenumeration methods, with some variations. The enumera-tion method may be modified from the models describedabove to reduce conceptual problems for the enumeratorand the public. For example, it may be prescribed that if aperson is away from his or her place of usual residence for acertain period before the census, and is not expected to re-turn before the census, enumeration will be conducted at

42
the place where the person is found at the time of the cen-sus. To deal with such variations, careful instructions andadequate training will be needed.
(d) Population groups
Though there is general agreement on the definitions ofde facto and de jure populations, in practice, countries rarelyachieve either type of enumeration fully. In the applicationof the concepts, differing principles are adopted with re-gard to the inclusion or exclusion in the total population ofcertain groups. These groups include the following:
(a) Nomads;
(b) Persons living in areas to which access is difficult;
(c) Defence and diplomatic personnel of the country, andtheir families, located outside the country;
(d) Merchant seamen and fishermen resident in the coun-try but at sea at the time of the census (including those whohave no place of residence other than their quarters aboardship), and workers on offshore oil rigs;
(e) Civilian residents temporarily in another country asseasonal workers;
(f) Civilian residents who cross the border daily to workin another country;
(g) Civilian residents other than those above who areworking in another country;
(h) Civilian residents other than those above who aretemporarily absent from the country;
(i) Foreign defence and diplomatic personnel and theirfamilies who may be located in the country;
(j) Civilian aliens temporarily in the country as seasonalworkers;
(k) Civilian aliens who cross a frontier daily to work inthe country;
(l) Civilian aliens other than those above who are work-ing in the country;
(m) Civilian aliens (including refugees) other than thoseabove who are temporarily in the country;
(n) Transients on ships in harbour at the time of thecensus.
Some of the groups are closely related. However, thegroups have been listed separately to emphasize that theirenumeration will have to be provided for by special proce-dures or instructions. In some cases, it will have to be de-cided whether to include them in the total population.
The treatment of these groups is not uniform. The inclu-sion or exclusion of some of the groups in the enumerationhas generally been governed by past practice, or by an ad-ministrative view of who should legitimately constitute partof a country’s population. Each country will have reasonsfor such differential treatment. However, it is recommendedthat census documentation indicate which groups constitutethe population and which groups are excluded, rather than
simply describing the count as place of enumeration or placeof usual residence. Such information will be very useful incomparing population size and characteristics among coun-tries and will also help in arriving at appropriate decisionsin the succeeding censuses in the same country.
The importance of a standardized definition of the totalpopulation to be applied from census to census must beemphasized. At the same time, the difficulties in arriving ata common definition, insofar as those difficulties arise fromthe differential treatment of the groups referred to earlier,must be recognized. Any serious variations from one cen-sus to another will considerably reduce the utility of thedata, render the study of population trends difficult and in-troduce serious errors in population estimations and projec-tions. This will have follow-on impacts on policies formedfrom the previous results.
Variations among countries in the concept or definitionof what constitutes total population have great significancein estimations and monitoring of world population. The ab-sence of uniform treatment of the groups under consider-ation could result in some of those groups being completelyomitted or double counted in the estimation of the worldpopulation. This distortion, the magnitude of which is un-known, may be growing because of the increase in popula-tion of all or some of these groups and the large interna-tional movements that have become apparent in recent years.The implicit assumption of a few decades ago that the dif-ferential treatment of these groups did not have any signifi-cant effect on the total population is no longer valid.
It would be desirable to achieve some degree of unifor-mity in the definition of total population and in the corre-sponding principles of enumeration of the groups underconsideration.
(i) Exclusion of groups in the population
Operational realities must be taken into considerationwhile defining any groups that should not be enumerated. Aspecial case exists with diplomatic personnel, who are gen-erally readily identified and can be briefed by the relevantagencies on the rules of the census and how to respond.Identifying people in other categories to be excluded dur-ing enumeration will involve some degree of probing, andthe enumerators may not always be capable of eliciting thecorrect information.
It may be better to structure the questionnaire so as toobtain the information necessary for classification into orout of an exclusion group and resolve these issues in theprocessing phase. If this procedure is adopted, the enumera-tion will include virtually all persons present in the countryat census time.
For groups not included in the total population (e.g., short-term overseas visitors), it is recommended that a clear indi-cation be provided of the population size of such groups. Ifthose groups have not been enumerated (as may be the casefor the excluded groups), they should be listed and estimatesof their size provided from administrative records or othersources.

43
(ii) Inclusion of residents in other countries
It is strongly recommended that the residents of a countrywho are located in other countries on a long-term basis beexcluded from the definition of total population. This isbecause inclusion of this group is contrary to the censusdefinition.
However, in practice, some countries have included thisgroup in their total population. Inclusion of this group hasgenerally been based on special circumstances that may pre-vail in the country, such as in countries with small popula-tions, of which a substantial proportion live abroad.
If inclusion of such groups is required, the accurate de-termination of the number of their nationals in other coun-tries will be the most important and difficult issue. Twopossible methods of collecting this information are:
(a) Enumeration through the country’s own diplomaticrepresentatives in the host country;
(b) Collection from the members of their families whoare being enumerated in the source country.
The quality of information collected by either method islikely to be relatively poor. It is suggested that the data soughtby such means be included on separate forms and limited toa few basic questions on key demographic information (e.g.,name, sex, age, relationship to head of household and dura-tion of absence from the country).
If the practice of including nationals living in other coun-tries in the total population is adopted, it is recommendedthat the total population enumerated within the country andthe total number of nationals living in other countries bepresented separately. The procedure adopted for determin-ing nationals living in other countries should also be clearlystated.
(iii) Enumeration of the defence forces
The procedures for the enumeration, and the presentationof data for this group, are matters that need special atten-tion when planning enumeration.
In some countries, defence personnel are enumerated butthe results are aggregated in a way so that these personnelcannot be identified from the published data. In particular,most countries present the data in a way that prevents theidentification and location of defence camps and concen-trations of troops. This is often a matter of state policy andsecurity.
Appropriate enumeration and tabulation procedures willhave to be developed for this purpose by each country. It isbeyond the scope of the present manual to specify the fullrange of possible procedures. However, the probability ofidentifying current locations of forces is reduced under ausual residence census. This will require careful manage-ment of the actual enumeration task to ensure that peopleare able to report their usual residence when enumerated inbarracks or defence camps. Caution should also be exer-cised to avoid the risk of double counting defence person-nel in a usual residence census.
6. Method of enumeration
The decision regarding the method of enumeration shouldbe taken in the early stages of census planning because ofthe wide-ranging influences this decision has. The methodadopted will influence the following:
(a) Budget;
(b) Organizational structure;
(c) Type of questionnaire and its content;
(d) Training programme;
(e) Content and scope of the publicity campaigns;
(f) System of management of records.
There are three main methods of enumeration:
(a) Interviewer (canvasser);
(b) Self-enumeration (householder);
(c) Use of pre-existing administrative records.
A combination of all three, or any two of the three canalso be used in one census.
Reminder questionnaire
In some Arab countries, for example, a reminderquestionnaire is distributed to each household beforethe census enumeration. Households are asked to fillin the questionnaire on the night of the censusreference day. The questionnaire contains a fewquestions such as full name, date of birth and personalidentification number. The purpose is to facilitate thetask of the enumerator, on the one hand, and to givehouseholder the time to fill in initial information fromformal documents. A face-to-face interview is thenconducted for each household.

44
The administrative method is mainly restricted to coun-tries in northern Europe. In view of its restricted applica-tion, it is not considered further in this chapter.
(a) Interviewer method
In the interviewer method, the questionnaires are com-pleted by an enumerator who conducts necessary field in-quiries, usually by interview, about each housing unit andabout each person who is a member of the household. Theenumerator then records the information on the census form.Owing to cost and time constraints, a representative adultmember of each household usually reports for all membersof the household.
The records are always in the possession of the enumera-tor and are not handed over to the household.
This method has been adopted in most developing coun-tries. It has the following advantages:
(a) Enumerators can be well trained in the concepts, in-structions and procedures;
(b) If there are sufficient numbers of enumerators and su-pervisors, the enumeration can be completed in a short time;
(c) In areas of relatively low literacy, the meaning andpurpose of the census questions can be better conveyed tothe people by oral communication rather than throughprinted material. Such direct interviews by the enumeratorselicit prompt replies, and cases of reluctance to cooperatecan generally be settled during the course of the enumera-tion itself;
(d) Within an enumeration area, the information is likelyto have fairly uniform quality and consistency;
(e) More complex questions can be included in the cen-sus than would otherwise be possible.
(b) Self-enumeration method
Most developed countries have adopted the self-enumera-tion method. In this method, the information about the hous-ing unit and the members of the household are recorded onthe questionnaire by one or more members of the house-hold. The questionnaires, along with the instructions, aredistributed to every household in advance of the census dateand received back after completion. The questionnaires canbe distributed to the households by the enumerator person-ally and collected after a fixed period of time. The enumera-tor may merely act as the agent for distribution and collec-tion or, depending on the circumstances in each country,may also assist in completing the forms.
In some cases, the questionnaires and the instructions arehanded over to the households by the enumerator, with arequest that they be completed and kept ready for verifica-tion. The enumerator will, in a second round, collect theforms, verify the entries and correct them, if necessary,through personal inquiries. In some countries, the verifica-tion process is rigorous, while in others the forms are onlyscanned to ensure that complete pages have not been omit-ted by accident.
In some cases, the forms are mailed to households on thebasis of mailing lists and received back through the mail. Inthis mail-out/mail-back procedure, the role of the enumeratoris limited. However, there will be cases of non-response orincomplete response, in which case the enumerator may haveto intervene to obtain full information. Such gaps could alsobe filled through telephone inquiries, where the facilities areefficient and widely available. The public communicationsstrategy (see chap. III, sect. A) will also play a significant rolein providing explanatory material to the respondents.
The identification and location particulars of the house-hold are generally recorded on the questionnaires prior tobeing handed over to the household. The responsibility forcompleting the questionnaire in the self-enumeration methodis that of the head, or some other responsible member, ofthe household. This method can be adopted, with the ex-pectation of reliable results at substantially lower costs thanthe interviewer method, in countries where:
(a) Literacy is near universal;
(b) Educational levels are relatively high;
(c) Communication systems are widespread and efficient.
The self-enumeration method is also conducive to greaterinvolvement of other members of the household in the enu-meration process. This is because it encourages consulta-tions among family members, which should yield more ac-curate and comprehensive information regarding the indi-vidual members of a household.
Mail-out/mail-back systems
Such systems are usually a subset of the self-enumera-tion approach. However, they often become combinationmethods (see below) through the use of interviewers to fol-low up cases of non-response to the mail system.
Countries that have used mail-out/mail-back methods haveindicated that significant further savings can accrue if thepostal and/or address register systems for mail-out are ad-equate. The preparation and maintenance of such a mail di-rectory is difficult and expensive.
A method that involves a mail-back approach has the par-ticular disadvantage of census materials being beyond thecontrol of the statistical agency for a key part of the opera-tion. This highlights the importance of some particular is-sues, including the following:
(a) Determining delivery strategies, which must be con-sidered carefully in initial planning (see chap. I, sect. B);
(b) How to monitor effectively which households havemailed back their census forms;
(c) The relationship with, and reliability of, the country’spostal services;
(d) Problems with non-response rates in particular areas.
The problems with non-response rates in particular areascan be dealt with by using interviewers to follow up on non-responding households. If there is a low response rate to themail-back operation, the costs of following up all non-re-spondents could be very high. These costs may be contained

45
by adopting direct sampling methods for those householdsthat do not respond. An important point to observe in adopt-ing such a practice is that all non-responding householdsmust have a known probability of selection in the sample.Also, the follow-up must be intensive to ensure that all se-lected households provide a completed questionnaire.
A wide range of possible sampling plans could be envis-aged, and it is beyond the scope of the present handbook toconsider them in detail. The key elements of the plan arethat (a) it must provide data of the standard required by cli-ents of the census programme, and (b) the rules and proce-dures for selecting the sampled units must be easy to apply,since this aspect of the collection will, in most cases, alsobe undertaken by temporary staff.
For example, it may be decided that a 90 per cent responserate for all geographic areas is required. Those geographicareas with response rates of, for example, 70 per cent canhave the balance of the households sampled at a rate of 2 in3 to achieve the necessary 90 per cent response rate. Geo-graphic areas with initial mail response rates of better than90 per cent could have the balance of households sampled at1 in 10. This is because there may be a difference betweenthose households that responded and those that did not.
(c) Combination methods
A combination of both interviewer and self-enumerationmethods is often used for the purpose of ensuring maxi-mum coverage. In these cases, the self-enumeration methodis adopted in areas where the response rate is likely to behigh. The interviewer method is used in areas, or commu-nity situations, where the literacy levels are low or specialproblems exist. In areas where the mailing system may beineffective or too expensive or where the terrain or climaticconditions impose constraints, the interviewer method isadopted as being more conducive to a better enumeration.
(d) Other methods
Other methods of enumeration have been adopted in somecountries.
All households may be listed in a preliminary round anda census station is then established in the enumeration area.Respondents are requested to gather at the census station inorder to give the enumerator detailed information on eachtopic. In this method, the enumerator does not visit everyhousehold for the purpose of completing the forms. The pre-liminary listing of households enables the enumerator to keeptrack of non-reporting households and ensure complete cov-erage. However, even with the adoption of this procedure,it will still be necessary for the enumerator to visit somehouseholds. This will occur in cases such as those where,owing to illness or physical incapacity, no member of thehousehold is able to report to the enumeration station.
The inhabitants of a village or people living in dispersedsettlements may be assembled at one place and enumera-tion carried out. In some cases, the head of the group pro-vides the information regarding its members. In the groupapproach, abbreviated questionnaires are generally used. Theobjective in such cases is to obtain, as a priority, reliableestimates of numbers rather than highly detailed informa-
tion relating to every member of the group. The drawbackof such a group approach is that people may not give fulland frank answers to some questions. With improvementsin communications and accessibility, and with the integra-tion of previously isolated or special groups in the largercommunities, the adoption of the interviewer method shouldbe increasingly possible in such cases.
A similar approach may also be adopted, formally or in-formally, where a community group, such as recent immi-grants, has relatively limited skills in the official languageof the country. This aproach can make effective use of lim-ited interpreter resources and/or utilize the official languageabilities acquired by school attendance of relatively youngmembers of the immigrant group.
In recent censuses, with personal awareness of the censusincreasing, there have been demands for separate enumera-tion. Those demands are still rare, but some countries allowpersons to be enumerated separately. The linkages with thehousehold and the housing unit are maintained through theuse of relevant identification codes. The questionnaire isdevised so that it can be sealed and either posted or handedover to the enumerator. The adoption of this procedure wouldimply that arrangements have been made for early check-ing of such returns and amendments through personal con-tacts, if necessary. A reduction in the numbers of such re-turns can be attempted by supervisors in difficult casesthrough personal contacts.
(e) Possibilities for change
Most countries have tended to retain the method of enu-meration they have used in past censuses. Any strategicchange in the method requires careful testing and evalua-tion before it is introduced.
Unless there is remarkable improvement in such factorsas educational levels and communication and postal sys-tems, changes in traditional systems will be fraught withrisk. This does not mean that innovation should always berejected. Even within traditional systems, it will be worth-while examining the procedures to determine possible ar-eas of improvement. Such an examination and testing ofpossible improvements can be profitably undertaken dur-ing the intercensal period and take advantage of experiencein other countries. Such methodological studies should bepart of the constant attempt to improve census practices.
7. Timing of enumeration
The time of year during which the census enumerationwill be carried out is an important planning factor. Some ofthe main issues that will determine the best time of the yearfor the enumeration include the following:
(a)—Desirability of selecting that period of the year;
(i) During which the enumeration can be carried outsimultaneously in all parts of the country,
(ii) During which it is likely to yield the mosttypical data;
(iii) During which operational problems will be least;

46
(b) Operational issues. Weather conditions that may ham-per field operations and calls for a large mobilization ofsurface or water transport vehicles should be avoided, sincethe mustering of such input may not always be possible oraffordable. The safety, retrieval, transport and storage ofcensus field records immediately after the census enumera-tions are important considerations;
(c) Seasonal conditions. Extreme heat or severe cold willpresent risks to the enumerators, while heavy rain or snowmay make some areas inaccessible. In countries with sharplycontrasting seasonal patterns in different geographical re-gions, the most suitable period of the year for the major partof the country could be selected. Additional input of trans-port, staff or other requirements owing to adverse weatherconditions in the specified areas can then be allocated. Some-times, such considerations may compel separate enumera-tion of the nomadic population;
(d) Expected change with the seasons. In some countries,the activity of large proportions of the population differs mark-edly between seasons. For example, agricultural workers mayhave a peak period of activity only during the agricultural sea-son or at harvesting time. In such cases, it is unlikely that theaffected part of the population will be able to devote the timeneeded to complete census forms. The decision as to how theseactivities can be reflected in a census can also be influencedby the design of reference periods for specific questions, andis a matter for each country to consider;
(e) Demographic and social factors. These will also berelevant if there are large migratory movements of the popu-lation during certain periods of the year (for example, un-dertaking harvest activities);
(f) Periods of long holiday festivities, pilgrimages or fast-ing, which should be avoided;
(g) Availability of personnel for the field force. In manycountries, officials such as schoolteachers are employed asenumerators and/or supervisors. The period of the year cho-sen for the census should be when these staff are availableand with the least disruption to their usual work.
8. Census reference time
Having determined the time of year in which the censusshould be taken, it is necessary to refine the timing of thecensus to a specific point in time.
An essential feature of a census is that each person, oreach set of living quarters, is enumerated with reference tothe same predetermined point in time. This census refer-ence time is usually midnight at the beginning of the desig-nated census day.
Each person alive at the census reference time is includedin the count. People who die after this reference time areincluded, while people born after this time are excluded.
This Census reference time
The choice of the time of year in which the census will may depend on anumber of factors. First, it is necessary to avoid those seasons in whichit will be difficult to reach all inhabited areas because of rains, flooding;snow and so forth or in which the work will be particularly arduous, as isthe case during extremely hot weather.
When a census has been taken and the census date is found to have beenon the whole satisfactory, the next census should be taken at the sametime of the year, unless there are strong reasons for changing this date. Aregular census date enhances the comparability of the data and facilitatesanalysis. The tradition of a fixed census date in a country also providesadministrative discipline, motivating all those involved in the census tomake necessary preparations in a timely manner.
———— Source: Principles and Recommendations for Population and Housing CensusesRevision 1 (United States Publication, Sales No. E.98.XVII.8) Paras. 1.171 and 1.173.

47
Every structure, housing unit or set of living quarters thatexist, or have reached a defined stage of completion, as at thecensus reference time is included in the housing census, irre-spective of whether it is occupied. This arrangement will givea true inventory of housing stock. If the housing census isindependent of the population census, an appropriate refer-ence time will have to be specified for the housing census.
The concept of the census reference time is relevant forcertain characteristics of the population such as age, mari-tal status and place of enumeration. Not all characteristicsare defined in terms of such a specific point in time. Infor-mation on many census topics is elicited on the basis ofother periods of time. For example, labour force status isusually based on a longer time-frame.
In actual practice, enumeration may begin before or afterthe census day. If before, the forms are either distributed orinterviews conducted over a short period before census dayand collected or updated in a short round after census day.If after census day, the forms are distributed and collectedor interviews conducted over a few days following the cen-sus reference time. In either case, the information collectedwill refer to the situation at census reference time.
Some countries have adopted a moving census day suchas the night before the enumerator’s visit or the Sunday priorto that visit. This procedure is not recommended, althoughit has been adopted where problems force the extension ofthe enumeration period over a period of a month or longer.Such problems could include:
(a) Insufficient field staff;
(b) An unsatisfactory map base;
(c) Absence of sufficient logistic support.
The rationalization for adopting a moving census day isthat the respondents will not be able to recall details of thenumber, and characteristics, of the members of their house-holds on a day significantly before the enumerator’s visit.Therefore, census day has to be moved nearer to the day ofthe visit. The adoption of this procedure involving a longreference period, while preferable to no census at all, willincrease coverage error and make the interpretation of thedata more difficult.
If experience has shown that a particular census day ordate has been found convenient and conducive to a goodcensus, succeeding censuses should preferably be conductedwith the same reference date. Unless there are strong rea-sons to depart from this practice, the timing of every censusat the same time of the year would be desirable. This willenhance the comparability of the data of each census. Thisis particularly important for data such as employment inspecific industries, or residency in holiday destinations,which may be affected by seasonal factors.
9. Duration of enumeration
The actual duration of the enumeration period must becarefully considered and the advantages and disadvantagesof each option compared. However, it is worth noting that acensus is not an exact science, and whatever the durationadopted, there will need to be some trade-off between prac-tical application of the census in the field and data quality.
Such trade-offs need to be balanced in the best interests ofthe most efficient and effective census.
The duration of the census enumeration will be determinedby the magnitude of the census operations, the availability ofstaff, logistic support and the method of enumeration. In prin-ciple, the enumeration period should be as short as possible.
In the interviewer method, the duration should allowenough time for enumerators to complete the questionnairesin their workload without being rushed. If the time providedfor interviewing is insufficient, the coverage and quality ofenumeration will suffer. Conversely, a period that is too longmay reduce the quality of the census since respondents willhave problems with recalling numbers of persons, or detailsof individual characteristics, with accuracy. In particular,extended periods of enumeration may result in incorrectreporting of numbers.
In a self-enumeration census, if the period between thedelivery of the forms and the time for collection or return istoo long, there is a risk that the forms will become lost inthe household or, at best, overlooked. In the mail-out/mail-back system, this could result in inaccurate information be-ing provided owing to problems of recall.
(a) A one-day enumeration period
Some countries plan their enumeration so that it is takenover one day. A one-day enumeration is usually achievedby all persons staying at their residence on the chosen cen-sus day.
The adoption of the one-day procedure avoids the com-plexities that may arise owing to movement of people dur-ing an extended enumeration period. However, it has cer-tain disadvantages:
(a) A large number of enumerators are required forcompletion of the enumeration in all areas simultaneouslyin one day. The enumerators will have less opportunity tobecome proficient, as compared with a longer period of enu-meration. This is because they are operating at the bottomof a learning curve;
(b) In terms of budgetary efficiency, a higher proportionof expenditure is attributable to overheads (recruitment,training, etc.) than to actual enumeration;
(c) The supervision of fieldwork may tend to be superficial;
(d) There are likely to be more coverage errors, espe-cially in urban areas where the optimum workload for a daycannot be predetermined accurately;
(e) To fit in with the shortened time period the content ofthe census will have to be restricted in comparison with whatcould be achieved with a longer period. The choice of top-ics and the degree to which information on those topics canbe collected will be limited.
In actual practice in such cases, either the forms are dis-tributed in advance for initial completion or interviews areconducted by the enumerator before census day and thenverified and updated on census day. This may overcomemany of the disadvantages listed above.
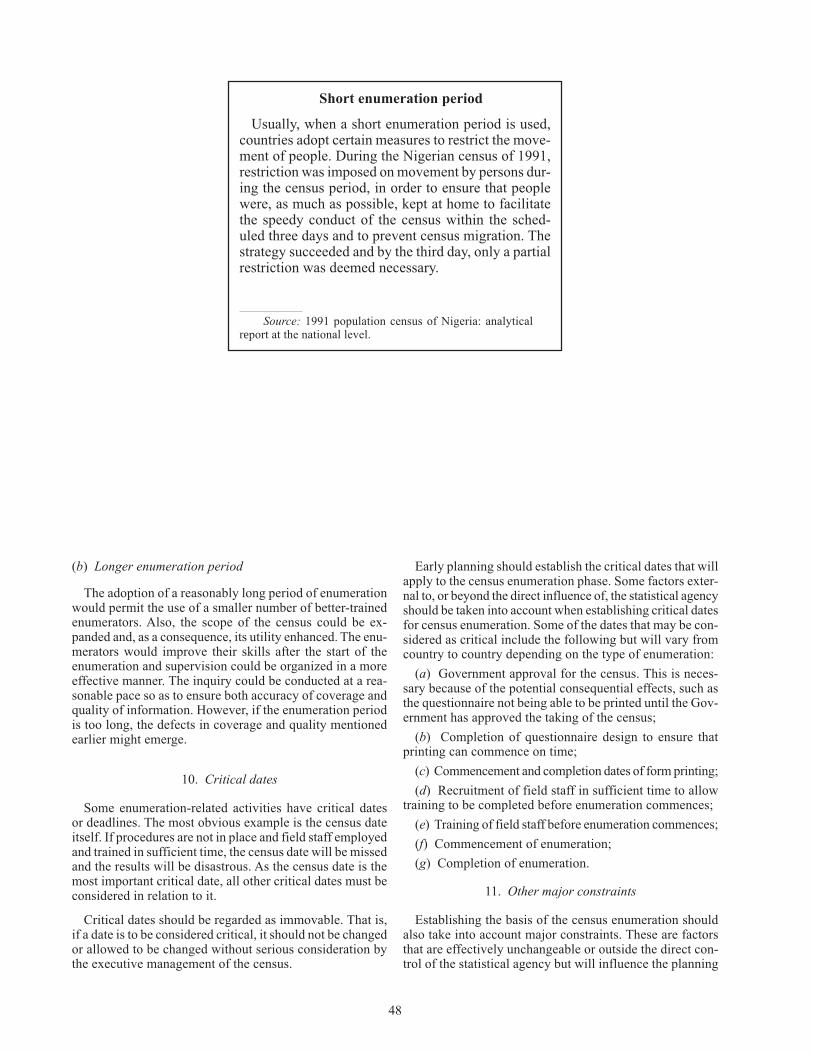
48
(b) Longer enumeration period
The adoption of a reasonably long period of enumerationwould permit the use of a smaller number of better-trainedenumerators. Also, the scope of the census could be ex-panded and, as a consequence, its utility enhanced. The enu-merators would improve their skills after the start of theenumeration and supervision could be organized in a moreeffective manner. The inquiry could be conducted at a rea-sonable pace so as to ensure both accuracy of coverage andquality of information. However, if the enumeration periodis too long, the defects in coverage and quality mentionedearlier might emerge.
10. Critical dates
Some enumeration-related activities have critical datesor deadlines. The most obvious example is the census dateitself. If procedures are not in place and field staff employedand trained in sufficient time, the census date will be missedand the results will be disastrous. As the census date is themost important critical date, all other critical dates must beconsidered in relation to it.
Critical dates should be regarded as immovable. That is,if a date is to be considered critical, it should not be changedor allowed to be changed without serious consideration bythe executive management of the census.
Early planning should establish the critical dates that willapply to the census enumeration phase. Some factors exter-nal to, or beyond the direct influence of, the statistical agencyshould be taken into account when establishing critical datesfor census enumeration. Some of the dates that may be con-sidered as critical include the following but will vary fromcountry to country depending on the type of enumeration:
(a) Government approval for the census. This is neces-sary because of the potential consequential effects, such asthe questionnaire not being able to be printed until the Gov-ernment has approved the taking of the census;
(b) Completion of questionnaire design to ensure thatprinting can commence on time;
(c) Commencement and completion dates of form printing;
(d) Recruitment of field staff in sufficient time to allowtraining to be completed before enumeration commences;
(e) Training of field staff before enumeration commences;
(f) Commencement of enumeration;
(g) Completion of enumeration.
11. Other major constraints
Establishing the basis of the census enumeration shouldalso take into account major constraints. These are factorsthat are effectively unchangeable or outside the direct con-trol of the statistical agency but will influence the planning
Short enumeration period
Usually, when a short enumeration period is used,countries adopt certain measures to restrict the move-ment of people. During the Nigerian census of 1991,restriction was imposed on movement by persons dur-ing the census period, in order to ensure that peoplewere, as much as possible, kept at home to facilitatethe speedy conduct of the census within the sched-uled three days and to prevent census migration. Thestrategy succeeded and by the third day, only a partialrestriction was deemed necessary.
Source: 1991 population census of Nigeria: analytical report at the national level.

49
or carrying out of the enumeration. The value in identifyingthese factors is that the risks associated with these constraintscan be identified and appropriate risk-management guide-lines developed. Not identifying these major constraints earlymay result in a negative impact on the census enumerationat a time when there is little or no scope to react or wherethe cost may be prohibitive. Major constraints may includethe following:
(a) Cost. While careful consideration is given to the cen-sus budget, emerging issues may result in unexpected short-falls. Given the cyclical nature and fiscal funding peaks re-quired for a census, it is generally difficult to obtain extragovernment funding if there is a shortfall. Additionally, eco-nomic rationalism by the Government of the day can placefunds already approved under review;
(b) Government or other authority decisions. For example,the Government may direct that a census be held in a cer-tain month or that a particular sub-group of the populationbe given special treatment;
(c) Production capacity. This applies particularly to pro-ducing maps and the printing of the census questionnaireand related procedural documentation. The scale and spe-cialized nature of these tasks may require technology be-yond that readily available in some countries. In some cases,it may be highly undesirable to undertake this work outsidethe country owing to loss of control and quality assurancepurposes;
(d) Logistics capacity. This refers primarily to the bulkmovement of materials (questionnaires and manuals) intothe field and their return to the processing centres. It re-quires sufficient infrastructure (e.g., roads and railways) andtransport facilities (trucks, cars, boats and possibly aircraft)to allow one of the major logistical challenges of modernsociety to operate smoothly;
(e) Coincidence of other national activities. For example,in some countries an election may be scheduled in a censusyear that may impact on the ability to obtain a sufficientnumber of enumerators. This is also a planning issue in coun-tries where an election or other national activity may becalled well into the planning of the census enumeration;
(f) Seasonal weather patterns that may make enumera-tion difficult in parts of the country;
(g) Security of enumerators in dangerous areas (e.g., ar-eas of civil unrest, see example below);
(h) Public attitudes. If the mass of public opinion is notfavourably disposed to the census operation, it will usuallyfail or be very expensive.
The purpose of identifying major constraints when estab-lishing the basis of enumeration is not to solve any associ-ated problems, but rather to take them into account in sub-sequent planning.
12. Performance Indicators
Performance indicators should be established before thecensus to enable an assessment of the quality of the enu-meration. While the performance measures may not behighly accurate, they add value to the understanding of the
census results and improve decision-making, particularlywhen combined with data quality assessments carried outduring processing. In particular, performance indicators willbe useful within the country in assessing changes betweencensuses. Many of the measures listed below will also be ofbenefit in understanding the reasons for differences betweencountries by either international agencies or individualcountries assessing their situation in relation to othersimilar countries.
Some potential performance indicators include:
(a) Rate of underenumeration, including netunderenumeration and gross overcount or undercount;
(b) Response rates to specific questions;
(c) Refusal and prosecution rates (if applicable);
(d) Number of calls to an inquiry service (if established)or comments made to enumerators, classified by type ofinquiry or comment;
(e) Extent of forms returned through other than standardprocesses (e.g., if mail-back is the standard process, howmany forms were collected by follow-up staff);
(f) Performance of the enumerators;
(g) Coincidence of political campaigns or activities thatmention the census;
(h) Adverse conditions experienced during the census(unseasonal weather, civil unrest, etc.).
It should be noted that some performance measures arebeyond the ability of the census agency to control. This doesnot lessen their usefulness in contributing to an understand-ing of the census results nor does it necessarily reflect poorlyon the census agency.
B. STRUCTURE OF THE WORKFORCE
1. Introduction
Establishing the basis of the enumeration (see sect. Aabove) defines the broad operational framework withinwhich the structure of the field workforce must operate. Thepresent section describes the geographic, logistical, com-munications and social factors that have to be consideredwhen determining the structure of the workforce to supportthe enumeration phase.
As described in chapter I, section D, and taking into ac-count the basis of enumeration, it is common for the basicmanagement structure to involve three or four layers of hi-erarchical management:
(a) Regional manager;
(b) Deputy regional manager;
(c) Supervisor (or crew leader);
(d) Enumerator.

50
The second and third groups can be combined if it is pos-sible to obtain the communications and logistical objectiveswith three groups. It is desirable to minimize the number oflevels in the hierarchy, while assuring that quality and con-tinuity does not suffer as a result.
In the Arabic-speaking countries, crew leaders are respon-sible for the marking and listing of buildings and housingunits, as well as households and establishments.
In many countries, the existing administrative structure,both centrally and in the regions, will also be used to facili-tate the management and coordination of the enumerationactivity. This varies considerably from country to country.
Apart from enumerators, other specialist staff may alsobe employed to undertake tasks such as mapping and house-hold listing (see sect. C below) or the enumeration of non-private dwellings. In some countries, these tasks may beundertaken by enumerators and managed by the structureshown above.
Assuming a hierarchical structure, there are a number of keyissues that the statistical agency needs to address in formallydetermining the structure of the workforce. These include:
(a) Roles and responsibilities of each level;
(b) Time available;
(c) Staffing ratio between the different levels.
These issues are interrelated and dependent on one anotherand should not be considered in isolation. For example, theamount of time available may well determine the roles andresponsibilities, which in turn will affect the staffing ratios.
The role of the commune chief, as shown in the censusstructure of Cambodia in 1998 (see chap. I, sect. D) is ex-tremely important in countries that are heavily rural in com-position and where there is a dependency on the tribal orcommunal hierarchy to help in the entire census process.
2. Roles and responsibilities
The roles and responsibilities at each level will vary andwill depend on the basis of enumeration. However, they willalways involve some form of management, supervision andcommunication with the level immediately below, and com-munication with the level immediately above. Several enu-merators will be dealing with one supervisor, and severalsupervisors will be dealing with one deputy regional man-ager or regional manager. The roles and responsibilities ofeach level must be clearly defined in the various instructionmanuals that need to be produced, and they should be rein-forced during training.
Governorates Census Director
Assistants
Supervisors
Crew leaders
Enumerators
Census Management Structure at the governorate level for the Palestinian Central Bureau of Statistics

51
(a) Regional manager
The role of the regional manager will include work simi-lar to that of the deputy regional manager. At this level, workwill also involve public communications activities and liai-son with targeted government and community groups. Thiswill help promote census awareness, which will assist fieldstaff during enumeration.
There would normally be little direct contact with respon-dents or enumerators, thus, regional managers do not play astrong role in direct quality assurance of the census enu-meration. They do, however, play a strong role in the qual-ity assurance of the census field administration. For example,where a recruitment and selection process is used for enu-merator positions, the regional manager may be responsiblefor vetting selection documentation and approving appoint-ments. Similarly, they may be responsible for approvingpayment of salaries and expenses.
Regional managers would communicate on a regular ba-sis with the statistical agency but usually this would involveprogress reporting rather than seeking advice or assistance.
(b) Deputy regional manager
The role of the deputy regional manager is dependent onthe basic structure of the field operation. The present hand-book assumes that there is a four-tier structure where thereis a deputy regional manager position. This will vary fromcountry to country. For example, if there is only a three-tiermanagement structure, the roles of the deputy and regionalmanager should be considered together.
Where the role of the deputy regional manager is prima-rily administrative in nature, the need for frequent (or daily)communication between these two levels is less, as is theneed for face-to-face communication. Telephone contact,where available, may suffice for most of the duration of theoperation.
(c) Supervisors
Ideally, supervisors should contact each of their enumera-tors, either in person or by other means such as telephone,on each day during the actual enumeration period.
At the very start of enumeration, the supervisor shouldspend some time with each enumerator doing on-the-jobtraining (see chap. III, sect. C). Distance and travel time arekey factors and it may be necessary for some enumeratorsto start delivering forms or conducting interviews beforetheir supervisor can join them to observe. In these cases, itis even more important that the supervisor, if at all possible,be in contact with the enumerators at some stage during theday to ask about the day’s work and to check on issues thatmay have arisen.
During enumeration, supervisors will undertake qualityassurance tasks (see chap. III, sect. F). These tasks are criti-cal and sufficient time must be allowed both during enu-meration and between the end of enumeration and when theforms must be dispatched to the processing centres. If su-pervisors have too many enumerators, they may not be ableto allocate sufficient time to quality assurance. This mayresult in errors in the data that should have been correctedin the field.
The importance of supervision
Adequate supervision of the enumeration is essential. When theenumeration lasts only a few days, control of t he quantity andquality of the work accomplished after the first day ofenumeration is recommended, in order to facilitate the correctionof inefficiencies and to maintain satisfactory progress during theenumeration period. Where the enumeration extends over morethan a fe w days, periodic and systematic assessment should beorganized.
————— Source: Principles and Recommendations for Population and HousingCensuses; Revision 1 ( United Nations Publication, Sales No. E.98.XVII.8) para.1.177.

52
If the supervisor has substantial administrative responsi-bilities in addition to training and supervising enumerators,this will impact significantly on the available time for qual-ity assurance tasks. The prime focus of the supervisor shouldbe on quality assurance rather than on administrative taskssuch as completing remuneration documents for each of theirenumerators. The role and responsibilities of supervisorsshould reflect this.
(d) Enumerators
Enumerators will usually work under general direction,following well-prescribed procedures and guidelines. Whileenumerators can be expected to solve some problems byreference to documentation, they will, on occasion, requireassistance or direction from their supervisor.
The work of enumerators will usually involve a mixture of:
(a) Contact with respondents (including interviewing,where this method is used), which will involve representingthe statistical agency to respondents, answering queries aboutthe census and providing assistance, as needed;
(b) Clerical work at home and in the field, which willinvolve understanding and applying procedures and guide-lines, and providing feedback;
(c) Travel to and from, and around, the enumeration area.
The mix of these will vary depending on the basis of enu-meration and the specific circumstances encountered.
During the peak enumeration period, enumerators willspend most of their time in the field. Therefore, they willusually only be available to report to their supervisor in theevenings, or on their way to or from their enumeration area.This means that in many cases, supervisors will need to lo-cate and meet their enumerators in the field to check onprogress and problems. When both the enumerators and theirsupervisor are in the field, it is important to address the com-munication issues that will arise.
3. Time available
A key factor in establishing the structure of the workforceis the amount of time required for communication betweenpeople at different levels in the hierarchy. For example, eachcontact between enumerators and their supervisor will taketime. Where distances are relatively great, the travel timerequired for face-to-face contact can be a significant part ofthe time required for supervisors to undertake their duties.Similar issues must be considered in planning for other lev-els in the hierarchy.
The period of greatest demand on the time of staff is theactual enumeration period (e.g., several weeks on either sideof census day), when all staff are engaged in operationaltasks relevant to their own level. This is also the period whenthey are subject to the greatest demands for across-levelcommunication. As this is the most important period in theoperation, it is the period in which the demand on the timeof staff at all levels in the structure must be considered.
Budgetary considerations will also be a factor and mayrequire that the staffing ratios are higher than would other-wise be desirable. The task is to find the right balance be-tween cost and quality in the form of available time.
4. Staffing ratios
(a) Regional manager/deputy regional manager ratio
This ratio depends to a large degree on the top-level struc-ture of the census and whether regional managers are em-ployed within the statistical agency or are part of the tem-porary collection workforce.
Where the regional managers are permanent employeesof the statistical agency they will generally have supportsuch as office facilities and personnel to assist them in man-aging communications with their deputies.
Where the regional managers are temporary employees,the ratio with deputies will be dependent on such factors aswhether the regional managers are office or home based andhow much of their role involves direct contact (e.g., train-ing) with deputies or lower-level staff.
(b) Deputy regional manager/supervisor ratio
The deputy regional manager/supervisor ratio also takesinto account available time but focuses more on the admin-istrative and management roles of the two levels in the over-all structure.
(c) Supervisor/enumerator ratio
The supervisor/enumerator ratio is the most important asit has the most impact on dealings with the public duringenumeration. The number of enumerators reporting to eachsupervisor has a direct bearing on the amount of time a su-pervisor may spend with each enumerator in training and inthe field. It will also impact on the amount of quality assur-ance that can be performed on the work of enumerators be-fore the census forms are returned for processing.
If supervisors have too many enumerators to supervise,they may be physically unable to give sufficient attention toeach individual. This may also affect their communicationwith their own manager and their ability to relay messagespromptly.
Establishing the ratio of supervisors to enumerators can-not be done by formula and will involve some level of quali-tative rather than objective judgement. It is also likely thatthe ratio will vary within a country (e.g., between urban andrural areas) owing to differing conditions in the various ar-eas. However, as a rule of thumb, a 1:5 ratio can be used asa starting point and then varied accordingly, taking into ac-count the myriad of issues to be considered. The opportu-nity of field tests should be used to confirm the feasibilityof the general supervisor/enumerator ratio.

53
C. MAPPING
1. Introduction
The quality of maps used in the census has a major influ-ence on the quality and reliability of census data.
The vast majority of countries use maps for enumeration.There have been instances where maps have not been avail-able for the census and countries have relied on householdand building lists to conduct the enumeration. This has gen-erally been the case in countries where such lists are strictlycontrolled through administrative procedures and are up todate. However, the circumstances are changing in thesecountries and using the lists for enumeration purposes is nolonger a viable method.
The enumeration activity should rely on hard-copy mapsas they play a vital role in guiding enumerators to dwellingsand other places where people are likely to be during theenumeration period. They are crucial in ensuring full andunduplicated coverage of geographic areas.
Similarly, maps, more commonly as digital products, playan increasingly important role in the dissemination phase.Statistics compiled from census data can be geographicallyreferenced and provide for methods of analysing the geo-graphic characteristics of those statistics.
The tasks and lead times necessary to create, maintain,print and distribute enumeration area maps are significant.Therefore, careful consideration should be given to the map-ping activity during the census planning and preparationphases.
Prior to developing the mapping programme for the cen-sus, consideration needs to be given to the geographic clas-sification to be used and the mapping infrastructure avail-able to carry out the mapping tasks.
2. Geographic classification
As the geography on which the census is collected willdetermine the geography on which the census data can bedisseminated, a geographic classification should be devisedin conjunction with the development of census mapping.Figure II.1 is an example of the different geographic areasand regions that may be defined for a country. These willdepend on the administrative structures of the country andthe needs of statistical data users.
In this example, the statistical areas are those that havebeen defined by the statistical agency as being the most rel-evant for users of statistical information and for which sta-tistical output is generally disseminated. The complexity ofthe statistical areas structure and the nature of the units willvary depending on the needs of the statistical data users.Administrative regions reflect the different levels of gov-ernment administration in a country and will already exist,independent of the census. Census management areas aredefined for managing census enumeration. Other areas arethose that are not part of any of the other area structures butfor which statistical data may be required.
Statistical areas may or may not relate directly to differ-ent levels of the administrative regions. However, as theGovernment is one of the largest users of statistical data, itwould be expected that some of the statistical areas willmatch directly, or aggregate to, the administrative regions(in the example above, statistical local areas aggregate tosubdistricts and statistical divisions aggregate to provinces).
Census management areas may or may not relate to ei-ther administrative regions or statistical areas as they aredevised to allow the most efficient census collection. Incountries where the collection is undertaken by other gov-ernment agencies, the census management areas may, in fact,be the same as the administrative regions.
Statistical outputs may be required for other areas, whichmay or may not be part of the geographic classification,such as, in the example, electoral areas or postal areas.Boundaries of the other areas may not match those of con-stituent enumeration areas or any other statistical areas oradministrative regions. Therefore, statistical data for otherareas may only be available on a “best fit” basis.
The definition of the various areas of the geographic clas-sification, their relationship to one another and other issuesrelating to geographic classification will not be consideredin the present handbook, except for those of direct concernto census enumeration, namely, the design of enumerationareas and the census management areas.
(a) Design criteria for enumeration areas
As the diagram above shows, enumeration areas are fun-damental to both the statistical areas structure and to thecensus management area structure. The multi-purpose na-ture of this unit needs to be reflected in the criteria estab-lished for setting enumeration area boundaries. This will bea combination of geographic classification criteria and prac-tical census collection criteria. Issues that need to be con-sidered include:
(a) The need to ensure complete coverage of the country;
(b) The ability to manage field operations effectively;
(c) The usefulness of the area for census output purposesincluding the ability to disseminate census data for varioushigher levels of geographic areas through the aggregationof enumeration areas.
(i) Complete coverage
Enumeration areas must cover the entire territory of thecountry, without any overlap or gap. This should includeareas thought to be uninhabited, even if the availability ofmapping data for those areas is limited.
(ii) Ability to manage field operations effectively
For enumeration purposes, the enumeration areas shouldbe designed with regard to the workload limits of enumera-tors. (see chap. 3, sect. B for more detail).

54
Country
Province
District
Subdistrict
Statisticaldivision
StatisticalSubdivision
Statistical localarea
Statisticalregion
Labour area
Cultural/tribalarea
Urban/ruralarea
Regionalmanager area
Deputy regionalmanager area
Supervisor area
Electoral areas
Postal areas
Administrativeregions
Statistical areas Censusmanagement
areas
Enumerationarea
Other areas
Figure II.1. Example of a geographical classification for a country

55
To enable effective management of the field operationphase, the determination of enumeration area boundariesmust consider the following:
(a) Density of population;
(b) Type of terrain;
(c) Method of enumeration;
(d) Mode of enumerators’ transport envisaged for eacharea of geography.
To assist the enumerators to undertake their work effec-tively and with a high level of accuracy, it is important alsoto specify in the criteria that enumeration area boundariesare designed so that they follow easily recognizable fea-tures thereby enabling enumerators to easily identify theirenumeration areas. These features can include roads, wa-terways, established walking tracks and railway or powerlines. The use of features such as village or local govern-ment boundaries, which may be necessary in order to pub-lish small area data or for a larger geographic area such as atown, should be carefully considered, taking into accountthe difficulty of enumerating areas with intangible featuressuch as compass bearings or lines of sight.
As well as determining the boundaries of the enumera-tion area a range of other attributes may be considered inthe design of an enumeration area for census managementpurposes. These could include matters such as defining ar-eas requiring special enumeration procedures (e.g., cultur-ally specific procedures applicable to minority groups).
(iii) Dissemination of census data
For dissemination purposes, the enumeration area designneeds to take into account the demand for small area dataand the confidentiality of personal information. An impor-tant requirement of any census is not only to meet the smallarea data needs of users, but also to present information onvarious larger geographic units.
In many cases, it is impracticable to force enumerationarea boundaries to aggregate exactly to all possible largergeographic areas. The geographic classification should makeclear the higher-level geographic areas to which enumera-tion areas must aggregate. The design processes and proce-dures should ensure that this occurs.
However, for other defined boundary areas, such as postalareas, an approximation of enumeration area boundaries maybe used to enable the dissemination of census data againstthese commonly defined areas.
There may also be other areas of particular interest to us-ers of census output. These could include distinguishingurban and rural areas, or cultural groups. Therefore, enu-meration areas may be classified during the design phase(or after census data are available) as to the degree of urbandevelopment or remoteness or may be coded to an urbancentre of which it forms a part.
An important issue to users of census information at theenumeration area level is the comparability of enumerationareas across censuses. By taking into account enumerationarea comparability issues during design, procedures can bedeveloped that will allow a comparability listing of enu-meration areas from one census to the next to be produced.
In cases where this is not possible, the criteria can outlinedesign principles that will allow users to easily compare enu-meration area-based data across censuses. For example, it ispreferable to split an enumeration area and create two areasthat exactly aggregate to the previous one. This will enableusers to easily track the movements of boundaries and per-form some time-series analyses of the disseminated data.
Another task that could usefully be done during the de-sign phase is the preparation of concordances that show thelink between an enumeration area and higher-level geo-graphic areas. Both external users and the staff within thecensus agency working on dissemination will find such con-cordances invaluable in preparing census output productsand services.
(b) Design Criteria for Census Management Areas
Census management areas will consist of aggregationsof enumeration areas brought together for ease of manag-ing the enumeration staff. The numbers of areas and levelsin the hierarchy will depend on the structure of the enu-meration staff (see sect. B above). Where already existinggovernment administrative staff and structure are used forenumeration purposes, the census management areas maybe the same as the administrative regions.
3. Mapping technology
Before census mapping can commence, the census agencyneeds to determine the appropriate technology to be used formapping. A range of different systems can be used to pro-duce maps for use in the census. At a base level, an agencycan either produce hand-drawn maps of enumeration areas,or source hard-copy geographic maps that would allow enu-meration areas to be clerically designed and represented. Al-ternatively, at the most sophisticated level, a Geographic In-formation System (GIS) could be implemented. This wouldprovide a computer-based design of enumeration areas andsignificant automation of map production tasks. Agenciesshould refer to the United Nations publication Handbook ona Geographic Information System and Digital Mapping forPopulation and Housing Censuses (ST/ESA/STAT/SER.F/79), which contains further details on GIS mapping.
(a) Hand-drawn maps
In circumstances where it has not been possible to ac-quire appropriate base maps for areas of geography, theremay be a need for enumerators (or other enumeration staff)to produce hand-drawn maps to enable successful enumera-tion. Hand-drawn maps do not possess the level of accu-racy required by high-quality topographic maps, but are aviable option when:
(a) No map exists for an area;
(b) The available maps for an area are too small a scaleto provide sufficient detail for an enumeration area map;
(c) The available maps for an area are considered seri-ously out of date and inappropriate as input into enumera-tion area maps;

56
Use of the Geographic Information System in developing countries
Being a rather complex technology and a re source-consuming one, GISneeds to be introduced in developing countries carefully and gradually.As an alternative to immediately launching full-scale GIS applications,countries may start with a simple and robust design that is likely to beunderstood and maintained by a wide array of users, transferable to awide range of software packages and independent of any hardwareplatform. GIS implementation in a d eveloping country may follow ahierarchical strategy, with the national statistical office employing ahigh-end commercial GIS with extensive capabilities for handling andanalysing large amounts of spatial data. Widespread dissemination ofdatabases can then be achieved by creating a version of t he finisheddatabases using a low-end mapping software format for distribution atlow cost.
———— Source: Principles and Recommendations for Population and Housing Censuses,Revision 1 (United Nations Publication, Sales No. E.98.XVII.8) para. 1.235.
(d) During the enumeration period, an enumeration areamap proves to be so out of date that it is deemed to be moreefficient to draw a sketch map rather than annotate changesto the enumeration area map provided.
Accurately sketching the shape and extent of an enumera-tion area in the field requires a great deal of skill and prac-tice. Even where such skills are available, the resulting hand-drawn maps are almost impossible to relate one to anotherto obtain an overview of an entire region or country. Withthe exception of circumstance (d) above, owing to the tim-ing, it is recommended that the use of hand-drawn maps beconsidered carefully against the benefits of requesting thatan area be subject to a new survey to enable the productionof an accurate base map, even though there may be signifi-cant costs incurred.
(b) Map overlays and technology assisted mapping
Where reasonable-quality topographic maps are available,they should be used as a base and hand-drawn enumerationarea boundaries can be added as an overlay. The resultingmaps may not be of cartographic quality, but enumerationarea boundaries will at least be oriented and scaled rela-tively accurately and the major difficulties of relating onesketch map to another will be mostly overcome. Bound-aries and other census information can be drawn on clearfilm overlayed on the original source map so that the twocan be photocopied together for field use or separated forother purposes.
Where accurate and current maps at relevant scales arenot available for a country, or part of a country, the follow-ing alternatives can be employed:
(a) Satellite imagery;
(b) Aerial photography;
(c) Global Positioning System (GPS).
Although relatively expensive to acquire, a satellite im-age typically covers a large area and can be cost-effectivecompared to other sources. Imagery should be pre-processedby the supplier so that it is rectified and geo-referenced (i.e.,a known scale and orientation, with some latitudes and lon-gitudes, printed on the face of the image).
While acquisition of aerial photo graphs for large tractsof a country is qexpensive, existing archives of photographscan be an excellent resource for both population and pre-liminary counts of dwellings, and as a base for rudimentarymaps. It should be remembered that aerial photographs havedistortions owing to variatiosn in height of the terrain andare only approximately oriented to compass bearings. Scal-ing, orienting and integrating the boundaries of adjoiningenumeration areas will be, at best, imperfect.
Where the only recourse is to make a hand-drawn map inthe field, this process can be greatly assisted by GPS. Asimple, hand-held GPS receiver will give latitude and lon-gitude accurate to about 100 metres. Greater accuracy isavailable with differential receivers where differential cor-

57
rections are available. A hand-drawn map can be greatlyenhanced by the addition of latitudes and longitudes recordedat a few key points on the sketch to provide orientation,scale and absolute position. Alternatively, some receiversallow the operator to electronically log positions and com-ments while traversing an area on foot or in a vehicle. Thistechnique can quickly produce a relatively accurate map.
(c) Geographic Information Systems
In recent years, many countries have adopted the use ofGIS to facilitate census mapping as these platforms offergreat potential benefits. However, they are comparativelyexpensive and are complex to maintain and operate. Adop-tion of GIS should be seen as a major strategic decision,and when looking at the benefits or otherwise of introduc-ing GIS applications many issues need to be considered.Determining the overall cost benefit of introducing new orupdated technology into the mapping project will be influ-enced by many factors, most of which will be specific tothe situation existing in each country at the time of drawingup census plans. Issues to be considered include:
(a) The relevant technical skills base in the census agency(or within other businesses or agencies that are able to con-tract services to the census agency);
(b) The computing infrastructure within the census agencyor that can be made available to the census agency undercontract;
(c) The availability of maps or digital geographic data tobe used;
(d) Determination of the functions that will be performedwithin the census agency versus those that will beoutsourced;
(e) The cost of hardware, software, maintenance and train-ing (which are likely to be much higher for a GIS solutionthan for a clerical system);
(f) The cost and time in updating base maps and bound-aries, which will be directly related to the size of the coun-try both in terms of the spatial area of the country and thesize and distribution of the population within the country.This may involve a one-time cost, with considerable ben-efits for later censuses, including possible time savings inperforming mapping activities for later censuses.
While there are many advantages for a country using GISfor its census, these need to be carefully weighed againstthe pre-requirements for the successful implementation ofGIS. The alternative to GIS is one of the more traditionalforms of a clerical-based mapping system.
In terms of the points raised above, the advantages andbenefits of GIS are as follows:
(a) GIS requires a significant level of technical exper-tise, whereas the traditional systems utilize skills morereadily available in most countries;
(b) By definition, GIS will require a higher level of com-puting infrastructure than will a clerical-based system. Oneof the benefits of GIS, namely, a closer linkage betweenmaps or enumerators and map-based products for users, re-
quires that users, as well as the census agency, have the com-puting infrastructure to utilize the output of GIS. For thecensus agency to take the lead on this issue is a significantstep towards using the census as a catalyst for an overallnational advance in capacity;
(c) A clerical census system can proceed on the basis ofrather rudimentary maps (for example, relatively old mapsfrom an administrative system supported by sketch mapsprepared by the enumerators “on the job”). However, use ofGIS in this task requires that a digital map base exists andcan be used for census purposes. If it is necessary to createthe digital map base, significant lead times are required, aswell as significant funding;
(d) In most cases, the preparation of maps and/or GISwill not be the core business of a statistical agency. It willtherefore be necessary for the census agency to determinewhich of the functions it will undertake and which will beoutsourced. This decision is of strategic importance in de-termining the direction of a country’s census effort;
(e) Producing duplicate maps (including hard-copy mapsfor dissemination) may be less expensive with a GIS solu-tion ;
(f) Space needed to store input maps for digital purposeswill be far less than with a clerical system;
(g) GIS will have increased ability to undertake qualityassurance of geographic boundaries;
(h) The census agency will have a greater ability to per-form spatial queries against the geography database under GIS.
4. Undertaking the mapping programme
The mapping programme associated with a census isamong the most daunting, costly and technically demand-ing of all census activities. With the exception of hand drawnmapping (which is an activity usually carried out by enu-merators in the field), census mapping has two broad com-ponents: statistical and technical.
There are many ways of organizing the census mappingprogramme, from the census agency undertaking the entireprogramme to outsourcing almost the entire map prepara-tion and production. The major difficulty for a statisticalagency is having a good basis in one area (statistical) com-bined often with a lack of skills in another (technical). De-cisions on this will depend on the nature of the mappingrequired for the census and the availability and levels ofskills and infrastructure either within the census agency it-self or within other government or private organizations.
Many countries have an agency that provides mappingservices to the Government and the community. The map-ping agency will usually cover a broad spectrum of map-ping including elevation, minerals, mining, land use, and soon, but often will not be involved in large scale mapping ofareas for social purposes (such as street directories and cen-suses). The exception is where a country has developed aland titles system, however, the output of these systems maynot be suitable for use in the field.

58
Maps for the 1997 census in the West Bank and Gaza.
Maps were made by the Cartographic Department of the PalestinianCentral Bureau of Statistics for all localities. There was no need toproduce hand-drawn drawn maps. Some 80 per cent of the maps werebased on aerial photographs.
Scale
• The scale 1:25,000 was used in about 90 per cent of the maps.
• The scale 1:1,000 and 1:500 was used in about 10 per cent.
• Small-scale maps for localities and governorates were produced to beused for distribution and in census reports
A team of fully qualified and trained surveyors and cartographers carriedout the process of maps updating in the field.
This meant the error rate inmetres in most cases.
estimating distance did not exceed two
Content
Maps comprised:
• Detailed sets of data pertinent to each building (e.g., number ofhousing units, number of floors, building utilization and buildingtype, in general);
• Streets;
• Roads;
• Passages;
• Other features facilitating the identification of the building;
• Borders.

59
The carrying out of a census can provide a catalyst for thestatistical and mapping agencies to work together to thebenefit of both agencies and the community. Statistical agen-cies are not mapping agencies and should not, for the mostpart, try to duplicate the functions of one. As mapping movesmore and more towards computer-based systems and GIS(which mapping agencies are usually among the first in acountry to take up), statistical agencies will find it moredifficult to establish and maintain effective and relevantmapping programmes. Likewise, mapping agencies are notstatistical agencies and often do not fully appreciate the sta-tistical value of the information they hold or how best topresent statistical information in map-based products.
(a) Census agency-based mapping programme
Regardless of the extent to which advanced technology isused, the development of a mapping system requires thecoordination of a series of complex tasks with relativelylong lead times. Therefore, it is important that project plansare established to manage this process. In broad terms, themain activities to be reflected in such plans are as follows:
(a) Establishing a mapping unit;
(b) Developing a timetable;
(c) Identifying the source of basic mapping and digitalgeographic data, if appropriate;
(d) Preparing the map base;
(e) Designing the enumeration areas and field manage-ment boundaries;
(f) Preparing maps for enumeration;
(g) Producing enumeration and dissemination maps;
(h) Developing of other dissemination map products andservices.
Each of these activities is discussed below.
(i) Establishing a mapping unit
The census mapping project requires the services of aspecialized project team. Where mapping activities are per-formed by external organizations, the mapping project teamswill be responsible for specifying the requirements of thecensus for mapping products and coordinating arrangementswith the provider of mapping services.
(ii) Developing a timetable
The mapping timetable will be dependent on several fac-tors and the critical date is the date that maps must be deliv-ered to the field to enable the enumeration activity to pro-ceed. It is therefore essential that the mapping programmecommence early in the census cycle to allow sufficient timeto produce a national coverage of maps.
The time required will be dependent on the availabilityand relevance of pre-existing material, including:
(a) Maps from previous censuses;
(b) The extent of change considered for the mapping sys-tems;
(c) The extent of change in the features to be depicted onthe maps (including, as a key element, changes in the sizeand pattern of population).
It is recommended that for any proposal beyond the mostrudimentary system, significant lead times be allocated tothis process. Even where a fully clerical system is adopted,the dependency of most other processes in the census onthe mapping system requires that it be one of the first pro-cesses to be initiated for the census.
(iii) Sourcing of basic mapping and digital geographicdata
One of the major steps in the mapping project is to estab-lish a map base of the country through the acquisition ofvarious forms of maps. If a more sophisticated mappingsystem is to be developed, digital map data will be required.
As indicated above, the availability of maps and digitaldata will determine the suitability of using clerical or GISmethods for the various mapping activities that will be un-dertaken.
In general, a census agency will be required to sourcemaps or digital geographic data from external organizations.If a census mapping project has already been establishedbefore the agency may still be required to source updates totheir existing map holdings.
(1) Basic mapping data
Official published maps may be available from nationalor provincial government mapping agencies, the local gov-ernment or municipal bodies. Special attention and coor-dination will be needed where a country’s mapping infra-structure is provided through a network of regional organi-zations.
Other sources of maps may be other government agen-cies or private companies. These may include agencies orcompanies involved in the following areas:
(a) Public utilities, such as power, water, telephone orgas services;
(b) Transport, defence or the environment;
(c) Oil or other mineral exploration;
(d) Air, rail or road transport;
(e) Automobile associations, which may maintain mapsof the road network;
(f) Commercial cartographic firms and providers of aerialphotographic services.
Where the maps are obtained from sources outside thecensus agency permission to use the maps collected mustfirst be sought from the original source, and any copyrightissues addressed. Offering an assurance that the maps willonly be used for census purposes will often promote coop-eration from mapping agencies, while particular care shouldbe taken when negotiating with non-government all sources.

60
The types of maps required for a census mapping includethe following:
(a) Small-scale reference maps for use in the censusagency to manage the overall operation;
(b) Relatively large-scale topographic maps for use byenumerators;
(c) Maps of the subregions or administrative areas abovethe village or its equivalent, for the use of supervisors andregional managers, showing the location of villages or smallpopulation settlements and dominant physical features suchas rivers, ridges and forest areas that identify the type ofterrain.
It is important that each map is relevant for its purpose.This should require that the maps for enumerators are ofsufficient size to allow all significant text to be readable infield conditions (for example in poor light). Maps for su-pervisors or regional managers should provide sufficientdetail to identify major features but not be so large as to beimpossible to manipulate easily while, for example, answer-ing a phone call from an enumerator. In many cases, the useof inset or supplementary maps may be required if the mapis to cover a relatively large area.
To complement topographic maps, or in the absence ofmaps for an area, it may be advantageous to source remote-sensing material such as aerial photographs or satellite im-age to assist in the preparation of enumeration area maps.However, the cost of obtaining such material, especiallysatellite images, and the time and expertise required to in-terpret them, is likely to be extremely high and should becarefully assessed against any benefits of using them.
(2) Digital geographic data
A major consideration in developing a computer-basedmapping system, even in developed countries, is the deter-mination by the census agency of data requirements. In de-termining these requirements, due note should be taken ofwhat data already exists, and plans to enhance that supplyonly made where a long lead time is available before thecensus.
In general, the digital data needed will be in the form ofboundary, topographic and cultural features, and made upof both geographic (spatial) and attribute (aspatial) elements.The prime purpose is to obtain the best available mappingof dwellings. In exceptional cases, the position of everybuilding may be mapped. More commonly, some other in-dicator of human occupation should be used. Where a sys-tem of recording of land ownership exists, land parcel bound-aries can be a good indicator, with small parcels of landindicating larger populations.
With increasing amounts of digital data becoming avail-able, it is also important that standards and a common dataspecification be produced to ensure data validity and con-sistency. This will also assist in the integration of data setsfrom different sources.
A wide range of data items could be considered for inclu-sion in a census mapping database. As it is likely that dataitems will vary considerably between countries, no list ofitems is suggested here. However, the key rules to be fol-
lowed in selecting data items for inclusion are to questionwhether:
(a) The data item will be useful to enumerators in navi-gating their way around their enumeration area;
(b) The data item is relevant to users.
Data items that meet neither of those criteria should notbe included in the database. Where possible, data items onlyapplicable to one purpose should only be shown in the mapsprepared for that purpose (even though both purposes maybe satisfied from a common database).
The establishment of a digital census mapping databaserequires the development of a common data specificationthat will allow data providers to manipulate their digital datainto a form useful to the mapping system, and to enable theintegration of digital data from differing sources. In deter-mining a data specification, the following issues should beaddressed:
(a) The digital format, or formats, acceptable to the orga-nization;
(b) The transfer media acceptable, for example, tape orCD-ROM;
(c) The datum and projection;
(d) The required and/or acceptable levels of detail, givenby the scale of the input mapping, for geographic areas;
(e) The delivery units;
(f) The table structure for each required feature type;
(g) The data attributes required for each feature;
(h) The symbology for each feature.
The specification of a single digital format is desirable,as this would alleviate the need for any reformatting of data.Using a range of formats will require significant resourcesto be dedicated to data reformatting and integration. Thisformat should also specify the datum and projection to beused. The type of media that can be used to receive the datawill need to be compatible with the systems deployed forstoring and manipulating the digital data.
In addition to the data specification containing the fea-ture types required by the mapping system, it also needs tooutline the attribute data required and the symbology foreach individual feature type. Attribute data is important, notonly to present named features on a map, but also for differ-entiating between features. Attribute data should consist ofnames, identification codes, feature codes, use classifica-tions, mapping source and scale, and mapping dates. Sym-bology should refer to line types and weight, line and fillcolours and cultural symbols.
(iv) Preparation of base maps
The activities associated with preparing or updating basemaps, or updating base map digital data, require substantialresources to be managed over a long period of time. Thefinal content of base maps will have a major bearing on theaccuracy and completeness of enumeration area maps and,subsequently, the effectiveness of census enumeration.

61
The updating of base maps should be scheduled accord-ing to priorities, regardless of whether it is performed bythe census mapping unit or externally. Noting that the prin-cipal purpose of all census mapping is to produce maps tocollect information from people, or to depict the outcomeof such a collection of information, it is suggested that up-dating be based on areas in which changes to the number orcharacteristics of the people require the maps to be updated.Thus, the task of setting priorities requires the census agencyto identify areas in which there has been (or will be by cen-sus day) the greatest degree of change in the population sincethe base map was last updated.
An important consideration when evaluating maps is ap-propriateness of scale and the associated detail shown. Pri-mary source maps require appropriate features to be shownif they are going to be useful in producing meaningful enu-meration area maps that will assist enumerators. Importantfeatures include:
(a) Accurately named and presented roads and water-ways;
(b) Administrative boundaries;
(c) Landmark features, such as schools, churches, postoffices, parks and large buildings.
They also need to be accurate and readable, with text andsymbols readily identifiable and correctly placed, along withthe information being presented in a standard format com-pared to other source maps. The last, and very important,quality indicator is the currentness of the base map data rep-resented.
The outcome of the base map preparation and update ac-tivities should be accurate, relevant base maps will allowfor the design of enumeration area boundaries and the sub-sequent production of enumeration maps.
(v) Undertaking enumeration area and census manage-ment area design
(1) Enumeration area design
An enumeration area design manual should be producedthat contains the design criteria and the procedures to befollowed when designing enumeration areas. The manualcan be used as a basis of training for those involved in theenumeration area design process, and should include thefollowing:
(a) Enumeration area design background;
(b) The role of enumeration areas in both census enu-meration and dissemination;
(c) The definition and explanation of higher area admin-istrative and statistical boundaries and the part they play inenumeration area design;
(d) The cut-off date for accepting changes to higher areaboundaries;
(e) The procedures to delineate areas by an urban or ruralclassification;
(f) Enumeration area design criteria, processing proce-dures and design rules;
(g) Procedures for assigning geographic identificationcodes and allocating higher area codes;
(h) The roles and responsibilities of staff involved in theprocess. The staff could be from the central census agency,regional offices or field operations.
Using a standard design manual as the basis for training,and as a reference for enumeration area designers and fieldstaff, will play a significant role in ensuring that enumera-tion area design is approached in a consistent manner.
Once the base map has been updated for a region and thecensus agency has determined the criteria for boundary de-sign, the design of enumeration areas can commence. It isrecommended that, if possible, enumeration area design beconducted by regional statistical office staff who are prima-rily responsible for enumeration areas within their provinceor regional boundaries. Conducting enumeration area de-sign at a regional office level ensures that local knowledgeof geography and population can be utilized in the enumera-tion area design process.
Enumeration area design basically facilitates the designor redesign of area boundaries to provide for such things aspopulation fluctuations (usually growth) and administrativeor statistical boundary alterations. A considerable part ofthe design process is the gathering of information to assistin determining where population and boundary variationshave occurred in order to determine the best way to designparticular enumeration areas. The information used mainlyincludes the following:
(a) Legally published boundary changes in each prov-ince or regional area;
(b) Indicators of building activity;
(c) Population data from the previous census;
(d) Intercensal population estimates;
(e) Enumerator comments from the last census fieldoperation;
(f) Field inspections;
(g) Information from local or regional governments.
If applicable, the enumeration area design process shouldbe evaluated from the previous census with a view to im-proving the process for the current census. Regardless ofwhether new systems or procedures are employed from theprevious census, any evaluation reports or mapping-relatedfeedback must be considered, particularly to determine theaccuracy and suitability of previous enumeration area bound-aries. Any comments from previous census enumerators,including notations to previous enumeration area maps,should be analysed during the design process.
There will be occasions when a lack of relevant informa-tion for specific areas will require field inspections to as-certain accurate estimates of dwellings or population countsfor those areas. Given the high cost of performing field in-spections, it is imperative that the requirements of each in-spection be well defined prior to departure to ensure thatfollow-up visits to the same area will not be required at alater date.

62
The design process must be structured so that all relevantinformation relating to enumeration areas of a particularregion will be analysed, and a systematic update of enu-meration area boundaries performed against the design cri-teria. The update of enumeration area boundaries will bethe result of splits or amalgamations of those areas, dona-tions of areas from one enumeration area to another or re-alignment of enumeration area boundaries to updated basemap features.
As a result of enumeration area design, a list should beproduced that provides the enumeration phase with all rel-evant field data for each enumeration area, and the dissemi-nation area with relevant geographical data.
(2) Census management area design
The design of field supervisor and regional and deputyregional manager area boundaries can be determined at thecompletion of the process through the simple aggregationof enumeration areas, and the subsequent allocation of geo-graphic identification codes.
(3) Quality assurance
Quality assurance should be implemented to ensure thatdata are correct to a minimum standard. Examples of thisinclude ensuring that:
(a) Enumeration area boundaries do not cross adminis-trative or statistical boundaries;
(b) Enumeration area boundaries have been drawn cor-rectly and are complete;
(c) Design has been done according to enumeration areadesign criteria;
(d) The enumeration area list contains all data items andgeographic codes for each area.
It is usually not necessary to check all design work thathas been done in this process. Traditionally, initial designwork is checked at a higher rate; once the enumeration areadesigner gains more experience, the check rate can be movedto a lower ongoing base rate.
(vi) Preparation of enumeration and dissemination maps
(1) Enumeration maps
Considerations for the preparation of enumeration mapsinclude the following:
(a) Enumerators may not be familiar with their enumera-tion areas and are not likely to be expert map readers, there-fore, the maps must be easily interpreted;
(b) Enumerators may be required to navigate in poor light-ing conditions, particularly at night;
(c) Folding and refolding of large-format maps (aboveA2 in size) is inefficient for enumeration staff (includingmore senior staff);
(d) Maps need to facilitate the addition of handwrittenenumerator comments relating to the planning of the col-lection route (blocking), difficulties in navigation, the find-
ing of new dwellings, adding and deletion of streets, etc.This information can be useful both in quality assurance ofthe enumerator’s work and in subsequent quality improve-ment of the base;
(e) Production of the maps should be cost-effective;
(f) Statistical boundaries overprinted on the maps mustbe clear and unambiguous;
(g) enumeration areas must be distinguishable when com-pared to the surrounding area;
(h) The maps should be suitable for dissemination pur-poses.
(2) Dissemination maps
It may be decided to produce a separate set of dissemina-tion maps if the enumeration maps prove to be too detailedand cumbersome for use by statistical data users. It will gen-erally be cost-effective to produce these maps at the sametime as the enumeration maps. In general, data users requiremaps to understand how the enumeration areas fit togetherand build up to higher geographic levels. Therefore, dissemi-nation maps can be usefully based on the next level of thestatistical area structure. While data users are less concernedabout topographic details, sufficient details need to be retainedin order to allow the boundaries to be readily identified, aswell as the presence of social and cultural features, such asschools, hospitals and major retail and work areas.
(vii) Map production
Maps should be provided to every level of field staff. Dif-ferent levels will require different scale maps.
At least one map must be printed for every enumerationarea in the country. It is recommended that two copies ofthe map be produced, one copy to be used by the enumera-tor and the other by the field supervisor for training andreference purposes. A larger-scale map for supervisors show-ing all of the enumeration areas in their area of responsibil-ity should also be produced.
Maps should also be printed for regional managers show-ing the areas they are responsible for and the areas for whicheach of their subordinates is responsible. Such maps are anessential part of the managerial tools provided to the re-gional manager by the census agency.
It should be noted that regardless of whether clerical orGIS processes are used, this task can take a significantamount of time and will be performed relatively close tothe end of the project. Careful consideration should be givento the time required for this work when establishing theproject plan for census mapping.
(viii) Preparation of other dissemination products andservices
While mapping for enumeration purposes rightly receivesthe highest priority and attention from census managers, itwould be useful if the needs of dissemination could also beaccommodated in the process. This may prove to be cost-

63
effective and may provide flexibility for the use of the map-ping data for other purposes. Factors that should be consid-ered include the following:
(a) A format. As formats are those that are widely usedwithin the country, output products can be prepared readilyto meet a wide market;
(b) The suitability of the data for commonly availabledesktop mapping applications. The map database for prepa-ration of enumeration maps may be large and detailed andmay present problems for desktop mapping use. In this case,a programme to thin the data set may be required.
(b) Contract/agreement based mapping programmes
The development of a mapping project beyond rudimen-tary clerical systems requires considerable knowledge ofmapping, cartography and geographic systems. In the eventthat a census agency cannot draw on such skills from withinthe agency, it may be required to contract out the prepara-tion of census maps.
Establishing a contract or agreement between the statisti-cal and mapping agencies is based on the specification ofthe statistical agency’s requirements and the mappingagency’s ability to meet those requirements at an agreeablecost. In some cases, the production of a complete, digitizedbase map of a country suitable for a census (and, subse-quently, electoral, postal and other purposes including com-mercial ones may be a sufficient reason for the Governmentto approve additional funding, on an exceptional basis, toestablish the base map. A complete, consistent base map ofan entire country suitable for small-scale activities is a na-tional resource of high value. In other cases, a contract oragreement between the agencies provides the opportunityfor the mapping agency to consolidate or increase its ownmapping skills and capacity while lessening the resourceand technical burden on the statistical agency. The two agen-cies must develop a cooperative and long-term (or strate-gic) relationship, but the outcome will be worth the effort.
For the census, a mapping agreement between the agen-cies would comprise two broad elements:
(a) Mapping for field purposes;
(b) Mapping and map-based products for disseminationpurposes.
Using the same base map as the common source for bothof these elements adds a level of quality assurance and con-sistency to the census programme that can be difficult toachieve where field and dissemination mapping are twoseparate elements.
Mapping for field purposes under a contract or agreementbasis requires the statistical agency to specify its require-ments of the mapping agency. These may include the fol-lowing:
(a) Acquiring the base map data;
(b) Creating (or obtaining) the statistical boundaries andaligning them to the base map;
(c) Providing a process for enumeration area designersto advise on changes to boundaries (and updates to associ-ated aspatial data);
(d) Producing hard-copy maps as specified for field work.
The statistical agency would undertake the enumerationarea design work and validation of the associated aspatialdata, as well as take delivery of the hard-copy maps for qual-ity assurance checks and subsequent delivery into the fieldlogistics programme. The statistical agency would also pro-vide, after the census, any feedback received from enumera-tors about the base map that may be of use to the mappingagency.
Mapping for dissemination purposes is more difficult be-cause the outputs will involve representation of statistical in-formation (with, or as part of, a map) and often be accompa-nied by analysis or commentary about the information. Ad-vances in mapping software have made it easier for censusagencies to produce a wide variety of standard thematic maps.
However, advanced mapping products may require theexpertise of the mapping agency. In these cases, it may bebetter for the statistical agency to focus on the statistics andlet the mapping agency provide the technical skills requiredto produce the actual products.
The statistical agency would direct the development ofmap-based products as part of the overall output plan, tak-ing into account user needs and requirements and the de-mand for different types of products. For example, it maybe established that there is a strong demand for a series ofthematic maps showing population change between cen-suses. The statistical agency would determine how the finalmaps should look, what standards should be applied (colourscales, etc.), what analysis should be included and how itshould be presented and so on. The mapping agency wouldproduce drafts of the maps using the information provided.These would be reviewed, changes made and so on until theproduct was final.
Part of the contract or agreement would cover how bothagencies are represented in the presentation of maps (e.g.,logos) and what financial arrangements would apply whereproducts were sold.
D. FORM DESIGN AND TESTING
1. Introduction
The purpose of the census form, or questionnaire, is to cap-ture data. A well-designed form captures data efficiently andeffectively, with the minimum number of errors. It would bepossible to devote an entire handbook to the principles asso-ciated with form design but for the purposes of the presenthandbook some fundamental issues are discussed in the sec-tions below. Further detail on recommended questions to beasked in a census can be found in Principles and Recommen-dations for Population and Housing Censuses, revision 1.1
It is also recommended that countries draw on the experi-ence of other countries by obtaining examples of forms usedin previous censuses. However, caution should be exercised
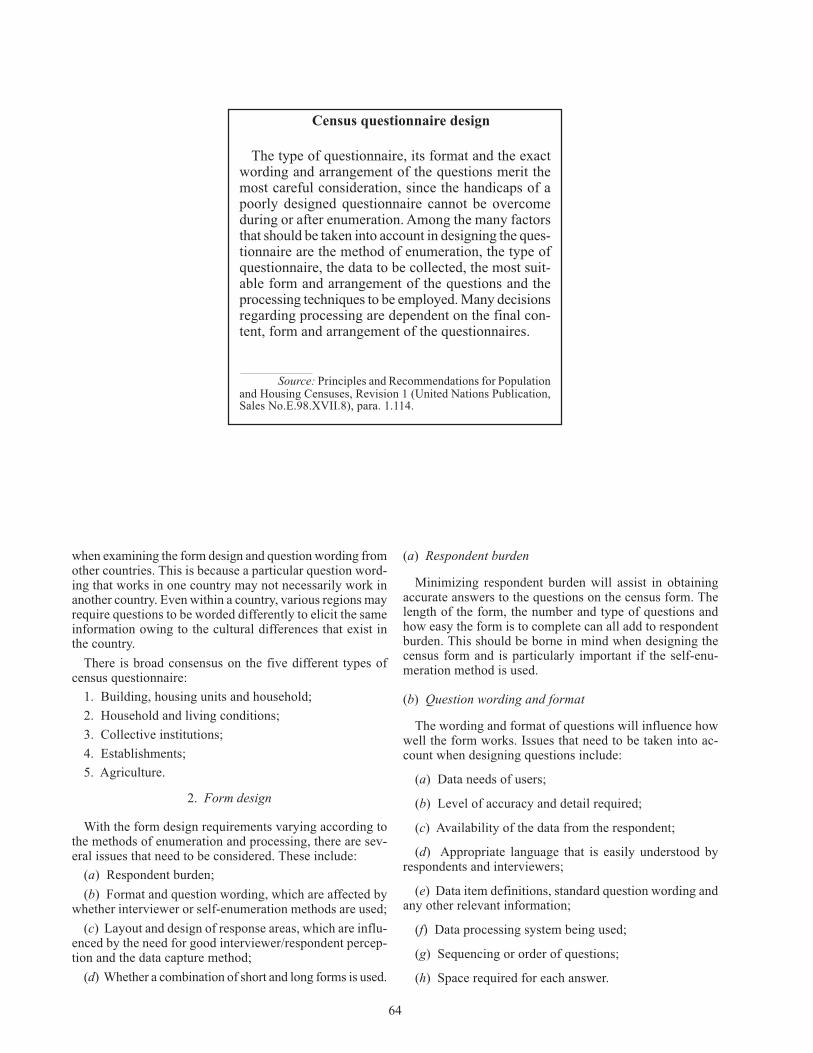
64
when examining the form design and question wording fromother countries. This is because a particular question word-ing that works in one country may not necessarily work inanother country. Even within a country, various regions mayrequire questions to be worded differently to elicit the sameinformation owing to the cultural differences that exist inthe country.
There is broad consensus on the five different types ofcensus questionnaire:
1. Building, housing units and household;
2. Household and living conditions;
3. Collective institutions;
4. Establishments;
5. Agriculture.
2. Form design
With the form design requirements varying according tothe methods of enumeration and processing, there are sev-eral issues that need to be considered. These include:
(a) Respondent burden;
(b) Format and question wording, which are affected bywhether interviewer or self-enumeration methods are used;
(c) Layout and design of response areas, which are influ-enced by the need for good interviewer/respondent percep-tion and the data capture method;
(d) Whether a combination of short and long forms is used.
(a) Respondent burden
Minimizing respondent burden will assist in obtainingaccurate answers to the questions on the census form. Thelength of the form, the number and type of questions andhow easy the form is to complete can all add to respondentburden. This should be borne in mind when designing thecensus form and is particularly important if the self-enu-meration method is used.
(b) Question wording and format
The wording and format of questions will influence howwell the form works. Issues that need to be taken into ac-count when designing questions include:
(a) Data needs of users;
(b) Level of accuracy and detail required;
(c) Availability of the data from the respondent;
(d) Appropriate language that is easily understood byrespondents and interviewers;
(e) Data item definitions, standard question wording andany other relevant information;
(f) Data processing system being used;
(g) Sequencing or order of questions;
(h) Space required for each answer.
Census questionnaire design
The type of questionnaire, its format and the exactwording and arrangement of the questions merit themost careful consideration, since the handicaps of apoorly designed questionnaire cannot be overcomeduring or after enumeration. Among the many factorsthat should be taken into account in designing the ques-tionnaire are the method of enumeration, the type ofquestionnaire, the data to be collected, the most suit-able form and arrangement of the questions and theprocessing techniques to be employed. Many decisionsregarding processing are dependent on the final con-tent, form and arrangement of the questionnaires.
Source: Principles and Recommendations for Populationand Housing Censuses, Revision 1 (United Nations Publication,Sales No.E.98.XVII.8), para. 1.114.

65
The use of different languages in the census
Special provisions will have to be made if two ormore languages are used in the country. Several meth-ods have been used to deal with this situation: a singlemultilingual questionnaire, or one version of the ques-tionnaire for each major language, or translationsprinted in the enumerators manual of the questionnairein the various languages. The problem is more seri-ous in the case of non-written languages. Staff re-cruitment and training procedures (see paras.1.133-1.138) will also have to take language problems intoaccount. Information on the distribution of languagesin the country is important for sound census planningand; if not available, will have to be collected at somestage of the census preparations.
———— Source: Principles and Recommendations for Population
and Housing Censuses, Revision 1 (United Nations Publication,Sales No.E.98.XVII.8), para. 1.116.
An important factor to note here is language diversity. Forexample, Indonesia has 300 spoken languages and Zambiahas 73 different dialects. This proliferation and diversity oflanguages has a direct effect on the methods and techniquesused to train field staff, as well as on the census managementstructure and questionnaire preparation. This may require thequestionnaire to be provided in more than one language. Ad-ditionally, field staff may have to be trained to translate intothe regional languages and/or dialects spoken in the area.
(c) Layout and design
(i) Interviewer/respondent perception of the form
The layout and design of the form will have a direct im-pact on how interviewers or householders will complete theform and the accuracy of the data supplied. Therefore, spe-cial consideration should be given to graphic presentation,placement and presentation of instructions, the use of space,layout and colours and the wording used.
Poor use of any form design element, be it language, ques-tion sequencing or layout, creates an obstacle for the re-spondent or interviewer. Each obstacle may be only minor,but they all accumulate in the person’s mind until a point isreached when the person no longer cares about what re-sponses go on the form. As the purpose of the census formis to obtain high-quality information, it is important to mini-mize obstacles so that the form is filled in before this pointis reached.
(ii) Processing system requirements
Differing requirements for the data-capture components ofprocessing systems, ranging from key entry to electronic im-aging through scanners, will require markedly differing formdesign. The form design requirements and form size for dif-fering technologies may vary greatly and should be taken intoaccount when designing the forms. It is also important to notethat it is possible for the form design to easily incorporateprovision for contingencies in data processing. For example,even though a form may be designed for automatic data cap-ture (e.g., imaging, character recognition), it is a simple taskto include space and codes alongside response areas on theform. By incorporating these codes on the form, responsescan be easily key entered, if necessary, owing to the failure ofthe intelligent character recognition system.
It is important that the respondent’s perception of the formis not unduly impacted by data-capture requirements.
When designing forms for more advanced data-capturemethods, such as imaging, it is necessary to establish thatthe respondents are able to provide answers in a suitableformat that can be recognized by the data-capture equip-ment. If the forms are self-enumerated, this will requireextensive testing that includes processing of live data fromtests.
A general principle that should be adopted is that pre-coded response areas should be used as much as possible.Open-ended questions should be limited to essential topicssuch as occupation and industry.

66
(d) Format of census forms
The choice of format for the form will be influenced bythe enumeration method. Census forms can be householdforms or individual personal forms. A household form canbe arranged as a matrix providing for answers from all mem-bers of an average-sized household on each page. Anotherapproach to the design of household forms is the use of abooklet, with all of the personal questions asked first forperson 1, then repeated for other persons in the household.Annex VII includes different types of census forms. Theform used in the Argentinian census of 1991 is an exampleof a questionnaire designed as a booklet. The census formused in Botswana in 1991 is an example of a questionnairearranged in a box format. The form used in South Africa in1996 is an example of a column format. The examples ofthe census forms used in Uruguay and in New Zealand areincluded to highlight the differing requirements for auto-mated data capture. Uruguay is an example of a system thatrelies on optical character recognition and New Zealandrepresents a system that relies on optical mark recognition.
3. Form testing
It is likely that as the census form is developed it willundergo several changes as its performance is tested andevaluated. Many countries concentrate their testingprogramme on new topics or questions, but it is also impor-tant to test the impact that these new questions may have onother questions on the form.
The principles of good form development are:
(a) Always evaluate the performance of a form beforechanges are made;
(b) If necessary, change the form to improve its perfor-mance;
(c) Always evaluate the form after changes are made tofind out if its performance has improved.
The evaluation of tests provides the basis for good formdesign. However, there is no single best procedure for evalu-ating forms. Each procedure will provide a slightly differ-ent view of a form’s performance. For example, three pro-cedures that can be adopted are the following:
(a) An analysis of errors. This will provide data on themost obvious errors that respondents make, but does notexplain why the errors occur;
(b) Cognitive testing. During this procedure, respondentsare observed completing the form;
(c) Analysing the quality and level of detail given in re-sponse to particular questions on the form.
Using these procedures will give an overall picture of theform’s performance, with each particular procedure givinga distinctive, though incomplete, picture of the relationshipbetween the form and the respondents.
(a) Analysis of errors
An analysis of errors consists of counting and tabulatingthe number and type of errors that have occurred on a sampleof forms during field tests or from the previous census.
The purposes of an analysis of errors are the following:
(a) To find out what errors are occurring on a form;
(b) To provide a benchmark against which to judge theform’s performance;
(c) To provide information on which to base modifica-tions of the form which will lead to a reduction in errors;
(d) To determine the costs of repairing the errors, bothbefore and after re-design.
An analysis of errors is the most important quantitativemeasure of a form’s performance. It is the basic quantita-tive benchmark against which the performance of one formcan be compared with another. It also provides an estimateof some of the less obvious costs such as:
(a) The repair of errors in the processing phase whichcan be expensive;
(b) Respondent burden.
If errors remain unnoticed, they can seriously affect thequality of data; good design can reduce the incidence oferrors on forms. However, it is not possible to improve thedesign of a form if it is not known how the form has per-formed in the past. Therefore an analysis of errors shouldalways be conducted first before attempting to improve thedesign of a form. After the form has been improved anotheranalysis of errors should be conducted. A comparison of thebefore and after results is the best evidence that the formhas been improved.
There are many kinds of errors, and they have a varietyof different causes for which different remedies are neces-sary. When conducting an analysis of errors, it is importantto distinguish between the different kinds. There are gener-ally three basic types or errors: (a) omission, (b) commis-sion and (c) mistakes.
(i) Omission
Errors of omission occur when respondents fail to answera question. Respondents may fail to answer a question be-cause they do not notice it, because they deliberately avoidit or because they do not understand it.
Omissions are extremely hard to diagnose in an analysisof errors, partly because they can be due to many reasons.Also, a blank answer space on a form may be perfectly le-gitimate and not particularly significant in itself. The rea-sons for these errors have to be analysed in conjunction withother procedures.

67
(ii) Commission
Errors of commission result when respondents give infor-mation they were not asked for. They can arise because of amisunderstanding of questions or incorrect assumptions. Com-missions are easier to notice than omissions in an analysis oferrors, but caution should be exercised in drawing conclu-sions without the support of results from other investigations.In most cases, unnecessary information is not as expensive todeal with as omissions or mistakes. Errors of commissionoften result from failure to follow routing instructions suchas “Go to part...”. While the additional answers provided arenot harmful in themselves, the increase in respondent effortand often frustration can have a serious effect on how accu-rately the remainder of the form is completed.
(iii) Mistakes
These result when respondents give incorrect information.There are many reasons why people make mistakes on formswhich lead to problems in identifying the causes of this typeof error. Moreover, not all mistakes are noticeable. For ex-ample, if the question on the form asks respondents to givetheir income and they give their net income when their grossincome was needed, the mistake would go unnoticed unlessthere was an independent check. However, one of the greatadvantages of analysing mistakes is that many of them aredirectly observable and they can provide clues to a form’sperformance. Other procedures, such as cognitive testing, canbe used to determine the causes of mistakes.
(b) Cognitive testing
Cognitive testing can be used as a viable supplement tofull-scale field testing. In essence, cognitive testing involvesa market research approach to form design testing. Typically,cognitive testing will comprise a mixture of the following:
(a) Focus group research. This is often referred to as “be-hind the glass testing” where a moderator leads a group ofpeople through a structured discussion;
(b) Observational studies. This is where observers watchrespondents complete forms in the environment in whichthey would normally do this, for example in their home.
As noted elsewhere cognitive studies are relatively ex-pensive. To ensure the studies are directed at the topics ofparticular interest, an abbreviated form could be prepared.Where necessary, specific demographic groups will be re-cruited as subjects for cognitive testing. For example, shoulda topic relating to country of birth be tested, the panel ofpeople for cognitive testing should include a high propor-tion of immigrants.
Advantages of cognitive testing include the opportunityto closely observe participants in completing the test form.Factors such as the time it takes to read instructions, theorder in which questions are answered and the care takenwhen completing the form can be assessed. The facilitatorof the cognitive testing exercise can also involve partici-pants in a discussion during which specific questions canbe asked. As a result, form designers are given a greaterdepth of understanding of how particular questions are in-terpreted by respondents.
Purpose of Test Time to Census Date
Specific purpose test for proposed new question 3 years
Form design and enumeration procedures 3 years
Specific purpose test for proposed new processing technology 3 years
Specific purpose test for enumeration procedures in remote area 2 years
Major test (or pre-test) of final form design, enumeration and processingsystems
2 years
Dress Rehearsal (or pilot test) of enumeration, processing and disseminationsystems and procedures
1 year
Table II.1. Census from testing programme

68
Extreme care should be taken when assessing the resultsof cognitive testing. By necessity, sample sizes are smalland problems with form design may not be detected. Con-versely, because of the small sample size and specific de-mographic groups selected, the significance of problemsdetected may be biased. The fact that testing conditions arenot identical to census conditions should be considered.
(c) Analysing the quality and level of detail provided
This is particularly important for open-ended questionssuch as occupation. How the question is worded will im-pact on the level of detail given by the respondent. Subse-quently, the level of detail given by the respondent will im-pact on how the response can be coded and, ultimately, onthe quality of the output from the census.
Therefore, as part of the testing programme, these ques-tions should be coded to the established classifications toensure that the level of detail being reported is sufficient forcoding purposes.
4. Census tests
The approach to testing will be greatly influenced by thesize and diversity of the population, the enumeration method,the processing method and the resources available. It ishighly desirable to provide for more than one form design
test to eliminate the need of having to use an untested ques-tion in the census itself. Form design is only one of severalobjectives in testing.
The test programme should be comprehensive enough totest effectively all of the main components of the census.As well as testing the form, the test programme should testany guide or other information booklet, enumeration proce-dures (including training and administration of temporarycensus staff) and processing procedures. Ideally, at somestage during the programme each of the major systems tobe used in the census should be tested, up to and includingthe delivery of output.
In general, the earliest tests will focus on form designissues and any of the collection procedures that warrant test-ing, such as enumeration area design, mapping and enu-meration management. Later on in the testing programme,testing should include processing systems and proceduresand dissemination systems.
The testing programme should include a final pilot test (ordress rehearsal) well in advance of the census. This is a finaltest, at which the enumeration, processing and disseminationsystems, and the interface between them, are given a finaltest to resolve any outstanding problems. The form designshould not be changed after this final test. This test also pro-vides an opportunity to revise the costing estimates. In orderfor this to happen, the final form design needs to be availableand all systems have to be acceptance tested beforehand.
The Pilot Census
The kind of tests usually carried out first during census prepara-tions are questionnaire tests. Their purpose is to test the suitabil-ity of intended census questions, including their formulation andthe instructions provided, as well as the suitability of the question-naire design.
A comprehensive test of all census procedures is often called apilot census. Essential features of a pilot census coverage of oneor more sizeable administrative divisions and encompassment ofthe preparatory, enumeration and processing stages of a census,by which it thus tests the adequacy of the entire census plan and ofthe census organization. In order to best serve this purpose, itshould be undertaken in conditions resembling the actual enumera-tions as close as possible. For this reason, it is often taken exactlyone year before the planned census so as to conform with the ex-pected seasonal patterns of climate and activity. It is generallyunwise to consider the pilot census a source from which to deriveusable substantive data. Apart from the sampling problems in-volved, such a use inevitably detracts from the central purpose ofthe pilot.
———— Source: Principles and Recommendations for Population and Housing
Censuses, p.21, paras. 1.120-1.121.

69
Table II.2, an example of a testing programme, is a guideto the type and timing of tests that may be conducted in thelead up to a census. The nature of the testing programme foreach country will largely depend on the resources available.It will also depend on factors such as the extent of proposedchanges to the form, procedures and processing systems.
5. Methods of testing
Testing requires some benchmarks against which the trialprocedures can be assessed. Often this can be the procedurethat was used in the previous census, otherwise it can besome externally determined standard, which it is agreed mustbe met. It is common to use “split samples”. This is whereone part of the test population is subjected to one procedureand another part to a second procedure, with the resultsanalysed to determine which is the better outcome. The splitsample approach is ideal for testing form design changes.
For tests to provide reliable results, it is important to de-sign them to reflect as much of the final census environ-ment as possible. Field operations, for example, should re-semble census conditions as far as possible. However, us-ing central office staff to do most of the work should beavoided. Assistance provided to respondents in the testshould be similar to that available in the census proper. Pro-cessing of test data should also replicate census proceduresas far as possible.
Recruiting, training and paying the staff necessary to carryout a test of the size necessary to produce worthwhile resultsis a major exercise, which will incur significant expenses.These expenses should be fully included in the total costingof the census. The importance of adequate testing to ensuresuccessful census outcomes should not be underestimated.
E. INSTRUCTION MANUALS
1. Introduction
The present section includes suggested contents for theprimary handbooks (or manuals) required for field opera-tions. They are divided into three categories, representingthe three levels of field staff used in this handbook. Theseare:
(a) Enumerators;
(b) Supervisors;
(c) Regional Managers/Deputy Regional Managers (aregional manager cannot supervise between 20 and 35 per-sons; in many countries, there may be someone in betweenand thus, quality can be enforced).
Given the hierarchical nature of the census operation, thehandbook for each level of staff should supplement the hand-book for the level below it. Therefore, the enumerators’ hand-book will contain detail appropriate to that level, whereas thesupervisors’ handbook assumes that the supervisor is famil-iar with the content of the enumerators’ handbook. Detail inthe supervisors’ handbook provides additional information
about enumerator duties but avoids repeating material alreadyincluded in the enumerators’ handbook. Therefore, whilemany headings will be the same between handbooks, the con-tent under those headings will differ in each. The main ex-ceptions would be the timetable and introductory parts, wheresome repetition is necessary or desirable.
All handbooks (and other manuals and materials) shouldaim for commonality, wherever possible. This includes con-sistency of layout, style and imagery (logos, etc.). The useof different colors for covers is recommended to provideeasy distinction between topics.
2. Enumerators’ handbook
The enumerators’ handbook is, with the exception of theenumerators’ record book, the most important field docu-ment. It details the responsibilities and tasks of theEeumerator and should provide sufficient information foran enumerator, after training, to work independently in thefield. While the enumerators’ handbook will often be theonly reference available in the field, and as such should in-clude sufficient information to cover most eventualities, itshould not attempt to cover every eventuality. This may leadto the handbook being too bulky and give enumerators theimpression that the job is more difficult than it really is. Theaim should be to cover most ordinary situations in somedetail and provide guidance on how to deal with unusualsituations, should they occur.
The enumerators’ handbook should focus on issues re-lated to census taking and avoid including information aboutadministrative arrangements (such as recruitment and pay-ment), which should be provided separately.
Topics, particularly process-type activities (such as fill-ing in a form) should be covered in bullet (or dot) pointform, wherever possible. This will assist in quick referenc-ing, particularly when in the field.
(a) Timetable
It is recommended that a timetable of census tasks andactivities be included on the inside front cover (or first pages)of all handbooks. This would provide easy referencingthroughout the operation.
(b) Introduction
The introduction section should describe the census, whotakes it and why. It should introduce the goals and objec-tives of the census, emphasize the importance of theenumerator’s role, explain how to use the handbook anddescribe the overall operational arrangements. Suggestedsections include:
(a) About the statistical agency;
(b) About the census;
(c) Census organization;
(d) How to use the handbook.

70
(c) Enumerator responsibilities
This section provides a summary of the role and respon-sibilities of enumerators and also covers some practicalmatters associated with safety, lost material and so on.
Suggested sections are as follows:
(a) Enumerator duties;
(b) Enumerator conduct;
(c) Identification;
(d) Safety;
(e) Confidentiality;
(f) Lost materials;
(g) Access to dwellings;
(h) Handling materials;
(i) Marking questionnaires;
(j) Checking questionnaires.
(d) Before training
This section describes what enumerators need to do be-fore they attend training. This may include reviewing theirarea, reading their handbook and completing a home studyexercise. It is important that enumerators receive the hand-book and other relevant census materials so that they canreview them before the testing. Suggested sections are:
(a) Collecting or receiving materials from supervisor
(b) Reading enumerators’ handbook;
(c) Completing home study exercise;
(d) Checking or updating maps;
(e) Reviewing enumeration area (if practical);
(f) Planning enumeration route or path;
(g) Advice about managing time.
(e) Training
This section describes each part of the training and whatwill be covered. It should include a brief description of howtraining will be conducted and how enumerators will be askedto participate. Suggested sections include the following:
(a) Preparation;
(b) Training session;
(c) On-the-job training.
Enumeration
The structure of the handbook at this point will need totake into account the type of enumeration and whether thereis a pre-listing exercise to be carried out. For the sake of
completeness, the content here assumes that there is a pre-listing exercise and that there will be a delivery and collec-tion period (i.e., drop-off/pick-up method). If the census isinterview based, the delivery and collection sections can becombined into a single enumeration section.
(f) Pre-listing
This section covers activities associated with pre-listing(if conducted).
Suggested sections are:
(a) Purpose;
(b) Preparation;
(c) Method to be used;
(d) How to complete pre-listing forms;
(e) Conducting the pre-listing exercise;
(f) Checking completed workloads.
If pre-listing is done prior to census day, there may be aneed for separate measures for the turnover.
(g) Delivery
This section covers the delivery period in essentially achronological manner. It should focus on what will happenmost of the time, while taking into account special cases orpotential problems. Suggested sections include:
(a) Before approaching dwellings;
(b) Making contact;
(c) Completing the record book and questionnaire;
(d) Large households;
(e) Special (non-private) dwellings;
(f) Refusals or objections;
(g) No contact made;
(h) Unoccupied dwellings or vacant blocks;
(i) Delivery checks.
(h) Collection
This section covers the collection period in a manner simi-lar to that of the delivery section. Suggested sections in-clude:
(a) Before approaching dwellings;
(b) Making contact;
(c) Checking questionnaires and completing the recordbook;
(d) Special (non-private) dwellings;
(e) Refusals or objections;
(f) No contact made;

71
(g) Unoccupied dwellings or vacant blocks;
(h) Creating dummy questionnaires or record entries;
(i) Collection checks.
(i) Conducting interviews
This section should be included when the enumerator fillsout the questionnaire. Suggested sections are as follows:
(a) Introduction to the household questionnaire;
(b) Introduction to the individual questionnaire;
(c) Principle of interviewing;
(d) The art of asking questions;
(e) How to write in the questionnaire;
(f) Explanation of procedures;
(g) Births/deaths and so on.
(j) Review of completed materials and reviewing com-pleted work
This section sets out what should take place immediatelyafter the enumeration is completed. It focuses on quality-related issues and ensuring that all questionnaires are ac-counted for and that enumerator checking is complete. Sug-gested sections are:
(a) Sorting and checking questionnaires;
(b) Completing summary records;
(c) Packing questionnaires and materials;
(d) Returning materials to supervisor;
(e) Certifying work completed;
(f) Administrative procedure.
Annexes
Annexes are not essential. There may be some topics ormatters, however, that are better covered as a separate an-nex rather than within the body of the handbook, for ex-ample, a list of definitions that will be needed by enumera-tors. A list of frequently asked questions, about working asan enumerator or by respondents, can also be useful to as-sure enumerators that they are not the only ones with suchquestions. Annexes may include the following:
(a) Definitions or glossary;
(b) Census scope;
(c) Frequently asked questions;
(d) Additional mapping information;
(e) Explanation of census questions.
3. Supervisors’ handbook
(a) Timetable
The timetable is similar to the one included in the enu-merators’ handbook but covers additional tasks and activi-ties required of supervisors.
(b) Introduction
The introduction may contain information in addition tothat included in the enumerators’ handbook. For example,it may contain more detailed information about census pro-cessing that will help supervisors better understand their rolein a quality census. Suggested sections are:
(a) About the statistical agency;
(b) About the census;
(c) Census organization;
(d) How to use the handbook.
(c) Supervisor responsibilities
As well as being responsible for the supervision and, to alarge degree, the quality of work of their enumerators, su-pervisors will often have additional responsibilities of anadministrative or clerical nature. For example, where theenumerators’ handbook may describe safety in relation toworking as an enumerator, the supervisors’ handbook willalso need to provide advice about what the supervisor shoulddo if an enumerator reports a safety problem. In other words,the supervisors’ handbook will need to expand on a numberof topics covered in the enumerators’ handbook, withoutnecessarily duplicating a lot of the material. Suggested sec-tions are:
(a) Supervisor duties;
(b) Supervisor conduct;
(c) Contact with regional manager/deputy regionalmanager;
(d) Contact with enumerators;
(e) Role in telephone inquiry service;
(f) Identification;
(g) Safety;
(h) Confidentiality;
(i) Lost materials;
(j) Access to dwellings;
(k) Births/deaths and arrivals in the area at census time(scope);
(l) Handling materials;
(m) Marking and checking questionnaires;
(n) Quality assurance tasks.

72
(d) Administration and recruitment
A section similar to this will be required if supervisorsare involved in the recruitment and/or payment of enumera-tors. Suggested sections are the following:
(a) Issues relating to supervisor employment;
(b) Recruiting enumerators;
(c) Administration;
(d) Financial matters/expenses;
(e) Enumerator pay issues;
(f) Supervisor Pay Issues.
(e) Receipt of materials and workload review(pre-training)
As in the enumerators’ handbook, this section describeswhat is required of supervisors before they attend training.It also deals with the receipt of bulk materials and their sub-sequent dispersal to enumerators. As supervisors are respon-sible for many enumerators, they will often have a largearea to review before training and should be familiar withall facets of the enumerators’ responsibilities. Therefore,supervisors should do all the reading and training that isrequired of enumerators. Suggested sections are:
(a) Receipt of materials;
(b) Allocating materials to enumerators;
(c) Reading handbooks (enumerators’ and supervisors’);
(d) Review workloads;
(e) Checking or updating maps and/or boundaries;
(f) Completing enumerator training home study exercise;
(g) Completing supervisor training home study exercise;
(h) Advice about supervising enumerators.
(f) Supervisor training
This section describes each part of the training and whatwill be covered. Suggested sections are:
(a) Preparation;
(b) Training session;
(c) Additional training.
(g) Training enumerators
This section is particularly important to a quality census.Supervisors must be able to organize and conduct enumera-tor training with confidence and authority. The supervisors’handbook should focus on how to conduct effective train-ing. Suggested sections are:
(a) Preparation;
(b) Checking completed enumerator home study exercises;
(c) Training session;
(d) On-the-job training;
(e) Additional training.
(h) Pre-listing
This section expands on the supervisors’ role in the pre-listing exercises. Suggested sections are:
(a) Purpose
(b) Preparation;
(c) Method and forms used;
(d) Checking staff preparation;
(e) Accompanying staff in the field;
(f) Special cases and problems;
(g) Checking completed listing;
(h) Post-listing activities;
(i) Writing progress reports.
(i) Delivery and collection (interviewing)
This section expands on the supervisors’ role during de-livery and collection or interviewing. It should focus on thoseaspects of the work that improve quality. Suggested sec-tions are:
(a) Supervising enumerators during delivery(interviewing);
(b) Access difficulties, objections and refusals;
(c) Special dwelling issues;
(d) Other special cases;
(e) Checking workloads before collection;
(f) Supervising enumerators during collection;
(g) Writing progress reports.
(j) After collection or interviewing
This section focuses on quality assurance in the field op-eration. It should assist supervisors in ensuring that all formsare accounted for and correctly completed or marked andthat the questionnaires are ready for processing. Suggestedsections are the following:
(a) Receipt of materials from enumerators;
(b) Completing summary records;
(c) Evaluation information and supervisor’s report;
(d) Certifying enumerators’ work;
(e) Certifying supervisor work completed.
(k) Packing and returning materials
This is the final phase of the supervisors’ job and describeshow material is to be prepared for pick-up. It should alsocover tidying up any loose ends such as submitting theirreport. Suggested sections include:
(a) Sorting completed questionnaires;
(b) Sorting unused material;
(c) Packing material for return;
(d) Material delivery and pick-up arrangements;
(e) Completing administrative tasks.

73
Annexes
As in the enumerators’ handbook, annexes are not essen-tial. There may be some topics or matters, however, that arebetter covered as a separate annex rather than within thebody of the handbook. Annexes may include:
(a) Definitions or glossary;
(b) Special enumeration strategies;
(c) Frequently asked questions;
(d) Additional administration and recruitment information.
4.—Regional managers’/deputy regionalmanagers’ handbook
The nature and role of the regional manager (and/or deputyregional manager, if included in the field workforce) mayvary significantly from country to country. Included here isa suggested list of contents for a regional managers’ hand-book that assumes the regional manager:
(a) Will be provided with computer equipment (of somedescription);
(b) Has a significant role in the recruitment and paymentof staff;
(c) Has responsibility for financial delegations;
(d) Will have some involvement in public relations;
(e) Will undertake training of supervisors.
(a) Timetable
The timetable is similar to the one included in the super-visors’ handbook but covers additional tasks and activitiesrequired of regional managers.
(b) Contents
(a) Introduction
(i) The statistical agency
(ii) Overview of the census of population and housing
(iii) Outline of the census operation
(iv) Structure of the census workforce
(v) Support services
(b) Regional manager responsibilities
(i) Overview
(ii) Contact with statistical agency
(iii) Responsibilities
(iv) Ethics of census work and conduct of field staff
(v) Security and confidentiality of census material
(vi) Lost materials
(vii) Access rights to dwellings
(viii) Contact with supervisors and enumerators
(c) Safety issues
(i) Introduction
(ii) Regional manager safety
(iii) Enumerator and supervisor safety
(iv) Handling materials
(v) Screen-based equipment
(vi) Accidents or illness
(d) Computer equipment
(i) Introduction
(ii) Equipment to be delivered
(iii) Setting up
(iv) Getting started
(v) Problem solving
(vi) Backup and recovery
(vii) Security of equipment and data
(viii) Passwords
(ix) Authorized use of equipment
(x) Packing and returning equipment
(e) Computer application
This section would describe the specific applications tobe used by the regional manager. It would likely providesome overview information and refer to a specific usermanual or on-line assistance.
(f) Expenditure of government funds
(i) Authority and role
(ii) General conditions and limits in purchasing
(iii) Operating bank/trust/credit card accounts
(iv) Acquittal and accountability
(g) Mapping
(i) Overview
(ii) Definitions
(iii) Statistical geography used in the census
(iv) Review of supervisor and enumerator workloads
(v) Changing workloads
(h) Public communications
(i) Overview and public communication strategy
(ii) Dealing with the media
(iii) Special public communication strategies
(iv) Local communications issues

74
(i) Special Enumeration Strategies
This section should describe any special enumeration strat-egies that may be included in the overall census plan. Forexample, there may be a specific strategy for very remote,isolated or inner-city areas or for large holiday resorts.
(j) Recruitment and administration
(i) Overview
(ii) Record keeping and forms used
(iii) Recruitment policies and guidelines
(iv) Recruiting supervisors
(v) Recruiting enumerators
(vi) Recruiting other field staff
(vii) Appointing staff
(viii) Employment forms (including taxation, etc.)
(ix) Staff changes after recruitment
(x) Unsatisfactory staff
(xi) Accident and/or incident reports
(xii) Travel Required for Census Work
(k) Training
(i) Overview
(ii) Regional manager training
(iii) Training preparation and attendance
(iv) Supervisor training
(v) Enumerator training
(vi) Other training
(l) Census telephone services
(i) Overview
(ii) Description of operation
(iii) Regional manager role
(iv) Supervisor role
(v) Enumerator role
(vi) Administration
(m) Special dwellings
(i) Overview
(ii) Definitions
(iii) Enumeration strategy
(iv) Regional manager role
(v) Available information about special dwellings
(vi) Communication strategy and/or approach
(vii) Specific training issues
(viii) Administration and forms used
(n) Refusals or objections
(i) Overview
(ii) Definitions and policy
(iii) Regional manager role
(iv) Supervisor role
(v) Enumerator role
(vi) Specific training issues
(vii) Administration and forms used
(o) Payment
(i) Overview
(ii) Regional manager role
(iii) Timetable of payment activity
(iv) Policy and guidelines
(v) Forms used
(vi) Rates of payment
(vii) Method of payment
(viii) Paying staff who are on other benefits
(ix) Supervisor payment
(x) Enumerator payment
(xi) Payments to other staff
(xii) Payments for incomplete work
(xiii) Unsatisfactory staff
(xiv) Claims for additional payment
(xv) Checking payments
(xvi) Payslips
(p) Materials
(i) Overview
(ii) Transport arrangements and/or contracts
(iii) Timetable of transport activities
(iv) Regional manager role
(v) Forms used
(vi) Packaging of census materials
(vii) Delivery of material to regional managers
(viii) Bulk delivery to supervisors
(ix) Delivery to enumerators and return to supervisor
(x) Bulk pick-up from supervisors
(xi) Return of regional manager materials

75
2. Planning and management of printing
Planning and managing printing required for the censusenumeration is relatively straightforward. The most diffi-cult aspect may be the coordination involved in obtainingsufficient information from specialized areas within the cen-sus operation that require items to be printed (e.g. recruit-ment, procedures, training and payment).
The type of information required in order to plan andmanage printing includes the following:
(a) Details of the items that will need to be printed;
(b) Specifications that are sufficiently detailed to enable;(i) Printers to provide reliable quotations of costs
and printing timetables,(ii) Logistical support staff to develop plans for
packing.(c) Estimates of quantities of each item that are reliable
and will not result in shortfalls or significant oversupply.
Planning the printing process is primarily about:
(a) Establishing the timetable for the preparation of manu-scripts by the relevant areas of the census agency;
(b) Establishing key requirements and dates for the receiptof printing material (to feed into packing and distribution);
(c) Setting up processes to obtain information and quotations.
F. PRINTING OF FORMS AND OTHER DOCUMENTS
1. Introduction
Printing the many items that are required to conduct cen-sus enumeration is a major activity. The main census formis the most obvious item but there are many others that needto be printed. Given the size of census enumeration, theamount of printed material is often large, and significantlead times need to be taken into account.
For each item, printing requirements need to be estab-lished, quantities calculated, items specified and productionundertaken. The packing and dispatch of materials into thefield (see chap. III, sect. D) relies on the timing of the print-ing process, and careful planning and coordination of theseactivities is necessary.
In the majority of countries, printing will be conductedoutside the statistical agency, either through a governmentprinter or commercially. Part of establishing the basis of thecensus enumeration (see sect. A above) is investigating thecountry’s printing capacity based on broad requirements.Early discussions with major printers should be undertaken.Before proceeding to select the printer, census agencies maywish to seek specialist advice from printing consultants and/or other census agencies.
Notes Item 1 Item 2 etc
Description Describes the purpose of the item.
Quantity Includes any notes about how the quantity wasdetermined.
Stock The type of stock the item is to be printed on (e.g.,paper, cards).
Ink The colour or colours of the print.
Binding The type of binding if multi-page document (e.g.,stapled, perfect bound, folded).
Packing How the printer is to pack the item (e.g., bundlesof 40, pads of 70).
Delivery Location and dates; includes a breakdown if thereare large quantities.
Manuscript When and how the manuscript will be provided bythe census agency.
Proof Details about whether and when proofs will berequired and how they will be checked.
Quality assurance Details about sample requirements before orduring the main production run.
Table II.2. Printing table

76
This is followed by processes to establish printing, or bro-kerage contracts (or other formal arrangements), and thenmanage, the printing activity as it is undertaken.
(a) Details of individual items
The first step should be to establish a method for record-ing the need for a printed item and details about it that canbe used to obtain a printing estimate. A simple pro formainvoice, either computer based or clerical, can be used todocument printing requirements. This might include theitems in table II.2, which is provided as a guide only.
If the pro forma inovice is set out on a computer spread-sheet, it could be linked to the cost and quantity sheet that isdescribed below. If clerical processes are used, care shouldbe taken to ensure the two estimation processes are kept insynchronization. The actual format is not as important ashaving a methodical approach to obtaining the initial de-tails and then keeping the records updated as new or re-vised information becomes available.
(b) Cost and quantity sheet
The next step is to establish a method for recording thecost and quantity of all items to be printed. Estimated, quotedand actual costs can be recorded.
The use of estimated costs initially, enables a running to-tal to be kept that is updated as quotations are obtained andagain when actual costs are known. This information al-lows the total printing budget to be monitored and providesearly warning if unexpected increases in costs appear likelyto threaten the budget. Again, the use of a spreadsheet isideal for this task. The following information might be re-corded on the spreadsheet, which can also be used for man-agement information purposes:
(a) Item name;
(b) Printed quantity;
(c) Initial quantity (used if there is a variation betweenseeking quotes and what is finally printed);
(d) Actual cost;
(e) Quoted cost;
(f) Estimated cost;
(g) Date ordered;
(h) Date delivered;
(i) Supplier.
3. Types of forms
There are four broad groups under which printing-relatedservices will be required. These are as follows:
(a) Census forms, and post-enumeration forms;
(b) Enumerator items;
(c) Procedural and training items;
(d) Administrative items.
(a) Census forms
The importance of the main census form is so great that itshould be treated as a separate printing activity from theother groups specified above. It is important that the statis-tical agency deals directly with the printer and that otherstakeholders (e.g., processing staff) are involved in all stagesof production. This is even more important if the print qual-ity is crucial for the processing system, as would be the case,for example, where optical mark recognition is used.
The census enumeration will often include more than asingle type of form (for example, personal forms and house-hold forms). There may also be a combination of self-enu-meration and interviewer forms where these two methodsof enumeration are used in combination.
In some countries, the main census questionnaire may bepre-printed, with identifiers for different geographic regionsof the country. There may also be slight differences in somequestions because of differing circumstances throughout thevarious regions of the country.
There may also be other forms that will be needed in lessernumbers for enumeration in remote areas, or forms used tosummarize details of persons enumerated in special dwell-ings such as hotels, hospitals or prisons.
There are four important issues to consider when orga-nizing the printing of all census enumeration forms:
(a) Quantity;
(b) Quality;
(c) Paper stock;
(d) Timing.
(i) Quantity
Estimating the quantity of forms to be printed is discussedin detail in the section on distribution and return of material(see chap. III, sect. D). A lack of forms can have serious con-sequences as there may not be enough time to print addi-tional quantities if a shortfall becomes apparent during theenumeration. However, printing excessive numbers of formswastes resources and adds unnecessary costs to the censusoperations. Thus, great care must be taken in this process.
(ii) Quality
The quality of form printing can be crucial to the qualityof census data. Mistakes on the form (for example, incor-rect question wording or incorrect sequencing instructions)can result in data items being missed or completed errone-ously by interviewers or householders.
Special attention should also be given to ensure that print-ing adheres to standards required for processing systems.These standards may refer to the positioning of responseareas, and colours of the form. Deviation from these stan-dards may result in data quality problems and costly correc-tions in the processing phase. Procedures that can be imple-mented to monitor the quality of form printing are discussedin section 4 below.

77
(iii) Paper stock
Owing to the large number of forms that have to be printed,it is important that an estimate is made of the total quantityof paper stock that is required.
Apart from the quantity required, special considerationshould be given to the characteristics of the paper used for thecensus forms. Is it of sufficient quality to handle conditions inthe field? Does it meet the specifications for the processingsystem? For example, some data-capture systems cannot userecycled paper because of the impurities in the paper.
These estimates should be made as early as possible. Thisis particularly important in countries where additional quan-tities of the required paper stock may need to be produced forthe census. Sufficient time must be allowed for paper mills toschedule additional production and/or import additional stock.
(iv) Timing
Planning of the printing process needs to take into con-sideration the long lead times that may be required. Thequantities required may place a large burden on the avail-able printing capacities in the country. Early discussions withprinters will give an indication of the lead time required toprint sufficient quantities of forms. Planning should include,but not be limited to, the activities set out in table II.3, witha broad indication of timing in relation to the census date.The timing shown in the table is regarded as the ideal leadtimes required, although it is recognized that these lead timesmay not be possible in some countries. It should also benoted that countries with small populations may be able tocondense this timetable considerably.
It should be noted that in most cases, the packing anddispatch of the printed forms should occur progressivelyand concurrently with the printing.
Many of the issues discussed above for the main censusform will also apply to the post-enumeration survey form.The main difference will be that far fewer forms will needto be printed.
(b) Enumerator items
These items are those used by the enumerators in theirwork and may include some or all of those listed below.The list is not prescriptive or exhaustive but illustrates thetype of items that may be required in addition to the ques-tionnaire and the listing book. A common attribute of eachof these items is that if they are used, they will be requiredin large numbers. The printing of enumerator items shouldbe planned around the printing of the main census question-naire, as these items will usually be packed together fordelivery to field staff. Items that may be used by the enu-merators include:
(a) Information booklets or pamphlets that explain thetaking of the census. These are sometimes handed to eachhousehold by the enumerator or delivered by mail to house-holds before enumeration commences;
(b) Privacy envelopes, which enable householders to mailtheir form back or prevent the enumerator from seeing it;
(c) Multilingual brochures to help enumerators commu-nicate with householders who are not proficient in the prin-cipal language of the country;
Activity Months Before Census
Preparation of technical specification (draft) 24
Preparation of technical specification (final) 23
Provision of contractual wording and/or advice 22
Review of tender document 22
Calling tenders 21
Evaluation of tenders 18
Management review 16
Letting of contract 15
Preparation of manuscript 15
Typesetting 14
Printing and quality assurance (start) 12
Printing and quality assurance (finish) 8
Table II.3. Printing activity table

78
(d) Calling cards, which enable enumerators to inform ahousehold when they will return to collect the completedform (if applicable in a drop-off and pick-up scenario);
(e) Non-contact cards, which enable enumerators to lethouseholds know they have not been able to contact themand what to do;
(f) Enumerator identification cards;
(g) Objection or refusal forms for enumerators to reportcases of refusal.
(c) Procedural and training items
This group of items includes the instructions and guide-lines that document how the census enumeration will be con-ducted. The items that may be included in this group include:
(a) Enumerators’ record book;
(b) Enumerators’ handbook (or manual);
(c) Enumerator training exercises;
(d) Enumerators prompt card, which summarizes proce-dures in point form for quick reference;
(e) Supervisors’handbook (or manual);
(f) Supervisors’ record (or management) book;
(g) Supervisor training exercises;
(h) Instructions for training enumerators;
(i) Regional managers’ and/or deputy regional manag-ers’ handbook or management book;
(j) Regional managers’ and/or deputy regional manag-ers’ control book and home study exercise;
(k) Special enumeration instructions;
(l) Inquiry service instructions.
(d) Administrative items
This group includes all the forms and letters used in theadministration of the census enumeration. It can amount to alarge number of individual items, although some may be onlya single page or of a relatively small quantity. The list belowbreaks these items into categories and gives some examplesof the type of forms that may be included in each category.The list is not prescriptive or exhaustive, and the items to beincluded will largely depend on the nature of employment inthe country. Categories and examples include:
(a) Recruitment and/or appointment:
(i) Application form for enumerator position;
(ii) Application form for supervisor position;
(iii) Interview form;
(iv) Offer of employment form (or contract);
(b) Finance and/or taxation:
(i) Advice on payment,
(ii) Taxation forms,
(iii) Other financial forms;
(c) Control forms:
(i) Record of attendance at training;
(ii) Record of receipt of materials;
(iii) Record of quality assurance on completedworkloads;
(iv) Record of return of materials;
(d) Letters and/or notices:
(i) Approach letter to special dwellings;
(ii) Letter to persons objecting or refusing;
(e) Labels:
(i) For completed census material;
(ii) For unused census material;
(iii) For administrative material.
4. Quality assurance
As stated above, the quality of the printing process canhave a large impact on the final quality of the census data. Itis therefore important that a quality assurance scheme isdevised whereby printing is closely monitored throughoutthe entire process. This should extend to the checking ofproofs and production runs.
The census form is the most important form and there-fore should be subject to intensive quality assurance checksin both the proof and the production stages. The other itemsare normally only subject to intensive constraints in the proofstages and not in the production stage. This reflects the lackof technical requirements for extreme precision of the physi-cal placement of characters in these other items and the highcost of production checks.
(a) Checking of proofs
As material is developed, it will progress through severalproof stages before it is finally typeset for the printing pro-cess. At each stage, proofs should be checked and autho-rized as correct by the project leader responsible for formdesign. Additional checks by staff not directly involved inthe form design process can also prove useful in detectingdiscrepancies.
In some situations, the final typeset proof used for print-ing is the responsibility of the printer. In these cases, thetypeset version should be checked and approved by the sta-tistical agency before printing commences.
(b) Production runs
As the printing process progresses, a sample of censusforms should be selected for quality assurance checks. Is-sues such as resources available and the level of problemsdetected will affect the size of the sample selected, and thesampling strategy.

79
What Can Go Wrong During The Printing Process?
Printing of questionnaires should be done well in advance. Inone of the African countries, the 1990 census printing ofquestionnaires was a big bottleneck, which almost threatened thesuccessful completion of the exercise. The government printerwas responsible for printing questionnaires. All along assuranceswere given that the printing would be completed before the startof the enumeration period. At the last minute it was realized thatit was not possible for the government printer to print therequired number of questionnaires by the enumeration date.
This constraint was so serious that if it was not promptlyaddressed the whole census program could have been derailed.Other small printers, in addition to the Government printer, wereused in printing questionnaires. The printing continued whileenumerators were in the field. As a consequence of this problem,printing was done round the clock and in a hurry: therefore insome cases quality was compromised. The questionnaire wasbulky with varying sizes of inserts. Inclusion of a supplementquestionnaire on basic agriculture contributed to the delay in theproduction of final questionnaires. As a result of the printingconstraint:• enumeration work was extended for some days in some
areas;• printing costs increased due to the overtime costs associated
with the use of private printing presses;• transport costs increased because vehicles were sent from
various provinces to collect printed questionnaires, in smallbatches, from the capital city where most of the printing wasundertaken.
However, it is important that sufficient resources are al-located to ensure the quality of the printing process. Other-wise, significant costs may be incurred in the processingphase to rectify mistakes resulting from printing errors. Ifthese mistakes cannot be rectified during processing, prob-lems in the final census data may occur.
Sampling rates can be adjusted throughout the printing pro-cess, with higher rates at the beginning of the printing. Wherethe printing technology includes the creation of new printingplates after some proportion of the work has been completed,a higher sampling rate should be employed after each newset of plates is produced. The sample rate can be adjusteddownwards if detected problems decrease. However, a sampleshould be taken over the entire printing process from start tofinish. It cannot be assumed that, if the quality is good at thebeginning of the print run, this will necessarily continue.
It is also preferable that quality assurance is conducted atthe printing plant. This will assist in the early detection of
problems. However, agencies should not rely on the print-ers themselves to conduct all quality assurance checks. In-dependent checks need to be carried out.
An example of some of the checks that can be made onthe forms include:
(a) Horizontal and vertical trimming;
(b) Positioning or skew of response areas on the actualpage;
(c) Page numbering and correct order of pages;
(d) Colour, including any smudging;
(e) Strength of any binding.
Particular attention should be given to any specializedprinting requirements that are required for data-capture sys-tems. A final check should be undertaken by processing asample of forms through these systems to enable a com-parison of actual versus expected results.

80

81
A. PUBLICITY
1. Introduction
The reason why an effective publicity campaign in a cen-sus is essential is because it contributes to the overall suc-cess of the census. By increasing public understanding ofthe purposes of the census, response rates will be improvedand higher-quality data will be achieved.
The publicity strategy also needs to be closely allied withcollection processes. Important messages about when andhow the census is going to be held, what is expected fromthe public and how the public can find out more about thecensus need to be communicated. Public understanding ofthese aspects of the census will contribute to the smoothconduct of collection operations.
The size and complexity of a publicity campaign will varyaccording to the conditions in a country and the funds avail-able for such campaigns. The costs of a publicity campaignare often overlooked in census planning and it is importantthat sufficient resources are included in the census budgetto ensure a quality outcome.
Even though the publicity campaigns may vary amongcountries, the objectives, scope, and planning needs of agood publicity campaign remain standard for all censuses.
The planning of effective communication to mass audi-ences needs to take into account all of the potential issuesthat might affect the interaction between a census agencyand its respondents. Such planning is not easy nor can it beundertaken at the last minute. Therefore to deliver success-ful outcomes the publicity issues need careful considerationin the context of overall census planning. It is essential thatpublicity planning has census agency management support,and be seen by the census agency staff and external audi-ences to have such support.
It is highly recommended that census agencies use pro-fessional communications personnel to plan and implementtheir publicity campaign. The benefits of this approach arethat it ensures that the campaign is professional and attunedto the needs of the census agency. This also allows censusmanagement to concentrate on the core business of con-ducting the census. In the early stages of planning, key com-munications managers from within the census agency (wherethese exist) could be assigned to the census or external ad-visers appointed.
Agencies may also find that the census publicity cam-paign can be a natural extension of any ongoing publicityprogrammes that are already in place with their respondentand user communities. The advantage of using an ongoing
publicity campaign is that it will have developed links withthe media and provide a valuable profile-raising role for thewider community. This can be drawn upon to better gener-ate widespread awareness of a census.
2. Developing a publicity strategy
Before any detailed implementation plans are developed,a strategy for the publicity campaign should be developed.While the situation in each country may vary, the followingissues are generally applicable and need to be addressedwhen developing a publicity campaign:
(a) Background;
(b) A situation analysis that identifies any particular op-portunities or issues that need to be taken into account;
(c) A clear statement of the objectives of the publicitytask;
(d) Definition of the target audiences;
(e) Statement of messages that are to be communicated;
(f) Ppublicity strategies that will be implemented.
Each of these issues is discussed in the following sections.
(a) Background
Census agencies may be aware, from formal market re-search or from their own experience, of public attitudes con-cerning their census. This background can indicate the mostlikely opportunities and difficulties to be encountered incommunicating with the public about the census. It may alsoreveal particular economic, political or social informationand circumstances that may impact on how a census public-ity programme is perceived or acted upon by the generalpopulation.
(b) Situation analysis
Once the communications environment in which the cen-sus is to be conducted has been thoroughly understood anddocumented, a more detailed analysis of the communica-tion opportunities is required. For example, the censusagency may be able to use government-operated mass me-dia outlets, or it may need to ensure access to the mass me-dia through paid advertising for effective publicity.
An important part of this analysis is to establish the cur-rent opinions of stakeholders about the census. This appliesin particular to those stakeholders who are likely to be thetarget of the publicity campaign.
III. FIELD OPERATIONS
82
It is recommended that agencies undertake or commis-sion detailed research, both qualitative and quantitative, intopublic opinions about and awareness of the census. Goodresearch with honest and frank responses about perceptionsof the census will provide a strong guide to the way an overallpublicity campaign is framed and conducted. The views andbeliefs of community leaders and groups should also be can-vassed through appropriate forums, which may range fromone-on-one meetings to an extensive process of communityconsultation.
Changes to the way the census form is worded, the waythe census is conducted and processed and how the outputis disseminated have the potential to impact on a publicityprogramme. The impact of these changes on the publicityprogramme should be considered when such changes arecontemplated.
Attention should be paid to understanding the argumentsof individuals or groups who do not approve of the census.At best, this will enable the communications process to seekto change their views, admittedly a difficult task for thosewho disagree on philosophical grounds. At worst, it willresult in a better-planned census that is less likely to be thetarget of negative reaction by individuals or groups fromthe community.
Issues related to privacy and confidentiality may beequally noted in both developed and developing countries,although cultural differences may affect the specific degreeof concern.
As well as this external focus, census agencies should alsolook inward to the strengths, skills, knowledge and percep-tions of their own staff. This process of internal consulta-tion will help to raise awareness of the census and encour-age its support within the census agency. The attitude ofstaff towards the census, and their own individual dedica-tion to a positive outcome, is thus both a management and acommunications issue.
Different communication environments will have theirown special challenges, although given the scale of census-awareness campaigns, these are not commonly encounteredeven by the Government. Thus, matters of literacy, ethnicity,politics, geography, access to mass media and influence ofparticular beliefs will need to be considered.
There is a wide variety of potential issues that can affecta census publicity campaign and identifying them is an im-portant part of the situation analysis. To illustrate, the fol-lowing issues of importance to members of the public havebeen identified in some countries:
(a) Privacy and confidentiality of information given;
(b) Whether the information provided was actually putto good use (see chap. I, sect. A);
(c) Cost of the census;
(d) Potential use of census information for non-statisti-cal or other inappropriate purposes;
(e) Issues raised by lobby groups regarding the inclusionor exclusion of specific topics from the census;
(f) Requirement that name and address be included onthe census form;
(g) Concerns about potential government intrusion intoprivate affairs;
(h) Where individuals can find additional informationabout the census.
(c) Statement of objectives
The aim of a publicity campaign is to support the opera-tion of the census and obtain a high quality result throughthe following measures:
(a) Organizing a recruitment campaign for field staff;
(b) Getting interested groups involved in census plan-ning and gaining their cooperation;
(c) Organizing an awareness campaign to:
(i) Maximize awareness, of when the censuswill be carried out;
(ii) Address any issues that need clarification;
(iii) Promote awareness of procedures and waysto get assistance;
(iv) Encourage respondents to cooperate to thebest of their ability.
The communications task is to provide timely and appro-priate information, reinforce positive perceptions and ef-fectively manage any negative issues. Contingency plan-ning should be undertaken to ensure that management ofnegative issues is effective.
(d) Defining target audiences
While the target audience for a census is the populationas a whole, for communication purposes this needs to befurther analysed and broken down into relevant audiencesegments. The final set of segments will reflect any particu-lar communities of people in the population that require aparticular focus. Such a list should fully answer the ques-tion “To whom do we want to communicate?”
By way of example, a set of audience segments could bethe following:
(a) The media;
(b) Opinion leaders and public figures who can endorsethe census;
(c) Groups of influential people, e.g., religious leaders,teachers and unions;
(d) Speakers of the national language;
(e) Speakers of other languages;
(f) Groups under-represented in previous censuses;
(g) Population groups (e.g., ethnic groups) with specialgeographical, social, communication or logistical disadvan-tages;

83
(h) Heads of households, if appropriate;
(i) Users of census data;
(j) Staff of the census agency.
(e) Statement of messages
There are likely to be several core messages that censusagencies will need to communicate to their different audi-ences in order to maximize outcomes for the census.
Examples of external messages could be the following:
(a) The census is for the good of all because it is the bestway to plan for the future;
(b) Filling in the form is a patriotic duty of citizens;
(c) The census agency has a human face;
(d) Census enumerators will call at households at certaintimes;
(e) Assistance is available for those having difficultyfilling in their form;
(f) Privacy and confidentiality will be honoured;
(g) The census date and duration of the enumerationperiod;
(h) Cooperation is mandatory;
(i) There are penalties for enumerators or other staff whomisuse information.
(f) Publicity strategies
Strategies to achieve the publicity objectives should seekto make the census an event of national importance and atopic of public interest and debate.
Suitable broad strategies could include the following:
(a) Recruiting temporary field staff through advertising;
(b) Staging of extensive media events to mark the begin-ning of the census campaign (i.e. a formal launch of thecampaign), followed up by the issuance of a range of mediareleases and background material for use by the media forthe duration of the enumeration period;
(c) Building awareness through:
(i) Effective media advertising,
(ii) Active media programmes of information dissemination.
(d) Building support through third-party endorsements;
(e) Being proactive in public debates about the censusand associated issues;
(f) Developing specific campaigns for each target audi-ence, as defined above in section (d);
(g) Training census agency staff to act as media spokes-persons;
(h) Developing lists of expected questions and standardmodel answers on key issues;
(i) Monitoring the public debate and media coverage.
A range of implementation strategies will be needed to putthese broad publicity strategies into practice; these are dis-cussed in the section below.
3. Implementing a publicity strategy
Implementation strategies, or tactics, will depend verymuch on the characteristics of a country’s cultural, social,administrative and mass media. The following examples areoffered as models of the implementation strategies that canbe developed. Countries will need to adapt them based ontheir own particular circumstances.
An important point to note is that the publicity strategycan be divided into different stages and should reach a peakjust before census enumeration.
(a) Census agency staff
(i) Permanent staff
Staff of the census agency should be regularly briefed onpublicity activities and given previews of advertisementsand other material before they are distributed. From a com-munications point of view, invitations to such briefings couldalso be extended to the families of staff members.
Where a staff newspaper exists, it should include regulararticles about the census, concentrating on staff involvedwith particular tasks. A staff video service, either broadcastor by way of video cassettes, could be used to supplementother contact.
(ii) Field operations workforce
The field operations workforce may first encounter thepublicity campaign through the recruitment messages usedto attract them to the workforce.
After recruitment, the field staff should be given back-ground on the publicity campaign so that they are aware ofthe communications environment that will impact on theirwork in cases where the supervisor may be involved in dis-tributing some of the publicity or in being a part of it.
It is important that the filed staff be given instructions onthe procedures for handling requests for media interviews.It is suggested that the communications manager clear allsuch requests.
(b) General external audiences
There will be many opportunities for publicizing the cen-sus to external audiences that are specific to each country. Itis not possible to be prescriptive about these opportunitiesin view of the wide range of possibilities. Each opportunity

84
Publicity strategies for the 1997 census in the West Bank and Gaza
For the 1997 census in the West Bank and Gaza, the Palestinian Central Bureau ofStatistics employed various publicity strategies, including the following:
• Newsletters were issued on a regular basis every month for about two yearsbefore the census. The audience of the newsletters included the statist ical bureaustaff, governmental and non-governmental organizations and the media.
• One publicity coordinator was recruited for each governate and regional publicitycommittees were formed. A central publicity committee was established tooversee the implementation of the publicity campaign;.
• A magazine entitled Census and Society was issued on a regular basis during thecensus fieldwork implementation. The magazine was issued for three monthswith a volume of 100,000 copies;
• There was a circulation of leaflets on census activities. The contents of theleaflets as well as their circulation were depended on the census fieldwork stage;
• A publicity campaign was carried out in schools in coordination with the Ministryof Education. Pens carrying the census logo and slogans were d istributed. Censusinformation was provided daily school line-ups and the distribution on schools ofweekly timetables;
• The census Web site contained news About census activities, press releases,presidential decrees and other census related information in Arabic and English,as well as a census countdown on the Internet;.
• National as well as local media stations were involved in the census publicitycampaign. There were a ser ies of talk shows on the census or national and localnetworks. Posters, pamphlets, and comic books were used, as well as sketches oncensus fieldwork activities. A census contest entitled “How many are we?” wa sorganized for estimating the total number of population in the census, withspecial prizes for winners. The statist ical bureau organized a soccer contest, theCensus Cup. The census questionnaire was explained on television. The publicitycampaign also used mosques, churches, schools and universities to promotecensus cooperation;
• A census logo was selected two years before the census through a nationalcontest. The census logo was printed on all census products. The census logoappealed on water, electricity, and telephone bills. Census stamps were printedthe census logo in post offices in Gaza and the West Bank.
———— Source: Palestinian Central Bureau of Statistics.
85
should be examined carefully to ensure that it is alignedwith the message the overall publicity campaign is trying toconvey and is utilized where it has a positive cost benefit.Publicity for external audiences should be greatest just priorto and during the enumeration activity. Some examples ofkey tactics for general audiences can include the following:
(a) An information booklet;
(b) Media advertising;
(c) Community service announcements;
(d) Provision of speakers to the media and the community;
(e) Posters and comic books;
(f) Developing a census logo and slogan;
(g) Influencing key members of target audiences.
Each of these tactics is discussed below.
(i) Information booklet
A booklet can be prepared to explain the purposes of thecensus to householders and provide other messages as re-quired by the census agency. Such an approach will be moreuseful in a self-enumeration approach, since interviewerswill explain these details as part of their approach.
(ii) Media advertising
Advertisements can be paid for and placed in all forms ofmass media, including newspapers, radio and television. Theamount of resources devoted to each medium, and the de-tails of placement of the advertisements (dates of, and posi-tioning relative to other elements of the medium), shouldbe selected carefully on the basis of advice from communi-cation professionals within the country.
Advertisements should be professionally designed andinclude some audience testing research to ensure the cor-rect message is being transmitted.
(iii) Community service announcements
In some cases, media interests will recognize the value ofthe census to the country and supplement paid advertisingby free announcements. These could include the following:
(a) Statements by media staff;
(b) Use of interesting stories about the census during newsbulletins and the like;
(c) Incorporating a census story in regular programming,such as serials.
Access to these opportunities will be greatly facilitatedby the use of media releases to keep editors and journalistsup to date on what is happening in the census. By cooperat-ing with the media in this way it is more likely that they willcooperate with the census agency.
(iv) Provision of speakers to the media and the community
It is important to identify a set of people from within thecensus agency, or other government ministries, with goodpresentational skills to help promote census and associatedissues through media presentations and interviews. Specifictraining sessions should be offered to develop and use re-sponses to census issues.
To ensure that a consistent picture is provided by thespokespersons, they should be given a set of standard an-swers to expected questions.
(v) Posters, and comic books
In many countries, wall posters and comic books are com-monly used as a method of communicating a range of so-cial and general interest messages to the public. Where thisis a common practice, this medium could be very effectivein communicating the census message.
A supply of posters could be issued to regional managersand/or supervisors for placement in suitable locations in theirareas.
(vi) Developing a census logo and slogan
Many countries have successfully developed a census logoand slogan. A simple but effective slogan and distinct logocan be developed and used in all national and local adver-tising campaigns and in all types of media (e.g., television,radio, newspapers and posters).
The slogan can concentrate on explaining why the censusis important for the country and why it is important thateveryone participates in respect to planning for the future.Examples of simple slogans that have been used include“Everyone counts for the census”, “Census 2000: helpingto build our future”, and “Count us in” was widely usedduring the South African census of 1996.
(vii) Influencing key members of community audiences
These tactics cover ways in which influential people canbe shown the benefits of the census in order to gain theirsupport of the census. They can then encourage other mem-bers of their group to also support the census. Examples ofinfluential people could include the following:
(a) Politicians (including national and local governmentpoliticians);
(b) Village heads or local community leaders;
(c) Religious leaders;
(d) Media commentators;
(e) Senior bureaucrats;
(f) Industry leaders.

86
The last two groups in particular should be encouraged toprovide examples of the ways in which their groups haveused the results of previous censuses for the benefit of thecommunity. The overall tactic with influential people is toconvince them to endorse the census by talking about it andhelping it become part of community discussion. Invitingthem to openings and census events and providing briefingmaterial are useful ways to keep them involved.
It may also be possible to seek endorsement from popularfigures not included in the above groups such as sports fig-ures or popular entertainers. It should be noted, however,that such personalities may not be universally popular (forexample, a football player may not be liked by the support-ers of rival clubs) or they may not be seen as authoritative(e.g., what does a singer know about the census?). As withother aspects of the publicity campaign, professional ad-vice should be sought on the implications of selecting suchpersonalities.
(c) Specific audience tactics
There may be specific audiences that require particularattention, and different tactics, when implementing the pub-licity campaign. Examples of these audiences may include:
(a) Different ethnic groups within the community;
(b) People travelling within the country on census day;
(c) Overseas visitors;
(d) The homeless.
The differing cultural backgrounds of some ethnic groupswithin the community may require different tactics to en-sure that the messages are communicated effectively tomembers of such groups. Persuading the leaders of thesegroups that the results of the census is important (i.e., rel-evant) to these groups is often an effective strategy sincethe leaders will influence other members of the group.
Publicity strategies for the 1999 census in Kyrgyzstan
During the Kyrgyzstan census of 1999, the publicity strategy employedwas an active information campaign using posters, publicity, andtelevision, as well as organizing a prize lottery among censusparticipants. The prize lottery encouraged large numbers of people toparticipate in the census. The lottery helped in achieving the main goalof the census – to secure practically complete coverage of the population.The mayor of Bishkek and the Government of Switzerland providedsupport for the lottery
The lottery, with a first prize of a studio apartment, was conducted inJuly 1999. There were a total of 450 prizes. The Government plans tohave one more lottery based on questionnaires at the end of 1999, justafter the capture of the census data.
Public support for the census, namely, by President A. A. Akayev andother prominent persons of the country, was important in theunderstanding of the census as a national undertaking by localadministrations, statisticians and the many enumerators and census staffinvolved.
The clergy also provided their support in the census publicity campaign.Moreover, many mosques provided their premises for the work of thecensus teams.
———— Source: National Statistical Committee of the Kyrgyzstan, August 1999.

87
Directing communications through groups within these com-munities and placing advertisements and editorial commen-tary in specialized media outlets (e.g., ethnic newspapers)are also effective means of communicating with thesegroups. Other means could include distributing pamphletsand information sheets in the different languages of theseethnic groups.
People who are travelling on census day are frequentlydifficult to contact. This can be overcome by arranging forenumerators to contact passengers as they disembark fromplanes, buses, trains and ferries.
In many cases, there is doubt in the minds of people whohave recently arrived from overseas about their participa-tion in a census. Such doubts can be overcome by usingannouncements on international flights close to census dayto explain the census to these people. This opportunity canalso be used to communicate with residents of the countryreturning from overseas who might otherwise not be influ-enced by the publicity campaign. Information pamphlets indifferent languages can also be distributed to hotels andmotels.
It is possible to focus on events for specific groups whomay not be contacted by other means. A number of coun-tries use the availability of subsidized food outlets to con-tact people without a fixed address. This could be a soupkitchen operated by charitable groups or a special event (e.g.,a breakfast for homeless people on census day).
(d) Schools
Schools can provide a good opportunity for getting themessage into a large number of households by providingthe teachers with resource material to enable them to give aclass on the census close to census day. The objective ofsuch an exercise is to provide the message to the children sothat they can pass it on to their parents, who will be respon-sible for completing the form or giving the interview.
A key issue with such endeavours is that the material mustbe provided at the correct time of year so that teachers areable to incorporate the material into their planning.
Lower primary school-age children may not relate wellto census concepts, and efforts could be better focused onupper primary or secondary students.
4. Publicity support services
To support field operations, many countries have estab-lished publicity support services to assist in publicizing thecensus and provide assistance to the public. The implemen-tation of such services will largely depend on the infrastruc-ture available within the country. While the examples givenbelow may not have been applicable to many developingcountries in the past, they are now rapidly becoming viablein a number of countries. Two examples of such services are:
(a) Establishing a census Web page on the census agency’sInternet site;
(b) Providing a telephone-based inquiry service.
(a) Internet
The numbers of people accessing the Internet has in-creased dramatically in recent years. While the largest in-crease has been in developed countries the number of peoplenow accessing the Internet in developing countries is in-creasing rapidly and will further increase in the comingyears.
Agencies that develop their own web page can use this topublicize the census. All material that is included in otherforms of advertising can be placed on the web page. Com-monly asked questions about the census and answers canalso be placed on the web page. These can be updated con-tinuously as the census agency become aware of issues raisedby the public.
(b) Telephone inquiry service
The telephone inquiry service provides a system wherebymembers of the public can obtain assistance with particularquestions on the census form, ask questions about the cen-sus or report issues in the field. This service is often re-ferred to as a hotline. The service must communicate thesame messages as the overall census communication cam-paign; therefore, it is appropriate to include it in this chap-ter.
Where necessary, assistance should be available to call-ers in all the languages commonly spoken in the country.This may require the assistance of telephone-based inter-preters. The hotline service may also provide assistance tospeech- and hearing-impaired members of the public by theuse of fax and touch-telephone facilities.
Where matters raised over the hotline require action byenumeration staff (for example, a household has not beenenumerated several days after census day), the hotline staffmay interact with other communications procedures to raisethese matters with appropriate field staff.
The hotline facility is less important where an interviewapproach is used, since the interviewer should be able toanswer many of the questions about the census form andprocedures. In addition, the interview process has clear limitsregarding the involvement of the householder, while a self-enumeration approach may raise questions about the timingof visits by the collector and the responsibilities of the house-holder. However, all countries should consider providing ahotline service as a support mechanism.
People who are familiar with telephone services will nothesitate to use the facilities to seek information. This canlead to a considerable demand for the service and it is un-likely that the census agency will have the expertise to pro-vide the necessary services in-house. The assistance of thecountry’s telephone service providers will be essential toprovide the service. This could take the form of a formalcontract outsourcing the service.

88
Publicity strategies for the 1990 census in Zambia
Zambia’s publicity campaign exercises, for the population and housingcensus, were conducted at both the provincial and district levels. TheZambian census was conducted in August 1990. However, the censuspublicity campaigns were launched as early as January 1990. Zambia hasnine provinces and 57 districts. The one-day workshops carried out ineach of the districts were de signed to create awareness among seniorgovernment officials and traditional and opinion leaders. In addition,the workshops were organized to brief the participants on the plannedorganization and conduct of the census and to form a basis forformulating more effective publicity campaigns within each d istrict toensure maximum cooperation from members of the general public duringenumeration.
Apart from workshops, radio and television programme were used toexplain the objectives of the census. A number of posters were producedand distributed to all parts of the country. Government personnel, villageheadmen, chiefs and teachers were used as communication agents todistribute census publicity materials. The Ministry of Information andBroadcasting assisted in the publicity campaign, together with the entireZambia mass media system. Ministry officials helped in translatingcensus radio programmes in various languages for broadcasting. Thetelevision programmes were mo stly in English. These broadcasts wereput on the air several times a day.
The President of Zambia launched the census by addressing the countryand explaining the importance of the exercise. He urged people tocooperate with census officials. T-shirts marked 1990 census weredistributed at workshops and issued to census officials as part of thepublicity campaign.
Census materials, including T-shirts, car stickers, calendars and badgeswere used to promote the census. Radio and television interviews wereheld on a regular basis by the Director of the Census to answer questionsand clarify issues related to the census operation
———— Source: Statistical Division of United Nations Secretariat.

89
(i) Strategies
The hotline can be either centralized or decentralized. Theadvantages of a centralized hotline are the following:
(a) Provides a higher probability of standard responsesto callers;
(b) Provides economies of scale to a potentially largeundertaking;
(c) Releases regional management staff from the burdenof administering and managing a hotline;
(d) Offers more efficient and effective training of opera-tors.
The benefits of a decentralized hotline are the following:
(a) The network demand is spread over a greater numberof sites, reducing the likelihood of localized system over-load;
(b) The operators are more likely to be able to respond toissues specific to a locality.
The disadvantages of each approach are the opposite ofthe advantages of the other. While each country should makea judgement about the balance of views, it is suggested thatthe benefits of standard answers to questions and econo-mies of scale are important arguments for centralizing theprocess.
As with all other aspects of the census, this element ofthe undertaking should be subject to testing. In particular, itshould be subject to load testing to ensure that the telecom-munications system can operate under the estimated peakloads. To the extent possible, this testing should simulatethe types of queries raised in the census and come from allregions of the country.
Where a hotline service is offered, it should generally bewidely advertised. It is thus the responsibility of the censusagency to ensure that as far as possible all calls are answered.An important fall-back option is to have the capacity to addextra sites to the hotline where the demand is too high forthe established sites.
It may be possible to provide this emergency service bydiverting a proportion of calls to the permanent offices ofthe census agency. Such outcomes are not desirable as theywill impact on other work in the census agency and requirethe use of untrained staff, thus negating a key benefit of thecentralized approach.
The hotline should operate for the entire period that enu-merators are on duty, and preferably for a few days after-wards (since a number of calls towards the end of the pe-riod will concern non-contact by enumerators). In a self-enumeration census, many people will complete the censusform in the evening. It is therefore important that the hotlineis open at that time to answer questions at the time they arebeing raised. Different time zones within a country also needto be taken into account.
(ii) Staffing and training
It is necessary to have sufficient staff engaged, either bythe census agency or by the contractor, to meet the antici-pated demand, and to have some reserves trained to assistin dealing with unexpected peak demands.
The majority of staff will be temporary employees whowill provide standard answers to the most common ques-tions expected to be asked. These will cover matters such asthe meaning of the questions on the form and simple proce-dural matters (for example, When will the enumerator bearriving at our dwelling?). While the answers to most ques-tions handled by the staff will be straightforward, the abil-ity to deliver these answers in an efficient and polite man-ner is an acquired skill. Where possible, it is desirable touse staff who have experience from other hotlines ortelemarketing campaigns.
There will also be a number of difficult calls involvingeither more concerned or aggressive callers or more com-plex topics. The census agency should provide expert staffto answer such calls, regardless of whether the Hotline isundertaken by the agency or outsourced.
Training provided to hotline operators should cover (a)basic conditions of work and telephone techniques and (b)census knowledge and specific inquiries.
Hands-on training prior to logging in for the operator’sinitial shift can be considered a useful approach. It wouldallow the reinforcement of techniques and the transmittingof news about recent developments in the census.
(c) Managing demand
Managing the demand on the hotline is a primary consid-eration that needs to be looked at when designing the hotlinefor a census. In most countries, it will not be logisticallypossible for any call centre, regardless of how well resourcedand planned, to cope with the huge number of calls thatmay be received if the census becomes a topic of major pub-lic debate. The task is to manage the demand on the hotlinein the first instance.
Some specific recommendations for reducing demand arethe following:
(a) The information booklet should contain straightfor-ward and convincing answers for householders who areconcerned about the compulsory nature of the census, con-fidentiality and privacy;
(b) The information booklet should include standard re-sponses to queries about common procedural matters, suchas dates of the collection period and what response shouldbe given by people who are away from home on censusnight;
(c) The preceding topics should also be explained in thegeneral census publicity and be further reinforced by theenumerator at delivery.

90
The hotline can be an essential component of census opera-tions and provide an important service to the public. It canalso play an important role in assuring the public of the needfor the census and that confidentiality and privacy are assured.
5. Budget
The budget for the publicity campaign will vary with eachcampaign.
Important factors to consider include the frequency ofthe census, the quantity and quality of publicity by the cen-sus agency between censuses, resources that can be calledupon at subsidized rates (for example government-ownedmedia outlets) and the size of the population.
Investment in good communication can have a real im-pact on the quality of data from the census. It is importantto recognize this when setting the draft budget. It is sug-gested that the determination of the final budget is best un-dertaken after early planning has been done (including ini-tial market research), as there will then be a better basis onwhich to seek endorsement from census agency manage-ment. This additional information will also be of value insetting broad parameters for briefing advertising and/or com-munications agencies.
6. Evaluation
It is recommended that agencies see the evaluation of apublicity campaign as a continuous process from the begin-ning of the campaign leading up to an overall evaluation.
A suggested basis of a good publicity evaluation approachis as follows:
(a) To have established objectives that are measurable;
(b) To measure the media exposure;
(c) To measure its impact on the intended audience.
Measuring media exposure could include indicators suchas total coverage or broadcast time given to the messages.Measuring the impact would include the ability to trackswings in public awareness (positive, negative or neutral),its relativity to the message being communicated, and theratio of audience reach to frequency of the message.
Internal feedback, especially that noted or received bythe communications unit and by field staff, is also useful.
Continuous evaluation and modification during the cen-sus enumeration process through tracking research and dy-namic management will ensure that implementation of thepublicity campaign is on the right track. To permit this tooccur, flexible implementation tactics are essential in orderto maximize outcomes.
In setting up systems to evaluate communications efforts,it is appropriate to take a long-term view and ensure thatmeasurement of awareness can continue throughout theintercensal period, and that the methodology is such thatcomparison between censuses is possible.
The results of this detailed evaluation of the publicitycampaign need to be considered as part of the overall cen-sus evaluation, and judgements made about what can beimproved in the future. Evaluation of the publicity cam-paign must be seen as credible if its vital role in a success-ful census is to be appreciated and understood.
B. RECRUITMENT AND REMUNERATION
1. Introduction
In some countries, hundreds of thousands of staff spread,over wide and varying geographic areas, are required forfield operations. The majority of these staff are only requiredfor the relatively short enumeration period (e.g., three weeks)and therefore their relationship with the census agency is,at best, tenuous. In some countries, these staff may be re-cruited from the general public, while in others, existingstaff from other government ministries (e.g., teachers) maybe used.
The principal objectives of the recruitment exercise shouldbe to recruit staff who are capable of undertaking the dutiesof the various positions and in sufficient numbers for allgeographic areas.
The quality of the recruitment campaign will directly af-fect the quality of the data to be collected and, therefore, thesuccess of the census. While a good recruitment campaignwill not by itself necessarily guarantee a successful census,a badly conducted campaign will inevitably lead to prob-lems and increase the risk of an unsuccessful census.
The amount of remuneration paid to field staff has a di-rect effect on the recruitment campaign. Staff need to beassured that payment is fair and equitable in comparisonwith market rates for broadly similar tasks in other jobs andis compatible with the amount, and difficulty, of the workthey will undertake.
If this is not the case, difficulties will arise in recruitingsufficient numbers of quality staff.
In some countries, where existing staff from other gov-ernment ministries are used, they are paid per diem costs.Again, these payments must be fair and equitable to allowthe staff to perform their duties to the best of their abilities.
2. Recruitment
By the time the recruitment campaign is considered, thestructure and ratio of staff in the various levels of the fieldoperations hierarchy will have been established (see chap.II, sect. B, on structure of the workforce).
The other major force impacting on the recruitment cam-paign is the basis of enumeration. This has been discussedin chapter II, section A on establishing the basis of enu-meration.

91
(a) Determining the number of field staff
The first step in the recruitment campaign is to determinethe number of field staff required. This can be done by adopt-ing a bottom-up approach. This means starting at the lowestlevel (usually the enumerator) and first establishing the num-ber of these staff required. Workload statistics can then beapplied to derive the number of supervisors required. This canthen be repeated for all levels in the management hierarchy.
(i) Number of enumerators
The number of enumerators required will depend on thelength of the enumeration period. The shorter the enumera-tion period, the more enumerators will be required. Usu-ally, an enumerator will be responsible for a single enumera-tion area. Therefore, the total number of enumeration areasin a country can be used as the starting point for estimatingthe total number of enumerators required. Initial estimates(e.g., those required for developing an initial budget) canbe based on the number of enumeration areas in the previ-ous census and possibly adjusted by the rate of populationgrowth. These initial estimates can be updated as the enu-meration area design and mapping or household listing pro-cesses evolve.
However, while a ratio of one enumerator per enumera-tion area is a useful starting point, the numbers will need tobe adjusted to cater for differential growth in the expectednumbers of:
(a) Single enumeration areas that require more than oneenumerator;
(b) Several enumeration areas that may be combined tocreate a workload for a single enumerator;
(c) Population groups that require particular attention andtherefore additional or specialist enumerators;
(d) Special dwellings in enumeration areas that may re-quire a separate enumerator. These dwellings can includehospitals, hotels, defence force barracks, or prisons;
(e) Reserve staff who can be used as replacements forstaff not able to complete their duties.
As stated above, it is, by definition, normal for one enu-merator to be responsible for one enumeration area. How-ever, this will largely depend on the enumeration area de-sign process (see chap. II, sect. C). One enumerator per enu-meration area is possible if the area is designed to meet astandard degree of effort or workload. This standard is ex-pressed as a set amount of time in days and expected num-ber of hours worked per day. It may be based on some or allof the following:
(a) An existing standard developed by the country;
(b) The duration of the enumeration period;
(c) A realistic assessment of staff availability by day overthe duration of enumeration, considering:
(i) Travel time to and from the area;
(ii) Hours of daylight;
(iii) The standard working day;
(iv) Expected limitations on enumerator availability,for example, if the average enumerator will onlybe available on a part-time basis because he orshe is working in another job;
(v) Some margin for contingencies, considering ab-normal circumstances.
To test each enumeration area against this standard, thefollowing issues may need to be considered:
(a) Total number of households in the enumeration area;
(b) Time estimated per household;
(c) Characteristics that may make enumeration more dif-ficult, including low population density, remote areas anddifficult terrain. This criterion may be best expressed as aweighting, according to which time per household is in-creased or decreased.
Ideally, the standard is applied to each enumeration areaduring the design process, well before enumeration. How-ever, workloads may need to be adjusted in the field in thefollowing ways:
(a) By treating several enumeration areas as one workload(i.e. they can be enumerated by one person) if they are wellbelow the standard;
(b) By treating one enumeration area as two or moreworkloads (i.e., they require more than one enumerator) ifit is well above the standard. Ideally, this should be a rareevent.
(ii) The number of supervisors, regional managers anddeputy regional managers
After the number of enumerators has been established, itis possible to work up the managerial hierarchy, level bylevel, to establish the numbers of supervisors and manag-ers. The ratio of enumerators to supervisors is discussed inmore detail in chapter III, section B on structure of theworkforce.
The principles used in determining the required numberof these positions are the same for all of the supervisory andmanagement levels. To begin with, a standard based on thenumber of employees to be supervised or managed must bedecided. This standard will depend on the following:
(a) Any existing standard;
(b) The amount of face-to-face time required with subor-dinates;
(c) Travel time, which itself is often correlated with thesize of the area of responsibility;
(d) Estimated time required to be spent on tasks not re-lated to staff supervision and management;
(e) Amount of time available to undertake this work.
It is preferable that this benchmark be decided by the cen-sus agency and adapted in the field (with advice from thecensus agency where necessary) where local circumstancessuch as the following exist:

92
(a) The population density of the area may increase thedistance that needs to be travelled;
(b) The characteristics of the area may make enumera-tion more difficult and therefore require a greater level ofmanagerial or supervisory support of enumeration staff.
(iii) The number of reserve staff
Experience has shown that staff at any level in the fieldworkforce may not complete their duties during the con-duct of enumeration owing to a variety of reasons. Thesecould include the following:
(a) Availability of better employment;
(b) Sickness;
(c) Staff dissatisfaction with the duties they are under-taking;
(d) The census agency terminating their employmentowing to poor performance.
Also, if there is a long lag time between the recruitmentcampaign and the actual enumeration period, some staff maynot begin their duties because they have found alternateemployment or have lost interest in the job.
In these situations, it is necessary to consider, and be readyto implement, strategies on how the workload can be com-pleted without reducing quality standards. Whatever strat-egy is adopted, it must be able to be implemented quicklyand efficiently. Strategies that may be considered are thefollowing:
(a) Utilizing a pool of reserve staff that have already beentrained;
(b) The workload being taken over by other workers ofthe same level who have completed their workload or areable to accept further demands;
(c) The workload being taken over by other workers at ahigher level;
(d) Promoting staff to a higher level (e.g., promoting anenumerator to a supervisor’s position).
The appointment of a suitable number of trained reservesis a key strategy that will reduce delays in the critical timeof enumeration. The enumeration period is short and reservesneed to be available, and able to be placed, in the field in ashort period of time.
Reserves could attend the same training session as thestaff they may replace. The appointment of reserves willinvolve extra payment, since they will usually be paid a re-tainer of some type, regardless of whether they undertakeany actual work. The number of such staff needs to be de-cided in terms of cost and the work done to date. However,an important message is that reserves will be needed to ca-ter for the inevitable shortfalls that will occur in the field.
In larger geographic areas, the appointment of more re-serves will reduce the possibility of one reserve having toundertake a large amount of travel (e.g., from his or herhome to the area where assistance is required).
An open and informative recruitment process is regardedas the key to reducing the frequency of resignations by cen-sus field staff owing to job dissatisfaction. It is essential toprovide applicants for census positions with accurate state-ments of the duties to be undertaken, amount of workload,remuneration and quality expectations.
(b) Recruitment campaign
In general, the vast majority of positions in field opera-tions will be filled by members of the public who are recruitedthrough a recruitment campaign. However, some positionsmay be filled by people from special groups (e.g., school-teachers or heads of villages) through direct appointment.
There are four important issues to consider with respectto the recruitment campaign. These are the following:
(a) The timetable for the campaign;
(b) The type of campaign;
(c) Publicity;
(d) Government regulations.
(i) Timetable
As noted above, an important issue when recruiting staffis to recruit them as close as possible to the date when theywill commence work. However, recruitment cannot com-mence too late as this may leave insufficient time to under-take additional recruitment campaigns in areas where theremay be a shortfall in applicants.
The recruitment campaign can be conducted separatelyor conjointly for each level of staff. However, selectionwithin field operations normally works on a cascade prin-ciple, that is, where each level in the field staff hierarchy isresponsible for recruiting the next level down. Issues to beconsidered include the following:
(a) Employment commencement dates, which may dif-fer for each level of staff;
(b) Capacity required to process a large number of appli-cations at one time rather than processing smaller groups ofapplications over a period of time;
(c) Adoption of a joint process, which can be universalor only apply to various components of the recruitment cam-paign (e.g., advertising, distribution and processing of ap-plications). Joint processes may lead to efficiency savings;
(d) Desirability of attracting applicants of appropriatequality to each level in the management hierarchy. If jointadvertising is used for all levels, a greater proportion ofapplicants are likely to apply for every position.
(ii) Type of campaign
Government agencies may have established networks ofboth permanent and temporary workers who could be ap-proached to support the census. In some countries, it maybe possible to use existing social, as opposed to employ-ment, networks to attract prospective employees.

93
These staff may be possible applicants for field operationpositions in which case advertising should be placed in therelevant media and/or key members of the network ap-proached for assistance.
If government staff are not available for census duties,they may be able to assist by including census advertisingin any internal media such as newsletters and staff bulle-tins. This may attract current staff who are able to under-take census duties when they are off duty from their usualposition. Other government agencies such as post offices,electoral offices and local government bodies may also beprepared to display and distribute recruitment materials (e.g.,posters and pamphlets).
In the early stages of planning the recruitment campaign,the census agency will need to identify which governmentagencies can be of assistance. A proactive approach can thenbe made to these agencies to obtain their support for censusactivities.
Community groups or institutions provide an opportunityto disseminate the recruitment campaign among groups thatdo not normally access the mainstream media. Posters andinformation about field positions can be distributed to suchplaces as community centres, libraries, universities, schools,neighbourhood groups and sporting clubs. The use of com-munity groups can be particularly effective in remote areas.
(iii) Publicity
Publicity is necessary for the recruitment campaign. Sec-tion A above outlines publicity elements that can be adopted.
An important point is that the publicity should be orga-nized and targeted towards potential applicants. Assump-tions need to be made about the type of people that willcomprise the majority of applicants, for example, unem-ployed persons, university students or homemakers. This willdictate which media are used and the methods of publicity.
There may be some regions in the country where therewill be a possibility of a shortage of applicants. These maybe identified through previous experience in organizing sta-tistical collections in such areas or be based on local knowl-edge. Additional publicity should be organized as part ofthe initial campaign in these regions and it is important thatthey are dealt with proactively as time is crucial in this partof the census cycle. Remote areas may fall into this cat-egory and special attention should be given to utilizing com-munity networks that exist in these areas.
(iv) Government regulations
In some countries, government regulations may prescribethe methods that may be used for the recruitment of staffand these will need to be taken into account. In some cases,these regulations may not have been designed to cater forthe recruitment of the large numbers of staff needed for theenumeration activity. In these cases, the census agencyshould negotiate with the appropriate government agenciesto gain approval for the most efficient practices to be used.
(c) Selecting staff
The selection methodology should allow for large num-bers of staff to be selected efficiently and to appoint thebest quality staff from those available. In some areas, theremay be an excess of applicants when compared to the num-ber of available positions. A methodology to select the beststaff can comprise the following:
(a) Using standard application forms;
(b) Distributing selection criteria and other informationabout the positions to applicants;
(c) Assessing the applications and shortlisting, if required;
(d) Conducting interviews.
(i) Standard application forms
Using standard forms, which all applicants must use,makes the task of comparing the applicants much easier andmore efficient.
(ii) Selection criteria
The selection criteria should list the most significant quali-ties, attributes or experience that an applicant should pos-sess to successfully undertake the position. These criteriawill vary significantly among countries and each countryshould develop them based on its own particular circum-stances. However, it is important that the selection criteriaare documented so that prospective applicants are aware ofthem and know the criteria against which they are to bemeasured.
Other information about each position can also be madeavailable to the applicants. Information that can be providedincludes the following:
(a) Type of work;
(b) Duties of the position;
(c) Dates showing the period of employment;
(d) Amount of payment and expected payment dates;
(e) Code of conduct expected of staff.
(iii) Assessment of applications
Assessment of applicants against the selection criteria maybe used to remove, in an efficient way, unsuitable appli-cants and to rank the remainder in approximate order ofsuitability. This can be done by scoring each applicantagainst each of the selection criteria. Any written refer-ences from previous employees can also be taken into ac-count when assessing applications.
(iv) Interviews
Those applicants who are regarded as suitable can thenbe interviewed to confirm their suitability for the position.A standard set of questions should be developed and askedof each applicant. Again, each applicant’s performance atthe interview can be scored.

94
3. Remuneration
Field staff need to be assured that payment will be com-mensurate with the amount and difficulty of the work theywill undertake. The payment schedule also needs to fulfiltheir expectations and requirements.
If these conditions are met, it is expected that field staffwill not be distracted from performing their work by con-cerns with payment. The converse also applies. If field stafffeel unhappy about their pay, especially in contrast with theconditions of employment offered prior to appointment, theywill not produce high-quality work, with serious implica-tions for the outcome of the census. Senior staff will also bedistracted from quality work, with further serious, adverseimpacts on the quality of output.
An efficient payment system will only require a minimumof information flowing from the enumeration activity. Thiswill lessen the administrative load on the supervisory andmanagerial positions.
The rates of payment and the schedule of payments mustbe finalized before recruitment commences, as applicantswill require this information.
A Computerized System for Remuneration of Census Staff.
(a) Development of a payment system
Development of a payment system includes determining(a) the basis of payment, (b) the payment timetable and (c)the system design.
(i) Basis of payment
There are numerous methods for establishing the basis ofpayment. In general, it should be simple and efficient toadminister, clear and understandable to staff, meet publicexpectations for work of this nature, be precisely docu-mented and allow for variation according to the difficultyof the workload.
Payments can be based on a record of hours worked, anestimate of time per household, or an estimate of time forthe entire workload.
There are advantages and disadvantages for each option,as detailed in the table below.
Option A is not recommended for enumerators becauseof the high supervision overhead associated with it and thewidely dispersed nature of field operations. Both options Band C are feasible, or a combination of both is possible.While options B and C require a commitment by staff to acontracted amount, there will be occasions where staff arerequired or directed to work over and above normal expec-tations. As a result, the pay system needs to be flexibleenough to accommodate such cases. Staff will also need tobe flexible enough to recognize that their employment con-tract is based on an average.
The degree of certainty in option C, for both the employeeand the census agency, has considerable benefits. However,for areas of significant change in workload size, the physi-cal amount of work may be so variable as to make this ap-proach unworkable.
A computerized system for remunerationof census staff
If a country has about 3 million people, a database of allcensus staff can be developed and continuously maintainedby a team of about 10 persons. Listings of census workerscan be produced and transferred to the finance departmentprior to payments. Computerized files containing employ-ees’ personal identification numbers, account numbers, andsalaries can be transferred to the bank on computer dis-kette prior to payment.
A special transfer of payments can be reached with banksto facilitate payments. Training certifications can be is-sued to each fieldworker. Computerized experience certi-fications can be issued after the completion of census field-work activities, as well as after the completion of censusdata-processing activities.

95
Basis of Payment General Application Advantages DisadvantagesA. Record of hours
workedFor staff under directsupervision. This is not generallythe case with field operationstaff.
Payment is only made for actualhours worked.
High supervision overhead
B. Estimate of time perhousehold
For staff where the amount ofwork in the workload is notknown until after the contract iscompleted.
Payment is made for everyhousehold enumerated.
The budget can be calculated onthe basis of number of units,together with growth factors.
Staff cannot be advised of thetotal remuneration beforecompletion of the contract.
Requires a greater degree ofadministrative effort to process,which delays the date of finalpayment.
Enumerators may be tempted toincrease the number ofhouseholds in their workload.
C. Estimate of time perworkload
For staff where the amount ofwork in the workload can beestimated.
Staff can be advised of thepayment before commencementof contract.
Administratively simple: requireslittle information flow fromcollection process.
Timely.
Relies on estimate of workloadsize being reasonably accurate.
Enumerators may not revisithouseholds at which they initiallyhad no contact.
D. Fixed payment Usually in countries that use stafffrom other governmentministries.
Same as op tion C above. Provides no incentives to staff tocomplete the workload.
E. Fixed payment, plusadditional rate basedon the number ofhouseholds above acertain level.
Usually in countries where theamount of work cannot be easilyestimated.
More homogeneity in thepayment of enumerators.
Staff cannot be advised of thetotal remuneration beforecompletion of the contract.
Requires a greater degree ofadministrative effort to process,which delays the date of finalpayment.
Enumerators may be tempted toincrease the number ofhouseholds in their workload.
Table III.1. Basis of payment options

96
Regional managers (and deputy regional managers) canbe paid on the basis of the number of staff under their con-trol, with a weighting for areas of geographic or social com-plexity. Given that workloads have been designed on thisbasis, it is highly likely that there will be little variance inpayment amounts.
(ii) Timetable
The payment timetable needs to balance the needs of fieldstaff against the cost of processing payments. Each indi-vidual payment has an associated cost and therefore the morefrequent the payments the higher the cost to the censusagency. Depending on the nature of the payments process-ing system, these costs could be significant.
The timetable will also be determined by the availabilityof both personnel and payment data necessary to processpayments. Personnel data is an output from the recruitmentactivity and payment data an output from the enumerationactivity. Sufficient time should be allowed for the collec-tion, processing and checking of the data.
In general, total payment should not be made in advanceof work performed. If this occurs, staff lose the financialincentive to complete their workload and staff who do notcomplete their contract may be overpaid. However, in somecountries, a small advance payment is made to cover anycosts that the field staff may incur while undertaking theirduties (e.g., travel expenses).
In some countries, multiple payments are made through-out the enumeration period. In these cases, the payment time-table should be based on conservative estimates of the rateof workload completion, by date, for each level of staff.
The timetable needs to be realistic as it must be guaranteedas deliverable. A late payment will generate hardship for staffwho have made personal financial commitments based on theirexpectations from the payment timetable. It will also imposean extra and unnecessary workload on the census agency be-cause of the many inquiries from staff trying to ascertain whenthey will be paid. These inquiries can become a major burdenon the agency when all attention should be devoted to ensur-ing the quality of the work being undertaken. If such a situa-tion arises, it is to be expected that the work of the field op-eration staff will suffer, thus diminishing the quality.
(iii) System design
Once the basis of payment and the payment timetable havebeen established, a system to make the payments can beconsidered. The system can be clerically based, electronicor a combination of both. Factors to consider include thefollowing:
(a) Present systems in place in the census agency;(b) Delegation of administrative control of payment;(c) Security;(d) Accountability;(e) Reporting;(f) Government policy on outsourcing;(g) Links to other agencies.
Existing systems in the census agency may be used topay field staff. However, there will be a significant increasein numbers of staff that will have to be paid during the enu-meration period. Therefore, the capacity of existing systemsand their ability to handle the increase will need careful test-ing. Extra resources may need to be allocated to these sys-tems to ensure that they can handle the anticipated load.
The administrative control of payments to staff may bedelegated to different levels in the census agency. For ex-ample, this delegation may be organized centrally withinthe census agency or through any regional offices that mayexist. Alternatively, this delegation may be given to differ-ent levels of staff in the field hierarchy (e.g., regional man-agers).
There are two aspects to remuneration that must be con-sidered with regard to security:
(a) The need for the census agency to ensure that thesystems employed are not susceptible to fraud;
(b) The need to ensure that funds are accurately trans-ferred to the employees concerned.
Both of these matters will be greatly influenced by theinfrastructure and administrative systems applicable withina country. It is therefore not possible to be prescriptive aboutthe ways in which these broad principles are implemented.
Internal controls and audit trails should also be built intothe system to ensure accountability. These can assist in mini-mizing overpayments and ensure that funds are not misap-propriated. However, there needs to be a balance regardingaccountability. Risks need to be weighed against costs. Toomany edits and controls will slow down the system.
The system should be capable of producing standard man-agement reports. These may include:
(a) Reports of expenditure by pay, which may be mea-sured against the budget;
(b) Future estimated expenditure according to the pay-ments timetable;
(c) Other internal reports, which may include staff num-bers and average payments by level.
Consideration may also be given to outsourcing the pay-ments system. In many agencies, there may be a lack ofexpertise and/or infrastructure necessary to establish a pay-ments system.
However, outsourcing should be approached with cau-tion. It is likely that few external providers of such serviceswill have systems established to deal with a system that re-quires a large number of employees to be recruited, paidand let go within a very short period. It is likely that theexternal supplier will have to undertake the same systemsdevelopment exercise as the census agency, but without theownership of the process held by the census agency. Thisownership recognizes the direct link between remunerationand quality of statistics.

97
The system may also be required to have links to otheragencies. For example, these may be required in countrieswith personal income taxation arrangements. In these cases,discussions should be held with these agencies to ensurethat the necessary links are established and tested well be-fore the enumeration period.
As with all census systems, the payment system shouldbe subject to rigorous volume testing before it is imple-mented into field operations.
C. FIELD STAFF TRAINING
1. Introduction
A high proportion of staff from all levels of the fieldworkforce are usually short-term temporary staff. They gen-erally have limited experience or training in statistical col-lection activities. It is therefore important that they are givensufficient training to understand the following matters:
(a) The importance of their duties;(b) How their efforts fit into overall census goals;(c) Issues such as confidentiality;(d) The way they are expected to undertake those duties.
Providing sufficient training to these staff at the beginningof their relationship with the census is a good step towardsenabling them to undertake their duties in an efficient andpositive manner. This is a significant step towards achievinga high level of quality in the overall census outcome.
A further benefit of good training is that it will achieve apositive relationship between the field staff and the censusagency. This is potentially of great benefit if it increases theproportion of the staff who come forward to undertake cen-sus duties in the future. While these staff will still requiretraining, it will be more a refreshment of knowledge or skillenhancement approach than basic skill provision. This willimprove the quality of the census through a more cost-effi-cient operation or a higher level of accuracy in work or both.
In countries that use a short and a long form approach,the training programme for enumerators will need to be splitin two. The training programme for the short form can bereduced considerably when compared to the trainingprogramme for the long form. The best enumerators shouldbe used in those areas selected for the long form.
In the present chapter the training programme that is dis-cussed relates to the field operations staff (i.e., managers,supervisors and enumerators). However, countries shouldalso note that additional groups of people may need to un-dergo training on the census. These groups can include re-gional government administrators and/or village heads whomay be involved in the coordination of census logistics intheir particular areas of responsibility. These groups ofpeople do not necessarily need to know all of the technicaldetails associated with enumeration. However, they shouldbe given a short training course so that they are familiarwith the census framework and the responsibilities of staffworking on the census, and an overall appreciation of theoperations that will occur in their areas.
2. Training programmes
The training is directly related to the procedural aspectsof undertaking a specialized operation. Therefore, it is usu-ally impractical to outsource the delivery of the training.However, it may be desirable to utilize professional trainersin developing the training materials and providing adviceon training strategies.
In the present section the methods described are a recom-mended training regimen for the temporary staff, engagedon operational tasks directly related to the field aspects ofenumeration. However, it is likely that many of the staff ofthe census agency engaged in managing the operational staffwill themselves be relatively inexperienced in census work.It is therefore essential that they be given sufficient trainingto equip them for this work.
In many countries, key participants (e.g., regional man-agers and census agency staff) are brought together at thestart of the field operations some months before census day.This is a cost-effective way of passing on the necessary in-formation and providing a good basis for team buildingamong the staff. The duration of such a workshop is a mat-ter of judgement by the census agency, taking into accountsuch factors as:
(a) The nature of the staff who have been engaged;
(b) Their experience in census-related activities;
(c) The degree of change in processes since the previouscensus;
(d) The amount of time and other resources available.
Training should be delivered as close as possible to thetime at which it is to be used. This applies to the field opera-tion phase of the census as well as to other aspects of thecycle. In the field operation phase, this can be particularlydifficult. This is because there are usually large numbers ofstaff to be trained, over a large geographic area, in a shortperiod of time (typically three or four weeks).
The training should aim at equipping more senior staffwith a high level of understanding of their role and the na-ture and relevance of the census. This should result in ahigher level of understanding by those in lower positions. Itis therefore important that the more senior staff are welltrained, with particular focus on understanding the impor-tance of their duties and how they contribute to the overallcensus goals.
3. Trainers
An effective way of undertaking training is to follow acascade principle, where each level in the staffing hierar-chy trains the level immediately below it. Using this prin-ciple, the regional managers are trained by staff from thecensus agency; the regional managers then train the deputyregional managers, who in turn train the district managers,who train supervisors, who train the enumerators.

98
A further consequence of this cascading approach is thateach layer in the hierarchy must receive some training inhow to train the next level down. Where possible, the im-portance of this training function should be emphasized inthe selection of staff, in the census agency as well as themore senior field staff. It is recommended that the the num-ber of layers in the training cascade be as short as possible.
Another method employs master trainers who are respon-sible for training staff in particular geographic regions. Thesetrainers would initially undergo training (often referred toas training the trainers) in the census agency. They are thenresponsible for training staff in a particular geographic re-gion. However, while these trainers can undertake some face-to-face training and coordinate training in their regions, it isunlikely that they will be able to train all staff. Therefore,some field staff will have to undertake training as part oftheir duties.
In some cases, the master trainers are specialist staff fromthe census agency while in others, the master trainers willbe temporary employees. If temporary employees are used,it is important that they are given adequate training and timeto become completely familiar with the concepts and issuesassociated with census enumeration. Permanent staff fromthe census agency should also carry out spot checks whenthese trainers are training other staff to ensure that they areconducting the training sessions correctly.
In some Arab countries, a hierarchy method of training,from top to bottom levels, is usually carried out:
• Census key subject matter persons train census direc-tors;
• Census directors then train census supervisors;
• Census supervisors then train census crew leaders;
• Census crew leaders then train census enumerators;
• Daily visits by census key subject matter staff are orga-nized during the training sessions;
• The census office conducts centralized workshops afterthe training of the supervisors and after the training of thecrew leaders for open discussions on fieldwork activitiesand responsibilities.
4. Developing training material
It will usually be the responsibility of census agency staffto develop materials (handbooks, instruction kits, trainingpackages and videos) to support the activities of the collec-tion staff. Care and attention in the development of thesematerials is needed. The standard, and application, of thesematerials is crucial if a consistent approach to enumerationis to be adopted across the entire country. High-quality train-ing guides and videos will make it more likely that the ap-proved, standard procedures will be used with consequenthigh-quality outcomes. It is to be expected that trainers willuse their initiative in developing ways of applying thesematerials that satisfy both their own personality and styleand the needs of their audience. This should be encouraged,
and training staff should also be encouraged to pass alongsuggestions on methods they have found to be particularlyeffective.
Some countries make extensive use of video as a trainingtool in certain parts of the training cycle to ensure homoge-neity of training outputs.
It is recommended that, where training is being given incountries with multiple languages and those with an offi-cial language and a variety of local languages, careful con-sideration be given to terms. The terms should first be docu-mented and recorded and then used in the practical trainingsessions.
5. Training sessions
In preparing training sessions, the requirements of eachgroup of trainees should be considered. The organizer ofthe course will need to undertake the following:
(a) Set the goals of the session for each group;
(b) Plan the session using the guide, goals and materials;
(c) Prepare any additional materials required;
(d) Practise the session, testing all visual and technicalaids;
(e) Ensure the venue is set and seating is arranged in anappropriate manner.
During formal training courses certain techniques can beused to lay the foundation for success. These include thefollowing:
(a) Knowing the subject matter;
(b) Following the standard training guides to ensure con-sistency of training;
(c) Encouraging trainee participation;
(d) Conducting practical exercises, including role play-ing and mock interviews;
(e) Looking for and overcoming signs of fatigue and bore-dom (for example, have regular breaks and ask questions ofthose losing concentration);
(f) Sticking to the main issues and not getting boggeddown with ones;
(g) Dealing separately with persons within the group whoneed special attention.
6. Training regional managers
The census agency will also provide ongoing support andassistance to the regional managers throughout their periodof duty. This can be achieved through visits by agency staffor frequent telephone contact at periods of more intenseactivity. This can be regarded as a form of on-the-job train-ing. In addition, these staff must be provided with a printedmanual setting out details of the procedures to be followed.If appropriate facilities are available, these more senior staffmay be supplied with computers enabling them to contact

99
Module Content01 Introduction Introduction of staff to one another.
Introduction to the census.02 Administrative systems Overview of the role and tasks of the regional manager with an
emphasis on quality management.Procedure for communications among regional managers and with thecensus agency.Overview of collection operation computer systems (if applicable).Clerical administrative procedures.
03 Occupational health and safety forenumeration staff
04 Form distribution and return Logistics.Timetable.Impact of logistics on quality.Role(s) of staff by level.
05 Recruitment of staff Advertising.Selection of staff.Administrative procedures for appointment.
06 Financial matters Budgeting.
Administrative procedures for expenditures.
Procurement of material by collection staff.
07 Training techniques Train-the-trainer techniques.
Training deputy regional managers and supervisors.
08 Mapping Use of maps in planning workloads.
Use of maps to manage operations.
Managing operations in areas where maps are deficient.
09 Special enumeration strategies Communal/special dwellings.
Other groups requiring special strategies.
10 Remuneration/payment ofcollection staff
Basis and rates of payment.
Timetable for payments to each level of staff.
Role of regional manager.
Procedures for payment system.
Course review Brief review of progress in each region.
Table III.2. Regional managers training course (phase one: modules 01-10)

100
the census agency for advice by using the Internet or othernetworks.
It is usually convenient for the senior temporary staff toreceive several days of classroom-based training. As theywill be employed for a relatively long period, perhaps sev-eral months, it may be effective for the training to be splitinto separate phases as follows:
(a) The first, immediately after appointment, dealing withinitial tasks such as familiarization with the area, recruit-ment and training of lower-level staff, and establishing con-tact with local stakeholders;
(b) The second, for one day as close to census day aspossible, dealing with the tasks to be expected in the enu-meration activity, including quality monitoring, throughputmonitoring and remuneration processes.
A model of the issues to be covered in the training coursesfor regional managers is given in the table below. It will benecessary for countries to adapt the model according to theneeds of the census model they adopt. Countries that alsoemploy deputy regional managers should develop a coursespecifically for that level, basing it on a shortened versionof the regional manager course.
The model is based on two phases of formal training, cov-ering 14 modules. The training sessions should also includereview sessions as shown.
It is suggested that, where possible, the courses be con-ducted on a residential basis. This will encourage the man-agers to get to know one another and the census agencystaff and assist in establishing the effective communicationspaths that are necessary during the field operation.
It is suggested that a class size of from 10 to 15 staff isappropriate for this course. Where there are significant dif-ferences in procedures required between regions (for ex-ample several regions in an urban area and others in therural hinterland), it will be desirable to group the managersfrom similar regions together.
The first phase covers the initial tasks and administrativeprocedures relating to the regional manager’s work. Thisshould be scheduled just before they commence their work.Planning should allow for this to take approximately threedays. Depending on the aptitude and experience of the man-agers, this could be extended to four days.
The second phase covers tasks that are important in theactual enumeration period. This will take at least one dayand, if time is available, could be extended to a second day.
Deputy Regional Managers
As indicated in chapter II, section B, the role of a deputyregional manager may be essentially that of an administra-tor. If this structural model is used for the field operationsworkforce, it is suggested that the training course for thesestaff be given by the regional manager.
The course should be approximately one full day in lengthand comprise the following modules from the regional man-ager training course above:
01. Introduction (with a focus on the role of the deputyregional manager);
05. Recruitment of staff, with a focus on administrativeprocedures;
06. Financial matters;
07. Training techniques;
10. Payment of collection staff.
In this situation, it would be appropriate for these modulesto be given less emphasis in the regional manager trainingand relatively more emphasis given there to the quality man-agement and training modules. It would also be necessarythat the administrative procedures to be followed by deputyregional managers be clearly specified in manuals and otherdocumentation since there would be less direct contact be-tween the census agency staff and the administrators.
7. Training supervisors and enumerators
The training of these staff can use a range of trainingmethods, including the following:
(a) Home study exercises;
(b) Classroom training sessions;
(c) On-the-job training.
(a) Mainstream supervisors and enumerators
(i) Home study exercises
Home study exercises are designed to familiarize the fieldstaff with their work before attending classroom trainingsessions. Completion of a home study exercise forces fieldstaff to read their manuals, to prepare themselves for thetraining and to identify areas of confusion, all before at-tending training.
By giving the material back to the trainer before the train-ing actually commences, the trainer can ascertain if there isa consistent problem across the group as a whole or whetherjust one, or a few people, are having specific problems. Inessence, an analysis of home study exercises can providethe trainer with insight on where and how to focus trainingpriorities.
To gain maximum value from this process, it is importantthat the documentation, including the manuals and homestudy exercises, are delivered to the participants well be-fore training is to commence.
A typical home study exercise would require written an-swers, or completed questionnaires, to be returned and ex-amined. Topics likely to be addressed for an interviewer-based census would cover all or most of the following:
(a) Rationale for the census and its use;
(b) Confidentiality;
(c) Supervisors’/enumerators’ role;
(d) Receiving, checking and accounting for material;
(e) Coverage;

101
Module Content
Brief review of progress in each region.
11 Public communications and inquiryservices
Review of public communications.
Plans for advertising campaign during enumeration.
Plans for inquiry services, including (where appropriate)telephone hotline and use of the Internet.
12 Review of recruitment processes Matching staff to workloads.
Review of quality of staff appointed.
13 Review of special enumeration strategies
14 Quality assurance in enumeration Role of regional manager.
Procedures for refusals.
(f) Definitions of certain topics (for example, labour forcestatus and occupation);
(g) Sequence guides;
(h) Procedures on the doorstep;
(i) Procedures for interview;
(j) How to handle respondents who refuse to participatein the census;
(k) Checking and editing completed material.
Supervisors would have some additional questionscovering the following:
(a) Materials checking procedures;
(b) What to watch for in observed interviews, andrecording of information;
(c) Managing poor performing interviewers;
(d) Quality assurance checks;
(e) Editing;
(f) Materials collection.
These study exercises can contain approximately 20 ques-tions for interviewers, and the same 20 and approximately
15 more questions for supervisors. The questions should beclear and unambiguous.
It is essential that the trainers have access to a completeset of accurate answers, enabling correction and analysisprior to the commencement of training.
(ii) Classroom training sessions
The amount of time spent in classroom training will varyconsiderably between countries and will depend on, amongother things, whether the census is interviewer based or self-enumeration. With an interviewer-based census, more timewill be needed to train the enumerators.
A model of the issues to be covered in training coursesfor supervisors and enumerators is given below. It will benecessary for countries to adapt the model according to theneeds of the census model they adopt.
Supervisors
Supervisors should complete a home study exercise tofamiliarize themselves with their duties and to introducethem to the enumerators’ handbook (or instruction manual)before they attend their formal training session. Supervi-sors should return their completed home study exercises tothe regional manager before their formal training to enablean assessment of their understanding of procedures.
Table III.3. Regional managers training course (phase two: modules 11-14)

102
Enumerators
The details of duties at this level are greatly influencedby the basis of enumeration, local conditions and overalladministrative requirements. Therefore, only an outline ofthe course is given:
1. Welcoming and introduction to the census
2. Confidentiality
3 Enumerator role
4. Occupational health and safety
5. Administrative issues
6. Definitions, mapping and other concepts
7. Special enumeration strategies
8. Duties of enumerators and procedures to be employed(a) Before contact with households(b) During contact with households
9. Quality assurance of completed forms
10. Preparation of forms for transport to supervisor
(iii) On-the-job training
For enumerators, on-the-job training, where enumeratorsare accompanied by their supervisor for a few interviews(or deliveries to households, if a self-enumeration approachis used), is particularly relevant to ensuring that they under-stand their tasks and are performing them correctly. Thesupervisor should assess the relative abilities of the enu-merators and manage their time so that the weakest enu-merators receive the greatest level of support.
Module Content
01 Introduction Introduction of staff to one another
Introduction to the census.
02 Confidentiality Importance of confidentiality.
Procedures to be followed by supervisors.
Procedures to be followed by enumerators.
03 Dispatch and return tasks Transport arrangements for supervisors.
Material to be distributed.
Distributing material to enumerators.
04 Definitions and mapping Definitions of key characteristics, as employed in the census, which shouldinclude age, usual residence, types of housing and other characteristicsdetermined by the country.Introduction to census maps.
Use of maps in review of supervisor's area of responsibility.
05 Implications of informationtechnology
Relationship between field operations and processing phases.
Use of computers in collection operation (if appropriate).
06 Enumeration staff recruitment Enumerators.
Other field staff.
07 Enumeration staff training Enumerators.
Other field staff.
On-the-job quality assurance.
08 Enumeration procedures Role of supervisor.
Role of enumerator.
Role of other field staff.
09 After Enumeration Quality assurance of workloads.
Preparation of material for transport to the processing centre(s).
Review of course
Table III.4. Supervisors training course

103
(b) Specialist enumerators
Some countries may also employ specialist staff to enu-merate population groups that require particular consideration.Examples of such groups could include people in communaldwellings (such as hospitals, prisons, boarding schools or ho-tels) or members of distinct cultural or language groups. Wherethere is sufficient need, it may be necessary to establish spe-cific training schemes for these staff. As the range of possiblesituations is wide, no prescription for such schemes is offeredin this handbook. However, the training should follow thesame principles as the mainstream courses and, where pos-sible, use the same materials to ensure a standard outcome.
8. Administration training
As indicted in other parts of this handbook, a large under-taking such as the filed operation phase of a census willrequire staff to follow a wide range of general administra-tive procedures relating to the terms and conditions of theiremployment, rules and/or laws relating to the security andprivacy of census materials and other rules relating to theproper behaviour of government employees.
It is important that staff receive some training in these mat-ters, otherwise they will be unable to perform their duties ef-fectively. At worst, it may create situations that cause signifi-cant adverse publicity for the census and/or the census agencyin general. However, it is important that administrative train-ing does not detract from operational training. The staff areemployed to collect high-quality statistical information frompeople, and pass this on to the census agency within an agreedtimetable and at the highest level of accuracy. The collectionstaff are not to be employed to fill in administrative forms.
9. Health and safety training
Even in the best-run census, there will be situations thatpose a risk to the well-being of field staff. Ways of mini-mizing these potential risks should be covered in the train-ing for all levels of field staff. The matters covered couldrange from correct methods for handling enumeration ma-terials to managing encounters with domestic animals. Train-ing in this area should concentrate on the more commonoccurrences rather than on those that rarely occur.
The training must itself be carefully managed, to avoidoveremphasizing the risks, which can create a victim men-tality in the staff. It is usually possible to reverse the pre-sentation to stress attaining the positive rather than recover-ing from the negative. For example, people should be trainedin the correct way to lift boxes of forms, rather than listingthe health risks from poor techniques; they should be giventips on how to avoid dog attacks rather than on how to sub-mit a compensation claim when bitten.
10. Computer systems training
Following widespread acceptance of the Internet and othercomputer-based communications systems, countries may beencouraged to use these systems rather than traditional
printed or voice-based communications. If such a process isto be applied, the staff who will operate the system must begiven sufficient training in the use of the application. Evenif familiarity with computers is a criterion for selecting staff,it cannot be assumed that the selected people will be famil-iar with the specific software used by the census agency.
If this element of training is undertaken successfully, theprobability of a high-quality outcome from the census canbe dramatically enhanced. To do otherwise risks staff be-coming more concerned with learning to operate computersthan focusing on their key roles.
As well as formal training in the initial courses, care mustbe taken to provide on-line reference material for the com-puting system and a readily accessible help-desk facilitywithin the census agency.
D. DISTRIBUTION AND RETURN OF MATERIALS
1. Introduction
In many countries, the distribution and return of materi-als in the field operations phase will represent the largestpeace-time movement of materials for any single exercise.As a logistics operation, this activity will be referred to asdistribution and return tasks.
Distribution and return of materials is the term used tocover tasks associated with materials that are:
(a) Supplied to a packing centre;
(b) Distributed to field staff;
(c) picked up from field staff;
(d) Returned to data processing centres.
The tasks include the following:
(a) Receipt of material from manufacturers (e.g., printers)and other external suppliers. This could include the censusform and materials needed for packing (e.g., boxes and tape);
(b) Bulk storage during the packing operation;
(c) Packing;
(d) Consignment preparation and delivery to enumera-tion staff;
(e) Bulk transport outward;
(f) Pick-up from enumeration staff;
(g) Bulk transport inward to processing centres;
(h) Close-down operations.
Regardless of the type of census, there will be a need formaterials to be supplied to field staff and returned. For ex-ample, even in the case of a mail-out/mail-back census, thereis usually a field follow-up component for which materials,including manuals and administrative supplies, will be re-quired. In these cases, the volume of material would be rela-

104
tively small, but there is still a need to plan and implementthese activities. Specific issues regarding using a postal ser-vice for a mail-out/mail-back census are discussed in sec-tion 8 below.
The majority of these tasks are usually carried out undercontract by a government transport service or commercialoperator, although the packing of materials may be donewithin the census office in some countries. The contractorwill use specifications and consignment details provided bythe statistical agency. If the volume is small, the postal ser-vice may be a feasible method.
2. Inputs
As a first stage in this process, decisions must be madeconcerning the nature and responsibilities of the centrallycontrolled distribution and return operation. Will deliveriesbe made to regional managers or to supervisors? Will enu-merators be required to collect their work from a more cen-tral depot? These decisions must be made by countries, keep-ing in mind the impact of the amounts of material to betransported, the transport available to field staff and the con-dition or existence of roads or other means of transport.
Once these decisions have been made, the key inputs tothe dispatch and return of materials are as follows:
(a) Workload estimates from the mapping programme toestablish packing volumes for transport requirements;
(b) Name and address details from the recruitment activ-ity to establish details on delivery and pick-up points.
3. Material
The material to be transported generally falls into fourbroad categories, that is, material for (a) enumerators, (b)supervisors (c) regional managers and/or deputy regionalmanagers and (d) other uses.
(a) Enumerator material
Enumerator material consists of relatively few items andincludes the main census form. However, it comprises thebulk in terms of volume, packing, storage and transport tasks.
This material can be packed centrally, transported in bulkto regions around the country, and then transported fromthere to supervisors. Supervisors then arrange for its deliv-ery to, or pick-up by, enumerators. This may also involvesome recounting of the bulk materials into lots suitable forindividual enumerators. Typically, each pack will comprisea standard amount of specific material. For example, thiscould be a number of packs of forms of a size sufficient toenumerate a specific number of households. The number ofpacks allocated to each workload may be specified centrallyor by the supervisor.
At the completion of the enumeration, the material is usu-ally picked up from supervisors, after quality assurance hasbeen completed, and returned to the processing centres.
(b) Supervisor material
This material includes the packing and transport of ad-ministrative and training material used by supervisors andincludes the enumerator record book and training and pro-cedural manuals.
Again, this material can be packed centrally and then trans-ported to each region. It can then be included with the trans-port of enumerator material to supervisors. It should bepacked separately from the enumerator material because itmay include material of a specific nature (e.g., enumeratormaps) or of variable quantity (e.g., enumerators’ handbooks),depending on the composition of the workload.
After enumeration, this material is picked up from super-visors and returned to the processing centres, along withthe enumerator material.
(c) Regional manager and/or deputy regional managermaterial
This material includes the packing of administrative andtraining material used by regional managers and deputy re-gional managers and includes material for supervisor train-ing.
Because of the relatively small number of these staff, thematerial can be packed centrally and then transported di-rectly to regional managers.
After enumeration, the material is picked up from the re-gional managers and the bulk returned to the processingcentres. Some material that is not necessary for the process-ing phase may be returned to a regional or central office ofthe census agency. This material may include key adminis-trative documents such as objection/refusal reports or re-muneration details.
(d) Other material
In addition to the above, other material used in the fieldshould also be included within the scope of the distributionand return activity. For example, this may include specialforms used for certain population groups (such as in remoteareas) and public communications material.
4. Specifications
A significant task in planning field operations is estab-lishing the specifications for the packing and transport ofmaterials. These specifications need to be developed regard-less of whether these activities are carried out by the censusagency itself or contracted out to another government agencyor private company.
Planning for the packing, distribution and return of materi-als should begin, where possible and depending on the par-ticular country, approximately two years prior to the censusdate. A contract should be in place at approximately the sametime as the major printing contracts are established. In somecases, and particularly where these operations are commer-

105
Part 1. Introduction
Title DescriptionIntroduction Includes a description of the census agency and the census. Sets out the role of
the activity and its overall goals. Includes key dates and requirements. Setsout the structure of the specification.
Structure of census Describes hierarchy of field structure, number of management units andenumeration areas. Brief description of the role of each level in the structure.
Overview Brief description of the activity and its main components. Goals of eachcomponent. Describes key functions of the contractor.
Preferences,mandatoryrequirements
Includes a description of any particular preferences and mandatoryrequirements. For example, the use of dedicated vehicles for census material inthe return phase may be a mandatory requirement. Not using subcontractorsmay be a preference.
Privacy Clearly states the census agency's policy on privacy and the requirements inthis activity.
Contract arrangement Describes how the contract will be established and managed.
Payment Describes preferred payment basis and the basis on which quotations are beingsought.
Reporting Basic reporting requirements.
Part 2. Packing
Title DescriptionIntroduction Describes packing activity.
Functions Sets out and describes functions of the contractor:(a) Receipt of materials;(b) Storage and handling;(c) Packing and labeling;(d) Quality assurance;(e) Dispatching.
Timetable Detailed timetable for packing activities.
Requirements Detailed requirements (e.g. security, labeling, storage);
Packing Packing details:(a) type of packs by level of structure;(b) content of each pack type;(c) quantities of each pack type.
Reporting Detailed reporting requirements.
Table III.5. Specifications for distribution and retrun of materials

106
Part 3. Dispatch
Title Description
Introduction Describes dispatch of material to field staff.
Function Sets out and describes functions of the contractor:(a) Receipt of materials from packing centres if they are different;(b) Storage and handling;(c) Preparation of consignments and labeling;(d) Quality assurance;(e) Delivery requirements.
Timetable Detailed timetable.
Requirements Detailed requirements (e.g., security of vehicles and obtaining signatures).
Transport Transport details:(a) Description of drop-off method and requirements;(b) Description of control documentation requirements;(c) Description of consignment details and volume;(d) Method of supply of field staff names and addresses;(e) Description of control documentation requirements;(f) Handling shortfalls and surpluses.
Reporting Detailed reporting requirements.
Part 4. Return
Title DescriptionIntroduction Describes pick-up of material from field staff and return to the processing
centre(s).
Function Sets out and describes functions of the contractor:(a) Pick up of materials from field staff;(b) Security requirements;(c) Storage and handling;(d) Delivery to processing centre;(e) Reconciliation of materials;(f) Delivery requirements.
Timetable Detailed timetable.
Requirements Detailed requirements (e.g., security of vehicles and obtaining signatures).
Transport Transport details:(a) Description of pick-up method and requirements,(b) Description of control documentation requirements,(c) Handling shortfalls and surpluses.
Reporting Detailed reporting requirements.
Table III.5. Specifications for distribution and retrun of materials (continued)

107
cially based, savings can be made if printing and packingcontracts are coordinated. For example, transport costs canbe avoided if the printing and packing centres are co-located.
The specifications used for this activity can be used as thebasis for a contract whether it be commercial or an arrange-ment with another government agency. Even though anothergovernment agency may be used, it is important that a formalagreement along the lines outlined below is still used. Someelements of the agreement may not need to be included, but itis important that both agencies clearly understand, and agreeon, the requirements for this major activity.
In either case the specification may include some or all ofthe following items; however, there may be additional itemsrequired, depending on the circumstances of the countryinvolved.
5. Estimating Quantities
Estimating quantities not only establishes the volume ofmaterials to be packed and transported but also provides akey input into the printing process (i.e., the number of eachitem that needs to be printed). A lack of material duringenumeration can have serious consequences, as there willnot be enough time to print additional quantities. However,a cost-effective census requires that there are no excessiveamounts of material. Estimates should also provide for areasonable level of contingency.
The basis of estimating quantities is to establish thenumber of items each person in the field structure requiresto complete his or her tasks. These items can then bymultiplied by the number of staff in each level of thestructure. This gives the standard pack sizes referred to insection 6 (b) below.
To establish the number of items each person requires isusually based on the amount of work to be done (i.e., dwell-ings to be enumerated), plus a reserve factor. This is basedon the number of items to be used by each enumerator,
supervisor and so forth. For example, to enumerate 100households, the following items might be provided to anenumerator: 110 census questionnaires, 110 informationbrochures, 50 calling cards, 5 objection report forms, 1satchel, 1 clipboard, 2 pencils, 1 pencil sharpener, 1 identi-fication card and other materials such as envelopes.
The above example shows that some spare census formsare provided. This is necessary in case the enumeratorneeds to use an additional form at a dwelling or findsadditional dwellings in the enumeration area. Assumingthat all enumerators will have a workload of 100 house-holds, the quantities in the above list are multiplied by thenumber of enumerators to establish how many forms willbe required in total. However, it is unlikely that allenumerators will have workloads of exactly the same size.Therefore, it is necessary to make some judgement,perhaps based on information from the mapping activity,about what is an average workload size.
During the design of enumeration areas and mappingtasks, an estimate will be made of the number of enumera-tion areas, and the amount of work in each. This informa-tion can be used to calculate how much material will beneeded by each enumerator, supervisor and so on. Thismethod should provide a more accurate forecast of needs.
For simple items (such as calling cards), the cost of print-ing additional quantities may be minimal; thus, estimatescan be rounded up with little impact on the overall cost. Formore complex items (such as the enumerators’ handbook)the cost of printing will be more significant, and care shouldbe taken with final calculations.
As with the printing operation, the use of a spreadsheet(either computer-based or clerical) can assist with estimat-ing quantities. An example of how a spreadsheet might beused to record the basis of estimates and total quantities isgiven below. The first group of factors would be recordedin a separate sheet and used as multipliers in a second sheetcontaining a list of items:
Part 5. Evaluation and pricing
Title DescriptionIntroduction Describes how quotes for the contract will be evaluated.
Evaluation criteria Describes evaluation criteria for each task: packing, distribution and return.
Pricing Sets out in detail how prices are to be provided. Terms of payment andsanctions for non-performance.
Table III.5. Specifications for distribution and retrun of materials (continued)

108
(a) Factors
(a) Number of enumeration areas;
(b) Number of enumerators (if not the same as (a) above);
(c) Number of supervisors;
(d) Number of regional managers (deputy regional man-agers).
The following variables would be recorded for each itemto be provided and multiplied by the relevant factor above:
(b) Items
1. Item;
2. Number per enumeration area;
3. Total required for enumeration areas ((a) x 2);
4. Number per enumerator;
5. Total required for enumerators ((b) x 4);
6. Number per supervisor;
7. Total required for supervisors ((c) x 6);
8. Number per regional manager (deputy regional man-ager);
9. Total required for regional manager (deputy regionalmanager) ((d) x 8);
10. Subtotal required (3 + 5 + 7 + 9);
11. Reserve factor (10 x per cent) where per cent is judgedon an item-by-item basis;
12. Total requirement (10 + 11).
In this model, some items may not be required by all lev-els and would simply be shown as a nil requirement andthus would not add to the total. For example, enumeratorswould not require application forms for supervisor positions.However, regional managers may receive a small reserve ofcensus questionnaires or simply a few as samples for theirown use.
The primary benefit of using a spreadsheet is that assump-tions about supply can be varied and quantities recalculatedquickly. For example, the initial calculation may be for twocopies of the objection report form in each enumeration area,but this may be considered too low and a decision made tosupply a pad of 10 forms to each enumerator. This could beeasily remodelled in a spreadsheet.
6. Packing
The movement of the bulk of the material associated withfield operations is best carried out by way of modular card-board boxes. The shape and size of the boxes should be de-signed around the size of the census questionnaire, takingnote of the occupational health and safety requirements for
handling relatively dense material such as paper. The samecardboard boxes can also be used for transporting adminis-trative and training material.
Within these boxes, the census forms themselves can alsobe packed into bundles of forms (e.g., lots of 50 forms) thatare shrink-wrapped in plastic. This has the advantage ofprotecting the forms and making it easier for supervisors tocount and distribute forms to enumerators.
The boxes should be able to be sealed to prevent tamper-ing with the contents during transport. One method to assistsecurity is to transport two (sometimes three) boxes insideanother larger one. The outer box would be designed forsecurity, storage and transport.
Most of the transport arrangements put in place for fieldoperations may be based on a price per box basis. An outerbox containing two boxes of census materials would be rec-ognized as a single box for counting and charging purposes.However, this would not necessarily be the case if a priceper kilogram basis were used.
It is also desirable to design boxes for use in the fieldoperations that can also be used to store and move the cen-sus questionnaires around the processing centres. The boxes,therefore, should be pre-printed, with spaces for packingstaff to identify the contents for enumeration staff and, sub-sequently, for enumeration staff to identify the contents forprocessing staff. Additional labelling for processing purposescan be included on the box when it is produced.
The content of the boxes will depend largely on how ma-terials are to be supplied to supervisors and from there toenumerators. There are two methods: (a) bulk supply and(b) pre-packing.
(a) Bulk supply
Under this scenario, each supervisor is provided with abulk supply of each of the required items for enumerators.The supervisor would then count out and re-pack the re-quired items for each enumerator from the bulk supply re-ceived. Supervisors may also be supplied with a number ofstandard census boxes (see above) into which to repackmaterial for enumerators.
This method has the advantage of simplicity but also anumber of disadvantages, including the following:
(a) Reliance on supervisors to count and repack material;
(b) Reliance on suitable packing by the original printeror supplier;
(c) Larger number of different shaped and sized boxes(non-standard appearance);
(d) Low likelihood of materials being clearly labelled ascensus material.
A key task for the census management area with thismethod is to ensure the coordinated supply of the differentitems through a transport staging area. Direct supply fromprinters to supervisors should be avoided from both a man-agement and a quality perspective.

109
(b) Pre-packing
This is where material is pre-packed centrally, or in a smallnumber of packing centres. It involves preparing packs ofmaterial suitable for use by enumerators and higher-levelstaff. One method of pre-packing is to make modular packsthat are designed to contain all the materials required toenumerate a given number of households. With this method,the supervisors’ job only requires them to calculate howmany packs each enumerator will need rather than countingand repacking materials for each enumerator. Another ad-vantage of this method is that standard census boxes areused from the outset in a more controlled manner.
The content of the packs is determined in advance by thecensus agency and is based on the concept of uniform con-tent wherever possible. This simplifies the packing processand is therefore likely to add to efficiency and more accu-rate delivery of supplies. Uniform content simply means thateach pack type contains the same number of each item.
There may be several pack types. For example, there maybe packs containing material to enumerate dwellings in ur-ban areas, dwellings in rural areas, or people in special dwell-ings; or a pack may contain material for a supervisor to re-cruit and train enumerators.
The variation in pack types would depend on the basis ofthe enumeration, how feasible standard content packs are inrelation to enumeration area sizes, and size of the country.The main advantages with this method are a standardizedform of supply, less dependence on supervisors to count andrepack, and a standardized appearance for census materials.
7. Census agency management role
The role of the census agency with regard to dispatch andreturn tasks is primarily one of liaison and monitoring. Forthe most part, the contractor will contact regional managersand supervisors directly about the delivery or pick up ofmaterial. The census agency can expect to be involved inliaison between the contractor and field staff in the earlystages of the operation or if there are any particular prob-lems experienced by either field staff or the contractor
The census agency management staff should meet fre-quently with the contractor to discuss the operation and li-aison arrangements. These staff should also visit packingcentres to become familiar with how the operation works.
Part of the planning of the operation will include arrange-ments to enable census agency management staff to moni-tor the delivery and return of materials. In particular, whenmaterial is picked up from supervisors, census agency man-agement staff should maintain a close watch over what istaking place in the field as the transport of completed cen-sus forms is involved.
8. Mail-out/mail-back census
There are a number of key issues to consider in relationto distribution and return tasks when conducting a mail-out/mail-back census. For the mail-out component these includethe following:
(a) A complete and accurate list of addresses for the en-tire country;
(b) The postal service infrastructure throughout the en-tire country;
(c) Cost.
In the majority of countries, comprehensive lists of ad-dresses are not available; this situation has the potential toimpact adversely on underenumeration of a census.
Even in countries where most of the population is cov-ered by an effective mail service and a mail-based opera-tion is adopted as the standard procedure, there may be someregions that are unsuitable for a census mailout/mailbackoperation. Examples include remote rural areas or informalsquatter camps. Non-standard procedures will need to beadopted for such areas.
Because of the lack of comprehensive mailing lists, somecountries have adopted a combination of delivering formsthrough an enumerator and the respondents mailing themback. The issues associated with the delivery of forms arediscussed in the sections above. For the mail-back compo-nent to work efficiently, the postal infrastructure needs tobe able to handle the volume of mail generated by such anoperation within an acceptable time-frame. A formal agree-ment between the statistical agency and the postal organi-zation would need to be in place. Issues to consider withmail-back include the following:
(a) Form size;
(b) Weight;
(c) Cost per unit;
(d) Confidentiality and security of census forms.
Forms can either be mailed back directly to the process-ing centres or to the regional mail-back centres specificallyestablished to initially receive census forms when mailedby respondents.In both cases, forms received will need tobe reconciled with the enumerator’s record book, and pro-cedures will need to be in place to follow up non-responsessoon after census day to ensure that people have not movedand to satisfy processing timetables.
Bar code identifiers on forms and enumerator record bookscan be considered a basic tool for this reconciliation process.
If lower than expected response rates are achieved in themail-back process, there will have to be increased follow-up operations by enumerators. This will have a negativeimpact on both the census budget and the timetable.
E. MONITORING FIELD OPERATIONS
1. Introduction
The key to successful monitoring of field operations is anefficient and relevant management information system.However, collecting management information for this ac-tivity is difficult because of the large numbers of field staffinvolved and the fact that these staff are often widely geo-graphically dispersed. Therefore, it is important to ensurethat the information collected is needed and will be usedconstructively in the management of the operation. The in-

110
formation can be collected and transmitted by a variety ofmethods (e.g., telephone, fax or e-mail). The issues outlinedin this section are applicable to whichever method is used.
The nature of the field operation means that managementinformation may take some time to be acquired and receivedby the intended user. If it is considered that the informationcannot be acquired in a reasonable time-frame so that it canbe used effectively, it should not be collected. Alternatively,the type of information or level of detail should be recon-sidered and reorganized.
A key point is that a small amount of good informationwill be of more use than a large amount of poor or incom-plete information. The information must be able to be usedeffectively, otherwise there is little point in collecting it.
Some countries equip each regional office with computer,printer, telephone and fax services. Service centres are es-tablished with a special census hotline for receiving inquir-ies from the public and the field staff. The central office ofthe census agency receives inquiries, the census key staffdiscuss them and then fax the answer to the intended party.Sometimes, the answer to an inquiry made on an importantpoint is circulated to all field offices.
2. Planning a management information system
Planning a management information system for the fieldoperation should comprise the following steps:
(a) List all potentially useful items of information, forexample, number of applications received for field positions,dates training is to be started and completed and number ofdwellings interviewed or enumerated. Wherever possible,have benchmark data for comparison, for example, the num-ber of positions available compared with the number of ap-plications received;
(b) Consider how and when each item of informationmay be collected;
(c) Consider how each item of information will be usedand by whom. For example, information about applicationshortfalls may be used to start action to attract more appli-cants by different means;
(d) Review the value and usefulness of each item with aview to keeping the list to the minimum of those consideredessential or highly desirable. Items considered low priorityshould only be included if the cost is marginal and there isat least some evaluation use for the information;
(e) Incorporate the final list into relevant work plans.
The type of information to be considered as part of themanagement information system should improve the abil-ity of managers: (a) to ensure that the field operation pro-ceeds according to schedule; (b) to respond to public rela-tions issues; (c) to ensure that field staff are paid correctlyand on time; (d) to manage the budget; and (e) to evaluatethe effectiveness and efficiency of the operation.
The nature of the information that may be collected var-ies. It may include the following:
(a) Date or dates that particular activities are started orcompleted;
(b) Piece rates or amounts, such as number of dwellingsinterviewed or enumerated;
(c) Volume, such as percentage of enumeration completed;
(d) Status, such as incomplete, started or finished;
(e) Type (and number) of calls to the telephone inquiryservice (including number of certain types of calls).
The information may also be required at different levelsin the management hierarchy. For example, the number ofapplicants may be reported at the regional level, while thestatus of completion of a particular activity may be reportedat the enumeration area. It depends to a large degree on whois going to use the information and at what level of detail.
3. How to collect management information
This depends to a large extent on the communicationsinfrastructure available to the census agency and temporaryfield managers and staff. Information can be transmittedbetween the different field management levels and the cen-sus agency as follows:
(a) Electronically (e-mail, fax or telephone);
(b) By the postal service;
(c) With the return of the bulk census material.
The use of each type of transmission will impose its ownrequirements as far as the style of reporting is concerned.For example, e-mail and fax may use a standard form de-signed for that purpose. Telephone transmission may requirethe recipient to use a form designed for ease of receivingverbal information and to maximize telephone operator ef-fectiveness. Returning information by a postal service mayrequire that management books allow single duplicate pagesto be removed.
The relative urgency of some types of information maydictate the method to be used. For example, information re-quired to pay temporary field staff may need to be transmit-ted by post or electronically rather than waiting for the bulkcensus material to be returned to the processing centre.
In some cases, a number of different methods may be usedto send information from the enumerators to the census of-fice. For example, an enumerator may make a verbal reportto his or her supervisor, who then uses the telephone to senda consolidated report to the regional office, where an e-mailreport is made to the central office.
These factors need to be considered within the context ofthe particular country. What will work in some countriesmay not be appropriate in others.
4. Where to start
Like any census activity, it is not possible to plan themanagement information system for field operations as asingle isolated task. Information requirements should beconsidered for each area of the field operation, dependen-cies identified and requirements consolidated into a plan.The consolidation phase should include discussions withother stakeholders of the field operation phase.

111
The information requirements can be expressed initiallyin the form of questions. The actual data requirements canthen be derived from the questions. For example, to answerthe question “Have all field staff been trained?” the datarequirement would be a yes or no status report from fieldmanagers. In turn, this may be recorded in the field man-ager control book as a record of the date training was com-pleted (a date equals a yes status, while no date equals a nostatus).
The question method is useful in “what if” planning ses-sions to start developing ideas. A small group of people fromstakeholder areas can hold discussions about the questionsto which they need answers. Questions are written downthroughout the session and reviewed afterwards. This re-view begins the process of prioritizing and identifying par-ticular data requirements.
5. What to collect
Included in this section is a list of areas in the field opera-tion and types of management information that may be col-lected. It is not an exhaustive list but is a useful startingpoint for planning. More detailed information about par-ticular aspects of the census can be obtained from other sta-tistical agencies, in particular those with similar attributesand infrastructures that have recently taken a census.
(a) Budget
In field operations, a significant proportion of the censusbudget is usually spent on salaries for temporary field staff.Furthermore, a high proportion of this expenditure is in-curred over the brief enumeration period. As a result, thereis usually little that can be done at that time to resolve bud-get difficulties.
Therefore, management information data must be gath-ered early enough to ensure that sufficient funds are avail-able to undertake the work. More senior staff (especiallyregional managers and supervisors) should provide an evalu-ation of the workload in their areas before enumeration com-mences so that potential problems can be identified and re-solved. They are then responsible for ensuring that their staffwork within that budget.
(b) Mapping and household listing
The mapping area provides the basis for most logisticalplanning for the field operation, as well as the crucial detailsof the number of enumeration areas and their estimated size.In some cases, the mapping will be done before the house-hold listing exercise, if this is undertaken. In other cases, itmay be conducted during or after household listing.
If mapping is carried out, taking advantage of the fieldwork done during a household listing exercise, it is likelythat the management information obtained will be reliablefor subsequent aspects of the census. For example, infor-mation about the estimated number of households in eachenumeration area would be aggregated to management
levels and used to check that sufficient materials were be-ing dispatched to the particular area. The actual number offield workloads can be used to check the budget.
Mapping and household listing is usually a large exercisethat takes a considerable amount of time to complete. There-fore, the work should be scheduled and management infor-mation requirements managed in a way that enables pack-ets of information to be added to the management informa-tion system progressively (see chap. II, sect. C).
Specific management information data items from map-ping and household listings may include the following:
(a) Number of enumeration areas;
(b) Number of management areas;
(c) Estimated households in each enumeration area;
(d) Estimates of potential travel requirements;
(e) Intelligence about problem areas.
(c) Logistics
Logistics is another key area for early management infor-mation modelling. Information about the number ofworkloads can be used to determine the amount of materialneeded to complete the enumeration, which in turn can beaggregated to determine print quantities. These estimatesbeing available in the early stages of planning will enablean accurate costing of materials. They will also assist inestablishing realistic schedules for activities such as print-ing and transport. The processing centres can also use theseestimates to prepare for the estimated volume of material,as well as estimates of the number of workloads and recordsto be processed.
Management information based on logistics is basedaround three broad areas:
(a) Material acquisition and preparation;
(b) Delivery of materials in bulk into the field and toenumerators;
(c) Return of materials from the field to the processingcentre.
Material acquisition and preparation specific to manage-ment information may include the following:
(a) Number of materials ordered and received (e.g., num-ber of census forms printed);
(b) Date of receipt of materials;
(c) Amount of material and date prepared (packing, man-agement books and maps);
(d) Amount of material and date dispatched to, and re-ceived at, each management area;
(e) Amount of additional material requested (for evalua-tion purposes);
(f) Number of forms expected to be mailed in (whereapplicable) from the enumerators record book.
112
The method of packing material will determine the unitsof measurement (see section D above).
For the delivery and return tasks, the key managementinformation items will be the dates on which these taskswere completed for specific geographic areas.
(d) Recruitment
Management information about recruitment is aimed atenabling census managers to ensure that there are sufficientapplicants from which to select suitable candidates for allfield positions. A strong field of applicants increases thepossibility of obtaining good quality-field staff.
Specific management information items may include thefollowing:
(a) Number of positions available, by management area(from the mapping system);
(b) Number of applications received, by day (during therecruitment period);
(c) Number of applications initially rated acceptable(where practical).
During the recruitment activity, emphasis should be givento information that enables managers to respond to short-falls of applicants in particular areas.
(e) Training
Well-trained enumerators are essential to the successfulcarrying out of a census. Information about training is re-flected in reports from field supervisors and managers thattraining has been conducted before the staff commence enu-meration work.
Specific management information items may include thedate training was completed and the number of staff trained.
(f) Operation
Information to support, and later evaluate, the field op-eration is mainly obtained from records created by field staffor inquiry service staff. In some cases, the information maybe received in time to respond with action (e.g.,. calls fromhouseholders that forms have not been delivered or that theenumerator has not called). However, most information ob-tained during the operation is used for subsequent evalua-tion purposes.
Much of the information is obtained from control booksand other records (e.g., packing slips) that are eventuallyreturned from the field. The objective is to ensure that in-formation being recorded is useful. Even if the informationcannot be acted on to rectify a problem in the field, it can beused to inform processing centre staff about potential dataquality issues. It can also be evaluated later on to improvethe operation in future censuses.
(g) Public relations and inquiry services
Where a service is provided for respondents to call thecensus office, the management information that can beobtained is of enormous value. Such services will be of
particular value where the collection is undertaken on a self-enumeration basis rather than by interview.
In some cases, such a service enables corrective action tobe taken in the field, while in others, it may alert censusmanagers to a need for additional widespread publicity aboutthe census.
Calls to such a service should be logged and some basicinformation recorded. This may include (a) time of call, (b)location of caller (enumeration or management area) and(c) reason for call.
The reasons for the calls should be monitored to detectemerging problems requiring corrective action.
F. QUALITY ASSURANCE FOR FIELD OPERATIONS
1. Introduction
Quality assurance during field operations tends to iden-tify problem enumerators within the enumeration workforcerather than systematic or process errors. This is a conse-quence of the brief duration of the enumeration activity andthe limited scope for improving this process once it has com-menced.
The strategies outlined in the sections below will enablethese enumerators to be identified. However, these strate-gies will also allow for evaluation to occur after enumera-tion so that improvements can be made to future censuses.These quality assurance strategies can also be implementedin any tests leading up to the census so that identified prob-lems can be addressed before the census.
Section 3 below assumes that the census is interviewerbased. Countries that use a self-enumeration, drop-off andcollect approach should in particular adapt section 3 tofocus on the respondent contact elements and omit partsspecifically dealing with interviewing. Sections 4 throughto 6 are relevant for both interviewer and self-enumera-tion methods.
The scope for quality assurance in field operations is morerestricted where the mail service is used for the deliveryand return of forms.
The present section also concentrates on the quality as-surance conducted by supervisors on the work of the enu-merators. Ideally, managers may also wish to conduct spotchecks on the work of the supervisors. However, it is recog-nized that in reality, owing to other work pressures, this mayprove difficult for managers to organize.
2. Role of supervisors
Supervisors play a critical role in assessing and review-ing the performance of enumerators and ultimately influ-encing the quality of the census. The supervisor is also animportant link in terms of evaluating the procedures, docu-mentation and training for census tests.

113
By adopting quality assurance, and collecting andanalysing quantitative information, an important aspect ofthe overall quality of the census can be substantiated. Inparticular problem cases, these checks may enable correc-tive action to be taken before census forms leave the field.It also provides census management with information aboutthe quality of the enumeration.
These quality assurance checks during the main censusenumeration provide valuable information after the census.The information can be used to inform the processing areaabout potential problems as well as contribute to the evalu-ation of census enumeration.
Supervisors need to be trained in the procedures requiredfor conducting quality assurance on enumerators’ work andhave a thorough knowledge of the enumeration procedures.
It is acknowledged that supervisors have an extensive rolein terms of supervision; however, the material contained inthe present section concentrates on their role in qualityassurance.
Details on quality assurance processes will need to beincluded in the supervisors’ guide or handbook. Interviewerswill also need to be advised that quality assurance procedureswill be adopted. This has the added benefit of reinforcing tointerviewers the need to follow all procedures andthat theirsupervisor will be assisting them by checking their work.
During training, supervisors should emphasize that, aswell as being a means of quality assurance, these checks arealso designed to help enumerators quickly become profi-
cient in their work. Where significant problems are identi-fied, the supervisor must assess whether the interviewer re-quires further training to overcome the problems.
The role of a supervisor is (a) to provide retraining ofenumerators who require it following their initial trainingcourse; (b) to enhance the enumerators performancethrough practical advice; (c) to provide support and en-couragement; (d) to provide contact, open communicationand feedback; (e) to perform quality assurance on enumera-tors’ work; and (f) to ensure recommended improvementsare implemented.
In practical terms, it is the responsibility of a supervisor(a) to ascertain that the enumerator has checked the mapsand household list before commencing work; (b) to observethe introductions to a sample of householders; (c) to ob-serve the completion of a sample of questionnaires; (d) toobserve a sample of the editing work of the enumerator; (e)to do checks on a sample of dwellings to ensure that enu-merators have actually visited the households and completedthe forms; and (f) to report to managers on the progress ofquality assurance checks and emerging issues relating tothe quality of enumeration.
Supervisors need to ensure that they establish a positiverelationship with the enumerators. Supervisors need to es-tablish a friendly atmosphere by demonstrating they areapproachable and empathetic and attempt to put the enu-merator at ease. Discussions should be commenced and con-ducted in a non-threatening manner. Supervisors should alsogive enumerators the opportunity to ask questions or makecomments.
Ten percent error checking
During the Kyrgyzstan census of 1999, a 10 per centsample control check-up was carried out after the censusenumeration to ensure complete coverage
Supervisors together with enumerators in accordancewith their schedule, made control visits. In addition toevery tenth household, the checking covered thosehousing units about which there were questions duringthe control check-up of census forms or where finalfigures were different from preliminary data.
———— Source: National Statistical Committee of Kyrgyzstan.

114
Performing quality assurance on the work of enumera-tors can be done in four ways:
(a) Observing interviews during enumeration;(b) Checking households already enumerated;(c) Checking coverage of the enumeration area;(d) Checking completed census forms.
Each of these is discussed in detail in the following sec-tions.
3. Observing interviews
Observing interviewers in the field is usually conductedearly in the enumeration period, and less frequently later inthe enumeration period. This pattern of observation is aimedat ascertaining whether interviewers have followed all ofthe instructions outlined in their handbook and at training.In part, it also acts as a form of on-the-job training.
Observing interviews will identify whether interviewers(a) are following instructions on how to complete the forms;(b) understand the concepts and basic definitions; (c) areasking the right questions in the right manner; (d) are ableto establish good rapport with the respondents; and (e) arerecording answers accurately.
As supervisors observe interviewers, they should com-plete an observed interview report. A sample observed in-terview report is shown below.
(a) Preparation
Before visiting any households, interviewers need to beadvised that, after introducing themselves to the householder,they should introduce the supervisor as a person who iscarrying out quality assurance. Generally speaking, thesupervisors aim is to be “seen and not heard”. However,particularly in the actual census enumeration, they may needto intervene to rectify a situation that would otherwiseresult in a number of incorrect questions being asked or,perhaps, questions being missed.
Before conducting any supervised interviews, the super-visor will need to do the following:
(a) Complete training of all interviewers;
(b) Make arrangements with each interviewer for amutually agreeable meeting time and place;
(c) Ensure that there is sufficient time between appoint-ments, especially in rural areas where travel time could besignificant;
(d) Ensure that they have a full kit of required forms,including census forms, and observed interview reports;
(e) Ensure that they have a set of interviewers’ andsupervisors’ handbooks and guides.
Supervisors need to ensure that interviewers are manag-ing their work correctly. Indicators include the interviewer(a) meeting the supervisor at the appointed time; (b) havingthe correct equipment and forms; (c) having the material
organized and prepared to commence interviewing; and (d)managing completed forms and not mixing them up.
(b) Interviewing technique
A good introduction at the door will help the interviewerobtain a positive reaction and will most likely assist with anaccurate response to all relevant questions. When conductinginterviews they need to (a) make sure that they identify andinterview the head of the household (unless each person is tobe interviewed); (b) apply the customs and etiquette expectedin the country or region concerned; (c) explain the censusand how long the interview will take; (d) tactfully keep therespondent to the point; (e) pace the interview to allow therespondent time for thought without wasting time; (f) assessthe situation in the household from the door; (g) be flexibleenough to come back at a more suitable time;(h) maintain afriendly yet positive and professional manner; and (i) be pre-pared, informed and keep to the point.
The supervisor would assess the interviewer as “requiringimprovement” if any of the above information was omitted.It is also important that interviewers leave the household in apositive and friendly manner because they may have to re-turn to collect additional information at a later time.
(c) Scope and coverage
The supervisor should check that the interviewer asks thecorrect questions in order to establish who is to be includedor excluded from the scope of the census. While most peoplewill be included in the census, the coverage rules for thosewho are to be included must be carefully applied. For ex-ample, if the census is based on place of usual residence,supervisors need to ascertain whether interviewers have onlyincluded usual residents. Similarly, if particular populationgroups are excluded from the census (e.g., overseas visi-tors), the supervisor must ensure that persons from thesegroups are not included.
(d) Completing the census form
There are three priorities for supervisors in relation toquestion wording:
(a) Identification and recording of any errors;
(b) Recording the initial asking of any questions;
(c) Recording of the response to any questions.
In an interviewer-based census, the basic principle is thateveryone is asked the same question and in the same man-ner. This approach is necessary if there is to be nationwideconsistency and accurate data. Interviewers must read thequestions as worded and not rely on their memories. Super-visors are required to stress the importance of this approachand to specifically provide assessments on this matter aspart of their observed interview report.
Supervisors should follow each interview with their owncopy of a census form, and note when the interviewer has(a) strayed from the actual question wording; (b) missed

115
OBSERVED INTERVIEW REPORT
Supervisor:
Interviewer:
District/region name:
Enumeration area reference number:
Household number:
Type of household:
Administrative matters
DoneCorrectly
Not Done Comments
1. Enumeration area listing checked
2. Organized their documents
3. Transferred reference numbers
4. Selected the correct house
5. Established rapport with household
6. Coverage established for usual residents
7. Coverage established for visitors
8. Established head of household

116
Completion of form (for each household)
Person numbers
Questions/probing 1 2 3 4 5 6 7 8 Total
Exactly as worded
Reworded, meaning thesame
Reworded, meaningdifferent
Not asked, response inferred
Correct probing/clarifying
Prompt needed but not used
Incorrect/directiveprompting
Used prompt cards correctly
Questions where interviewer had difficulties
Specify:
Comments on introductions, explanations given and closing remarks
Very good Good Needs improving
Specify:

117
questions or asked questions that do not apply; (c) incor-rectly directed answers through prompting rather than prob-ing for a response; and/or (d) recorded insufficient infor-mation.
The number of occurrences for each person should be re-corded on the observed interview report.
The following scale could be used for scoring each ques-tion:
(a) Exactly as worded. The interviewer asks the ques-tion exactly as written, and possibly only adds words suchas “and” or “well”;
(b) Reworded, meaning the same. The interviewer addswords, although the changes are only minimal, but does notchange the actual meaning. Supervisors should record theseadditional words, as they will be valuable in test evaluationprocedures;
(c) reworded, meaning different. This category shouldbe used if words are added, or key words missed, to theextent that the actual meaning has changed. For example, ifthe words “last 12 months” were omitted from the relevantquestion, the whole meaning of the question would bechanged and it is left to the respondent to interpret what ismeant by “usual activity”. Once again, supervisors shouldrecord on the observed interview report the words that areactually used by the interviewer;
(d) Not asked, response inferred. This category shouldbe used if interviewers decide they do not need to ask thequestion because they think they know the response, or,perhaps, they forgot to ask the question. Supervisors shouldalso mark the questions where this has occurred and recordit on the observed interview report.
Not all respondents will understand the questions put tothem by the interviewers. It is important that interviewersuse correct probing techniques for clarification. It is thesupervisor’s role to assess whether interviewers are usingcorrect probing techniques or whether they are promptingthe respondent with their own ides of what the responseshould be. This may lead to potentially inaccurate data.
If there is any confusion on the part of respondents, inter-viewers should seek clarification by, perhaps, repeating thequestion or by neutrally probing.
A probe or explanation is inappropriate if it either changesor limits the frame of reference of the question, limits theresponse possibilities or suggests possible answers. Thisform of questioning is being directive and prompts the re-spondent to react to or give a specific answer. This approachwill lead to inaccurate data being collected and is thereforeinappropriate. For evaluation purposes, supervisors shouldrecord where this happens on the form as well as on theobserved interview report.
(e) Completing the observed interview report
In completing the last part of the observed interview report,the supervisor should provide details of questions where inter-viewers had difficulties; comments on introductions, explana-tions given and closing remarks; and overall performance.
These summary comments should be provided based onthe earlier comments and the tallies of recordings from theprevious pages. Care should be taken that comments are fac-tual and positive. If, owing to an uncooperative respondent,it was difficult for the interviewer to complete the census form,this needs to be acknowledged on the observed interview re-port. Supervisors need to be concise and relevant; encourag-ing and constructive in their feedback, and not demoralizing;and precise and explicit where there are errors.
After the supervised interview is completed and they haveleft the household, the supervisor should discuss the evalu-ation with the interviewer, emphasizing the positive areasand pointing out any problems. The problems need to bepointed out in a positive manner. Any problems should beprioritized and their significance weighed in the context ofthe situation. Negative comments need to include sugges-tions for improvement.
Interviewers must be given the opportunity to ask questions,provide comments and indicate whether they agree or disagree.
In the case of extremely poor performance, supervisorsmay need to determine whether an interviewer should con-tinue his or her employment. Before such a decision is made,extra supervized interviews should be carried out and supple-mentary training provided. However, in extreme circum-stances, where interviewers have blatantly ignored instruc-tions, they may need to be dismissed summarily.
(f) Observing interviews during tests
The procedures for observing interviews may be differ-ent for tests and the main census enumeration. During tests,the supervisor would observe approximately four interviewsbefore suggesting any changes. During census enumeration,the supervisor would suggest improvements after the initialinterview was observed. This is because during tests, evalu-ation of training and procedures is important and may re-quire a few observations to confirm the nature of the prob-lem, whereas during census enumeration, the quality of re-sponses is so important that additional incorrect informa-tion cannot be permitted.
In tests, analysis of the observed interview report will needto be carefully undertaken, and attention paid to the typesand frequency of errors. The evaluation needs to considerwhether the mistakes are being made by only one inter-viewer, all the interviewers trained by the same supervisor,or all interviewers.
The answers to this evaluation will provide a good indi-cation of where improvements need to be made. These couldbe in (a) the quality of the interviewers; (b) the interviewerrecruitment programme; (c) the master trainers or the train-ing; or (d) the instructions.
This analysis can also be of assistance to the evaluationof other aspects of tests (e.g., analysis of non-response tofertility questions by age groups and marital status). Thiscould provide some indication of whether specific questionsare being missed in certain circumstances and what thosecircumstances are. This would enable the interviewers’ in-structions and perhaps even the trainers’ instructions to bereviewed before the main census.

118
An analysis of all errors on all completed test forms, dis-sected by interviewer training groups, will provide someindications of whether there are problems across the inter-viewing panel as a whole. This may indicate a possible prob-lem with either the documentation or the instruction guides,or whether individual interviewers or individual trainers areat fault. This disciplined approach to analysing activitiesand occurrences will enable the census agency to substanti-ate its evaluation procedures.
4. Checking households already enumerated
A second method of quality assurance is for the supervi-sor to return and check a sample of households already enu-merated to ensure that the enumerator did indeed make con-tact. Checks can also be made on whether enumerators com-pleted the form in the right manner, and without leavingquestions unanswered. This process is often called a pro-bity check and the results are recorded in a probity report.
The probity report will identify whether enumerators areactually calling at households, and whether rapport has beenestablished with the respondent. The latter point is an indi-cation of whether enumerators are managing the interper-sonal aspects of their work.
Probity checking is an integral and necessary componentof the quality assurance strategy. It is a positive aspect de-signed to assist the development and monitoring of enu-meration. Probity checks are also a public relations exer-cise with the community. Probity checks will: (a) check andconfirm whether an enumerator actually called at a dwell-ing; (b) monitor respondent reaction to the enumerator’svisit; and (c) establish whether the enumerator providedenough explanation.
In essence, probity checking is designed to give an indi-cation that enumerators are doing their job. It is importantthat this is done early enough in the enumeration period toimprove poor performance, and not wait until the work isnearly completed. If these checks are done too late, correc-tive action will be extremely time-consuming and expen-sive. It is recommended that three or four visits be made todwellings that the interviewer has recorded as having fin-ished. While the selections would normally be at random,there may be cases where the supervisor determines thatspecific dwellings require close inspection.
When checking households that have already been enu-merated, the approach can be fairly simple. In essence, su-pervisors need to do the following:
(a) Introduce themselves and the census;
(b) Explain that the purpose of the visit is to conductquality assurance;
(c) Establish who spoke to the enumerator and, wherepossible, speak to that person;
(d) Ask “Was the enumeration (e.g., interview) completedto your satisfaction?”;
(e) Ask “Do you have any questions about the census?”;
(f) Thank the respondents for their cooperation.
In this probity process, supervisors record comments bythe householder regarding (a) whether the enumerator madecontact; (b) whether the enumerator established rapport; (c)whether the interviewer completed all the questions (in aninterviewer method); and (d) whether there were any prob-lems.
If there are a number of problems associated with the vis-its made to date, the supervisor will need to ensure that in-terviewers know exactly where they need to improve. De-pending on the significance of the problems identified, su-pervisors may need to determine whether to do additionalprobity checks before and/or after they have provided feed-back to the interviewer. If significant problems continue,supervisors will need to discuss the matter with their re-gional manager or deputy regional manager.
5. Checking coverage of the enumeration area
The supervisor should assess that enumerators have cov-ered all of the households in their allocated enumerationarea and no others from adjoining areas. This can be doneby reconciling the forms, or the entries in the enumeratorsrecord book, with the map and household list.
The map and household list can also be checked for anyadditions or deletions by (a) asking enumerators whetherthey have found any new or missed dwellings; (b) checkingthe changes they have made; (c) using local knowledge toascertain any additional changes; (d) doing spot checks ofthe enumeration area.
In some countries, enumerators are required to place avisual sign on the outside of households they have enumer-ated. This may be done by a chalk mark or by sticking anadhesive label on an obvious space. In these cases, the su-pervisor can quickly ascertain whether all households havebeen enumerated.
6. Checking completed census forms
This section provides the most significant level of qualityassurance of data where a self-enumeration method is used.
The supervisor should scrutinize all census forms beforethe material is returned to the processing centre. This scru-tiny is essential to ensure that enumerators have completedtheir work as required and that completed workloads are ofsufficient quality for the processing phase. The nature ofthis scrutiny should include checking that:
(a) All fields to be completed by the enumerator havebeen completed correctly;
(b) All census forms are accounted for;
(c) Census forms have been fully completed;
(d) Summary information has been completed correctly.
This scrutiny should be carried out as soon as possibleafter enumerators have finished a portion of their workload.It does not have to be left until the end of the enumerationperiod. They can be conducted on a daily basis for workloads

119
completed that day. Checks made at the start of the enu-meration period will detect problems early and allow timelyfeedback to the enumerators.
G. TECHNOLOGY ISSUES FOR FIELD OPERATIONS
1. Introduction
The use of sophisticated technology for field operationsin a census has traditionally been very limited owing to (a)the disperse nature of the operation over the entirety of acountry; (b) cost; (c) lack of suitable infrastructure; and (d)the majority of field staff being temporary employees whoonly work for a short period, usually from their homes.
Telephones and facsimiles have represented the main useof technology in the field and will continue to do so for theforeseeable future in some countries. However, personal com-puters and the Internet are increasingly becoming viable toolsin the management and operation of field activities.
The implementation of technology for field operations hastwo objectives. These are (a) to improve the efficiency ofenumeration through effective communication between cen-sus management and field staff; and (b) to improve accu-racy and quality of administrative and operational informa-tion recorded in the course of field operations.
Field operations have two distinct periods. The first pe-riod starts with the recruitment of temporary field staff andends just before the enumeration activity begins. This pe-riod is characterized by times of intense activity, such asrecruitment or training, with reasonably quiet times in be-tween. During this period, accuracy and quality of adminis-trative information is important.
The second period is the enumeration itself. During thisperiod, speed and efficiency of communication is impor-tant in order to respond quickly to issues that arise in thefield.
Planning the field operations should aim to maximize theuse of available technology but minimize reliance on un-proved or unreliable technology. The use of technologyshould also be consistent across the country.
For example, the use of the Internet may be attractive.However, if it is only reliable in a small part of the country, itmay not be cost-effective or efficient to have two systems inplace; one based on the use of the Internet to communicatewith some staff and another based on other technology tocommunicate with the remaining staff. Where new tech-nology such as the Internet is to be used, it must be subject torigorous testing in the field before being implemented.
Another important consideration is the type of informationtransmitted and by what method. Care should be taken thatany confidential information is transmitted through securemethods. For example, facsimiles containing confidential datamisdirected to a wrong number could prove embarrassing forthe census agency. This could also generate bad publicity at acrucial time during enumeration.
2. Types of technology
There are four main types of technology that can be ap-plied to field operations: (a) telephone; (b) facsimile; (c)computers; and (d) the Internet.
(a) Telephone
While the use of telephones is commonplace in most coun-tries, there are some countries, or areas within countries, wherewidespread access to telephones is limited. The situation inany given country will need to be taken into account whenconsidering the use of telephones in field operations.
In many cases, using telephones to maintain regular com-munication between the various levels in the field structurewill be the most practical and cost-effective method of moni-toring and reporting. Accordingly, planning for the census enu-meration should specifically include the use of telephone com-munication. This can be documented in procedural manuals,which can provide guidelines on the frequency of calls. Qual-ity assurance documentation containing check lists of items tobe covered during telephone contact can also be included.
Telephone answering machines or voice mail services canalso be considered. This is particularly useful during theenumeration activity, when the majority of staff will be awayfrom a telephone for a large part of the time.
(b) Facsimile (Fax)
The use of facsimile is also widespread in many coun-tries. It is relatively inexpensive and flexible in that it canbe used to transmit a variety of reports or even copies ofmaps for updating. One advantage of using facsimile is thatit is a written record. This is particularly useful for progressreporting or providing administrative data to different man-agement levels. Standard documentation and control formscan be designed with facsimile transmission in mind. Forexample, a simple control form can be used to record thepayment details for a group of collectors and sent to thecensus agency for input to the payment system.
(c) Computers
In considering the use of computers, the first issue to beaddressed is how their use will assist the management ofthe field operations and the quality of the census. Comput-ers provide the potential to greatly enhance the range ofmanagement information collected (see section E above).This information is easily accessible and can be acted uponquickly. However, information on computers needs to becarefully managed so that the loss of information throughhardware faults does not have an adverse impact on fieldoperations at crucial times. It should be understood that theuse of computers in the field operation is primarily aboutthe management and administration of the field system. Itis not about collecting statistical information on computers.
The census agency may want to implement a computer-based system for use in field operations. In this case, andparticularly where temporary staff will be using computers

120
in their homes, it is a major technological undertaking andshould be approached carefully. While the benefits of usingcomputers in managing and administering field operationscan be significant, the costs and potential problems can beequally significant. A clear benefit to the statistical agencyneeds to be established before implementing a computer-based system.
In other cases, it may be left up to individual field staffwhether they want to use their own computers for managingtheir work. In these cases, it should be emphasized to thesestaff that any systems they use must be compatible with theclerical procedures implemented by the census agency. Forexample, it would be undesirable if reports were compiled ina variety of different formats rather than the one standardreport. This can cause confusion, and extra work, for staffresponsible for interpreting and collating these reports.
If it is considered that a computer-based system is desir-able and feasible, a project team should be established asearly as possible. This team would be responsible for plan-ning, designing, testing and implementing the system. It isunlikely that the use of computers at the supervisor levelwould be feasible on cost grounds. Therefore, such a sys-tem should be aimed at the regional manger and/or deputy
Issue Description
Skills Are the potential field staff likely to be computer literate?
Infrastructure Can the core infrastructure of the country support widespread computersystems?
Hardware Will computers, monitors, printers and modems be provided and whowill be using them?
Telephone system Does the telephone system in the country provide a reliable serviceacross the country for computer based transfer of data?
Telephone lines Will the statistical agency provide an additional telephone lineexclusively for census use or subsidize the use of the managers ownprivate line?
Software What software will be used? How will the software be designed? Willa special purpose application be written? Will standard packages beused with the census agency providing templates (such as in MicrosoftWord) or blank spreadsheets set up for use in the field?
Training How will staff be trained?
Data transfer How will data be transferred between the census agency and field staffand vice versa? How will different versions and updates of the samedata be managed?
Security Is the data confidential, and if so, how will the data be secured?
Testing How will the system be tested to assure its viability?
Transport andreturn
How will the technology be delivered and returned?
Asset How can the technology be used after the census? Can the hardware beused in the processing phase?
regional manager levels. Key issues that will need to beaddressed are included in table III.6.
(d) The Internet
As a starting point, the level of use of the Internet in thecommunity in general should be assessed to determinewhetheris a possibility of providing Internet-based optionsin the field. Only where there is significant use of the Internetshould any effort be made to put it into use for field opera-tion purposes.
One service that is usually a key component of Internetservices is e-mail. This may be particularly useful for com-municating with staff. In many cases, it is likely that fieldstaffs who have access to e-mail will use it to communicate.If it is known that all field staff in a particular level in thehierarchy have access to e-mail, it may be reasonable toinclude the use of e-mail in the design of field operations.Again, there are cost issues that need to be taken into ac-count, but it may prove a more cost-effective means of trans-ferring information than the telephone or fax. Another issuethat needs to be considered is security of information trans-ferred through the Internet.
Table III.6. Issues for implementing computer systems in field operations

121
A. PROCESSING STRATEGIES
1. Introduction
The strategic directions for the processing phase need tobe established early in the census cycle. The single mostimportant decision regarding the processing phase is decid-ing on the processing system to be used and the technolo-gies that will be adopted.
This decision needs to be made early enough to allowsufficient time for testing and implementation of the pro-cessing system.
2. Processing system
Of all the phases in the census cycle the processing phaseoffers the greatest opportunity for the use of sophisticatedtechnology. Rapidly emerging technologies such as imag-ing and intelligent character recognition offer great poten-tial and associated benefits for census processing strategies.Issues associated with the use of particular technologies arediscussed in section F of below.
There are many issues that need to be addressed beforeany of the technologies discussed in section F are imple-mented. The main aim of implementing any particular tech-nology into the processing phase should be to assist in theeffective and efficient processing of census forms. It shouldnot be about implementing technology for technology’s sake.
The following key management issues need to be addressed:
(a) Strategic directions for the census programme;
(b) Technology infrastructure currently established withinthe census agency;
(c) Level of technical support available in the country;
(d) Level of information technology expertise in the cen-sus agency;
(e) Technologies used in previous censuses;
(f) Establishing the viability of the technology;
(g) Outsourcing of processing activities;
(h) Cost-benefit.
Each of these issues is discussed in detail below.
(a) Strategic directions for the census program
The processing strategies that are adopted need to be con-sidered with regard to the overall strategic directions thathave been set for the census programme. These are oftenrelated to timeliness and cost; for example, the release ofdata nine months after census day or a reduction in costs of
5 per cent per capita of population, when compared to theprevious census, would not be timely or cost-effective. Thetime and costs associated with the processing phase willhave a large influence on achieving overall census timeli-ness and cost-effectiveness.
Consideration may also be given to the corporate strate-gic directions of the statistical agency. This is because theadoption of new technologies may have longer-term ben-efits for the statistical agency, such as (a) acquiring hard-ware and software that can be used after the census and (b)staff acquiring new skills that can be utilized in the ongoingwork programme of the agency.
(b) Technology infrastructure currently established
The establishment of sophisticated technology infrastruc-ture within a census agency is a significant undertaking (seesect. F below). The lead times necessary to test, install andconfigure new technology should not be underestimated.The time required will depend on the current levels of in-frastructure established within the census agency.
(c) Level of technical support available
If hardware and/or software is sourced from commercialvendors, the engineering and software support provided bythese vendors is both necessary and critical. Before imple-menting any new technology, it is necessary to establish thelevel of support that is available for that particular technol-ogy within the country.
This can be particularly important if the technology adoptedis of a specialized nature. Owing to costs, some vendors maybe reluctant to provide an extensive store of spare parts in thecountry and instead rely on sourcing them from outside thecountry if they are necessary. They may also wish to providesoftware support through international help desks. However,census processing is subject to tight deadlines. Delays causedby the unavailability of spare parts can affect not only theparticular process where these spare parts are required butalso the work flow to other processes. Similarly, not beingable to obtain timely technical advice for software problemsowing to different time zones can also lead to delays. Thesedelays may not only adversely affect deadlines but can alsoincur significant costs in lost production.
To minimize the effect of down time on census process-ing activities some agencies have insisted that vendors pro-vide support on-site at the processing centre for critical ac-tivities (e.g., data capture). This support may be in the formof an engineer on-site to maintain and service the equip-ment. Other support can include the provision of “hotspares”, which are placed on-site at the processing centre.These are complete units that are on standby and can be
IV. DATA PROCESSING

122
brought on-line quickly to replace units that fail. Other sparekits of parts should be ordered and placed on-site at the pro-cessing centre. These spare kits are essential, especially ifthe equipment has been sourced internationally rather thanlocally.
(d) Level of information technology expertise present inthe census agency
Another factor to consider is the level of information tech-nology expertise currently available within the censusagency. Additional training programmes may have to beconsidered to provide agency staff with the necessary knowl-edge to support processing activities. These trainingprogrammes should be developed as early as possible toenable staff to become proficient well before processingcommences. In some cases, it may be necessary to seek as-sistance from other countries and/or to send key personnelto other countries for training.
(e) Technologies used in previous censuses
In many countries, there are 10 years between censuses.Recent rapid advances in technology may mean that the tech-nology used in a previous census has been superseded. How-ever, this does not mean that this technology should neces-sarily be abandoned.
Significant resources may have been spent on establish-ing these technologies and census agencies may wish tocapitalize on that investment by reusing significant portionsof the system. It may be decided that census agency resourcesare better utilized in other areas of the census programme(e.g., establishing dissemination products). Reusing exist-ing technologies will be of more significance to countriesthat undertake censuses every five years. If particular sys-tems are reused, they will still need to be rigorously retestedbefore they are implemented into processing operations.
There will also be cases where the adoption of new tech-nology will not be cost-effective. For example, in countrieswhere labour costs are low, the adoption of new technologysuch as imaging may prove to be more costly when com-pared to traditional key-entry systems.
(f) Establishing the viability of the technology
During census planning, significant lead times should beallocated for the purpose of investigating and testing theviability of different technologies.
A recommended approach, undertaken by many countries,is the testing and implementing of new technologies in othersmaller statistical processing operations before the census.This has allowed these agencies to become familiar with thetechnology and to solve operational problems before the tech-nology is implemented in the census. Given the importanceof the census and its infrequency, it is important that agencieshave a thorough understanding of the limitations of any newtechnology before implementing it in the census.
Regardless of whether an agency has experience with aparticular technology it is recommended that a rigorous test-ing programme be conducted before the census. This is be-cause technologies that are effective in one environment maynot necessarily be effective in the different environment of acensus. The testing programme can consist of the following:
(a) Small-scale and specific-purpose tests that targetparticular components of the overall processing system (e.g.,data capture, coding or editing). These tests may also targetparticular problem areas from the previous census;
(b) Larger scale tests that not only target individual com-ponents of the processing system but also test the integra-tion of all of the component parts of the system.
The smaller-scale tests can use either contrived test dataor data from any of the pilot tests conducted for the census.These tests can be designed to test specific functionalityand performance of particular components of the proposedprocessing system and should be undertaken first.
After the smaller-scale tests establish the viability of par-ticular components, larger-scale tests should be conducted.The main aim of the larger-scale tests should be to test theintegration of all components of the system. During theseintegration tests, it may be necessary to make changes toparticular component parts of the system. In these cases,the complete system should be retested using the same datato measure the impact the changes have had.
The testing programme should also schedule a final pro-cessing test that imitates census conditions as closely aspossible. This should be regarded as a “dress rehearsal” ofcensus processing and should be conducted before censusprocessing commences. While it is impossible to replicatethe exact conditions of a census it is important that volumetesting that simulates the load and conditions of census pro-cessing is also undertaken.
(g) Outsourcing
It is usually more efficient and cost-effective for censusagencies to conduct the majority of processing activities.However, outsourcing may be considered for all or part ofthe processing activities, especially those activities that mayrequire (a) specialist expertise that is not available withinthe census agency, and (b) the provision of specialized equip-ment that is only needed for the census and has no furtheruse in the census agency.
Outsourcing may be particularly relevant for specializedactivities, such as data capture, that use sophisticated tech-nology (e.g., imaging and intelligent character recognition).This allows the managers of the processing centres to con-centrate on the other core activities of processing. However,in these cases, managers will need to ensure that the activi-ties that have been outsourced deliver the data quality speci-fied. Managers will not need to be concerned with the finerdetails of the technology (i.e., the “how”) but rather only theresults (i.e., the output). However, they will need a broad levelof understanding of the technology in order to both specifythe contract for outsourcing and manage that contract.

123
Special attention will need to be paid to managing thecontract owing to the loss of control that will result fromoutsourcing. This loss of control can have serious implica-tions regarding the quality of data produced. Therefore, agen-cies should exercise extreme caution when outsourcing criti-cal functions associated with processing. Some agencieshave successfully outsourced contracts for census process-ing, but there are many more examples of failures. Detailson managing outsourcing contracts are contained in chapter1, section G.
(h) Cost-benefit
Apart from establishing the viability of new technologies,investigations will also need to include a rigorous cost-ben-efit analysis. In the early stages of planning, it is likely thatseveral strategies and solutions will be considered. Eachshould be compared using the same assumptions, which mayinclude number of units to be processed, staff costs and soon. The cost-benefit analysis should include the following:
(a) Capital cost of hardware, including spare parts;
(b) Software licence and development costs;
(c) Vendor support costs;
(d) Training costs;
(e) Salary costs for number of processors needed. Thesemay vary for each strategy, depending on the amount ofautomation involved;
(f) Benefits, which may include:
(i) Time needed to process the forms,
(ii) Quality of the data produced;
(g) Risks.
The majority of the inputs mentioned above are straight-forward and do not need further discussion. However, be-cause of the critical nature of census processing, it is worth-while to expand on the identification of risks and managingthese risks. It is important that all of the risks associatedwith particular technologies are identified early and man-aged appropriately before, during and after implementation.The processes involved with identifying, analysing and re-sponding to specific risks include the following:
(a) Identifying the risk;
(b) Quantifying the probability of each specific risk;
(c) Quantifying the impact of the consequences of each risk;
(d) Identifying risk mitigation strategies of each risk;
(e) Costing the risk mitigation strategies of each risk;
(f) Quantifying the probability of each risk after the riskmitigation strategy is in place;
(g) Quantifying the impact of the consequences of eachrisk after the risk mitigation strategy is in place.
B. LOCATION OF PROCESSING CENTRES
1. Introduction
It is unlikely that the staff needed to process the censuswill fit into the census agency’s present accommodation. Inmany countries, the number of staff needed to process thecensus will be larger than the total number of staff in thecensus agency. Therefore, premises of a sufficient size needto be found. Issues that need to be considered are (a) thenumber of locations (centralized versus decentralized) and(b) suitability of premises.
2. Number of locations
Issues to be considered when deciding on the locationand number of processing centres include the following:
(a) Availability of skilled workforce;
(b) Availability of support services;
(c) Coordination of processing activities;
(d) Quality;
(e) Geographic location for delivery of forms;
(f) Dispersing infrastructure and skills throughout thecountry;
(g) Costs.
Multiple processing centres may be configured as respon-sible for the complete processing of data for the surroundingregions, and particular processes (e.g., data capture), with otherprocesses (e.g., coding) conducted at different centres.
(a) Skilled workforce
Processing centres will need to be located in areas wherethere are a large number of potential workers who have therequired skills and are available for processing. This willusually mean that the centres will be located in large urbanareas. The processing centre should be located at a site withinthese urban areas that allows staff easy access to public trans-portation facilities.
(b) Support services
The activities at the processing centre rely on many sup-port services, which may be provided by staff from the cen-sus agency, the statistical agency or other external provid-ers. These may include specialist subject matter support (e.g.,classification experts from the statistical agency), informa-tion technology support and other administrative supportservices. All of these support services should be availablein the locations selected. The number of processing centresmay impact on the level of support that is available fromthese support groups. It should be noted that, during censusprocessing, some of the support staff from the statisticalagency will also have commitments to the ongoing workprogramme of that agency.

124
(c) Coordination of processing activities
Coordination of overall national processing will be neededwith multiple locations. The appointment of a national op-erations manager will assist in these coordination activities.
Special attention will be needed to ensure that each cen-tre is properly resourced and meets the processing timetables.In some circumstances, it may be necessary to add resourcesto particular centres if they are experiencing unforeseen dif-ficulties. This could impact on the budget. Reallocation ofresources is much easier in a centralized scenario, as theseresources can be more easily transferred between processesto overcome temporary difficulties.
(d) Quality
The most common argument against decentralizing pro-cessing to a number of locations is the risk to the quality ofcensus data owing to a lack of consistency in processingamong centres. This can occur when managers and/or staffin different centres interpret or implement procedures dif-ferently.
If multiple centres are used, particular attention shouldbe paid to implementing consistent quality assurance pro-cedures across all centres. In these cases, open and regularcommunication channels between the centres are essential.Any proposed changes to procedures and/or processing sys-tems should be carefully coordinated with all centres. Theappointment of a national quality assurance manager whois responsible for monitoring the quality of data producedin each centre will assist in coordinating these tasks amongall centres.
(e) Geographic location
If a centralized processing centre is used, it may be ben-eficial to locate it near the site of the greatest populationwithin a country. This would mean that a large proportionof forms would only have to be transported relatively shortdistances. It would also be expected that this location wouldalso have the most suitable transportation access from mostregional areas. However, with decentralization to a numberof regional centres, transportation costs may be significantlyreduced.
Another advantage of decentralized locations is that thestaff employed at these centres have knowledge of theirlocality, which may be beneficial. Locally engaged staff mayhave a better knowledge about local industries and occupa-tions, which can be utilized in the coding process. How-ever, care needs to be taken that these staff do not rely toomuch on local knowledge and regard themselves as expertsand disregard established standardized coding procedures.
(f) Dispersing infrastructure and skills throughout the country
A decision may be made to decentralize to a number ofcentres in order to take the opportunity to provide bothinfrastructure and skills to various parts of the country. This
is a strategic decision, and the capabilities of the proposedregions need to be considered. While the census providessuch opportunities, it should not be regarded as a trainingexercise and the staff in these regions must be capable ofundertaking the processing activities to the agreed qualitystandards.
(g) Costs
If buildings are sought in the commercial market, rentalcosts will usually be higher for a short-term tenancy thanfor a longer period. In general, the costs associated withdecentralized operations may be higher than those for cen-tralized ones because of the diseconomies of scale associ-ated with duplication of support services.
3. Selecting suitable premises
Obtaining available premises to house census processingactivities may not be straightforward. The fact that the pre-mises may only be required for a relatively short period oftime can restrict the choice of premises. In some countries,other government agencies may have established infrastruc-ture that can be utilized for census processing. In other cir-cumstances, premises may need to be obtained through com-mercial markets. Some of the factors to consider when se-lecting premises for processing include:
(a) Security;
(b) Access for transportation;
(c) Building layout;
(a) Security
The security of the census forms is necessary owing tothe confidential nature of the information on the forms andthe assurances given to the public about protecting theirpersonal information. Therefore, building security issuesmust be considered during the selection of a building andnot as an afterthought. It is difficult and expensive to pro-tect against determined breaches of security and, in real-ity, no building that houses staff can be made totally se-cure from the removal of confidential information. Theperception that adequate security provisions have been putin place can be equally as important as the actual provi-sions themselves.
Dual or multi-tenancy buildings provide a risk to secu-rity, especially where entry and exit routes such as loadingdocks, stairs and lifts are shared; in this regard, single-oc-cupancy premises are preferred. In single-occupancy pre-mises, the number of entry and exit points should be kept toa minimum. Clearly, staff access is an issue, but as long asstaff are able to enter and exit the building without unduedelay, the fewer entry points will provide for better securitycontrol.
A combination of both electronic and physical securitycan be implemented. With the technological advancementin recent years, electronic surveillance has become more

125
financially viable and an extremely effective option, evenfor short-term projects such as census processing. The pres-ence of physical security in the form of security guards notonly covers the issue of perception of security discussedearlier but is also effective in the important aspect of creat-ing a security consciousness in the minds of employees.
(b) Access for transportation
While not an overriding issue, suitable access for trans-port to deliver the forms may be important in some coun-tries. If large road transport vehicles are used to transportthe forms, easy access to the premises will be required. Thiswill be particularly important if the processing is central-ized in one location where large volumes of materials willneed to be processed.
(c) Building layout
Because of the large volume of census forms, premisesshould contain a combination of office accommodation forstaff and storage areas for the forms. It is recommendedthat single premises be used for both the storage and pro-cessing of forms. This will enable a more efficient move-ment of material throughout the processing centre. The stor-age of material nearby but in another building will involveadditional handling costs and the potential for forms to bedamaged, as well as introducing security risks. There willalso be economies of scale with a single premise in regardto both rental cost and security.
Special attention should be paid to estimating the spacerequired for the storage of material and for the efficientflow of forms throughout the building to reduce bottle-necks. For example, sufficient space should be providedin the office accommodation for the storage of workloadsthat the processors are currently working on. If this is notthe case, the workloads will have to be returned to a cen-tral storage area at the end of each shift. This would createa bottleneck and lost production at the beginning of eachshift, as processors would have to retrieve their workloadsfrom a central point.
While storage of some material within the office accom-modation is required, it must be remembered that the ma-jority of material should be stored in designated storage ar-eas and not in the office accommodation. Excess amountsof material in the office accommodation can create occupa-tional workplace hazards and restrict the design of work-place configurations. Material can be transferred from spe-cifically designed storage areas to the office accommoda-tion only when it is needed for processing. Efficient flowcontrol systems to control the movement of forms are dis-cussed in section D below.
The design of the office accommodation will need care-ful planning not only to ensure that material can flow effi-ciently but also to take into account occupational health andsafety issues. For example, several desks can be groupedtogether in a way that will allow the computer cables to behidden between the desks rather than run across walkwaysand corridors.
C. ESTABLISHING THE WORKFORCE STRUCTUREAND RECRUITING STAFF
1. Introduction
Issues associated with recruiting staff for the processingphase are in some ways similar to those associated with re-cruiting staff for the field operations phase. While some ofthe logistical issues will differ, the main objective is the same.The aim of a successful large-scale recruitment campaign forprocessing should be to recruit the best quality staff from thoseavailable, within the time allocated and within budget.
2. Establishing the workforce structure
When planning a recruitment campaign, it will be neces-sary to establish the workforce structure at the processingcentres. It is not possible to be prescriptive about what struc-tures should be put in place at a processing centre, as thiswill largely depend on the processing strategy, technologyused, number of staff employed (see sect. 3 below) and thelocal conditions in a country.
If processing is decentralized to a number of locations,the structures can also vary according to the tasks carriedout at each centre. For example, one centre may be respon-sible for a particular process (e.g., data capture), with otherprocesses (e.g., coding) conducted at different centres. Inother cases, multiple processing centres may be establishedthroughout the country that are responsible for the completeprocessing of data for the surrounding regions.
A generic management structure is illustrated in figureIV.1. This structure is based on the assumption that there isone processing centre that carries out all tasks associatedwith the processing phase. Countries will need to adapt thisto suit their own conditions. The roles and responsibilitiesof each level in the generic structure are also discussed be-low.
In this structure, the director of the processing centre re-ports directly to the executive officer in the central censusagency. If processing is decentralized to a number of cen-tres, an additional layer of management may be needed tocoordinate and monitor the activities of each processingcentre and report to the census agency executive officer.
Managers, who are accountable for broad areas of respon-sibility, report to the director of the processing centre. Theareas and associated responsibilities are shown in table IV.1.
An important point to note in this generic top-level struc-ture is that one position has been allocated for operationsand one position for quality assurance. Allocating separateresponsibility to these tasks at this level in the structure re-flects the need for these important aspects of processing tobe managed by separate positions. In general, this has notbeen done by agencies in the past and is a relatively newpractice. However, agencies that have successfully adoptedthis practice have proved that there are great benefits inadopting such a model.

126
Census agencyexecutive
officer
Directorprocessing
centre
Operationsmanager
Qualityassurancemanager
Administrativemanager
Informationtechnologymanager
Quality assurance managers will be able to devote all oftheir time to ensuring that the quality of the data meets theagreed minimum standards, without the pressures of day-to-day operational control. Operational managers will simi-larly be able to devote all of their time to coordinating thework flow and ensuring that timetables are met. Dependingon the size of the processing centre, the operations managermay need assistance from additional deputy managers atthe middle management level. However, the important pointis that there is a single position in the management hierar-chy that is ultimately responsible for all operational tasks.
Adopting this management model during processing op-erations may lead to conflicting opinions regarding the dif-ferent components of overall data quality (i.e., timeliness,cost-effectiveness and data accuracy). For example, the qual-ity assurance manager may recommend that additional pro-cedures are implemented to rectify deficiencies in a par-ticular process that are causing problems with the accuracyof the data. The operations manager will be responsible forassessing the impact that these procedures may have on time-liness and cost. The director will be responsible for resolv-ing conflicts and establishing a balance between quality cri-teria, and must do so with regard to the strategic directionsset for the processing centre.
Below this top-level structure there may be another levelof middle managers. The number of levels of middle man-agement will depend on the size of the processing centreand the complexity of the processing methodology adopted.These middle managers will be responsible for several teamsof staff that comprise a supervisor and several processors.An example is shown in figure IV.2.
The ratio of supervisors to deputy managers, and proces-sors to supervisors, will vary according to the processingmethodology used and the number of staff employed. How-ever, special attention should be paid to establishing the ra-tio of processors to supervisors. The number of processorsin these teams should be limited so that an effective teamenvironment can be established and the supervisor has ad-equate time to pay close attention to all staff. As an example,some agencies have established ratios of approximately 15processors per supervisor.
Supervisors are a key link in the management structureand communications chain. They are usually temporary staffand form the link between management, who are generally
census agency staff, and the bulk of the temporary process-ing staff who are undertaking the processing tasks. Becauseof their importance in the structure it is worthwhile discuss-ing their tasks and responsibilities. These can include thefollowing:
(a) Conduct day-to-day supervision of a team of proces-sors;
(b) Prioritize, coordinate and monitor the work flow;
(c) Maintain an effective team environment;
(d) Conduct on-the-job training;
(e) Ensure that all procedures are being followed;
(f) Provide performance feedback to processors;
(g) Report to management on issues affecting data qual-ity and any other issues they should be aware of;
(h) Co-ordinate with the storage room.
In addition to supervisors, group leaders can also be en-gaged in the following activities:
(a) Provide performance and daily production reports tothe supervisor;
(b) Assist processors with technical issues;
(c) Provide processors with all needed materials and ques-tionnaires;
(d) Check-in and checkout of questionnaires with the stor-age room.
3. Estimating staff numbers
The strategies adopted for the recruitment campaign, andthe management structure, will largely depend on the num-ber of staff required at each processing centre. Therefore,the first step should be to estimate the number of staff re-quired to complete processing in the time-frame specified.The number of staff required can be calculated using thefollowing model:
(a) Estimate of total number of units (e.g., persons andenumeration areas) to be processed;
Figure IV.1. Processing centre—top-level management structure

127
A possible structure for data-processing operations
The director of data processing reports directly to the executive director
• The data processing operation unit assists the director of dataprocessing in evaluating progress in different activities, solvingtechnical problems and comparing daily production against theoriginal data-processing work plan.
• The data processing unit is headed by the director of data processingand includes as members the storage room attendant, the data-entrysupervisor, census key subject matter staff and a representative fromthe administrative directorate. During the preparation stage, dataprocessing committees can be formed to ensure that the technical andlogistical planning of the data processing activities are on scheduleand to make decisions regarding data processing needs.
• The storage room attendant submits daily reports to the data-processing operation unit on the office editing, coding and finalstorage activities.
• The data-entry supervisor submits daily reports on the progress madeon the data-capture activity.
• The data processing operation unit has daily meetings and a report issubmitted to the executive director after each meeting
———— Source: Palestinian Central Bureau of Statistics
(b) Estimate of total number of units to be processed forparticular topics;
(c) Average production rates (units processed per hour)per processor;
(d) Average processing hours per shift per processor;
(e) Number of shifts per day;
(f) An allowance for public holidays and staff takingleave;
(g) Estimated staff turnover;
(h) Building capacity;
(i) Length of time for processing.
(a) Total number of units
The total number of units to be processed can be derivedfrom a variety of sources. The total number of enumerationareas and/or dwellings may be available from the mappingand listing process for the current census. The estimatednumber of persons may be available from current popula-tion estimates that are based on the previous census.
(b) Total number of units per topics
Not all questions on the census form will be processedfor each person enumerated. For example, only those per-sons in the labour force will need occupation and industrycoded; some questions may only relate to females over 15years of age (e.g., fertility questions); and some questionsmay be targeted towards immigrants (e.g., year of arrival).
Therefore, estimates on data entry and coding actions re-quired can be made for each topic, based on estimates oflabour force participation rates, number of females over 15years of age, or immigrants.
(c) Average production rates
Sources for this variable can be the results from the pre-vious census and/or any processing pilot tests that are con-ducted for the current census. If data are not available fromthese sources, it is possible to draw on the experiences ofother national census agencies that have similar conditions.For example, for key-entry systems, an overall average of6,000 keystrokes per hour is a realistic estimate.

128
It is important that realistic estimates are made for thisvariable and, where possible, they should be based on quan-titative data from previous experiences. This is because sal-ary costs for processing are generally a large component ofthe overall census budget. Discrepancies between these es-timates and the rates actually achieved during productioncan have a large impact on the overall census budget.
An allowance must also be made for the expected learn-ing curve of processors. As processing continues, staff willbecome more proficient and therefore production rates willrise. The steepness and length of the learning curve (i.e.,the time it takes for processors to reach peak efficiency)largely depends on the particular process, the technologyused and the quality of staff recruited. In some simple pro-cesses’ staff may reach peak efficiency in a short period oftime, whereas for more complex processes, the learningcurve can be spread over several months.
It should also be recognized that the actual form designcould dramatically affect the production rates that can beachieved. It is therefore important that managers responsiblefor processing have an input into the form design process.
(d) Average processing hours per shift
It is important to estimate the processing hours achiev-able in a single shift. It is unreasonable to expect that a per-son employed for an eight-hour shift will be able to delivereight hours of processing. Allowances must be made fortime spent in meetings, training programmes, work breaksand so on. The amount of time allowed for this will varydepending on a country’s particular circumstances, but it is
important to factor unproductive time into the equation. Insome countries, this time can comprise approximately 25per cent of the total shift hours (e.g., six processing hourscan be achieved in one eight-hour shift).
Allowances should also be made for the total amount oftime processors will spend on quality assurance tasks. Somecountries allocate an overall 10 per cent of processors’ timefor these tasks. This percentage will vary over the life cycleof the processing phase and should be built into the model.
(e) Number of shifts per day
Some countries may use more than one shift in a day.Using multiple shifts can assist in reducing capital costsassociated with equipment purchases and/or reduce the to-tal time needed to process the census. If multiple shifts areadopted, adequate time should be allowed between the shiftsto avoid congestion.
(f) Public holidays and leave
Public holidays are the easiest to allow for as they aregenerally known. However, calculating an allowance forstaff taking leave is more problematic. Again, this willlargely depend on the particular conditions of service thestaff are employed under and the country’s particular cir-cumstances. Experience has shown that when temporarystaff are engaged to process the census and they have ac-cess to leave provisions (e.g., paid sick leave or other leave),they will generally avail themselves of these provisions. Theexperience of previous processing centres will provide agood guide as to the expected trend.
Operationsmanager
Deputymanager coding
Processor
Processor
Supervisor Supervisor Supervisor Supervisor
Figure IV.2. Processing centre—middle management structure

129
(g) Staff turnover
The prevailing economic climate in a country will directlyaffect both the quality of staff available and staff turnover.The economic climate will differ markedly over time andfrom one country to another (and even between regions in acountry), and therefore staff turnover may or may not be asignificant issue. Countries will have to assess the signifi-cance of staff turnover when estimating staff numbers.
The majority of positions (often greater than 90 per cent)at a processing centre are usually short-term temporary ones,with relatively low remuneration attached to them. There-fore, in times of economic growth, with job growth flour-ishing and low unemployment, a census processing centreis more likely to be seriously affected by a high turnover ofstaff. Conversely, with an economy contracting and alter-native jobs difficult to find, the processing centre will expe-rience a more stable employment base.
Costs attributable to high staff turnover, which may behidden in large ongoing organizations, are magnified in ashort-term project, with a fixed budget and deadlines.
A booming economy and high turnover of staff is likelyto result in:
(a) Loss of the best quality staff first;
(b) Additional recruitment costs and delays;
(c) Additional training costs for replacement staff;
(d) Learning curves for new staff, reducing productionrates and quality of work overall;
(e) Management focus on training rather than on produc-tion;
(f) Possible greater utilization of leave credits;
(g) An increased risk of industrial disharmony.
(h) Building capacity
The capacity of the buildings selected to house process-ing staff may be a constraint on the number of staff that canbe employed. Ideally, buildings with sufficient capacity willbe sought after the required staffing numbers have been es-tablished, but this is not always possible.
Areas Responsibilities
Operations Day-to-day operations of the processing of forms. Includes all of the main
processing tasks, including data capture and coding and coordination of
work flows. Responsible for ensuring that timetables are met.
Quality assurance Monitoring and control of all quality assurance systems and procedures,
including edits and validation. Responsible for ensuring that data meet all
quality standards.
Administration Responsible for all administrative support of the processing centre.
Includes facilities' management, recruitment, payroll services, purchasing
and budget monitoring. Responsible for provision of efficient and effective
support services.
Information technology Responsible for all information technology support, including
communication networks, hardware and software installation and
maintenance. Responsible for maintenance and support of all information
technology infrastructure.
Table VI.1. Areas of responsibility at processing centres

130
(i) Length of time for processing
The length of time for processing can be either a con-straint (e.g., processing must be completed by a certain date)or a variable (e.g., the building capacity allows for x num-ber of staff and therefore processing will be completed on acertain date). However, in general, the length of time forprocessing will be a constraint. It is usually set as a goal inthe census planning phase.
Once staffing numbers have been calculated, recruitmentof staff can be divided into two streams. The first task shouldbe to recruit the managers and the second to recruit the bulkof the processing staff.
4. Recruiting managers
Managerial positions are more specialized and fewer innumber than the bulk of processing staff and therefore canbe recruited through a different campaign. In the majorityof countries, the senior managers of a processing centre willbe recruited from census agency staff. In these cases, agen-cies can adopt their traditional recruitment methods.
It is essential to have managerial staff from the censusagency at the processing centres as they will have an expertknowledge of the processing systems and procedures thathave been developed. They will also be aware of the depen-dencies associated with the processing phase, the overall
Estimating data-entry time in the 1997 population andhousing census in the West Bank and Gaza
The Palestinian Central Bureau of Statistics estimated the time neededto enter the data for the 1997 census, considering the following factors:
1. Number of working days per month was assumed to be 25 days.
2. Three shifts a day were used.
3. Each shift consisted of seven hours, with about one half-hourin between the shifts.
4. Six out of seven working hours were assumed as a base foraverage hours per day shift.
5. Only five out of seven working hours were used as a base foraverage hours in the midnight shift.
6. For the contingency plan, 10 per cent of data-entry time wasused for cases of non-operational equipment that would delaythe data-entry process.
7. Ten per cent of total data-entry time was added for data’ entryverification.
8. Ten per cent of total keystrokes required were added to the totalnumber of keystrokes required for editing and correction.
9. Ten per cent was added to the total time estimated for factorsthat might affect production such as closures, equipment mal-function and down time.
10. Average number of keystrokes for data entry of numeric datawas assumed to be 5,000 keystrokes per hour.
11. Average number of keystrokes for data entry of alphanumericdata (entering the name of the head of household) was assumedto be 3,000 keystrokes per hour.
12. Only the name of the head of household was entered into thecomputer.
———— Source: Palestinian Central Bureau of Statistics

131
census goals and how the processing phase will contributeto these goals. They will also understand the data and thecore business of the census agency. It is also highly desir-able to recruit capable staff who have experience in pro-cessing operations, as their knowledge and experience ofoperational work is a valuable asset.
However, agencies should note that the environment at aprocessing centre is generally quite different from that inthe central statistical agency. It is operational and in thebeginning is often described as “organized chaos”. There-fore, to ensure that this chaos is indeed organized, it is im-portant that the senior managers at the processing centre areaware of the different operational nature of the processingcentre and that they are suited to this environment.
The number of subordinate staff a manager in a process-ing centre will usually supervise is higher than in the cen-sus agency. Therefore, the supervisory role of the managerbecomes far more important.
A predominantly temporary workforce, many of whommay have been previously unemployed, can draw togethera wide range of social and economic backgrounds. This en-vironment is therefore more likely to have a volatile andsocially unstable employee base than that of a more perma-nent workforce, where staff have security of tenure and aconsistent source of income. In particular, managers musthave good people skills in addition to statistical knowledge.
It should not be assumed that statistical experts who haveworked on the development phases of a census can easilytransfer to a staff management position and cope with peopleskills as a matter of course. While there may be numerouscensus agency staff who are capable of adapting to the al-ternative role, the fact that good staff management skillsare not easily attained and are crucial to the success of theprocessing centre should be kept in mind.
Managers will need to fully understand, and have a com-mitment to, the quality assurance principles adopted for theprocessing centre. They will also need to have the ability toinstil this commitment in the staff they will manage.
A successful strategy for recruiting managers in a pro-cessing centre will require striking the right balance betweenretaining current technical knowledge, providing develop-mental opportunities for employees of the census agencyand searching, often externally, for staff with people man-agement expertise.
5. Recruiting supervisors and processors
These levels in the workforce structure comprise the larg-est number of staff and they will generally be recruited on atemporary basis. Therefore, the recruitment of these staffmay require different strategies from those used in recruit-ing the managerial staff. Strategies that may be adopted in-clude the following:
(a) Agencies conducting their own recruitment campaign;
(b) Using other specialist government employment agencies;
(c) Outsourcing to private sector recruitment agencies, ifthey exist and they have access to resources.
(a) Agencies conducting their own campaign
The option of agencies conducting their own recruitmentcampaign may be regarded as the easiest and most cost-effective one. However, there are a number of issues thatshould be considered that could outweigh any expected sav-ings. These include the following:
(a) Bulk recruitment of this order of magnitude is usu-ally not a core function of a census agency. Although theremay be officers within the agency who perform the task ona small scale, it is unlikely that they would have the re-quired expertise for large-scale recruitment;
(b) The timing of the task is far from ideal given that anyrecruitment strategy would have to be aimed as close tocommencement of processing as possible in order to reducethe dropout numbers. It would therefore coincide with othermajor preparatory tasks that may require the focus of man-agement;
(c) Depending on the economic situation at the time, alarge-scale recruitment exercise could require significantinfrastructure to cater for a possible flood of inquiries andapplications.
If an agency chooses to conduct its own recruitment cam-paign, it will have to decide to what lengths it wishes to goto secure suitable staff. There is a large amount of referencedocumentation and assessment techniques relating to thegeneral process of selecting staff. However, few of theseare applicable when discussing the placement of a largenumber of short-term staff within a very short period. There-fore, the ideal results may not be achievable within the avail-able time-frame and budget. It is therefore important to de-termine the essential criteria to be met by prospective ap-plicants.
One of the simpler and more cost-effective options fordetermining suitability for a position in a processing centreis the application of a short selection test. This test can bedesigned to evaluate those attributes that are deemed mostapplicable to the duties involved. These attributes may in-clude the following:
(a) Aptitude for the repetitive clerical tasks to be per-formed;
(b) Accuracy in performing this type of work;
(c) Comprehension of written material;
(d) Speed in performing tasks, without loss of accuracy.
A short, multiple-choice explanation that tests the abovecriteria can prove a valuable guide to an applicant’s suit-ability. While some basic infrastructure will be needed toconduct these tests, this should be available in the process-ing centres that are being established to process the census.
The results of these tests can be used to establish a rank-ing of applicants, which can be used as the order in which

132
applicants will be offered employment. This list can also beused for contingency purposes (see sect. 8 below) to replaceprocessing staff, if necessary.
It may also be useful to confirm applicants’ suitability tothe positions through conducting short interviews, duringwhich each applicant is asked a standard set of questions.At these interviews, applicants should be given completeinformation about the position, the tasks to be performedand the performance standards required. Undertaking a largenumber of interviews over a short period of time can bephysically and mentally demanding for the interviewingstaff. Therefore, careful management of this workload isrequired.
(b) Using specialist government employment agencies
Whether these agencies exist and are an option will largelydepend on the circumstances in a country. If such agenciesdo exist, their expertise and permanent infrastructure canbe used effectively. This may prove to be more cost-effec-tive than the census agency establishing the infrastructurefor a not often repeated exercise.
However, the current trend in many countries is for suchgovernment agencies to operate on a cost-recovery basis.Therefore, the savings that may accrue in direct costs byusing these agencies may not be a significant factor. Otherconsiderations, such as lessening the burden on managersat the processing centre, may make using these other gov-ernment agencies an attractive option.
(c) Outsourcing to private sector recruitment agencies
In some countries, private sector recruitment agenciesoffer similar services to those of government agencies, al-though at a cost that is sometimes prohibitive for the re-cruitment of large numbers of staff. Census agencies needto ensure that the selected private sector agency understands,and will implement, their requirements. It is possible that atask for profit organization may have a conflict of interestin that there could be a desire to place persons from its ex-isting lists who may not necessarily be the most suitableapplicants.
The principles regarding selecting and managing contractsin outsourcing are covered in chapter I, Section G.
6. Recruiting other specialist staff
Apart from managers, supervisors and processors, theremay be a need to recruit specialist staff for particular func-tions at the processing centre. These staff can include:
(a) Specialist information technology staff;
(b) Specialist administrative staff;
(c) Storepersons for the movement of material;
(d) Support services staff (e.g., for maintenance, securityand cleaning).
If these staff perform functions that are not part of thecore business of the census agency, these functions may beoutsourced to other agencies or private companies. In othercases, separate recruitment campaigns may be needed be-cause of the specialist nature of these staff.
7. Timing of recruitment campaign
As with all recruitment campaigns, it should be conductedas close as possible to the time when people are required tocommence work. This will lessen the impact of applicantsnot accepting the job offer because they have found alterna-tive employment or lost interest in the position.
All positions in the processing centre can be filled on acascading principle from the top down. This means that se-nior managers are recruited first, followed by middle man-agement, supervisors and, finally, processors. Specialist staffmentioned in section 6 above will be recruited as they areneeded. This will enable the senior and middle managers tobe involved in the selection process of their staff if this isundertaken by the processing centre. It will also allow forthe staff at the managerial level to receive training beforethe supervisors commence work and the supervisors to betrained before the processing staff begin.
Processing centres that contain large numbers of staff mayalso need to stagger their intake of staff over several weeks.This is because of the logistical problems associated withprocessing and training large intakes of staff at one time.
8. Contingency planning
An important issue that is often overlooked when consid-ering recruitment strategies is contingency planning. If staffturnover becomes a significant factor, which would not beunreasonable to expect in a temporary workforce (especiallyin boom times), and this turnover exceeds expected naturalattrition, there will be the need to recruit additional staff. Thealternative would be an extension of the processing timetable.
It is recommended that any recruitment campaign includea contingency factor where the addition of staffing levels canoccur efficiently, quickly and with little additional expense.
9. Remuneration
The remuneration paid to staff will affect the number, andquality, of staff who will apply for these positions. As far aspossible, remuneration should be in comparison with mar-ket rates for broadly similar jobs. However, agencies shouldbe aware that, in many cases, government rates will be be-low market rates.
Remuneration can be in either of two forms:
(a) Set wage rates regardless of the output produced bythe individual;
(b) Payment based on the number of units processed(piecemeal rates).

133
Adopting set wage rates results in less administrative over-head and does not promote a production-line mentality,where staff focus on production rather than quality. Somecountries that have adopted set wage rates have also imple-mented small performance bonuses, which can include timeoff or extra holidays. These bonuses are given to staff whoare performing at or above an agreed minimum standard. Itprovides a small incentive for staff and rewards those staffwith superior performance. It may also assist in retaininggood quality staff.
Payment based on units produced has the advantage ofonly paying for actual work completed. Estimating process-ing costs for budget purposes can also be simpler. This isbecause it is generally easier to forecast numbers of units tobe processed than production rates. However, a major dis-advantage is that staff can become focused on productionand disregard the quality of the work they produce. Thiscan have negative implications on the quality of data pro-duced. The complexities associated with this scheme canalso make it difficult to administer.
D. PROCESSING OPERATIONS
1. Introduction
Operations at the processing centres need to be carefullymanaged in order to achieve a successful outcome for thisphase of the census. The quality of the staff employed at theprocessing centres will have a large impact on the successor otherwise of the processing operations. In particular, thequality of the staff employed as managers of the processingcentres, and the management tools they are provided, arecritical to the success of the processing operations.
Adequate management structures (see sect. C above) willneed to be put in place in order to coordinate and control allof the activities involved in processing (see figure IV.3 be-low).
2. Data-processing cycle
The data-processing cycle involves many differentinterdependant activities. The number and nature of theseactivities will largely depend on the technology used to pro-cess the census forms (see section F below). As an example,the diagram below shows the major activities that may com-prise a census processing system using key entry. The orderof these activities may vary depending on the technologyused. If key entry is not used (e.g., optical mark recognitionor intelligent character recognition is used instead), thecoding activity will take place after balancing.
As can be seen in the above diagram, the processing phaseis a client area of the enumeration phase and, as such, relieson the quality of the output from that phase. The dissemina-tion phase is the major client area of the output from theprocessing phase and, again, relies on the quality of the out-put produced by the processing system.
The quality and quantity of output from each activity inthe processing cycle has a direct effect on the success orotherwise of the next activity and other activities down-stream. It is also important to note that, in this example, allactivities interact with one another through ongoing qualityassurance. This can become evident at any stage. For ex-ample, the staff undertaking validation may detect problemsthat are the result of inadequate procedures and/or trainingin one of the other activities (e.g., receipt and registration).
While data processing can to a large extent be regardedas a linear cycle, all activities will usually be concurrent.Initial activities such as receipt and registration will com-mence first, but the other activities will commence shortlythereafter as soon as sufficient workloads have been com-pleted by the initial activities. It is important that the flowof forms between activities is managed and coordinatedcarefully to ensure that each activity has sufficient formsfor all staff. A buffer or backlog of forms should be estab-lished between each activity (e.g., two weeks of work),which will ensure that staff do not run out of forms to pro-cess. For example, using the system described in diagramIV.2 above, the data-capture activity should not commenceuntil there are sufficient numbers of forms for two weeks ofprocessing. If it takes one week for this amount of forms tobe processed by all of the activities before data capture, thendata capture would not commence until the third week.
(a) Quality assurance and edits
These strategies are discussed in detail in section E be-low. However, it is worthwhile to consider their relation-ship to all other activities in the processing cycle. As can beseen from the above diagram, quality assurance and editscan be regarded as the core of the processing cycle and arecritical to producing high-quality data. They ensure that theoutput from each activity is of the required quality for thenext activity and provides a mechanism whereby appropri-ate feedback is delivered to all activities.
(b) Receipt and registration
As forms are received at the processing centres, theyshould be registered to ensure that all enumeration areas inthe country and all households within each enumeration areaare accounted for.
The managers of this activity will be required to closelycoordinate their work with managers in the field operationsphase. They will need to monitor the deliveries from thefield to ensure that material flows smoothly, with minimaldelays or congestion.
(c) Preliminary checking
Regardless of the technology employed to process thecensus forms, some type of grooming of the forms will benecessary. The extent of grooming can vary from superfi-cial checks to ensure that the forms are in adequate condi-tion to be read by scanners to transcription of damaged formsand manual editing of responses.

134
(d) Coding
Coding assigns classification codes to responses on thecensus form. Coding can be an automated system, computerassisted, clerical or a combination of all three.
(e) Data capture
For the purposes of the present handbook, data capturerefers to the system used to capture information from thecensus form and create a computer data file. These systemscould include:
(a) Key entry;
(b) Optical mark recognition;
(c) Intelligent character recognition;
(d) Electronic lodgment of forms (e.g., the Internet).
A detailed discussion of the various systems that can beused for data capture is included in section F below.
(f) Balancing
Balancing refers to a system to ensure that a computerrecord has been created for every enumeration area, everyhousehold within each enumeration area, and every personwithin those households.
(g) Validation
Validation is the final check of data to ensure that thequality of the data meets agreed minimum standards (seesect. E below for further details).
3. Controlling work flows
Close attention needs to be paid to monitoring and con-trolling work flows throughout the entire processing phase.Each activity depends on the quality and quantity of theoutput from the previous activities. Once all activities arefully operational, it is critical that each activity meets pro-duction targets to ensure that the following activity has suf-ficient work.
Delays in one activity can lead to costly lost productionin the following activities. If difficulties are being experi-enced in one activity, managers may need to reallocate re-sources between activities or change procedures in order toraise production levels. Any proposed changes in proceduresto raise production will have to be carefully considered toensure that the quality of the data is not adversely affected.
(a) Movement of forms
In some processing systems (e.g., imaging), the physicalforms will only be required up until data capture. After this,electronic images of the forms will be transmitted through-
Receipt andregistration
Preliminarychecking
Coding
Data capture
BalancingValidation
Qualityassuranceand edits
Enumerationphase
Disseminationphase
Figure IV.3. Data processing cycle

135
out the remaining activities, with the physical forms onlyrequired for disaster recovery. In other systems, the physi-cal forms will be required for all activities.
In all cases, controlling the movement of forms betweenrelevant activities needs to be done efficiently and in a con-trolled manner. This can be done through a flow controlsystem. These systems can be clerically based or sophisti-cated automated systems that track material in real time us-ing radio frequency devices. Advancements in technologyin recent years have seen the development of cost-effectivestock control systems that use bar codes for tracking pur-poses. These systems are relatively cheap and ideally suitedfor tracking boxes containing census forms. Regardless ofthe type of system used, a flow control system should con-tain the following:
(a) Movement rules that specify both legal and illegalmovements. For example, forms for an enumeration areacannot flow into coding unless balancing has been com-pleted;
(b) Flexibility to allow forms to be flowed back to previ-ous activities if reprocessing for a particular enumerationarea is necessary;
(c) Provision for timely management information aboutwork flow and location of forms (e.g., number of enumera-tion areas in an activity and exact physical location in theprocessing centre of an enumeration area).
(b) Status of data
Apart from controlling the movement of forms, it willalso be necessary to control the transfer of the electronicdata. In many processing systems, there will be a variety ofautomated stages that manipulate and transform the datafiles. The number of these automated stages can often ex-ceed the total number of activities shown above in diagramIV.2. These automated stages can include the following:
(a) Edits that check for inter- and intra-record consis-tencies;
(b) Derivations of data items (e.g., labour force status);
(c) Imputations for missing data items based on thevalues of other data items;
(d) Imputations for number of persons in householdswhere forms are missing;
(e) Quality assurance points (see sect. E below);
(f) Aggregations and transformation of files for finalrelease of the data from the processing centre.
The automated system used to control the movement ofdata is commonly referred to as process control. The pro-cess control system is similar to the flow control systemmentioned above but reports and controls the different stagesof the data files rather than the physical forms. The systemshould report on the stage of each workload (e.g., enumera-tion area) and contain the following:
(a) Rules that specify when the next automated stage canbegin. For example, labour force derivations cannot com-mence until all labour force variables have been coded;
(b) Flexibility to allow the stage of a data file to be resetif reprocessing is required for a particular enumeration area,household or topic;
(c) Provision for timely management information aboutthe stages of files.
4. Management information system
An essential tool for managers at a processing centre is amanagement information system. An effective managementinformation system enables efficient activity monitoring andcan improve the effectiveness of decision-making withinthe processing centre.
Implementing a management information system can be acomplex and costly exercise. Agencies should therefore seekassistance and advice from other countries that have imple-mented such systems. For example, the CENTRACK mod-ule of the Integrated Microcomputer Processing System isone system that can provide management information.
The general requirements of a management informationsystem are as follows:
(a) To allow access to all relevant management informa-tion by the different levels of management in the areas ofproduction, work flows, staffing information, quality assur-ance and budget control;
(b) To ensure that all management information is as timelyand detailed as needed, while maintaining integrity and ac-curacy of collected data;
(c) To forecast and report on the outcome of future activ-ity within the processing centres for:
(i) Crisis resolution to determine the effects of al-ternate decisions;
(ii) Highlighting potential problem areas before theyarise;
(d) To ensure that information acquired in one censuscan be utilized for planning in future censuses.
Activities at the processing centres need to be monitoredclosely to assist with the smooth running and integration ofall activities; this will ensure that timetables and budgets aremet, and that data produced are of a high standard. Becauselarge amounts of data can be processed very quickly, it isimperative that the management information system deliverstimely and accurate data to management. The vast majorityof census processing is conducted using computerized sys-tems. Therefore, the capture and production of managementinformation data can be automatic and should be regarded asan integral component of the processing system.
Management information data can be made available in avariety of standard reports and/or in a form that allows dif-ferent managers to select the level of detail in which theyare interested. For example, senior management at the pro-cessing centres may only be interested in overall produc-tion rates, whereas middle managers may be interested inindividual section production rates, and supervisors in pro-

136
Table IV. 2.—Report on units processed
Activity Week 1 Week 2 Total
Forecast Actual Difference Forecast Actual Difference Forecast Actual Difference
Registration 3,500 2,700 -800 5,500 5,400 -100 9,000 8,100 -900
Preliminarychecking
2,300 2,400 +100 3,000 3,100 +100 5,300 5,500 +200
Datacapture
2,000 2,000 0 2,400 2,400 0 4,400 4,400 0
Table IV. 3. —Report on production rates (units per hour)
Activity Week 1 Week 2 Week 3 etc
Forecast Actual Difference Forecast Actual Difference
Registration 50 35 -15 55 38 -17
Preliminary Checking 75 80 +5 85 95 +10
Data capture 20 20 0 24 24 0
Table IV. 4.—Report on processing hours worked
Activity Week 1 Week 2 Week 3
Total Hours Average hours perperson
Total hours Average hours perperson
Total hours Average hours perperson
Data capture 1,000 35.5 1,400 37.3 1,550 38.0
Coding etc. 0 0 1,125 41.4 2,750 40.5

137
(ii) Flow Control
Table. IV. 5. Examples of report of activity status for each region
Activity Region A Region B Total
Not started In progress Complete Not started In progress Complete Not started In progress Complete
Datacapture
70percentage
20percentage
10percentage
90percentage
10percentage
0percentage
80percentage
25percentage
5percentage
Balancing90
percentage5
percentage5
percentage100
percentage0
percentage0
percentage95
percentage3
percentage2
percentage
Coding95
percentage3
percentage2
percentage100
percentage0
percentage0
percentage97
percentage2
percentage1
percentage
Example: Report of activity status for governorates in the Palestinian census.
Region Total Enumeration areas Office Editing Office CodingProcessed Accumulated Processed Accumulated
A 298 298 298 298 298
B 58 29 29 12 12
C 184
D 115
Total 655 327 327 310 310

138
(iii) Staffing
Table. IV. 6. —Report of activity by staff numbers and cost
Activity Week 1 Week 2 Week 3 Total to date
Number Salary cost Number Salary cost Number Salary cost Salary cost
Registration 25 12,500 35 17,500 35 17,500 47,500
Preliminary
checkin g
10 5,000 25 12,500 55 27,500 45,000
Data capture 0 0 15 7,500 65 32,500 40,000
Etc
Total 35 17,500 75 37,500 155 77,500 132,500
Table IV. 7.—Report on discrepancy rates by topic
Week 1 Week 2 Week 3
Sample Discrepancy percentage Sample Discrepancy percentage
Sample Discrepancy Percentage
Address 1,390 76 5 1,450 65 4 1,270 40 3
Industry 2,449 136 6 1,800 91 5 2,011 90 4
Occupation 2,139 159 7 2,452 146 6 2,586 122 5

139
duction rates for individuals. Therefore, information shouldbe collected at the finest level of reporting (i.e., individual)and then aggregated to broader levels of detail (e.g., sec-tion) for reporting purposes.
(a) What to collect
(i) Production rates
The production rates achieved in each activity will deter-mine whether timetables will be met. Therefore, to monitorproduction the following will need to be collected for eachactivity:
(a) Units completed, (b) total processing hours worked;from which then derives (c) production rates (units per hour).
The base measurement of units can comprise enumera-tion areas, households or dwellings, persons or a combina-tion of these units. The measure used will depend largelyon the nature of the processing system and the workloadallocation system used to distribute work to staff.
(ii) Flow control
In order to control work flow it is necessary to monitorthe flow of material throughout all processes. Therefore,the following will be needed:
(a) Total number of units and overall percentage not yetstarted, by each activity;
(b) Total number of units and overall percentage cur-rently within each activity;
(c) Total number of units and overall percentage com-pleted for each activity.
(iii) Staffing
A large component of the census budget is salaries forprocessing staff. To monitor this activity the following willbe needed:
(a) Staff numbers by activity;
(b) Salary costs by activity.
(iv) Quality assurance
Ensuring that the data meet the minimum required stan-dards will be an important focus of managers at the pro-cessing centres. The quality of the data produced should bemonitored over the complete processing cycle. To accom-plish this, the following will be needed:
(a) Error or discrepancy rates by activity and/or topic;
(b) Error or discrepancy rates by individual by topic.
A detailed description of quality assurance strategies iscontained in section E below.
(v) Automatic edits
In many processing systems, there will be a series of au-tomated edits (see sect. 3(b) above). Because these edits areautomated, it is important that they are monitored to ensurethat they are functioning as specified and that they are notproducing unexpected results. A simple method of doingthis is to automatically record the number of times each editis applied. Examining this data may also alert managers toanomalies in the census data. For example, there may be alarger than expected count for an edit that checks on inter-record consistency (e.g., number of people under 15 yearsof age reporting an occupation). This may indicate a pro-cessing system error (e.g., incorrect data capture of age val-ues) or may be attributable to respondent error.
(b) What to report
(i) Production
Before the establishment of the processing centres pro-duction plans should be drawn up that show expected pro-duction rates for each activity over time. During produc-tion, the management information system should automati-cally measure actual production rates and compare these tothe original production plan. This will enable managers totrack progress easily and will allow the early detection ofbottlenecks in processing and/or delays in the timetable.Some hypothetical examples are shown below.
The reports above can be further broken down to finerdetails (e.g., groups, sections or individual persons) to showrespective managers how their section compares to othersections and to the overall average for an activity.
Again, the report above can be further broken down tofiner details (e.g., groups, sections or individual persons) toshow respective managers how their section compares toother sections and to the overall average for an activity (seesect. E below for further details on quality assurance).
(v) Automatic edits
Table IV. 8.—Report on automatic edits
Edit No Total
1 475
2 4,895,960
3 3,249,143
4 251,397
5 391,638
etc. 52

140
(c) Feedback to individuals
While the reports shown above, with varying degrees ofdetail, can be utilized by the various levels of managementat the processing centre, it is also important to provide timelyfeedback to individuals on their own performance. The re-porting period for these reports can vary (e.g., weekly, fort-nightly or monthly), but regular performance feedback tostaff allows them to compare their own performance withthe rest of their section.
E. QUALITY ASSURANCE FOR PROCESSING
1. Introduction
In earlier chapters, the quality of census data is definedas multidimensional, involving elements of data accuracy,budget, timeliness and relevance. During the processing ofcensus data, assuming that the criterion of relevance hasalready been met, the emphasis should be on data accuracy,budget and timeliness.
While the aim should be to improve all three elements, itmay be necessary to improve one element at the expense ofanother. For example, it may be necessary to add proce-dures to improve data accuracy at the expense of budgetallocation and/or timeliness. Managers at a processing cen-tre must be responsible for balancing these three qualitycriteria and must do so with regard to the strategic direc-tions set for their particular census programme.
2. Total quality management philosophy
The environment at a census processing centre is particu-larly suited to the adoption of a total quality managementphilosophy. This philosophy is founded on the belief that er-rors in the output of a process are primarily the result of defi-ciencies in the process itself, rather than the actions of indi-viduals working in that process. This means that managersmust take responsibility for data quality, as they are ultimatelyresponsible for the process in which their staff work.
However, while managers must ultimately take responsi-bility for the process, the staff are their most valuable re-source when implementing a total quality management phi-losophy. If this resource is used wisely and staff are involvedin the process and empowered to define and achieve usefulresults, there is every opportunity for success. Implicit inthis philosophy is the belief that most people want to workand that the rate and quality of their work are determined bythe process. Staff who work in the process are in the bestposition to advise on improvements to that process.
While most deficiencies in data quality will be the result ofdeficiencies in the process, it must also be recognized thatcensus data for particular geographic areas are unique. If auser needs data for one particular geographic area, and thedata are of poor quality, they cannot be substituted with datafor another geographic area of higher quality. Therefore, it isimportant to ensure that the quality of the data for each enu-meration area is at least of a minimum acceptable standard.
Line managers have responsibility for quality by ensur-ing that staff understand the management philosophy. It isimportant that the rationale behind the total quality man-agement approach is clearly explained when staff are firstintroduced to the system. Managers should also ensure thattheir ownbehaviour is consistent with the total quality man-agement philosophy, as staff soon pick up on inconsisten-cies between what managers say and what they practise.
Managers need to ensure that staff comments and obser-vations are fed into the quality improvement process. Thebelief that it is the process rather than the individual thatdetermines the quality of output needs to be reinforcedthroughout the entire approach to management. Managersshould ensure that both formal and informal means are usedto encourage staff to contribute, and that staff are comfort-able in giving their opinions.
Providing feedback to staff is an important component ofthe total quality management philosophy. This feedbackshould not only concentrate on negative aspects, althoughthis will be necessary in some cases; it is important thatstaff also receive positive feedback and encouragement.
To be successful, it is necessary to create a culture in whicheveryone has the opportunity to contribute to quality im-provement at the processing centre. The staff who are em-ployed there perform basically repetitive clerical and screen-based tasks, and it is up to managers to motivate them, andto encourage them to assume some ownership of their work.
However, while the majority of data-quality problems willbe the result of deficiencies in the process, there are cir-cumstances where the actions of individuals clearly havean impact on quality. These individuals need to be dealt withby management and, where all else fails (e.g., counsellingand retraining), their employment should be terminated.By communicating why such decisions have been taken,managers can use these rare events to reinforce to all stafftheir commitment to quality.
3. Quality management framework
Processing of census data is a complex exercise that usu-ally involves many different processes (see sect. D above).While each of these processes can be regarded as a separateentity, each one relies on the quality of the output from thepreceding process. To assist in obtaining the highest pos-sible data quality, a framework incorporating the followingcomponents can be established at a processing centre:
(a) Quality management system;(b) Quality assurance points for each process;(c) Continuous quality improvement processes;(d) Validation of data.
Each of these components is discussed in detail below.
4. Quality management system
Quality management systems that can be incorporated intocensus processing are in some respects similar to conven-tional quality control inspection systems as discussed inchapter I, section C. However, there are some important andsignificant differences, which are outlined below.

141
(a) Units of work selected
As it would be far too costly to inspect all units of work, asampling scheme is usually implemented. This samplingscheme can involve selecting a sample of a processor’s workthat is reprocessed by another processor and the results com-pared. In some countries, approximately 10 per cent of pro-cessors’ work is selected for quality management processing.
Sampling schemes to measure the quality of work can beimplemented for all stages of census processing and the ac-tual implementation of such schemes depends largely onthe actual process. However, some general principles canbe applied to a wide variety of processes. Some basic rulesare as follows:
(a) Sampling rates should be relatively high at the begin-ning of a process, gradually tapering off to an ongoing moni-toring rate as processors become more proficient;
(b) At a minimum, all processors should have their firstworkload (e.g., enumeration area) sampled;
(c) More proficient operators should be subject to a lowersampling rate;
(d) All processors should have some of their work sampledover the complete life cycle of the process;
(e) Sampling rates may be increased towards the end of aprocess so that the quality of work does not suffer as stafflose interest in the process as it comes to an end;
(f) Complex processes (e.g., coding occupation or indus-try) should be sampled at a higher rate than simpler pro-cesses (e.g., coding birthplace or religion);
(g) Initial sampling units should be based on operationalefficiency. For example, if the basic workload is an enu-meration area, the sample should first be based on a per-centage of enumeration areas. The sample can then be fur-ther refined to a percentage of households within those enu-meration areas, persons within those households and lastlytopics for those persons.
In some countries, with populations of about three mil-lion, verification was implemented at the following rate:
(a) Office editing, 100 per cent;
(b) Office coding, 100 per cent;
(c) Data entry, 100 per cent at the early stages and fornew data entry staff; then a random sample of only 5%.
(b) Method of operation
The method of operation will largely depend on the pro-cess. As an example, the following is based on a qualitymanagement scheme for the coding process, where responsesfrom the census forms are coded to a classification.
Table IV.9.—Individual performance feedback report
Processor name: John Smith
Period: Fortnight ending 30/06/00
Production
(units/hour)
Discrepancy rates
(percentage)
Address Industry Occupation
Your average 68 2 7 7
Your section average 60 4 4 7
Your group average 65 3 6 5
Overall activi ty average 75 3 4 5

142
A sample of each processor’s work is selected by the sam-pling scheme. This sample can then be reprocessed by an-other processor (quality management processor) from a dif-ferent section. The data files produced by the two iterationsare then compared. Any mismatches between the two filescan be inspected by a supervisor performing the role of ad-judicator. The supervisor can then determine what the cor-rect code should have been. A discrepancy is defined as ei-ther the original processor’s or the quality managementprocessor’s code not agreeing with the supervisor’s code.
Involving processors and supervisors in the qualitymanagemnt system, rather than expert coders, will give thesestaff ownership of the quality of their work. Another advan-tage in using normal processing staff is that experts tend touse their expert knowledge rather than follow procedures.The objective is to promote consistent adherence to proce-dures and also to identify systematic errors caused by defi-ciencies in the process itself.
Once supervisors have inspected the mismatches, they canprovide feedback reports to processors. These reports showthe discrepancies between the code the processor assignedand the code the adjudicator believes is correct. The majorobjective of these reports should be to alert processors toinstances where they are not following procedures correctly.
Supervisors should be trained to provide feedback to theindividual processor, in a clear and concise way, such as“You coded the response to X when procedure N says tocode the response to Y using these steps”. The feedbackreports can be standardized to concentrate on providing feed-back on adherence to procedures.
(c) Rejected units of work
In general, rejected units of work are not reprocessed,except in cases where they do not meet the defined mini-mum standard. This is because the benefit of correcting alldiscrepancies is generally not justified by the cost. For ex-ample, if the overall discrepancy rate for occupation codingis 10 per cent, and the quality management sample rate foroccupation is 10 per cent, correcting all the discrepanciesfor occupation would only reduce the overall discrepancyrate for that topic to 9 per cent. The actual improvement inthe discrepancy rate for occupation would be further reducedby the effects of errors in the inspection process and errorsintroduced during correction.
However, because census data at the enumeration arealevel is a unique product, reprocessing will be required wherequality management processing identifies severe data-qualityproblems.
5. Quality assurance points
As mentioned above, census data for particular geographicareas are a unique product. It is for this reason that there area series of quality assurance points that every enumerationarea should go through during processing. These points en-sure that each enumeration area is of an acceptable mini-mum standard.
The traditional application of quality assurance pointsrefers to a number of automated checks and measures, sys-tems and utilities built into the processing system. The pur-pose of these points is to set measures that can be quantifiedand used to determine a pass or fail status for the outputfrom a process.
This is based on each part of the process having identi-fied points where the progress of the data or output can beflagged as either “pass” or “fail” and used as a measure ofthe success of that process.
For example, the overall data produced by the processingsystem must pass validation (see sect. 7 below) and be of anacceptable standard for the dissemination phase. Before datareach the validation stage, each process must produce datathat are of an acceptable standard for subsequent processes.When the output of a process has passed the checks of thequality assurance point, the next process can proceed. How-ever, if the output fails the checks of the quality assurancepoint, the next process cannot commence until correctionsare made to the output.
Examples of quality assurance points that may be imple-mented in a census processing system (see sect. D above)may includethe following:
(a) Registration process. Every enumeration area and eachform associated with that area is received at the processingcentre;
(b) Balancing. Data have been captured for every house-hold in an enumeration area and every person in those house-holds;
(c) Coding. Coding results for each topic in each enu-meration area are of a minimum acceptable standard;
(d) Edits. Checks and necessary data transformations havebeen made to ensure consistency of data items, for example,that fertility data only relate to females.
A common quality assurance point that can be used is toexamine coding results in the form of discrepancy rates, asmentioned in (c) in the above list. A report can be generatedof enumeration areas where the discrepancy rate for anytopic is above that defined as acceptable. This report willidentify particular enumeration areas that may require re-processing owing to unacceptable quality. It will also iden-tify those processors who require some type of retraining,either through on-the-job training by their supervisor or for-mal training.
Defining what level of discrepancy rates are acceptablebefore an enumeration area passes this quality assurancepoint can be based on results that have been achieved in (a)previous censuses, (b) processing tests conducted for thecurrent census, (c) coding of the same topics in other sur-veys or (d) international comparisons.
Quality assurance points focus on each process achievingthe best possible output rather than relying on later processesto correct data. To achieve improvements in all relevant ar-eas of quality (i.e., budget, timeliness and data accuracy), itis essential that proactive cyclic measures of quality are used

143
and that problems are addressed at their source. Quality as-surance points set a measurable standard and can be fine-tuned to reflect the success of the process. For example, ifaccuracy is high, tolerances can be refined to reflect a finerdetail of checking and improve accuracy further. However,changes in tolerance levels must take into account cost andtimeliness issues, as well as quality, and be realistic in termsof what is important to the final outcome.
Continuous checking of the output from each process isparticularly effective in the development and testingprogrammes leading up to the census. In these tests, there isa greater opportunity for processes and procedures to bethoroughly tested and the output assessed by all stakehold-ers. Any required changes can be tested again and reassessedthoroughly. There may not be as many opportunities for thisduring census processing owing to operational pressures.
Tolerances for quality assurance points used in produc-tion can be determined on the basis of the results from thetesting programme. Where there are known remaining is-sues or problems after the testing programme, these can bespecifically targeted for measurement in the operationalphase.
Some quality assurance points can be designed not to bemandatory but instead to advise about possible problems.These are measures where the purpose is to flag a possibleproblem that requires investigation but allows the output toproceed to the next process. An example of this is the toler-ance levels set for the number of “not stated” fields. It is tobe expected that some topics will be missed by respondentsor interviewers, thereby leading to “not stated” values forsome fields. An advisory quality assurance point could pro-duce reports where the number of “not stated” fields for anenumeration area are above the average expected. This couldthen be investigated to ensure that this is as reported on theforms and was not caused by processors not following pro-cedures or some other system error.
6. Continuous quality improvement
Continuous quality improvement is a core component oftotal quality management. The fundamental difference be-tween continuous quality improvement and classic qualitycontrol is that, instead of aiming to achieve a specified av-erage quality limit, continuous quality improvement aimsto continue to improve the quality of the output of a projectthroughout the life of that project. Continuous quality im-provement will determine the quality of the data producedover and above the minimum standard ensured by the qual-ity assurance points.
A continuous quality improvement approach can be imple-mented during census processing in the following ways:
(a) By using teams of processing staff to identify andresolve quality problems;
(b) By using quantitative measures of quality, based ondiscrepancies in the output of the process;
(c) By giving priority to identifying and addressing theroot causes of these discrepancies.
To ensure that continuous quality improvement is imple-mented correctly, the following four-step cycle is recom-mended:
(a) Step 1. Measure quality;
(b) Step 2. Identify the most important quality problems;
(c) Step 3. Identify the root causes of these importantquality problems;
(d) Step 4. Implement corrective action and return tostep 1.
(a) Step 1. Measure quality
Discrepancy rate data produced by the quality manage-ment system should detail the discrepancy rate for both theoriginal processor and the quality management processorfor those enumeration areas and topics selected by the sys-tem (see examples of reports in sect. D above). It is impor-tant to note that these are not necessarily error rates but aremeasures of inconsistency in processing.
Discrepancy rate data provide information on which ar-eas of processing are not meeting the quality targets andtherefore allow the first step of measuring quality to be per-formed.
(b) Step 2. Identify the most important quality problems
The quality management system can also produce dis-crepancy profile data that are used to identify which par-ticular codes are being assigned incorrectly. These data canbe presented using standard reports in a variety of differentsoftware packages.
This step requires that the most important quality prob-lems are identified and that discrepancy rate data areanalysed to determine which topics, and particular areaswithin those topics, need to be targeted. Compiling profilesof discrepancy data will identify what the most importantdata-quality problems are for these topics.
The first step is to determine what are the most frequentdiscrepancies. Therefore, reports should identify the mostprevalent discrepancies and remove those discrepancies thatare below specified frequency minimums (table IV.10).
The next step is to consider what level of discrepancyshould be of the most concern. For example, if coding aparticular topic assigns a six-digit code, it could be arguedthat discrepancies at the major group, or one-digit level, aremore serious than discrepancies at the six-digit level. Forexample, whether a person’s occupation is coded as “man-ager” or “clerk” is a significant discrepancy. Therefore, fur-ther analysis could result in the report in table IV.11.
The above example is specified at the one-digit level andshows that nearly two thirds of the original occupation dis-crepancies shown in the previous table have been coded todifferent major groups. The most prevalent of these discrep-ancies in the example are between major groups 1 and 2.This suggests that processors are having trouble differenti-ating between these two groups.

144
(c) Step 3 Identify the root causes of these importantquality problems
To perform step 3 of the cycle, information from a vari-ety of sources is needed.
(i) Case reporting forms
Staff working in a process are in the best position to ad-vise about how that process can be improved. Processorsand supervisors can be provided with case reporting formsthat allow them to describe problems they are having with aprocedure, processing system or coding index. These formsare also a vehicle for any suggestions they may have abouthow the process can be improved.
(ii) Adjudication feedback reports
As mentioned above, supervisors have the opportunity toprovide feedback to individuals on the discrepancies betweenthe code they assign and the code the supervisor believes iscorrect. The major objective of adjudication feedback re-ports is to alert processors to instances where they are notfollowing procedures correctly.
Another benefit from supervisors’ performing this adjudi-cation role is that it provides them with an opportunity to con-template why these discrepancies are occurring, particularlyif a number of processors are making similar errors. There-fore, they will be able to advise on deficiencies in training,procedures, processing systems and coding indexes. This en-ables them to make a valuable contribution to identifying theroot causes of the important data quality problems identifiedthrough step 2 of the continuous quality improvement cycle.
(iii) Quality improvement teams
The use of teams of processors to identify and proposesolutions to quality problems is central to the total qualitymanagment approach. Separate teams can be established forthe different processes at a processing centre.
The focus of these teams should be to provide a formalmechanism through which staff can contribute to improv-ing the process in which they work. Each team should com-prise mainly processors and some supervisors, with a middle-level manager performing the role of facilitator. These teamsshould meet on a regular basis at the beginning and lessfrequently once the major problems with the process areaddressed. It is important that participation by staff in theseteams is encouraged by management and that members arerotated so that as many staff as possible have the opportu-nity to contribute in these forums.
The function of these teams is to assist in identifying theroot causes of important quality problems and to recommendcorrective action to address these problems. Case reportingforms, as mentioned above, can be passed on to these qualityimprovement teams. The case reporting forms should be re-turned to the originator, containing feedback on the sugges-tions. Members of the teams can also meet with staff in theirarea to identify problems not raised through formal channels.
Discussions in the quality improvement teams should bewide-ranging and members must feel free to raise any is-sues they think are relevant. It is important that individualsare provided with information about the process, if they re-quest it. Otherwise, they will not be in a position to makesound suggestions for improving the process and will beless willing to contribute to continuous quality improvement.
A record of the discussions at these quality improvementteam meetings should be distributed to all processors andsuggestions sent to management of the processing centre.These suggestions can then be considered by management(see step 4 below).
(d) Step 4. Implement corrective action and return tostep 1
The first part of step 4 of the cycle is to implement cor-rective action to address the root causes of the quality prob-lems identified in step 3.
Before any corrective action is implemented, the ramifi-cations of these changes must be carefully considered sothat the implications are fully understood and predictable.Therefore, proposed changes should be considered at a highmanagement level at the processing centre. This could bedone through the establishment of a quality managementsteering committee.
Managers can consider information from a variety ofsources, including the issues and suggestions generated bythe quality improvement teams. It is important that manag-ers provide timely feedback to the quality improvementteams on the issues raised in their reports, and any proposedcorrective action. In some cases, while the suggestions maybe worthy of consideration, they cannot be implemented fora variety of reasons (e.g., technical reasons, cost or adverseimpact on other processes). The reasons for not implement-ing the suggestions should be clearly stated in the feedbackto the quality improvement teams.
It is important that the contribution of processors and su-pervisors is acknowledged, otherwise this contribution maynot continue. Changes to be implemented should be seen ascoming from the suggestions of quality improvement teams,rather than from management.
The types of corrective action that may be available in-clude the following:
(a) Changes to procedures;
(b) Changes to the processing systems;
(c) Retraining or additional training;
(d) Reminders about particular procedures sent to staff;
(e) Changes to coding indexes in processes where theyare used.
The second part of step 4 is to continue to measure qualityand evaluate the effectiveness of the corrective action thathas been implemented. As the most important quality prob-lems are resolved, the cyclical approach is continued and thenext most important set of problems is targeted. This resultsin the quality of the process being continuously improved.

145
7. Validation
The purpose of validating census data is to identify sys-tem problems and ensure data quality for final output. It isthe final check to ensure that the data produced by the pro-cessing system meet the specifications of the editing pro-gram and output requirements.
Validating the data before it leaves the processing centreensures that errors that are significant and considered im-portant can be corrected in the final file. This final file canthen be used as the source database for the production of alldissemination products. It is important that all products arecreated from the one source file. Changes to the source fileafter validation can result in products being produced fromdifferent source files, which may impact on data and prod-uct integrity.
While it is the final check of data, validation should not beviewed as the last process in the processing cycle. It is vitallyimportant that validation is an ongoing and parallel processto all other processes. This allows for the early detection ofproblems and subsequent implementation of fixes to eitherprocessing systems or procedures. In this way, validation hasthe same aim for the processing system as that for the finaldata. This ensures that the stages in the processing system areproducing output as specified, and as required for the nextsystem. In this way, it contributes to continuous qualityimprovement of both the system and the data.
It is also important that a validation process is included inany processing tests prior to the census. Validation of thedata in these tests will allow early detection of system prob-lems (e.g., edits) before the processing system is commis-sioned for the census. The role of validation in improvingthe processing system is even more critical in the testingstages. The early detection of problems allows for a morethorough examination of the problem, and development andtesting of fixes, than can be undertaken during census pro-cessing. Problems found during census processing are sub-ject to the conflicting priorities of timeliness and cost. There-fore, the decision may have to be made to correct the dataalone, without correcting the process.
(a) Defining the data items
In conjunction with the census dissemination area andother stakeholders, the specification of the output data itemsto be validated should be determined. Each data item is de-fined for the legal values to the output classification, whatconstitutes “Not applicable” categories, and any specific datacombinations that are mutually exclusive.
In addition, known data problems from previous censuses,or owing to the feedback received from the enumerationactivity, are identified and procedures for checking themare defined.
Table. IV.10.—Discrepancy report at the detailed level
(frequency > 30)
Correct code Incorrect code Frequency Percentage of totaldiscrepancies
123456 123457 65— 4
200023 70— 5
810001 34— 2
Sub total 169—
234678 134567 68— 4
245679 55— 3
498765 35— 2
Subtotal 158—
etc.

146
(b) Define the method
The procedures and methods for validation must be de-fined to ensure coverage of problems and consistency ofapproach. Each time the data are corrected or changed forsome reason, they should be validated, following the sameprocedures, to ensure that both the error has been correctedand no new problem has been created.
(c) Aggregating the data
All data items should be checked for consistency and ac-curacy for all categories at a number of levels of geographicaggregation. As validation should run parallel to the otherprocesses, it should commence with the first enumerationareas that complete processing, and continue with largeraggregations of data as they become available for valida-tion. These aggregations will eventually comprise entiregeographic regions, as defined for the country (e.g., regionsor States).
This ensures that data are checked a number of times, andalso ensures that larger table populations are checked. Thisis essential as small table populations may not fill all cellsin a table. Therefore, data errors, and the processing prob-lems that produce them, may go undetected until a largeamount of data is available. By the time a large amount ofdata is ready for validation, some initial processes may havealready been completed and the opportunity to correct theprocess where the error was created passed or considerednot worthwhile given time and cost constraints.
(d) Comparison with other data and inter-censual change
Where possible, it is beneficial if data items in both cen-sus data and recent surveys can be compared. This is par-ticularly important if the comparable data items have beencollected in a recent survey or are available from adminis-trative by-product collections. This can give indications ofexpected changes, or provide an explanation of changes ormovements detected in the census data.
When validating intercensal change between current andprevious census data, it is useful to specify tolerance levelsfor changes in the data items. For example, this may in-volve setting a tolerance level of plus or minus 5 per cent inpopulation growth for a particular geographic region. Thistolerance level can be based on expected normal rates ofpopulation growth in these regions. Any growth outside thisrange would signal the need for more detailed investiga-tions into the reasons for the growth or decline.
Changes in the components of the workforce, or in thetypes of industries and occupations in which people areemployed, occur over time in all economies. Having somebackground knowledge of what sort of changes may be ex-pected in the data, and where they may occur, is part of thevalidation process. This ensures that the data released fordissemination have been checked to ensure that they reflectwhat has actually occurred. This is particularly critical inareas of population growth or decline, where the census dataare required for equitable distribution of funds and elec-toral distribution.
Table. IV.11.—Discrepancy report at the broad level
Correct code Incorrect code Frequency Percentage of total
discrepancies
1 2 70— 8
8 34— 3
Sub total 104—
2 1 68— 7
4 35— 3
Sub total 103—
etc.

147
The staff undertaking validation at the data-processingcentre have ready access to the forms, and to much of theenumeration material such as annotated enumerator booksand maps. This makes ascertaining why a change has oc-curred, or determining if there is a problem with the datacollected, a more effective process at this stage than at alater stage when data products have already been dissemi-nated.
The final validated data released from the processing cen-tre should be complete, with details of any changes in thedata that may be problematic for users.
(e) Regional office participation
Some statistical agencies will have regional offices spreadthroughout the country. These offices may have a better, ifnot an expert, knowledge about their particular geographicregions. This expertise can be used in the validation pro-cess as follows:
(a) Seeking advice from regional offices before process-ing starts to identify any known changes that will affect thecomparison of census variables. For example, these changesmay include population shifts, ethnic clusters, new housingdevelopments or regional employment changes such as theopening or closing of a large employer;
(b) Determining if the level of growth or decline of popu-lation and dwellings in the census is in line with anticipatedgrowth or decline. This can be done through the checkingof census counts of persons and dwellings at the smallestgeographic level of output (e.g., the enumeration area), aswell as for aggregated areas (e.g. statistical regions or ad-ministrative areas).
F. TECHNOLOGY ISSUES FOR PROCESSING
1. Introduction
The successful introduction of technology into the pro-cessing phase will have a large impact on the overall suc-cess of the census. The nature of census processing (i.e., thecapture and manipulation of large amounts of data) is ide-ally suited to computerized technology.
In fact, census processing has a long association with com-puters. The first commercially available computer, theUNIVAC 1, was first installed at the United States Bureauof the Census in 1951. Since that time, advancements intechnology through the different generations of mainframesand the more recent rapid advancements in personal com-puters (PCs) have enabled census agencies to become so-phisticated in the way in which they process and manipu-late data. This has led to more efficient and cost-effectiveprocessing and, ultimately and more importantly, provideda better product for the users of census data.
The use of sophisticated technology such as the rapidlyemerging technologies of imaging and intelligent characterrecognition offers great potential and associated benefits for
census processing. However, agencies also need to be awareof the lead times and technology infrastructure required forthe successful implementation of intelligent character rec-ognition. A variety of data-capture systems, in particular,imaging and intelligent character recognition, are discussedin the sections below. Details on this technology have beenprovided because it is rapidly becoming viable for censusoperations and is being adopted by many agencies in the2000 round of censuses.
2. Processing platforms
The increase in processing power and storage capacitiesof the mid-range systems (e.g., Unix) and lower-end sys-tems such as personal computers has provided new oppor-tunities for many countries. The associated reduction in costsof these platforms has also contributed to the trend of coun-tries moving away from expensive mainframe solutions.
Apart from cost considerations, the PC and mid-rangeplatforms offer greater flexibility and user-friendly systems.This has led to the development of more sophisticated ap-plications on these platforms. However, data managementand network considerations take on greater importance inthe planning phases for these platforms.
3. Data-capture methods
For the purposes of the present handbook, data capture isdefined as the system used to capture the information re-corded on the census forms and create associated computerdata files. These data files are then passed through a codingprocess to transform the information into classification codesrequired for the dissemination of data. Data-capture sys-tems include the following:
(a) Key entry;
(b) Optical mark recognition;
(c) Digital imaging;
(d) Intelligent character recognition;
(e) Electronic lodgement of forms (e.g., the Internet).
Each system has different advantages, costs and impactson hardware and software requirements at both data cap-ture and later stages. A complete census data capture maycontain a combination of more than one of the above. Inthis chapter, the focus is on imaging and intelligent charac-ter recognition as these technologies are relatively new forcensuses and some agencies may not previously have hadaccess to sufficient information on which to base a decisionon whether their use would be cost-effective.
Another emerging technology for data capture is handhelddevices for computer-assisted personal interviewing. Thistechnology has not been discussed in any detail in the presenthandbook because the technology has been limited to sur-veys. At the present time, the cost associated with this tech-nology does not make it viable for census operations.

148
(a) Key entry
In key entry systems, staff manually enter every responsefrom the census form into computers. This method requiresrelatively simple software systems and low-end computinghardware because of the low volume involved. However, itdoes require many more staff than do the automated dataentry systems and is likely to take more elapsed time to com-plete. The decision to use manual entry versus automatedentry is partly based on timetable requirements and relativi-ties between staff and hardware costs. Other factors, suchas whether it is feasible or possible to implement more so-phisticated technology (see sect. A above) also need to betaken into account. Where staff costs are low and comput-ing infrastructure is moderate, keyed entry may be the opti-mal method.
These systems can also require either post-collection pro-cessing to group textual responses into classification classes,or a clerical process prior to keying to assign the classifica-tion class to be key entered.
(b) Optical mark recognition
Optical mark recognition machines read responses to “tick-box” type questions on specially designed forms. Only thepresence or absence of a mark is detected by the machine andany handwritten responses must be later manually entered orcoded by way of computer-assisted methods.
The advantages of optical mark recognition include thefollowing:
(a) The capture of tick-box responses is much faster thankey entry. Typically, optical mark recognition machines willread, on average, 7,000 A4 pages per hour;
(b) Equipment is reasonably inexpensive;
(c) It is relatively simple to install and run;
(d) It is a well-established technology that has been usedfor a number of years in many countries.
Disadvantages of optical mark recognition include thefollowing:
(a) Precision required in the printing process;
(b) Restrictions on the type of paper and ink that can beused;
(c) Precision required in cutting of sheets;
(d) Restrictions as to form design;
(e) Requirement that response boxes be correctly markedwith appropriate pen or pencil;
(f) Significant additional costs associated with (a), (b)and (c) above.
Optical mark recognition forms may be marked by therespondents or the interviewers or responses may be tran-scribed from the census forms onto optical mark recogni-
tion sheets by staff in the data-processing centres. However,the latter method of transcription in the office is regarded asinefficient and a source of errors.
(c) Digital imaging
Digital imaging machines are similar in operation to op-tical mark recognition machines but they use a digital cam-era, or scanners, to take an image (or picture) of each pageof each form. While the physical process of scanning theforms is similar to that used for optical mark recognition,the outcome differs as the scanning process results in animage (and, optionally, a data file), while the optical markrecognition scanning process only results in a data file. Theimage file that results from digital imaging is subsequentlyused for further “heads-up” processing. In “heads-up” pro-cessing, operators refer to an image on the screen ratherthan a physical form. The advantages of heads-up process-ing is that savings are possible from the reduced paper han-dling as the electronic images can be used in place of theactual forms. Heads-up processing is more efficient and re-sults in greater operator productivity.
In general, a digital imaging system can easily incorpo-rate a combination of recognition of optical mark recogni-tion tick-box type responses with the presentation of writ-ten text for processing by operators. However, imaging isusually the precursor to a more sophisticated system of in-telligent character recognition.
(d) Intelligent character recognition
Intelligent character recognition is an extension of thedigital imaging system described above.
After the forms are scanned, the images are processed byone or more recognition engines (software), which then ex-amine response areas to interpret tick-box type questions(optical mark recognition) and “recognize” what has beenwritten by a respondent or interviewer in constrained textfields, and translate this into text values (intelligent charac-ter recognition). Bar codes can also be processed by theserecognition engines.
Figure IV.4 shows how intelligent character recognitioncan operate in a census processing environment.
(i) Scanning
In the above example, the census forms are processedthrough scanners which take an image of each page of thecensus form, resulting in image files.
Once images for all forms in a suitably sized workload(which can be smaller than a complete enumeration area)are captured, they are loaded to network storage and datacollection from them can begin. The physical forms areplaced in store, with minimal further reference expected,while images are transferred to near-line storage and off-site backup.

149
(ii) Recognition
The first step in the data collection process is to “recog-nize” the data from the images. This is essentially identify-ing any tick-box responses that have been marked, as wellas attempting to translate handwritten response areas intotextual values. The images are processed by software com-monly referred to as a recognition engine. The recognitionengine processes the raw data from the form using prede-termined confidence levels that indicate how confident therecognition engine was that the character it recognized isvalid. This process can be undertaken in batch mode on PCsor servers.
Recognition generally occurs using one of two methods.The first method is based on creating histograms of eachcharacter and matching the histogram against a pre-identi-fied set (character set) of histograms. The similarities be-tween the input and character set histograms are scored andthe highest scoring match is returned. The second method,which has similarities to histograms, is where the input char-acter image is split into a number of components. Thesecomponents are matched against a similarly created charac-ter set, with the character with the highest number of match-ing components being the one returned.
(iii) Automated repair and validation
Those fields on the census form that contain charactersnot recognized by the recognition engine can then be trans-ferred to an automated repair process. This automated pro-cess is used in an attempt to reduce the amount of operatorrepair (see (iv) below) required for unrecognizable charac-ters. This process usually involves using dictionary look-uptables and contextual editing.
For example, the recognition engine may recognize themajority of characters (apart from one) in a response to aquestion on person’s birthplace. The characters in the textstring may be recognized as “VANUA-*-U” with -*- indi-cating a character the software could not recognize. Thistext string can then be passed through a dictionary that isspecifically associated with that particular topic. In this ex-ample, it would be a list of countries of the world. If the textstring only matches one entry in the dictionary where allcharacters in the text string match, regardless of the miss-ing character, then the missing character in the text stringcould be assigned a value. In this example, the missing char-acter would be assigned a value of “T” so that the responsewould be “VANUATU”.
Forms fromgrooming Scanning
Physical formsForm storage
Recognition Image storage
Data files
Data filesto laterprocess
Image files
Automatedrepair
Operatorrepair
Automaticcoding
Computer-assistedor clerical
coding
Figure IV.4. Intelligent character recognition processing system architecture

150
It is recommended that a generic dictionary not be usedin this process. Instead, various dictionaries that are tailoredto particular census topics should be used. For example, re-sponses associated with occupation should be matched witha dictionary that only contains typical occupations that oc-cur in a particular country. This method is usually better forsimpler topics, which have a smaller number of possibleresponses, such as country of birth. This process can alsobe used for numeric fields, such as Zip code, where the pos-sible values are known.
(iv) Operator repair
For those characters that cannot be recognized by the rec-ognition engine, or assigned by the automatic repair process,operator repair (also known as “key from image”) will berequired. In this process, operators will examine the individualimages of these characters and either confirm or correct whatwas identified by the recognition engine. Operator repairshould only be carried out for selected fields that have a highprobability of being coded automatically, with the images forother fields being directly transferred to the coding process.It is also important to fully repair numeric data.
Some systems provide other repair methods, which canspeed this process, or, alternatively, provide options thatallow all responses to key fields to be verified.
Once the dictionary look-up system has either recognizedall the characters or operator repair has been carried out, thedata can be passed on to the automatic and manual codingprocesses (see sect. 4 below).
(v) Advantages of intelligent character recognition
An intelligent character recognition solution can be ex-pected to provide the following advantages:
(a) Savings are made in salaries owing to the reduced num-ber of staff needed to code responses, as a proportion of therecognized handwritten responses can be automatically codedwithout any human input (see sect. 4 (c) below);
(b) Additional savings are possible through the efficien-cies gained by using electronic images rather than physicalforms. These include savings from not having to physicallymove forms, and the increase in production that is possiblefrom coding staff referring to images rather than physicalforms;
(c) The reduction in staff costs will also have consequen-tial reductions in various other costs (e.g., recruitment, ad-ministrative support staff and building rental costs);
(d) Automatic coding will provide improvements in dataquality, as consistent treatment of identical responses isguaranteed;
(e) Processing time can be reduced owing to the auto-mated nature of the process. This can lead to a significantreduction in time for census results to be released to usersand thus contribute to an important component of data qual-ity (i.e., timeliness);
(f) Form design does not need to be as stringent as thatrequired for optical mark recognition;
(g) Corrections for paper skew are more sophisticated;
(h) Some systems do not need special colours to be usedin the printing process (although these do assist in reducingthe image sizes), as they can successfully remove preprintedvalues (including black boxes used around ticked responses).
(vi) Disadvantages of intelligent character recognition
The disadvantages associated with an intelligent charac-ter recognition solution are as follows:
(a) Higher costs of equipment owing to the sophisticatedhardware and software required. The images that are cre-ated also add greatly to the data volume, which again addsto the cost of hardware;
(b) Character substitution, which can affect data quality.This is where the recognition engine returns a value for acharacter that is not the same as the response on the form.For example, a 4 is assigned by the recognition engine whenthe value on the form is actually a 9. The majority of soft-ware companies now state that their recognition enginesachieve substitution rates of less than, or equal to, 1 percent for numeric characters. However, the effect of thesesubstitutions should not be underestimated. This would bea problem for critical fields such as age when no interfieldediting can occur. Systems do exist that allow all “confi-dent” responses for specific fields to be verified;
(c) The tuning of the recognition engine, whereby confi-dence levels are set for the software to recognize a charac-ter as a particular character (e.g., a 9 as a 9), is particularlycritical. These levels can be adjusted so that more charac-ters are accepted by the software and therefore require lessclerical repair. However, the confidence levels that are setwill affect quality (owing to character substitution, if thelevels are too low) and cost (owing to the need to repair byoperators, if the levels are too high). The values need to becarefully tested to achieve the planned required balance ofquality and cost outcomes;
(d) To recognize handwritten responses they must bewritten in a constrained response area, and the handwritingmust be of a certain standard, for example:
(e) Network design and capabilities are critical to theoverall operation. The use of images can require millions ofadditional files across the network, which can comprise thou-sands of extra gigabytes when compared to other solutionssuch as optical mark recognition;
A N E X A M P L E O F A
R E S P O N S E A R E A

151
(f) The expected savings resulting from the automaticcoding process might not eventuate because of lower thanexpected automatic coding rates;
(g) Systematic errors may occur in the automatic codingprocess that will affect data quality;
(h) Suitable character sets may not exist for some coun-tries;
(i) The use and storage of images may raise privacy con-cerns with respondents.
(vii) Risk management
Intelligent character recognition is a relatively new tech-nology that has only had limited testing in census opera-tions and therefore involves a greater risk than other moreproved technologies. Therefore, it is critical that countriesconsidering adopting this technology do so only after a rig-orous testing programme. It should not be assumed that,because intelligent character recognition has worked in onecountry, or in one particular statistical collection, it is ap-propriate for census operations in another country.
If countries do adopt intelligent character recognition tech-nology, the risks associated with the technology need to bemanaged carefully. Some of the risk management strategiesthat can be adopted include the following:
(a) Reducing as far as possible intelligent character rec-ognition response areas;
(b) Limiting the effect of character substitution on criti-cal topics such as age by:
(i) Repair operators checking the result of recognitionfor these topics;
(ii) Introducing optical mark recognition tick-box re-sponse fields for these topics;
(c) Using lists of common responses and associated opti-cal mark recognition tick-box response fields for some top-ics with an “other” category that allows respondents to writein their response;
(d) Additional questions on the census form can be usedfor cross-referencing (interfield editing) by the recognitionengine to reduce character substitution. For example, if ques-tions relating to both date of birth and age in years are asked,these can be used as a cross-reference. However, unlike datacontained on statistical forms relating to finance, the dataon census forms do not normally allow for this type of cross-referencing of fields;
(e) The results from the recognition of critical fields canbe subject to higher software confidence levels or verifiedby repair operators by reference to the images;
(f) Image quality checking;
(g) Manual sampling of all processes to ensure integrityand measure error rates.
More generally, the intelligent character recognition so-lution increases the need to carefully manage quality versuscosts. Evaluation of possible acceptance confidence levels(the prime determinant of accuracy) should be undertakenthroughout the development cycle to assess the correspond-ing effect on the substitution rate and the cost in repair loadso that the best balance is identified. The intelligent charac-ter recognition solution should be fine-tuned so that the bestbalance between quality (measured as accuracy) and cost(of character repair) is identified during development. Theprocessing centre’s operations plan should include specificquality assurance monitoring plans that continually evalu-ate the character substitution levels, with software confi-dence levels adjusted when and if required.
The repair workload will need to be managed so that re-sources are not wasted repairing responses that would becheaper to process in the computer-assisted or clerical cod-ing processes.
Adequate network capacity is critical because of the largenumber and size of files associated with imaging. To reducethe size of these files, a technique known as “form drop-out” can be used. This is the process of eliminating knownblack text from images. In some cases, using form drop-outhas reduced the total size of files to one tenth of the originalsize (e.g., from 4,500 Gb to 450 Gb). Using drop-out colourson the census form can also assist in this process.
(e) Electronic forms
The recent expansion of the Internet has provided an op-portunity for the electronic lodgement of forms through thismedium. Many organizations, in both the public and pri-vate sectors, are now developing systems for the automaticcapture of information through the Internet.
The use of the Internet offers opportunities for some as-pects of census operations and it has a great attraction forprocessing because of the reduced resources necessary forform handling, data capture and coding.
However, at the time of writing the present handbook,many countries had investigated the use of the Internet forelectronic lodgement of census forms but have rejected it.The reasons for doing so are as follows:
(a) This solution requires that respondents have a com-puter with Internet access. Even for developed countries thepenetration of the Internet is unlikely to be much above 30per cent in the period leading to the 2000 round of censuses;
(b) Management of respondents. For example trackingwhich households have responded once and once only is anarea of concern;
(c) Security concerns regarding the transfer of data overthe Internet and providing widespread external access tocensus agency networks;
(d) The need to build parallel processing systems (be-cause not all forms will be submitted through the Internet)and the associated complexities of merging data from dif-ferent sources.

152
However, use of the Internet and the development of as-sociated applications is growing at an extremely fast rate.Agencies may wish to monitor these developments closelyto take advantage of the opportunities they may present inthe future.
4. Coding
The coding systems assign classification codes to the vari-ous written responses on the census form. These codingsystems can be (a) clerical, (b) computer assisted, (c) auto-matic or (d) a combination of all three.
The coding systems can use different coding methodolo-gies, including (a) simple, (b) structured and (c) bounded.
Simple matching can be used for those topics where cod-ing is reasonably straightforward and limited to referenceto one question on the census form. An example of this isthe birthplace topic, where a limited number of words (e.g.,one or two) in the response can be matched against a simplealphabetical list.
Structured coding is used for more complex topics suchas occupation. To code these topics, reference may need tobe made to more than one question on the census form. Forexample, some occupation responses can be coded by ref-erence to the occupation title question. However, a largepercentage of responses can only be coded by referring toother questions on the census form such as tasks performedand/or industry. These coding rules can be built into the struc-tured coding system to guide the operators.
Bounded matching (sometimes referred to as hierarchi-cal matching) is used for those topics where it is necessaryto obtain different levels of detail before a code can be as-signed. This method is commonly used for coding of ad-dresses. For example, an operator may start the search at abroad geographic level (e.g., province or Zip code) and, af-ter matching at this level, continue on to further levels (e.g.,region, city, street and even street number), as necessary, toobtain a classification code.
Regardless of which system is used, they all rely on cod-ing indexes. These indexes are lists of typical responses thatare likely to be given on a census form and have an associ-ated classification code assigned to them. An important pointto note about these indexes is that they should be based onwhat respondents report and not simply contain the catego-ries in the classification structure. The indexes should beregarded as a map that enables responses to be classifiedinto the various classification structures. Respondents donot provide answers in classification terms but in everydaylanguage, and the indexes should reflect this.
The quality of the indexes that are constructed has a di-rect influence on both the quality of data and the efficiencyof processing. The effort and time required to build theseindexes should not be underestimated and sufficient leadtime should be built into census plans for this importanttask. These indexes are not static and will need to be up-dated during processing to cater for new responses.
(a) Clerical
Clerical coding involves the processor matching the re-sponse on the census form with responses contained in oneor more indexes that are commonly referred to as code books.The processors then transfer the associated code from thecode book onto the form for later data capture. This clericalprocess is tedious and can be subject to higher errors thanother types of coding. Using this method, processors alsotend to rely on their memories for coding which can intro-duce further errors into the process.
(b) Computer-assisted coding
This method involves processors using computerized sys-tems to assist in the coding process. Similar indexes to thatused in clerical coding are used but they are computer based.The processor usually enters only the first few charactersof each word in the response, and the system then returns amatching list from the appropriate index. The coder thenselects the matching index entry and the code can be auto-matically written to the data file.
An advantage with computer-assisted coding is that morecoding rules can be incorporated into the system to guidethe processors through several processing steps, which re-sults in better-quality data. Computer-assisted coding is par-ticularly suited to the structured coding approach mentionedabove.
Structured coding also has the advantage of reducing thenumber of potential matches presented to the operator onthe screen. This is done through the use of “basic” words(usually nouns) and “qualifying” words (usually adjectives),for example, a processor may enter the text string “far pou”for the response poultry farmer. The system would return alist of all basic words beginning with “far” and after theoperator confirms the basic word as farmer, a list of all quali-fying words beginning with “pou” would then be presented.After selecting the correct qualifying word, “poultry”, theappropriate code would be written to the file. Reducing thepossible number of matches on the screen reduces operatorburden and results in higher-quality data.
Countries that have developed computer-assisted systemshave found them to be more efficient than clerical systemsand result in higher-quality data. However, the system andassociated indexes are relatively complex and require a longlead time to develop. The costs of developing these systemsshould not be underestimated and the assistance and adviceof other countries that have developed them should besought.
(c) Automatic coding
Automatic coding uses computerized algorithms to matchcaptured textual responses (e.g., from intelligent characterrecognition) against indexes without any human interven-tion. The matching algorithms used in automatic coding arecomplex and usually involve a scoring mechanism where aparticular score is required before a response is regarded as

153
a match. There are a variety of algorithms that can be usedfor automatic coding and a complete handbook could bedevoted to this subject. However, it should be noted thatcaution is needed when implementing any automatic cod-ing matching algorithm. Faults in either the algorithm orassociated indexes can result in incorrect codes being as-signed. Because of the complex nature of these systems, itis recommended that agencies that are considering usingautomatic coding contact other countries that have devel-oped these systems.
Depending on the algorithm used, tests have shown thatautomatic coding will achieve high match rates (approxi-mately 80 per cent) for simpler textual responses such asbirthplace. However, responses for the more difficult topicssuch as occupation and industry will achieve much lowermatch rates (approximately 50 per cent).
Regardless of the system used, it will not be possible tocode all responses automatically. Therefore, those responsesthat cannot be coded automatically will need to be furtherprocessed at a later stage through either computer-assistedor clerical coding.
5. Editing
The introduction of more powerful and sophisticated tech-nology has allowed agencies to implement more complexediting systems. It is important that the overall editing strat-egy is given particular attention during the planning phasefor the census. After deciding on the overall strategy, theediting system must be rigorously tested before its imple-mentation into processing operations.
One of the most important decisions to be made regard-ing the editing strategy is the extent of editing that will takeplace. This is a decision that needs to be made on a country-by-country basis.
However, experience has shown that the more complexediting systems are more difficult (and expensive) to imple-ment and test and can, in fact, introduce further undetectedproblems into the data. It may be a preferred strategy toadopt a simpler system, which may leave slight inconsis-tencies in the data but reduce the risks and costs associatedwith complex systems. End-users of the data can be edu-cated with respect to the reasons for these inconsistencies.
However, some type of editing of responses will be re-quired to rectify obvious mistakes made by respondents and/or interviewers.
A recommended approach is that an editing system be:
(a) Minimalist (i.e., only change obvious respondent orinterviewer mistakes or responses that are clearly out ofrange);
(b) Automated (clerical editing is inefficient and costlyand only provides marginal improvement in the final prod-uct);
(c) Systematic, as this will make the system easier tobuild and test. Careful attention needs to be paid when speci-fying the edits and the order in which the edits will be in-
voked. Precise specifications will make it easier for pro-gramming staff to build the system and for subject-matterstaff to test it;
(d) Compliant with procedures used in other statisticalcollections carried out by the agency to ensure comparabil-ity of data;
(e) Compliant with United Nations and/or InternationalLabour Organization standards to ensure international com-parability.
In a minimalist approach, only obvious errors for spe-cific fields that are pre-determined will be adjusted. Theywill usually be adjusted by assuming that certain basic de-mographic information is correct as reported on the form.For example, the reported age (e.g., 2 years of age) may beinconsistent with another variable (e.g., attending univer-sity) and it is not obvious which of these is correct. It maybe decided to consistently use the age reported as correctand adjust the other response to “not attending university”.
Rather than using the minimalist approach where age isused as the cornerstone other systems that use a majorityrule approach may be adopted. For example, when there isan inconsistency between two or more variables, severalother variables may be examined. In these cases, the major-ity of variables that are consistent with one another will re-main as reported, with all other variables adjusted. How-ever, the number of different combinations that can occurmake these systems extremely complex and they are morelikely to introduce further errors in the data when comparedto a minimalist approach.
An important message regarding the editing strategy isthat experience has shown that overambitious and complexediting systems do not necessarily add value to the finalproduct. In fact, there have been many cases where com-plex systems have resulted in the exact opposite, in that theyhave created problems with the data.
6. Imputation
As with editing, the introduction of more powerful andsophisticated technology has allowed agencies to implementmore complex imputation systems. Imputation involves as-signing values to missing data through reference to othervariables. This can be done by way of reference to (a) look-up tables that contain typical data (e.g., age distributions)and (b) other records with similar characteristics. This ap-proach is commonly referred to as “hot-deck” imputation.
Look-up tables may be used to impute variables such asage. There may be several tables for the one variable, whichare broken down by gender or geographic region. Thesetables would contain age distributions that have been de-rived from previous census data, or other survey data, andused to impute age. Other information on the census formmay be used to restrict the range in which age may be im-puted. This may be a lower bound (e.g., must be greaterthan 15 years) or a range (e.g., from 30 to 55 years). Forexample, age may be missing for a married woman withchildren. The lower bound for imputing her age may be set

154
at the age of her oldest child plus a certain amount of years(e.g., 15). The upper range may be set with reference toother variables on the census form.
Hot-deck imputation is the most complex method. In thismethod, a missing value for a particular field is imputedfrom data from a different record. It involves searching backthrough the census records until a preceding similar recordis found that does not have a comparable inconsistency. Thevalues from the field in that record are then copied to therecord with the missing value. For example, income may bemissing for a particular record, although it contains occu-pation and industry responses. The system would search fora preceding record that contains the exact same combina-tion of occupation and industry, with a stated income. Theincome from this preceding record is then copied to therecord missing this value.
The hot-deck approach has been adopted by some agen-cies because it uses existing data and, as such, is regardedas statistically sound. However, hot-deck imputation meth-ods are extremely complex and are difficult to build andtest.
Which data items will be subject to imputation is a strate-gic decision that needs to be made early in the planningprocess. However, it is considered that the advantages ofadopting a realistic minimalist approach that only imputesvalues for basic demographics far outweigh any marginalbenefits that may arise from building complex systems suchas hot-deck methods. Inventing data through imputation formany variables (e.g., occupation) will not add any signifi-cant value to the final product. Users should be educated toexpect not stated responses in census data and the reasonsfor these “not stated” values.
7. Data management
Data management is particularly critical in a distributedprocessing environment where there may be hundreds, ifnot thousands, of PCs connected on a Local Area Networkor a Wide Area Network.
Some basic considerations that are applicable to a varietyof systems, regardless of the technology used, are discussedbelow.
(a) Data storage
During processing, data will pass through a number ofsequential activities from data capture through to release offiles to the dissemination phase. Each activity will refineand change the data in some way. Therefore, it is advisableto maintain copies of all versions of data for auditing and
tracking purposes. This will enable easy pinpointing ofwhere problems were introduced and where corrective ac-tions can be taken.
The technology used for data storage depends on the ar-chitecture chosen for the data-capture and processing sys-tems. Simple text files may be sufficient, if appropriate tothe architecture. Whatever data storage system is used, akey issue is the management of large volumes of data andmultiple versions of files as the data passes through eachactivity. The management of the data also needs to addressissues such as retrieval for the various activities within speci-fied response times. A decision on the data storage method-ology will depend on the volume of data involved and thecomplexity of the processing system.
(b) Data back-up
In order to recover from inadvertent loss of data it is im-portant that a back-up strategy is developed. This strategymay include frequent on-site back-ups of data, and controlfiles, from all stages of processing, and regular off-site back-ups to protect against major disasters.
It is also important to have a recovery strategy in place tobe able to reinstate all files in a consistent state after thefailure of a server, corruption of data or other problems.
(c) Data security
The unit record data that is produced during processingshould be subject to the same strict security rules that applyto the physical forms. This means that only authorized staffshould have access to the unit record files for the purposesof processing. Network security will be required to monitorand restrict access to unauthorized staff. It will also need toprovide mechanisms that prevent unauthorized tamperingof the data in the files and provide audit trails of all changes.
Protection against the threat of computer viruses is an-other important aspect of protecting the data. The introduc-tion, either deliberately or inadvertently, of a virus couldhave disastrous effects on processing. There is a variety ofcommercially available software that can be used to reducethis threat. However, one of the easiest and most effectiveways of reducing this threat is to physically remove the dis-kette drives from the computers connected to the network.In a network environment, there is usually no need for themajority of staff to have access to diskette drives. Any soft-ware upgrades or transfer of data that are necessary by wayof diskette can be done through a restricted number of ter-minals used by a restricted number of authorized staff. Up-to-date virus protection software should be installed on thesecomputers to ensure network security.

155
8. Communications
Effective and efficient communication, both within theprocessing centre and between the processing centre andother stakeholders (e.g., the field operations and dissemina-tion phases and central census agency management), is es-sential. If several processing centres are established in adecentralized option, special attention should be paid to es-tablishing secure links between these centres.
The use of electronic mail, bulletin boards or discussiondatabases is particularly suited to processing centres. Thebulletin boards or discussion databases can be used to holdcopies of manuals and procedures. They can also be used toraise problems and hold discussions about various aspectsof processing.
The data from the processing centres may also have to betransferred between sites or to the dissemination team forinclusion in census products. Because of the size of the cen-sus files, electronic transmission may be impossible or in-efficient. If electronic transmission is used, it is recom-mended that file compression software be used. Validationof decompressed files will also be necessary to ensure dataintegrity. Security issues associated with electronic trans-fers will also need to be considered. Encryption softwareand/or hardware may be needed to protect the data duringtransmission.
Physical transfer of the data may be less expensive. Filescan be downloaded to a variety of media, including diskettesand digital audio tapes.

156
157
A. BROAD DISSEMINATION STRATEGY
1. Introduction
The present chapter describes the processes that lead tothe creation of products that will meet the needs of usersof the census data. It has been written from the view of acensus agency that undertakes a considerable amount ofdevelopment of products to the final stages.
In other countries, a far less ambitious output programmeis employed, reflecting one or more of the following condi-tions:
(a) A policy decision by the census agency to use theskills of external entities to add value to a suite of basictables produced;
(b) Lack of suitably skilled staff within the user commu-nity to utilize advanced and/or complex output products;
(c) Lack of financial resources to fund the developmentof complex products within the census agency or for usersto purchase them.
Where such conditions apply, it is still important thatusers are consulted about the range of output to be pro-vided. In fact, if the principal form of output from thecensus is to be a concise set of simple and generally ap-plicable tables, it is crucial that the content of those tablesmeets a high proportion of user needs. This can only beachieved if users are intensively consulted during the pro-cess of designing the tables.
It is important to recognize that there are a range of stra-tegic issues that should be considered by the census agencybefore commencing the development of products.
The major issues to be considered include the following:
(a) Wholesale versus retail approach to dissemination;
(b) Pricing of census products;
(c) Timeliness of release of data compared to accuracyof data;
(d) Stages of data release;
(e) General or customized releases;
(f) Integration of census results with other products ofthe census agency.
2. Wholesale versus retail approach to dissemination
At a very broad level, it is possible to consider whetherthe census agency should provide detailed standard tabula-tions to other entities (either public agencies or private sec-tor entrepreneurs) that will develop value-added productsor provide a full range of services to end-users. Using thelanguage of commerce, these options are often referred toas wholesaling or retailing models.
The main advantage claimed for a wholesale approachis that the census agency concentrates on its core busi-ness of collecting, analysing and disseminating statisti-cal information. The potential distractions of marketingand related activities are avoided.
Even where a broad wholesaling approach is followed, itis likely that there will be requests for non-standard infor-mation, including consultancies, from retailers and, possi-bly, direct from users. Furthermore, it is probable that thecensus agency will be involved in resolving user queriesabout the interpretation of the data supplied by retailers.This will follow from the superior knowledge of the censusagency in respect of the impact of the census processes onthe data, and the access of the agency to unit record files forfurther analysis. From a census management perspective, itis important that work plans and budgets make appropriateallowance for these tasks.
The advantages claimed for a retail approach are that thecensus agency is best placed to understand the data and itslimitations, and can thus provide the most effective serviceto users. Also, it can be considered that developing prod-ucts in-house provides positive feedback to census staff.
It is important to note that the costs to the census agency ofuser liaison under a retail approach will be considerably higherthan under a wholesale approach. It may be necessary for thecensus agency to take on staff (either as employees or con-sultants) with different skills for some of the retail-orientedtasks. Additional staff could include the following:
(a) Developers of more complex output products;
(b) Sales and marketing experts;
(c) Client support staff.
The decision about the position of the census agency withrespect to this criterion should be made as far as possible inadvance of census day. This reflects the central role ofclient’s views determining the relevance of the census tousers of census output, and through them, relevance to thecommunity in general.
V. CENSUS PRODUCTS

158
3. Pricing of census products
Countries will make the most basic decision regarding pric-ing. It is to be expected that each Government will determineas a matter of policy the extent to which a census will be fundedby general revenue or by sales of the results of the census.
At one extreme, the Government may determine that fund-ing will be made available through the general taxation sys-tem, with the consequence that all output will be providedat no further cost to the users of those statistics, whetherthey are taxpayers or not (i.e., free data for all). At the otherend of the spectrum, the work of the census agency may bedetermined by the funding provided by users of the results(i.e., a user-pays strategy).
In practice, it could be expected that most Governmentswill expect the census agency to fall between these extremes.A range of output will be provided at no cost, while otherelements will be seen as value-added products for which acharge will be levied. It should be noted that the full costsof a census are never recovered through the sale of data.The role of a pricing mechanism may be based on a numberof criteria, including the following:
(a) The need for a mechanism to ration demand for ser-vices of the census agency;
(b) Encouraging users to identify, and specify, their realneeds for census data;
(c) Relieving taxpayers of the burden of funding elementsof the census that are only utilized by a small proportion ofthe community.
It should be noted that, in most cases, the majority of fund-ing for the census will be provided through general rev-enue. This is usually taken to imply an obligation on thecensus agency to return some services to the communitiesthat have devoted time by providing information to the cen-sus agency. These services are often described as commu-nity service obligations and may include provision withoutcharge of (a) basic tabulations “on demand”: to all whomrequest them; (b) a basic product through major public in-formation sources such as libraries or elected officials;(c) information services provided by media outlets; and(d) support for retailers adding value to the data.
4. Timeliness of release compared to accuracy
One of the most basic decisions in a census operation,and indeed a key decision about the quality of census re-sults, is the trade-off between timeliness and accuracy. Thisis particularly important in designing the output strategy, inthat the decision affects not only the dissemination teambut all the preceding stakeholders in the census programme.
In general, it can be expected that the faster a process isundertaken the greater the level of inaccuracy in the resultsof that process. It is also a general rule that users of censusdata will expect a high level of accuracy in the informationprovided by an official census agency. The census agencywill need to manage this trade-off.
It should be expected that the majority of users would besatisfied by an initial release of core information followedby a subsequent release of ancillary data. Where the re-sources of a census agency are limited, it may be found thatthe optimum strategy is to focus a high proportion of re-sources on the initial release of basic data. Other entities,such as value-adding external agencies, can be relied on tomeet more complex data needs.
5. Stages of data release
It may be found that advantages of timeliness of releaseof some basic information can be achieved by splitting therelease of information into two or more stages.
Some countries have adopted the practice of releasingpreliminary data that are subject to later revisions. Thesedata are usually restricted to head counts tabulated by largegeographic areas and basic demographics (e.g., sex). How-ever, this practice is not recommended, as the accuracy ofthe data can be poor because it is usually not subject to thesame stringent quality assurance procedures that are presentin the final data. This can lead to large revisions of the data.
Other countries have adopted the practice of a staged re-lease of final data. Responses to simple questions (notably,basic demographics) could be dealt with in a first release topermit consideration of key “head count” related analyses.More complex topics, such as industry and occupation,which require considerable processing resources, could bedealt with in a second release.
Managing such a process requires consultation with us-ers to determine which data items are required close tocensus day, balanced by the census agency’s knowledgeof the items that are difficult (and thus time-consuming)to process.
6. General or customized releases
A further decision has to be made between providing ba-sic, standard data suitable for all users and providing morecomplex data for the needs of specialized users.
To some extent, the type of funding adopted for the cen-sus will determine this matter. It could be expected that ahigh proportion of funding from general revenue would beaccompanied by a high priority being given to standard tablesto meet a wide range of needs. Alternatively, a high propor-tion of user funding will be accompanied by a relativelyhigh priority given in the dissemination phase to meetingthe needs of the providers of funds.
One way of balancing these requirements is to determinethat some products are community service obligations, towhich resources are devoted according to the level of com-munity funding. Other products are seen as commercial prod-ucts, with resources devoted according to the level of cli-ent-specific funding (either through advance funding orthrough purchases of products once they have been offeredfor sale).

159
It may be found that there are advantages to developing abasic set of data tables to meet all needs. These tables canthen be manipulated, or presented with more complex toolssuch as GIS software, to meet commercial market niches.
7. Integration of census results with other products
In most cases, the census results will only be one part(albeit an important part) of the product range of the statis-tical agency. It is important that the output produced by thecensus is integrated as far as possible with the output fromother collections conducted by the statistical agency.
One way of achieving this, particularly if a retail philoso-phy is employed, will be to include the corporate dissemi-nation or sales area as a stakeholder of the census. Thisshould ensure that salespeople can demonstrate how to usedata from across a range of collections undertaken by thestatistical agency to enable users to obtain a greater under-standing. This could be expanded to include integration interms of statistical standards, dissemination structures andcomputing systems such as those for tabulation and/or ma-nipulation of data and for statistical mapping.
In addition, the use of other authoritative data for the coun-try to validate the census data will help ensure that the censusdata are seen as part of a larger package, and not simply aself-contained set of numbers. Such validation is a key ele-ment of the quality circle described in chapter I, section C.
B. USER CONSULTATION PROCESS
1. Introduction
The user consultation process discussed in the presentchapter complements that which takes place when deter-mining the content of the census (see chap. I, sect. A).
The user consultation process in terms of census productsis a major factor in the development of a disseminationprogramme. The work done at this stage of the census is im-portant in achieving the objective that the census is relevantto users. As indicated in the quality assurance section of chap-ter I, this is a major indicator of the quality of the census.
The overall aim of the dissemination phase is to provideinformation to assist users to make more informed decisions.In working towards this objective, the dissemination phaseshould use the results of the evaluation of the output fromone census to consolidate and improve the product rangefor the next census. The focus should be on data relevance,quality and timeliness of delivery.
It is likely that the user consultation process will commencewith the census agency stating its view on the nature of out-put to be produced. This view can be developed from theevaluation of the previous census and enhanced by the knowl-edge of recent developments. However, there will need to besome flexibility to adapt the range of products and servicesto meet current and emerging needs in the market place thatonly become identified in the consultation process.
2. Managing the process
(a) Objectives
The aim of the user consultation process should be to in-form census users of the census agency’s strategies for de-veloping the products and services of the next census. Itshould also seek their views on the strategic goals and di-rections for the census dissemination phase. This overallaim can be broken down into three objectives as follows:
(a) To better understand overall user reactions to the cur-rent broad direction of the dissemination phase;
(b) To understand user reactions to specific products andservices;
(c) To report on the outcome of the research and makerecommendations to users and census agency managementfor the dissemination phase.
The process described below consists of several stages,in which a range of tools can be used; these tools aredescribed in table V.1.
(b) Stages of the process
The consultation process can be carried out in two stages.
(i) Stage 1. Consultation on the broad directions
It is recommended that the dissemination strategy be pro-vided in publication form, accompanied by a questionnaire.The publication and the questionnaire will usually be in hard-copy form, although some countries may wish to supple-ment this with an Internet publication, supported by e-mailresponses.
This first publication can provide the goals, the strategiesto achieve the goals and the broad directions of the dissemi-nation phase. The self-enumerated questionnaire can com-prise two parts:
(a) Questions relating to the client’s use of current cen-sus products and services;
(b) Questions relating to the strategies proposed by thecensus agency for the products and services of the next cen-sus.
To facilitate later work, users should also be asked whetherthey wish to be involved in later rounds of the consultativeprocess.
The hard-copy publication can be mailed to existing andpotential clients. For the convenience of clients, a reply-paid envelope can be included in the mail-out.
As indicated above, much of the information sought inthis stage will be qualitative commentary. Information maybe available on the quantity of products purchased (oraccessed, if products are not sold) by each user. This infor-mation can be used to develop some weighted measures ofthe strength of views according to the nature of the client.

160
(ii) Stage 2. Consultation on specific products and services
Based on the results of the stage 1 consultation, more spe-cific proposals can be developed. A second publication andquestionnaire can be mailed out (or supplied through theInternet, as appropriate) to those clients that expressed in-terest in further consultation. This publication presents theproposed content of products and services that will becomeavailable, indicative prices and indicative release dates. Thequestionnaire can seek detailed information on the contentof specific products.
In addition to the mail-out of publications and question-naires, face-to-face sessions can be conducted with key us-ers, where possible, to obtain more detailed feedback.
The returned questionnaires can be categorized either byclient sector and industry or by client’s status (heavy useror ad hoc user), and the results analysed using standardspreadsheet software.
(c) Information required
Reactions from clients can be sought against a number ofspecific criteria, such as the following:
(a) Content and functionality;
(b) Views on, and reactions to, pricing of products andservices;
(c) Importance of timeliness;
(d) Client support;
(e) Usefulness and appropriateness of the census dataand products.
(i) Content and functionality
The range of issues to be covered under this heading isextremely broad and will be determined by many factors,including the range of topics on which data are to be col-lected, and the strategic issues covered in section A above.
However, the following list of broad topics may be ofassistance to countries in planning this phase of user con-sultation:
(a) Data:
(i) Quality;
(ii) Comprehensiveness and breadth;
(iii) Reliability;
(b) Software (if provided):
(i) Quality and performance;
(ii) Ease of use and intuitiveness (user-friendly);
(iii) Level of functionality;
(iv) Technical support and training;
(c) Service delivery:
(i) Timeliness and predictability of release;
(ii) Range of media and formats;
(iii) Presentation and packaging;
(iv) Pricing and value for money;
(v) Client support, awareness and training;
(vi) Usefulness of data or product;
(vii) Appropriateness of the product (standard versuscustomized).
(ii) Views on, and reactions to, pricing of products and services
In the discussion that follows, the terms “services” and“products” are used interchangeably. This reflects the factthat in many cases there is an arbitrary choice by the censusagency as to whether a range of data are provided through aspecific (usually, generally available) product or by a value-added service.
Table V.1.—Tools used in user consultation process
Stages Qualitativestudies
Quantitativestudies
Comments onPrototypes
Use of current products and services Major use Minor use Not applicable
Broad strategies planned for next cycle Major use Major use Not applicable
Detailed design of specific products Major use a Minor use a Major use
a These ratings reflect the likelihood that, by the detailed design stage, much of the client contact and negotiation will be based on the quantitative
information determined in the previous stages.

161
To some extent, the issues raised by this topic will bepredetermined by the policies applicable in a country, asdescribed in section A above. Within this broad set of pa-rameters, users’ reactions to pricing are likely to vary ac-cording to their circumstances and their view of the officialpolicies. However these views can be influenced by a num-ber of factors, including the following:
(a) Whether it is a standard product or a customized ser-vice;
(b) Timeliness of the product or service;
(c) Comprehensiveness, accuracy, breadth and relevanceof the data included in a product or service;
(d) Scope and content of the product and the range ofmedia in which it is disseminated;
(e) Level and effectiveness of the training and supportprovided;
(f) Breadth of functionality of the software (where appli-cable), and its quality and performance;
(g) Complexity and ease of use of the software.
All of the above factors will influence the client’s per-ception of whether the product represents value for money.
(iii) Importance of timeliness
Many users of census data have unrealistic expectationsof the timeliness that can be achieved for release of accu-rate census data. An important role of managing a census isto manage users’ expectations of this aspect of quality sothat the output programme is not threatened by unreason-able demands for early data.
The time required to undertake the following activitiesshould be drawn to users’ attention:
(a) Quality assurance in the field;
(b) Transporting forms from enumeration staff to the data-processing centres;
(c) Data capture of the information from the forms;
(d) Coding textual responses;
(e) Validation of the unit record file;
(f) Compilation of the output files and preparation ofproducts.
(iv) Client support
This item refers to the services that the census agencymay provide to support users in their application of the dataor use of the product. This may range from an inquiry ser-vice to a product-support facility similar to that offered bycomputer software companies. The level of sophisticationwill rely on the funding available to the census agency andthe needs of users.
The position adopted by a country in regard to this itemwill depend on the range of products the census agency pro-duces, with considerable weight given to whether the coun-try is oriented towards retailing or wholesaling statisticalinformation.
(v) Usefulness and appropriateness of the census dataand products
This information should be of great value to the censusagency in determining the priority afforded to providingspecific products.
Information collected under this topic will need to be in-tegrated with and compared to that collected under otheritems in this section. It is, however, a key measure of therelevance of the data and/or product under consideration.
3. Tools to be used
The user consultation process can take place in threephases, some of which will overlap. These are:
(a) Qualitative studies;
(b) Quantitative studies;
(c) Detailed product design.
While the research should commence well before the enu-meration period, it may be possible for detailed productdesign (for more complex products) to be undertaken dur-ing the processing period. However, it would be desirablefor the detailed design of the basic output products to becompleted in sufficient time to minimize the lag betweencompletion of validation of processing and release of theproduct.
It is important that clients and/or stakeholders within thecensus agency are involved as a matter of course in all phasesof the consultation process. They should be given the op-portunity to reply to questionnaires and participate in thedetailed product proposals at the contemplative stage. Fo-cus groups and workshops for internal clients provide aneffective forum for innovation and generating proposals fornew products, as well as providing internal staff with thechance to have input into the final product design.
(a) Qualitative studies
Qualitative studies are most commonly undertaken in theform of focus groups (i.e., small group discussions moder-ated by a market research specialist).
Focus groups can be established to obtain qualitative in-formation about the performance of current products andservices. Detailed current product plans provide the start-ing point. The groups are usually general in nature, cover-ing a range of clients and products. However, there may bethe need for more specialized groups to deal with key mar-ket segments, as well as with individual products, in par-ticular flagship or premium commercial products. An ex-

162
ternal consultant can be employed to assist in the process,although the census agency should be heavily involved inthe development of the specifications to be provided to theconsultant.
Where appropriate, larger-scale conferences and/or work-shops can be held to allow consultation with clients andusers from the central and regional offices of the censusagency.
The aim of the qualitative research is to better understandthe reactions of clients to the current census disseminationprogramme, including products, services and their delivery.This contributes to recommendations for the next censusdissemination programme.
The major tasks are as follows:
(a) Prepare detailed specifications;
(b) Contract external consultants;
(c) Organize focus groups;
(d) Prepare interim report (for the evaluation phase);
(e) Prepare final report.
Approximately six months should be allowed for thisphase of consultation.
(b) Quantitative studies
Quantitative studies and the detailed product design willhave some overlap and will give a broader base to clientcontacts.
Quantitative studies may make use of client mailing liststhat have been built up by the census agency over the pastcensus cycle (e.g., client databases and newsletter subscriberlists).
A variety of questionnaires may be required, including ageneral questionnaire and others focusing on:
(a) A particular product or service;
(b) Particular market segments or industry sectors;
(c) Users’ technical requirements (available formats andmedia and industry standard software in use).
A user’s newsletter is a useful avenue to provide a forumfor feedback.
The major tasks in the quantitative research phase are:
(a) Determine detailed methodology;
(b) Develop questionnaires, covering letters, newsletterarticles the response mechanisms;
(c) Conduct surveys;
(d) Analyse and prepare reports.
Approximately 8 to 10 months should be allowed for thisphase of consultation.
(c) Detailed product design
Based on the results of the qualitative and quantitativestudies, decisions will need to be made on the appropriateproduct mix.
Within the census office, approval should be sought forthe detailed product design, along with submissions for ap-propriate funding (where this is required from governmentfunding rather than being obtained through user-pays ar-rangements).
Prototypes of the various products can be prepared andfollow-up user consultation undertaken through seminarsand mail-outs. Consultation will also need to take place onthe classification details clients require from the census,some of which (such as income ranges) have an impact onthe final census form design.
The major tasks in the detailed product design phase are:
(a) Determine overall product mix;
(b) Develop product plans for corporate approval;
(c) Develop prototypes;
(d) Devise classification proposals;
(e) Consult users;
(f) Finalize product design.
Approximately 12 months should be allowed for thisphase.
4. The business plan
A business plan is developed after extensive consultationwith external clients and the agency’s stakeholders. Even ifthe census results are not being sold on the open market(i.e., no revenue is required or expected), a plan should becreated showing the costs, the expected number of units tobe created and the expected principal users of the productsand services.
A management steering group can be established to re-view on a regular basis the development of the plan and tomonitor revenue and expenditure under the plan. The busi-ness plan should cover the costs of the full range of dis-semination activities. These include the costs associated withdata validation, output systems development and productdevelopment and production. Costs associated with market-ing and ongoing support of all census products through thecomplete census cycle should also be included.
C. PRODUCT DEVELOPMENT
1. Introduction
The challenge to census planners is to achieve continu-ous improvement in all aspects of data quality. This includesthe provision of a flexible and client-focused census dis-

163
semination programme and service. In terms of the dissemi-nation programme, the key goal will be the development ofa user-driven and predictable programme, with the devel-opment of effective dissemination systems and procedureswithin budget and on time.
To ensure predictability of release (i.e., that the announcedrelease dates are adhered to), resourcing and timetabling ofthe dissemination programme must be carefully consideredand be realistic and achievable.
2. Product planning
The following procedures should precede the develop-ment of products and services:
(a) Review of the products and services from the previ-ous census. In particular, attention should be paid to con-tent and method of production, and content of standard prod-ucts, with a view to improving timeliness and use;
(b) Targeted user consultation and market testing;
(c) Review of the method for protecting confidentialityof individual responses to improve data additivity and con-sistency (as determined by user requirements);
(d) Review of the mix of hard-copy and computer-basedplatforms for the dissemination of census data;
(e) Investigation of cost-effective internal and/or exter-nal suppliers of information technology services to the cen-sus dissemination phase.
(a) Review of method of production
An evaluation of the method of production from the pre-vious census should be conducted to identify successful el-ements in the process that can be carried over to the nextcycle. More importantly, problem areas need to be identi-fied and addressed to improve the process.
(b) User consultation and market testing
The public consultation work, which ensures the relevanceof this element of the census programme is described broadlyin section B above.
In addition to the consultation needed to establish users’views of the current output and to define their requirementsfor the next census, ongoing consultation and market testingshould be conducted throughout the product design stage. Thiswill allow the census agency to review and refine the tablesuntil the proposed output meets a majority of users’ needs.
(c) Method for protecting confidentiality
A technique for protecting confidentiality must be devel-oped and applied to ensure not only that users receive high-quality data, but also that information provided by individu-als cannot be identified from the data included in the output.
To meet this requirement, various countries have adopteda wide range of procedures. In many cases, the requiredoutcome is achieved by randomly changing output cells withsmall numbers (e.g., less than 3) to reduce the probabilityof an individual being identified. The precise nature of suchprocedures (e.g., what is a “small number”?) should be de-termined by the census agency, bearing in mind its circum-stances, including its stated objectives in relation to confi-dentiality.
A confidentiality algorithm used to determine whether theinformation in a table can be released can be included inthese confidentiality procedures. Where applicable, themethod of protecting confidentiality should be applied inthe tabulation program itself (i.e., the algorithm is built intothe program).
No tables that have not been subject to these proceduresshould be released to people or organizations outside thecensus agency.
(d) Hard copy or electronic dissemination
In many countries, some users of census results will nothave access to computers and will prefer output to be deliv-ered in paper bulletins. Even in the most advanced coun-tries, many users (for example, community organizationsand individuals interested in the population profile of theirlocal area) will wish to receive information in this format.Equally, in countries with relatively low use of computers,it is likely that central Governments and international agen-cies will prefer to receive information in a computer-read-able form.
The challenge for the census agency is to develop sys-tems that allow flexibility in output media. For example, itis possible to develop a standard set of commonly requestedtables for each enumeration area and store these electroni-cally. Simple systems can be developed that allow the userto specify the enumeration area, combination of enumera-tion areas or other specified statistical areas that are of in-terest. The census agency can then deliver the tables for therequested enumeration areas either in hard copy or in elec-tronic form. This method of dissemination also avoids theneed to preprint large numbers of paper bulletins for areasin which there may be only limited interest.
Where a computer-based delivery mechanism is chosen,an investigation into the data formats and media used byclients should be included in the user consultation process.Output should be made available in industry standard dataformats such as ASCII. Where research has shown that alarge number of clients are using particular software (forexample, a common spreadsheet or tabulation package suchas EXCEL), these options should also be provided. Mediacould include floppy disc, CD-ROM, cartridge or magnetictape. Because of the diversity of data formats and mediaavailable, it will not be cost-effective to provide data in amanner to suit all clients.
The Internet can also be used to disseminate data.

164
(e) Suppliers of information technology services
Where a computer-based product is not going to be de-veloped entirely in-house (for example, because of limitedexpertise within the census agency), a process of seekingexpressions of interest from external developers needs tobe conducted. The submissions, often received through atendering process, should be evaluated using a specific setof criteria, including experience of external developers, theirability to comply with the specifications and meet dead-lines, potential return on investment to the census agencyand proposed payment arrangements (see chap. I, sect. G,for details on managing outsourcing).
3. Production strategy
The production strategy for dissemination products shouldinclude a description of the aggregation and retrieval sys-tems used to compile the basic tabulations and references tothe use of these systems. These could include PC-based tabu-lation systems such as PC-SAS, IMPS or Supercross. Someagencies may still use mainframe systems such as TPL(table-producing language), although these systems aregradually being phased out in preference to PC or mid-rangesystems. A similar description of the system (e.g., UNIX-based or PC-based) to be used to disseminate the tabulateddata also needs to be included.
The key production activities include the following:
(a) Development of geographic elements;
(b) Classifications;
(c) Data products;
(d) Software products.
(a) Development of geographic elements
A key attribute of census data in most countries is that itprovides information relating to small areas (such as EAs,or aggregations of small numbers of EAs). To maximize theusefulness of such information it is important that the fol-lowing are developed:
(a) Geographic database;
(b) Time series concordance;
(c) Map dissemination system.
(i) Geographic database
The geographic database should store data relating to cen-sus geography. The data stored on this geographic databaseshould be primarily the codes and labels that relate to thegeographic regions used to output census data. Other dataitems can also be stored, such as the following:
(a) Comparability codes to indicate comparability be-tween a current enumeration area and its counterparts inearlier censuses (see below);
(b) Latitude and longitude of the centroid of the enu-meration area;
(c) Total area of the enumeration area (sq km).
(ii) Time series concordance
A time series concordance can be used to align enumera-tion areas from earlier censuses to the current census bound-aries. Changes to enumeration area boundaries will impacton comparability of data across censuses.
(iii) Map dissemination system
A map dissemination system can be provided to satisfyrequests for hard-copy and/or digital maps. An on-demandmap printing service, which could provide bound sets orsingle maps, may also be outsourced. The digital bound-aries (where relevant to user needs) could be made avail-able in common industry formats and the agency may chooseto outsource this service to maximize the choice of file for-mats for clients. The census agency may also choose to in-clude a topographic map base in products to add value tothe analysis and display of statistical data.
(b) Classifications
A key attribute of the work of a national statistical agencyshould be to produce output that presents the data accord-ing to standard classifications. A starting point for the con-sideration of these standards should be international classi-fications that have been issued by various organizations.Examples include the International Standard Classificationof Occupations (ISCO), issued by the International LabourOrganization, and the International Standard Classificationof Education (ISCED), issued by the United Nations Edu-cational, Scientific and Cultural Organization.
Within these guidelines, it must be understood that outputinformation can never be more detailed than the informationcollected from respondents and transformed by coding in theprocessing phase. For example, some responses may not beable to be coded to the most detailed level of a particularclassification because the level of detail in the response is notsufficient. In these cases, a higher-level code in the classifi-cation (e.g., at minor or major group) may be allocated.
In developing the output classifications, the followingsteps should be covered:
(a) Review of classifications to cover new topics andchanges in concepts;
(b) Development of a directory of classifications to en-able effective access by users;
(c) Development of a dictionary of census terms to assistusers’ understanding of the data items.
(c) Data products
Data products refer to the tabulations, and the productscontaining them, that are produced from the final census data.
Standard products are those developed to satisfy the ma-jority of census data users who want basic, easy to accessdata (e.g., publications) for distinct geographic areas, suchas provinces or capital cities, or administrative areas suchas regions. The tabulations in these publications provide

165
basic cross-classified data on subjects such as age and sex,labour force characteristics and family composition. Elec-tronic format should also be provided for users who want toextract from these tabulations, or add data from othersources.
Subpopulation or thematic products are those designedto focus on particular populations of interest to more spe-cialist users. These products are again sets of standard de-fined tabulations that provide the data in easily accessibleformats such as publications, and often include some de-scriptive information.
Customized output is provided for users whose require-ments are more specialized and cannot be satisfied by stan-dard tabulations. These users provide the specifications forthe tabulations they require, and the data output is producedon a consultancy basis.
Production of data products includes the following:
(a) Development of prototypes based on results of userconsultation. This may be an iterative (or dynamic) process,with ongoing revisions being applied as further consulta-tion takes place. It is important that the outcome of eachiteration is fed back to all participants to ensure all users aresatisfied with the final outcome;
(b) Coding and production of prototype tables using testdata. This will also serve as a test for the production andoutput systems;
(c) Finalizing tabulation content. It is important to set adefinite date for this and to adhere firmly to this date;
(d) Live data production for standard output;
(e) Release of the consultancy service (for customizedtabulations, where appropriate);
(f) Specialized table production for specific products.
(d) Software products
This section relates to the software developed to accom-pany and/or deliver products based on computer platforms.In most cases, it is expected that the statistical material in-cluded in these products will be based on the basic tablescompiled for the standard products.
Developing software includes the following tasks:
(a) Identify the broad nature, structure and content ofthe product;
(b) Determine software developers (internal and/or ex-ternal consultants);
(c) Specify the detailed design and functionality of thesoftware;
(d) Acquire necessary hardware;
(e) Develop and test software with test data (where pos-sible, involving end-users in processes such as beta versiontesting);
(f) prepare training programmes/tutorials to accompanythe product, such as computer-based training material, con-text-sensitive help files and hard-copy user manuals.
4. Quality assurance
It is essential that the data flowing from a census and theproducts that include such data are of the highest possiblequality (particularly with respect to accuracy). It is there-fore recommended that a first step in the management ofthe dissemination phase of a census is development of aquality assurance strategy.
The following points have been identified as critical toensuring that the required quality data and products are de-livered to clients.
The accuracy of information provided by respondents andcoded by the processing system cannot be improved by thedissemination system. The objective of the quality assur-ance system should be to prevent the introduction of errorat this stage in the cycle.
However, even in the best-managed census, errors maybe detected in the dissemination phase. Decisions will needto be made about how to deal with these errors. The deci-sions will need to be made with regard to the nature andextent of the errors. In some cases, it may be decided toleave insignificant errors in the final data rather than delaythe release of data, which will impact on the timeliness as-pect of overall data quality.
(a) Documentation
All production and validation procedures should be fullydocumented to ensure census agency staff follow appropri-ate procedures and fully understand these procedures. Thisdocumentation, together with quality assurance check sheetscompiled for each product, will readily assure users that theyare receiving a high-quality product.
The production team must understand the quality assur-ance strategy’s purpose. The team should not see it as amechanical application of procedures that may or may notcontinue to be appropriate but as a key component of itswork.
(b) Skilled staff
The production team should be fully trained in the pro-duction and/or tabulation and output platforms, with clearlydefined objectives and deliverables. Procedures should bediscussed and clarified. Team members should be encour-aged to suggest improvements.
(c) Validation procedures
Procedures for data validation and systems and/or soft-ware acceptance testing must be implemented to ensure thedetection and correction of any defects contained in the dataor software. The strategies should be oriented towards es-

166
tablishing a system with the objective of preventing errorsor defects from occurring. In contrast to earlier stages ofthe cycle, it is probable that any errors identified in the out-put quality assurance process indicate a failing of the sys-tem. Thus, if (or when) errors are identified, the system mustbe checked and revised and tables rerun to remove all er-rors.
One useful approach to this phase is the development of aset of standard tables against which the output for specificareas can be compared. These tables could be developed sothat they are used at all levels of geography (e.g., enumera-tion area, region and province) the first time such a levelbecomes available. If no errors are identified, it can be as-sumed that the system is functioning correctly and a sam-pling approach be followed for validating later productionat that level. Where it is expected (or suspected) that a changebetween areas (for example, from one province to another)may increase the probability of systemic error, it may bedesirable to reuse the standard tables, again at each level ofgeography.
(d) Timeframe
As indicated elsewhere in the present handbook, timeli-ness is a key attribute of quality. The timetable for, and ac-tivities involved in, the validation and production processesshould be developed in consultation with all staff membersworking in the dissemination projects of the census (andother projects that are stakeholders of dissemination). Theprocedures should also be fully documented.
(e) Dependencies
Any problems that have the potential to affect the sched-ule (for example, in earlier projects on which the dissemi-nation phase depends) should be identified and solutionsput in place as soon as possible.
In particular, where agencies have distinct sections re-sponsible for the various tasks associated with product de-velopment, it is important that dependencies are identifiedand communication strategies put in place to ensure a smoothflow of data through the processes. For example, criticalelements such as geography or classifications may be de-veloped and produced by other stakeholders in the statisti-cal agency. Therefore, clearly defined objectives and ongo-ing communication are essential to ensure that deadlinesare met.
There are a number of issues relating to standard classifi-cations that will impact on the preparation of the data andthese should be clearly defined and understood by the dis-semination project team prior to commencing production.These may include the following:
(a) New concepts and variables. New topics that are col-lected in the census may result in additional classificationsand/or new variables. Census concepts and classificationscan change over time, often owing to the requirement tofollow international or the agency’s own standards;
(b) Modified classifications. The need for different out-put categories is often highlighted by responses receivedfrom census tests and dress rehearsals; questions that elicitobscure or widely varied answers may be restructured toavoid respondent confusion.
New and changed classifications will affect comparabil-ity with data from earlier censuses and will thus impact onthe production of any time series data. Where the changesto classifications are significant, concordances should bedeveloped to assist users to compare census data over time.
5. Development and testing of procedures
Once plans for the overall dissemination cycle and thequality assurance strategy have been established, the devel-opment and testing of the dissemination system can pro-ceed. Recommended procedures for the identification of userrequirements for dissemination have been described in sec-tion 2 above. The present section describes the managementof a development path to be followed, which will ensurethat those needs are satisfied according to the prescribedstandards of quality.
It is recommended that a maximum level of testing ofdissemination systems and procedures be conducted usingdata obtained from the final test (dress rehearsal) conductedfor the current census. If this dress rehearsal strategy isemployed, the data presented for testing from the dress re-hearsal will have been subject to the full range of “mainevent” processes. That is, the dress rehearsal processes willhave been geared to the nature and content of the censusitself and will provide data for the majority of data items,with a considerable range of values for each data item.
If dress rehearsal data is not available, or does not satisfythese requirements, then data from any of the census testsshould be used. The key management objective should beto ensure that all processes used in the production of outputfrom the census itself should have been tested before theiruse in a production environment.
6. Presentation guidelines
While not necessarily agreeing that the “medium is themessage”, there is a vast amount of published material inthe field such as communications theory. This indicates thatthe way in which information is presented will have a con-siderable impact on the way in which readers of the mate-rial will interpret (or misinterpret) it. It is beyond the scopeof the present handbook to review this body of work, butthe points below are suggested as matters for considerationin setting more detailed objectives for an output programme.
It is noted that, in some countries, there will already beestablished standards for the presentation of statistical ma-terial by the statistical agency. In these cases, the censusproducts should follow these guidelines as far as possible.The incorporation of these standards into census productswill be greatly assisted if standard style sheets are avail-able.

167
A key point to note is that many of the issues to be con-sidered will be crucially affected by the systems, notablycomputer systems, available for the production of censusoutput. There will be far more flexibility available under afull desktop publishing system than with a combination ofoff-the-shelf word-processing and spreadsheet packages.However, it may be the case that the latter are quite suffi-cient to meet the core needs of users in a timely and cost-effective manner.
The detailed issues that follow require consideration inthe light of each country’s circumstances. They will gener-ally be more applicable to hard-copy publications than toelectronic dissemination processes (which, prima facie,implies a relatively sophisticated information technologyenvironment with associated flexibility). They include:
(a) Landscape or portrait orientation, which depends onindividual table requirements, for example:
(i) A cross-classification with a relatively smallnumber of columns may well fit in a portraitformat, whereas a larger number of columnsindicates a landscape orientation;
(ii) There are well-recognized difficulties in link-ing the data in more distant columns back tothe stubs describing that data;
(iii) If there are many rows in a table, the need formore frequent repetition of the table stubs mayadd considerably to the number of pages in(and, thus, cost of) a publication;
(b) Explanatory notes should be provided in all releasesof information to ensure that users of the census data areaware of the following:
(i) Important contextual information such as de-tails about the collection of the information;
(ii) The scope and coverage of the collection;
(iii) Interpretation of technical terms used in thepublication and any limitations affecting theaccuracy of the data;
(c) Further assistance to users of the data will be pro-vided by presentation of a detailed table of contents and,where the product is large, an index. The extent of theseelements of the product will be influenced by both the pro-duction facilities available to the census agency and the re-sources devoted to the individual product;
(d) To give an authoritative and professional look andfeel to the products, a professional cover page should bedesigned. This will assist in creating a link to the authorityof the census agency.
7. Storage issues
It is desirable that a retention period is specified for allcomputer-readable data, supporting programmes and docu-mentation to ensure that a service can be offered to clientsin the future. This should be the responsibility of the area of
the census agency that produces the data, which could in-clude:
(a) Statistical data for internal (census agency) use, thatis, current data retained because of a need for further use inprocessing, back-up and/or input to other areas;
(b) Copies of base material produced for output productsto enable re-compilation of those products, if required, fordisaster recovery or other functions;
(c) Non-statistical data, that is, programs, test packs,metadata and reference data required to support statisticaldata systems or as an information source.
The details of such a strategy will be greatly influencedby a wide range of factors, including the information tech-nology culture and facilities of the country and the censusagency. The nature of the data files created in the dissemi-nation phase and the laws of the country relating to storageof official records will also have an influence. In view ofthis complexity, no suggestions are made in the present hand-book relating to these strategies.
8. Management of intellectual property
Where a country uses a dissemination strategy basedheavily on cost recovery, especially where this is combinedwith the heavy use of computer-based products, it is desir-able for the census agency to ensure that its rights in respectof ownership of intellectual property are properly protected.
Census software development should comply with thestandard intellectual property protection practices of theagency. For internally developed products, written assign-ment of intellectual property rights signed by the agency’semployees who create them should be procured. For exter-nally developed products, ownership of intellectual prop-erty rights must be clearly defined in the contract.
Conditions of sale documents, copyright and trademarknotices should appear on the software and the packagingand in user manuals. Any licence agreement to be signed byclients must be in accordance with the agency’s policy onownership and licencing of intellectual property.
D. MARKETING STRATEGY
1. Introduction
Marketing has not been one of the traditional functions ofstatistical agencies. However, many Governments now re-quire that agencies recover some of the costs of their opera-tions through charging for statistical products and services.Some of the reasons why pricing has been introduced in-clude the following:
(a) To enable the demand for statistical products to beused as a reliable indicator of how resources should be used;
(b) To encourage users to address their real needs forstatistical products and services;

168
(c) To relieve the general taxpayer of those elements ofthe cost of the statistical service that have a specific andidentifiable value to particular users.
In general, where pricing has been introduced, policiesneed to be developed regarding who is to be charged, howprices are to be calculated and the provision of access todata by the general community as part of a community ser-vice obligation. In this regard, basic statistics can still bemade available through such means as press releases andcopies of statistical publications and output in libraries andlocal community centres.
With the introduction of pricing has come the need toundertake marketing. Many people view marketing as ad-vertising and selling of particular products. In fact these areonly a small component of marketing. Marketing is seeingthe entire business of the statistical agency from the client’s(the users of the data) point of view. Marketing manage-ment is the planning, implementation and control ofprogrammes designed to create and maintain relationshipswith target markets for the purpose of achieving organiza-tional goals.
Marketing involves finding out what the client needs, andplanning and developing a product or service that will sat-isfy those needs. It is the process of conception, pricing,promotion and distribution of products and services thatsatisfy individual and organizational objectives. Sales areone part of promotion and an important component of themarketing mix. The sales strategy is discussed in section Ebelow.
2. The marketing strategy
The census agency’s marketing department, or a con-tracted marketing consultant, should have the responsibil-ity for the development and implementation of a coordi-nated marketing strategy and promotional programme. Inaddition to undertaking market research and providing feed-back for the product development team, the marketing de-partment should report on the progress of individual pro-motional activities, evaluate the effectiveness of these ac-tivities and adjust the marketing programme as required.
The aim of the marketing strategy should be to positionthe census agency and its products and services as the pri-mary source of quality demographic and socio-economicinformation on the population. The major objectives of thestrategy can be to increase the use of census data in the com-munity and to generate revenue within specific time-frameswithin a set budget. Strategies to achieve these objectivesmay include the following:
(a) Maintain the relationship with the existing user (orclient) base and further explore other identified market seg-ments;
(b) Extend the market through focused promotion to high-potential untapped sectors where the census agency has onlyachieved low penetration to date;
(c) Develop new census products and services to meetemerging needs in the market by extending the existing prod-uct range;
(d) Educate potential users about the census product andservice range and possible benefits and applications of cen-sus data in research, planning and decision-making;
(e) Make the data widely accessible to members of thecommunity through public and educational libraries.
3. Marketing activities
Marketing activities commence with seeking to under-stand users and their needs, and conclude with providingrelevant services. The key features of marketing activitiesinclude the following:
(a) The market, both existing and potential users;
(b) Market research;
(c) Product development, production and pricing;
(d) Strategic marketing plan;
(e) Dissemination;
(f) Sales plan;
(g) Promotion;
(h) Public relations;
(i) Product launch;
(j) Evaluation and ongoing review.
(a) The market
In broad terms, the market for census products and ser-vices can be defined as any person, organization or busi-ness enterprise interested in demographic or socio-economicinformation. This may be for the community as a whole orany group within the community, or for a particular geo-graphic location.
The identification of major user segments can be basedon the buying behaviour and the type of relationship theseusers seek with the census agency. These segments may in-clude the following:
(a) Key users;
(b) Subscribers;
(c) Ad hoc users;
(d) The media sector;
(e) Competition users.
(i) Key users
These users are important to the census agency from astrategic and/or business point of view. It is important thatthe agency establishes a close ongoing relationship and regu-

169
lar contact with these users. The client service logic thatunderpins this group includes a combination of understand-ing, empathy and sharing of user needs. Flexible, creativesolutions should be used that call upon the full capability ofthe organization to service those needs. The key user seg-ments may include other government departments, educa-tional institutions, finance and other business sectors, andmarket research-consulting sectors.
A special category of key users is “lifeline” users. Theseare defined as strategically important organizations that havethe potential to influence continuing political or opinionleader support for the agency and/or contribute significantlyto revenue raising.
(ii) Subscribers
These are users that regularly do business with the agencybut usually in a repetitive manner and whose needs are forthe most part satisfied through the regular supply of stan-dard products and services. The client service logic thatunderpins this group includes reliable, predictable and con-sistent service, supported by a loyal, stable and long-termrelationship. The subscriber’s segment comprises users sub-scribing to publications and other standard regularly releasedproducts or services such as on-line statistics.
(iii) Ad hoc users
These are users that make occasional or one-time contactor whose requirements are easily met through the provisionof individual products or customized services. The clientservice logic that underpins this group includes quick, reli-able, predictable, consistent, responsive, informative andaccurate service.
(iv) The media sector
There is a need to have strong and coordinated links withthe working media to promote broad public awareness ofthe agency and its products and to contribute strongly to“public good” outcomes. This sector may be dealt with aspart of media liaison through a public relations unit withinthe agency.
(v) Competition users
Competition users are those that have a number of choicesto satisfy their information needs. Potential competitors mayinclude:
(a) Market research organizations that are able to tailortheir services to satisfy the needs of individual users;
(b) Consultancy service providers that are able not onlyto provide data but also to conduct analysis and interpretresults;
(c) Secondary distributors that either distribute censusdata or package the data into applications developed for user-specific needs (e.g., client profiling and location analysis).
(b) Market research
Market research prior to the development and design of aproduct or service is essential to ensure that output is alignedwith the needs of the market. Market research can monitorthe performance of products and services and measure andanalyse consumer attitudes. It can also analyse competition,and gather intelligence to feed into the redesign of productsand services and the development of new products and ser-vices. In many cases, appropriate information may alreadyexist in previous research that has been carried out (whichcan include user consultation).
(c) Product development, production and pricing
A good knowledge of the demands of the intended targetmarket, as a result of market research, will dictate the way inwhich the product or service is designed, produced and de-livered. Product development should not proceed before acomprehensive business plan (as discussed in sect. B above),which incorporates the findings from market research is for-mulated. Individual product business plans will provide theinformation necessary to determine funding requirements andthus form the basis of pricing for the product.
(d) Strategic marketing plan
The marketing plan can provide a strategy to communicateeffectively with target market segments. A sound understand-ing of the potential market is necessary before a marketingplan can be developed. A strategic plan highlights opportuni-ties within the market and expands the use of the products andservices. Promotional plans flow from the strategic marketingplan and they represent a measurable implementation of thisplan. A consistent marketing approach will ensure that usersreceive the right products at the right price in the right place,with promotion appropriate to the product and the market.
(e) Dissemination
The most appropriate methods of dissemination are thosethat directly meet the needs of the market. A distributionprocess should be established to deliver products and ser-vices in the most useful, timely and cost-effective manner.It should also offer users alternative methods of delivery,which may include regular post, door-to-door courier, col-lection from a bookshop or personal delivery by sales staff.
(f) Sales plan
A sales plan is contingent on the outcomes of the strategicmarketing plan and is driven by the market. It articulates howa census agency intends to sell its range of major products andservices to the market; this is discussed in section E below.
(g) Promotion
The promotional implementation plan should aim at in-creasing the awareness of products and services within themarket place and communicating their benefits. It provides

170
details of promotional strategies and tactics, and the pro-motional material that will be made available. Promotionalactivities may include direct mail and advertising campaigns,attendance at trade shows, conferences and user seminars,promotion through the Internet and public relations activi-ties. Promotional materials can include brochures, posters,demonstration disks and case-study examples. These canform the basis of sales kits for use in the selling programme.
A useful promotional tool is a regular newsletter. A news-letter provides a means of communicating with users and,through response to various articles and questionnaires, abetter understanding of their needs. An added benefit is thatthe subscriber list can be built upon and become a deposi-tory of useful user information. The list can be segmentedand used to tailor approaches.
(h) Public relations
A public relations unit is generally established to achievea high positive profile for the census agency in the mediaand the community. It can assist with improving publicawareness and understanding of statistics, and enhance andcoordinate the agency’s corporate image. The public rela-tions unit generates product media releases, monitors andmanages media enquiries, liaises with journalists and othermedia personnel, and undertakes promotional launches andpublic awareness campaigns (see chap. III, sect. A, for fur-ther details).
(i) Product launch
This is the stage at which products and services enter themarket place. Products and services should be launched intothe market to ensure maximum community awareness ofdata availability. Both the marketing and the public rela-tions departments generally coordinate product launches. Ahigh-profile government or business personality may be in-vited to open the proceedings to ensure maximum mediaattention.
(j) Evaluation and ongoing review
Evaluation allows the agency to monitor the performanceof products and services within the market place and to en-sure that market needs are met. It is therefore essential thatthe interaction of all products and services within the mar-ket place is evaluated. It is also important that evaluation isundertaken for every stage of the marketing cycle. Withevaluation and ongoing review, the agency can keep up withchanges in the market place and identify improvements andother opportunities.
4. The marketing plan
An effective marketing plan is the cornerstone of a suc-cessful dissemination programme. The key factors of a mar-keting plan are to assess the internal and external situation,to define goals that are qualitative and quantitative and toextrapolate from those goals definitive action plans.
Marketing planning is both strategic and operational. Stra-tegic planning focuses on long-range issues such as howthe mix of products can vary in different stages in the lifecycle of the product range. The operational plan is shortranged. It should be results oriented and deal with facts ratherthan theory. There are likely to be a number of operationalplans associated with a strategic plan, with a distinct opera-tional plan for each key or flagship product.
The following attributes should be considered in the de-velopment of a marketing plan:
(a) Realistic. Undue optimism can lead to unrealisticexpectations by management. The acceptance and use of amarketing plan occurs only when the costs and sales targetsare realistic;
(b) Comprehensive. Detailed analysis of market condi-tions and selecting appropriate strategies and detailed tac-tics will ultimately be reflected in the sales figures;
(c) User-friendly. A marketing plan is a communicationtool and, as such, it should be easy to read and understand,with the major points well-defined. While other areas withinthe organization, or external consultants, may assist in thedevelopment of the plan, those who have the responsibilityfor its implementation should write it;
(d) Organizational commitment. The marketing plan isnot for the exclusive use of the marketing department. Whilemanagement will have the final approval of a marketingplan, the commitment of all stakeholders within the organi-zation who use the marketing plan will impact on the re-sults;
(e) Ongoing review and improvement. The market isdynamic, and regular monitoring and review of the plan isnecessary to ensure its continued success. New marketingopportunities and challenges can exist in those markets pre-viously regarded as inactive. Economic, political and com-petitive environments require different objectives and strat-egies. Revisions to the marketing plan should reflect anychanges in these environments.
The key elements of a marketing plan are as follows:
(a) An analysis of strengths, weaknesses, opportunitiesand threats;
(b) Planning assumptions;
(c) Marketing objectives and strategies;
(d) Marketing mix decisions;
(e) Prices;
(f) Distribution;
(g) Promotion;
(h) Programme timetable;
(i) Budget and expected revenue;
(j) Monitoring and evaluation.

171
(a) Analysis of strengths, weaknesses, opportunities and threats
An analysis should be conducted of the strengths and weak-nesses of the census programme, its products and services,and opportunities and threats that are present in the marketplace. Such an analysis is based on information gained fromthe user consultation process, market research results, andexperience with and knowledge of the market place.
(i) Strengths and weaknesses
These can be determined from internal factors such as thesize and structure of the agency, the market share currentlyheld, cost structures and marketing information.
Strengths may include the corporate image of the agencyas a reliable and authoritative data source, the comprehen-sive nature and quality of census data and the availability offree technical support. Any strengths identified should be,at the least, maintained and, ideally, improved upon.
Weaknesses may include the time lag between the collec-tion and the release of data, a public perception that pricesare too high, and product limitations such as lack of user-friendliness. Any factors identified as weaknesses shouldbe addressed and responded to as soon as practicable.
(ii) Opportunities and threats
These are determined from external factors such as over-all market size, competitive products, political or social in-fluences and technological developments.
Opportunities may include growing market awareness andwider acceptance of analytical techniques in planning, re-search and decision-making. This will lead to a greater needfor data, and a corresponding growth in the use of the Internetto provide a viable on-line delivery channel.
Threats may include a perception that the informationprovided by government organizations should be free ofcharge. They may also include the uncontrolled reselling ordistribution through computer networks of census productsthat are delivered on compact disks, floppy disks or on-line.
(b) Planning assumptions
During development of the marketing plan, a number ofassumptions are made. The recommendations in the mar-keting plan are based on information from historical re-search, evaluation and experiences of earlier census outputprogrammes, user consultation and market research. Themarketing plan expands on the broad strategic directionoutlined in the census business plan, and the financial esti-mates and revenue projections contained therein. The planacknowledges that the key areas for improvement identi-fied through user consultation have been addressed. An as-sumption that the current broad economic conditions willprevail during the output cycle can also be made, althoughthis assumption should be subject to continued scrutiny.
(c) Marketing objectives and strategies
The marketing plan should clearly define the objectivesand contain detailed sales and revenue goals. A number ofstrategies may be adopted to achieve the objectives. A growthstrategy may be to explore other identified market segmentsto attract new clients and to extend the market through fo-cused promotion to high-potential untapped sectors. A com-petitive strategy may be to differentiate census products andservices along the unique dimensions that are widely val-ued by existing users.
(d) Marketing mix
The range of census products and services to be devel-oped should be predicated by user demand, that is, in re-sponse to the results of the user consultation process. Therange should be designed to cater to the demands of as manyusers as possible. It may be found that a range of electronicproducts are more suitable than an all hard-copy outputrange, or that less data or more limited functionality are pro-vided to allow faster delivery.
Each product will have its intended audience, for example:
(a) Reference publications, such as a census dictionary,are intended for users who need specific information oncensus definitions of terms and classifications (i.e., mostcensus data users);
(b) Statistical publications containing summary statis-tics for large geographic areas are generally suitable for sub-scribers, the media and libraries;
(c) Geography products, such as maps and digital bound-aries, are targeted at both government and private sectorusers and educational and research organizations;
(d) Electronic products that provide basic tabulation soft-ware may be useful for educational organizations and li-braries. The more complex products, which provide sophis-ticated manipulation and mapping software, are aimed atusers who need access to census information for small ar-eas for detailed analysis;
(e) Consultancy services are targeted at users whose needscannot be satisfied by standard census products and services,generally from government departments and the researchcommunity.
(e) Prices
An existing pricing policy may dictate the recommendedretail prices for census products and services. The price of aproduct could also depend on whether it is considered acommunity service obligation, in which case it may be madefreely available through libraries. Alternatively, it may beconsidered a commercial product, the price of which couldbe determined on a full cost-recovery basis. Market researchmay be required to determine users’ price sensitivity for thesecommercial products.

172
(f) Distribution
Distribution is market coverage, or the channels used toget the product to its market. The physical distribution isthe flow of materials such as transportation, warehousingand inventory control.
The following are examples of channels that may be usedto disseminate census products and services to the end-users:
(a) Subscription support units, which fulfil subscriptionorders for census publications;
(b) User managers, who are staff recruited to developand maintain relationships with key users;
(c) Sales force, for the delivery of major products andfield support for the user managers;
(d) Statistical support units, which deliver standard cen-sus services and customized data consultancies;
(e) Bookshops within the agency, which can provide over-the-counter and mail order-sales of census publications;
(f) Libraries, which are a source of free census informa-tion for the general public;
(g) Public relations unit to service the media sector;
(h) Internet for on-line dissemination of census data.
(g) Promotion
A generic promotional message could focus on the ben-efits of using census products and services and how differ-ent needs for demographic and socio-economic data on thepopulation can be satisfied by the agency. The message canfocus on the fact that the information is readily available inthe form suited to specific requirements. This can be de-tailed or summarized information, with extensive choice ofgeographical coverage and media delivery options. Specificpromotional messages can be developed for individual cam-paigns of key products and services.
Promotional activities may include the following:
(a) Direct mail and advertising campaigns for generalawareness raising and product-specific promotions aimedat specific target groups;
(b) Trade shows, conferences and seminars. Suitable ven-ues can be selected that can be used to distribute censuspromotional materials, demonstrate the census product rangeand outline possible applications and benefits of census datato specific user groups;
(c) Public relations activities. These can introduce cen-sus products to the broad community and involve medialiaison, coordination of press releases and official censusproduct launches;
(d) Personal contact, which is an integral part of the totalpromotional effort. Visits to users by sales staff and usermanagers can be used to gain a better understanding of spe-cific user needs, to demonstrate product options and to pro-vide recommendations on best solutions;
(e) An Internet Web site. This medium can provide ex-tensive information on census products and services, theirapplications and benefits.
Publication covers, packaging and other promotionalmaterial should be designed to allow easy brand identifica-tion. A creative consultant may need to be contracted forthis exercise. A wide range of promotional materials can beproduced, including the following:
(a) Brochures, posters, demonstration disks, case-studyexamples and sales kits;
(b) Reference materials, such as pricing documents anddetailed product briefs;
(c) A directory of census products and services, whichcan be used as a main reference document to educate pro-spective buyers about the range available;
(d) A newsletter, which can be used to promote theseproducts and services;
(h) Programme timetable
The marketing department’s primary responsibility is todetermine and prioritize essential marketing activities. A time-table should be developed and strictly monitored to cover thekey phases of the marketing programme and major productreleases. This is essential to ensure that key activities are com-pleted as scheduled. It is recommended that regular progressreviews be held to uncover problems that may have arisen,and that corrective action be taken before they become anobstacle to achieving the marketing objectives.
(i) Budget
The marketing department should prepare a proposedbudget that reflects projected costs associated with the pro-posed marketing plan and that reflects existing market con-ditions and opportunities. The budget allocated for the ex-ecution of the census-marketing plan should be strictlymonitored in a management information system. This shoulddetail all expenditure associated with promotional activi-ties and materials, and all sales revenue generated. Someexamples of items to be included are:
(a) Advertising;
(b) Sales promotion (trade shows and conferences);
(c) Market research;
(d) Creative concepts;
(e) Promotional material (brochures, posters and pack-aging);
(f) Human resources development;
(g) Administration costs.
The marketing department may choose to design a bud-get that reflects monthly budget forecasts rather than quar-terly or annual budget forecasts.

173
(j) Monitoring and evaluation
The effectiveness of the marketing programme must be ob-jectively evaluated against key performance indicators, and theanalysis of the information should be used to adjust the mar-keting programme as required. Key areas to be monitored are:
(a) Sales volume and value of each product and/or ser-vice;
(b) Response rate to promotional activities and conver-sion rate;
(c) Technical assistance queries;
(d) Research on census data users within key target sec-tors;
(e) Market feedback and competitor activity.
It is recommended that these evaluations take place on amonthly or quarterly basis. The use of regularly scheduledevaluations provides an opportunity to revise tactics to en-sure that the objectives will be met. Measuring objectivesagainst actual results identifies where variances have oc-curred; corrective action can then be taken to bring pro-jected and actual results into line.
E. SALES STRATEGY
1. Introduction
The intention of the present section is to provide guid-ance to those agencies that may be in a position wherebythey can sell census products to clients. It is recognized thatsome of the techniques outlined in this section may not beappropriate for some countries but agencies can adapt themto suit their own circumstances.
The major objective of a sales strategy is to create an over-all approach to the selling of major products and servicesby a sales team. The use of professional selling techniques,and selling the product suite or related services best suitedto the client’s needs, is essential to the success of a salesstrategy. In terms of marketing, sales is a vital componentof promotion. A detailed marketing, promotional and com-munication strategy should be in place to support theagency’s sales force.
Making a sale should be seen as the beginning or the con-tinuance of a client relationship, not the end, and adequateresources should be provided in the sales budget to createand maintain this relationship.
2. The sales strategy
Sales strategies generally focus on the sale of particularproducts to the wider community. However, while any sell-ing activity is primarily associated with products or a prod-uct range, the strategy may be to better understand the dif-ferent buying logic of the various segments in the market
place, and the needs of the clients and sectors within thosesegments. Understanding clients’ motivation, their applica-tion of the data and, hence, their buying logic, are all funda-mental to improved marketing performance.
The sales teams should focus on satisfying the total needsof clients, not just achieving product targets. Specific cam-paigns should be designed to increase the volume of leadsfor packaged products. In some cases, the market for a par-ticular product is narrow and this can be pursued with anindividual campaign.
(a) Market segmentation
The primary market segments need to be identified forthe management and focusing of sales activities (e.g., keyclients, subscribers and education). The segments are deter-mined by examining the “buying or client service logic” ofvarious groups of the agency’s clients, and then clusteringthose with common elements into main groups.
Segment management plans should be prepared for eachidentified segment, focusing on the various objectives, strat-egies and processes necessary to achieve the sales outcomesrequired for each segment, and to ensure the new marketopportunities are fully explored. The sales effort shouldclosely align and support these segment management plans,as well as support the various lower-level sector and prod-uct marketing plans. The sales strategies may therefore bedifferent for each of the segments.
Each segment or product plan should outline the broadissues related to the particular segment and/or the sale ofthe particular product. The plans follow the same broadoutline, including product targets for the year and product-and/or segment-specific strategies. These strategies includetactics for sales to both new and existing clients. A specificpromotional timetable for each product should be developed.
(b) Distribution channels
A sales system generally depends on a sales team but mayalso employ other means of selling such as direct mail ortelemarketing. Channels of distribution can change over timeand the use of new channels of distribution offers an oppor-tunity to gain a competitive edge over other providers. It isneither efficient nor wise to limit distribution to face-to-face personal selling.
(c) Sales and client databases
Direct interaction with prospective clients has replacedmass marketing. With the advent of database marketing,detailed profiles of clients can be developed using geo-graphic and demographic characteristics and their purchas-ing history. Special products, services or offers can be tai-lored to increase return on investment and client satisfac-tion. Direct advertising not only invites a response fromprospective clients but also serves to increase general aware-ness of the agency and its product range.

174
A sales and client database can be established to build upan understanding of clients’ needs and their purchasing pat-terns. This database will provide information crucial to boththe marketing section and the product developers. The cli-ent database can be used for the following purposes:
(a) To stimulate repeat sales. If the product fits the cli-ents’ needs, they may purchase additional copies for differ-ent departments or regional offices;
(b) To increase the success of product line extensions. Anew product, using a successful brand name, can be easilylaunched to an existing market;
(c) To cross-promote different products. By introducingclients who purchase one type of product to other opportu-nities, perhaps by distributing a catalogue of the full prod-uct range;
(d) To build client loyalty. By offering other products,services or benefits that are especially selected to fit theirindividual requirements.
Sales can be achieved through product directories or cata-logues, which provide response mechanisms for clients toorder a product direct, to express interest in further infor-mation or to request a personal product demonstration to becarried out in their own office.
(d) Cross selling
A strategy to institute a programme of cross selling toexisting clients should also be explored. Many existing cli-ents, particularly in the private sector, may use only one (orfew) products or services. Sales staff should be encouragedto call on any existing client base with the objective of crossselling products and services.
3. The sales plan
The aim of a sales plan is to describe how the agencyintends to sell its range of major products and services tothe market.
The sales plan should provide details of a sales strategyfor each major product and service, and recommend anevaluation approach to these strategies. The selling processmust (a) satisfy the needs of the client (b) aake the sale, thatis, convert the prospective client’s interest into a purchase;(c) develop an ongoing relationship.
The sales plan should continue to evolve and be suffi-ciently flexible to accommodate movements in the market,variations in promotional strategies and changes in theagency’s product line and corporate direction. It should bereviewed in the light of sales data analysis, marketing plansand information on the market.
The major aims of a sales plan are as follows:
(a) To outline the responsibilities of the sales unit;
(b) To create an overall strategic approach to the sellingof major products and services;
(c) To detail a sales strategy for each major product andservices.
(a) Sales objectives
The sales objectives should work directly towards fulfill-ing the major marketing objectives. Objectives should bebroken down so that each sales area, each salesperson andeach product or product line has objectives that must bemet. The objectives should be time and quantity, for ex-ample, to obtain a certain amount of sales (either quantityor revenue) by the end of June 2000. Objectives must beclearly defined so that results can be easily measured. Forexample, indicating the month or quarter for each of thefollowing can establish sales objectives:
(a) All products and/or all services;
(b) Strategically critical products;
(c) All distribution channels;
(d) By regional sales team;
(e) By each salesperson.
The principal objective of any sale is client satisfaction.This is not achieved until the client receives and success-fully uses the product or service. To ensure this, the agency’ssalespersons should track the order through the organiza-tion, keep the client informed of progress, possibly partici-pate in the delivery, installation and training, and providefast responses to any client questions or complaints. Withthis service effort, a solid relationship for future business orreferrals can be built.
The following are examples of sales objectives:
(a) Achieve and exceed revenue targets for key products;
(b) Implement an effective programme to cross sell ma-jor products and services to the existing client base;
(c) Increase understanding of major products and ser-vices within selected sectors to increase client base;
(d) Continue to expand the retail bookseller market forselected publications.
To achieve these objectives, it is necessary to adopt salesand promotional strategies that will allow the agency (a) togenerate new business and find new clients (growth com-ponent), and (b) to compete successfully in the market place(competitive component).
Some general sales strategies to help achieve sales objec-tives may include:
(a) Developing the sales presentation skills of the salesstaff, and ensuring that there is adequate product trainingand infrastructure support in the sales centrres;
(b) Using direct marketing techniques to generate salesleads;
(c) Setting up sales demonstrations in-house and at theclient’s premises.

175
4. The selling process
(a) The selling function
Personal selling is a highly selective form of communica-tion that allows the agency to tailor a message to the specificneeds of an individual client. As the salesperson is a sourceof vital information, some clients rely on the salesperson as areliable and credible source of product information.
Knowing about the product is important, but knowingabout the client is more important. It is what the productcan do for the client that is important. Sales personnel mustbuild clients’ confidence and anticipate future needs. Knowl-edge of the data and products, backed by prompt service,builds clients’ confidence. Building rapport and developingknowledge of clients’ business leads to sales.
Secondary providers, or resellers, take raw data and re-sell it after value adding. As a rule, secondary providerspossess a great deal of skill in manipulating and using sta-tistical data, so the effort in servicing this sector is largelyat the front end (i.e., negotiating a fair price and providingthe required data or service in a timely fashion).
In general, the selling effort requires contact at severallevels within an organization. This requires the sales repre-sentative to be knowledgeable of a number of industries andthe information requirements of these industries. The buy-ers also tend to be sophisticated and professional in theirbuying practices; to be effective, the sales representativemust match these skills. This area requires the most cre-ative selling skills as well as a complete knowledge of theagency’s products and services.
Salespersons who have clients in the professions (e.g.,medical, legal, social work, accounting and architecture)have a different sales responsibility. They must relate to theseindividuals not as users or purchasers but as specifiers orinfluencers of buying decisions. Selling to these profession-als requires a strong problem-solving orientation, a profes-sional presence and the ability to maintain personal motiva-tion while awaiting long-term results.
(b) Personal selling
There are traditionally two types of personal, or face-to-face, selling. The first is cold calling, where no prospectnames have been provided by the marketing department,and there has been little or no advertising to support thesalesperson. The second is selling to a prospect lead listgenerated by direct or other forms of advertising. The sec-ond type is, of course, more efficient and cost-effective. Theclient has already been made aware of the product rangeand activated into responding, and may even have receivedadditional literature to further convert the client’s inquiryinto a sale even before a personal visit during which thesalesperson can “close the sale”. This, however, is not theend of salesperson and client contact. Salespersons shoulddevelop a relationship with the client, and make it easy forthe client to reach them with complaints, questions or re-quests for more information.
Personal selling involves a sequential process that appliesto all types of selling tasks and all classes of clients. Theprocess is as follows:
(a) Prospecting. Generating leads and qualifying the pros-pect;
(b) Planning the initial contact and the sales presenta-tion;
(c) Processing. Making the sale and following up.
(i) Prospecting
The vital factor in any selling effort is an ongoing sourceof new prospective clients. There is always an attritionamong existing clients over time, so new buyers must emergeto maintain and expand the client base if the organization isto grow in the market place.
Marketing activities should provide leads, but the salesoffice should develop as many lists (by industry sectors) aspossible to ensure a supply of leads for the sales staff.
There is a subtle distinction between suspects (leads) andprospects. A suspect, or lead, is someone who might buy; aprospect is someone who can or will buy from the salesper-son or another supplier. As the time of salespersons is lim-ited, and costly, they must be able to sort prospects from sus-pects as quickly as possible. This activity is called qualifyingthe prospect. There are four criteria to apply in the qualifica-tion process: existence of need or want of the product or ser-vice, ability to buy, motivation to buy and eligibility to buy.
(ii) Planning the initial contact and presentation
Professional salespeople help clients make buying deci-sions. Planning the first contact with the prospective clientis essential, as is the sales presentation. A classical salespresentation has several stages but the effort within eachstage can be tailored to suit individual client organizations.The first part of the presentation should not involve anyselling; it should aim at getting to know the client and theclient’s business and gaining an understanding of what theclient needs. With this information, the features and ben-efits of the product range can start to provide a solution tothe client’s problems. The final stage is closing the sale,which should be seen as helping people make decisions thatare good for them. It is important to note that there is notone presentation that will work with all clients; each pre-sentation may need a different focus or emphasis and a dif-ferent communication style.
The information required for planning falls into three cat-egories: prospect’s business, buying influences and compe-tition (direct and indirect). To the extent the prospect hasbeen qualified, as discussed earlier, and the buying influ-ences determined, it is then essential to weigh the advan-tages and disadvantages of the product and competitive prod-ucts in satisfying the client’s needs. With this insight, thesales representative organizes the presentation to empha-size strengths and minimize weaknesses. The final elementof the planning effort is the organization of the informationleading to the presentation.

176
The presentation is the high point of the sales process. Itis here that the sales representative translates the prospect-ing and the planning into results. The presentation may behighly structured or flexible and tailored to the individualprospect’s needs in a problem-solving sales environment.
(iii) Processing
Closing the sale is necessary because prospects, despitetheir desire to buy, are ambivalent about the decision. Theywant the advantages and benefits of the product, but mayfear that the purchase involves risk or that purchasing theitem means forgoing something else.
Despite the prospect’s strong affirmative response to theclose, the sale may not be completed. There are several ad-ministrative tasks that the salesperson must fulfil as well,such as completing order forms, obtaining authorized sig-natures, receiving necessary deposits or advance paymentsand ensuring the delivery schedule.
5. Sales targets
Techniques for projecting sales range from complex sta-tistical methods to simple estimates. In general, the use ofhistorical data provides an idea of trends, and a commonmethod of projecting is simply to multiply the previouscycle’s figures by “x” per cent. However, sales teams maybe asked to provide their projections based on the sales tar-gets that are provided in the marketing plan; sales managersmay feel that their organization can produce sales in excessof the targets.
Sales objectives are unlikely to be met without continu-ous planning and control. Monitoring in the sales field isessential to ensure that the total number of sales meetsmonthly sales targets. The sales manager generally sets an-nual or quarterly sales targets, and it is preferable for eachsalesperson to be assigned a monthly target. In sales,monthly, weekly and even daily objectives help to achieveoptimal results, and weekly reviews are advisable. If salestargets are not met, the situation must be analysed and cor-rective action taken as quickly as possible. Exceeding salestargets acts as a great motivator to salespeople, who shouldbe encouraged to establish personal sales objectives abovethe target.
It is important to note that sales targets represent a mini-mum level of expected sales, not a maximum. Sales targetscan vary depending on the experience of the salesperson orthey may reflect the greater or lesser market potential of thesales territory. Sales targets may be set for individual prod-ucts, and an emphasis may be placed on achieving sales fora premium or flagship product.
The sales history of each product needs to be examinedand new targets framed in line with the results over the pastyear or census cycle. Input from regional offices should betaken into consideration, as they have knowledge of localmarket conditions.
6. Sales reporting/ evaluation/ performance indicators
Regional sales managers should complete sales reportsfor each region on a monthly basis. This information couldbe compiled into a national monthly sales report. The majorpurpose of this report is to assess performance against salestargets and to assess the levels of activity both nationallyand in regional offices.
The national sales manager should prepare a quarterlyreport of sales information. This information will focus onthe success of strategies outlined in the national sales plan,including penetration into sectors. The information will beincorporated into the next quarter’s sales plan, which willbe produced at the same time. An annual report should becompiled to provide information on performance. This couldbe coordinated by the national sales manager but shouldinvolve contributions from all major stakeholders. This re-port will also feed into the annual sales planning process.
As part of the reporting system, feedback on product de-sign, unmet needs, new product ideas and competition, aswell as general feedback from clients, should be includedin sales reports.
The monitoring and evaluation of the sales efforts requiressystems to evaluate the individual salesperson and the re-gional or national effort.
Reporting by sales representatives is an important compo-nent in the overall evaluation of the sales programme, as wellas being a tool for sales managers to evaluate the performanceof salespersons and to correct any deficiencies, such as lowcall rate, low sales conversion rate or poor planning.
A set of criteria that can be used to evaluate salespersonsis given below. It falls into two categories: quantitative (mea-surable) standards and qualitative ones, which are far moredifficult to measure apart from observation. It is up to indi-vidual sales managers to dedcide how these evaluation meth-ods are reported.
Quantitative performance standards are as follows:
(a) Sales volume. Monetary or percentage increase, mar-ket share, achieving quota and conversion rate;
(b) Sales calls per day;
(c) New business obtained;
(d) Client “penetration” achieved;
(e) Sales:cost ratio.
Qualitative performance standards are as follows:
(a) Personal attributes. General attitude towards clients,empathy with clients, liaison with other team members andstaff, team spirit, motivation to improve, and self-improve-ment undertaken;
(b) Selling skills. Product knowledge, understanding fea-tures and benefits, understanding selling formats, presenta-tion skills, questioning skills, handling objections, and clos-ing skills;

177
(c) Territory management. Time-management skills,record keeping, relationship building with key clients, andmarket intelligence gathering.
As selling is rarely observed, it is difficult to get a realis-tic measure of performance. Sales managers are encouragedto work alongside their staff in the field on a regular basis,for example, one day every month. The sales manager’s roleis to observe and analyse all the positive and negative as-pects of the sales event and then to prepare an objectiveanalysis. This analysis allows sales managers to help im-prove the performance of their sales staff.
7. Sales team organization
The main objective of organizing a sales team is to getresults. It is assumed that other organizational functions arein place to allow the sales team the maximum selling time.Sales managers need to ensure that:
(a) Sales staff have adequate product knowledge andtraining;
(b) Promotional material is available;
(c) Sales administration arrangements are in place;
(d) Sales staff have well-defined territories to work, andall territories targeted have suitable staff;
(e) Sales staff actually service their defined territories.
8. Sales territory management
A defined selling territory provides the operational bound-aries for a sales representative. It is imperative that the ter-ritory possess sufficient potential to allow the representa-tive to sell a good mix of products and services.
The reasons for using a territory structure are as follows:
(a) To cover the market thoroughly;
(b) To evaluate market response;
(c) To evaluate the performance of salespersons;
(d) To minimize sales expenses;
(e) To provide the salesperson with clear working guide-lines;
(f) To improve client contact;
(g) To best match salespersons to the market place.
The following factors can be used in sales territory de-sign:
(a) State or regional boundaries;
(b) Provincial towns and cities;
(c) Known major trading areas;
(d) Places where clients exist.
9. Sales roles and responsibilities
The roles and responsibilities of all sales personnel shouldbe established in terms of the following:
(a) Overall management and leadership of the sales ef-fort on a national basis;
(b) Development of a national sales plan;
(c) Ensuring that sales plans are aligned to marketingactivities;
(d) Development and implementation of sales policiesand procedures;
(e) Providing input into the product review process;
(f) Providing regular sales reports on product perfor-mance, buying trends and market conditions;
(g) Maintaining an effective working relationship withmarketing and public relations in planning, implementationand monitoring of plans;
(h) Providing information on markets, accounts and pro-motional activity back to marketing and public relations;
(i) Providing sales support to other areas of the agency.
10. Training
Sales training is an important element of the sales planand one that must be incorporated into the recruitment, train-ing and retraining of all sales staff. Relationship selling willbe increasingly important to the agency’s sales teams as morecompetitors establish products in the market. In addition,an effective relationship will assist sales staff to achieve goodresults through cross selling line extension and other prod-ucts and services.
A base level of sales training should be regularly pro-vided on a national basis for all sales staff. Each regionaloffice should provide additional sales training, dependingon the needs of the region, and on-the-job training.
Listed below are the basic skills of the sales profession;they will need constant upgrading and reinforcement regard-less of how experienced the salesperson is:
(a) Planning skills, including time management;
(b) Prospecting;
(c) Presentation skills;
(d) Communication skills, including listening and ques-tioning;
(e) Negotiation skills;
(f) Closing techniques;
(g) Client/market knowledge;
(h) Technical training;
(i) Broader business skills.
Product training may also be required and this should beprovided to sales teams annually, in liaison with productdevelopment areas.

179
A. INTRODUCTION
Like any other project, the census needs to be evaluatedto ensure that the effort and investment of resources havebeen worthwhile. With so many different activities involved,the evaluation of such a project is a complex exercise.
The census represents a rich source of information aboutcontemporary populations. It is widely used by governmentadministration and large numbers of users outside the Gov-ernment. Therefore, evaluation of the census should makefundamental measurements of data quality in order to assistusers and judge the success of the operation.
The evaluation can be viewed as having two broad objec-tives. These are to ensure (a) that the quality of results meetsthe requirements of the key users of census data and (b) thateach process in the operation contributes in a cost-effectiveway to achieving the desired level of quality.
The outcomes of the evaluation process should be com-municated to the users of census data, as well as to the man-agers of the census.
A soundly managed census will include quality assuranceand improvement procedures in each of the major phases ofthe census (i.e., field operations, processing and dissemina-tion). These procedures are crucial to monitor performanceduring the operation and make certain that any tendency tofall below pre-set standards is corrected as work proceeds.
In addition, a standard feature of census evaluation shouldbe a review of each of the major phases upon completion.This can identify strengths and weaknesses and make rec-ommendations for investigation or redevelopment in thefollowing census cycle.
The evaluation of census data can be undertaken at twolevels; these are (a) basic measurements of the overallquality, at a broad level, and (b) a more detailed level ofinvestigation, where in-depth analysis of selected topicsis performed.
Each of these is discussed in more detail in the followingsections.
B. BASIC MEASUREMENTS OF OVERALL QUALITY
At this broad level of data evaluation, two aspects can beconsidered (a) coverage and (b) accuracy.
(a) Coverage
It is normal practice for a census to aim to cover 100 percent of the population. However, in practice this will rarelybe achieved. In order for the results of the census to have
validity, some attempt should be made to assess the extentto which the count has missed or duplicated people. Thebest way to do this is to conduct an independent survey im-mediately after the census enumeration activity to determinethe number of persons who have been missed (undercount)or counted more than once (overcount). Such surveys areknown as post-enumeration surveys and may include ques-tions to evaluate census questions as a means of checkingthe content of the census.
The main reasons for undercount and overcount are:
(a) Incomplete or inaccurate mapping and access diffi-culties;
(b) Population in transit or difficult to enumerate;
(c) Errors in communicating census requirements to thepublic;
(d) Misunderstanding of definitions and instructions byenumeration staff owing to inadequate training;
(e) Lack of quality assurance in the enumeration activity,including inadequate coordination and supervision.
Completeness of mapping, as well as accurate delinea-tion of areas to be enumerated, is of high importance to thefinal population count. People can be missed if parts of thecountry have been excluded from the mapping system ow-ing to poor coverage. Similarly, duplication may occur inoverlapping enumeration areas. Inadequate mapping of ur-ban areas may cause omission of private dwellings that arehidden in non-residential or relatively sparsely populatedareas.
Some households may also be missed owing to difficultiesin access. This predominantly applies to remote communi-ties and floodaffected or inaccessible mountainous areas.
The possibility of omission is high for populations in tran-sit, homeless persons and households with more than oneplace of residence. Populations in transit include the fol-lowing:
(a) Nomadic populations;
(b) Highly mobile sections of the population (typically,younger people);
(c) People who change residence during census enumera-tion;
(d) People living temporarily in hotels or boarding houses.
Alternatively, highly mobile or young persons may beincluded on the census form in more than one household ifthey are perceived, by the members of both households, tobe usual occupants.
VI. EVALUATION

180
Censuses based on place of enumeration may suffer fromovercount owing to the erroneous inclusion of personsabroad or staying elsewhere during census enumeration.Additionally, if there is a long enumeration period, thechances of duplication owing to population mobility areincreased.
Lack of understanding of the census instructions may alsoresult in undercount. Examples include misinterpretation ofthe coverage instructions, resulting in exclusion of infants,the elderly, visitors or servants. In some cases, this may re-flect cultural beliefs and should therefore be managed at anaggregate level rather than by field operations.
In countries where persons are enumerated on the basisof usual residence, the failure to include members of thehousehold who are temporarily absent will add to theundercount. For example, this could include persons on shortperiods of work away from home; away from home on holi-day; in hospital or in prison (for relatively short periods) orwith no fixed address.
On the other hand, overcount may occur as a result oferroneous inclusion of households or persons not entitled tobe enumerated. These are often the opposite of those listedabove. Some examples of groups commonly included erro-neously are the following:
(a) People on long term stays in hospitals or prisons;
(b) Members of defence forces on long-term postingsaway from their families;
(c) People on long-term holidays;
(d) Foreign diplomats and their families;
(e) Persons who died before census day.
Furthermore, confidentiality concerns contribute consid-erably to the undercount. In countries with military con-scription, these concerns may result in a significantundercount of young males.
Good organization and supervision will minimizeundercount owing to the erroneous assessment of dwellingsin the following situations:
(a) Where households are mistakenly classed as unoccu-pied;
(b) Owing to non-contact with occupants, in cases wherethe occupants are usually away when the census enumera-tor calls.
It should also solve problems with possible duplicationowing to lack of coordination between enumerators of ad-jacent areas.
Post-enumeration survey
In general, there are more people missed than double-counted in a census. The difference is called the netundercount. By ascertaining a few basic characteristics inthe post-enumeration survey, it is possible to establish thenature of the population missing from the count. This is use-
ful both in estimating the size of the population missed andin revising procedures such as public communications toimprove the count of these groups in the next census.
As the post-enumeration survey provides an independentvalidation of the census count, efforts must be made to en-sure that the survey is independent from the census. At theleast, no census field staff should work on the post-enu-meration survey in the area in which they enumerated dur-ing the census. It is preferable that the survey workforcehave no involvement with the census. A further assuranceof independence is given if the post-enumeration survey isconducted without reference to census forms. Being able torefer to these forms and resolve inconsistencies may offerinsights into the reasons for discrepancies but presents arisk of bias in measuring the net undercount.
The post-enumeration survey must be representative ofthe entire country and of all population groups. To achievethis, the use of appropriate sampling techniques is crucial.The collection should be independent of the census enu-meration itself and preferably conducted as soon as pos-sible after census enumeration. However, it should not beso close that it interferes with census enumeration. This willensure minimal changes in population owing to mobilityand the cooperation of the public owing to the impact ofcensus publicity.
Finally, household and person records from the post-enu-meration survey have to be reconciled with the census data.A process involving searching for corresponding censushousehold forms and matching each survey household mem-ber with an appropriate census person record should be used,where possible. This process will greatly benefit from ac-curate recording of names and addresses during both col-lections. However, examining information common to boththe census and the post-enumeration survey, such as age,sex, birthplace and relationship to other members in thehousehold, will also aid the identification process.
It should be noted that accurate reporting of names andaddresses may pose particular difficulties in areas wherethe population is nomadic, living in a tribal situation or liv-ing in shanty towns (with no formal addresses). These situ-ations have to be addressed in overall census planning. Thekey point is to include the post-enumeration survey and otherevaluation processes in that planning.
Coverage assessment using the post-enumeration surveycan be valuable for both census management and clients.The census agency can use the information to modify andimprove procedures that might reduce undercounting. Us-ers of the data can make use of the information if it is rel-evant to their use of the census results.
(b) Accuracy
The second aspect of a broad-level census data evalua-tion programme consists of assessing the reliability of thedata beyond merely establishing the extent of coverage. Itis relatively straightforward to collate some information atthe aggregate level, but it is more difficult to establish theaccuracy of individual responses. A system of benchmarkscan be established to determine data reliability.

181
Benchmarking
Benchmarks can be established for each variable to trackthe contributions of question non-response, editing and im-putation to final data quality. Simple benchmarks may con-sist of a basic table comparing non-response rates betweencensuses. A complex benchmark can include detailed tablesbroken down by population or geographic region. Thesetables can show responses before and after processing, aswell as listing edits, imputations and coding procedures in-volved in the compilation of final data for each variable.
To minimize the resources required, benchmarks can beproduced using a sample representative of census data. Pro-duction of complex benchmarks requires access to data fromvarious stages during processing. This will provide a com-plete picture of responses provided on the forms and theimpact of the processing system on those responses.
Ideally, benchmarking should be completed before therelease of census data. However, time and staff constraintsmay delay this task. Benchmarking not only permits com-parisons of quality between successive censuses, it also al-lows the effectiveness of the form design and processingactivities to be assessed. Decisions can be made about ap-propriate procedures for the next census on the basis of suchassessments.
Where the statistical system of a country is well devel-oped it may also be possible to utilize information from otherelements of the statistical system to benchmark the census.For example, a survey of employers may give indicativeinformation about the size of the labour force in a country(or a region). It would be unlikely to get an exact match, butif both collections are well managed it would be possible toindicate that the results are in broad agreement. If they arenot in agreement, the factors that have caused this (e.g., dif-ference in concept or question design, changes in process-ing or changes introduced by differing collection method-ologies) can be noted.
C. DETAILED ANALYSIS
While all countries should aspire to evaluate their censusdata and set benchmarks at the broad level, as shown above, itmay prove too costly to proceed to this next level of analysis.
The evaluation process should be flexible enough to re-spond to queries and issues identified by the census staffand the census data users. Investigation of these issues mayvary from short data interrogations to prolonged topic orprocess studies. The benchmarking process should iden-tify issues that may require more detailed analysis. Othertopics for detailed examination should be determined onthe basis of:
(a) Continuing interest in the topic;
(b) Lack of recent examination of a topic;
(c) Considerable change since the previous census;
(d) Concerns raised during the development of the nextcensus.
Issues of continuing importance will vary from countryto country. Some examples of such issues are:
(a) Housing;
(b) Labour force status;
(c) Education and qualifications;
(d) Enumeration of ethnic or indigenous populations.
Each of these issues should be prioritized, and suitableinvestigations undertaken within the allocated resources andtime-frames. In-depth investigation of selected topics shouldinclude comparisons between censuses and other data avail-able from surveys or administrative collections. It is pre-sumed that some data from household surveys will be avail-able for each topic to be investigated. Comparing censusresults with other data at the aggregate level is much moreefficient than comparison at an individual record level. How-ever, such surveys need to be based on compatible stan-dards and should be conducted close to the time of censusenumeration.
Detailed investigation of selected population characteris-tics may be based on direct and indirect demographic tech-niques. Validity of comparison of census data with admin-istrative records such as the registers of births, deaths ormarriages is highly dependent on the quality and accuracyof the latter and will vary among countries. Countries withpoor registration systems may employ indirect demographictechniques to evaluate their census data. These techniquesmay include a study of age-sex distribution, a stable popu-lation analysis or a component method utilizing high-qual-ity data from other countries.
Some topics may be covered more accurately and fre-quently by data collections other than the census. Topicsthat were not evaluated during previous censuses should beseriously considered for detailed investigation. This willensure that there is no degradation in the level of data qual-ity established by previous censuses.
D. CHANGES TO CENSUS PROCESSES
Changes to any of the census processes have the poten-tial to impact on the quality of the final data. The censusevaluation team should assess all changes to the form andmajor phases of the census. Assessment of changes to theform may amount to a simple task if there are minorchanges to wording or instructions. However, the inclu-sion of a new topic should warrant a thorough investiga-tion of the new data and establishment of benchmarks forfuture reference.
Changes to the enumeration process and processing sys-tems, including coding, edits and derivations, should beclosely monitored throughout the census. Ongoing data-quality management and continuous quality-improvementpractices are discussed in chapter I, section C. The role ofthe census evaluation team is to review data-quality man-agement reports from major phases of previous census cyclesand compile lists of recommendations for improvements forthe next census.

182
The evaluation team should seriously consider concernsraised in the planning and preparatory phases for the nextcensus. If data are available, an assessment of past prac-tices should reveal strengths and weaknesses of the system.Alternatively, if there is no available data, new strategies tomonitor identified points of weaknesses should be devel-oped. Subsequently, the information obtained through thenew monitoring strategies should be evaluated prior to thedevelopment of the next census. All issues identified in anyof the phases of the census should be reviewed prior to thedevelopment of the next census.
E. COMMUNICATING QUALITY ISSUES
The census agency must take a proactive role in commu-nicating the reliability and shortfalls of the census data toenable informed use of census data. Users should be fullyaware of the limitations and strengths of the final data. It is
important that users understand the impact of any changesmade to census procedures on any analysis they may wishto perform. Therefore, the outcomes of evaluation have tobe disseminated effectively.
There are two ways to approach this task. A formal ap-proach involves compiling publications addressing variousissues, preferably published in a series of census evaluationpapers or fact sheets. This type of dissemination may takeadvantage of different media, including emerging technolo-gies such as the Internet.
Informal communications will include ad hoc reports,presentations given to interest groups, articles in censusnewsletters or census updates, and answering queries fromusers. To fulfil the last requirement, it is recommended thatcomplete evaluation reports be accessible to staff dealingwith users. This can be facilitated by a computerized data-base, where the census documentation can be permanentlystored and easily accessed when needed.

183
ANNEX I
COMPOSITION AND TERMS OF REFERENCE OF THE NATIONALCENSUS COMMITTEE OF ZAMBIA FOR THE 1990 CENSUS

184
A. COMPOSITION
The National Census Committee shall comprise:
1. The Secretary of the Cabinet (Chairman)
2. The Director of Census and Statistics (Secretary)
3. The Director-General, National Commission for Development Planning
4. The Senior Permanent Secretary, Ministry of Finance
5. The Permanent Secretary (Economics), Cabinet Office
6. The Permanent Secretary, Personnel Division, Office of the Prime Minister
7. The Permanent Secretary, Decentralization Division, Office of the Prime Minister
8. The Permanent Secretary, Ministry of Defence
9. The Permanent Secretary, Ministry of General Education, Youth and Sport
10. The Permanent Secretary, Ministry of Home Affairs
11. The Permanent Secretary, Ministry of Agriculture
12. The Permanent Secretary, Ministry of Cooperatives
13. The Permanent Secretary, Ministry of Health
14. The Permanent Secretary, Ministry of Labour, Social Development and Culture
15. The Permanent Secretary, Ministry of Works and Supply
16. The Permanent Secretary, Ministry of Power, Transport and Communication
17. The Permanent Secretary, Ministry of Information, Broadcasting and National Guidance
18. The Permanent Secretary, Ministry of Legal Affairs
19. The Secretary, Election and Publicity Committee of the Central Committee
20. The Secretary, Economic and Finance Committee of the Central Committee
21. The Chairman, National Housing Corporation
22. The Permanent Secretary, Central Province
23. The Permanent Secretary, Copper Belt Province
24. The Permanent Secretary, Eastern Province
25. The Permanent Secretary, Luapula Province
26. The Permanent Secretary, Lusaka Province
27. The Permanent Secretary, Northern Province
28. The Permanent Secretary, North-western Province
29. The Permanent Secretary, Southern Province
30. The Permanent Secretary, Western Province

185
B. TERMS OF REFERENCE
The terms of reference for the National Census Committee were:
To report to the Prime Minister and make proposals for appropriate action to be taken on the following matters:
(a) Fixing the date for the 1990 Census of Population, Housing and Agriculture;
(b) The nature of information to be collected in the 1990 Census of Population, Housing and Agriculture;
(c) Administrative, financial and logistical arrangements for holding the Census, processing of data and dissemina-tion of results;
(d) Methods to ensure the fullest public cooperation;
(e) Any other matters deemed necessary by the Committee.
The National Census Committee shall have powers to:
(a) Co-opt representatives of any other organization for specific purposes;
(b) Form subcommittees to deal with specific aspects of the census programme.

186

187
ANNEX II
EXAMPLE OF A MODEL CENSUS PROJECT TIMETABLE

188

189
1 Coordination Branch Thu 01/04/99 Tue 30/04/02 0 hrs 804 days
Thu 01/04/99 Thu 01/04/99
1.1 Communications Network Mon 03/05/99 Fri 29/12/00 0 hrs 435 days
1.1.1 Develop Organisation Chart Mon 03/05/99 Mon 31/05/99 0 hrs 21 days
1.1.2 Develop Contact Lists Mon 03/05/99 Mon 31/05/99 0 hrs 21 days
1.1.3 Design Key Reports System Mon 03/05/99 Fri 30/07/99 0 hrs 65 days
1.1.4 Monitor Activities Mon 03/05/99 Fri 29/12/00 0 hrs 435 days
1.2 Printing Mon 17/05/99 Tue 29/02/00 0 hrs 207 days
1.2.1 Pilot Test Materials Mon 17/05/99 Mon 30/08/99 0 hrs 76 days
1.2.2 Pilot Test Census Form Mon 02/08/99 Tue 31/08/99 0 hrs 22 days
1.2.3 Supervisor/Enumerator Man. Mon 01/11/99 Fri 31/12/99 0 hrs 45 days
1.2.4 Main Census Form Mon 01/11/99 Tue 29/02/00 0 hrs 87 days
1.3 Publicity Mon 03/05/99 Fri 28/07/00 0 hrs 325 days
1.3.1 Develop Strategy Mon 03/05/99 Fri 24/12/99 0 hrs 170 days
1.3.2 Pilot Test Mon 02/08/99 Fri 24/09/99 0 hrs 40 days
1.3.3 Census Mon 03/05/99 Fri 28/07/00 0 hrs 325 days
1.4 Notable Events Book Mon 03/05/99 Thu 30/09/99 0 hrs 109 days
1.4.1 Revise Previous Version Mon 03/05/99 Mon 31/05/99 0 hrs 21 days
1.4.2 Despatch New Version Thu 01/07/99 Thu 30/09/99 0 hrs 66 days
1.5 Despatch of Materials Tue 01/06/99 Fri 12/05/00 0 hrs 249 days
1.5.1 Preparation Tue 01/06/99 Thu 30/09/99 0 hrs 88 days
1.5.2 Pilot Test Mon 02/08/99 Fri 20/08/99 0 hrs 15 days
1.5.3 Census Mon 10/04/00 Fri 12/05/00 0 hrs 25 days
1.6 Recruitment Tue 01/06/99 Wed 31/05/00 0 hrs 262 days
1.6.1 Preparation Tue 01/06/99 Thu 30/09/99 0 hrs 88 days
1.6.2 Pilot Test Mon 16/08/99 Tue 31/08/99 0 hrs 12 days
1.6.3 Census Mon 01/05/00 Wed 31/05/00 0 hrs 23 days
1.7 Training Mon 03/05/99 Fri 07/07/00 0 hrs 310 days
1.7.1 Develop Methods Mon 03/05/99 Thu 30/09/99 0 hrs 109 days
1.7.2 Pilot Test Mon 16/08/99 Fri 27/08/99 0 hrs 10 days
1.7.3 Train the Trainers Mon 01/05/00 Wed 31/05/00 0 hrs 23 days
1.7.4 Census Wed 21/06/00 Fri 07/07/00 0 hrs 13 days
1.8 Enumeration Start Mon 30/08/99 Wed 31/05/00 0 hrs 198 days
1.8.1 Pilot Test Mon 30/08/99 Fri 17/09/99 0 hrs 15 days
1.8.2 Census Mon 01/05/00 Wed 31/05/00 0 hrs 23 days
Number Task Start Finish Work Duration

190
1.9 Enumeration End Mon 02/08/99 Thu 31/08/00 0 hrs 284 days
1.9.1 Pilot Test Mon 02/08/99 Fri 31/12/99 0 hrs 110 days
1.9.2 Census Mon 20/09/99 Fri 24/09/99 0 hrs 5 days
1.9.3 Return Census Forms Fri 21/07/00 Thu 31/08/00 0 hrs 30 days
1.10 Processing Preparation Thu 01/04/99 Fri 30/06/00 0 hrs 327 days
1.10.1 System Design Wed 01/09/99 Fri 17/12/99 0 hrs 78 days
1.10.2 Hardware/Software Design Mon 01/11/99 Fri 28/01/00 0 hrs 65 days
1.10.3 System Build/Test Wed 01/12/99 Fri 28/04/00 0 hrs 108 days
1.10.4 System Install/Test Wed 01/03/00 Fri 30/06/00 0 hrs 88 days
1.10.5 Recruitment Thu 01/04/99 Thu 01/04/99 0 hrs 1 day
1.10.6 Training Thu 01/04/99 Thu 01/04/99 0 hrs 1 day
1.11 Processing Start Wed 22/09/99 Fri 29/09/00 0 hrs 268 days
1.11.1 Pilot Test Forms to DP Wed 22/09/99 Thu 30/09/99 0 hrs 7 days
1.11.2 Census Forms to DP Tue 01/08/00 Fri 29/09/00 0 hrs 44 days
1.12 Processing 1 Tue 01/08/00 Fri 12/10/01 0 hrs 314 days
1.12.1 Flow Control Tue 01/08/00 Fri 28/09/01 0 hrs 304 days
1.12.2 Data Entry Fri 01/09/00 Fri 28/09/01 0 hrs 281 days
1.12.3 Editing/Validation Mon 11/09/00 Fri 12/10/01 0 hrs 285 days
1.13 Processing 2 Tue 01/08/00 Wed 31/10/01 0 hrs 327 days
1.13.1 Quality Assurance Mon 11/09/00 Fri 12/10/01 0 hrs 285 days
1.13.2 Data File Input Validation Mon 11/09/00 Fri 12/10/01 0 hrs 285 days
1.13.3 Store/Disposal Census Forms Tue 01/08/00 Wed 31/10/01 0 hrs 327 days
1.14 Dissemination Preparation Thu 01/04/99 Mon 28/02/00 0 hrs 238 days
1.14.1 Outputs Design Mon 02/08/99 Mon 28/02/00 0 hrs 151 days
1.14.2 User Consultation Thu 01/04/99 Thu 01/04/99 0 hrs 1 day
1.14.3 Anaysis Design Mon 02/08/99 Mon 28/02/00 0 hrs 151 days
1.14.4 Product Development Mon 02/08/99 Tue 30/11/99 0 hrs 87 days
1.14.5 Product Testing Thu 01/04/99 Thu 01/04/99 0 hrs 1 day
1.15 Dissemination Thu 01/04/99 Mon 31/12/01 0 hrs 718 days
1.15.1 Data File Output Validation Fri 01/12/00 Thu 30/08/01 0 hrs 195 days
1.15.2 Product Quality Assurance Fri 01/12/00 Thu 30/08/01 0 hrs 195 days
1.15.3 Outputs Production Thu 01/02/01 Wed 31/10/01 0 hrs 195 days
1.15.4 Analysis Production Thu 01/02/01 Mon 31/12/01 0 hrs 238 days
1.15.5 Client Support Thu 01/04/99 Thu 01/04/99 0 hrs 1 day
1.16 Evaluation Mon 02/08/99 Tue 30/04/02 0 hrs 717 days
Number Task Start Finish Work Duration

191
1.16.1 Develop Evaluation Plans Mon 02/08/99 Thu 31/05/01 0 hrs 479 days
1.16.2 Pilot Test Evaluation Fri 15/10/99 Fri 29/10/99 0 hrs 11 days
1.16.3 Census Evaluation Tue 01/08/00 Tue 30/04/02 0 hrs 456 days
1.16.4 Overall Census Eval. Report Fri 01/02/02 Tue 30/04/02 0 hrs 63 days
1.17 Financial Management Thu 01/04/99 Fri 13/08/99 0 hrs 97 days
1.17.1 Develop Budgets Mon 02/08/99 Fri 13/08/99 0 hrs 10 days
1.17.2 Budget Approval Process Mon 21/06/99 Wed 23/06/99 0 hrs 3 days
1.17.3 Budget Training Wed 23/06/99 Wed 30/06/99 0 hrs 6 days
1.17.4 Budget Management Mon 09/08/99 Wed 11/08/99 0 hrs 3 days
1.17.5 Budget Reviews Thu 01/04/99 Thu 08/04/99 0 hrs 6 days
2 Development Thu 01/04/99 Fri 28/09/01 0 hrs 652 days
Thu 01/04/99 Thu 01/04/99
2.1 User’s Consultation Thu 01/04/99 Fri 23/07/99 0 hrs 82 days
2.1.1 Agency Views on Topics Thu 01/04/99 Fri 23/04/99 0 hrs 17 days
2.1.2 Users Information Paper Thu 01/04/99 Fri 23/04/99 0 hrs 17 days
2.1.3 Establish Cons. Forums Mon 12/04/99 Fri 16/04/99 0 hrs 5 days
2.1.4 Meeting No. 1 Thu 24/06/99 Thu 24/06/99 0 hrs 1 day
2.1.5 Minutes No. 1 Thu 24/06/99 Mon 28/06/99 0 hrs 3 days
2.1.6 Meeting No. 2 Tue 20/07/99 Tue 20/07/99 0 hrs 1 day
2.1.7 Minutes No. 2 Tue 20/07/99 Fri 23/07/99 0 hrs 4 days
2.2 Design of Census Form Mon 12/04/99 Fri 29/10/99 0 hrs 145 days
2.2.1 Evaluation of Past Topics Mon 12/04/99 Wed 30/06/99 0 hrs 58 days
2.2.2 Topic Selection Mon 12/04/99 Wed 30/06/99 0 hrs 58 days
2.2.3 Format of Questionnaire Mon 12/04/99 Wed 30/06/99 0 hrs 58 days
2.2.4 Census Form Draft 1 Mon 12/04/99 Wed 30/06/99 0 hrs 58 days
2.2.5 Census Form Draft 2 Mon 12/07/99 Fri 23/07/99 0 hrs 10 days
2.2.6 Pilot Census Form Mon 16/08/99 Fri 27/08/99 0 hrs 10 days
2.2.7 Final Census Form Mon 27/09/99 Fri 29/10/99 0 hrs 25 days
2.3 Questionnaire Testing Mon 28/06/99 Fri 17/09/99 0 hrs 60 days
2.3.1 Pretest No. 1 Mon 28/06/99 Wed 30/06/99 0 hrs 3 days
2.3.2 Pretest No. 2 Mon 12/07/99 Tue 20/07/99 0 hrs 7 days
2.3.3 Pilot Test Wed 01/09/99 Fri 17/09/99 0 hrs 13 days
2.4 Enumeration Strategy Mon 19/04/99 Fri 29/10/99 0 hrs 140 days
2.4.1 Develop Special Enum. Strat. Mon 19/04/99 Fri 24/09/99 0 hrs 115 days
2.4.2 Special Enumeration Manual Mon 06/09/99 Fri 29/10/99 0 hrs 40 days
Number Task Start Finish Work Duration

192
2.5 Documentation Mon 19/04/99 Fri 29/10/99 0 hrs 140 days
2.5.1 Concepts & Definitions Mon 19/04/99 Fri 11/06/99 0 hrs 40 days
2.5.2 Enumerator Manual Mon 19/04/99 Fri 27/08/99 0 hrs 95 days
2.5.3 Field Supervisor Manual Mon 19/04/99 Fri 10/09/99 0 hrs 105 days
2.5.4 Trainers Manual Mon 19/04/99 Fri 17/09/99 0 hrs 110 days
2.5.5 QA/Editing Manual Mon 19/04/99 Thu 30/09/99 0 hrs 119 days
2.5.6 Coding Manual Mon 19/04/99 Fri 08/10/99 0 hrs 125 days
2.5.7 Output Product Procedures Mon 12/07/99 Fri 08/10/99 0 hrs 65 days
2.5.8 Finalise All Training Manuals Mon 06/09/99 Fri 29/10/99 0 hrs 40 days
2.6 Printing of Documents Mon 19/04/99 Fri 28/01/00 0 hrs 205 days
2.6.1 Printing Estimates Mon 19/04/99 Fri 24/09/99 0 hrs 115 days
2.6.2 Census Form Mon 04/10/99 Fri 26/11/99 0 hrs 40 days
2.6.3 Training Materials Mon 11/10/99 Fri 28/01/00 0 hrs 80 days
2.6.4 Enumerator Manual/Materials Mon 18/10/99 Fri 28/01/00 0 hrs 75 days
2.6.5 Supervisors Manual/Materials Mon 25/10/99 Fri 28/01/00 0 hrs 70 days
2.6.6 Processing Manuals Mon 01/11/99 Fri 28/01/00 0 hrs 65 days
2.6.7 Dissemination Materials Mon 08/11/99 Fri 28/01/00 0 hrs 60 days
2.7 Training Program Mon 03/05/99 Fri 28/01/00 0 hrs 195 days
2.7.1 Develop Training Program Mon 17/05/99 Fri 28/01/00 0 hrs 185 days
2.7.2 Train Master Trainers Mon 03/05/99 Fri 21/05/99 0 hrs 15 days
2.8 Evaluation Mon 26/07/99 Fri 26/01/01 0 hrs 395 days
2.8.1 Develop Evaluation Plan Mon 26/07/99 Fri 26/05/00 0 hrs 220 days
2.8.2 Conduct PES (If applicable) Mon 13/11/00 Thu 30/11/00 0 hrs 14 days
2.8.3 Conduct Census Evaluation Mon 14/08/00 Fri 26/01/01 0 hrs 120 days
2.9 Data Analysis Mon 21/06/99 Fri 28/09/01 0 hrs 595 days
2.9.1 Develop Analysis Plan Mon 21/06/99 Fri 31/03/00 0 hrs 205 days
2.9.2 Undertake Analysis Mon 01/01/01 Fri 28/09/01 0 hrs 195 days
3 Field Operations Thu 01/04/99 Fri 24/11/00 0 hrs 432 days
Thu 01/04/99 Thu 01/04/99
3.1 Methods/Procedures Thu 01/04/99 Fri 30/04/99 0 hrs 22 days
3.1.1 Urban Listing Procedures Thu 01/04/99 Fri 30/04/99 0 hrs 22 days
3.1.2 Rural Listing Procedures Thu 01/04/99 Fri 30/04/99 0 hrs 22 days
3.1.3 Enumeration Procedures Thu 01/04/99 Fri 30/04/99 0 hrs 22 days
3.1.4 Training Procedures Thu 01/04/99 Fri 30/04/99 0 hrs 22 days
3.2 Regional Workshops Thu 01/04/99 Fri 20/08/99 0 hrs 102 days
Number Task Start Finish Work Duration

193
3.2.1 Regional Schedules Thu 01/04/99 Tue 22/06/99 0 hrs 59 days
3.2.2 Regional Budgets Thu 01/04/99 Tue 22/06/99 0 hrs 59 days
3.2.3 Conduct Regional Workshops Thu 01/04/99 Fri 20/08/99 0 hrs 102 days
3.3 Train/Recruit Listers Thu 01/04/99 Thu 30/09/99 0 hrs 131 days
3.3.1 Recruit Field Staff Thu 01/04/99 Thu 30/09/99 0 hrs 131 days
3.3.2 Train Master Trainers Wed 30/06/99 Fri 02/07/99 0 hrs 3 days
3.3.3 Train Regional Trainers Mon 05/07/99 Fri 27/08/99 0 hrs 40 days
3.3.4 Train Supervisors & Listers Mon 19/07/99 Fri 24/09/99 0 hrs 50 days
3.4 Listing & Mapping Oper. Mon 02/08/99 Fri 17/12/99 0 hrs 100 days
3.4.1 Workload Preparation Mon 02/08/99 Fri 27/08/99 0 hrs 20 days
3.4.2 Workload Distribution Mon 09/08/99 Fri 26/11/99 0 hrs 80 days
3.4.3 Complete Listing Forms Mon 16/08/99 Fri 26/11/99 0 hrs 75 days
3.4.4 Complete Sketch Maps Mon 23/08/99 Fri 26/11/99 0 hrs 70 days
3.4.5 Field Coverage Checks Mon 30/08/99 Fri 10/12/99 0 hrs 75 days
3.4.6 Return Workloads Mon 06/09/99 Fri 17/12/99 0 hrs 75 days
3.5 Process Listing Workloads Mon 20/09/99 Fri 31/03/00 0 hrs 140 days
3.5.1 Form Registration Mon 20/09/99 Fri 31/12/99 0 hrs 75 days
3.5.2 Manual Checks & Edits Mon 27/09/99 Fri 28/01/00 0 hrs 90 days
3.5.3 Compile Head Counts Mon 04/10/99 Fri 28/01/00 0 hrs 85 days
3.5.4 Compile Enum. Workloads Mon 25/10/99 Fri 31/03/00 0 hrs 115 days
3.6 Produce Base Maps Thu 01/04/99 Fri 31/03/00 0 hrs 262 days
Check Sketch Maps Thu 01/04/99 Thu 01/04/99 0 hrs 1 day
3.6.1 Form EAs & Boundaries Thu 01/04/99 Fri 28/01/00 0 hrs 217 days
3.6.2 Provincial Updates Thu 01/04/99 Fri 31/12/99 0 hrs 197 days
3.6.3 Produce Base Maps Thu 01/04/99 Fri 31/03/00 0 hrs 262 days
3.6.4 EA Sketch Maps Mon 23/08/99 Fri 31/03/00 0 hrs 160 days
3.7 Test Operations Mon 05/07/99 Fri 17/09/99 0 hrs 55 days
3.7.1 Prepare Test 1 Mon 05/07/99 Fri 09/07/99 0 hrs 5 days
3.7.2 Pretest 1 Mon 12/07/99 Tue 20/07/99 0 hrs 7 days
3.7.3 Prepare Test 2 Mon 26/07/99 Fri 06/08/99 0 hrs 10 days
3.7.4 Pretest 2 Mon 09/08/99 Fri 20/08/99 0 hrs 10 days
3.7.5 Prepare Pilot Test Mon 23/08/99 Tue 31/08/99 0 hrs 7 days
3.7.6 Pilot Test Wed 01/09/99 Fri 17/09/99 0 hrs 13 days
3.8 Train/Recruit Census Staff Mon 06/12/99 Fri 30/06/00 0 hrs 150 days
3.8.1 Recruit Field Staff Mon 06/12/99 Fri 23/06/00 0 hrs 145 days
Number Task Start Finish Work Duration

194
3.8.2 Train Master Trainers Mon 03/04/00 Fri 28/04/00 0 hrs 20 days
3.8.3 Train Regional Trainers Mon 01/05/00 Fri 26/05/00 0 hrs 20 days
3.8.4 Train Supervisors/Enum’s. Mon 19/06/00 Fri 30/06/00 0 hrs 10 days
3.9 Census Enumeration Mon 03/07/00 Fri 25/08/00 0 hrs 40 days
3.9.1 Workload Distribution Mon 03/07/00 Mon 10/07/00 0 hrs 6 days
3.9.2 Complete Enumeration Mon 03/07/00 Fri 14/07/00 0 hrs 10 days
3.9.3 Complete Summary Forms Mon 10/07/00 Fri 21/07/00 0 hrs 10 days
3.9.4 Field Coverage Checks Mon 17/07/00 Fri 28/07/00 0 hrs 10 days
3.9.5 Return Forms to Regions Mon 24/07/00 Fri 11/08/00 0 hrs 15 days
3.9.6 Return Forms to Agency Mon 31/07/00 Fri 25/08/00 0 hrs 20 days
3.10 Agency Rec. of Cen. Forms Mon 31/07/00 Fri 27/10/00 0 hrs 65 days
3.10.1 Registration of Forms Mon 31/07/00 Fri 01/09/00 0 hrs 25 days
3.10.2 Manual Checks & Edits Mon 04/09/00 Fri 15/09/00 0 hrs 10 days
3.10.3 Compilation of Head Counts Mon 18/09/00 Fri 13/10/00 0 hrs 20 days
3.10.4 Forms to Data Processing Mon 04/09/00 Fri 27/10/00 0 hrs 40 days
3.11 Post Enumeration Survey Wed 08/03/00 Wed 30/08/00 0 hrs 126 days
3.11.1 Develop Recruitment Strategy Wed 08/03/00 Wed 03/05/00 0 hrs 41 days
3.11.2 Recruit PES Field Staff Thu 01/06/00 Fri 30/06/00 0 hrs 22 days
3.11.3 Train PES Staff Mon 03/07/00 Fri 07/07/00 0 hrs 5 days
3.11.4 Conduct PES Mon 17/07/00 Fri 28/07/00 0 hrs 10 days
3.11.5 Return Forms to Regions Mon 31/07/00 Fri 04/08/00 0 hrs 5 days
3.11.6 Return Forms to Agency Mon 07/08/00 Fri 18/08/00 0 hrs 10 days
3.11.7 FOB Process Forms Mon 21/08/00 Fri 25/08/00 0 hrs 5 days
3.11.8 Forms to Data Processing Mon 28/08/00 Wed 30/08/00 0 hrs 3 days
3.12 Evaluation Thu 01/04/99 Fri 24/11/00 0 hrs 432 days
3.12.1 Develop Evaluation Plan Mon 31/01/00 Fri 25/02/00 0 hrs 20 days
3.12.2 Census Operations EvaluationMon 01/11/99 Fri 26/11/99 0 hrs 20 days
3.12.3 Prepare Final Report Fri 24/11/00 Fri 24/11/00 0 hrs 1 day
Thu 01/04/99 Thu 01/04/99 0 hrs 1 day
4 Publicity Thu 01/04/99 Fri 27/10/00 0 hrs 412 days
Thu 01/04/99 Thu 01/04/99
4.1 Strategy/Budget Mon 21/06/99 Fri 09/07/99 0 hrs 15 days
4.1.1 Develop Publicity Strategy Mon 21/06/99 Wed 30/06/99 0 hrs 8 days
4.1.2 Develop Publicity Budget Mon 28/06/99 Fri 09/07/99 0 hrs 10 days
4.2 Publicity Committee Mon 14/06/99 Fri 07/04/00 0 hrs 215 days
Number Task Start Finish Work Duration

195
4.2.1 Identify Members Mon 14/06/99 Fri 25/06/99 0 hrs 10 days
4.2.2 Meeting No. 1 Wed 30/06/99 Wed 30/06/99 0 hrs 1 day
4.2.3 Minutes No. 1 Thu 01/07/99 Mon 05/07/99 0 hrs 3 days
4.2.4 Meeting No. 2 Wed 13/10/99 Wed 13/10/99 0 hrs 1 day
4.2.5 Minutes No. 2 Wed 13/10/99 Fri 15/10/99 0 hrs 3 days
4.2.6 Meeting No. 3 Wed 02/02/00 Fri 04/02/00 0 hrs 3 days
4.2.7 Meeting No. 4 Wed 05/04/00 Wed 05/04/00 0 hrs 1 day
4.2.8 Minutes No. 4 Wed 05/04/00 Fri 07/04/00 0 hrs 3 days
4.3 Preparations Mon 07/02/00 Fri 10/03/00 0 hrs 25 days
4.3.1 Press Materials Mon 07/02/00 Fri 25/02/00 0 hrs 15 days
4.3.2 TV/Radio Materials Mon 07/02/00 Fri 25/02/00 0 hrs 15 days
4.3.3 Other Materials Mon 07/02/00 Fri 25/02/00 0 hrs 15 days
4.3.4 Distribution Mon 21/02/00 Fri 10/03/00 0 hrs 15 days
4.4 Evaluation Thu 01/04/99 Fri 27/10/00 0 hrs 412 days
4.4.1 Develop Evaluation Plan Mon 06/03/00 Fri 24/03/00 0 hrs 15 days
4.4.2 Conduct Evaluation Mon 04/09/00 Fri 29/09/00 0 hrs 20 days
4.4.3 Prepare Evaluation Report Mon 02/10/00 Fri 27/10/00 0 hrs 20 days
Thu 01/04/99 Thu 01/04/99 0 hrs 1 day
5 Data Processing Thu 01/04/99 Wed 14/11/01 0 hrs 685 days
Thu 01/04/99 Thu 01/04/99
5.1 Software Selection Mon 03/05/99 Mon 31/05/99 0 hrs 21 days
5.1.1 Data Entry Mon 03/05/99 Mon 31/05/99 0 hrs 21 days
5.1.2 Data Tracking Mon 03/05/99 Mon 31/05/99 0 hrs 21 days
5.1.3 Editing Mon 03/05/99 Mon 31/05/99 0 hrs 21 days
5.1.4 Tabulation Mon 03/05/99 Mon 31/05/99 0 hrs 21 days
5.2 Hardware Selection Thu 01/07/99 Fri 14/07/00 0 hrs 272 days
5.2.1 Quotes - Pilot Thu 01/07/99 Thu 15/07/99 0 hrs 11 days
5.2.2 Purchase - Pilot Thu 15/07/99 Fri 30/07/99 0 hrs 12 days
5.2.3 Installation - Pilot Wed 28/07/99 Fri 06/08/99 0 hrs 8 days
5.2.4 Testing - Pilot Fri 30/07/99 Fri 06/08/99 0 hrs 6 days
5.2.5 Quotes - Census Mon 17/04/00 Mon 15/05/00 0 hrs 21 days
5.2.6 Purchase - Census Mon 15/05/00 Wed 31/05/00 0 hrs 13 days
5.2.7 Installation - Census Thu 01/06/00 Fri 30/06/00 0 hrs 22 days
5.2.8 Testing - Census Thu 15/06/00 Fri 14/07/00 0 hrs 22 days
5.3 System Design/Dev. Thu 01/07/99 Fri 30/06/00 0 hrs 262 days
Number Task Start Finish Work Duration

196
5.3.1 Data Entry Thu 01/07/99 Tue 30/05/00 0 hrs 239 days
5.3.2 Data Tracking Thu 01/07/99 Tue 30/05/00 0 hrs 239 days
5.3.3 Edits Mon 02/08/99 Tue 30/05/00 0 hrs 217 days
5.3.4 Tabulations Mon 02/08/99 Wed 31/05/00 0 hrs 218 days
5.3.5 Quality Assurance Mon 02/08/99 Wed 31/05/00 0 hrs 218 days
5.3.6 Testing Wed 01/09/99 Fri 30/06/00 0 hrs 218 days
5.4 Recruitment Thu 15/06/00 Mon 31/07/00 0 hrs 33 days
5.4.1 Develop Selection Process Thu 15/06/00 Fri 30/06/00 0 hrs 12 days
5.4.2 Advertise Wed 21/06/00 Fri 30/06/00 0 hrs 8 days
5.4.3 Selection Mon 03/07/00 Fri 14/07/00 0 hrs 10 days
5.4.4 Recruitment Mon 10/07/00 Mon 31/07/00 0 hrs 16 days
5.5 Training Mon 03/04/00 Wed 14/11/01 0 hrs 423 days
5.5.1 Develop Training Strategy Mon 03/04/00 Fri 28/04/00 0 hrs 20 days
5.5.2 Develop Training Manuals Mon 01/05/00 Fri 30/06/00 0 hrs 45 days
5.5.3 Flow Control Training Mon 17/07/00 Tue 15/08/00 0 hrs 22 days
5.5.4 Supervisor Training Mon 17/07/00 Tue 15/08/00 0 hrs 22 days
5.5.5. Basic Computer Training Mon 17/07/00 Mon 31/07/00 0 hrs 11 days
5.5.6 Data Entry Training Tue 01/08/00 Mon 14/08/00 0 hrs 10 days
5.5.7 Computer Edits Training Thu 01/11/01 Wed 14/11/01 0 hrs 10 days
5.6 Flow Control Mon 03/04/00 Wed 31/10/01 0 hrs 413 days
5.6.1 Develop FC Procedures Mon 03/04/00 Fri 28/04/00 0 hrs 20 days
5.6.2 Develop Control Forms Mon 01/05/00 Wed 31/05/00 0 hrs 23 days
5.6.3 Procedures Manual Thu 01/06/00 Fri 30/06/00 0 hrs 22 days
5.6.4 FC Operations Mon 03/07/00 Wed 31/10/01 0 hrs 348 days
5.7 Data Entry Tue 01/08/00 Fri 13/04/01 0 hrs 184 days
5.7.1 Data Entry Tue 01/08/00 Fri 30/03/01 0 hrs 174 days
5.7.2 Verification Tue 01/08/00 Fri 13/04/01 0 hrs 184 days
5.8 Computer Edits Thu 14/09/00 Tue 31/07/01 0 hrs 229 days
5.8.1 Edits 1 Thu 14/09/00 Thu 31/05/01 0 hrs 186 days
5.8.2 Edits Quality Assurance Thu 14/09/00 Thu 31/05/01 0 hrs 186 days
5.8.3 Final Edits Wed 01/11/00 Tue 31/07/01 0 hrs 195 days
5.8.4 Final Quality Assurance Wed 01/11/00 Tue 31/07/01 0 hrs 195 days
5.9 PES Processing Tue 01/08/00 Fri 29/09/00 0 hrs 44 days
5.9.1 Search/Match Tue 01/08/00 Wed 30/08/00 0 hrs 22 days
5.9.2 Data Entry Mon 14/08/00 Thu 14/09/00 0 hrs 24 days
Number Task Start Finish Work Duration

197
5.9.3 Editing Mon 21/08/00 Thu 21/09/00 0 hrs 24 days
5.9.4 Quality Assurance Mon 21/08/00 Fri 29/09/00 0 hrs 30 days
5.10 Tabulation Wed 01/09/99 Fri 31/08/01 0 hrs 523 days
5.10.1 Strategy Wed 01/09/99 Fri 31/12/99 0 hrs 88 days
5.10.2 Procedures Mon 03/01/00 Tue 30/05/00 0 hrs 107 days
5.10.3 Revise Strategy/Procs Mon 02/10/00 Thu 30/11/00 0 hrs 44 days
5.10.4 Preliminary Tables Fri 01/12/00 Fri 29/06/01 0 hrs 151 days
5.10.5 Preliminary QA Fri 01/12/00 Fri 29/06/01 0 hrs 151 days
5.10.6 Final Tables Mon 02/04/01 Fri 31/08/01 0 hrs 110 days
5.10.7 Final QA Mon 02/04/01 Fri 31/08/01 0 hrs 110 days
5.11 Evaluation Thu 01/04/99 Fri 12/10/01 0 hrs 662 days
5.11.1 Develop Evaluation Plan Wed 01/09/99 Thu 30/09/99 0 hrs 22 days
5.11.2 Pilot Test Evaluation Thu 14/10/99 Fri 29/10/99 0 hrs 12 days
5.11.3 Revise Evaluation Plans Thu 01/02/01 Fri 30/03/01 0 hrs 42 days
5.11.4 Census Processing EvaluationMon 03/09/01 Fri 28/09/01 0 hrs 20 days
5.11.5 Prepare Final Report Mon 01/10/01 Fri 12/10/01 0 hrs 10 days
Thu 01/04/99 Thu 01/04/99 0 hrs 1 day
6 Dissemination Thu 01/04/99 Wed 30/04/03 0 hrs 934 days
Thu 01/04/99 Thu 01/04/99
6.1 User’s Committee Mon 01/11/99 Fri 11/05/01 0 hrs 400 days
6.1.1 Agency Views on Outputs Mon 01/11/99 Wed 15/12/99 0 hrs 33 days
6.1.3 Identify Members Mon 17/01/00 Tue 08/02/00 0 hrs 17 days
6.1.4 Meeting No. 1 Wed 23/02/00 Wed 23/02/00 0 hrs 1 day
6.1.5 Minutes No. 1 Wed 23/02/00 Fri 25/02/00 0 hrs 3 days
6.1.6 Meeting No. 2 Wed 04/10/00 Wed 04/10/00 0 hrs 1 day
6.1.7 Minutes No. 2 Wed 04/10/00 Fri 06/10/00 0 hrs 3 days
6.1.8 Meeting No. 3 Wed 07/02/01 Wed 07/02/01 0 hrs 1 day
6.1.9 Minutes No. 3 Wed 07/02/01 Fri 09/02/01 0 hrs 3 days
6.1.10 Meeting No. 4 Wed 09/05/01 Wed 09/05/01 0 hrs 1 day
6.1.11 Minutes No. 4 Wed 09/05/01 Fri 11/05/01 0 hrs 3 days
6.2 Outputs Development Tue 01/08/00 Fri 02/02/01 0 hrs 134 days
6.2.1 Specifify Outputs Tue 01/08/00 Fri 15/09/00 0 hrs 34 days
6.2.2 Design Outputs Mon 16/10/00 Fri 15/12/00 0 hrs 45 days
6.2.3 Develop Production Process Mon 27/11/00 Fri 02/02/01 0 hrs 50 days
6.3 User Workshops Mon 02/07/01 Fri 29/03/02 0 hrs 195 days
Number Task Start Finish Work Duration

198
6.3.1 Develop Workshop Content Mon 02/07/01 Mon 30/07/01 0 hrs 21 days
6.3.2 Prepare Training Materials Wed 01/08/01 Fri 31/08/01 0 hrs 23 days
6.3.3 National Workshop Mon 03/09/01 Fri 26/10/01 0 hrs 40 days
6.3.4 Regional Workshops Mon 19/11/01 Fri 29/03/02 0 hrs 95 days
6.4 Provisional Census Counts Fri 01/12/00 Fri 28/09/01 0 hrs 216 days
6.4.1 Preparation Fri 01/12/00 Fri 31/08/01 0 hrs 196 days
6.4.2 Quality Assurance Fri 01/12/00 Fri 14/09/01 0 hrs 206 days
6.4.3 Release to Regions Mon 01/01/01 Fri 28/09/01 0 hrs 195 days
6.4.4 Release National Count Wed 01/08/01 Fri 28/09/01 0 hrs 43 days
6.5 Census Tables Fri 01/09/00 Fri 14/12/01 0 hrs 336 days
6.5.1 Generate Tables Fri 01/09/00 Fri 30/11/01 0 hrs 326 days
6.5.2 Check Tables Fri 01/09/00 Fri 14/12/01 0 hrs 336 days
6.6 Main Census Report Mon 02/07/01 Mon 15/10/01 0 hrs 76 days
6.6.1 Prepare Draft Mon 02/07/01 Tue 31/07/01 0 hrs 22 days
6.6.2 Circulate & Revise Wed 01/08/01 Fri 31/08/01 0 hrs 23 days
6.6.3 Print Main Report Mon 03/09/01 Fri 14/09/01 0 hrs 10 days
6.6.4 Release Main Report Mon 01/10/01 Mon 15/10/01 0 hrs 11 days
6.7 Provincial Census Reports Wed 01/08/01 Wed 31/10/01 0 hrs 66 days
6.7.1 Prepare Draft Wed 01/08/01 Fri 31/08/01 0 hrs 23 days
6.7.2 Circulate & Revise Mon 03/09/01 Fri 28/09/01 0 hrs 20 days
6.7.3 Print Provincial Reports Mon 01/10/01 Mon 15/10/01 0 hrs 11 days
6.7.4 Release Provincial Reports Tue 16/10/01 Wed 31/10/01 0 hrs 12 days
6.8 PES Results Fri 01/10/99 Thu 15/11/01 0 hrs 555 days
6.8.1 Analyse PES Results Mon 02/10/00 Mon 02/10/00 0 hrs 1 day
6.8.2 Draft PES Findings Wed 01/11/00 Thu 30/11/00 0 hrs 22 days
6.8.3 Prepare PES Report Fri 01/10/99 Wed 31/10/01 0 hrs 544 days
6.8.4 Release PES Findings Thu 01/11/01 Thu 15/11/01 0 hrs 11 days
6.9 Specialised Analysis Mon 02/07/01 Fri 28/03/03 0 hrs 455 days
6.9.1 Appoint Inter-Agency Teams Mon 02/07/01 Tue 31/07/01 0 hrs 22 days
6.9.2 Conduct Specialised Analysis Mon 03/09/01 Fri 28/03/03 0 hrs 410 days
6.9.3 Document Results Mon 03/09/01 Fri 28/03/03 0 hrs 410 days
6.9.4 Conduct Seminars Fri 01/03/02 Fri 28/03/03 0 hrs 281 days
6.10 Monographs/Reports Mon 02/07/01 Wed 30/04/03 0 hrs 478 days
6.10.1 Assess Requirements Mon 02/07/01 Fri 28/09/01 0 hrs 65 days
6.10.2 Assign Responsibility Mon 03/09/01 Mon 15/10/01 0 hrs 31 days
Number Task Start Finish Work Duration

199
6.10.3 Prepare Reports Mon 01/10/01 Fri 29/03/02 0 hrs 130 days
6.10.4 Prepare Region Profiles Mon 02/07/01 Fri 28/03/03 0 hrs 455 days
6.10.5 Print & Distribute Reports Wed 01/08/01 Wed 30/04/03 0 hrs 456 days
6.10.6 Prepare Other Reports Thu 01/11/01 Fri 28/03/03 0 hrs 367 days
6.11 User Services Tue 01/01/02 Fri 28/03/03 0 hrs 324 days
6.11.1 Equip User Service Unit Tue 01/01/02 Fri 29/03/02 0 hrs 64 days
6.11.2 Establish Unit in Agency Tue 01/01/02 Fri 29/03/02 0 hrs 64 days
6.11.3 Develop Procedures Tue 01/01/02 Fri 29/03/02 0 hrs 64 days
6.11.4 Recruit/Train Staff Thu 28/02/02 Fri 31/05/02 0 hrs 67 days
6.11.5 Service User Requests Mon 01/04/02 Fri 28/03/03 0 hrs 260 days
6.12 Evaluation Mon 01/07/02 Thu 31/10/02 0 hrs 89 days
6.12.1 Develop Evaluation Plan Mon 01/07/02 Fri 30/08/02 0 hrs 45 days
6.12.2 Conduct Evaluation Mon 02/09/02 Mon 30/09/02 0 hrs 21 days
6.12.3 Prepare Evaluation Report Tue 01/10/02 Thu 31/10/02 0 hrs 23 days
Number Task Start Finish Work Duration
NOTE: The present example was provided by the Australian Bureau of Statistics. The timetablewas produced using Microsoft project 98 software.

200

201
ANNEX III
EXAMPLE OF A MODEL PROJECT GANTT CHART

202

203
NOTES: The present example was provided by the Australian Bureau of Statistics. The information contained in this annex was produced using Microsoft project 98 software. Descriptions of the ID codes included in this chart can be found in annex II.

204

205
ANNEX IV
1996 CENSUS PROCESSING: A PRACTICAL EXAMPLE OFA QUALITY MANAGEMENT STRATEGY

206

207
1. SUMMARY
There are many sources of potential error in census data.This paper outlines procedures used to minimize process-ing error by the implementation of a total quality manage-ment approach to the operation of a large-scale processingcenter.
2. BACKGROUND: OUTLINE OF PROCESSING
The Australian census is conducted by a delivery pick-upmethod, with a collector responsible for a unit of work calleda collection district (CD) consisting of about 200 dwellings.The forms are returned to the processing center in CD lotswhich is the basic workload used during processing and forwhich data are available as output.
The census is processed at a central location, which em-ploys up to 1300 staff and takes a year. About 1100 of thesestaff are temporary employees and are generally organizedinto teams of 12 Processors, headed up by a Section Leader.Team Leaders manage about five sections and undertakeday-to-day management and staff supervision. Group Lead-ers manage two or three teams and are responsible for themanagement of the overall process. Group Leaders andTeam Leaders are permanent public servants recruited fromthroughout Australia for the duration of census processing.
The processes involved are:
Precapture: Receipt of material, reconciliation with col-lectors records, preparation of forms for optical mark read-ing.
Optical Mark Reading: “tick box” responses are auto-matically coded.
First Release Processing: Check that all forms for the CDare captured, verification of not stated tick boxes and on-line automatic coding of write-in questions (e.g., birthplace,language and religion), family coding for households withcomplex family relationships.
Second Release Processing: on-line automatic coding (insome cases using structured coding approaches) for com-plex questions, e.g., occupation and qualification.
Editing is largely automated and is made up of consis-tency and legality checks. Only a small percentage of recordsrequire manual inspection after editing to reconcile incon-sistencies between family coding and individual details.
Imputation for missing values is only undertaken for age,sex, marital status and the statistical local area of usual resi-dence. Most other missing values are left as “not stated” inthe final data.
3. QUALITY OF CENSUS DATA
Data Quality
Timeliness
Budget
Quality at its broadest level of definition is multidimen-sional and involves elements of data quality, budget, andtimeliness. The aim of the approach to quality managementduring processing of the Australian Census is to improve allthree elements. It may be necessary to improve one ele-ment at the expense of another; for example, additional pro-cedures may be required to improve data quality at the ex-pense of budget allocation and timeliness. Census manage-ment will be responsible for balancing these three qualitycriteria. Processing tests have indicated that the processingoperations are likely to proceed according to budget andagreed timetables, therefore the major focus of the qualitymanagement strategy during the processing of the 1996Census will be data quality.
4. THE TOTAL QUALITY MANAGEMENT PHILOSOPHY
* PROCESS responsible for most errors in output
* CONTINUOUS QUALITY IMPROVEMENT
* TEAMS
* MEASURES of quality
* IDENTIFY CAUSES of quality problems
NEED TO ENSURE THE QUALITY OF DATA FOR EVERY CD-QUALITY ASSURANCE POINTS
The Total Quality Management philosophy is founded onthe belief that errors in the output of a process are primarilythe result of deficiencies in the process itself, rather thanthe actions of individuals working in that process. Thismeans that processing managers must take responsibilityfor throughput and data quality, as they are ultimately re-sponsible for the process in which their staff works. This isin contrast to many traditional approaches to quality, whichtarget individuals as the cause of quality problems ratherthan the process.
Implicit in this philosophy is the belief that most peopleswant to work and that the rate and quality of their work aredetermined by the process. Staff working on the processare also a very valuable resource, in that they are in the bestposition to advise on improvements to the process.
While most data quality problems will be the result ofdeficiencies in the process, it must also be recognized thatthe Census data for a Collection District (or CD) is a differ-entiated product, i.e., if a user of census data wants the datafor one CD, and this data is of poor quality, it cannot besubstituted with the data for another CD of higher quality.Therefore the quality of the data for each Collection Dis-trict must be of at least a minimum, acceptable standard. Itis for this reason that a series of quality assurance pointshave been put in place which every CD must go throughduring processing.
Continuous Quality Improvement is a core component ofTotal Quality Management. The fundamental differencebetween Continuous Quality Improvement and classic qual-ity control, is that instead of aiming to achieve a specifiedaverage quality limit, Continuous Quality Improvement aims

208
to continue to improve the quality of the output of a projectthroughout the life of that project. Continuous Quality Im-provement will determine the quality of the data producedover and above the minimum standard ensured by the qual-ity assurance points.
The other core components of the Total Quality Manage-ment approach are;
(i) Using teams of processing staff to identify and re-solve quality problems,
(ii) The use of quantitative measures of quality basedon discrepancies in the output of the process, and
(iii) The priority given to identifying and addressingthe root causes of these discrepancies.
5. PROCEDURES
* ADHERENCE is critical
* MANAGEMENT RESPONSIBLE for procedures
In a processing environment such as the Census Process-ing center, with approximately 1,000 Processors, each re-sponsible for coding individual Collection Districts, adher-ence to procedures is critical. At the same time, Processorsshould have the widest possible discretion to make deci-sions in accordance with established procedures.
Managers are responsible for the procedures, includingidentifying deficiencies and reviewing procedures, to en-sure accurate and consistent processing. Procedures can beincomplete, inconsistent or misleading to staff. A source ofinformation on the effectiveness of procedures and trainingis needed, and that source is the staff.
6. TRADITIONAL QUALITY CONTROL SYSTEMS AND QUALITY MANAGEMENT
TRADITIONAL QUALITY CONTROL SYSTEMS
The objectives of traditional Quality Control systems,which use experts to inspect the work of mainstream opera-tors, are;
(i) To ensure that errors in the output do not exceedsome specified level,
(ii) To improve the quality of the individual’s work byproviding feedback, and
(iii) To prevent the Processor from deliberately deviat-ing from procedures, through the threat of inspec-tion.
Quality Control systems also usually involve the rework-ing or correction of rejected units of work.
Criticisms of this approach are that;
(i) It adds significantly to the cost of the operation,
(ii) Those errors in the inspection process can fail todetect true errors or falsely identify errors,
(iii) The correction process can introduce errors intothe data,
(iv) Operators take less responsibility for the qualityof their work, believing it to be the responsibilityof the inspectors,
(v) Where not all units are inspected, the quality ofdata is only ensured for those units that are selected.
1996 Census Quality Management
At the core of the quality management process is the mea-surement of the quality of the data. While this shares manyof the features of the process used for traditional QC sys-tems, many of the operational aspects and the uses to whichthe data are put are quite different
1996 CENSUS PROCESSING QUALITY MONITORINGSYSTEM
The Quality Monitoring System in use during census pro-cessing is a conventional inspection system in many respects.A sample of each Processor’s work is selected for repro-cessing by a Processor from another Section. The data filesproduced by the two iterations are compared, and any mis-matches between these two files are resolved by an Adjudi-cator from a third Section, who determines what the “cor-rect” code or balancing should have been. A discrepancy iswhere either the original or QM Processor’s code does notagree with the Adjudicator’s code. The Adjudicator alsohas the opportunity to provide feedback to the individualconcerned. Quality Monitoring processing will all take placein the main processing environment.
The Quality Monitoring System differs from traditionalQuality Control systems in that “rejected” CDs will not bereworked. The rationale behind not reprocessing CDs ex-cept in disaster situations is that the benefit of correcting alldiscrepancies is not justified by the cost. For example, ifthe overall error rate for Occupation coding is 10%, and ourQuality Monitoring sample rate for Occupation is 10%, cor-recting all the discrepancies which are discovered for Oc-cupation could only reduce the overall error rate for thatfield to 9%. The effects of errors in the inspection processwould further reduce the actual improvement in the errorrate for Occupation, and errors introduced during correc-tion.
Clearly the resources required to recode all discrepanciesis not justified. However, as mentioned earlier, CDs are adifferentiated product, reprocessing will be required whereQuality Monitoring processing identifies severe data qual-ity problems. This will particularly apply when we findmajor problems in the Balancing of a CD, which determinesthe record structure of the data file, for example where alarge number of dwellings have not been inserted.
Another feature of the Quality Monitoring System, whichdiffers from traditional Quality Control systems, is that pro-cessing staff in the main production areas will be used toperform the Adjudication of discrepancies rather than ex-pert coders. The main reason for this is that experts tend touse their expert knowledge and extraneous informationrather than following procedures to get a “correct” code.The aim of the quality management process is the imple-mentation and promotion of consistent adherence to correctprocedures.

209
Discrepancy rate data produced by the Quality Monitor-ing System will show the discrepancy rate for both the origi-nal and QM Processor, for each field coded, for each CDcoded through the Quality Monitoring System. It’s impor-tant to note that these are not error rates, they are measuresof inconsistency in processing.
7. THE CONTINUOUS QUALITY IMPROVEMENT CYCLE
The following four-step cycle for implementing Continu-ous Quality Improvement will be used:
Step 1 of the cycle is to measure quality
Step 2 is to identify the most important quality problems
Step 3 is to identify the root causes of these important quality problems
Step 4 is to implement corrective action and measure quality once again
8. STEP 1 - MEASURE QUALITY
* QMS Discrepancy Rate Data
* Accept - Reject Scheme
* Control Charts
The Quality Monitoring System outline above is used toproduce discrepancy rates.
An Accept - Reject scheme will produce a report of CDswhere the error rate for any field is above that defined asacceptable by the Quality Assurance Manager. This allowsthe identification of those Processors who require some formof re-training, either through on-the-job training by theirSection Leader, or formal training.
CONTROL CHART - OCCUPATION
Control Charts will also be produced from the discrep-ancy rate data. These charts plot the discrepancy rates on aweek-by-week basis against the same acceptable error rateused by the Accept - Reject scheme, and warning and con-trol limits, as in this example for Occupation from the DressRehearsal.
These charts allow the monitoring of fluctuations in thediscrepancy rate for the coding of a particular field.
9. STEP 2 - IDENTIFY THE MOST IMPORTANTQUALITY PROBLEMS
The Quality Monitoring System will also produce dis-crepancy profile data, which will be used to identify whichparticular codes are being assigned incorrectly. This datacan be presented using standard Management InformationSystem (MIS) reports.
Step 2 of the Continuous Quality Improvement cycle re-quires the identification of the most important quality prob-lems. The discrepancy rate data will be used to determine
which fields will need to be targeted, and then the discrep-ancy profile data will be used to identify what the most im-portant data quality problems are for these fields.
DRESS REHEARSAL DISCREPANCY PROFILEOCCUPATION— ALL DISCREPANCIES
Individual Frequency: 1 Total Discrepancies: 1558
Total Frequency: 1
The first stage of this step is to determine what the mostfrequent discrepancies are. This example using Occupationdiscrepancy data from the Dress Rehearsal gives an indica-tion of how a discrepancy profile report looks when all dis-crepancies are considered. This report is in fact thirty-oddpages long.
The Total Frequency is the sum of the discrepancies inwhich this was the correct code. The Individual Frequencyis the number of times this was the incorrect code for thecorrect code being profiled. Even using the data from thesmall number of CDs selected for QM processing at theDress Rehearsal, this is not a very useful profile. It’s verydifficult to see what the most frequent discrepancies are.
PARETO ANALYSIS
* Total Frequency
* Individual Frequency
What is needed is some form of Pareto analysis, whichwill allow the identification of the most prevalent discrep-ancies. The MIS allows noise to be filtered from the data,through the removal of discrepancies below user-specifiedfrequency minima.
DRESS REHEARSAL DISCREPANCY PROFILEOCCUPATION
Individual Frequency: 4 Total Discrepancies: 1256
Total Frequency: 20
This is a much more useful profile.
The severity of the discrepancy also has to be considered.Occupation coding assigns a six-digit code, but one couldargue that discrepancies at the Major Group, or one-digitlevel, are more serious than discrepancies at the six-digitlevel. For example, whether a person’s occupation is codedto a manager or a clerk is a very significant discrepancy.
DRESS REHEARSAL DISCREPANCY PROFILEOCCUPATION—1 DIGIT
Individual Frequency: 4 Total Discrepancies: 639
Total Frequency: 20
The MIS also allows the data to be stratified by specify-ing which level of discrepancies are of most interest. If thereport is specified at the one-digit level, it can be seen thatnearly half of the original Occupation discrepancies havebeen coded to different major groups. The most prevalentof these discrepancies in this example are between MajorGroups 6 and 8 (“Intermediate Clerical, Sales and Service

210
Workers” and “Elementary Clerical, Sales and Service Work-ers”). This suggests that Processors are having trouble dif-ferentiating between these two groups.
10. STEP 3 - IDENTIFY THE ROOT CAUSES OF THESE IMPORTANT QUALITY PROBLEMS
* Case Reporting Forms
* Adjudication Feedback Reports
* Section Leaders
* Query Resolution
* Validation
* Quality Improvement Teams
In order to perform step 3 of the cycle, identifying theroot causes of these problems, more information is neededfrom a variety or sources.
10.1 Case Reporting Forms
Staff working in a process are in the best position to ad-vise on how that process can be improved. Processors willbe provided with Case Reporting Forms, which allow themto describe problems they have with a procedure, process-ing system or coding index. They’re also a vehicle for anysuggestions they might have as to how processes can beimproved.
10.2 Adjudication Feedback Reports
It was mentioned earlier that Adjudicators will have theopportunity to provide feedback to individuals, on the dis-crepancies between the code they assign and what the Ad-judicator feels is the correct code, through AdjudicationFeedback Reports. The major objective of these reports isto alert Processors to where they are not following proce-dures correctly.
Adjudicators will be trained to only provide feedback tothe individual Processor, in the form “you coded the responseto X when procedure N says to code the response to Y usingthese steps”. This is important, because most of the dis-crepancies found would be the results of deficiencies in theprocess, and not the responsibility of the individual Proces-sor, and the Adjudication Feedback Reports mustn’t send acontradictory message to our staff.
Processors will also have access to a coding simulator.Where appropriate, the Adjudicator will enter the responsein the feedback, so that the individual can use the codingsimulator to see how to arrive at the correct code for thatresponse.
Another benefit of these reports is that they encouragethe person performing the Adjudication to think about whythese discrepancies are occurring. This will enable them tomake a valuable contribution to identifying the root causesof the important data quality problems identified throughstep 2 of the Continuous Quality Improvement cycle.
10.3 Section Leaders
The Section Leaders are crucial to the success of ourQuality Assurance Strategy. Section Leaders will be re-cruited before Processors, so that they can become profi-cient with the procedures before their staff start, and will bein a position to reinforce, on the job, what the Processorsare taught in training.
Section Leaders will do most of the adjudication andthrough this process and the provision of feedback to theirstaff, they will also be in an ideal position to advise us ondeficiencies in our training, procedures, processing systemsand coding indexes.
It is vital that Section Leaders have an expert knowledgeof procedures, and are able to effectively communicate theseprocedures to the Processors. If Section Leaders do not fullyunderstand a procedure, they could potentially give thewrong direction to Processors in their own Section and tothose of the other two Sections, which they provide withAdjudication Feedback.
10.4 Query Resolution
Information on every query raised will be stored on a da-tabase by the Query Resolution System. This informationincludes the response on the Census form, the code assigned,and an indicator of why the response required a query to beraised. By stratifying the queries according to this indica-tor, we’ll be able to see where we can improve the processso that fewer queries are raised. As the raising of queries istime-consuming, any reduction in the number of queriesraised will have a positive effect on throughput and themorale of Processors. This will also provide a very usefulreference source for improving the design for the next cycle.
One of these indicators identifies those responses thatcould have been coded using existing procedures. Analysisof these responses will give us an indication of which pro-cedures need to be reinforced through retraining or the cir-culation of procedural reminders.
10.5 Validation
The data released from Census Processing to CensusOutput will be fully validated. This will be done by com-paring 1996 Census data with data from previous censusesand other sources such as other surveys undertaken by theABS and administrative data. Problems identified duringthe ongoing validation of the data for a state will feed intothe Continuous Quality Improvement process, and actiontaken to address these problems.
10.6 Quality Improvement Teams
The use of teams to identify and propose solutions to qual-ity problems is central to the Total Quality Managementapproach. During processing, Quality Improvement Teamswill be responsible for the following areas:
(i) Precapture,

211
(ii) Balancing,
(iii) Samples and Address coding,
(iv) Family coding,
(v) Business coding (Industry, Industry Sector, Jour-ney to Work),
(vi) Occupation and Qualifications coding, and
(vii) Work Environment.
The focus of these teams is to provide a formal mecha-nism through which processing staff on the floor can con-tribute to improving the process in which they work. Eachteam will be made up of Processors and Section Leaders,with a Group Leader in the role of facilitator and classifica-tion experts where appropriate. Quality Improvement Teamswill meet once a week to start off with, but meetings maybe held less frequently once the major problems with theprocess are addressed. Participation by staff in these Qual-ity Improvement Teams will be encouraged and some rota-tion of members may be required.
QUALITY IMPROVEMENT TEAMS INFORMATIONFLOWS
The function of these teams will be to perform step threeof the Continuous Quality Improvement cycle; to identifythe root causes of the important quality problems, and torecommend corrective action to address these problems. Allof the sources of information mentioned will be flowed intothese Quality Improvement Teams. Members will also beencouraged to liaise with staff in their area to identify prob-lems not raised through formal channels.
It is expected that the discussions in the Quality Improve-ment Teams will be wide-ranging and members must feelfree to raise any issues they think are relevant. It is impor-tant that individuals are provided with information aboutthe process if they request it, otherwise they wont be in aposition to make sound suggestions for improving the pro-cess and will be less willing to contribute to ContinuousQuality Improvement.
The minutes of the QIT meetings will be distributed toProcessors through their Section Leaders. Changes to beimplemented should be seen to come from the QIT, ratherthan from Census management.
11. STEP 4 - IMPLEMENT CORRECTIVE ACTIONAND RETURN TO STEP 1
* Quality Improvement Team Reports
* Quality Management Steering Committee
* Corrective Action
(i) Procedures
(ii) Coding Indexes
(iii) Processing Systems
(iv) Training
* Continue Measuring Quality
The first part of step four of the cycle is to implementcorrective action to address the root causes of the qualityproblems identified in step three.
Each Quality Improvement Team will produce a reportoutlining the issues covered at each meeting, including anysuggestions for corrective action. These reports will be con-sidered by the Quality Management Steering Committeeheaded by the Quality Assurance Manager. Any proposedchanges will be examined by the Quality Management Steer-ing Committee before implementation, as the ramificationsof these changes must be predictable and fully understoodbeforehand and be prioritized.
The Quality Management Steering Committee will pro-vide feedback to the Quality Improvement Teams on theissues raised in their reports and any proposed correctiveaction. It’s important that the contribution of Processorsand Section Leaders is acknowledged, otherwise this con-tribution may not continue.
In the context of Census processing, the forms of correc-tive action available include:
(i) Changes to procedures,
(ii) Changes to coding indexes
(iii) Changes to the processing systems
(iv) Retraining, additional training or procedural re-minders.
The second part of step four is to continue to measurequality and evaluate the effectiveness of the corrective ac-tion implemented. As the most important quality problemsare resolved, the cyclical approach will continue and go onto target the next most important set of problems, so thatthe quality of the process is being continuously improved.
12. THE ROLE OF LINE MANAGEMENT
* Explain Total Quality Management Philosophy
* Consistency
* Promote Continuous Quality Improvement
Line management has responsibility for quality, firstly byensuring that staff understand the management philosophy.It is important that the rationale behind the Total QualityManagement approach is explained when temporary staffare employed and are introduced to the Quality MonitoringSystem, as it is in some ways counter- intuitive. For ex-ample, staff do not always understand how so much empha-sis can be placed on data quality, yet “errors” detectedthrough QM processing are not corrected.
Line management must ensure that their behavior is con-sistent with the Total Quality Management philosophy, asstaff soon pick up on inconsistencies between what manag-ers practice and what managers preach. This approach tomanagement is based on placing trust in staff to do a goodjob, which is often inconsistent with some managers’ desireto exercise total control over the process.

212
Census processing managers need to ensure that staff com-ments and observations are fed into the Continuous QualityImprovement process. The belief that it is the process ratherthan the individual that determines the quality of outputneeds to be reinforced though the whole approach to man-agement. Managers should ensure that both formal and in-formal means are used to encourage staff to contribute toContinuous Quality Improvement, and that staff are com-fortable in giving their opinions.
A culture in which everyone has the opportunity to con-tribute to Continuous Quality Improvement at the CensusProcessing center needs to be created. The temporary staffwill perform basically repetitive clerical and screen basedtasks, and it is up to managers to motivate them and to en-courage them to assume some ownership of their work. Thiscan be done by promoting a commitment to the Total Qual-ity Management philosophy, and by adopting a consistentand thematic approach to management.
NOTE: The present example was provided by the AustralianBureau of Statistics.

213
ANNEX V
TIME AND EQUIPMENT ESTIMATIONS FOR MANUAL CENSUS DATA ENTRYAND SCANNER CENSUS DATA ENTRY

214

215
Traditional data entry
1 Population: 25,000,000
2 Housing: 6,345,000
3 Estimated average household size: 5.5 Characters
4 Estimated population information length: 55 Characters
5 Estimated housing information length: 37 Characters
6 Estimated enumeration areas: 80,000
7 Geographical identification fields: 20 Characters
8 Population 6 years and over: 85 Percentage (from total population)
9 Population 15 years and over: 59 Percentage (from total population)
10 Female population 15 years and over: 34 Percentage (from total population)
11 Active population: 47 Percentage
12 Errors and retyping information: 10 Percentage
13 Double entry verification: 40 Percentage
Population/cases Characters that need Keystrokes Questions related to: Percentageto be entered
80,000 20 1,600,000 Geographical ID 100
6,345,000 8 50,760,000 House No. and household No. 100
25,000,000 35 875,000,000 Total population 100
21,250,000 5 106,250,000 Population 6 years and over 85
14,750,000 2 29,500,000 Population 15 years and over 59
11,750,000 7 82,250,000 Active population 47
13,250,000 2 26,500,000 Inactive population 53
8,500,000 6 51,000,000 Female population15 years and over 34
6,345,000 37 234,765,000 Housing records 100
Subtotal 1,457,625,000
Errors and duplication. 685,083,750 47
Verification 145,762,500 10
Total number of characters that need to be entered 2,288,471,250

216
To estimate the duration of the census data entry, the following hypothesis has been used:
22 working days per month
7,000 numeric keystrokes per hour per operator
6 productive hours per shift in an 8-hour shift
2 operator shifts per day
6 months to accomplish data entry
5 months to accomplish coding
20 total coders per shift
15 total data-entry operators per group
The time and equipment estimates needed for the census data entry are as follows:
2,288,471,250 characters at 7000 keystrokes per hour = 326,924 hours
326,924 hours at 12 hours per day = 27,244 days, with two shifts
27,244 days at 22 working days per month = 1,238 months, with one microcomputer
1,238 months at a 6 month limit = 206 microcomputers
Item Quantity Description
1 5 One file server per region (with large memory) Large hard disk “Ultra-2 WideSCSI”, CD-ROM/DVD, tape back-up LAN adapter, keyboard and accesso-ries (including desks and network cable)
2 206 Workstations LAN adapter, keyboard and accessories (including desks andnetwork cable)
3 21 Terminals for data-entry team leaders LAN adapter, keyboard and accesso-ries (including desks and network cable)
4 2 Recordable CD-ROM/DVD unit (external)
5 58 Uninterruptible power unit 206 PCs + 21 PCs
6 5 Uninterruptible power unit, with special capabilities for the 5 servers
7 10 24 ports “hub”, including cables to interconnect hubs
8 5 Windows NT or NetWare (50 users)
9 1 Miscellaneous

217
10 2,160 Coders (432 x 5 months), according to the following estimates:22 working days per month 1 coder can code occupation and industry vari-ables for 300 persons in one working day (11,750,000 active population) 1coder can code geographical variables (place of residence, previous residence,etc.) of 3,000 people in one working day
11 108 Coders supervisors (1 supervisor x 20 coders x 5 months)
12 5 Chief of coding services 5 months
13 2,472 Data-entry operators (206 operators x 2 shifts x 6 months)
14 168 Data-entry supervisors (1 supervisor x 15 operators x 6 months)
15 60 Network administrators 5 servers x 2 shifts x 6 months
16 12 Data-processing and data-entry chiefs
DATA PROCESSING
17 4 2 fast microcomputers for data-processing tasks
2 fast microcomputers for program development, control and support activi-ties CD-ROM/DVD, large hard disk, floppy LAN adapter, keyboard andaccessories (including desks and network cable)
18 6 2 fast laser printers and 4 standard laser printers
19 1 Miscellaneous
20 4 Network administrator (1 x 4 months)
21 30 Programmers (2 x 15 months)

218
SCANNER CENSUS DATA ENRTY
1. Population: 16,000,000
2. Housing: 4,423,000
3. Estimated average household size: 3.5
4. Estimated population record length: 66 characters
5. Estimated housing record length: 25 characters
6. Estimated enumeration areas: 60,000
7. Geographical identification fields: 10 characters
8. Population 6 years and over: 90 per cent
9. Population 15 years and over: 63.4 per cent (from total population)
10. Female population 15 years and over: 34 per cent (from total population)
11. Errors and retyping information: 10 per cent
12. Double entry verification: 50 per cent
Population/cases Characters Keystrokes Comment Percentage
60,000 10 600,000 Geographical ID 100
4,423,500 5 22,117,500 House number and household number 100
16,000,000 44 704,000,000 Total population 100
14,400,000 2 28,800,000 Population 6 years and over 90
10,144,000 16 162,304,000 Population 15 years and over 63.4
5,440,000 4 21,760,000 Female population 15 years and over 34
4,423,500 25 110,587,500 Housing record 100
Subtotal 1,050,169,000
Errors and duplications 105,016,900 10
Verification 525,084,500 50
Total 1,680,270,400

219
CENSUS IMAGE PROCESSING
13. Pages to capture: 49,000,000
- Each questionnaire has 10 pages
- Estimated average household size is 3.5
- Need to process 4,900,000 questionnaires (the same as total houses + 10 per cent)
- The four questions, place of residence, previous residence, occupation and industry have 8 fields with
14. alphabetic characters to retrieve (120 in total per population record)
15. Scanner speed: 100 pages “duplex” per minute (Fujitsu M3099)
16. Working hours per day: 16 (from which only 14 show effective output)
17. Character recognition retrieval speed: 125 per second using a Pentium 200MHz
18. Data capture estimated duration: 4 months
19. Necessary scanners:
49,000,000 pages at 600 pages per minute = 81,667 minutes(six scanners)
81,667 minutes at 60 minutes per hour = 1,361 hours
1,361 hours at 14 hours per day = 97 days
97 days at 22 working days per month = 4 months,with 6 scanners

220
Equipment estimates:
Item Quantity Description
1. 6 Scanner: Fujitsu model M3099 GH (or similar)
2. 6 Images retrieval software
3. 3 One microcomputer to control two scanners: INTEL Pentium II 500 MHz (or better)PCI architecture, 512KB cache, 128 MB RAM SCSI-2 controller (for scanners) 8.0GB hard disk, diskette 1.44 MB 24xCD-ROM (or better), Ports: 1 parallel, 2 serialsPCI colour card, with 2 MB memory 15" colour monitor 101 enhanced keyboard
4. 3 DAT tape back-up units “Colorado power-tape”, 8.0 GB external
5. 18 Microcomputers to retrieve characters in 4 months (working 16 hours per day), withthe following specifications (125 cps using a Pentium 200; there are 199 characters ormarks in each population record and 38 characters or marks in housing records, inboth cases without including the geographical identification that is performed onlyone time at the beginning of the enumeration area: INTEL Pentium III 500 MHz (orbetter) PCI architecture, 512KB cache, 128 MB RAM 8.0 GB hard disk, diskette 1.44MB 32xCD-ROM (or better), Ports: 1 parallel, 2 serials PCI colour card, with 4 MBmemory 15" colour monitor 101 enhanced keyboard
6. 12 Microcomputers to be used to capture manually alphabetic fields that were not re-trieved properly by Nestor Reader (NCS Company): INTEL Pentium III 500 MHz (orbetter) PCI architecture, 256KB cache, 64 MB RAM 8 GB hard disk, diskette 1.44MB Ports: 1 parallel, 2 serials PCI colour card with 2 MB memory 15" colour moni-tor 101 enhanced keyboard
7. 2 One network server to control data-entry workstations One network server to controlcoders workstations, with the following characteristics: INTEL Pentium III 500 MHz(or better) PCI architecture, 512KB cache, 64 MB RAM 6.0 GB hard disk, diskette1.44 MB 24xCD-ROM, Ports: 1 parallel, 2 serials PCI colour card, with 2 MB memory15" colour monitor 101 enhanced keyboard
8. 35 Computer desks
9. 10 UPS APC2000 (for 12 workstations and 18 PCs dedicated to image processing)
10. 5 UPS APC700 NET, with power chute smart capability (for microcomputer control-ling scanner and two servers)
11. 3 2 KVA UPS for scanners
12. 3 Linkbuilder 10BT, “hub” with 12 ports
13. 2 Novell Intranet/Windows NT (25 users)
14. 3 Network cable installation
15. 2 Network interface 3COM Etherlink III 3C590 PCI 10BT
16. 3 Network interface 3COM Etherlink III 3C509 BTP
17. 1 CD-ROM recorder
18. 2 Automated data-entry system for character recognition and data processing manage-ment
19. 2 Paper cutters to split questionnaires so they can be processed by scanners
20. 1 Miscellaneous
21. 56 Scanners personnel (4 months, 2 shifts) 1 operator per each two scanners 1 operatorper paper cutter
22. 24 Supervisor of scanners teams (4 months, 2 shifts)

221
23. 96 Data-entry operator (for those images that were unable to be retrieved by scanners) 12operators (4 months, 2 shifts)
24. 8 Supervisor for previous operators 1 supervisor per group (4 months)
25. 10 Questionnaire reception, manual verification and storage: 90 per cent will have nomajor problems but 10 per cent will need 5 minutes of staff time for repair (4 months)
NB: The equipment may increase if the questionnaire requires more than one page to record one-person data.
DATA PROCESSING
Item Quantity Description
1. 4 2 microcomputers for data processing 2 microcomputers for program development,control tasks and support INTEL PentiumIII-500 MHz (or better) PCI architecture,256KB cache, 128 MB RAM 8.0 GB hard disk, diskette 1.44 MB 32xCD-ROM (orbetter) Ports: 1 parallel, 2 serials PCI colour card with 4 MB memory 15" flat screencolour monitor (0.28mm 1280x1024) 101 enhanced keyboard
2. 4 Computer desks
3. 2 UPS APC1250 smart (for data-processing microcomputers)
4. 1 Fast laser printer
5. 4 Standard laser printers
6. 2 Network interface 3COM Etherlink III 3C509 BTP
7. 4 Network cable installation
8. 1 Miscellaneous

222

223
ANNEX VI
EXAMPLE OF A TABLE OF CONTENTS OF A MODEL CONTRACT FOR THEPROVISION OF A CENSUS PROCESSING SYSTEM
Draft agreement betweenCensus Agency
and[Name to be supplied]
for the provision of a Census Processing System

224
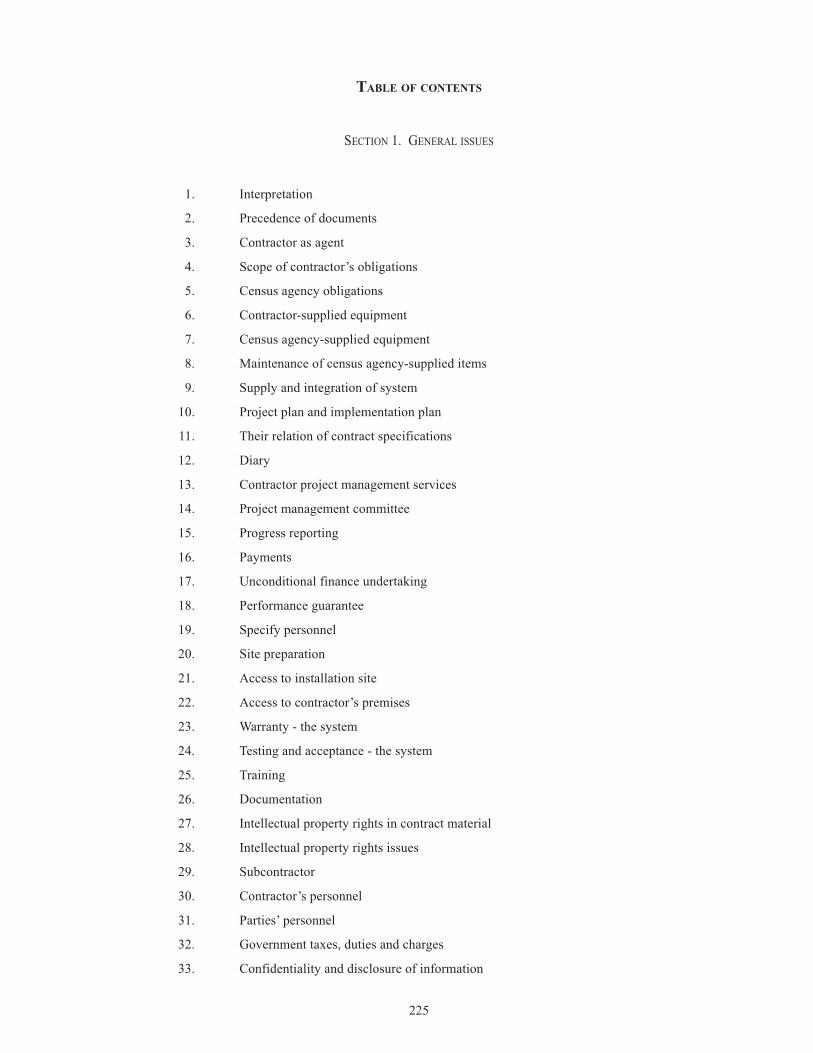
225
TABLE OF CONTENTS
SECTION 1. GENERAL ISSUES
1. Interpretation
2. Precedence of documents
3. Contractor as agent
4. Scope of contractor’s obligations
5. Census agency obligations
6. Contractor-supplied equipment
7. Census agency-supplied equipment
8. Maintenance of census agency-supplied items
9. Supply and integration of system
10. Project plan and implementation plan
11. Their relation of contract specifications
12. Diary
13. Contractor project management services
14. Project management committee
15. Progress reporting
16. Payments
17. Unconditional finance undertaking
18. Performance guarantee
19. Specify personnel
20. Site preparation
21. Access to installation site
22. Access to contractor’s premises
23. Warranty - the system
24. Testing and acceptance - the system
25. Training
26. Documentation
27. Intellectual property rights in contract material
28. Intellectual property rights issues
29. Subcontractor
30. Contractor’s personnel
31. Parties’ personnel
32. Government taxes, duties and charges
33. Confidentiality and disclosure of information

226
34. Monitoring of sales to government
35. Secrecy and security
36. Indemnity
37. Insurance
38. Liability
39. Liquidated damages
40. Termination
41. Money recoverable by census agency
42. Termination with compensation
43. Compliance with the laws
44. Applicable law
45. Variation and waiver
46. Extension of time
47. Delay costs
48. Agreement and notation
49. Dispute resolution
50. Entire agreement
51. Purchasing policy on specified suppliers
52. Notices
53. Warranty as to contract
54. Conditioned as to disclosure by contractor
55. Standards and quality compliance
SECTION 2. HARDWARE ACQUISITION AND INSTALLATION
56. Section 2 applicability
57. Interpretation
58. Title and risk
59. Contractor’s hardware specifications
60. Hardware warranty
61. Delivery and installation of hardware
62. Testing and acceptance of hardware
SECTION 1. GENERAL ISSUES (continued)

227
SECTION 3. HARDWARE MAINTENANCE
63. Section 3 applicability
64. Interpretation
65. Provision of hardware maintenance service
66. Maintenance service period
67. Standard of hardware maintenance service
68. Preventative maintenance
69. Remedial maintenance
70. Warranty - hardware maintenance service
71. Basic maintenance period
72. Hardware and minimum system configuration availability
73. Substandard hardware and system availability
74. Spares, test hardware and diagnostic routines
75. Engineering changes
76. Hazardous conditions
77. Movement of hardware
78. Maintenance records
SECTION 4. SOFTWARE LICENSE AND SUPPORT
79. Section 4 applicability
80. Scope of license obligations
81. License
82. Period a license
83. Contractors licensed software and services specifications
84. License fees and charges some
85. Delivery and installation of licensed software
86. Testing and acceptance of licensed software
87. Licensed software warranty
88. Specified operating environment
89. Conduct of the license
90. Support services
91. Software services
92. Updates and new releases
93. Protection and security of licensed software
94. Conversion of license
95. Escrow and source code
228
SECTION 5. SOFTWARE DEVELOPMENT
96. Section 5 applicability
97. Scope of software development services
98. Developed software specifications
99. Developed software detailed design specifications
100. Development of developed software
101. Delivery and installation of developed software
102. Acceptance test data
103. Testing and acceptance of developed software
104 conduct of software services
105. Developed software warranty
106. Specified operating environment
107. Support services
108. Developed software documentation
109. Source code
SECTION 6. DATA MIGRATION SERVICES
110. Section 6 applicability
111. Census agency data for migration
112. Contractor to supply data migration services
113. Testing of migrated data
114. Data migration source code
115. Migrated data warranty
229
Schedules
1. Census agency functional specifications
2. Diary
3. Agreement details
4. List of contractor-supplied equipment and prices
5. List of census agency-supplied items acquired by contractor as agent
6. List of census agency-supplied items not acquired by contractor as agent
7. Project planning
8. Implementation plan
9. Testing acceptance
10. Specified subcontractors
11. Statutory declaration by subcontractor
12. Public liability and other relevant insurance
13. Unconditional financial undertaking
14. Performance guarantee
15. Intellectual property rights in contract materials
16. Deed of confidentiality, Fidelity and ownership of intellectual property rights
17. Escrow agreement
18. Mechanism for variation of prices, license fees and charges
NOTE: The present example was provided by the Australian Bureau of Statistics.

230

231
ANNEX VII
EXAMPLES OF CENSUS QUESTIONNAIRE FORMS
The statistical offices of Argentina, Botswana, NewZealand, South Africa and Uruguay have provided examplesof the census questionnaires used in their most recent census.

232

233

234

235

236

237

238

239

240

241

242

243

244

245

246
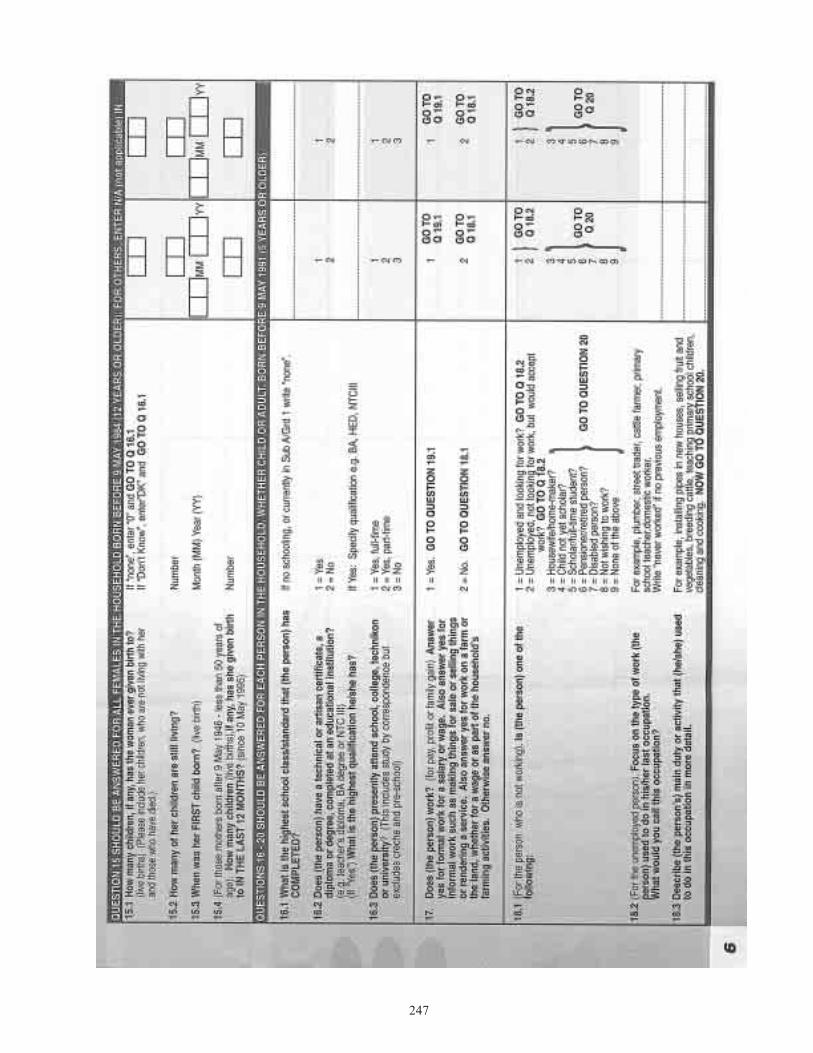
247

248
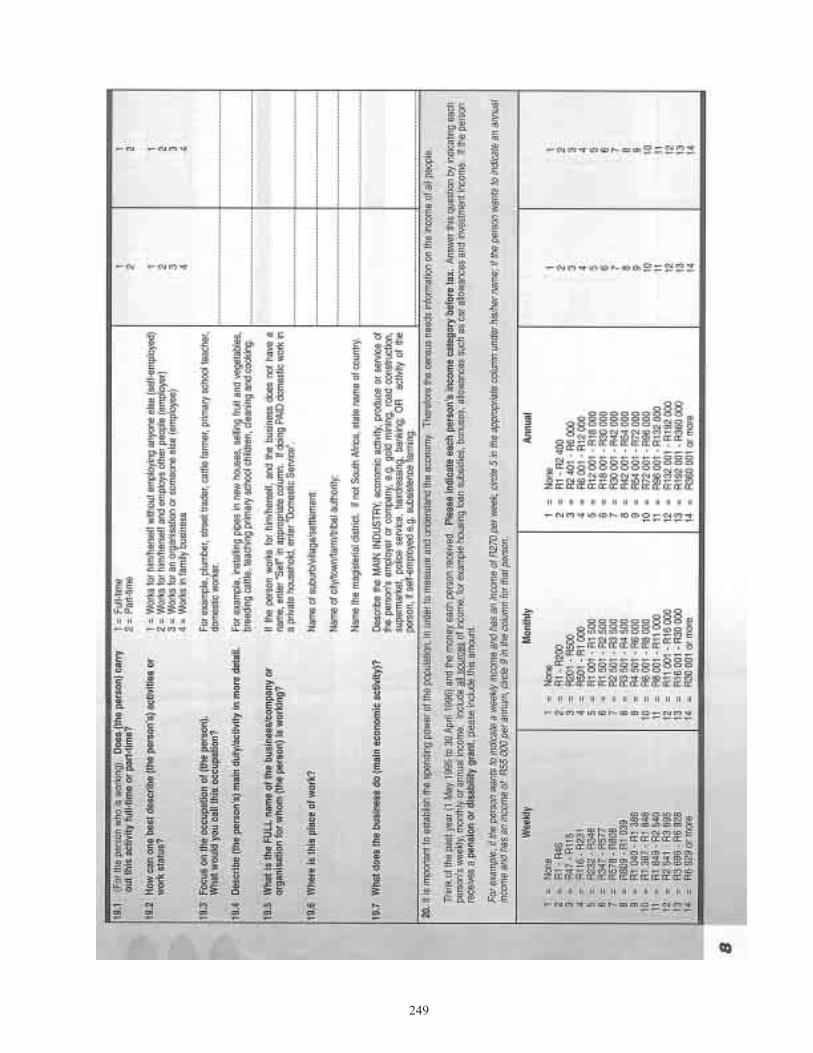
249

250

251

252

253

254

255

256

257
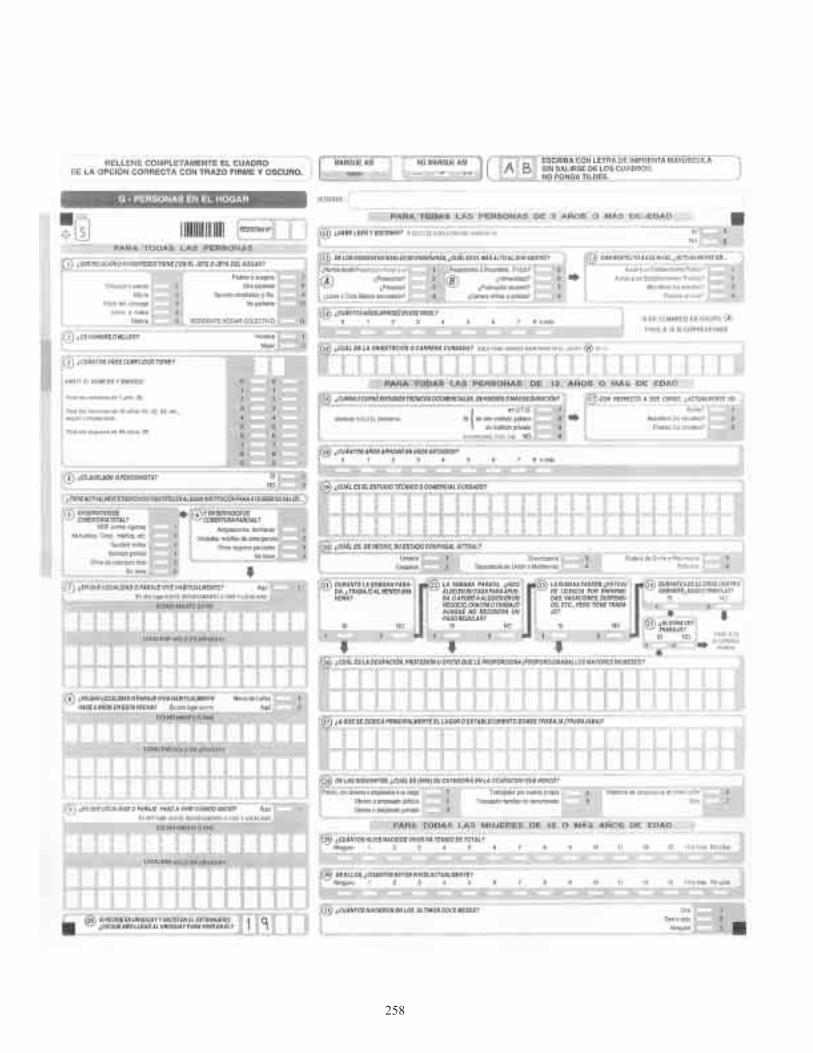
258

259

260

261