i n v e s t o r p r e s e n t a t i o...
TRANSCRIPT

I N V E S T O R P R E S E N T A T I O N
Q3’ 2017 RESULTS
Important Information
2
This presentation includes certain “forward-looking statements" within the meaning of the Private Securities Litigation Reform Act of 1995, including statements
concerning our cash flow and margin improvement expectations, our position to execute on our growth strategy in the mid-market, and our ability to expand our
leadership position and market opportunity for our inbound platform. These forward-looking statements include, but are not limited to, plans, objectives, expectations
and intentions and other statements contained in this press release that are not historical facts and statements identified by words such as "expects," "anticipates,"
"intends," "plans," "believes," "seeks," "estimates" or words of similar meaning. These forward-looking statements reflect our current views about our plans, intentions,
expectations, strategies and prospects, which are based on the information currently available to us and on assumptions we have made. Although we believe that our
plans, intentions, expectations, strategies and prospects as reflected in or suggested by those forward-looking statements are reasonable, we can give no assurance that
the plans, intentions, expectations or strategies will be attained or achieved. Furthermore, actual results may differ materially from those described in the forward-
looking statements and will be affected by a variety of risks and factors that are beyond our control including, without limitation, our history of losses, our ability to retain
existing customers and add new customers, the continued growth of the market for an inbound platform; our ability to differentiate our platform from competing
products and technologies; our ability to manage our growth effectively to maintain our high level of service; our ability to maintain and expand relationships with our
marketing agency partners; our ability to successfully recruit and retain highly-qualified personnel; the price volatility of our common stock, and other risks set forth
under the caption "Risk Factors" in our Quarterly Report on Form 10-Q filed on November 1, 2017 and our other SEC filings. We assume no obligation to update any
forward-looking statements contained in this document as a result of new information, future events or otherwise.

33
A leading CRM, marketing, sales, and customer experience platform
Total Customers
37,000+
Countries
90+Office Locations Worldwide
7

44
Why does exist?

55
2006
Humans are changing
94% skip TV ads
94% unsubscribefrom email
27% direct mail
isn’t opened
50% are on do not
call lists
Base: Varied bases, minimum 598 global digital consumers
Source: HubSpot Global Interruptive Ads Survey, Q4 2015 – Q1 2016.

66
2017
Humans are changing
Base: Varied bases, minimum 598 global digital consumers
Source: HubSpot Global Interruptive Ads Survey, Q4 2015 – Q1 2016.

77

How does Inbound work?
8
Aggressively pushes content at innocent bystanders, interrupting
their life
Outbound
Cold Calling | Spam | Interruptive Ads
VS.
Pulls in prospects by offering helpful content and experience when they
need it
Inbound
SEO | Blogs | Social

Inbound is about the size of your brain, not the width of your wallet
9

The Inbound Methodology
10
The best way to turn strangers into customers and promoters of your business
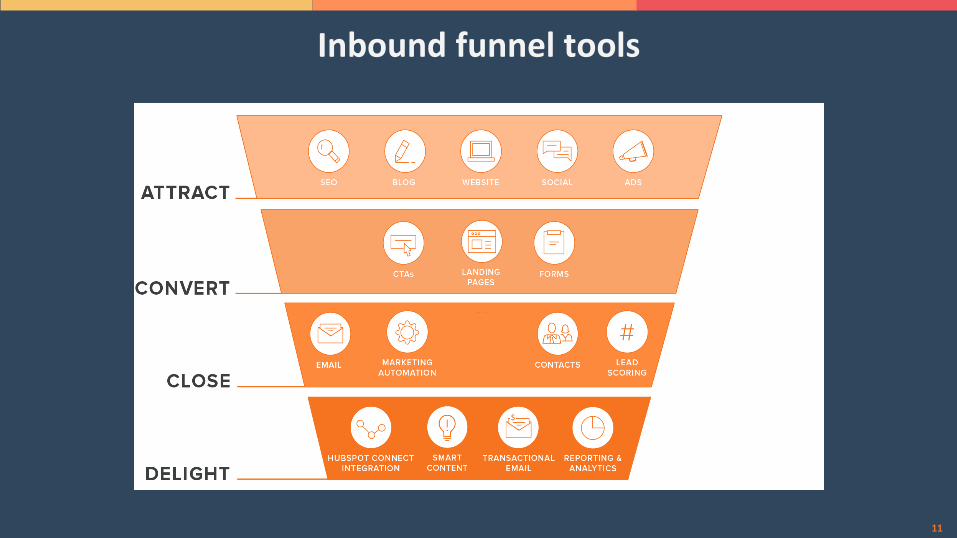
Inbound funnel tools
11

1212
2017
Mid-market companies are asking for

Our all-in-one solution
13
Content Creation,
SEO, Social Media,
Marketing
Automation
Email Templates,
Meetings,
Notifications,
Sequences
Contact Timeline,
Lead Enrichment,
Prospects,
Analytics

Front Office Platform
14
10 – 2kEmployees
} $45bnTAM}
-AMI Partners data, 2014 and HubSpot Estimates

The Inbound Community
15
Inbound numbers based off of Inbound 2017.Academy numbers based of Q3’17.Inbound.org, and Linking Domains numbers based of Q1’17
21,000+ Registered AttendeesWhere the inbound movement grows every year
Thousands of PartnersHubSpot provides training and support to our marketing agency partners, working together to sell our products.
100,000+ CertificationsHubSpot’s one-stop-shop for free education on all things inbound
150,000+ MarketersWhere the inbound movement grows the other 360 days of the year
49,000+ Linking DomainsThe number of websites linking back to HubSpot, providing us with both authority in search engines and recognition among industry professionals

16
Marketing Pricing
Upgrade based on database size Cross-sell
Sales product
Sales Pricing
Cross-sell Marketing product
Upgrade based on number of seats
10,000Contacts
1,000Contacts
100Contacts
S T A R T E R
$600/year
B A S I C
$2,400/year
P R O
$9,600/year
E N T E R P R I S E
$28,800/year
200Seats
0Seats
S T A R T E R
$50/month
P R O F E S S I O N A L
$400/month

Why HubSpot?
17
Go-To-Market
PeoplePlatform

F I N A N C I A L R E V I E W | T H I R D Q U A R T E R - 2 0 1 7

19
Summary
19
Fast-growing SaaS platform with positive mix-shift towards multi-product offering
Largely untapped global opportunity for growth
Margin improvement allows for incremental improvements in cash flow
Commitment to balancing top and bottom line growth allows for continued operating leverage

20
Revenue Growth Since IPO
20
$30.4$34.2
$38.2$42.9
$47.7
$53.1
$59.0
$65.0
$70.6
$76.4
$82.3
$89.1
$97.7
Q3'14 Q4'14 Q1'15 Q2'15 Q3'15 Q4'15 Q1'16 Q2'16 Q3'16 Q4'16 Q1'17 Q2'17 Q3'17
In Millions of USD

21
Increasing International Footprint
% of Total Revenue
78%
22%
Q3'14
Domestic International
67%
33%
Q3'17
Domestic International
% of Total Revenue

22
Steady progress in Gross & Operating Margin Trajectory
22
Gross Margin (Non-GAAP) Operating Margin (Non-GAAP)
70% 72% 73% 75% 75% 75% 77% 78% 78% 79% 80% 80% 81%
-32% -21% -16% -13% -18% -8% -6% -4% -2% -6% 2% 3% 0.5%
Q3’14 Q4’14 Q1’15 Q2’15 Q3’15 Q4’15 Q1’16 Q2’16 Q3’16 Q4’16 Q1’17 Q2’17 Q3’17
All percentages for historical and future periods are non-GAAP and exclude expenses associated with stock based compensation, amortization of acquired intangibles, and acquisition related expenses. Please refer to the end of this presentation for a reconciliation of GAAP to non-GAAP figures.

23
Framework For Growth And Profitability
23
Revenue Growth
Operating Margin %
Operating Cash Flow
<30%
3-4%increase per year
Moderate Growth
>30%
1-2%increase per year
≈ Revenue Growth
High Growth
30%
2-3%increase per year
Growth
All percentages for historical and future periods are non-GAAP and exclude expenses associated with stock based compensation and amortization of acquired intangibles. Please refer to the end of this presentation for a reconciliation of GAAP to non-GAAP figures.

24
Long Term Model
2014 2015 2016 Q1‘17 Q2’17 Q3‘17
GROSS MARGIN
70% 75% 78% 80% 80% 81%
R&D% of Revenue
17% 14% 14% 13% 14% 16%
S&M% of Revenue
63% 58% 55% 52% 51% 54%
G&A% of Revenue
18% 16% 14% 13% 12% 11%
OPERATING MARGIN
(28%) (14%) (4%) 2% 3% 0.5%
Long Term Target Model
80%
15%
30 - 35%
10%
20 - 25%
All percentages for historical and future periods are non-GAAP and exclude expenses associated with stock based compensation, amortization of acquired intangibles, and acquisition related expenses. Please refer to the end of this presentation for a reconciliation of GAAP to non-GAAP figures.

25
New Products
Large Domestic Opportunity
Expanding International Opportunity
Upsell Customers
1 2
3 4
Growth Strategy

2626
GAAP to Non-GAAP Reconciliation
26
HubSpot, Inc. Three Months Ended Three Months Ended Three Months Ended
GAAP to Non-GAAP Reconciliation
$ '000s
% of
Revenues $ '000s
% of
Revenues $ '000s
% of
Revenues $ '000s
% of
Revenues $ '000s
% of
Revenues $ '000s
% of
Revenues
Cost of Revenue
Subscription 23,655 20% 32,271 18% 41,182 15% 11,409 14% 12,492 14% 12,933 13%
Stock-based compensation (128) 0% (341) 0% (512) 0% (115) 0% (178) 0% (163) 0%
Amortization of acquired intangibles (118) 0% (70) 0% (57) 0% (9) 0% 0% (38) 0%
Acquisition related expenses - 0% - 0% - 0% - 0% - 0% - 0%
Non-GAAP subscription 23,409 20% 31,860 18% 40,613 15% 11,285 14% 12,314 14% 12,732 13%
Professional services and other 11,425 10% 15,652 9% 20,683 8% 5,663 7% 6,099 7% 6,077 6%
Stock-based compensation (498) 0% (1,216) -1% (1,640) -1% (449) -1% (666) -1% (591) -1%
Amortization of acquired intangibles - 0% - 0% - 0% - 0% - 0% - 0%
Acquisition related expenses - 0% - 0% - 0% - 0% - 0% - 0%
Non-GAAP professional services and other 10,927 9% 14,436 8% 19,043 7% 5,214 6% 5,433 6% 5,486 6%
Gross Margin
Gross margin 80,796 70% 134,020 74% 209,102 77% 65,180 79% 70,502 79% 78,716 81%
Stock-based compensation 626 1% 1,557 1% 2,152 1% 564 1% 844 1% 754 1%
Amortization of acquired intangibles 118 0% 70 0% 57 0% 9 0% - 0% 38 0%
Acquisition related expenses - 0% - 0% - 0% - 0% - 0% - 0%
Non-GAAP gross margin 81,540 70% 135,647 75% 211,311 78% 65,753 80% 71,346 80% 79,508 81%
Operating Expenses
Research and development 25,638 22% 32,457 18% 45,997 17% 13,370 16% 15,889 18% 18,828 19%
Stock-based compensation (6,190) -5% (6,327) -3% (8,828) -3% (2,442) -3% (3,461) -4% (3,110) -3%
Amortization of acquired intangibles - 0% - 0% - 0% - 0% - 0% - 0%
Acquisition related expenses - 0% - 0% - 0% - 0% - 0% (439) 0%
Non-GAAP research and development 19,448 17% 26,130 14% 37,169 14% 10,928 13% 12,428 14% 15,279 16%
Sales and marketing 78,809 68% 112,629 62% 162,647 60% 46,672 57% 50,708 57% 57,904 59%
Stock-based compensation (5,596) -5% (7,658) -4% (13,352) -5% (3,770) -5% (5,113) -6% (5,015) -5%
Amortization of acquired intangibles (20) 0% (26) 0% (27) 0% (7) 0% - 0% - 0%
Acquisition related expenses - 0% - 0% - 0% - 0% - 0% - 0%
Non-GAAP sales and marketing 73,193 63% 104,945 58% 149,268 55% 42,895 52% 45,595 51% 52,889 54%
General and administrative 24,958 22% 35,408 19% 45,120 17% 13,138 16% 14,482 16% 14,110 14%
Stock-based compensation (3,946) -3% (5,766) -3% (8,343) -3% (2,527) -3% (3,588) -4% (3,231) -3%
Amortization of acquired intangibles - 0% - 0% - 0% - 0% - 0% - 0%
Acquisition related expenses - 0% - 0% - 0% - 0% - 0% - 0%
Non-GAAP general and administrative 21,012 18% 29,642 16% 36,777 14% 10,611 13% 10,894 12% 10,879 11%
Loss from Operations
Loss from operations (48,609) -42% (46,474) -26% (44,662) -16% (8,000) -10% (10,577) -12% (12,126) -12%
Stock-based compensation 16,358 14% 21,308 12% 32,675 12% 9,303 11% 13,006 15% 12,110 12%
Amortization of acquired intangibles 138 0% 96 0% 84 0% 16 0% - 0% 38 0%
Acquisition related expenses - 0% - 0% - - 0% - 0% 439 0%
Non-GAAP loss from operations (32,113) -28% (25,070) -14% (11,903) -4% 1,319 2% 2,429 3% 461 0%
March 31, 20172015 2016 September 30, 20172014 June 30, 2017

2727
GAAP to Non-GAAP Reconciliation
27
HubSpot, Inc.GAAP to Non-GAAP Reconciliation
$ '000s
% of
Revenues $ '000s
% of
Revenues $ '000s
% of
Revenues $ '000s
% of
Revenues $ '000s
% of
Revenues $ '000s
% of
Revenues
Gross Margin
Gross margin 21,243 70% 24,228 71% 27,701 73% 31,668 74% 35,233 74% 39,419 74%
Stock-based compensation 108 0% 326 1% 324 1% 439 1% 404 1% 457 1%
Amortization of acquired intangibles 6 0% 6 0% 11 0% 19 0% 20 0% 20 0%
Acquisition related expenses - 0% - 0% - 0% - 0% - 0% - 0%
Non-GAAP gross margin 21,357 70% 24,560 72% 28,036 73% 32,126 75% 35,657 75% 39,896 75%
Loss from Operations
Loss from operations (10,957) -36% (19,939) -58% (11,412) -30% (11,322) -26% (13,290) -28% (10,449) -20%
Stock-based compensation 1,266 4% 12,844 38% 5,142 13% 5,642 13% 4,510 9% 6,015 11%
Amortization of acquired intangibles 13 0% 13 0% 17 0% 26 0% 26 0% 26 0%
Acquisition related expenses - 0% - 0% - 0% - 0% - 0% - 0%
Non-GAAP loss from operations (9,678) -32% (7,082) -21% (6,253) -16% (5,654) -13% (8,754) -18% (4,408) -8%
September 30, 2014
Three Months Ended Three Months Ended Three Months Ended
December 31, 2014
Three Months Ended Three Months Ended
December 31, 2015
Three Months Ended
March 31, 2015 June 30, 2015 September 30, 2015
HubSpot, Inc.GAAP to Non-GAAP Reconciliation
$ '000s
% of
Revenues $ '000s
% of
Revenues $ '000s
% of
Revenues $ '000s
% of
Revenues $ '000s
% of
Revenues $ '000s
% of
Revenues $ '000s
% of
Revenues
Gross Margin
Gross margin 44,989 76% 49,779 77% 54,777 78% 59,557 78% 65,180 79% 70,502 79% 78,716 81%
Stock-based compensation 418 1% 608 1% 577 1% 551 1% 564 1% 844 1% 754 1%
Amortization of acquired intangibles 18 0% 13 0% 13 0% 13 0% 9 0% 0% 38 0%
Acquisition related expenses - 0% - 0% - 0% - 0% - 0% - 0% - 0%
Non-GAAP gross margin 45,425 77% 50,400 78% 55,367 78% 60,121 79% 65,753 80% 71,346 80% 79,508 81%
Loss from Operations
Loss from operations (9,861) -17% (11,030) -17% (9,951) -14% (13,820) -18% (8,000) -10% (10,577) -12% (12,126) -12%
Stock-based compensation 6,231 11% 8,475 13% 8,695 12% 9,274 12% 9,303 11% 13,006 15% 12,110 12%
Amortization of acquired intangibles 24 0% 20 0% 20 0% 20 0% 16 0% 0% 38 0%
Acquisition related expenses - 0% - 0% - 0% - 0% - 0% - 0% 439 0%
Non-GAAP loss from operations (3,606) -6% (2,535) -4% (1,236) -2% (4,526) -6% 1,319 2% 2,429 3% 461 0%
Three Months Ended
March 31, 2016 June 30, 2016
Three Months Ended
March 31, 2017September 30, 2016
Three Months Ended Three Months Ended Three Months Ended Three Months Ended
September 30, 2017
Three Months Ended
June 30, 2017December 31, 2016

28
THANK YOU
28