i 2. fhwa/tx-92/1184-2 vol. 2 using the mul tidepth
TRANSCRIPT

1. Report No.
FHWA/TX-92/1184-2 Vol. 2 I 2. Government Accession No.
4. Title and Subtitle
USING THE MUL TIDEPTH DEFLECTOMETER TO STUDY TIRE PRESSURE, TIRE TYPE, AND LOAD EFFECTS ON PAVEMENTS
7. Autnor(s)
Tayyeb Akram, Tom Scullion, and Roger E. Smith
9. Performing Organization Name and Address
Texas Transportation Institute The Texas A&M University System College Station, Texas 77843-3135
u. sponsormg Agency Name ana Aaaress
Texas Department of Transportation Office of Research and Technology Transfer P. 0. Box 5051 Austin, Texas 78763
15. Supplementary Notes
Technical Report Documentation Page 3. Recipients Catalog No.
5. Report Date
September 1992 Revised: November 1993 6. Performing Organization Code
8. Performing Organization Report No.
Research Report 1184-2 Vol. 2
10. Work Unit No. (TRAIS)
11. Contract or Grant No.
Study no. 2-18-89-1184 13. Type of Report and Penod Covered
Interim: September 1991 -September 1992
14. Sponsonng Agency Code
Research performed in cooperation with the Texas Department of Transportation and the U.S. Department of Transportation, Federal Highway Administration. Research Study Title: "Using the Multidepth Deflectometer to Study Tire Pressure and Dynamic Load Effects on Pavements" 16. Abstract
In this study the impact of truck tire type, inflation pressure, speed, and axle load was examined by measuring depth deflections in two pavement structures (one thick, one thin) instrumented with multidepth deflectometers (MDD's). Measured depth deflections under truck loadings were converted into average vertical compressive strains in the pavement layers. The measured subgrade strains were used to estimate the time to rutting failure. Deflections measured at the bottom of the asphaltic concrete layer were used to calculate the surface curvature index which was then translated into tensile strains at the bottom of the layer. This report develops multiple linear regression models to predict the relationship between dependent variables (sub grade strain, tensile strain at the bottom of asphalt layer) and independent variables (speed, lateral offset, asphalt layer temperature, and axle load).
For the same load level, the wide based super single tires were measured to cause higher deflections, higher vertical compressive subgrade strains, and have sharper curvature to the deflection bowls than standard dual tires. Under similar loading conditions, wide based tires were predicted to be at least twice as damaging as conventional dual tires.
17. Key Words 18. Distribution Statement
Multidepth Deflectometer, Damage, Tires, Pressure, Truck Loads, Wide Base Super Singles
No Restrictions. This document is available to the public through NTIS:
19. Security Classif.(of this report)
Unclassified Form DOT F 1700.7 (8-72)
National Technical Information Service 5285 Port Royal Road Springfield, Virginia 22161
1
20. Security Classif.(of this page)
Unclassified Reprodnct10n of completed page authorized
1
21. No. of Pages
142 122. Price


USING THE MULTIDEPTH DEFLECTOMETER TO STUDY TIRE PRESSURE, TIRE TYPE, AND LOAD EFFECTS ON PAVEMENTS
by
Tayyeb Akram Graduate Assistant Research
Texas Transportation Institute
Tom Scullion Associate Research Engineer
Texas Transportation Institute
and
Roger E. Smith Associate Research Engineer
Texas Transportation Institute
Research Report 1184-2 Vol. 2 Research Study Number 2-18-89-1184
Study Title: Using the Multidepth Deflectometer to Study Tire Pressure and Dynamic Load Effects on Pavements
Sponsored by Texas Department of Transportation
In cooperation with U.S. Department of Transportation
Federal Highway Administration
September 1992 Revised: November 1993
TEXAS TRANSPORTATION INSTITUTE The Texas A&M University System
College Station, Texas 77843-3135


IMPLEMENTATION STATEMENT
The work presented in this report provides a framework for the Texas Department of Transportation to make quantitative decisions on the impact of truck/tire configurations on typical pavement structures. The study specifically addressed in this report focuses on Wide Based "Super Single" tires. Study findings indicate that these tires are at least twice as damaging as regular dual tires. Replacing the eight dual tires on a tandem axle with four wide based tires under the same loading conditions is predicted to cause substantially more damage to the highway.
v


- - ------------------------
DISCLAIMER
The contents of this report reflect the views of the authors who are responsible for the facts and accuracy of the data presented herein. This report is not intended to constitute a standard, specification, or regulation and does not necessarily represent the views or policies of the Federal Highways Administration (FHWA) or Texas Department of Transportation. Additionally, this report is not intended for construction, bidding, or permit purposes.
vii

ACKNOWLEDGEMENT
The authors would like to acknowledge both the Texas Department of Transportation and the U.S. Department of Transportation, Federal Highway Administration, for their support of this work. Bob Briggs P.E. was the Texas Department of Transportation (TxDOT) representative who initiated the study. The authors would also like to recognize District 17 are acknowledged for their assistance with the ground truth testing and traffic control. Additionally, John Ragsdale instrumented both sites with MDD's and assisted in all areas of data collection.
viii

TABLE OF CONTENTS
List of Figures
List of Tables
Metric Conversion Chart
Summary . . . . .
I INTRODUCTION
GENERAL
RESEARCH OBJECTIVES
RESEARCH SIGNIFICANCE
RESEARCH ORGANIZATION
II LITERATURE REVIEW
THE IMPACT OF TIRE TYPE, INFLATION PRESSURE, SPEED, AND LOAD ON FLEXIBLE PAVEMENT PERFORMANCE
The Effect of Truck Tire Type The Effect of Inflation Pressure The Effect of Speed The Effect of Axle Load
TIRE MODELS
Uniform Pressure Distribution Model .. Non-Uniform Pressure Distribution Model
FLEXIBLE PAVEMENT PERFORMANCE MODELS . .
Flexible Pavement Rutting Models ... Flexible Pavement Fatigue Damage Models
SUMMARY OF THE LITERATURE REVIEW
III MATERIALS AND METHODS
LAYOUT AND CROSS-SECTION OF TEST PAVEMENT SECTIONS
EXPERIMENTAL SETUP
TEST VEHICLE . . .
ix
. . .
Page
xii
xviii
.
xix
xx
1
1
1
1
2
3
3
3 5 8 8
10
10 11
14
15 16
18
21
21
23
25

TABLE OF CONTENTS (CON'T}
OFFSET MEASUREMENT
INSTRUMENTATION USED
LVDT Selection .... Data Acquisition System Testing Procedure
LABORATORY TESTING
Asphalt Concrete Granular Material Subgrade Material
SUBSURFACE EXPLORATION
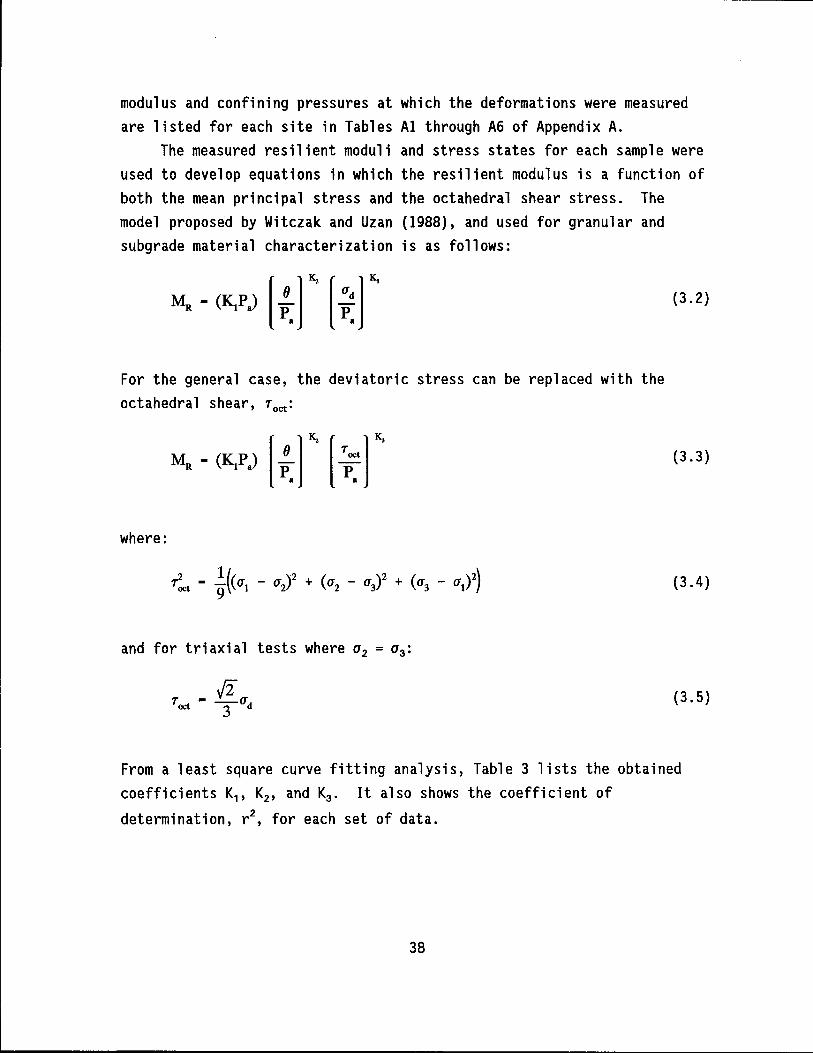
DYNAMIC CONE PENETRATION TESTING
IV EVALUATION OF THE EFFECTS OF TRUCK TIRE TYPE ON SUBGRADE RUTTING IN FLEXIBLE PAVEMENTS . . . . .
DETERMINATION OF AVERAGE VERTICAL COMPRESSIVE STRAINS FROM
Page
25
30
30 33 33
36
37 37 39
39
40
45
MEASURED DEPTH DEFLECTIONS . . . . . . . . . . . . . . . 45
EFFECT OF TIRE TYPE, AXLE LOADING, AC LAYER TEMPERATURE, AND TRUCK SPEED ON THE AVERAGE VERTICAL COMPRESSIVE SUBGRADE STRAIN . . . . . . . . . . . . . . . . . . 54
Section I (Thin) Subgrade Strain Data Evaluation . 61 Section II (Thick) Subgrade Strain Data Evaluation 62 Section I (Thin) Performance Evaluation 64 Section II (Thick) Performance Evaluation 71
CONCLUSION . . . . . . . . . . . . . . . . . 72
V EVALUATION OF THE EFFECTS OF TRUCK TIRE TYPE ON FATIGUE CRACKING IN FLEXIBLE PAVEMENTS
INTRODUCTION . . . . . . . . . .
75
75
DETERMINATION AND ANALYSIS OF SCI FROM MEASURED DEFLECTIONS 77
PREDICTION OF TENSILE STRAINS AT THE BOTTOM OF ASPHALTIC CONCRETE LAYER ..... .
PAVEMENT PERFORMANCE EVALUATION
CONCLUSION . . . . . . . . . .
x
81
91
98

TABLE OF CONTENTS (CON'T)
VI CONCLUSION AND RECOMMENDATIONS
CONCLUSIONS
RECOMMENDATIONS
REFERENCES . . . . .
APPENDIX A LABORATORY RESULTS .
xi
Page
103
103
105
107
. . . . 117

LIST OF FIGURES
Figure Page
1 Effect of Inflation Pressure on Gross Area (Marshek 1985a) 7
2 The Effect of Vehicle Speed on Peak Pavement Surface Deflections as Measured in the AASHO Road Test (Harr 1962) 9
3 Load Equivalency Single Versus Dual Tires (Christison 1978) 10
4 Nonlinear Vertical Tire Pressure Distribution with Lateral Surface Forces as Developed Using Finite Element Model by Tielking (Roberts et al. 1986)
5 Vertical Compressive Strain Versus the Number of Weighted 18-kip
12
Axle Load Applications for Three Different Rutting Equations 17
6 Typical Layout of Test Section 22
7 MDD Locations in Test Pavements 22
8 Experimental Design to Evaluate the Damage Effects of Dual and Wide Base Single Tires . . . . . 24
9 3S2 Water Tanker Used for Testing 29
10 Components of an MDD Module 31
11 Typical Cross Section of MDD after Installation 32
12 A Typical MDD Signal From Section I under the Test Vehicle (5 axles) Before Noise Filtering
13 A Typical MDD Signal from Section I under the Test Vehicle (5 axles) After Noise Filtering .....
14 Dynamic Cone Penetrometer Used for Penetration Testing
15 Cone Penetration Test Results on Section I (Thin) and Section II (Thick) ............ .
16 Typical Depth Deflections Profile Measured by MDD on
34
35
42
43
Section I (Thin) Under the Test Vehicle (5 axle) Loading 46
17 Typical Depth Deflections Profile Measured by MDD on Section II (Thick) Under the Test Vehicle (5 axle) Loading 47
18a Typical Average Vertical Compressive Strain Profile Measured at the Top of the Subgrade Layer on Section I (Thin) Under Test Vehicle (5 axle) Loading . . . . . . . . . . . . . 48
xii

LIST OF FIGURES (Continued)
Figure Page
18b Typical Average Vertical Compressive Strain Profile Measured at the Top of the Subgrade Layer on Section II {Thick) Under Test Vehicle (5 axle) Loading . . . . . . . . . . . . 49
19a
19b
Maximum Average Vertical Compressive Strain at Top of the Subgrade Layer Under Dual {Tandem Drive Axle) and Wide Base Single {Tandem Trailer Axle) Tires Loading on Section I (Thin) ............... .
Maximum Average Vertical Compressive Strain at Top of the Subgrade Layer Under Dual {Tandem Drive Axle) and Wide Base Single {Tandem Trailer Axle) Tires Loading on Section II {Thick) ............ .
20a Effect of Dual {Tandem Drive Axle) and Wide Base Single (Tandem Trailer Axle) Tires Loading at 77 DEG F AC Layer Temperature on the Average Vertical Compressive Strain at Top of the Subgrade Layer for Section I {Thin) ............. .
20b Effect of Dual {Tandem Drive Axle) and Wide Base Single {Tandem Trailer Axle) Tires Loading at 104 DEG F AC Layer Temperature on the Average Vertical Compressive Strain at Top of the Subgrade Layer for Section I {Thin) ............. .
21 Effect of AC Layer Temperature on 33 kips Dual {Tandem Drive Axle) and Wide Base Single {Tandem Trailer Axle) Tires Loading on the Average Vertical Compressive Strain at Top of the Subgrade Layer for Section I (Thin) ............. .
22a Effect of Dual (Tandem Drive Axle) and Wide Base Single {Tandem Trailer Axle) Tires Loading at 77 DEG F AC Layer Temperature on the Average Vertical Compressive Strain at Top of the Subgrade Layer for Section II {Thick) ............. .
22b Effect of Dual {Tandem Drive Axle) and Wide Base Single {Tandem Trailer Axle) Tires Loading at 104 DEG F AC Layer Temperature on the Average Vertical Compressive Strain at Top of the Subgrade Layer for Section II {Thick) ............. .
xiii
52
53
54
55
56
57
58

LIST OF FIGURES (Continued)
Figure
23
24a
24b
25.
26a
26b
Effect of AC Layer Temperature on 33 kips Dual (Tandem Drive Axle) and Wide Base Single (Tandem Trailer Axle) Tires Loading on the Average Vertical Compressive Strain at Top of the Subgrade Layer for Section II (Thick) ................ .
Allowable Number of Repetitions Under Dual (Tandem Drive Axle) and Wide Base Single (Tandem Trailer Axle) Tires Loading at 77 DEG F AC Layer Temperature for Section I (Thin) .............. .
Allowable Number of Repetitions Under Dual (Tandem Drive Axle) and Wide Base Single (Tandem Trailer Axle) Tires Loading at 104 DEG F AC Layer Temperature for Section I (Thin) ............... .
Effect of AC Layer Temperature on Allowable Number of Repetitions Under Dual (Tandem Drive Axle) and Wide Base Single (Tandem Trailer Axle) Tires 33 kips Tandem Axle Loading for Section I (Thin) ....... .
Allowable Number of Repetitions Under Dual (Tandem Drive Axle) and Wide Base Single (Tandem Trailer Axle) Tires Loading at 77 DEG F AC Layer Temperature for Section II (Thick) ............. .
Allowable Number of Repetitions Under Dual (Tandem Drive Axle) and Wide Base Single (Tandem Trailer Axle) Tires Loading at 104 DEG F AC Layer Temperature for Section II(Thick) .............. .
27 Effect of AC Layer Temperature on Allowable Number of Repetitions Under Dual (Tandem Drive Axle) and Wide Base Single (Tandem Trailer Axle) Tires 33 kips Tandem Axle Loading for Section II (Thick) .....
28 Peak Deflections Under Dual and Wide Base Single Tires Measured by MOD 1 . . . . . . . . . . . . . . . .
29 Typical Peak Longitudinal Deflection Profile Under Dual and Wide Base Single Tires on Tandem Axles
30 Measurement of SCI under Dual and Wide Base Single Ti res . . . . . . . . . . . . . . . . . . . . . .
3la Effect of Dual (Tandem Drive Axle) and Wide Base Single Tire (Tandem Trailer Axle) Loading on the Predicted SCI for Section I (Thin) ...... .
xiv
Page
59
65
66
67
68
69
70
76
78
78
82

LIST OF FIGURES (Continued)
Figure Page
31b Effect of Dual (Tandem Drive Axle) and Wide Base Single Tire (Tandem Trailer Axle) Speed on the Predicted SCI for Section I (Thin) . . . . . . . . . . . . . . . 82
32a Effect of Dual (Tandem Drive Axle) and Wide Base Single Tire (Tandem Trailer Axle) Loading on the Predicted SCI for Section II (Thick) . . . . . . . . . . . . . . 83
32b Effect of Dual (Tandem Drive Axle) and Wide Base Single Tire (Tandem Trailer Axle) Speed on the Predicted SCI for Section II (Thick) . . . . . . . . . . . . . . 83
33 Predicted Tensile Strain at the Bottom of the Asphaltic Concrete Layer Under Dual and Wide Base Single Tires at High and Low Inflation Pressure and 77 DEG F AC Temperature for Section I (Thin) . . . . . . . . 86
34 Predicted Tensile Strain at the Bottom of the Asphaltic Concrete Layer Under Dual and Wide Base Single Tires at High and Low Inflation Pressure and 104 DEG F AC Temperature for Section I (Thin) . . . . . 87
35 Predicted Tensile Strain at the Bottom of the AC Layer Under Dual and Wide Base Single Tires at High Inflation Pressure, Different Axle Loadings, and 77 DEG F AC Temperature for Section I (Thin) . . . . 87
36 Predicted Tensile Strain at the Bottom of the AC Layer Under Dual and Wide Base Single Tires at High Inflation Pressure, Different Axle Loadings, and 104 DEG F AC Temperature for Section I (Thin) . . . . . . . 87
37 Predicted Tensile Strain at the Bottom of the Asphaltic Concrete Layer Under Dual and Wide Base Single Tires at High and Low Inflation Pressure and 77 DEG F AC Temperature for Section II (Thick) . . . . . . . . . 88
38 Predicted Tensile Strain at the Bottom of the Asphaltic Concrete Layer Under Dual and Wide Base Single Tires at High and Low Inflation Pressure and 104 DEG F AC Temperature for Section II (Thick) . . . . . . . 88
39 Predicted Tensile Strain at the Bottom of the AC Layer Under Dual and Wide Base Single Tires at High Inflation Pressure, Different Axle Loadings, and 77 DEG F AC Temperature for Section II (Thick) . . . . . 89
xv
LIST OF FIGURES (Continued)
Figure
40
41
42
43
Predicted Tensile Strain at the Bottom of the AC Layer Under Dual and Wide Base Single Tires at High Inflation Pressure, Different Axle Loadings, and 104 DEG F AC Temperature for Section II (Thick)
Effect of Inflation Pressure and 33 kips Axle Loading at 77 DEG F AC Temperature on Allowable Number of Passes Under Dual and Wide Base Singles Tires on Section I (Thin) . . . . . . . . . . . . . . . . . .
Effect of Inflation Pressure and 33 kips Axle Loading at 104 DEG F AC Temperature on Allowable Number of Passes Under Dual and Wide Base Singles Tires on Section I (Thin) . . . . . . . . . . . . . . . . . .
Effect of Inflation Pressure and 17 kips Axle Loading at 77 DEG F AC Temperature on Allowable Number of Passes Under Dual and Wide Base Singles Tires on Section I (Thin) ................. .
44 Effect of Inflation Pressure and 17 kips Axle Loading at 104 DEG F AC Temperature on Allowable Number of Passes Under Dual and Wide Base Singles Tires on
Page
89
92
92
93
Section I (Thin) . . . . . . . . . . . . . . . . . . . . . . . . 93
45
46
47
Effect of 17 and 33 kips Axle Loading on Allowable Number of Passes Under Dual and Wide Base Single Tires on Section I (Thin) ........... .
Effect of Inflation Pressure and 33 kips Axle Loading at 77 DEG F AC Temperature on Allowable Number of Passes Under Dual and Wide Base Singles Tires on Section II (Thick) ................ .
Effect of Inflation Pressure and 33 kips Axle Loading at 104 DEG F AC Temperature on Allowable Number of Passes Under Dual and Wide Base Singles Tires on Section II (Thick) ................ .
48 Effect of Inflation Pressure and 17 kips Axle Loading at 77 DEG F AC Temperature on Allowable Number of Passes Under Dual and Wide Base Singles Tires on Section II (Thick) ................ .
49 Effect of Inflation Pressure and 17 kips Axle Loading at 104 DEG F AC Temperature on Allowable Number of Passes Under Dual and Wide Base Singles Tires on
94
94
95
95
Section II (Thick) . . . . . . . . . . . . . . . . . . . . 96
xvi

LIST OF FIGURES (Continued)
Figure
50 Effect of 17 and 33 kips Axle Loading on Allowable Number of Passes Under Dual and Wide Base Single Tires on Section II (Thick} .......... .
xvii
Page
96

LIST OF TABLES
Table
1 In Situ Soils Data for the Test Sections
2 Summary of Test Conditions ....... .
3 Base Course Coefficients for Equation 3.2
4 Subgrade Coefficients for Equation 3.2 ..
5 Predicted Damage Factor Ratio of Wide Base Single Tires (33 kips Tandem Trailer Axle) Versus Dual Tires (33 kips Tandem Drive Axle) in Terms of Compressive Strains at Top of the Subgrade layer and Number of 18 kips ESAL Repetitions for Section I {Thin) and
Page
23
26
39
40
Section {Thick) . . . . . . . . . . 73
6 Input Va 1 ues Used in BI SAR . . . . . . . . . 84
7a Predicted Damage Factor Ratio of Wide Base Single Tires (33 kips Tandem Trailer Axle) Versus Dual Tires (33 kips Tandem Drive Axle) at High Inflation Pressure in Terms of Tensile Strains at the Bottom of the AC Layer and Number of 18 kips ESAL Repetitions for Section I {Thin) and Section II {Thick) . . . . . . . . . . . 99
7b Predicted Damage Factor Ratio of Wide Base Single Tires (33 kips Tandem Trailer Axle) Versus Dual Tires (33 kips Tandem Drive Axle) at Low Inflation Pressure in Terms of Tensile Strains at the Bottom of the AC Layer and Number of 18 kips ESAL Repetitions for Section I {Thin) and Section II (Thick) . . . . . . . . . . . . . . 100
Al The Laboratory Results for Section I {Thin) at 10 Hz Frequency . . . . . . . . . . . .
A2 The Laboratory Results for Section I {Thin) at 5 Hz Frequency . . . . . . . . . . . .
A3 The Laboratory Results for Section I {Thin) at 0.4 Hz Frequency ....... .
A4 The Laboratory Results for Section II (Thick) at 10 Hz Frequency . . . . . . . . . . . . .
A5 The Laboratory Results for Section II {Thick) at 5 Hz Frequency . . . . . . . . . . . . .
A6 The Laboratory Results for Section II {Thick) at 0.4 Hz Frequency . . . . . ....
xviii
119
120
121
122
123
124

METRIC (SI*) CONVERSION FACTORS APPROXIMATE CONVERSIONS TO SI UNITS
Srmbol When Yoa Know Multlply By To Find
x -'• x
In ft yd ml
ln1
ft1 yd• ml1
ac
oz lb T
fl oz gal fl'
Inches feet yards mlles
square Inches square feet square yards square mlles acres
LENGTH
2.54 0.3048 0.914 1.61
AREA
645.2 0.0929 0.836 2.59 0.395
centimetres metres metres kllometres
centimetres squared metres squared metres squared kllometres squared hectares
MASS (weight)
ounces 28.35 pounds 0.454 short tons (2000 lb) 0.907
fluld ounces gallons cubic feet
VOLUME
29.57 3.785 0.0328
grams kllograms megagrams
mlllllltres lltres metres cubed
yd' coble yards 0.0765 metres cubed
NOTE: Volumes greater than 1000 l shall be shown In m1•
TEMPERATURE (exact)
°F Fahrenheit 5/9 (after Celslus temperature subtracting 32) temperature
• SI Is the symbol for the International System of Measurements
Symbol
cm m m km
cm 1
ma ma km1
ha
g kg Mg
ml l m• m•
.. =--
=--
...
...
... .. .. .. .. ..
::
... •
..
...
..
APPROXIMATE CONVERSIONS TO SI UNITS Symbol When You Know Multlply By To Find
mm m m
km
g kg Mg
ml l m• m'
mllllmetres metres metres kllometres
millimetres squared metres squared kllometres squared hectores (10 000 ml)
LENGTH
0.039 3.28 1.09 0.621
AREA
0.0016 10.764 0.39 2.53
Inches feet yards mlles
square Inches square feet square mlles acres
MASS (weight)
grams 0.0353 kllograms 2.205 megagrams (1 000 kg) 1.103
mlllllltres litres metres cubed metres cubed
VOLUME
0.034 0.264 35.315 1.308
ounces pounds short tons
fluid ounces gallons cubic feet cubic yards
TEMPERATURE (exact)
°C Celsius 9/5 ·(then Fahrenheit temperature temperature add 32)
°F 32 98.8
- 'f1 I I I ? I I ~ 4;0 I I I f!O I f. I
1~ I I I
1~ I I j t I i I I 1 I i
-40 -20 0 20 40 60 80 "C 37
OF 212
I 2?°J I 100
"C
These factors conform to the requirement of FHWA Order 5190.1A.
Sy111bol
In ft yd ml
oz lb T
fl oz gal ft' yd'

SUMMARY
The work performed in this study lays the framework for evaluating the impact of new tire configurations on the Texas highway system. In this report, the authors compare the pavement responses under both standard dual tires and wide based super single tires. These responses were measured on in-service pavements instrumented with Multi-Depth Deflectometers. Using existing performance models the measured responses were converted into estimates of pavement life (loads to failure). Failure in terms of both rutting and cracking criteria were considered.
In both cases the wide based tires used in this study were found to be more aggressive than current dual tires. Reductions in pavement life by a factor of between 2 and 5 were estimated. These results indicate that the wide spread adoption of wide based tires could cause significant additional damage to Texas pavements.
xx

GENERAL
CHAPTER I INTRODUCTION
In this study two in-service asphaltic concrete highways (one thick, one thin) were instrumented with multidepth deflection devices (MDD) to measure average vertical compressive strains and deflections at different depths. Depth deflections measured by the MDD's were then used to validate the pavement material characterization. Average vertical compressive strains measured under truck loadings were used to predict the effects of truck tire type, inflation pressure, speed, and axle load on expected pavement performance. Analyses of the measured data were used to estimate the amount of pavement damage caused by the vehicle loadings in terms of 18-Kip axle load repetitions.
RESEARCH OBJECTIVES The overall objective is to determine the impact of truck tire type,
tire inflation pressure, speed, and axle load on flexible pavement response by measuring the average vertical compressive strains and depth deflections with a multidepth deflectometer and comparing the measured response to a theoretical model prediction.
RESEARCH SIGNIFICANCE Recent trends in the trucking industry of using wide base single
tires as replacements for dual tires, accompanying higher tire pressures, and higher axle loads have created concerns for the highway agencies. The concerns are related to the potential increase in highway pavement damage that may be caused by these changes. By accounting for these changes in the current practices of pavement evaluation and design, the pavement performance prediction will prove more reliable. This research will determine how to estimate the damaging effects of wide base single and dual tires under various operating conditions.
1

RESEARCH ORGANIZATION This report has been subdivided into seven chapters. The second
chapter summarizes the existing knowledge regarding the impact of tire type, inflation pressure, speed, and axle load on flexible pavement performance, and examines existing flexible pavement rutting and fatigue damage models.
Chapter III describes the materials and methods used in this study and documents details concerning the two in-service instrumented pavement sections. The experimental setup and the test vehicle are described, as well as the procedure and instrumentation used to collect nondestructive deflection data. This chapter also includes results of the subsurface exploration using a dynamic cone penetrometer on the two test sections.
In Chapter IV the measured multidepth deflections under dual and wide base single tires have been converted into average vertical compressive subgrade strains at the top of the subgrade layer. Regression models are presented to evaluate the influence of tire type, axle load, asphalt concrete layer temperature, speed, and inflation pressure on subgrade strains. The conditions that are more detrimental to a particular pavement section (thick/thin) are defined. Finally, using the measured responses, estimates of future pavement performance are made for loadings using the two tire types.
Chapter V evaluates the effects of dual and wide base single tires on fatigue cracking in flexible pavements. The shape of the deflection bowl measured at MOD 1 is converted into a surface curvature index. Regression models are presented to evaluate the influence of tire type, axle load, asphalt concrete layer temperature, speed, and inflation pressure on the surface curvature index. Linear elastic computer program runs are made to develop relationships between the surface curvature index and tensile strains at the bottom of the asphalt concrete layer. Using these relationships, the surface curvature indices predicted by the regression models are converted into tensile strains. Pavement performance predictions are made for dual and wide base single tire loadings based on expected damage due to fatigue cracking.
Chapter VI contains conclusions and recommendations for further research developed as a result of this study.
2

CHAPTER II LITERATURE REVIEW
This chapter presents a review of literature regarding the use of wide base single tires as replacements for conventional duals, together with their potential impact on pavement performance. Use of uniform and non-uniform pressure distribution models are examined; and, a review of existing flexible pavement performance models concludes the chapter.
THE IMPACT OF TIRE TYPE, INFLATION PRESSURE, SPEED, AND LOAD ON FLEXIBLE PAVEMENT PERFORMANCE
Since the relationships between truck traffic and pavement performance for pavement design were developed during the AASHO Road Test (1962), several new tire types, sizes, and configurations have been used by the trucking industry. The test vehicles at the AASHO Road Test (1962) used bias ply tires inflated to 80 psi (552 kPa) cold pressure. Today, radial tires predominate on heavy trucks with pressures in excess of 100 psi (690 kPa) being common; axle load limits have increased to 20 Kip single and 34 Kip tandem axle loads (FHWA 1984). New tire designs, such as low profile tires and wide base single tires continue to gain popularity (Morris 1987).
Changes in tire and wheel configuration for heavy trucks have generated concern that highway pavement damage may increase. This review emphasizes findings of past studies regarding the influence of tire type, inflation pressure, speed, and axle load on flexible pavement performance, as well as the possible impact of replacing duals with wide base single tires.
The Effect of Truck Tire Type Vehicle loads are transmitted from the vehicle body through
suspension systems and tires to the pavement surface. These loads are then distributed through the pavement structure to the subgrade soils. In this tire-pavement interaction system, tires make up the least understood and most controversial aspect (Smith 1991).
3

- -- ---------~---------------..,
Tires are typically specified by two numbers separated by the letter "R" {for example, an 11R22.5 tire). The first number gives the nominal section width in inches, while the second number indicates the nominal diameter of the rim on which the tire is mounted. The "R" denotes a radial tire {replaced by a dash{"-") for bias ply, tires). Section width may also be specified in millimeters {e.g., 285R24.5). Low profile tires are often indicated by showing the aspect ratio multiplied by 100 after the section width {e.g., 285/80R24.5). Aspect ratio equals the ratio of section height to section width.
Several layers of rubber and fiber form a tire. In the bias ply tire, the synthetic fiber cord is wrapped on an angle with respect to the tire tread. In radial tires, the fiber cord is wrapped perpendicular to the tread direction. Both bias and radial tires may be reinforced with belts of steel, generally wrapped parallel with the tread direction {Morris 1987). At a given inflation pressure and axle load, a radial tire deflects somewhat more than its bias-ply counterpart. Radials heat up less than bias plies; consequently, the differences between hot and cold pressure in radial tires is less {Sharp 1987).
A rapidly growing share of the tire market for long haul highway trucks is being met by the newer "low profile" designs {Charles 1986). A major advantage of low profile is the reduction in vehicle height and associated increase in trailer cubic capacity. Low profile tires are stiffer, provide a rougher ride, and prove more susceptible to sidewall damage than conventional radial tires {Charles 1986).
Wide base single tires are typically 16 to 18 ins. {406 TO 457 mm) wide compared to the 10 to 12 ins. {254 to 305 mm) width of a typical conventional radial truck tire. Wide base tires are used to replace conventional dual tires at the trailer and drive axle positions. They are also used on high load front axles of heavy trucks, such as ready mix concrete trucks, for improved load spreadability. When used in the former capacity, a wide base tire is referred to as "super single." Proponents claim that using wide base single tires on truck tractors and trailers improves fuel mileage, ride, handling, and braking while reducing tire cost and increasing payload {Giles 1979; Snelgrove 1980; Ford et al. 1988). Wide base radials are available in sizes 15R22.5,
4

16.5R22.5, 18R22.5; the metric replacement for these sizes are 385/65R22.5, 425/65R22.5, and 445/65R22.5 respectively.
In terms of pavement damage, Christison et al. (1980) measured tensile strains and surface deflections for a variety of tire configurations on asphalt pavements under comparable test conditions. The results indicated that one application of a single wide base tire is equivalent in its potential damaging effect to between 1.2 and 1.8 applications of a dual tire in terms of asphaltic concrete fatigue life and limiting surface deflections. Sharp et al. (1986), in an experimental comparison of duals and wide base single tires, concluded that for a given load, wide base single tires with a section width from 15 to 18 ins (380 to 458 mm) produced higher deflections than dual tires of 10 or 11 in (254 to 280 mm) section widths. Huhtala et al. (1989) investigated the impact of duals and wide base singles on instrumented flexible pavement sections and found wide base singles to be more aggressive than duals by a factor of between 2.3 - 4.0 in terms of tensile strain in the bituminous layer and stress measurements in bituminous and unbound layers.
On the basis of asphalt strain measurements, Huhtala (1988) reported that wide base single tires will likely cause 3.5 to 7 times more damage than dual tires. The difference proves greater if the asphalt layer is thin and smaller when the asphalt layer is thick.
The Effect of Inflation Pressure Tire pressure is not a new concern to highway engineers. From the
earliest days when drivers used narrow, solid truck tires, highway engineers have been aware of the need to distribute wheel loads over an adequate contact area in order to minimize the stresses imparted to the pavement.
Three factors have contributed to the increase in tire pressures. The first is the shift from bias ply to radial truck tires. Radial tires have larger footprints and the belt structure distributes stresses more uniformly. The net effect may be a reduction in pavement contact pressure in comparison to the similarly loaded bias-ply tire. Recommended tire inflation pressures for radials are about 5 psi (35 kPa)
5

higher than for bias ply tires (Papagiannakis and Haas 1986). Secondly, part of the increase in tire pressure was caused by the increase in load limits which have occurred over the past 30 years. In order to support heavier wheel loads, higher inflation pressures are required. Thirdly, in the wide base single tire conversion, the same load which was supported by duals earlier is now supported by a single tire. Accordingly, the recommended inflation pressures for the wide base singles are higher than duals.
Increased inflation pressures reduce the gross contact area, as shown in Fig. 1. Due to the smaller contact area, the load spreadability is also reduced, which makes the tire more aggressive in terms of tensile strains and compressive stresses in asphaltic concrete pavements. Marshek et al. {1985a) found that for a 503 increase in inflation pressure, there is a corresponding decrease in gross contact area of approximately 83 to 203.
Researchers generally agree that tire pressure has relatively little influence on the fatigue life of thick asphalt pavements. However, the effects of tire pressure becomes more pronounced with a reduction in asphalt layer thickness. In general, for thick asphalt sections, the effects of increased load are much more significant than are the effects of increased tire pressure on fatigue performance {Monismith et al. 1988). Similar trends are reported by Croteau (1988). Papagiannakis and Haas (1986) performed linear elastic analysis to find the impact of increases in inflation pressure and load. They observed that increasing the tire inflation pressure from 60 to 120 psi {414 to 828 kPa) at a constant load, increased the vertical compressive strain near the surface of an 8 in {203 mm) thick asphaltic concrete layer by a factor of as much as eight, but hardly affected the strain at the bottom of the layer.
Marshek et al. (1985a; 1985b) utilized the linear layered elastic program BISAR to evaluate tire-pressure distribution (concentric) effects for asphaltic concrete pavements (asphaltic concrete surface thicknesses from 1 to 4 in {25 to 102 mm); 8 in (203 mm) granular base). The tire pressure distribution effects on the strain at the bottom of the AC layer are more prominent for thin AC surfaces and have little effect on 4 in (102 mm) thick AC surface layers. They reported no significant tire
6

141
~ "' c
& m
~ 11•
~ t•
~ ,.
c.> • :s i 71 ~
" 50
IO
0-
Gl'ON Cantld Ana ft. lnft1don Prwure (All at Rated Load)
!:;, - 1'-Sll - 22.S
I 1 I
D - 11ll • 2.2.5
Conversion Factors 1 psi = 6.9 kPa 1 in = 25. 4 11111
1 mph = 1. 6 kph 1 lbf = 4.5 N "F => subtract 32 x 5/9 = ·c
INFLATION PRESSUltE (psi)
FIG. 1. Effect of Inflation Pressure on Gross Area (Marshek 1985a)
pressure impact on subgrade compressive strain. Bonaquist et al. (1989) ran tire tests at an instrumented pavement
testing facility. The measured responses (surface deflection, surface strain, and strain at the bottom of AC layer) for different tire pressures generally agree with the theoretical deflections predicted by linear layered elastic theory using uniform pressure distribution. The effect of tire pressure on the measured responses was small. Increasing the tire pressure from 76 to 140 psi (524 to 966 kPa) increased the measured responses by less than 10 percent.
Roberts et al. (1986) studied the effect of tire inflation pressure. The tires were represented as non-uniform pressure distributions (Tielking 1984); and, pavement response was calculated with a finite element model (Figueroa et al. 1980). They concluded that an increase of tire pressure from 75 to 125 psi (517 to 862 kPa) increases rutting rate
7

for all surface thicknesses. The higher inflation pressure substantially increases the rate of formation of fatigue cracks in thinner (1 and 2 in (25 to 51 mm)) asphaltic concrete surfaces.
The Effect of Speed The moving vehicular load is frequently represented as a static
axisymmetric load. As a vehicle approaches a point on a pavement, that point experiences an increase in vertical stress, which reaches a maximum when the wheel is directly over the point, then decreases as the vehicle moves away. A typical vehicle induced vertical stress pulse is bell shaped and has a duration of approximately 120 msec for a vehicle travelling at 50 mph (80 kph) (Hoffman and Thompson 1982; Siddharthan et al. 1991).
Pavement structural responses are sensitive to vehicle speed, as shown in Fig. 2, reproduced from Harr (1962). It shows the effect of speed on pavement deflection as measured in the AASHO Road Test (1962). The Road Test showed that moving wheel deflections are approximately 60% of creep speed deflections. Christison (1978) found that both surface deflections and strains at the bottom of the asphalt layer decrease substantially with an increase in speed. Sharp et al. (1986), in a study on the comparative effects of wide base single and dual tires, also observed that under both tire types, surface deflections reduce with increasing speed.
The Effect of Axle Load From the standpoint of probable pavement damage, the most
significant influence results from axle load. Zube et al. (1965) measured pavement surface deflections to evaluate the relative effects of duals and wide base singles. They found that on the average, a 5,400 lbs (24.3 kN) load on a wide base single is equivalent, in terms of pavement deflection, to an 18,000 lbs (81 kN) load on dual tires.
Deacon (1969) reported theoretically derived equivalency factors with respect to the strain at the bottom of the asphalt layer. He concluded that under similar conditions, wide base single tires are approximately 3 times as destructive as dual tires in terms of tensile
8

Conversion Factors 1 psi = 6.9 kPa 1 in = 25.4 11111
1 mph = 1.6 kph 1 lbf = 4.5 N "F => subtract 32 x 5/9 = ·c
i t.03 / 30 kip Slqle .ble Laod
~ I:
I t.82
~ la 1.01
L12 ldp Slnale AU Lood
I 0 10 20 30 40
VEHICLE SPEED (mph)
FIG. 2. The Effect of Vehicle Speed on Peak Pavement Surface Deflections as Measured in the AASHO Road Test (Harr 1962)
SU
strain at the bottom of asphalt concrete layer. Christison (1978) observed similar results in his experimental work, as shown in Fig. 3.
A study on wide base singles and duals by Papagiannakis and Hass (1986) shows that increasing tire inflation pressure from 60 to 120 psi (414 to 828 kPa) at constant load increased the theoretical vertical compressive strain near the surface of an 8 in (203 mm) thick asphalt layer by a factor of as much as eight, but hardly affected the strain at the bottom of the layer. Conversely, doubling the axle load at constant pressure increased subgrade compressive strain by 95%, but made negligible changes in compressive strain in the asphalt layer. These trends are corroborated by Eisenmann et al. (1986).
9

-----------------------------------------
Conversion Factors 1 psi = 6.9 kPa 1 in = 25.4 nm 1 mph = 1.6 kph 1 lbf = 4. 5 N ·r => subtract 32 x 5/9 = ·c
FIG. 3. Load Equivalency Single Versus Dual Tires (Christison 1978)
TIRE MODELS In mechanistic design procedures, it is common to assume tire
inflation pressure and tire/pavement contact pressure equai one another and that the contact area is circular. The tire/pavement contact stresses are assumed to be vertical, and the surface shear stresses are generally not considered (Thompson 1987). Recent studies indicate that this assumption is in error, and the pressure distribution over the contact area is highly non-uniform (Tielking 1989; Marshek 1985a; 1985b; Roberts et al. 1986; Yap 1988).
Uniform Pressure Distribution Model One simplifying assumption traditionally made in analyzing the
stresses imparted by truck tires is that the pavement contact pressure
10
--------------------------------------- -

------------------------------------------
remains uniform and equal to the tire inflation pressure. In most of the pavement models, the tire-pavement contact area is modeled as a circle with uniform vertical pressure, with no considerations for the effect of tire construction and lateral shear forces at the tire-pavement interface. Only the inflation pressure and the total tire load are considered important. The tire inflation pressure is assumed to be constant and the radius of the circular tire print is calculated as (Yoder and Witczak 1975):
where:
a - jp J PIT
a = radius of the circular uniform contact pressure, in inches; P = total tire load, in lbs; and p =inflation pressure, in psi.
(2.1)
The assumption that contact pressure equals inflation pressure is true only if the tire basically behaves as an inner tube (i.e., if the tire itself has almost no structural integrity) (Roberts et al. 1987). Since Tielking (1989) and others have shown that the tire does have a structure which affects the pressure transmitted to the contact surface, the uniform pressure distribution assumption is far from reality. Still, making use of this assumption makes the analysis simple and, relative to non-uniform pressure distribution, makes no significant impact on asphalt concrete strain for surface thicknesses more than 2 in (51 mm). It also does not affect the subgrade compressive strains.
Non-Uniform Pressure Distribution Model Recent studies indicate that the assumption of uniform pressure
distribution is seriously in error and that high-pressure "spikes" occur under the tire sidewalls, as shown in Fig. 4. These localized contact pressures can be nearly twice the inflation pressure (Tielking 1984).
11

Conversion Factors 1 psi = 6.9 kPa 1 in = 25.4 rrm 1 mph = 1. 6 kph 1 lbf = 4.5 N ·r => subtract 32 x 5/9 = ·c
VEllTICAL CONT.ACF PRUSmlE IOR INILA'ltON PDSSllllE • 75 ptl 'l'IKE LOAD • 45M U..
18t ....
VEllTJCAL CONT.A.Cl' PRESSUD: FOR INl'LATION ~ ... 125' p9I TIU LOAD • 4AO lbs.
R • 3.21•
FIG. 4. Nonlinear Vertical Tire Pressure Distribution with Lateral Surface Forces as Developed Using Finite Element Model by Tielking (Roberts et al. 1986)
12

The tire/pavement contact pressure distribution depends on the structure of the tire, inflation pressure, and tire load {Huhtala et al. 1989).
The finite element tire model is believed to be the first to have the capability of calculating the contact pressure distribution in the footprint of a deflected tire. Such a capability is important because contact pressure has a profound influence on all aspects of tire performance. Tielking {1989) at Texas A&M University has developed a finite element model for tire carcass analysis to define the stress conditions that occur at the tire-pavement interface. Tielking chose a relatively general, nonlinear, finite element shell of revolution computer program to be the foundation for the finite element tire model. A Fourier transform procedure is developed and incorporated into the finite element program giving this tire model the unique capability of calculating the contact boundary and interface pressure distribution for a specified tire deflection.
Texas A&M researchers {Roberts et al. 1986) have utilized a "modified" ILLI-PAVE program {Roberts et al. 1985) to establish tirepressure effects for low-volume flexible pavements {AC surface thicknesses varied from 1 to 4 inches {25 to 102 mm) with an 8-inch (203 mm) granular base). The study indicates the difference in strains calculated at the bottom of an asphalt layer using the Tielking tire model and the uniform pressure model. For the pavements with asphaltic concrete layers less than 2 inches {51 mm) thick, the strains predicted by the Tielking tire model are more than 100% higher than those predicted by the uniform pressure model.
Marshek et al. {1985a; 1985b) have presented experimental data concerning truck tire contact pressure distribution. They used a digitizing camera and data acquisition system to determine the contact pressure distribution and the net contact area from pressure sensitive film prints of statically loaded truck tires. The measured contact pressures were found to be non-uniform.
The research work by Tielking (1989), Roberts et al. {1986) and Marshek et al. {1985a; 1985b) has provided more realistic information on actual tire-pavement contact pressures under a variety of conditions. Their results indicate that increasing inflation pressure at constant
13
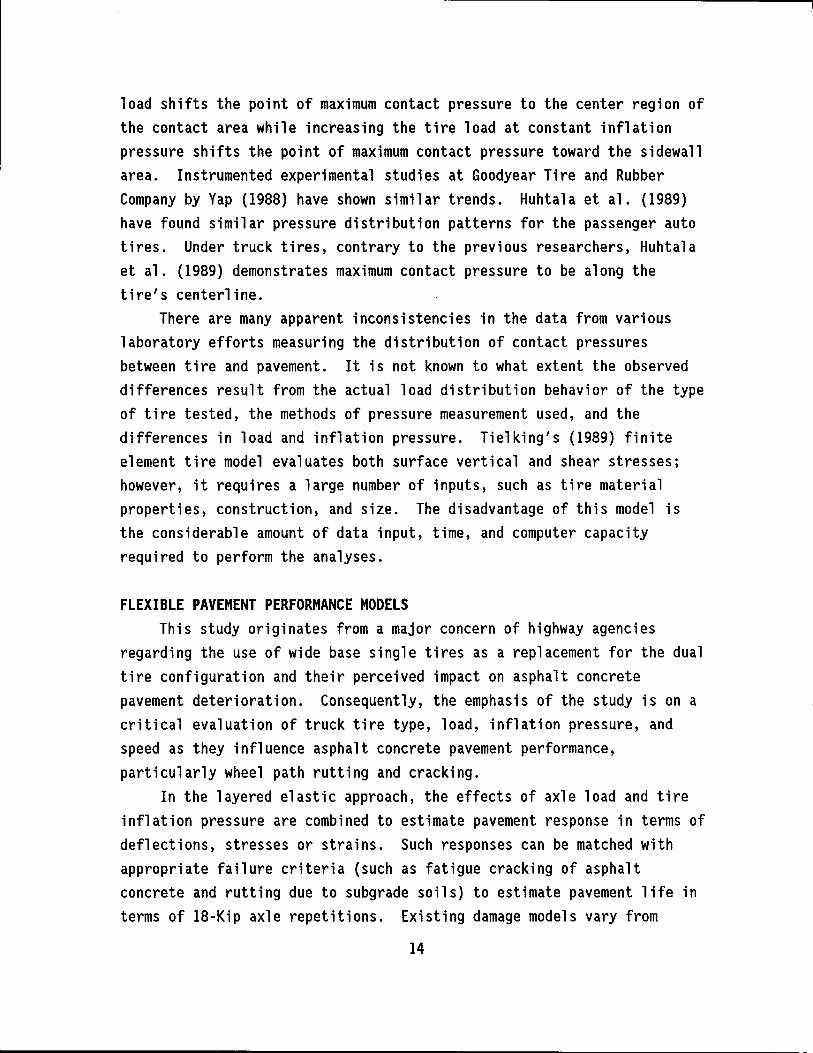
load shifts the point of maximum contact pressure to the center region of the contact area while increasing the tire load at constant inflation pressure shifts the point of maximum contact pressure toward the sidewall area. Instrumented experimental studies at Goodyear Tire and Rubber Company by Yap (1988) have shown similar trends. Huhtala et al. (1989) have found similar pressure distribution patterns for the passenger auto tires. Under truck tires, contrary to the previous researchers, Huhtala et al. (1989) demonstrates maximum contact pressure to be along the tire's centerline.
There are many apparent inconsistencies in the data from various laboratory efforts measuring the distribution of contact pressures between tire and pavement. It is not known to what extent the observed differences result from the actual load distribution behavior of the type of tire tested, the methods of pressure measurement used, and the differences in load and inflation pressure. Tielking's (1989) finite element tire model evaluates both surface vertical and shear stresses; however, it requires a large number of inputs, such as tire material properties, construction, and size. The disadvantage of this model is the considerable amount of data input, time, and computer capacity required to perform the analyses.
FLEXIBLE PAVEMENT PERFORMANCE MODELS This study originates from a major concern of highway agencies
regarding the use of wide base single tires as a replacement for the dual tire configuration and their perceived impact on asphalt concrete pavement deterioration. Consequently, the emphasis of the study is on a critical evaluation of truck tire type, load, inflation pressure, and speed as they influence asphalt concrete pavement performance, particularly wheel path rutting and cracking.
In the layered elastic approach, the effects of axle load and tire inflation pressure are combined to estimate pavement response in terms of deflections, stresses or strains. Such responses can be matched with appropriate failure criteria (such as fatigue cracking of asphalt concrete and rutting due to subgrade soils) to estimate pavement life in terms of 18-Kip axle repetitions. Existing damage models vary from
14

empirical to mechanistic. Currently, the mechanistic-empirical models for fatigue and rutting utilize calculated stress, strain, or deflections to estimate fatigue life or permanent deformation accumulation under repeated loading.
Flexible Pavement Rutting Models Concerning rutting, several failure criteria have been recommended.
Correlations between the vertical strain on the surface of the subgrade and the number of equivalent single-axle load (ESAL) repetitions are widely used (Dorman et al. 1965). Other rutting criteria correlate the rate of permanent strain to the elastic vertical strain, and the number of load repetitions.
The logic of selecting the subgrade strain is as follows. In pavement materials, the magnitude of the plastic strain is directly proportional to the magnitude of the elastic strain (Monismith et al. 1988). In a pavement system, elastic strain increases from the subgrade to the pavement surface. Accordingly, by setting the elastic strain at the subgrade surface at a specific value, the elastic strain in the layers above the subgrade are controlled, as are the values for the associated plastic strains. Integration of the plastic strains over the pavement sections provides a measure of the permanent deformation (rut depth), which will occur at the pavement surface.
The vertical compressive strain criteria can be expressed by an equation relating the number of· 18-Kip load applications to the vertical compressive strain at the top of the subgrade. The coefficients vary substantially depending upon the design methodology from which the compressive strain criteria are determined. Three different design criteria are reviewed below.
To minimize surface rutting, Santucci (1977) at Chevron developed the following relationship from analyses of flexible pavements:
w.8 - i.03 x rn•8 ( _.!.. )4.48 EC
(2.2)
15

where: W18= number of weighted 18-Kip axle load prior to excessive rut
depth; and E0 = vertical compressive microstrain at the top of the subgrade. To minimize surface rutting, the Shell Pavement Design Manual (1978)
used results from the AASHO Road Test (1962) to develop the following subgrade strain criteria equation:
W18 - 6.1s x 1011 ( ..!.. )4·0
ec
Brown et al. (1977) at the University of Nottingham developed a compressive strain criteria based on analyses using the Great Britain Road Note 20 Procedure:
w1s - 3.oo x 1015 (..!..)3.57 ec
(2.3)
(2.4)
These three strain criteria are plotted in Fig. 5. The plots show that the Chevron and Nottingham curves give more conservative values for the number of weighted 18-Kip axle loads for a given compressive strain on the subgrade, than does the Shell curve. For example, using the Chevron and Nottingham curves, a compressive strain of 1000 microstrain would limit the number of weighted 18-Kip axle loads to approximately 160,000 applications, while the Shell curve would limit the number to 600,000 applications.
Flexible Pavement Fatigue Damage Models Under traffic loading, the asphalt concrete (AC) layer in a flexible
pavement structure is subjected to continuous flexing. The magnitude of the AC flexural strains depends on wheel loading conditions, thickness of paving material layers, and properties of the various paving layers, and subgrade soil. Fatigue transfer functions relate the number of load repetitions to reach certain pavement "crack failure" conditions to the maximum tensile strain at the bottom of the AC layer.
16

lllOO
1000
I !il 100
Conversion Factors 1 psi = 6.9 kPa 1 in = 25.4 11111
1 mph = 1. 6 kph 1 lbf = 4.5 N "F => subtract 32 x 5/9 = ·c
FIG. 5. Vertkal Compressive Strain Versus the Number of Weighted 18-kip Axle Load Applications for Three Different Rutting Equations
Miner's hypothesis is the most widely used procedure for accommodating "mixed loading" conditions (Thompson et al. 1989).
According to Pell (1987), the general form of the fatigue algorithms for AC mixtures relating tensile strain to failure is:
where: N = number of repetitions to failure; ft = tensile strain repeatedly applied; and
K,a= coefficients.
17
(2.5)

The coefficients Kand a are usually established based on laboratory fatigue data and field calibration studies, or by relating structural model response to observed pavement performance.
To minimize surface cracking, Finn et al. (1977) developed a relationship from analyses of flexible pavement performance:
where:
(2.6)
(2. 7)
Nt =
=
the number of 18-Kip ESAL to predict up to 10% or equal to or greater than 45% cracking in the wheel path area; tensile strain repeatedly applied, in µStrain; and
asphaltic concrete stiffness, in psi.
SUMMARY OF THE LITERATURE REVIEW 1. In the past 40 years, the trucking industry has used several new
tire types, sizes, and configurations. New tire designs, such as wide base single tires to replace dual tires, continue to gain popularity; their use is widespread in Europe, particularly in France. These changes have generated concern among U.S. highway engineers that the new tires will increase highway pavement damage. Several researchers have shown the comparative damaging effects of wide base single tires and dual tires in terms of surface strain, surface deflections, and strain at the bottom of the asphalt layer. Thus, study is needed to evaluate the effect of these tires in different layers of thick and thin asphalt concrete pavements for different axle loads, tire inflation pressures, and speeds.
2. The authors acknowledge the non-uniform and non-circular pressure distribution under the tire; however, their impact is only observed near the surface. There is little difference between uniform and non-uniform pressure distribution on strains induced at the bottom of thick asphalt layers on the subgrade compressive strains. The finite element non-uniform pressure distribution model requires tire
18

construction and material properties as input, and is not userfriendly .. The assumption of uniform pressure distribution makes the analyses simple and produces reasonable results.
3. Pavement responses, such as stresses, strains, and deflections, have been matched with appropriate failure criteria to estimate pavement performance in terms of 18-Kip axle repetitions. Failure criteria for rutting and cracking (in which rutting is expressed as a function of vertical compressive strain at the top of the subgrade and cracking is expressed as a function of tensile strain at the bottom of the AC layer) have been reviewed in this chapter.
19


CHAPTER Ill MATERIALS AND METHODS
Truck tire size, tire type, tire inflation pressure, vehicle loading, and speed affect pavement performance. Pavement performance also depends on the material properties. Layered elastic procedures for the analysis of deflection data do not account for the nonlinear relationship between material stiffness and applied stress. Pavement modeling that uses elastic layer theory requires feedback from the field and laboratory tests that represent the actual behavior as closely as possible. To develop, verify, and evaluate a method to account for these changes in the material behavior and effect of tire type on the pavement performance, an extensive study was undertaken. Two in-service pavement sections (one thick, one thin) were instrumented with MDD's for this purpose. Depth deflection data were collected under both Falling Weight Deflectometer (FWD) and truck loadings. Material samples from each site were taken for the laboratory testing. This section describes the layout and cross-section of the test sections, the materials, and the tests conducted.
LAYOUT AND CROSS-SECTION OF TEST PAVEMENT SECTIONS The study was conducted on test sites located on Farm to Market Road
2818 (Section I [Thin]) near Bryan, Texas and State Highway 21 (Section II [Thick]) between Bryan and Caldwell, Texas. At each site, five positions were marked in the outside wheel path; These positions, as shown in Fig. 6, were used for the FWD testing and collection of material samples. MDDs with four Linear Variable Differential Transformers (LVDT's) modules each were installed in the outer wheel path at each site. The cross-sections of the test pavements showing the locations of MDD sensors are shown in Fig. 7.
Section I (Thin) has a hot mix asphaltic concrete (HMAC) layer of 1.5 inches (38 mm) thick and a crushed limestone base course 10 inches (254 mm) thick overlaying a sandy clay subgrade. The average value of International Roughness Index (IRI) for Section I (Thin) was 95.82 in/mile at the start of testing.
21

Conversion Factors 1 psi = 6.9 kPa 1 in = 25.4 nm 1 mph = 1.6 kph 1 lbf = 4.5 N "F => subtract 32 x 5/9 = ·c
-·-·~-~·-·-·-·-·-·-·-·-·-·-·-·-·-·-·-·-·-·-·-·-·-·-·-·-·-·-·-·-·-·-·-·-· a.dGrW\ MDD Bole
I FWD Test Pmitiom
w ~ I 01 12 03 04
\ \ Oater
Wheel Path Test pit for Laboratory Data
FIG. 6. Typical Layout of Test Section
1.5"HMAC
10" Crushed Limestone
Sandy Clay Subgrade
Conversion Factors 1 psi = 6.9 kPa 1 in = 25.4 nm 1 mph = 1. 6 kph 1 lbf = 4.5 N
SECTION I
"F => subtract 32 x 5/9 = ·c
MDDModule Depths (inches)
- - - - - - 10 13.75 - - - - -
------20 20.75- - - - - -
------30 29.75 - - - - -
FIG. 7. MOD Locations in Test Pavements
22
SECTION II
j~
7"HMAC
14" Crushed Limestone
6" Lime Stabilized Sub grade
Sandy Clay Subgrade
1'. -81.5" Anchor

Section II (Thick) has a hot mix asphaltic concrete (HMAC) layer 7 inches (178 mm) thick, a crushed limestone base course 14 inches (356 mm) thick, and a 6-inch (152 mm) lime stabilized subbase overlaying a sandy clay subgrade. The average value of international roughness index for Section II (Thick) was 85.87 in/mile.
Layer thickness and material density are two construction variables that have a significant effect on flexible pavement performance. The structural capacity of a pavement is influenced directly by the thickness of the component layers; density affects the stiffness of paving materials. Pavement layer thicknesses were obtained from cores taken at the test sites. In-place densities of the subgrade soil and crushed aggregate base materials were measured with a nuclear density gage in test pits. Table 1 shows the material properties found during these investigations.
EXPERIMENTAL SETUP The objective of the study was to compare pavement responses for
various combinations of load, speed, and tire pressure for dual and wide base single tires. The study included measuring depth deflections for two load levels, three tire pressures, four speeds, and two tire types. The type of tires used during the tests were 11R22.5 as dual tires and 425/65R22.5 as wide base single tires. Both tires were analyzed under a matrix of conditions that encompassed lightly loaded to fully loaded, and underinflation to overinflation for each tire. Fig. 8 summarizes the experimental design.
Table 1. In Situ Soils Data for the Test Sections
Section Test Date Base (B) Subgrade (S)
I 4-25-90 B I s II 11-15-89 B II s
23
Moisture Content Dry (Percent) Density
6.0 33.2 6.0 14.1
{pcf)
132.9 84.5 131.7 109.1
Convers1on Factors 1 psi = 6.9 kPa 1 in = 25.4 l1lTI
1 mph= 1.6 kph 1 lbf = 4.5 N ·F => subtract 32 x 5/9 = ·c

{(>. ~~~m '\;"'o~~~~ ~ \!}
'~ 2-5
10-lS
2S-30
SO-SS
Conversion Factors 1 psi = 6.9 kPa 1 in = 25.4 nm 1 mph = 1. 6 kph
EXPERIMENTAL DESIGN 1 lbf = 4.5 N ·r => subtract 32 x 5/9 = ·c
DRIVB AXLB - DUAL RADIALS TRAILBR. AXLB - WIDB BASB RADIALS (11R22.5) (425/6SR22.5)
mGH-120 LOW-80 HIGH-130 LOW-100
FOIL BMPTY FOIL BMPTY FUlL BMPrY FOIL BMPl'Y
Covmable: Wheel Positian. Relative to the MDD
FIG. 8. Experimental Design to Evaluate the Damage Effects of Dual and Wide Base Single Tires
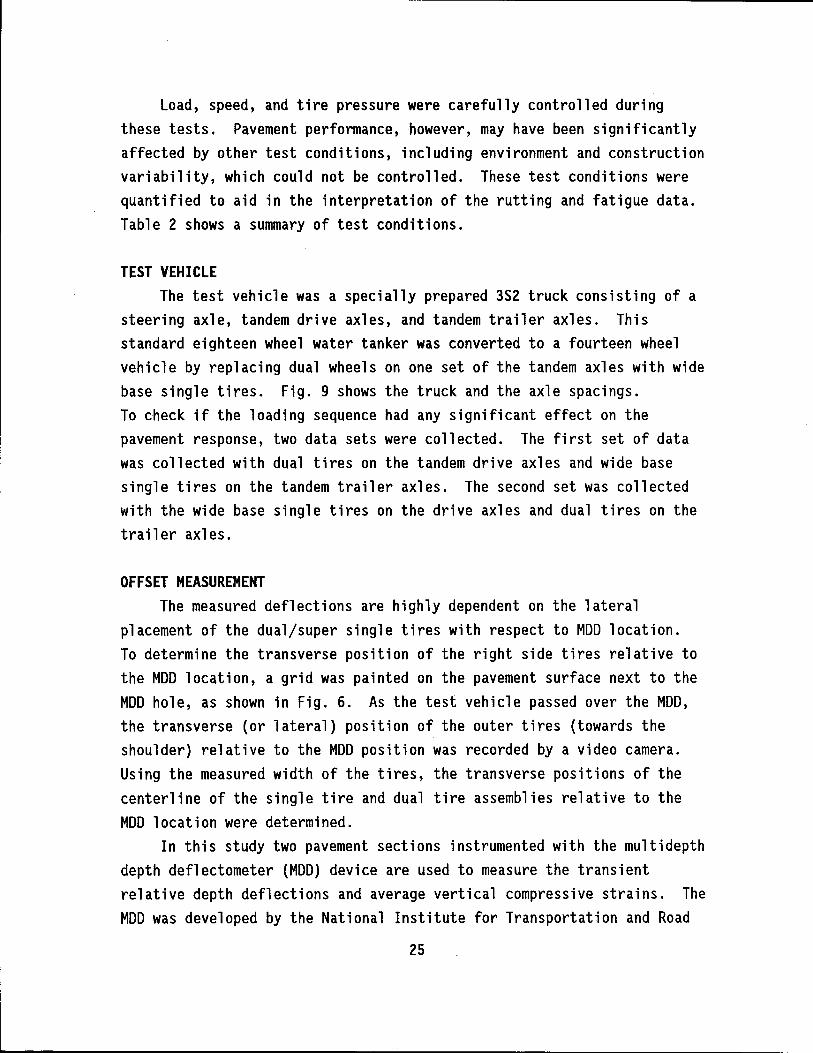
Load, speed, and tire pressure were carefully controlled during these tests. Pavement performance, however, may have been significantly affected by other test conditions, including environment and construction variability, which could not be controlled. These test conditions were quantified to aid in the interpretation of the rutting and fatigue data. Table 2 shows a summary of test conditions.
TEST VEHICLE The test vehicle was a specially prepared 3S2 truck consisting of a
steering axle, tandem drive axles, and tandem trailer axles. This standard eighteen wheel water tanker was converted to a fourteen wheel vehicle by replacing dual wheels on one set of the tandem axles with wide base single tires. Fig. 9 shows the truck and the axle spacings. To check if the loading sequence had any significant effect on the pavement response, two data sets were collected. The first set of data was collected with dual tires on the tandem drive axles and wide base single tires on the tandem trailer axles. The second set was collected with the wide base single tires on the drive axles and dual tires on the trailer axles.
OFFSET MEASUREMENT The measured deflections are highly dependent on the lateral
placement of the dual/super single tires with respect to MDD location. To determine the transverse position of the right side tires relative to the MDD location, a grid was painted on the pavement surface next to the MDD hole, as shown in Fig. 6. As the test vehicle passed over the MDD, the transverse (or lateral) position of the outer tires (towards the shoulder) relative to the MDD position was recorded by a video camera. Using the measured width of the tires, the transverse positions of the centerline of the single tire and dual tire assemblies relative to the MDD location were determined.
In this study two pavement sections instrumented with the multidepth depth deflectometer (MDD) device are used to measure the transient relative depth deflections and average vertical compressive strains. The MDD was developed by the National Institute for Transportation and Road
25
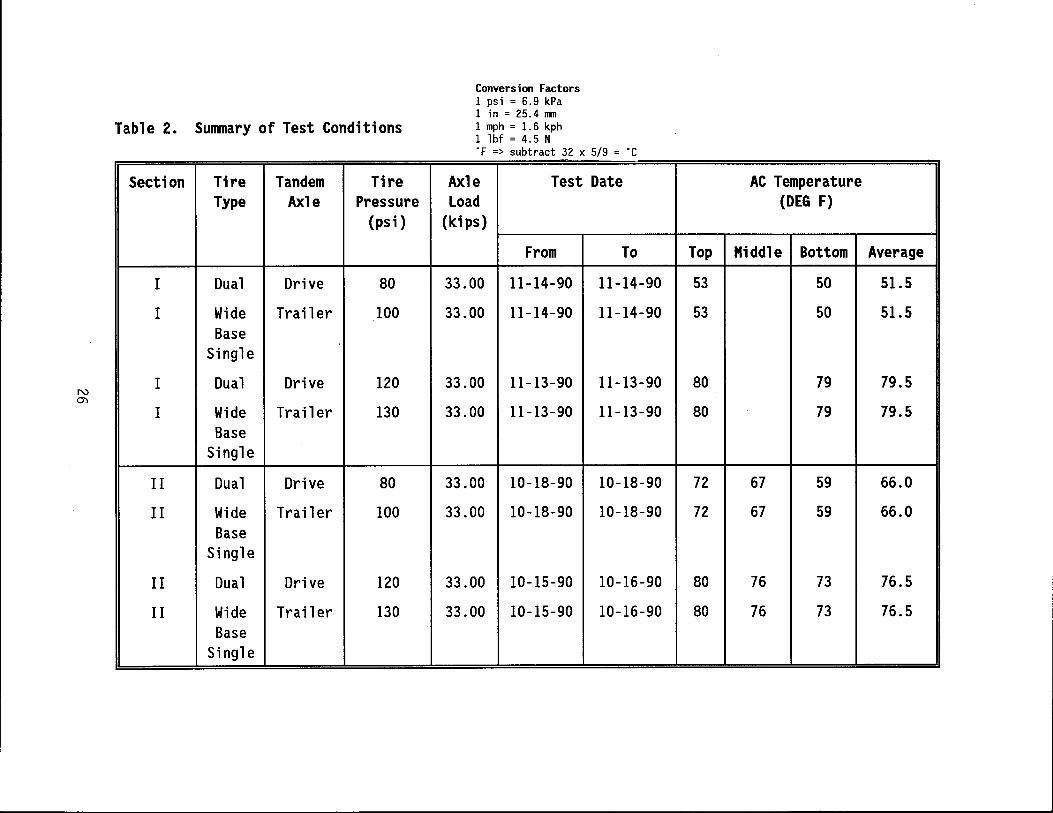
Table 2. Sunnnary of Test Conditions
Section Tire Tandem Tire Type Axle Pressure
(psi)
I Dual Drive 80
I Wide Trailer 100 Base
Single
I Dual Drive 120
I Wide Trailer 130 Base
Single
II Dual Drive 80
II Wide Trailer 100 Base
Single
II Dual Drive 120
II Wide Trail er 130 Base
Single
Conversion Factors 1 psi = 6.9 kPa 1 in = 25.4 nm 1 mph = 1.6 kph 1 lbf = 4.5 N ·F => subtract 32 x 5/9 = ·c
Axle Test Date Load
(kips)
From To
33.00 11-14-90 11-14-90
33.00 11-14-90 11-14-90
33.00 11-13-90 11-13-90
33.00 11-13-90 11-13-90
33.00 10-18-90 10-18-90
33.00 10-18-90 10-18-90
33.00 10-15-90 10-16-90
33.00 10-15-90 10-16-90
AC Temperature (DEG F)
Top Middle Bottom Average
53 50 51.5
53 50 51.5
80 79 79.5
80 79 79.5
72 67 59 66.0
72 67 59 66.0
80 76 73 76.5
80 76 73 76.5

N '-I
Table 2. Summary of Test Conditions (Continued)
Section Tire Tandem Tire Axle Type Axle Pressure Load
(psi) (kips)
I Dual Drive 80 11.10
I Wide Trailer 100 6.80 Base
Single
I Dual Drive 120 11.10
I Wide Trailer 130 6.80 Base
Single
II Dual Drive 80 10.66
II Wide Trailer 100 7.10 Base
Single
II Dual Drive 120 10.66
II Wide Trail er 130 7.10 Base
Single
Conversion Factors 1 psi = 6.9 kPa 1 in = 25.4 nm 1 mph = 1. 6 kph 1 lbf = 4.5 N °F => subtract 32 x 5/9 = ·c
Test Date AC Temperature (DEG F)
From To Top Middle Bottom
11-15-90 11-15-90 78 75
11-15-90 11-15-90 78 75
11-14-90 11-14-90 80 78
11-14-90 11-14-90 80 78
10-23-90 10-23-90 74 66 59
10-23-90 10-23-90 74 66 59
10-23-90 10-23-90 60 57 55
10-23-90 10-23-90 60 57 55
Average
76.5
76.5
79.0
79.0
66.5
66.5
57.5
57.5

N 00
Table 2. Sunnnary of Test Conditions (Continued)
Section Tire Tandem Tire Axle Type Axle Pressure Load
(psi) (ldps)
I Dual Trail er 120 37.00
I Wide Drive 130 37.00 Base
Single
II Dual Trail er 120 33.00
II Wide Drive 130 33.00 Base
Single
Test Date
From To
5-30-91 5-30-91
5-30-91 5-30-91
7-12-91 7-12-91
7-12-91 7-12-91
Conversion Factors 1 psi = 6.9 kPa 1 in = 25.4 11111
1 mph = 1.6 kph 1 lbf = 4.5 N ·r => subtract 32 x 5/9 = ·c
Top
95
95
103
103
AC Temperature (DEG F)
Middle Bottom Average
96 95.5
96 95.5
97 85 95.0
97 85 95.0

N l..O
TRAILER. AXLE
Conversion Factors 1 psi = 6.9 kPa 1 in = 25.4 R1T1
1 mph = 1.6 kph 1 lbf = 4.5 N "F => subtract 32 x 5/9 = ·c
DRIVE AXLE
IC
STEERING AXLE
.is~ .... ----- 23.67' --------i.-4.42._..,. _____ 14.58' ------
46.92'
FIG. 9. 352 Water Tanker Used for Testing

Research {NITRR) in South Africa {Basson et al. 1981). The two test sections {thick and thin) instrumented with MOD system are shown in Fig. 7.
INSTRUMENTATION USED The LVDT, together with its clamping unit, is called a module
{illustrated in Fig. 10). Each MOD module includes one LVDT and a housing unit consisting of a clamping nut, spring, cable ducting, loading washer, steel ball bearings, and a rubber membrane. The MOD is installed in a 1.5 inch {38 mm) diameter hole drilled to a depth of approximately 7 feet {2.1 m). The top 1 inch {25 mm) of the pavement is drilled with a 2.5 inch {63 mm) drilling bit for installation of the top cap. The MOD hole is lined with a 0.1 inch {2.5 mm) thick lining tube, and the voids between the tube and the wall are filled with a rubber grout. The flexible lining provides waterproofing, a smooth surface and minimizes "cave-ins" {Scullion et al. 1988b). The steel ball bearings within each MOD module are used to secure each module to the inside of the hole at a selected depth by turning the clamping nut clockwise, thereby compressing the spring on top of the loading washer. The subsequent horizontal movement of the ball bearings ensures that the modules are secured to the side of the hole. One duct on either side of the module is provided to allow a maximum of six sets of LVDT cables to pass through each module, enabling a string of modules, as shown in Fig. 11, to be installed.
The interconnecting rod shown in Fig. 11 is secured to the anchor rod by a snap connector unit. Normally, the anchor rod is anchored at a depth of approximately 7 feet {2.1 m) below the pavement surface.
At the surface of the pavement, the MOD hole is sealed with a brass surface cap and lid unit embedded in a polyurethane compound. The top of the surface cap is installed flush with the surface of the pavement.
LVDT Selection There are several factors which must be considered when selecting the
appropriate LVDT. These include movement range, sealed vs. unsealed, and type of LVDT. The E300 LVDTs have a range of plus and minus 0.30 inch {7.6 mm). E300 LVDTs may require signal amplification; however, they prove more appropriate for long term testing. ElOO LVDTs have a range of plus and
30

Conversion Factors 1 psi = 6.9 kPa 1 in = 25. 4 lll11
1 mph = 1.6 kph 1 lbf = 4.5 N °F => subtract 32 x 5/9 = ·c
FIG. 10. Components of an MOD Module
31
CLAMPING UNIT
SPRING
CABLE DUCTING
LOAD WASHER STEEL BALL
SHEET RUBBER ENCLOSURE
LVDT
LVDT CORE
RUBBER SLEEVE
FLEXIBLE LINING
INTER CONNECTING ROD

8 FI.
Conversion Factors 1 psi = 6.9 kPa 1 in = 25.4 nm 1 mph = 1. 6 kph 1 lbf = 4.5 N ·r => subtract 32 x 5/9 = ·c
--- POLY-tmEl'BANE CASTING COMPOUND
MtlLTJDEPTJI DEFLEC'I'OMETER MODULES
SNAP BEAD (POSnlYE LOCXING)
ANCHOR EXTENSION
U IN.
'------- ANCROR
NOTTO SCALE
FIG 11. Typical Cross Section of MOD after Installation
32

----------------------------------------------
minus 0.10 inch (2.5 mm). These LVDTs may not require signal amplification; but, they can go out of range as the pavement deforms.
LVDTs are available in both AC and DC voltages. AC LVDTs require external signal conditioning, whereas, DC LVDTs have the signal conditioner built in. Hermetically sealed LVDTs are about 5 times more expensive than the unsealed. Sealed LVDTs are recommended for use when they are to remain installed for a period over one year. From past experiences non-hermetrically sealed DC LVDT's are not recommended.
Data Acquisition System A specialized data acquisition system was developed at the Texas
Transportation Institute to record MOD pulses under both FWD or truck loadings. A Compaq 386/20 microcomputer is used with a Data Translation (OT 2814) circuit board providing a maximum sampling rate of 5000 readings per channel per second. For recording truck data, the truck length and speed are the input; the sampling rate is automatically calculated; and the data collection is automatically started based on a response of any sensor greater than a preset trigger level. For truck loads, typically 1000 data points per channel are stored. The files created are read directly into a spreadsheet software package for display and analysis.
Testing Procedure For the purpose of evaluating pavement performance under dual and wide
base single tires, multidepth deflection tests were conducted on the two instrumented sections. The general testing procedures for evaluating truck loading at each test site was as follows.
• Truck tire tests were conducted for the conditions shown in Fig. 8. In-depth pavement deflections were measured; the lateral tire positions were determined for each truck run.
• All deflection data were saved on a floppy diskette for later analysis.
The recorded MOD signal truck loading usually contains high frequency noise. This signal is cleaned by performing a Fast Fourier Transform on the signal. The frequency of the noise is determined, removed from the
33

45
40
z E 25 (..)
~ 20
i:i 15
10
5
TANDEM DRIVE AXIB (DUAL TIRES) (OFFSET 6.75")
STEERING AXLE LVDT@ 10"
TANDEM TRAIIBR AXIB (WIDE B.ASE SINGLE TIRES) (OFFOO 6.75")
oLL_~~~~~~~~~~~~~~__J 0 1000 2000 3000 4000 5000 6000 7000
TIME (msec) 8000 9000
Conversion Factors 1 psi = 6.9 kPa 1 in = 25.4 nm 1 mph = 1.6 kph 1 lbf = 4.5 N "F => subtract 32 x 5/9 = ·c
FIG. 12. A Typical MOD Signal From Section I under the Test Vehicle (5 axles) Before Noise Filtering

w (Jl
45
40
35
~ s 30 -z ~ 25 (.)
~ 20 f;;;:I Cl
15
10
5
0 0
TANDEM DRIVE AXlE (DUAL TIRES) (OFFSET 6.75")
LVDT@ 10" ffi'EERING AXIE
1000 2000 3000
TANDEM TRAILER AXLE (WIDE BASE SINGLE TIRES) (OFFSEI' 2.75")
4000 5000 6000 7000 8000 9000 TIME (msec) Conversion Factors
1 psi = 6.9 kPa 1 in = 25.4 rrm 1 mph = 1. 6 kph 1 lbf = 4.5 N °F => subtract 32 x 5/9 = ·c
FIG. 13. A Typical MDD Signal from Section I under the Test Vehicle (5 axles) After Noise Filtering

signal, and an inverse Fourier Transform is completed to return the signal to the time domain. Figs. 12 and 13 show a typical MDD response from Section I {thin) under the test vehicle loading, before and after filtering.
LABORATORY TESTING Temperature, loading frequency, and moisture conditions have a
significant impact on flexible pavement performance. The stiffness of asphalt concrete {AC) is affected by temperature and loading frequency. The stiffnesses of subgrade soils and granular base materials is affected by moisture. To quantify the thermal conditions during testing, temperatures at the top and bottom of the AC layer, and air temperature were taken three times every day. These temperatures were taken at the start of testing in the morning, at midday, and at the end of testing. Subgrade soil and granular base material samples were excavated and in situ moisture contents were measured {Table 2).
Asphalt concrete, base course, and subgrade samples were tested in the laboratory to determine the basic constitutive relationship between stress and deformation of the test site materials. For the asphaltic concrete, the indirect tension test was chosen, while a repeated load triaxial test was selected for characterization of the base and subgrade.
In this test a cyclic load is applied to a test sample while the confining pressure is controlled. The test has two major limitations. The deviatoric stress can only be applied along the principal axis of the specimen, and two of the three principal stresses are equal. The triaxial device can, therefore, only reproduce a stress state directly under a single wheel load or the FWD plate. Furthermore, the confining stresses under a vehicle or FWD load change in a cyclic nature, while the standard test only applies a constant confining stress. The frequency of loading in the laboratory, for an impulse loading device or vehicular load may be approximated by {Lytton et al. 1990):
1 f - -
2t
36
{3 .1)

where: f = the loading frequency, in Hertz; and t = the time duration of the impulse load, in seconds.
To characterize the test site materials, the following procedures were followed.
Asphalt Concrete On each test site, four inch (101 mm) diameter cores were taken
through the asphalt concrete layer at approximately position 00 (Fig. 6). On Section II (Thick), these cores were retrieved and sawn to produce two samples (i.e., top and bottom section) for testing. Cores from Section I (Thin) were left intact. These samples were tested in indirect tension for three frequencies, 0.4, 5, and 10 Hz, and at two temperatures, 77, and 104 degrees Fahrenheit (25°C to 40°C). These temperatures were selected to provide a representative range of pavement temperatures.
By assuming that the FWD transmits a load pulse of about 28 msec duration (Kennedy 1982), from equation 3.1 the frequency can be approximated as between 17 and 20 Hz. This fast loading rate is difficult to duplicate in the laboratory. The loading frequencies of a vehicle moving at creep speed and at 55 mph (88 kph) speed were approximated to be 0.4 and 5 Hz. The results of tensile tests are listed in Tables Al through A6 in Appendix A.
Granular Material Samples from the granular base materials were obtained from both
sections. The material, obtained from a test pit at approximately position 00 (Fig. 6), was bagged and transported to the laboratory. Before disturbing the material in the test pit, the moisture content and density were obtained using a nuclear density device (AASHTO T 238-79). In the laboratory, six inch (152 mm) diameter specimens, ten inches (254 mm) long, were remolded at approximately the measured field moisture content and field density. These cylindrical specimen were tested in a repeated load triaxial test according to AASHTO T 274-82. All measurements were made in the 2ooth cycle. The calculated resilient
37
modulus and confining pressures at which the deformations were measured are listed for each site in Tables Al through A6 of Appendix A.
The measured resilient moduli and stress states for each sample were used to develop equations in which the resilient modulus is a function of both the mean principal stress and the octahedral shear stress. The model proposed by Witczak and Uzan (1988), and used for granular and subgrade material characterization is as follows:
For the general case, the deviatoric stress can be replaced with the octahedral shear, 1 0 ct:
where:
and for triaxial tests where u2 = u3 :
T - {i C1 oct 3 d
(3.2)
(3.3)
(3.4)
(3.5)
From a least square curve fitting analysis, Table 3 lists the obtained coefficients K1 , K2 , and K3 • It also shows the coefficient of
determination, r 2, for each set of data.
38

Table 3. Base Course Coefficients for Equation 3.2
SECTION MATERIAL LOADING K, K2 FREQUENCY (Hz)
I Limestone 10.0 3594 0.90 I Limestone 5.0 6287 0.67 I Limestone 0.4 4295 0.82 II Limestone 10.0 4766 0.74
Subgrade Material
Conversion Factors 1 psi = 6.9 kPa 1 in = 25.4 lllTl
1 mph = 1. 6 kph 1 lbf = 4.5 N "F => subtract 32 x 5/9 = ·c
K3 r2
-0.25 0.99 -0.12 0.94 -0.17 0.99 -0.24 0.99
Samples of the subgrade material were obtained using thin walled sampling tubes pushed into the subgrade at position 00 (Fig. 6). These samples were extruded from the tubes, wrapped air tight, and transported to the laboratory for testing. In the laboratory, the samples were to a diameter of 2.81 inches (71 mm) and a length of 6 inches (152 mm). They were then subjected to a standard resilient modulus test as described in AASHTO T 274-82. All measurements were made at the end of 200th cycle.
The calculated resilient modulus for each stress state is listed by site in Tables Al through A6 of Appendix A.
The measured resilient modulus values and stress states for each sample were used to develop equations in which the resilient modulus is a function of both the mean principal stress and the octahedral shear stress. The results of the curve fitting analysis are shown in Table 4. The coefficient of determination, r 2
, for each set of data is also shown.
SUBSURFACE EXPLORATION The subsurface exploration at Section I (Thin) and Section II
(Thick) consisted of dynamic cone penetration testing. The purpose was to check the layer thicknesses and degree of uniformity in the subgrade layer. The equipment used, the testing procedure, and the method of data interpretation are described in this section.
39

Table 4. Subgrade Coefficients for Equation 3.2
SECTION MATERIAL LOADING K, K2 FREQUENCY (Hz)
I Sandy Clay 10.0 5953 0.25 I Sandy Clay 5.0 3856 0.27 I Sandy Clay 0.4 3526 0.23 II Sandy Clay 10.0 8412 0.34 II Sandy Clay 5.0 5841 0.39 II Sandy Clay 0.4 4769 0.37
DYNAMIC CONE PENETRATION TESTING
Conversion Factors 1 psi = 6.9 kPa 1 in = 25.4 11111
1 mph = 1. 6 kph 1 lbf = 4.5 N "F => subtract 32 x 5/9 = ·c
K3 r2
-0.23 0.86 -0.13 0.95 -0.06 0.94 -0.38 0.93 -0.33 0.93 -0.23 0.93
The equipment employed for the penetration testing was a dynamic cone penetrometer (DCP). This equipment has long been used by the geotechnical engineers to investigate soil's shearing resistance or its supporting strength (Khedr et al. 1985). The resistance to penetration is normally related to material properties or empirical material qualities. The equipment can also be used as a tool to define pavement layer thicknesses and material variabilities.
The DCP used in this study consists of a 5/8 inch diameter (15.9 mm) steel rod with a cone attached to one end which is driven into the pavement by means of a sliding mass hammer. The angle of the cone is 60 degrees and the diameter of the base of the cone is 0.79 inch (20 mm). The diameter of the cone is 0.16 inch (4 mm) larger than that of the rod to ensure that the resistance to penetration is exerted on the cone. The DCP is driven vertically into the soil by dropping a 17.6 lbs sliding hammer from a height of 22.6 inches (574 mm). The depth of cone penetration is measured at selected hammer drop intervals. A schematic of the DCP is shown in Fig. 14.
At Section I (Thin), the penetration testing was started from the top of the pavement surface. The DCP was pushed to a depth of about 32 inches (813 mm}, and penetration readings were recorded after every five hammer drops. The penetration rate was about 0.042 inch/blow (Imm/blow)
40

Conversion Factors 1 psi = 6.9 kPa 1 in = 25.4 rrm 1 mph = 1. 6 kph 1 lbf = 4.5 N "F => subtract 32 x 5/9 = ·c
1------ Handle r~-,
I i1~-- Hammer (17.6 lb)
v
Anvil
0.63" ¢ Steel Rod
Cone
,._--Cone Angle 60 °
0.79"
FIG. 14. Dynamic Cone Penetrometer Used for Penetration Testing
41

and 0.480 in/blow (12.2 mm/blow) in the granular base and subgrade layers, respectively. The penetration test results are plotted in Fig. 15. The slope of the penetration curve changes at a depth of about 11.5 inches (292 mm), indicating the depth of delineation between the base and subgrade layers. Within each layer the penetration rate was found to be consistent.
At Section II {Thick), the penetration testing was started after removing the asphalt concrete and the granular layers. The DCP was pushed to a depth of about 26 inches (660 mm). The penetration readings were recorded after every five hammer drops. The penetration rate throughout was about 0.160 in/blow (4 mm/blow). The subgrade penetration rate in Section II {Thick) was three times less than Section I {Thin), indicating a much stiffer material. The penetration test results are plotted in Fig. 15. The slope of the penetration curve is almost constant with depth, showing no point of delineation between the lime stabilized and natural subgrade layers. From these results it can be assumed that the two layers have almost similar strength properties. Therefore, the lime stabilized subgrade was not treated as a separate layer in the deflection analysis but combined with the subgrade.
42
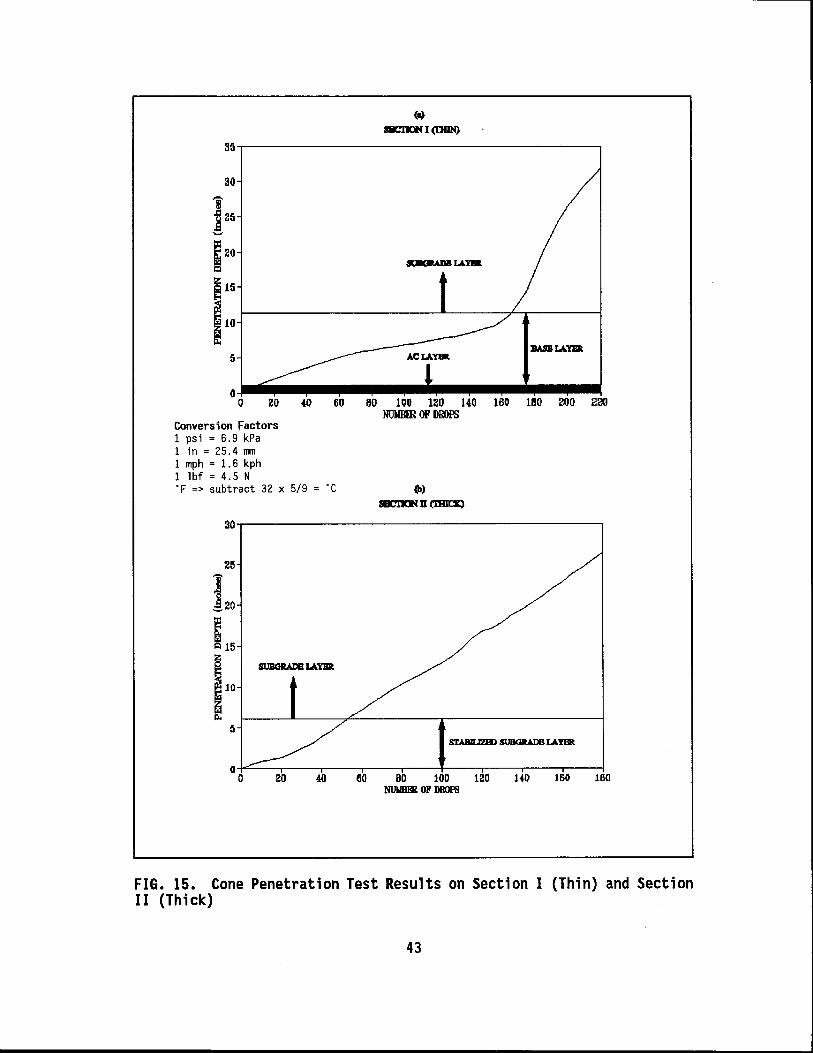
30
5
(a)
SliC'l1CR I (IHIN)
o_.. ............................. .... 0 20 fl> 60 80 100 120 140 160 lBO 200 220
Conversion Factors 1 psi = 6.9 kPa 1 in = 25.4 nm 1 mph = 1.6 kph 1 lbf = 4.5 N "F => subtract 32 x 5/9 = ·c
NUMillR OP DROPS
60 80 100 120 1f0 160 160 NUMHm OF DD'.JPS
FIG. 15. Cone Penetration Test Results on Section I (Thin) and Section II (Thick)
43


CHAPTER IV EVALUATION OF THE EFFECTS OF TRUCK TIRE TYPE ON SUBGRADE
RUTTING IN FLEXIBLE PAVEMENTS
This chapter describes the analyses of depth deflections measured in the subgrade layer under truck loadings. The deflections were measured at the test sections under dual and wide base single tires for different test conditions. The measured deflections were converted into average vertical compressive strains at the top of the subgrade layer. Pavement performance predictions were made for dual and wide base single tire loadings based on damage due to subgrade rutting. An attempt was made to evaluate the influence of tire type, axle load, asphalt concrete layer temperature, speed, and inflation pressure on pavement rutting life.
DETERMINATION OF AVERAGE VERTICAL COMPRESSIVE STRAINS FROM MEASURED DEPTH DEFLECTIONS
Figs. 16 and 17 show typical depth deflection profiles for the two sections as the test vehicle passed across the MDD location. From the information shown on these figures, it is straight forward to compute the average vertical compressive strains within the pavement layers. Average vertical compressive subgrade strains were calculated as the deflection measured by MDD 2 minus MDD 3, divided by the spacing between them for Section I (Thin); and MOD 3 minus MDD 4, divided by the spacing between them for Section II (Thick). Figs. 18a and 18b show the typical measured average vertical compressive strain profile in the subgrade layer under the test truck (5 axle) loading passing over the MDDs in Section I (Thin) and Section II (Thick), respectively.
In the data collection phase of this study, the vertical compressive subgrade strains were computed for a range of test variables. These include: (a) tire pressures (b) lateral offset distances (c) axle load and (d) surface temperature. A regression analysis was performed on the collected data; complete details can be found in Akram (1992). Below, a summary of the most significant findings, together with the developed regression models, will be presented.
45

Conversion Factors 1 psi = 6.9 kPa 1 in = 25.4 11111
1 mph = 1. 6 kph 1 lbf = 4.5 N
45
40
10
5
·r => subtract 32 x 5/9 = ·c
DUAL (DRIVE AXLE)
STEERING AXLE
WIDE BASE SINGIE (TRAIIER AXLE)
,,.... __ MOD 1@ 3.5"
1000 2000 3000 4000 5000 6000 7000 8000 9000 TIME (msec)
FIG. 16. Typical Depth Deflections Profile Measured by MDD on Section I (Thin) Under the Test Vehicle (5 axle) Loading

+::--....J
16 WIDE BASE SINGIE
(TRAIIER AXLE) 14
12 DUAL MDD 1 @ 6.75"
,-.. (DRIVE AXLE)
.!!l ·s 10 '--'
z STEERING 0 8 AXLE ...... ~
MDD 2 @ 13.75"
u ~
6 µ:.. IJ:1
MDD 3 @ 20.75"
Q
4 MDD 4 @ 29.75"
2
oJ..---~~~'.__~~~~~---,-__:~~~~~~==~""""""~ 0 1000 2000 3000 4000 5000 6000 7000 8000 9000 10000
Conversion Factors 1 psi = 6.9 kPa 1 in = 25.4 l1ITI
1 mph = 1.6 kph 1 lbf = 4.5 N ·r => subtract 32 x 5/9 = ·c
TIME (msec)
FIG. 17. Typical Depth Deflections Profile Measured by MOD on Section II (Thick) Under the Test Vehicle (5 axle) Loading

~ o::>
Convers1on Factors 1 psi = 6.9 kPa 1 in = 25.4 nm 1 mph = 1. 6 kph 1 lbf = 4.5 N
1800
1600
1400
1200
~ 1000 il:< E-< BOO [/]
~ u
600 ...... ~
400
200
0
-200
-
-
-
-
0
"F => subtract 32 x 5/9 = ·c
WIDE BASE SINGLE (TRAILER AXLE)
DUAL (DRIVE AXLE)
STEERING AXLE
'.~(\
" I ~fl ~,(\ '
L
I
1000 2000 3000 4000 5000 6000 7000 8000 9000 TIME (msec)
FIG. 18a. Typical Average Vertical Compressive Strain Profile Measured at the Top of the Subgrade Layer on Section I (Thin) Under Test Vehicle (5 axle) Loading

350
300
250 z ~ 200 E-< [!) 0 ~ 150 8 ::E
100
50
STEERING AXLE
DUAL (DRIVE AXLE)
WIDE BASE SINGLE (TRAILER AXLE)
-50-+-----~~~~-.---~~~~-.---~----.-~~.-~-----.-~~,-----~--,~----i
Conversion Factors 1 psi = 6.9 kPa 1 in = 25.4 11111
1 mph = 1.6 kph 1 lbf = 4.5 N ·F => subtract 32 x 5/9 = ·c
0 1000 2000 3000 4000 5000 6000 7000 8000 9000 10000 TIME (rnsec)
FIG. 18b. Typical Average Vertical Compressive Strain Profile Measured at the Top of the Subgrade Layer on Section II (Thick) Under Test Vehicle (5 axle) Loading

Analyses of experimental data showed that the range of tire inflation pressures (80 psi-120 psi (552 to 828 kPa)) for dual tires and 100 psi-130 psi (690 to 897 kPa) for wide base single tires) used in the studies does not contribute significantly to the subgrade rutting on either the thin or thick pavement section. The analyses showed that increased rutting potential was caused primarily by higher wheel loads, lower speeds, and higher AC temperatures during the testing. Tire pressure was, therefore, not considered in developing the regression equations.
Multiple linear regression procedures were performed on the measured data to examine the relationship between the dependent variable (average vertical compressive strains) and the independent variables (speed, axle load, AC layer temperature, and lateral offset). The models selected were the ones minimizing the sum of the squares of the residuals for the fitted line.
The relationships developed for dual tires on a tandem drive axle and wide base single tires on tandem trailer axles for the two test sections are shown below:
Section I (Thin) • Dual tires (drive axle)
ec - -23.917-(1.094*Sp)+(2.091*TP)+
(58.810*Ld)-[2.046*(0ff-3)2]
(R2 - 0.95) (4.1)
where:
fc =
Sp =
Tp =
Ld =
Off =
average vertical compressive strain at top of the subgrade
layer, in microstrain; speed, in mph; average AC layer temperature, in degree Fahrenheit; one half tandem axle assembly load, in kip; and offset distance from the middle of the dual tire assembly, or middle of the wide base single tire to the center of the MOD hole, in inches.
50

• Wide base single tires (trailer axle}
ec - -55.335-(3.035*Sp)+(4.950*Tp)+ (R2
- 0.97) (4.2) (77.072*Ld)-[3.511 *(Oft)2
]
Section II (Thick}
• Dual tires (drive axle}
ec - -32.667-(0.597*Sp)+(0.802*Tp)+ (R2 - 0.94) (4.3)
(14.884*Ld)-[0.226*(0ff-3)2]
• Wide base single tires (trailer axle}
ec - -60.289-(0.447*Sp)+(l.348*Tp)+ (R2
= 0.99) (4.4) (17 .297 * Ld)-[0.536 * (Oft)2
]
A problem in the comparison of wide base single and dual tires on tandem axles is that the load on dual tires is usually assumed to be evenly distributed. This is very seldom true (Huhtala et al. 1990}. The use of video camera to measure the transverse position of dual and wide base single tires for each test run, allowed a relationship to be established between the measured depth deflections and transverse position. The maximum pavement deflection under wide base single tires was found, as expected, under the tire centerline, while the maximum deflection and strain under the dual tire assembly was found under either of the tires as shown in Figs. 19a and 19b. The same phenomenon was observed by Sharp et al. (1986}.
The offset consideration is important because, in order to make a valid comparison between dual and wide base single tires, one should compare maximum responses. The uneven load distribution between dual tires may be due to several factors, including the following:
• the tires have not worn similarly; • the tires are a combination of new, old, and retread; • inside/outside position of the wheel in the dual assembly; • different tire pressures;
51

U1 N
Conversion Factors 1 psi = 6.9 kPa 1 in = 25.4 nm 1 mph = 1.6 kph 1 lbf = 4.5 N
1400
1300
1200
33 kips
t WIDE BASE SINGLE
(TRAILER A.XLE)
AC TEMPERATURE = 77 DEG F SPEED = 55 mph
Z, 1100 I --t----------23 <2 I 33 kips
~ 1000 ,~~
~ 900 u :@
800 -1--:-:~----17 kips
700
500
400-t-~-----,~~,-----~-.~~..,-~-,-~~-r-~~~~~~~~___.j
9 10 8 0 2 3 4 5 6 7 OFFSET (inches)
"F => subtract 32 x 5/9 = ·c
FIG. 19a. Maximum Average Vertical Compressive Strain at Top of the Subgrade Layer Under Dual (Tandem Drive Axle) and Wide Base Single (Tandem Trailer Axle) Tires Loading on Section I (Thin)

U1 w
33 kips 300 r------,r-----
150
\llDE BASE SINGLE (TRAILER AXIE)
17 kips
AC TEMPERATURE = 77 DEG F SPEED= 55 mph
DUAL (DRIVE AXIE)
17 kips 100+-~~~~~~~~~~~~~~~~~~~~~~~~--1
8 9 10 Conversion Factors O 2 3 4 5 6 7 1 psi = 6.9 kPa OFFSET (inches) 1 in = 25.4 nm 1 mph = 1.6 kph 1 lbf = 4.5 N °F => subtract 32 x 5/9 = ·c
FIG. 19b. Maximum Average Vertical Compressive Strain at Top of the Subgrade Layer Under Dual (Tandem Drive Axle) and Wide Base Single (Tandem Trailer Axle) Tires Loading on Section II (Thick)

• a greater or lesser degree of fatigue in the tire carcass; • uneven road surface (ruts, crown); and • type/condition of suspensions. The subgrade strain profiles on the two test sections show that,
under similar conditions, the strains generated by the wide base single tires are greater and more concentrated than those caused by the dual tires. On Section I (Thin), the peak strains and strains at an offset of 10 inches (254 mm), reduce by 25% under wide base single and 10% under dual tires. Similarly, at an offset of 10 inches (254 mm) the reduction in subgrade strains was 18% under wide base single and 5% under dual tires on Section II (Thick). The lesser reduction in strains with the increase in offset under dual tires show better load spreadability under these tires. Similarly, between the two test sections the load spreadability was found to be better on Section II {Thick).
EFFECT OF TIRE TYPE, AXLE LOADING, AC LAYER TEMPERATURE, AND TRUCK SPEED ON THE AVERAGE VERTICAL COMPRESSIVE SUBGRADE STRAIN
Evaluations of vertical compressive strain data showed that subgrade strains increased with an increase in axle load and asphalt concrete layer temperature, and they decrease with an increase in vehicle speed. The magnitude of the axle load was found to be the predominant factor that increases subgrade strains on both thick and thin pavement sections. Under similar test conditions, the average vertical compressive strains were found to be higher under wide base single tires than dual tires on both the test sections. Damage factor ratios (in terms of subgrade strain and number of allowable repetitions) for wide base single tires on tandem drive axles versus dual tires on tandem trailer axles were found to be greater on Section I (Thin) than on Section II {Thick).
Using the developed regression equations, a sensitivity analysis was performed relating the subgrade strains to each independent variable (speed, load, etc). Figs. 20 through 23 show these and they are discussed in the next section.
54

(.Tl (.Tl
1800 AC TEMPERATURE = 77 DEG F
1600 33 k;ps
j l
1400 -VYlDE BASE SINGLE
~ 1200 ti;
(TRAILER AXLE) -
33 kips
0
g 1000 ::E
'l -
1' 800 DUAL
17 kips
(DRIVE 'AXLE)
600 17 k;ps
400 Conversion Factors 5
I I I I
10 15 20 25 30 35 40 45 50 55 1 psi = 6.9 kPa 1 in = 25.4 rrm
SPEED (mph)
1 mph = 1.6 kph 1 lbf = 4.5 N "F => subtract 32 x 5/9 = ·c
FIG. 20a. Effect of Dual (Tandem Drive Axle) and Wide Base Single (Tandem Trailer Axle) Tires Loading at 77 DEG F AC Layer Temperature on the Average Vertical Compressive Strain at Top of the Subgrade Layer for Section I (Thin)

Conversion Factors 1 psi = 6.9 kPa 1 in = 25.4 l1lll
1 mph = 1.6 kph 1 lbf = 4.5 N
1800
1600
1400
z ~ 1200 ti) 0
g 1000 ;21
800
600
-
-
400 5
°F => subtract 32 x 5/9 = ·c
33 kips
l
WIDE BASE SINGLE (TRAILER AXIE)
1 r
17 kips
I I
10 15 20
AC TEMPERATURE - 104 DEG F
-
33 kips
J1
-DUAL
(DRIVE A.XIE)
• 17 kips
I I I
25 30 35 40 45 50 55 SPEED (mph)
FIG. 20b. Effect of Dual (Tandem Drive Axle) and Wide Base Single (Tandem Trailer Axle) Tires Loading at 104 DEG F AC Layer Temperature on the Average Vertical Compressive Strain at Top of the Subgrade Layer for Section I (Thin)
...__ __________________________________ ----- -

Conversion Factors 1 psi = 6.9 kPa 1 in = 25.4 nm 1 mph = 1. 6 kph 1 lbf = 4.5 N
1800
1600
1400
z ~ 1200
fil
~ 1000 ~
800
600
400
"F => subtract 32 x 5/9 = ·c
-
-
-
5
104 DEG F
.l
, l 77 DEG F
WIDE BASE SINGIE (TRAILER AXLE)
104 DEG F
'
AXLE LOAD = 33 kips
r Dffi F
DUAL (DRIVE AXLE)
I I I I
10 15 20 25 30 35 40 45 50 55 SPEED (mph)
FIG. 21. Effect of AC Layer Temperature on 33 kips Dual (Tandem Drive Axle) and Wide Base Single (Tandem Trailer Axle) Tires Loading on the Average Vertical Compressive Strain at Top of the Subgrade Layer for Section I (Thin)
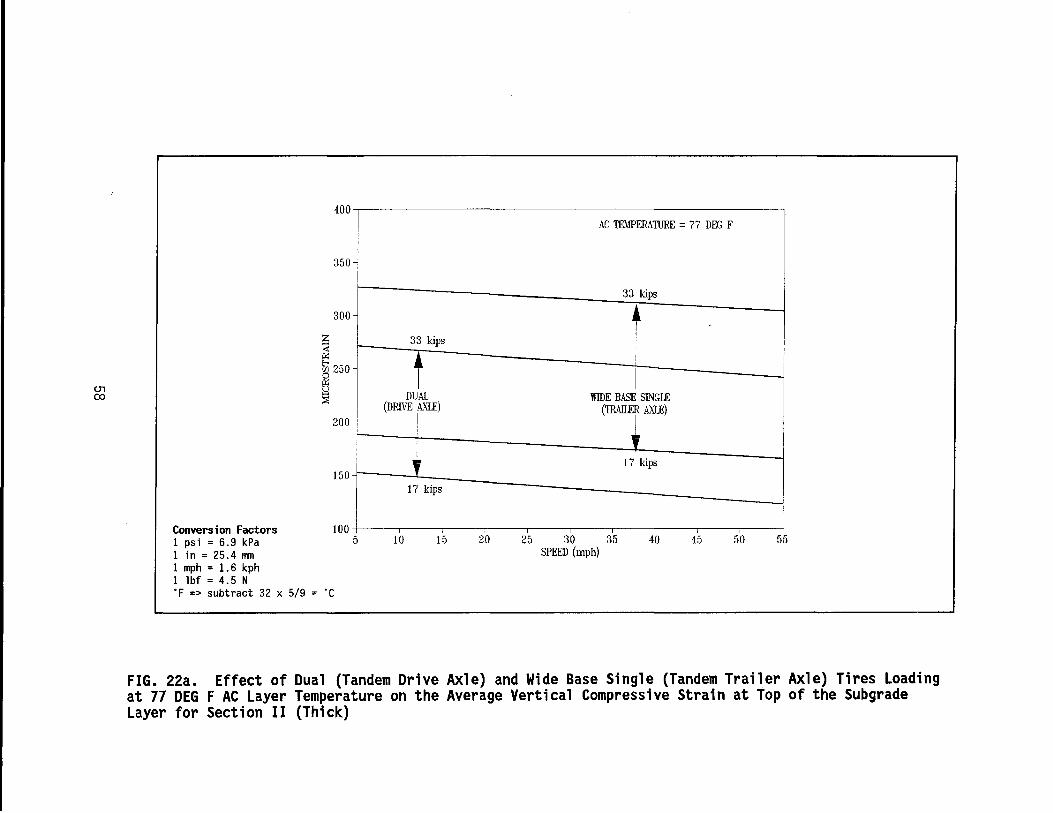
Ul co
400 AC TEMPERATIJRE = 77 DEG F
350 -
33 kips
300 - j~
- 33 kips
t DUAL WIDE BASE SINGLE
(DRIVE AXLE) (,Alli) 200
1 r 17 kips 150
17 kips
Conversion Factors 100 1 psi = 6.9 kPa 5 1 in = 25.4 11m
20 25 30 35 SPEED (mph)
40 50 55 10 15 45
1 mph = 1.6 kph 1 lbf = 4.5 N °F => subtract 32 x 5/9 = ·c
FIG. 22a. Effect of Dual (Tandem Drive Axle) and Wide Base Single (Tandem Trailer Axle) Tires Loading at 77 DEG F AC Layer Temperature on the Average Vertical Compressive Strain at Top of the Subgrade Layer for Section II (Thick)

(J1 l..D
400
-33 kips
~ 350
WIDE BASE SINGLE (IBAILER AXLE)
300 - 33 kips
z ~ • 0:: tii 250 0
DUAL - (DRIVE AXLE)
"' ~ '. 200 - 17 kips
ir
150 17 kips
-
AC TEMPERATURE = 104 DEG F
100 Conversion Factors 5 10 15 20 25 30 35 40 45 50 55
I
1 psi = 6.9 kPa SPEED (mph) 1 in = 25.4 11111
1 mph = 1.6 kph 1 lbf = 4.5 N "F => subtract 32 x 5/9 = ·c
FIG. 22b. Effect of Dual (Tandem Drive Axle) and Wide Base Single (Tandem Trailer Axle) Tires Loading at 104 DEG F AC Layer Temperature on the Average Vertical Compressive Strain at Top of the Subgrade Layer for Section II (Thick)

°' 0
Conversion Factors 1 psi = 6.9 kPa 1 in = 25.4 rrm 1 mph = 1. 6 kph 1 lbf = 4.5 N
400
350 -
300 -
z ~
§ 250 0::
~ 200
150
100 10
"F => subtract 32 x 5/9 = ·c
104DEGF
j, 77 DEG F
DUAL (DRIVE AXLE)
I I
15 20 25 30 35 SPEED (mph)
WIDE BASE SINGLE (TRAILER AXLE)
'104 DEG F
'r 77 DEG F
AXLE WAD = 33 kips
40 45 50 55
FIG. 23. Effect of AC Layer Temperature on 33 kips Dual (Tandem Drive Axle) and Wide Base Single (Tandem Trailer Axle) Tires Loading on the Average Vertical Compressive Strain at Top of the Subgrade Layer for Section II (Thick)

Section I (Thin) Subgrade Strain Data Evaluation Subgrade strain data evaluation of Section I (Thin) for the
conditions in Fig. 20a show that at a truck speed of 5 mph (8 kph) and 77 degree Fahrenheit (25°C) AC layer temperature, the subgrade strains were about 44% higher under wide base single tires (tandem trailer axle) compared to dual tires (tandem drive axle) at 33 kips tandem axle loading and about 53% higher at 17 kips tandem axle loading. However, with the increase in speed to 55 mph (88 kph) and under similar conditions, the subgrade strains were about 37% higher under wide base single tires compared to dual tires at 33 kips loading and about 41% higher at 17 kips tandem axle loading. At 77 degree Fahrenheit (25°C) AC layer temperature, for a speed increase from 5 to 55 mph (8 to 88 kph), the subgrade strains decreased by about 10% under wide base single tires and by about 5% under dual tires.
Fig. 20b shows strains at the top of the subgrade layer under dual and wide base single tires for an AC layer temperature of 104 degree Fahrenheit (40°C). At a truck speed of 5 mph (8 kph), the subgrade strains were about 48% and 60% higher under wide base single tires compared to dual tires at 33 kips and 17 kips tandem axle loading respectively. However, with the increase in speed to 55 mph (88 kph) and under similar conditions, the subgrade strains were about 42% higher under wide base single tires compared to dual tires at 33 kips loading and about 50% higher at 17 kips tandem axle loading. At 104 degree Fahrenheit (40°C) AC layer temperature, for a speed increase from 5 to 55 mph (8 to 88 kph), the subgrade strains decreased by about 9% under wide base single tires and by about 5% under dual tires. The strains in the subgrade caused by wide base single tires seem to be more sensitive to change in speed than those caused by dual tires.
The subgrade strains under dual and wide base single tires on tandem axles were influenced the most by the axle load. An increase in the tandem axle loading from 17 kips to 33 kips at a speed of 55 mph (88 kph) and constant AC layer temperature 77 degree Fahrenheit (25°C), as shown in Fig. 20a, resulted in about a 76% and 82% increase in the subgrade strains under wide base single and dual tires, respectively. Similarly, as shown in Fig. 20b, at 104 degree Fahrenheit (40°C) AC layer
61

temperature and similar conditions, the subgrade strains increased by about 65% and 74% under wide base single and dual tires, respectively. The strains in the subgrade caused by dual tires seem to be more sensitive to the change in axle loads than those caused by wide base single tires.
Fig. 21 illustrates the effect of AC layer temperature on vertical compressive strains at the top of the subgrade layer. At a truck speed of 55 mph (88 kph) and 33 kips tandem axle load, an increase in AC temperature from 77 to 104 degree Fahrenheit (25°C to 40°C) caused an increase in subgrade strain of about 9% under wide base single tires and about 5% under dual tires. The strains in the subgrade caused by wide base single tires seem to be more sensitive to the change in AC layer temperature than those caused by dual tires.
Section II (Thick) Subgrade Strain Data Evaluation Evaluation of subgrade strain data for Section II {Thick) for the
conditions in Fig. 22a show that at a truck speed of 5 mph (8 kph) and 77 degree Fahrenheit (25°C) AC layer temperature, the subgrade strains were about 20% higher under wide base single tires compared to dual tires at 33 kips tandem axle loading, and about 23% higher at 17 kips tandem axle loading. However, with an increase in speed to 55 mph (88 kph) and under similar conditions, the subgrade strains were about 26% higher under wide base single tires compared to dual tires at 33 kips loading, and about 35% higher at 17 kips tandem axle loading. At 77 degree Fahrenheit (25°C) AC layer temperature, for a speed increase from 5 to 55 mph (8 to 88 kph), the subgrade strains decreased by about 7% under wide base single tires and by about 11% under dual tires.
Fig. 22b shows that at a truck speed of 5 mph (8 kph) and 104 degree Fahrenheit (40°C) AC layer temperature, the subgrade strains were about 24% higher under wide base single tires compared to dual tires at 33 kips tandem axle loading, and about 29% higher at 17 kips tandem axle loading. However, with the increase in speed to 55 mph (88 kph) and under similar conditions, the subgrade strains were about 29% higher under wide base single tires compared to dual tires at 33 kips loading, and about 40% higher at 17 kips tandem axle loading. At 104 degree Fahrenheit {40°C)
62

AC layer temperature, for a speed increase from 5 to 55 mph (8 to 88 kph), the subgrade strains decreased by about 6% under wide base single tires and by about 10% under dual tires. The subgrade strains caused by dual tires seem to be more sensitive to the change in speed than those caused by wide base single tires.
The subgrade strains under dual and wide base single tires on tandem axles were influenced to the greatest extent by the axle load. An increase in the tandem axle loading from 17 kips to 33 kips at a speed of 55 mph (88 kph) at a constant AC layer temperature (77 degree Fahrenheit (25°C)), as shown in Fig. 22a, resulted in about 83% and 97% increase in the subgrade strain under wide base single and dual tires, respectively. Similarly, as shown in Fig. 22b, at 104 degree Fahrenheit (40°C) AC layer temperature and similar conditions, the subgrade strains increased by about 68% and 82% under wide base single and dual tires, respectively. The strains caused by dual tires seem to be more sensitive to the change in axle loads than those caused by wide base single tires.
Fig. 23 shows the effect of AC layer temperature on vertical compressive strains at the top of the subgrade layer for Section II {Thick). At a speed of 55 mph (88 kph) and 33 kips tandem axle load, an increase in AC temperature from 77 to 104 degree Fahrenheit (40°C) produced an increase in strain of about 12% under wide base single tires and about 9% under dual tires. The strain caused by wide base single tires seem to be more sensitive to the change in AC layer temperature than that caused by dual tires.
Pavement performance predictions in terms of rutting have been made for dual (tandem drive axle) and wide base single tires (tandem trailer axle). The rutting prediction model for flexible pavements developed by Santucci (1977) was used (equation 2.2). This model is:
w18 - 1.03 x 10¹⁸ ( 2. )4.48
EC
where: W18 = number of weighted 18 kip axle load prior to an excessive rut
depth (0.5 inch); and
63

E0 = vertical compressive strain at the top of the subgrade, in microstrain.
The model predicts the number of equivalent single axle load (ESAL) repetitions prior to 0.5 inch (12.7 mm) of pavement surface rutting. The predicted ESAL repetitions are summarized in Akram (1993) and shown in Figs. 24a through 27.
Sect;on I (Th;n) Performance Evaluat;on The remaining life analyses for Section I (Thin) show that dual
tires on tandem axles result in longer pavement life compared to wide base single tires on tandem axles. The performance evaluation shows that the remaining pavement life decreases with an increase in axle load and asphalt concrete layer temperature. The remaining pavement life increases with an increase in vehicle speed. Under similar test conditions, the remaining pavement life was found to be higher under dual tires compared to wide base single tires.
The performance analyses for Section I (Thin), as shown in Fig. 24a, illustrates the effect of axle loading and speed at 77 degree Fahrenheit (25°C) AC layer temperature. For 33 kips tandem axle loading, the pavement life was computed to be about 414% and 311% higher under the dual tires compared to wide base single tires for truck speeds of 5 and 55 mph (8 and 88 kph), respectively. However, by reducing the tandem axle load to 17 kips, the pavement life was computed to be about 571% and 368% higher under the dual tires compared to wide base single tires for truck speeds of 5 and 55 mph (8 and 88 kph) respectively.
Fig. 24b illustrates the effect of axle loading and speed at 104 degree Fahrenheit (40°C) AC layer temperature. For 33 kips tandem axle loading, the pavement life was computed to be about 482% and 377% higher under the dual tires compared to wide base single tires for truck speeds of 5 and 55 mph (8 and 88 kph) respectively.
The pavement performance under dual and wide base single tires on tandem axles was influenced to the greatest extent by the axle load. An increase in the tandem axle loading from 17 kips to 33 kips at a speed of 55 mph (88 kph) and 77 degree Fahrenheit (25°C) AC temperature, as shown
64

AC TEMPERATURE = 77 DEG F
400
Conversion Factors 1 psi = 6.9 kPa 1 in = 25.4 nm 1 mph = 1.6 kph 1 lbf = 4.5 N "F => subtract 32 x 5/9 = ·c
DUAL (DRIVE AXLE)
mDE BASE SINGLE (TRAILER AXLE)
33 ki s o-l====;====;::==:::::::;=::::=::::::;:::::==:::::;=====:::==~============::::J
5 10 15 20 25 30 35 40 45 50 55 SPEED (mph)
FIG. 24a. Allowable Number of Repetitions Under Dual (Tandem Drive Axle) and Wide Base Single (Tandem Trailer Axle) Tires Loading at 77 DEG F AC Layer Temperature for Section I (Thin)

Conversion Factors 1 psi = 6.9 kPa 1 in = 25.4 nm 1 mph = 1. 6 kph 1 lbf = 4.5 N
450
400 [fJ
z 9 350 t: E-< Iii Cl, 300 Iii ~
""" µ, [fJ
0 ] 250 ~ ro Iii ~ ~ ] 200 ;::i E-< z '--' ~ 150
~ 100 s ~
50
WIDE BASE SINGLE (TRAILER A.XIE)
17 kips
AC TEMPERATURE = 104 DEG F
DUAL (DRIVE A.XIE)
33 ki s 33 ki s o-:_t====r=========r=!:=~~:::::r====i===:::r===::;=======::::!
5 10 15 20 25 30 35 40 45 50 55 SPEED (mph)
"F => subtract 32 x 5/9 = ·c
FIG. 24b. Allowable Number of Repetitions Under Dual (Tandem Drive Axle) and Wide Base Single (Tandem Trailer Axle) Tires Loading at 104 DEG F AC Layer Temperature for Section I (Thin)

Conversion Factors 1 psi = 6.9 kPa 1 in = 25.4 l1ll1
1 mph = 1.6 kph 1 lbf = 4.5 N
35
0
·F => subtract 32 x 5/9 = ·c
-
-
5
AXLE LOAD = 33 kips
WIDE BASE SINGLE (TRAILER AXLE)
I• 77 DEG F
104 DEG F
I I I
10 15 20
77 DEG F --
.~
-, l 104 DEG F
DUAL (DRIVE AXLE)
'- I I I I I
2~ 30 35 50 55 40 45 SPEED (mph)
FIG. 25. Effect of AC Layer Temperature on Allowable Number of Repetitions Under Dual {Tandem Drive Axle) and Wide Base Single {Tandem Trailer Axle) Tires 33 kips Tandem Axle Loading for Section I {Thin)

Conversion Factors 1 psi = 6.9 kPa 1 in = 25.4 ITl1l 1 mph = 1.6 kph 1 lbf = 4.5 N
450
400
350
300 r.. ~ 0 ~ a:< 0 r.l ;:J 250 III :=l ::?l6 ~ 200
~ ~ 150
DUAL (DRIVE AXIE)
AC TEMPERATURE= 77 DEG F
WIDE BASE SINGIE (IBA1IER AXIE)
,.. 17kips
~ 100LJ------ll
50
10 15 20 25 30 35 SPEED (mph)
33 kips
40 45 50 55
·F => subtract 32 x 5/9 = ·c
FIG. 26a. Allowable Number of Repetitions Under Dual (Tandem Drive Axle) and Wide Base Single (Tandem Trailer Axle) Tires Loading at 77 DEG F AC Layer Temperature for Section II (Thick)

------- --------------------------------
500~-----------------------~
Conversion Factors 1 psi = 6.9 kPa 1 in = 25.4 mn 1 mph = 1.6 kph 1 lbf = 4.5 N
450
400
350
300 ... ~ 0 ~
~ ~ 250 p:i::: ~ ~ ~ ~ 200
~ 150
~ 100-<---
10
"F => subtract 32 x 5/9 = ·c
DUAL (DRIVE AXLE)
15 20
AC TEMPERATURE = 104 DEG F
WIDE BASE SINGLE (TRAILER AXLE)
17 kips
25 30 35 40 45 SPEED (mph)
50 55
FIG. 26b. Allowable Number of Repetitions Under Dual (Tandem Drive Axle) and Wide Base Single (Tandem Trailer Axle) Tires Loading at 104 DEG F AC Layer Temperature for Section II (Thick)

-......J 0
20 DUAL (DRIVE AXLE)
AXLE WAD = 33 kips
WIDE BASE SINGLE (TRAUER AXLE)
77 DEG F
Conversion Factors 1 psi = 6.9 kPa
o-+-~~~~~~~~~~~~~~~~~~~~~~--1
5 10 15 20 25 30 35 40 45 50 55 SPEED (mph)
1 in = 25.4 rrm 1 mph = 1. 6 kph 1 lbf = 4.5 N "F => subtract 32 x 5/9 = ·c
FIG. 27. Effect of AC Layer Temperature on Allowable Number of Repetitions Under Dual (Tandem Drive Axle) and Wide Base Single (Tandem Trailer Axle) Tires 33 kips Tandem Axle Loading for Section II (Thick)

in Fig. 24a, decreased the ESAL repetitions to failure under dual tires by about 93%, and under wide base single tires by about 92%.
Fig. 25 illustrates the effect of a decrease in AC layer temperature from 104 to 77 degree Fahrenheit {25°C) on the remaining pavement remaining life under dual and wide base single tires. At 33 kips tandem axle loading and 55 mph speed {88 kph}, the remaining pavement life increased by about 27% and 47% under the dual and wide base single tires loadings, respectively.
Section II {Thick) Performance Evaluation The performance analyses for Section II {Thick}, as shown in Fig.
26a, illustrate the effect of axle loading and speed at 77 degree Fahrenheit {25°C) AC layer temperature. For 33 kips tandem axle loading, the remaining pavement life was computed to be about 128% and 180% higher under the dual tires compared to wide base single tires for truck speeds of 5 and 55 mph {8 and 88 kph}, respectively.
Fig. 26b illustrates the effect of axle loading and speed at 104 degree Fahrenheit {40°C) AC layer temperature. For 33 kips tandem axle loading the pavement life was computed to be about 160% and 216% higher under the dual tires compared to wide base single tires for truck speeds of 5 and 55 mph {8 and 88 kph), respectively.
The pavement performance under dual and wide base single tires on tandem axles was influenced to the greatest degree by the axle load. An increase in the tandem axle loading from 17 kips to 33 kips at a speed of 55 mph {88 kph) and 77 degree Fahrenheit (25°C) AC temperature, as shown in Fig. 46a, decreased the ESAL repetitions to failure under dual tires by about 95%, and under wide base single tires by about 93%.
Fig. 27 illustrates the effect of a decrease in the AC layer temperature from 104 to 77 degree Fahrenheit (25°C) on the remaining pavement life under dual and wide base single tires. At 33 kips tandem axle loading and 55 mph (88 kph) truck speed, the remaining pavement life increased by about 50% and 66% under the dual and wide base single tires, respectively.
71

CONCLUSION The effects of tire type, axle load, speed, tire inflation pressure,
and AC layer temperature on the thick and thin flexible pavements' performance were evaluated by measuring the vertical compressive strains at the top of the subgrade layer. Regression models were developed to predict the relationships between subgrade strains and independent variables for the two tire types. The subgrade strains predicted by the regression equations were used to predict pavement performance under dual and wide base single tires using a subgrade strain prediction model.
Five trends were evident from the data: • the maximum response under wide base single tires was found
under the tire centerline and maximum response under dual tires was found under either of the tires;
• the range of tire inflation pressures used in our study was found to have no significant effect on the subgrade strain;
• the subgrade strain decreased as the speed increased; • the subgrade strain increased with the increase in axle load
and AC layer temperature; and • under similar conditions, the subgrade strain was always
greater under wide base single tires than dual tires, whether fitted to tandem drive axles or tandem trailer axles.
Under similar test conditions, wide base single tires were found to be more damaging than dual tires on both the test sections. Higher axle loads were found to be more damaging on Section I (Thin) compared to Section II (Thick). The combination of wide base single tires with high AC temperature, high wheel load, creep speed, and thin pavements was found to be extremely damaging.
The performance evaluation showed longer pavement life under dual tires than wide base single tires under similar test conditions on both Section I (Thin) and Section II (Thick). At 33 kips tandem axle loading, 77 degree Fahrenheit (25°C) AC layer temperature, and 55 mph (88 kph) truck speed, the wide base single tires (tandem trailer axle) were found to be 4.12 and 2.8 times more damaging than dual tires (tandem drive axle) on Section I (Thin) and Section II (Thick), respectively. Table 5 tabulates predicted damage factor ratios of wide base single tires versus dual tires.
72

-....! w
Table 5.
Section
I (Thin)
I
I
I
Predicted Damage Factor Ratio of Wide Base Single Tires (33 kips Tandem Trailer Axle) Versus Dual Tires (33 kips Tandem Drive Axle) in Terms of Compressive Strains at Top of the Subgrade layer and Number of 18 kips ESAL Repetitions for Section I (Thin) and Section II (Thick)
Operating Variables Damage Factor Ratio Wide Base Single Versus Dual Tires
AC Layer Temperature Speed Subgrade Strain ESAL Repetitions (DEG F) (mph)
77 5 1.44 5.14
77 55 1.37 4.12
104 5 1.48 5.82
104 55 1.42 4.77
II (Thick) 77 5 1.20 2.28
II
II
II
77
104
104
Conversion Factors 1 psi = 6.9 kPa 1 in = 25.4 nm 1 mph = 1.6 kph 1 lbf = 4.5 N °F => subtract 32 x 5/9 = ·c
55 1.26 2.80
5 1.23 2.59
55 1.29 3.16


CHAPTER V EVALUATION OF THE EFFECTS OF TRUCK TIRE TYPE ON FATIGUE
CRACKING IN FLEXIBLE PAVEMENTS
This chapter describes the analysis of depth deflections measured at MDD I, which is the sensor at the bottom of the asphaltic concrete layer, under truck loadings. The deflections were measured under dual and wide base single tire loads for different test conditions. The shape of the measured deflection bowl was used to obtain a surface curvature index {SCI}; this was related via regression analysis to the induced tensile strains at the bottom of the asphalt layer. Pavement performance predictions were made for dual and wide base single tire loadings based on expected damage due to fatigue cracking. For the purposes of this study, the SCI was defined as the maximum deflection directly under a given load minus the deflection measured at a distance of 1 foot {305 mm} from the center of the load. This chapter presents the influence of tire type, speed, axle load, asphaltic concrete layer temperature, and inflation pressure on the calculated fatigue life.
INTRODUCTION Higher deflections were measured under wide base single tires in
both drive and trailer axle positions under similar test conditions. Fig. 28 shows the plot of peak deflection versus offset distance measured at MDD 1. The zero position for the wide based tire is the center of the tire, and for the dual tire combination, a it is the mid-distance between the tires. The maximum deflection under a wide base single tire was measured under the tire centerline, while the maximum deflection under dual tires was measured under either of the two tires. The lateral shape of the deflection bowl under the two tire types shows that the deflection basin under wide base single tires is deeper, more concentrated, and a rapid decrease in deflection exists at the edge of the tire, while the deflection basin under dual tires is spread over a much wider area. This phenomenon indicates higher shear forces at the edge of the wide base single tires.
75

~ O'l
'° '°
I~
I-20
10 0
Conversion Factors 1 psi = 6.9 kPa 1 in = 25.4 nm 1 mph = 1.6 kph 1 lbf = 4.5 N
•
"F => subtract 32 x 5/9 = ·c
SEC'l'ION I (DUN)
12 OFFSE1' fJ.a.)
SECTIONII (THICK)
30 AULMI ~- 99 W,.
Wkle ... D,.- ....... a-.. 1'CI pal .,
I :v.w. D- ln&daD. .._.. • 120 pli
r " 0
16 Ol'R9B'l' (lacbM)
FIG. 28. Peak Deflections Under Dual and Wide Base Single Tires Measured by MDD 1

Tensile strains at the bottom of asphaltic concrete layers are not measured by the MOD; but, one can estimate them by analyzing the curvature of the deflection about the maximum deflection. According to theoretical analysis of pavement response, SCI is inversely proportional to the radius of curvature and is, therefore, a measure of tensile strains in the pavement (Majidzadeh 1982). In nondestructive testing of pavements, the SCI (Peterson et al. 1972) has been related to tensile strain at the bottom of the asphaltic concrete layer. Molenaar (1983) and Scullion (1988c) have developed relationships between SCI and tensile strain.
To evaluate the relative influence of tire type, speed, axle load, asphaltic concrete layer temperature, and inflation pressure on fatigue cracking for the thin and thick asphaltic concrete pavements, depth deflection data were collected at MOD 1 on Section I (Thin) and II (Thick) under test vehicle loadings. The measured deflection data on the two test sections were converted into SCI and, subsequently, into tensile strains. The expected number of test vehicle passes to failures was then calculated.
DETERMINATION AND ANALYSIS OF SCI FROM MEASURED DEFLECTIONS In the analysis, deflections under the tandem axle loading of dual
and wide base single tires were used. Typical longitudinal deflection responses of the moving dual and wide base single tires on tandem axles are shown in Fig. 29. The time axis is replaced by the displacement axis calculated from the travel speed. As shown in Fig. 30, the SCI is defined as the difference between the maximum deflection (A0 ) and the deflection measured when the load is 12 inches (305 mm) from the MOD (A, 2) ;
(5.1)
For the axle configuration of the test vehicle, the maximum SCI values were found under the front wheel of the tandem axle group. The probable explanation for this behavior can be given by the stress history sensitivity of the supporting layers and the test vehicle configuration
77
~
40
35
,30 ;;~
I: 10
6
0 -100 -8() -8() 40 -20 0 20 ~ 80 8() 100
WNGmlllNAL DJSl'ANCE (inch)
FIG. 29. Typical Peak Longitudinal Deflection Profile Under Dual and Wide Base Single Tires on Tandem Axles
10
5
o+-~~--F--''--'---r~~~1--~~~--'.__~_,,___~----i
-30 -20 -10 0 10 20 30 IDl'lll'IUDINAL DJSl'ANCE (inch)
FIG. 30. Measurement of SCI Under Dual and Wide Base Single Tires
Conversion Factors 1 psi = 6.9 kPa 1 in = 25.4 nm 1 mph = 1. 6 kph 1 lbf = 4.5 N ·r => subtract 32 x 5/9 = ·c
78

(5 Axle) approaching the MOD location. As the vehicle moves near the MOD location, the deflection value recorded by the first sensor under the steering axle (single) increases steadily from its zero value. The deflection value is maximum when the axle is directly over the MOD. As the axle moves away from the MOD location, the deflection curve drops off steadily to its zero position. When the tandem drive axle approaches the MOD location, the loading shape of the deflection curve under the first axle is similar to the single axle. As the first axle of the tandem group moves away from the MOD location, the deflection starts to decrease. However, before the load of the first axle is completely removed from the first sensor and the deflection returns to zero, the load of the second axle starts to affect the deflection at the first sensor. The deflection starts to rise once again. By the time the second axle is directly over the MOD location, the peak deflection value under it carries the residual effect of the first axle loading and shows the impact of the stress history on deflection.
Multiple linear regression was performed on the measured data to examine the relationships between the dependent variable (Maximum SCI) and independent variables (offset, speed, axle load, average AC layer temperature, and inflation pressure) to determine their influence on the measured SCI values. The selected models were those which minimized the sum of the squares of the residuals for the fitted line. Details of the regression analysis and models developed are found in Akram 1992.
The relationships developed between the dependent (SCI) and independent variables (speed, inflation pressure, axle load, asphaltic concrete layer temperature, and lateral offset) for dual and wide base single tires on tandem axles for the two test sections are expressed as follows:
Section I {Thin) • Dual tires
SCI - 1.6116-(0.0086*Sp)+(0.0308*TP)+ (0.9005*1..d)+(0.0028*Pr)-t0.0596*(0ff-4)2)]
79
(R2 - 0.91) (5.2)

where: Sp Tp Ld Pr
= = = =
speed, in mph; average AC layer temperature, in degree Fahrenheit; one half tandem axle assembly load, in kip; tire inflation pressure, in psi; and
Off = offset distance from the middle of the dual tire assembly, or middle of the wide base single tire to the center of the MOD hole, in inches.
• Wide base single tires
SCI - -2.1785-(0.0370*Sp)+(0.1065*TP)+ (l.0660*Ld)+(0.0055*Pr)-[0.0732*(0ff)2
)]
Section II (Thick) • Dual tires
SCI - 0.7017-(0.0135*Sp)+(0.0042*TP)+ (0.3307*Ld)+(0.0001*Pr)-[0.0231*(0ff-3)2
)]
• Wide base single tires
SCI - -l.4140-(0.0261*Sp)+(0.0538*TP)+ (0.2888 *Ld)+(0.0016*Pr)-[0.0178 *(Off)2
)]
(R2 - 0.95) (5.3)
(R2 - 0.89) (5.4)
(R2 - 0.81) (5.5)
Figs. 3la through 32b plot the predicted SCI values under dual and wide base single tires for different conditions on both test sections. The SCI decreases with the increase in offset, and is larger under wide base single tires than dual tires on both test sections. The maximum value of SCI occurred under either of two front tires in the case of duals, and at the middle of the front wide base single tire for both test sections. Under similar test conditions, the SCI under wide base single tires always yielded higher values than the SCI values under dual tires on both the test sections. The SCI values were about 3.5 times greater on Section I (Thin) than Section II (Thick), an indication of overall pavement strength. The effect of tire inflation pressure on SCI was found to be slightly more significant on Section I (Thin) than on Section
80

II (Thick). It was found that the rate of change for the SCI due to offset was greater for wide base single tires than for the dual tires, as shown in Figs. 3la and 32a. The higher rate of change for the SCI under wide base single tires implies that the curvature of the deflection bowl is sharper under this type of tires, resulting in the load being spread over a smaller area. Similarly, as shown in Figs. 3lb and 32b, the decrease in the SCI with the increase in speed indicates that the radius of curvature would be smaller at slow speeds compared to high speeds and, correspondingly, the tensile strains at the bottom of the AC layer would be higher for slow speeds. Similar findings have been reported by other researchers, particularly Christison et al. (1980) and Scullion et al. (1990).
The statistical analysis of the measured data showed that axle load is the most significant factor affecting the SCI. Speed and tire inflation pressure were comparatively less significant than the asphalt concrete layer temperature and axle load. Both the asphalt concrete layer temperature and axle load are found to be more significant on Section I (Thin) compared to Section II (Thick).
PREDICTION OF TENSILE STRAINS AT THE BOTTOM OF ASPHALTIC CONCRETE LAYER Tensile strains at the bottom of the asphaltic concrete layer under
dual and wide base single tires were calculated using the SCI concept. The SCI have been related to tensile strains at the bottom of the asphaltic concrete layer by Molenaar (1983) and Scullion (1988c). They developed their relationships for the deflections measured under dual wheel and steering axle single wheel loadings, respectively.
To estimate the tensile strains at the bottom of the asphaltic concrete layer and deflections A0 and A12 at the MOD sensor 1 location under tandem axle loadings of dual and wide base single tires, the layered linear elastic theory was used. The BISAR (1978) computer program was used to calculate pavement responses for test Section I (Thin) and Section II (Thick).
81

25.0
22.5
E [fJ
;20.0 w Cl
~ 17.5
1150 u 12.5
~ 10.0
+ WIDE BASE SINGLE (TRAILER AXLE)
AXLE LOAD = 33 kips
/130 psi
100 psi 120 psi
/ / t BO psi
DUAL (DRIVE AXLE)
~ AC TEMPERATURE = 77 DEG F [fJ
7.5
Conversion Factors 5.0 5 1 psi = 6.9 kPa 1 in = 25.4 mn 1 mph = 1. 6 kph 1 lbf = 4.5 N
10
"F => subtract 32 x 5/9 = ·c
15 20 25 30 35 40 45 SPEED (mph)
50 55
FIG. 31a. Effect of Dual (Tandem Drive Axle) and Wtde Base Singl.e Tire (Tandem Trailer Axle) Loading on the Predicted SCI for Section I (Thin)
25.0-.---------------------------, 111DE BASE SINGLE
(TRAILER AXLE)
~ 22.5 1-----1
; 20.0 w Cl
~ 17.5
f,'.l
~ 15.0 r------u 12.5 w \:1 rx. 10.0 Ct: ;:i [fJ
7.5
SPEED = 55 mph AC TEMPERATURE = 77 DEG F INFlATION PRESSURE DUAL = 120 psi 111DE BASE SINGLE = 130 psi
Conversion Factors 5.o 0 1 psi = 6.9 kPa
2 3 4 5 6
1 in = 25.4 mn OFFSET (inch)
1 mph = 1.6 kph 1 lbf = 4.5 N "F => subtract 32 x 5/9 = ·c
DUAL (DRIVE AXLE)
7 8 9 10
FIG. 31b. Effect of Dual (Tandem Drive Axle) and Wide Base Single Tire (Tandem Trailer Axle) Speed on the Predicted SCI for Section I (Thin)
82

Conversion Factors O 0 1 psi = 6.9 kPa 1 in = 25.4 ITl11
1 mph = 1. 6 kph 1 lbf = 4.5 N
SPEED = 55 mph AC TEMPERATURE = 77 DEG F INFLATION PRESSURE DUAL = 120 psi 1\1DE BASE SINGLE = 130 psi
2 3 4 5 6 OFFSET (inch)
"F => subtract 32 x 5/9 = ·c
7 8 9 10
FIG. 32a. Effect of Dual {Tandem Drive Axle) and Wise Base Single Tire {Tandem Trailer Axle) Loading on the Predicted SCI for Section II (Thick)
a.o~--------------------~
M7.5
x w ~ 7.0
~ ;:i
~ 6.5
;:i u w 6.0
~ [fJ 5.5
Conversion Factors 5.o 5 1 psi = 6.9 kPa 1 in = 25.4 1T111
1 mph = 1. 6 kph 1 lbf = 4.5 N
AXLE WAD = 33 kips AC TEMPERATURE = 77 DEG F
10 15 20 25 30 35 SPEED (mph)
"F => subtract 32 x 5/9 = ·c
DUAL (DRIVE AXLE)
40 45 50 55
FIG. 32b. Effect of Dual (Tandem Drive Axle) and Wide Base Single Tire {Tandem Trailer Axle) Speed on the Predicted SCI for Section II {Thick)
83

Deflections were calculated under dual and wide base single tires on tandem axle for a factorial of conditions shown in Table 6. Simple linear regression equations were then developed between SCI and tensile strains at the bottom of the asphaltic concrete layer.
Table 6. Input Values Used in BISAR
AC Layer Base Layer Subgrade (ksi) (ksi) Layer (ksi)
150 20 8 200 30 10 300 40 400
Conversion Factors 1 psi = 6.9 kPa 1 in = 25.4 nm 1 mph = 1.6 kph 1 lbf = 4. 5 N "F => subtract 32 x 5/9 = ·c
Ti re Pressure Axle Load (psi) (kips)
Duals Wide Base Singles
80 100 33 120 130
The set of equations developed to relate SCI to the tensile strain at the bottom of the asphaltic concrete layers for the two test sections, along with their correlation coefficients is as follows:
Section I (Thin) • Dual tires low inflation pressure (80 psi (552 kPa))
Et - -146.92 + 25.59 SCI r 2 - 0.97 (5.6)
where:
kPa))
ft tensile strain at the bottom of asphaltic layer, in µstrain;
and SCI = difference between the peak deflection underneath the load
and deflection 12 inches (305 mm) preceding the maximum, in inches.
• Dual tires high inflation pressure (120 psi (828 kPa))
Et = -132.22 + 29 .88 SCI r 2 = 0.96 ( 5. 7)
• Wide base single tires low inflation pressure (100 psi (690
84

et - -174.88 + 27.44 SCI r 2 - 0.88 (5.8)
• Wide base single tires high inflation pressure (130 psi (897 kPa))
et - -152.9 + 31.02 SCI r 2 - 0.93 (5.9)
Section II (Thick) • Dual tires low inflation pressure (80 psi (552 kPa))
et - -20.36 + 36.73 SCI r 2 - 0.94 (5.10)
• Dual tires high inflation pressure (120 psi (828 kPa))
et - -23.69 + 39.74 SCI r 2 - 0.96 (5.11)
• Wide base single tires low inflation pressure (100 psi (690 kPa))
et - -45.54 + 57.95 SCI r 2 - 0.98 (5.12)
• Wide base single tires high inflation pressure (130 psi)
et - -54.99 + 61.96 SCI r 2 - 0.98 (5.13)
Equations 5.6 through 5.13 were used to calculate tensile strains at the bottom of the asphaltic concrete layer for speeds between 5 and 55 mph (8 and 88 kph). Figs. 33 through 40 show plots demonstrating the effect of different test variables on the predicted tensile strains at the bottom of the asphaltic concrete layer for both test sections. The response evaluation shows that the tensile strains increase with an increase in axle load, tire inflation pressure, and asphalt concrete layer temperature. They decrease with the increase in vehicle speed. Higher tire inflation pressures and higher axle loads were found to be more detrimental on the thin pavement section compared to the thick section. Under similar test conditions, the tensile strains were found
85
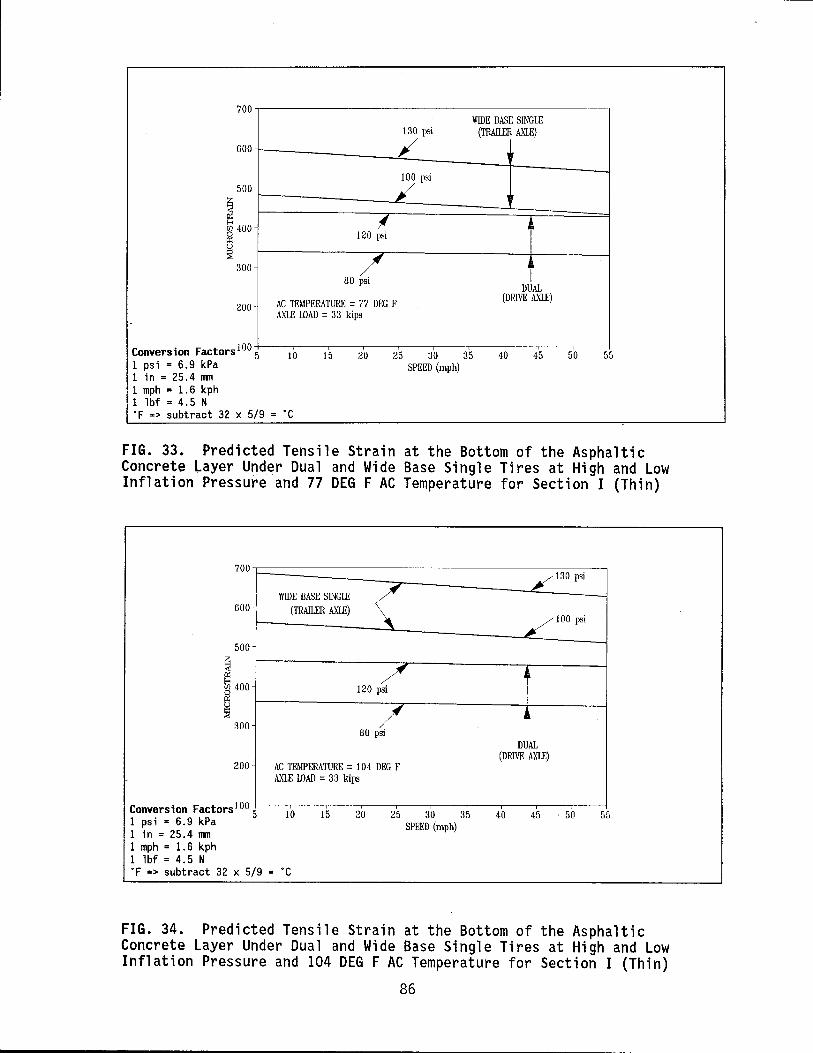
700
600
500
~ ~ 400 ~ ~
300
I 120 psi
/ 80 psi
WIDE BASE SINGIB 130 psi (TRAIIBR AXLE)
/ 1
100 psi
/ '
j
h
DUAL
AC TEMPERATURE = 77 DEG F (DRIVE AXIE)
200
Conversion Factors1005
1 psi = 6.9 kPa 1 in = 25.4 rrm 1 mph = 1. 6 kph 1 lbf = 4.5 N
AXLE IDAD = 3 3 kips
10 15 20
°F => subtract 32 x 5/9 = ·c
25 30 35 40 45 SPEED (mph)
50 55
FIG. 33. Predicted Tensile Strain at the Bottom of the Asphaltic Concrete Layer Under Dual and Wide Base Single Tires at High and Low Inflation Pressure and 77 DEG F AC Temperature for Section I {Thin)
700~~~~~~~~~~~~~~~~~~~~-----,
130 psi
600
500
~ ~ 400 ~ ~
300
l\1DE BASE SINGIB (TRAIIBR AXLE)
120 psi
80 psi
200 AC TEMPERATURE = 104 DEG F AXLE IDAD = 3 3 kips
Conversion Factors100 5 1 psi = 6.9 kPa
10 15 20 25 30 35
1 in = 25.4 rrm SPEED (mph)
1 mph = 1.6 kph 1 lbf = 4.5 N ·F => subtract 32 x 5/9 = ·c
DUAL (DRIVE AXIB)
100 psi
40 45 . 50 55
FIG. 34. Predicted Tensile Strain at the Bottom of the Asphaltic Concrete Layer Under Dual and Wide Base Single Tires at High and Low Inflation Pressure and 104 DEG F AC Temperature for Section I {Thin)
86

700
600
500
~ ~ 400 g ~
300
200
Conversion Factors 1005
1 psi = 6.9 kPa 1 in = 25.4 mn 1 mph = 1. 6 kph 1 lbf = 4.5 N
111DE BASE SINGLE (TRAILER AXLE)
J33 kips
, 17 kips
10 15
"F => subtract 32 x 5/9 = ·c
INFLATION PRESSURE DUAL= 120 psi \\1DE BASE SINGLE = 130 rtsi AC TEMPERATURE = 77 D G F
DUAL (DRIVE AXLE)
';33 kios
'"17 kips
20 25 30 35 40 45 50 55 SPEED (mph)
FIG. 35. Predicted Tensile Strain at the Bottom of the AC Layer Under Dual and Wide Base Single Tires at High Inflation Pressure, Different Axle Loadings, and 77 DEG F AC Temperature for Section l (Thin)
700
600
500
~ ~ 400
~ 300
200
Conversion Factors100 5 1 psi = 6.9 kPa 1 in = 25.4 mn 1 mph = 1. 6 kph 1 lbf = 4.5 N
INFLATION PRESSURE DUAL= 120 Nsi 1\1DE BASE SI GLE = 130 psi AC TEMPERATURE = 104 DEG F
33 kips
• I DUAL
(DRIVE. AXLE)
17 kips
10 15 20 25 30 35 SPEED (mph)
"F => subtract 32 x 5/9 = ·c
33 kips
t 1\1DE BASE SINGLE
(TRAILE AXLE)
Ir
17 kips
40 45 50 55
FIG. 36. Predicted Tensile Strain at the Bottom of AC Layer Under Dual and Wide Base Single .Tires at High Inflation Pressure, Different Axle Loadings, and 104 DEG F AC Temperature for Section I (Thin)
87

550~----------------------,
500
450
~ 400
~ 350
~ S1 300
250
AC TEMPERATURE = 77 DEG F AXLE WAD = 33 kips
130 psi
I
l\1DE BASE SINGIB (TRAIIBR AXLE)
200 r-------:r--=====t====:j Conversion Factors 150
5 1 psi = 6.9 kPa 1 in = 25.4 rrm 1 mph = 1.6 kph 1 lbf = 4.5 N
10
"F => subtract 32 x 5/9 = ·c
FIG. 37. Predicted Tensile Strain at the Bottom of the Asphaltic Concrete Layer Under Dual and Wide Base Single Tires at High and Low Inflation Pressure and 77 DEG F AC Temp~rat~r~ fbr Section II (Thick)
550~-------------------~
5001------
450
~ 400
~ 350 ~ u S1 300
250
AC TEMPERATURE= 104 DEG F AXLE WAD = 33 kips
120 psi
• 200 •
80 psi
130 psi WIDE BASE SINGIB
(TRAIIBR AXLE)
DUAL (DRIVE AXLE)
Conversion Factors 150+--~-~-~-~-~-~-~-~-~--1 1 psi = 6. 9 kPa 5 10
1 in = 25.4 rrm 15 20 25 30 35
SPEED (mph) 40 45 50 55
1 mph = 1.6 kph 1 lbf = 4.5 N "F => subtract 32 x 5/9 = ·c
FIG. 38. Predicted Tensile Strain at the Bottom of Asphaltic Concrete Layer Under Dual and Wide Base Single Tires at High and Low Inflation Pressure and 104 DEG F AC Temperature for Section II (Thick)
88

---
550
500
450 L
400
~ 350
~ 300 0 Q:;
~ 250
200
150
100
Conversion Factors 505 1 psi = 6.9 kPa
1 in = 25.4 nm 1 mph = 1.6 kph 1 lbf = 4.5 N
111DE BASE SINGIE (TRAllER AXLE)
'
' DUAL /
(DRIVE AXLE)""-
10 15
"F => subtract 32 x 5/9 = ·c
20
INFIATION PRESSURE DUAL = 120 psi 1\lDE BASE SINGIE = 130 psi AC TEMPERATURE = 77 DEG F
~ -33 kips
17 kips ~
' -33 1.ips
' 17 1.ips
25 30 35 40 45 50 55 SPEED (mph)
FIG. 39. Predicted Tensile Strain at the Bottom of the AC Layer Under Dual and Wide Base Single Tires at High Inflation Pressure Different Axle Loading and 77 DEG F AC Temperature for Section II (Thick)
500-r----
450 INFLATION~P~R~ES;SUR;E;----------400
150
DUAL = 120 psi 1\lDE BASE SINGIE = 130 psi AC TEMPERATURE= 104 DEG F
33 kips
DUAL (DRIVE AXLE)
100 17 kips
Conversion Factors 50 5
1 psi = 6.9 kPa 10 15 20 25 30 35
1 in = 25.4 nm SPEED (mph)
1 mph = 1.6 kph 1 lbf = 4.5 N "F => subtract 32 x 5/9 = ·c
111DE BASE SINGIE (TRAIIER AA'LE)
17 kips
40 45 50 55
FIG. 40. Predicted Tensile Strain at the bottom of the AC Layer Under Dual and Wide Base Single Tires at High Inflation Pressure, Different Axle Loadings, and 104 DEG F AC Temperature for Section II (Thick)
89

-to be-higher under wide base-single tires--than dual tires on both-testsections.
Tensile strain data evaluation of Section I (Thin) shows that at a truck speed of 55 mph (88 kph), 33 kip tandem axle loading, and 77 degree Fahrenheit (25°) asphalt concrete layer temperature, the tensile strains were computed to be about 26% higher under wide base single tires compared to dual tires at high tire inflation pressure, and about 31% higher at low tire inflation pressure. However, with an increase of asphalt concrete layer temperature to 104 degree Fahrenheit (40°C) and under similar test conditions, the tensile strains were computed to be about 39% higher under wide base single tires compared to dual tires at high tire inflation pressure, and about 46% higher at low tire inflation pressure.
Tensile strain data analyses of Section II (Thick) shows that at a truck speed of 55 mph (88 kph), 33 kip tandem axle loading, and 77 degree Fahrenheit (25°) asphalt concrete layer temperature, the tensile strains were computed to be about 62% higher under the wide base single tires compared to dual tires at high tire inflation pressure, and about 65% higher at low tire inflation pressure. However, with the increase of asphalt concrete layer temperature to 104 degree Fahrenheit (40°C) and under similar test conditions, the tensile strains were computed to be about 102% higher under the wide base single tires compared to dual tires at high tire inflation pressure, and about 104% higher at low tire inflation pressure.
Similar trends were reported by Roberts et al. (1985), when predicting theoretically calculated tensile strains for 75 and 125 psi (517 and 862 kPa) inflation pressures. Marshek et al. (1985) had also theoretically found that effects of increased inflation pressure are greatest for surface thickness less than 2 inches (50 mm). They calculated that for pavements having a 2 inch thick asphalt concrete surface layer, a 47% increase in the tire inflation pressure yields in a 33% increase in tensile strains at the bottom of the asphaltic concrete surface.
90

PAVEMENT PERFORMANCE EVALUATION- ----- -
Pavement performance predictions were made for dual and wide base single tires on tandem axles based on damage due to fatigue cracking. For predicting pavement performance, the distress prediction model for fatigue cracking developed by Finn et al. (1977) was used. The model predicts the number of equivalent single axle load (ESAL) repetitions to cause fatigue cracking equal to or less than 10% of the wheel path area (equation 2.6):
et smix log10 Nf - 15.947 - 3.291 log10(-) - 0.854 log10(-)
10-6 103 (5.14)
where: Nt the number of 18 Kip ESAL to predict up to 10% cracking in
the wheel path area; et = tensile strain repeatedly applied, in µstrain; and
smix asphalt i c concrete stiffness' in psi. The asphalt concrete layer stiffness values used in the Finn
equation (Finn et al. 1977) were obtained from the backcalculation procedures. Asphalt concrete stiffness values of 293,000 psi (2.0 MPa) and 135,000 psi (0.93 MPa) were used for Section I (Thin) and Section II {Thick), respectively. The predicted tensile strain values for speeds from 5 to 55 mph (8 to 88 kph) were converted into allowable ESAL repetitions. Figs. 41 through 50 illustrate the effects of speed, tire inflation pressure, axle load, asphaltic concrete layer temperature, and tire type on allowable ESAL repetitions for Section I {Thin) and Section II {Thick).
Remaining life analyses show that dual tires result in longer pavement life in terms of fatigue cracking compared to wide base single tires on both sections. The performance evaluation shows that the rema1n1ng pavement life decreases with an increase in axle load, tire inflation pressure, and asphalt concrete layer temperature. The remaining pavement life increases with an increase in vehicle speed. Under similar test conditions, the remaining pavement life was found to
91

. 400.
~ 350
80 psi
/ ~ 300
°" [,)
p:; ~250 ~ ~
AC TEMPERATURE = 77 DEG F
~ ~ 200
AXLE LOAD = 33 kips
~ f 150 ~ ~ 100
Z~ 50
Conversion Factors o 5 10 1 psi = 6.9 kPa 1 in = 25.4 nm 1 mph = 1.6 kph 1 lbf = 4.5 N "F => subtract 32 x 5/9 = ·c
15 20
120 psi
/
100 psi
' 130 psi
25 30 35 SPEED (mph)
Ji
DUAL (DRIVE AXLE)
'f
l
Ji
\\1DE BASE SINGLE (TRAILER AXLE)
40 45 50 55
FIG. 41. Effect of Inflation Pressure and 33 kips Axle Loading at 77 DEG F AC Temperature on Allowable Number of Passes Under Dual and Wide Base Single Tires on Section I (Thin)
400 AC TEMPERATURE= 104 DEG F
~ 350
~ 300
&l p:; ~250 ~ ~
~ ~ 200
~ f 150 ~ 0
~ 100
Z~ 50
Conversion Factors 05 1 psi = 6.9 kPa 1 in = 25.4 nm 1 mph = 1.6 kph 1 lbf = 4.5 N
AXLE LOAD = 33 kips
l\1DE BASE SINGLE (TRAILER AXLE)
, ' , J
10 15 20
"F => subtract 32 x 5/9 = ·c
80 psi
JI/ ~
DUAL (DRIVE AXLE)
120 psi ~ I
100 psi
~130psi 25 30 35 40 45
SPEED (mph) 50 55
FIG. 42. Effect of Inflation Pressure and 33 kips Axle Loading at 104 DEG F AC Temperature on Allowable Number of Passes Under Dual and Wide Base Single Tires on Section I (Thin)
92

Conversion Factors 1 psi = 6.9 kPa 1 in = 25.4 rrm 1 mph = 1. 6 kph 1 lbf = 4.5 N
6.0,------------------------,
~ 5.0
I : 4.0
~ <ii'
~ 2 3.0
~~
AC TEMPERATURE = 77 DEG F AXLE !DAD = 17 kips
111DE BASE SINGLE (TRAILER AXLE)
80 psi
130 psi/ 0.0 +--.---,----,---,----,---'-----.----,---.-----,-----1
5 10 15 20 25 30 35 40 45 50 55 SPEED (mph)
·r => subtract 32 x 5/9 = ·c
FIG. 43. Effect of Inflation Pressure and 17 kips Axle Loading at 17 DEG F AC Temperature on Allowable_Number of Passes Under Dual and Wide Base Single Tires on Section I (Thin)
6.0
~ 0 5.0
~ ~ 4.0
~ <ii' ~ § ~ ;.::: 3.0
~~ 2.0
1.0
Conversion Factors 0.0 5 1 psi = 6.9 kPa
1 in = 25.4 rrm 1 mph = 1. 6 kph 1 lbf = 4.5 N
AC TEMPERATURE = 104 DEG F AXLE !DAD = 1 7 kips
DUAL (DRIVE AXLE) BOp~
u
120 psi ,. ~ 130 psi'- 100 psi ...
10 15 20 25 30 35 SPEED (mph)
·r => subtract 32 x 5/9 = ·c
WIDE BASE SINGLE (TRAILER AXLE)
...... ',
40 45 50 55
FIG. 44. Effect of Inflation Pressure and 17 kips Axle Loading at 104 DEG F AC Temperature on Allowable Number of Passes Under Dual and Wide Base Single Tires on Section I (Thin)
93

1.4
1.2
1.0 [:l 00'
~ ~ 0.8
~! 0.6
[.<, 0
~ 0.4 ~
AC TEMPERATURE = 77 DEG F INFIATION PRESSURE DUAL= 120 psi \HDE BASE SINGIE = 130 psi
l\1DE BASE SINGIE (TRAIIER AXI.E)
rhl~ DUAL
(DRIVE AXIE)
~ 0.2 ~------~--:-:-_____ ____,,_33_ki'-ps __ 33 ki s
Conversion Factors o.o-1---------~-~--.----.----,------.-------1 lpsi=6.9kPa 5 10 15 20 25 30 35 40 45 50 55 1 in= 25.4 rrm SPEED(mph) 1 mph = 1. 6 kph 1 lbf = 4.5 N ·F => subtract 32 x 5/9 = ·c
FIG. 45. Effect of 17 and 33 kips·Axle loading on Allowable Number of Passes Under Dual and Wide Base Single Tires on Section I (Thin)
4.5~--------------------
AC TEMPERATURE= 77 DEG F
4.0 AXlE WAD = 3 3 kips
3.5
3.0
[:l ~ ~ § 2.5 .. ;::
~ ~2.0 1.5
1.0 100 psi
120 psi
DUAL (DRIVE AXI.E)
WIDE BASE SINGIE . (TRAllER AXI.E)
\
0.5 b===========~7==========::!========1 130 psi/
Conversion Factors 0.0 5 1 psi = 6.9 kPa
1 in = 25.4 rrm 1 mph = 1. 6 kph 1 lbf = 4.5 N
10
·F => subtract 32 x 5/9 = ·c
15 20 25 30 35 40 45 50 55 SPEED (mph)
FIG. 46. Effect of Inflation Pressure and 33 kips Axle Loading at 77 DEG F AC Temperature on Allowable Number of Passes Under Dual and Wide Base Single Tires on Section II (Thick)
94

4.5~-----------------:D:-:::UAL-:-:------
AC TEMPERATURE= 104 DEG F (DRIVE AXIE)
~ 4.0
~ 3.5
~ 3.0
~~ ~ § 2.5 a::~
~ ~2.0 ~ 1.5
lz~ LO
AXLE LOAD = 17 kips
WIDE BASE SINGLE (TRAILER AXLE)
0 5 lOOpsi
. I =============~---a...~========:=!:====;;;~~~ ~ .....,,,____130 psi Conversion Factors O.O 5 1 psi = 6.9 kPa 1 in = 25.4 mn
10
1
1 mph= 1.6 kph 1 lbf = 4.5 N °F => subtract 32 x 5/9 = ·c
15 20 25 30 35 40 45 50 55 SPEED (mph)
FIG. 47 .• Effect of Inflation Pressure and 33 kips Axle Loading at .. 104 DEG F AC Temperature on Allowable Number of Passes Under Dual and Wide Base Single Tires on Section II (Thick)
120 psi
WIDE BASE SINGLE (TRAILER AXIE)
Conversion Factors o 5 10 l5 20 25 30 35 40 45 50 55 1 psi = 6. 9 kPa SPEED (mph) 1 in = 25.4 mn 1 mph :; 1. 6 kph 1 lbf = 4. 5 N °F => subtract 32 x 5/9 = ·c
FIG. 48. Effect of Inflation Pressure and 17 kips Axle Loading at 77 DEG F AC Temperature on Allowable Number of Passes Under Dual and Wide Base Single Tires on Section II (Thick)
95

- -------45 ~=====-=-==-=---=-====-=--==-=-=-====---===-::::..-=-==-==--==-i AC TEMPERATURE = 104 DEG F
Conversion Factors 05 1 psi = 6.9 kPa 1 in = 25.4 mn 1 mph = 1. 6 kph 1 lbf = 4.5 N
AXLE LOAD = 17 kips
10 15 20
°F => subtract 32 x 5/9 = ·c
120 psi
100 psi 130 psi
' 25 30 35 SPEED (mph)
DUAL (DRIVE AXLE)
WIDE BASE SINGLE (TRAILER AXLE)
40 45 50 55
FIG. 49. Effect of Inflation Pressure and 17 kips Axle Loading at 104 DEG F AC Temperature on Allowable Number of Passes Under Dual and Wide Base Single Tires on Section II (Thick)
35
30
AC TEMPERATURE = 77 DEG F INFLATION PRESSURE DUAL= 120 psi WIDE BASE SINGLE = 130 psi
DUAL (DRIVE AXLE)
FIG. 50. Effect of 17 and 33 kips Axle Loading on Allowable Number of Passes Under Dual and Wide Base Single Tires on Section II {Thick)
96

--be--higher under dual tires compared to wide base single tires on both the---- -test sections.
The performance analyses for Section I (Thin) showed that at a truck speed of 55 mph (88 kph), 33 kip tandem axle loading, and 77 degree Fahrenheit (25°C) asphalt concrete layer temperature, the pavement life was computed to be about 115% higher under the dual tires compared to wide base single tires at high tire inflation pressure, and about 146% higher at low tire inflation pressure. However, with an increase of asphalt concrete layer temperature to 104 degree Fahrenheit (40°C) and under similar test conditions, the pavement remaining life was computed to be about 196% higher under the dual tires compared to wide base single tires at high tire inflation pressure, and about 248% higher at low tire inflation pressure. At a truck speed of 55 mph (88 kph), 77 degree Fahrenheit (25°C) asphalt concrete layer temperature, and high tire i nfl at ion pressure, for an increase in tandem axle load from 17 to 33 kips, the pavement remaining life decreased by about 89% under the wide base single tires and by about 90% under the dual tires. At 33 kips tandem axle loading, 77 degree Fahrenheit (25°C) asphalt concrete temperature, and 55 mph (88 kph) truck speed, remaining pavement life decreased by about 52% and 58% under wide base single and dual tires, respectively, for a tire inflation pressure increase from low to high. Under similar test conditions for a speed increase from 5 to 55 mph (8 to 88 kph), the remaining pavement life increased by about 40% under the wide base single tires and about 10% under dual tires.
The remaining life analyses for Section II (Thick) showed that at a truck speed of 55 mph (88 kph), 33 kip tandem axle loading, and 77 degree Fahrenheit (25°C) asphalt concrete layer temperature, the pavement life was computed to be about 394% higher under the dual tires compared to wide base single tires at high tire inflation pressure, and about 418% higher at low tire inflation pressure. However, with the increase of asphalt concrete layer temperature to 104 degree Fahrenheit (40°C) and under similar test conditions, the pavement remaining life was computed to be about 910% and 953% higher under the dual tires compared to wide base single tires at high and low tire inflation pressures respectively. At a truck speed of 55 mph (88 kph), 77 degree Fahrenheit (25°C) asphalt
97

-Goncrete layer temperature,- and high tire inflation pressure, for an increase in tandem axle load from 17 to 33 kips, the remaining pavement life decreased by about 84% under the wide base single tires and by about 91% under the dual tires. At 33 kips tandem axle loading, 77 degree Fahrenheit (25°C) asphalt concrete temperature, and 55 mph (88 kph) truck speed, remaining pavement life decreased by about 17% and 21% under wide base single and dual tires, respectively, for a tire inflation pressure increase from low to high. At 33 kips tandem axle loading, 77 degree Fahrenheit (25°C) asphalt concrete temperature, and high tire inflation pressure, the remaining pavement life increased by about 105% under the wide base single tires and about 50% under dual tires for a speed increase from 5 mph to 55 mph (8 to 88 kph).
Tables 7a and 7b tabulate predicted damage factor ratios of wide base single versus dual tires under different conditions.
CONCLUSIONS
The effects of tire type, axle load, speed, asphalt concrete layer temperature, and tire inflation pressure on the thick and thin flexible pavements performance were evaluated by measuring the SCI. Regression models were developed to predict the relationship between SCI and independent variables. The SCI values were converted into tensile strains at the bottom of the asphaltic concrete layer. A fatigue damage model was used to predict pavement performance. Effects of test variables on predicted SCI values, tensile strains, and remaining pavement life were evaluated and compared.
The response evaluation showed that the measured pavement response (SCI) was affected by tire type, load, inflation pressure, and asphalt concrete temperature. SCI values were greater under wide base single tires than dual tires and were also greater on the thin pavement section compared to the thick section. The effect of load was found to be more significant than other factors.
Fatigue evaluation showed that the tensile strains decreased with the increase in speed and increased with the increase in axle load, asphalt concrete temperature, and tire inflation pressure. Under similar test conditions, wide base single tires were found to be more damaging
98

Table 7a. Predicted Damage Factor Ratio of Wide Base Single Tires (33 kips Tandem Trailer Axle) Versus Dual Tires (33 kips Tandem Drive Axle) at High Inflation Pressure* in Terms of Tensile Strains at the Bottom of the AC Layer and Number of 18 kips ESAL Repetitions for Section I (Thin) and; Section II (Thick)
Section
I (Thin)
I
I
I
II {Thi ck)
II
II
II
"Wide Base Single =
Operating Variables
AC Layer Temperature Speed
(DEG F) (mph)
77 5
77 55
104 5
104 55
77 5
77 55
104 5
104 55
130 psi "Dual = 120 psi
Conversion Factors 1 psi = 6.9 kPa 1 in = 25.4 rrm 1 mph = 1.6 kph 1 lbf = 4.5 N "F => subtract 32 x 5/9 = ·c
Damage Factor Ratio Wide Base Single
Versus Dual Tires
Tensile Strain ESAL Repetitions
1.36 2. 72
1.26 2.15
1.48 3.60
1.39 2.96
1. 78 6.74
1.62 4.94
2.13 12.08
2.01 10.09

Table 7b. Predicted Damage Factor Ratio of Wide Base Single Tires (33 kips Tandem Trailer Axle) Versus I
Dual Tires (33 kips Tandem Drive Axle) at Low Inflation Pressure· in Terms of Tensile Strains : at the Bottom of the AC Layer and Number of 18 kips ESAL Repetitions for Section I (Thin) and Section II (Thick)
Section
I (Thin)
I
I
I
II (Thick)
II
II
II
"Wide Base Single =
Operating Variables
AC Layer Temperature Speed
(DEG F)
77
77
104
104
77
77
104
104
100 psi "Dual
(mph)
5
55
5
55
5
55
5
55
= 80 psi
Conversion Factors 1 psi = 6.9 kPa 1 in = 25.4 11111
1 mph = 1.6 kph 1 lbf = 4.5 N "F => subtract 32 x 5/9 = ·c
Damage Factor Ratio Wide Base Single
Versus Dual Tires
Tensile Strain ESAL Repetitions
1.42 3.18
1.31 2.46
1.55 4.28
1.46 3.48
1.81 7.05
1.65 5.18
2.15 12.58
2.04 10.53

--than-dual tires on both the test sections. Higher tire inflationpressures and higher axle loads were found to be more damaging on Section I (Thin) compared to Section II (Thick).
The performance evaluation showed longer pavement life under dual tires than wide base single tires under similar test conditions on both Section I (Thin) and Section II (Thick). At 33 kips tandem axle loading, 77 degree Fahrenheit (25°C) asphalt concrete layer temperature, high tire inflation pressure, and 55 mph (88 kph) truck speed, the wide base single tires were predicted to cause between 2 and 5 times more damage than dual tires on Section I (Thin) and Section II (Thick), respectively.
101


CHAPTER VI CONCLUSIONS AND RECOMMENDATIONS
This report addresses the analyses of multidepth deflection data on thick and thin asphaltic concrete pavements under truck loadings. The data were collected for the truck tandem axles fitted with both dual and wide base single tires. In recent years replacing dual tires with wide base single tires on heavy trucks has generated concern due to a potential increase in highway pavement damage the latter may cause. This study examined the impact of tire type, inflation pressure, speed, and axle load on pavement response and the predicted pavement performance in terms of rutting and cracking.
CONCLUSIONS The following conclusions are based on this study: 1. Under similar test conditions, higher deflections were measured
under wide base single tires in both drive and trailer axle positions. The maximum deflection under the wide base single tire was measured under the tire centerline, while the maximum deflection under dual tires was measured under either of the two tires. The lateral shape of the deflection bowl showed that the deflection basin under the wide base single tires is deeper and more concentrated. A rapid decrease in deflection was monitored at the edge of the wide base single tires, while the deflection basin under dual tires was found to spread over a much wider area. This phenomenon indicates higher shear forces at the edge of the wide base single tires.
2. The multidepth deflection data on both test sections was converted into vertical compressive strains at the top of the subgrade layer. Regression equations were developed to predict the relationships between subgrade strains and tire type, axle load, speed, tire inflation pressure and asphalt layer temperature. The measured subgrade strains, as predicted by the regression equations, were used to estimate pavement performance under dual and wide base single tires using a
103

subgrade strain prediction model. Under similar conditions, the strains were always found to be greater under wide base single tires than dual tires.
3. The subgrade strains decreased with an increase in truck speed and increased with an increase in axle load and asphalt layer temperature. Among these, the axle load was found to be the most significant factor affecting the subgrade strain. Tire inflation pressure was not a significant factor in the measured subgrade strains.
4. Using the subgrade rutting criteria (under identical conditions of 33 kips tandem axle loading, 77 degree Fahrenheit (25°C) AC layer temperature, and 55 mph (88 kph) truck speed), the wide base single tires were found to be approximately 4 times more damaging on the thin section and 3 times more damaging on the thick section.
5. The main focus of this effort was in terms of estimating the rutting potential of wide base as opposed to dual tires, measured in terms of vertical strains. However, a first order analysis was made of the impact of tire type on surface cracking. This was approximated by using the shape of the deflection bowl under truck loading in the longitudinal direction. A SCI parameter was measured under both tire types. SCI values were found to be greater under wide base single tires than dual tires and were also greater on the thin section compared to the thick section. It was found that the rate of change for the SCI due to offset was greater for wide base single tires than for dual tires. This implies that the curvature of the deflection bowl is sharper under this type of tire, and that the load is spread over a smaller area generating large shear strains at the edge of the tire. The effect of load was found to be more significant than other factors.
6. Theoretical regression equations were built to convert SCI to tensile strain at the bottom of the asphalt layer. Fatigue evaluations showed that the tensile strains decreased with an
104

increase in speed and increased with an increase in axle load, asphalt layer temperature, and tire inflation pressure. Using the fatigue criteria (under identical conditions of 33 kips tandem axle loading, 77 degree Fahrenheit (25°C) AC layer temperature, high tire inflation pressure, and 55 mph (88 kph) truck speed) the wide base single tires were found to be 2 times more damaging than dual tires on Section I (Thin) and 5 times more damaging on Section II (Thick).
RECOMMENDATIONS The following area is recommended for further research: I. The wide base single tires cause more deflection, higher
vertical compressive strains, and sharper curvature of the deflection bowl, resulting in large shear strains at the tire edge. More work is needed to evaluate the effect of tire pressure and load on the vertical and tangential stresses at the tire pavement interface under static and rolling wide base single tires.
105

106

REFERENCES
AASHO Road Test. (1962). American Association of State Highway Officials, Special Report 61-E, Highway Research Board, Washington, D.C.
AASHTO Guide for Design of Pavement Structures. (1986). American Association of State Highway and Transportation Officials, Washington, D.C.
Akram, T. (1993). "In situ flexible pavement material characterization and estimation of distresses under dual and wide base single tires." PhD Dissertation, Texas A&M University, College Station, Texas.
Barksdale, R. D., and Hicks, R. G. (1973). "Material characterization and layered theory for use in fatigue analysis." Special Report No. 140, Highway Research Board, Washington, D.C.
Basson, J. E. B., Wijnberger, 0. J., and Skultety, J. (1981). "The multidepth deflectometer: A multistage sensor for the measurement of deflection and permanent deformations at various depths in road pavements." Technical Report RP/3/81, Institute of Transportation and Road Research, South Africa.
BISAR. (1978). "Bitumen structural analysis in roads user's manual." Koninklijke/Shell - Laboratorium, Shell Research, Amsterdam, Holland.
Bohn, A., Ullidtz, P., Stubstad, R., and Sorensen, A. (1972). "Danish experiments with the French falling weight deflectometer." Proceedings 3rd International Conference on the Structural Design of Asphalt Pavements, London, England.
Bonaquist, R., Surdahl, R., and Mogawer, W. (1989). "Effect of tire pressure on flexible pavement response and performance." Transportation Research Record 1227, Transportation Research Board, Washington, D.C.
Brown, S. F., Pell, P. S., and Stock, A. F. (1977). "The application of simplified, fundamental design procedures for flexible pavements." Proceedings 4th International Conference on the Structural Design of Asphalt Pavements. The University of Michigan, Ann Arbor, Michigan.
Burmister, D. M. (1945). "The general theory of stresses and displacements in layered soil systems." Journal of Applied Physics, Vol. 16, 89-94, 126-127, 296-302.
107

REFERENCES (Continued)
Cauwelaert, F. J. V., Alexander, D.R., White, T. D., and Barker, W. R. (1989). "Multilayer elastic program for backcalculating layer moduli in pavement evaluation." Nondestructive Testing of Pavements and Backcalculation of Moduli, ASTM STP 1026, American Society for Testing and Materials, Philadelphia, Pennsylvania.
Charles, F. S. (1986). "Trends in truck tires." Presented at Special Symposium on Rutting In Asphalt Pavements, Roads and Transportation Association of Canada, Toronto, Canada.
Christison, J. T., and Shields, B. P. (1980). "Evaluation of the relative damaging effects of wide base tire loads on pavements." Annual Conference of the Roads and Transportation Association of Canada, Toronto, Ontario, Canada.
Christison, J. T. (1978). "Evaluation of the effects of axle loads on pavements from insitu strain and deflection measurements." Internal Report HTE-78/02, Alberta Research Council, Transportation and Surface Water Engineering Division, Alberta, Canada.
Clark, R. B. (1989). "Tires, pressures and pavements." Paper 892458. Society of Automotive Engineers, Warrendale, Pennsylvania.
Crockford, W. W. (1989). "Modelling stress and strain states in pavement structures incompating granular layers." Report 89-63, USAIR Engineering Service Center, Tyndall AFB, Florida.
Deacon, J. A., (1969). "Load equivalency in flexible pavements." Proceedings of the Association of Asphalt Paving Technologists, Vol. 38, 465-691.
Dorman, G. M., and Metcalf, C. T. (1965). "Design curves for flexible pavements based on layered system theory." Highway Research Record 71, Highway Research Board, Washington, D.C.
Duncan, J. M., Monismith, C. L., and Wilson, E. L. (1968). "Finite element analysis of pavements." Highway Research Record 228, National Research Council, Washington, D.C.
108

REFERENCES (Continued)
Eisenmann, J., and Hilmer, A. (1986). "Influence of wheel load and inflation pressure on the rutting effect at asphalt-pavementsexperiments and theoretical investigations." Federal Minister of Transportation, Germany.
Federal Highway Administration. (1984). Bridge Gross Weight Formula. Federal Highway Administration, U.S. Department of Transportation, Washington, D.C.
Figueroa, J. L., and Thompson, M. R. (1980). "Simplified ILLI-PAVE based structural analysis of flexible pavement for secondary roads." Transportation Research Record 766, Transportation Research Board, Washington, D.C.
Finn, F., Saraf, C. L., Kulkarni, R., Nair, K., Smith, W., and Abdullah, A. (1977). "Development of pavement structural subsystems." Vol. I, Final Report, NCHRP Project 1-108, Transportation Research Board, Washington, D.C.
Ford, T. L., and Charles, F. S. (1988). "Heavy duty truck tire engineering." 34th L. Ray Buckendale Lecture. SP-729, Society of Automotive Engineers, Warrendale, Pennsylvania.
Giles, W. L. (1979). "Expanded applications of the wide base radial truck tire." Paper 791044. Society of Automotive Engineers, Warrendale,
Pennsylvania. Harr, M. E. (1962). "Influence of vehicle speed on pavement deflection."
Report No. 41, Highway Research Board, Washington, D.C. Harry, A. S. (1991). "Truck tire characteristics and asphalt concrete
pavement rutting." Transportation Research Board 10th Annual Meeting, Washington, D.C.
Hicks, R. G., and Finn, F. N. (1970). "Analysis of results from the dynamic measurement program on the San Diego test road." Proceedings of the Association of Asphalt Paving Technology, Vol. 39, 153-183.
Hoffman, M. S., and Thompson, M. R. (1982). "Comparative study of nondestructive testing devices." Transportation Research Record 852, Transportation Research Board, Washington, D.C.
109

REFERENCES (Cont;nued}
Hoffman, M. S., and Thompson, M. R. (1981). "Mechanistic interpretation of nondestructive pavement testing deflections." Transportation Engineering Series No. 32, Illinois Cooperative Highway and Transportation Research Program, Series No. 190, University of Illinois, Urbana-Champaign, Illinois.
Huhtala, M., and Pihlajamaki, J. (1990). "Truck tires and pavements." Third International Conference on Bearing Capacity of Roads and Airfields, The Norwegian Institute of Technology, Trondheim, Norway.
Huhtala, M., Pihlajamaki, J., and Pienimaki, M. (1989). "The effects of tires and tire pressures on road pavements." Transportation Research Board 68th Annual Meeting, Washington, D.C.
Huhtala, M. (1988). "Field tests to compare tires." FHWA Load Equivalency Workshop, U.S. Department of Transportation, Washington, D.C.
Irwin, L. H. (1983). "Users guide to MODCOMP2." Report No. 83-8, Cornell University Local Roads Program, Cornell University, Ithaca, New York.
Ishihara, K. (1983). "Soil response in cyclic loading induced by earthquakes, traffic and waves." Proceedings 1th Asian Regional Conference on Soil Mechanics and Foundation Engineering, Haifa, Israel, Vol. 2, 42-66.
Kennedy, C. K. (1982). "Equipment for assessing the structural strength of road pavements." International Symposium on Bearing Capacity of Roads and Airfields, The Norwegian Institute of Technology, Trondheim, Norway.
Khedr, S. A., Kraft, D. C., and Jenkins, J. L. (1985). "Automated cone penetrometer: a nondestructive field test for subgrade evaluation." Transportation Research Record 1022, Transportation Research Board, Washington, D.C.
Lambe, T. W., and Whitman, R. V. (1969). Soil Mechanics. John Wiley & Sons, Inc., New York, New York.
Letta, A. R. (1980). "A computer program for function optimization using pattern search and gradient summation techniques." Master of Engineering Thesis, Industrial Engineering Department, Texas A&M University, College Station, Texas.
110
---------------------------------------

REFERENCES (Continued}
Lytton, R. L. (1989}. "Backcalculation of pavement layer properties." Nondestructive Testing of Pavements and Backcalculation of Moduli, ASTM STP 1026, American Society for Testing and Materials, Philadelphia, Pennsylvania.
Lytton, R. L., Germann, F., and Chou, Y. J. (1990}. "Determination of asphaltic concrete pavement structural properties by nondestructive testing." NCHRP Report 10-27 - Phase II, National Cooperative Highway Research Program, Transportation Research Board, National Research Council, Washington, D.C.
Mahoney, J. P. (1988). "The relationship between axle configurations, wheel loads and pavement structures." Paper 881884. Society of Automotive Engineers, Warrendale, Pennsylvania.
Majidzadeh, K. (1982}. "Dynamic deflection as pavement performance indicator." International Symposium on Bearing Capacity of Roads and Airfields, The Norwegian Institute of Technology, Trondheim, Norway.
Marshek, K. M., Hudson, W. R., Connell, R. B., Chen, H. H., and Saraf, C. L. (1985a}. "Experimental investigation of truck tire inflation pressure on pavement-tire contact area and pressure distribution." Research Report 386-1. Center for Transportation Research, The University of Texas at Austin, Austin, Texas.
Marshek, K. M., Hudson, W. R., Connell, R. B., Chen, H. H., and Saraf, C. L. (1985b). "Effect of truck tire inflation pressure and axle load on pavement performance." Research Report 386-2F. Center for Transportation Research, The University of Texas at Austin, Austin, Texas.
Michelow, J. (1963}. "Analysis of stresses and displacements in an nlayered elastic system under a load uniformly distributed on a circular area." California Research Corporation, Richmond, California.
Molenaar, A. A. A. (1983}. "Structural performance and design of flexible road construction and asphalt overlays." PhD Dissertation, Delft University, Delft, Netherlands.
111

REFERENCES (Cont;nued}
Monismith, C. L., Sousa, J., and Lysmer J. (1988). "Modern pavement design technology including dynamic load conditions." Paper 881845. Society of Automotive Engineers, Warrendale, Pennsylvania.
Morris, J. R. (1987). "Effects of heavy vehicle characteristics on pavement response and performance - - Phase 1." Research Report 2-16. National Cooperative Highway Research Program, Transportation Research Board, National Research Council, Washington, D.C.
Papagiannakis, A. T., and Haas, R. C. G. (1986). "Wide base truck tires; industry trends and state of knowledge of their impact on pavements." Ministry of Transportation and Communications of Ontario, Canada.
Pell, P. S., and Brown, S. F. (1972). "The characteristics of materials for the design of flexible pavement structures." Proceedings 3rd International Conference on the Structural Design of Asphalt Pavements. The University of Michigan, Ann Arbor, Michigan.
Peterson G., and Shephard, L. W. (1972). Deflection analysis of flexible pavements. Final Report, Materials and Test Division, Utah State Department of Transportation, Salt Lake City, Utah.
Roberts, F. L., Urruela, R., and Mikael, P. J. (1987). "Effects of automobile tire loads on thin flexible pavements." Research Report 345-2F. Texas Transportation Institute, Texas A&M University, College Station, Texas.
Roberts, F. L., Tielking, J. T., Middleton, D., Lytton, R. L., and Tseng, K. (1986). "Effects of tire pressures on flexible pavements." Research Report 372-lF. Texas Transportation Institute, Texas A&M University, College Station, Texas.
Roberts, F. L., and Rosson, B. T. (1985). "Establishing material properties for thin asphalt concrete surfaces on granular base." Research Report 345-1. Texas Transportation Institute, Texas A&M University, College Station, Texas.
Rohde, G. T., and Scullion, T. (1990). "MODULUS 4.0: Expansion and validation of the MODULUS backcalculation system." Research Report 1123-3. Texas Transportation Institute, Texas A&M University, College Station, Texas.
112

REFERENCES (Cont;nued) -
Rohde, G. T. (1990). "The mechanistic analysis of FWD deflection data on sections with changing subgrade stiffness with depth." PhD Dissertation, Texas A&M University, College Station, Texas.
Santucci, L. E. (1977). "Thickness design procedures for asphalt and emulsified asphalt mixes." Proceedings 4th International Conference on the Structural Design of Asphalt Pavements. The University of Michigan, Ann Arbor, Michigan.
Scullion, T. (1988c). "Incorporating a structural strength index into the Texas pavement evaluation system." Research Report 409-3F, Texas Transportation Institute, Texas A&M University, College Station, Texas.
Scullion, T., Bush, A. J. III., and Kenis, W. J. (1990). "Using the multidepth deflectometer to evaluate tire pressure effects in flexible pavements." Proceedings 3rd International Conference on Bearing Capacity of Roads and Airfields, The Norwegian Institute of Technology, Trondheim, Norway.
Scullion, T., Brigg, R. C., and Lytton, R. L.(1988a). "Using the multidepth deflectometer to verify backcalculation procedures." First International Symposium on NDT of Pavements and Backcalculation of Moduli, ASTM Conference, Baltimore, Maryland.
Scullion, T., Uzan, J., Yazdani, J, I., and Chan, P. (1988b). "Field evaluation of multidepth deflectometers." Research Report 1123-2, Texas Transportation Institute, Texas A&M University, College Station, Texas.
Sebaaly, P., and Tabatabaee, N. (1989). "Effect of tire pressure and type on flexible pavement." Transportation Research Record 1227, Transportation Research Board, Washington, D.C.
Sharp, A. III. (1987). "Truck tire pavement interaction." Presented at AASHTO Symposium on High Pressure Truck Tires, Austin, Texas.
Sharp, K. G., Sweatman, P. F., and Potter, D. W. (1986). "The comparative effects of dual and wide single tires." Australian Road Research Board.
113

REFERENCES (Continued)
Shell Pavement Design Manual. (1978). Shell International Petroleum Company Limited, London, England.
Siddharthan, R., Anooshehpoor, A., and Epps, J. A. (1991). "Model tests for moving load effects on pavements." Transportation Research Board 10th Annual Meeting, Washington, D.C.
Smith, H. E. (1991). "Truck tire characteristics and asphalt concrete pavement rutting." Transportation Research Board 10th Annual Meeting, Washington, D.C.
Smith, R. E., and Lytton, R. L. (1984). "Synthesis study of nondestructive testing devices for use in overlay thickness design of fl exi bl e pavements." Report FHWAIRD-83/091, U.S. Department of Transportation, National Cooperative Highway Research Program, Transportation Research Board, National Research Council, Washington, D.C.
Snelgrove, F. B. (1980). "The fuel economy, stability and pavement effects of the wide base radial tires." Ministry of Transport and Communications, Ontario, Canada.
The Asphalt Institute (1982}. "Research and development of the Asphalt Institute's thickness design manual (MS-1) ninth edition." Research Report No. 82-2.
Thompson, M. R. (1989). "Calibrated mechanistic structural procedures for pavements." Final Report. NCHRP Report I-26, National Cooperative Research Program, Transportation Research Board, Washington, D.C.
Thompson, M. R. (1987). "Analytical methods for considering tire pressure effects in pavement design." Proceedings of a Symposium/Workshop on High Pressure Truck Tires, Austin, Texas.
Tielking, J. T. (1984). "A finite element tire model." Tire Science and Technology, Vol. II, Nos. 1-4, 50-63.
Tielking, J. T. (1989). "Finite element tire model calculation of pavement pressures produced by truck tires." Research Report MM 2324-89-13. Texas Transportation Institute, Texas A&M University, College Station, Texas.
114

REFERENCES (Continued)
Uddin, W., Meyer, A. H., Hudson, W. R., and Stakoe K. H. (1985). "Project-level structural evaluation of pavements based on dynamic deflections." Transportation Research Record 1007, Transportation Research Board, Washington, D.C.
Ullidtz, P., and Larsen, H. J. E. (1989). "State-of-the-art stress, strain and deflection measurements." Symposium State of the Art of Pavement Response Monitoring Systems for Roads and Airfields, 6-9 March 1989, West Lebanon, New Hampshire.
Ullidtz, P., and Stubstad, R. N. (1985). "Analytical-empirical pavement evaluation using the falling weight deflectometer." Transportation Research Record 1022, Transportation Research Board, Washington, D.C.
Uzan, J. (1992). "Resilient characterization of pavement materials." International Journal for Numerical and Analytical Methods in Geomechanics, Vol. 16, 453-459.
Uzan, J., and Scullion T. (1990). "Verification of backcalculation procedures." Proceedings of the Third International Conference on the Bearing Capacity of Roads and Airfields, Trondheim, Norway.
Uzan, J., Lytton, R. L., and Germann, F. P. (1988a). "General procedures for backcalculating layer moduli." First Symposium on NDT of Pavements and Backca1cu1ation of Moduli, ASTM, Baltimore, Maryland.
Uzan, J., Scullion, T., Michalek, C. H., Parades, M., and Lytton, R.L. (1988b). "A microcomputer based procedure for backcalculating layer moduli from FWD data." Research Report 1123-1, Texas Transportation Institute, Texas A&M University, College Station, Texas.
Wiman, L. G., Jansson, H. (1990). "A Norwegian/Swedish in-depth pavement deflection study (2) - seasonal variations and effect of loading type." Third International Conference on Bearing Capacity of Roads and Airfields, The Norwegian Institute of Technology, Trondheim, Norway.
Witczak, M. W., and Uzan, J. (1988). "The universal airport pavement design system: Granular material characterization." Report I, University of Maryland, College Park, Maryland.
115

REFERENCES (Continued)
Yap, P. (1988). "A comparative study of the effect of truck tire types on road contact pressures." Paper 881846. Society of Automotive Engineers, Warrendale, Pennsylvania.
Yazdani, J. I. (1989). "Using the multi-depth deflectometer to study pavement response." Master of Science Thesis, The Texas A&M University, College Station, Texas.
Yoder, E. J., and Witczak, M. W. (1975). Principles of Pavement Design. 2nd Edition, John Wiley & Sons, New York, New York.
Zienkiewicz, 0. C. (1977). The Finite Element Method. 3rd Edition, McGraw-Hill, London, England.
Zube, E., and Forsyth, R. (1965). "An investigation of the destructive effect of flotation tires on flexible pavement." Highway Research Record No. 71, Highway Research Board, Washington, D.C.
116

APPENDIX A
LABORATORY RESULTS
117

118

•-------T-ab'l-e-A-h-- T-he Laboratory Res~lts for Section I (Thin} at 10 Hz Frequency
ASPHALT
Temp M,
(oF) (ksi)
77 743
104 325
LABORATORY RESULTS FOR SECTION I {THIN)
BASE SUBGRADE
a3 ad M, a3 ad
(psi) (psi) (psi) (psi) (psi)
20
20
20
15
15
15
10
10
10
5
5
5
1
1
1
10 97720
15 89197
20 85714
10 71174
15 71828
20 72595
5 63025
10 56338
15 58670
5 31983
10 32913
15 34938
5 15424
7.5 17523
10 23687
Conversion Factors 1 psi = 6.9 kPa 1 in = 25.4 rrm 1 mph = 1. 6 kph 1 lbf = 4.5 N
6
3
0
6
3
0
6
3
0
6
3
0
"F => subtract 32 x 5/9 = ·c
119
6
6
6
8
8
8
10
10
10
12
12
12
M,
(psi)
8594
7169
6529
8307
7105
6330
8316
6862
6000
8459
6750
5978

•-----· ---Table A2.- The-Laboratory Results for Section l {Th-in) at 5 Hz Frequency
ASPHALT
Temp M,
(oF) (ks i)
77 547
104 210
LABORATORY RESULTS FOR SECTION I (THIN)
BASE SUBGRADE
a3 ad M, a3 ad
(psi) (psi) (psi) (psi) (psi)
20
20
20
15
15
15
10
10
10
5
5
5
1
1
1
10 91185
15 90543
20 89286
10 75282
15 75125
20 76726
5 52448
10 53194
15 54414
5 34602
10 36058
15 38330
5 26594
7.5 25182
10 26053
Conversion Factors 1 psi = 6.9 kPa 1 in = 25.4 ITITI
1 mph = 1.6 kph 1 lbf = 4.5 N 'F => subtract 32 x 5/9 = ·c
120
6 6
3 6
0 6
6 8
3 8
0 8
6 10
3 10
0 10
6 12
3 12
0 12
M,
(psi)
7358
6120
5238
7345
6352
5192
7087
6110
5415
7310
6698
5333
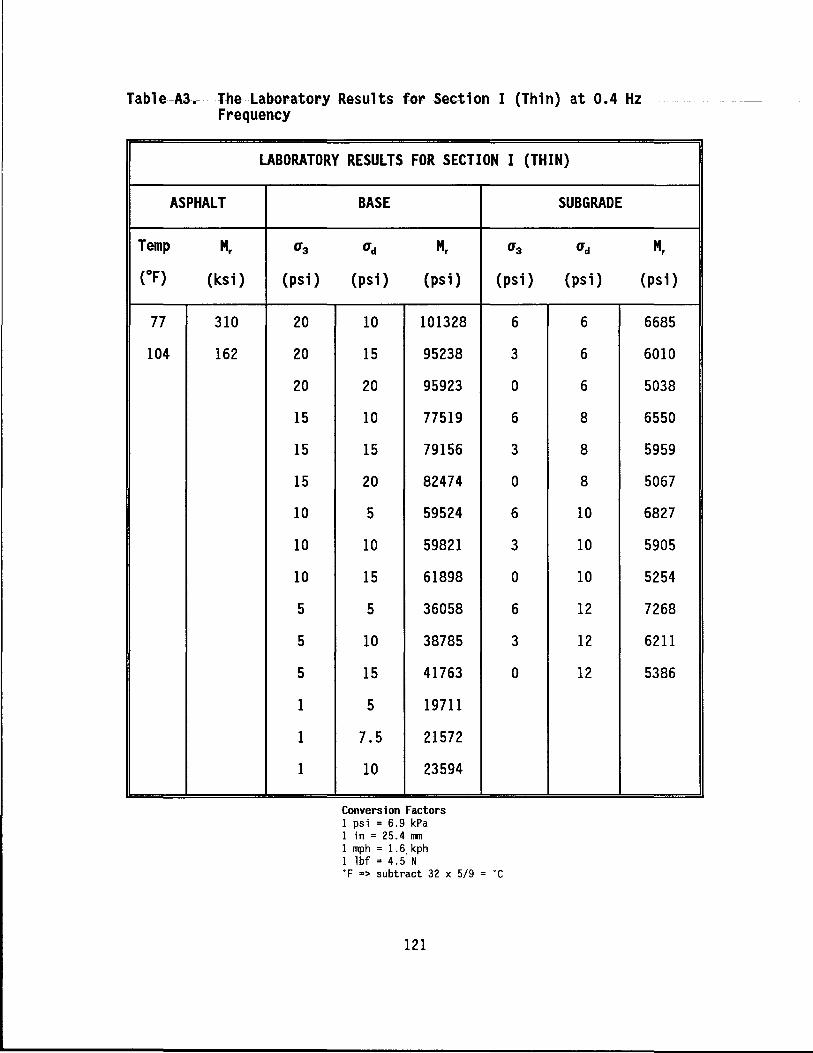
-Table-A3.- The Laboratory Results for Section I (Thin) at 0.4 Hz -Frequency
ASPHALT
Temp M,
(oF) (ksi)
77 310
104 162
LABORATORY RESULTS FOR SECTION I (THIN)
BASE SUBGRADE
03 ad M, 03 ad
(psi) (psi) (psi) (psi) (psi)
20
20
20
15
15
15
10
10
10
5
5
5
1
1
1
10 101328
15 95238
20 95923
10 77519
15 79156
20 82474
5 59524
10 59821
15 61898
5 36058
10 38785
15 41763
5 19711
7.5 21572
10 23594
Conversion Factors 1 psi = 6.9 kPa 1 in = 25.4 nm 1 mph = 1.6. kph 1 lbf = 4.5 N °F => subtract 32 x 5/9 = ·c
121
6 6
3 6
0 6
6 8
3 8
0 8
6 10
3 10
0 10
6 12
3 12
0 12
M,
(psi)
6685
6010
5038
6550
5959
5067
6827
5905
5254
7268
6211
5386

·----- -T-able-A4-.--- -The Laboratory Results for Section lI (Thick) at 10 Hz- - -Frequency
ASPHALT
Temp M,
(oF) (ksi)
77 591
104 347
LABORATORY RESULTS FOR SECTION I (THIN}
BASE SUBGRADE
a3 ad M, a3 ad
(psi) (psi) (psi) (psi) (psi)
20
20
20
15
15
15
10
10
10
5
5
5
1
1
1
10 61856
15 62413
20 60729
10 52493
15 52941
20 52910
5 44776
10 42105
15 43311
5 30738
10 29070
15 29950
5 16060
7.5 16593
10 17462
Conversion Factors 1 psi = 6.9 kPa 1 in = 25.4 ITITI
1 mph = 1.6 kph 1 lbf = 4.5 N "F => subtract 32 x 5/9 = ·c
122
6 6
3 6
0 6
6 8
3 8
0 8
6 10
3 10
0 10
6 12
3 12
0 12
M,
(psi)
12740
9877
8187
11096
10507
7847
10729
8981
7498
11242
9173
7212

--Table-AS. The Laboratory Results for Sectfon II (Thick) at 5 Hz. Frequency
LABORATORY RESULTS FOR SECTION I (THIN)
ASPHALT
Temp M, 0'3
(oF) (ksi) (psi)
77 253
104 84
BASE
O'd M,
(psi) (psi)
Conversion Factors 1 psi 7 6.9 kPa 1 in = 25.4 mn 1 mph = 1. 6 kph 1 lbf = 4. 5 N
0'3
(psi)
6
3
0
6
3
0
6
3
0
6
3
0
·r => subtract 32 x 5/9 = ·c
123
SUBGRADE
O'd
(psi)
6
6
6
8
8
8
10
10
10
12
.12
12
M,
(psi)
11482
8564
6904
10749
8020
6739
10638
8270
6760
10168
8009
6645

·-------table-A6.- The Laboratory Results for Section II (Thiele) at O.A Hz .
Temp
(oF)
77
104
Frequency
LABORATORY RESULTS FOR SECTION I (THIN)
ASPHALT BASE SUB GRADE
M, a3 ad M, a3 ad
(lcs i) (psi) (psi) (psi) (psi) (psi)
149
55
Conversion Factors 1 psi = 6.9 kPa 1 in = 25.4 mn 1 mph = 1. 6 kph 1 lbf = 4.5 N "F => subtract 32 x 5/9 = ·c
124
6 6
3 6
0 6
6 8
3 8
0 8
6 10
3 10
0 10
6 12
3 12
0 12
M,
(psi)
10236
8203
6539
10650
7583
6344
9894
8268
6666
9783
8134
6686