hysplit part 1: trajectories glenn gehring, office of air quality dept. of science and engineering...
TRANSCRIPT

HYSPLIT Part 1: Trajectories
Glenn Gehring, Office of Air Quality
Dept. of Science and Engineering
Confederated Tribes of the Umatilla Indian Reservation
Glenn Gehring, Office of Air Quality
Dept. of Science and Engineering
Confederated Tribes of the Umatilla Indian Reservation

2
Hybrid Single-Particle Lagrangian
Integrated Trajectory model
WHAT??

3
I think I’ll call it HYSPLIT
What??

4
Who Provides it?Who Provides it?
Air Resources Laboratory (ARL) provides products related to atmospheric dispersion and air quality
ARL mandated by Congress shortly after WWII—concerns about pollution transport (nuclear fallout initial concern)
ARL now within National Oceanic and Atmospheric Administration (NOAA)
Air Resources Laboratory (ARL) provides products related to atmospheric dispersion and air quality
ARL mandated by Congress shortly after WWII—concerns about pollution transport (nuclear fallout initial concern)
ARL now within National Oceanic and Atmospheric Administration (NOAA)

5
What HYSPLIT DoesWhat HYSPLIT Does
modeling tool used for computing wind trajectories in three dimensions complex pollutant dispersion, deposition patterns
can be used online or downloaded and used on your computer
can provide short-term forecasts for pollutant dispersion, or wind trajectories, using National Weather Service forecast meteorological data
can help us predict air quality and explore existing pollution episodes in near-real-time, and increase understanding of past pollution episodes

6
Why Do We Use it?Why Do We Use it? forecast smoke impacts from
proscribed burns or wildfires assess
Contributors to high pollutant concentrations observed on our monitors
transport patterns day/night/seasonal differences
forecast smoke impacts from proscribed burns or wildfires
assess Contributors to high pollutant
concentrations observed on our monitors transport patterns day/night/seasonal differences
But Mainly…

7
To Find Out Where is it Going
To Find Out Where is it Going
Proscribed burn

8
And Where it Came FromAnd Where it Came From

9
How Does it Work?How Does it Work?
Some day I’ll tell you. But right now my name isn’t Dr. Glenn and I don’t have a clue. Lets focus on how to use it.

10
If You Want Details, They’re There
If You Want Details, They’re There
http://www.arl.noaa.gov/ready/hysplit4.html

11
Some ExamplesSome Examples
12
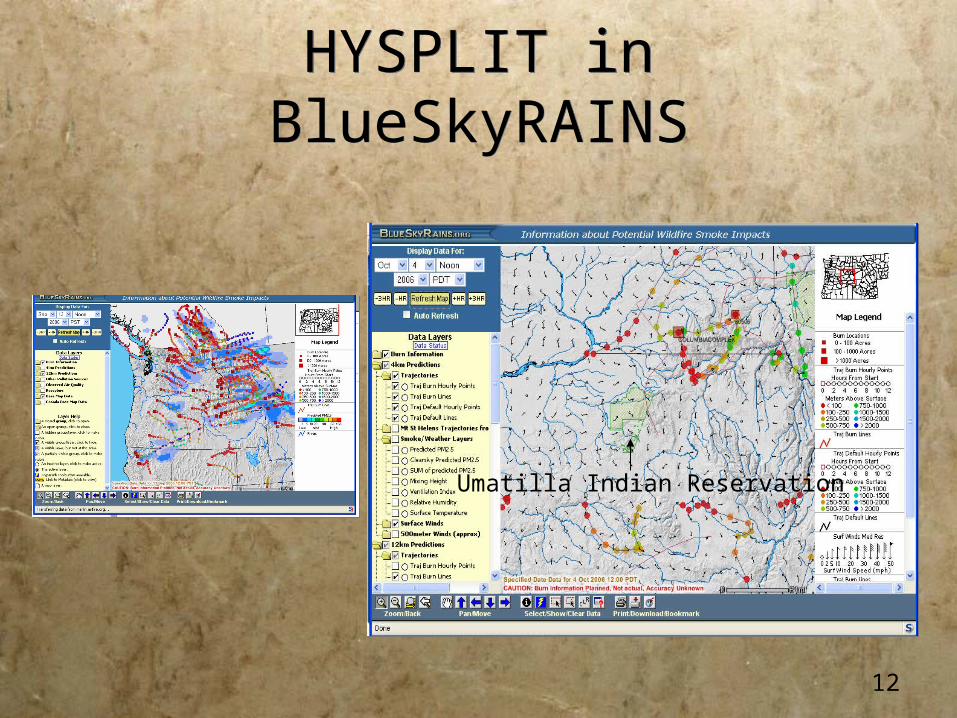
HYSPLIT in BlueSkyRAINSHYSPLIT in BlueSkyRAINS
Umatilla Indian Reservation

13
Cherokee Nation Stilwell Site
90ppb 8-hour ozone
Quapaw Nation83ppb 8-hour ozone
Two Ozone Sites on 4/12/2003

14
Stilwell SiteStarting with highest concentration at the analyzer, a 24-hour backward trajectory shows where parcel of air located, at 1-hour intervals, before it entered analyzer
GRDA Plume ConcentrationGradient
GRDA
Muskogee
Northeastern
24-Hr. Forward Plume Starting 4/11/03 Back Trajectory Starting 2 PM 4/12/03Stillwell 8-hour Ozone - 0.090 PPM
Tahlequah Site
1-Hour Before
24-Hours Before

15
3/20/2002 Great Basin National Park
16
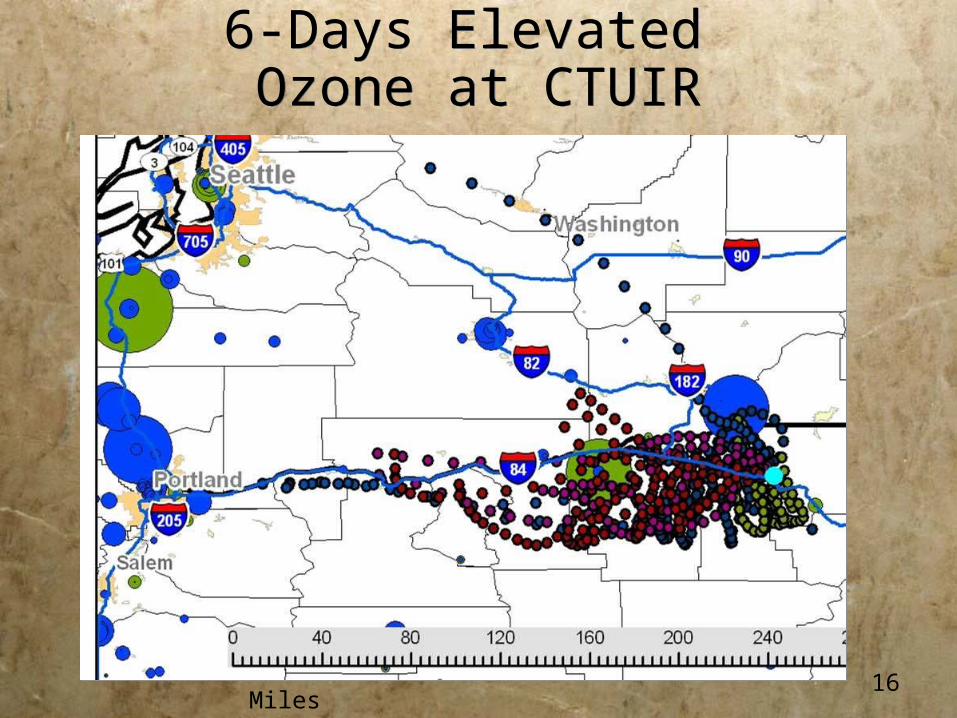
6-Days Elevated Ozone at CTUIR
6-Days Elevated Ozone at CTUIR
Miles

17
6 days Low Ozone at CTUIR6 days Low Ozone at CTUIR
Miles
Wind speed and other conditions matter. Not just direction.

18
Highest Passive Ozone (24-hour Sample)
19
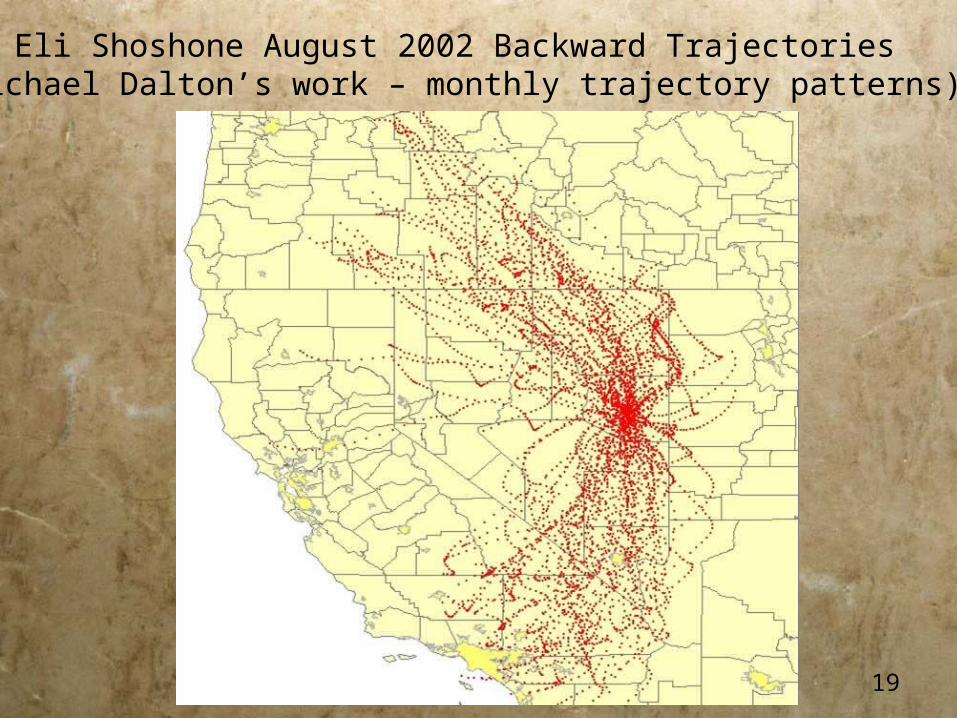
Eli Shoshone August 2002 Backward Trajectories(Michael Dalton’s work – monthly trajectory patterns)

20
NOAA’s HYSPLIT Online Modeling Tool: A Backward Trajectory Demonstration
NOAA’s HYSPLIT Online Modeling Tool: A Backward Trajectory Demonstration

21Select Compute trajectories

22
EDAS 40Provides best resolution, butlimited to post- 2003 dates
Alaska may need to use global reanalysis
Select Met dataset

23
Select date for met dataapr03 is April 2003 001 is day 1 through 15 of month002 is day 16 to end of month

24Enter latitude, longitude of monitoring site

25

26

27

28

29
Backward trajectories
Elevations of trajectories

30

31Save text file for GIS integration

32
Open Text File in Excel and Modify
Open Text File in Excel and Modify
Then save as a text file

33
Open ArcCatalog, Right Click on Text File and Create Feature
Class from XY Table
Open ArcCatalog, Right Click on Text File and Create Feature
Class from XY Table

34
Left Click, Hold and Drag to MapLeft Click, Hold and Drag to Map

35
There IS More to it – You’ll Learn that in the Trajectory
Exercise and in Your Practice
There IS More to it – You’ll Learn that in the Trajectory
Exercise and in Your Practice