hypothesis testing statistics for the social sciences psychology 340 spring 2010
TRANSCRIPT
Hypothesis testing
Statistics for the Social SciencesPsychology 340
Spring 2010

PSY 340Statistics for the
Social Sciences Reminders
• Don’t forget to complete homework 4 for Feb 9 (Tues)
• And Quiz 3 (Chapters 5, 6, & 7) by 11AM Thurs (Feb 4)
• Exam 1 Feb 11 (Thurs)

PSY 340Statistics for the
Social SciencesOutline (for the week)
• Review of: – Hypothesis testing framework
• Stating hypotheses
• General test statistic and test statistic distributions
• When to reject or fail to reject
– Effect sizes: Cohen’s d
– Statistical Power
PSY 340Statistics for the
Social Sciences Hypothesis testing
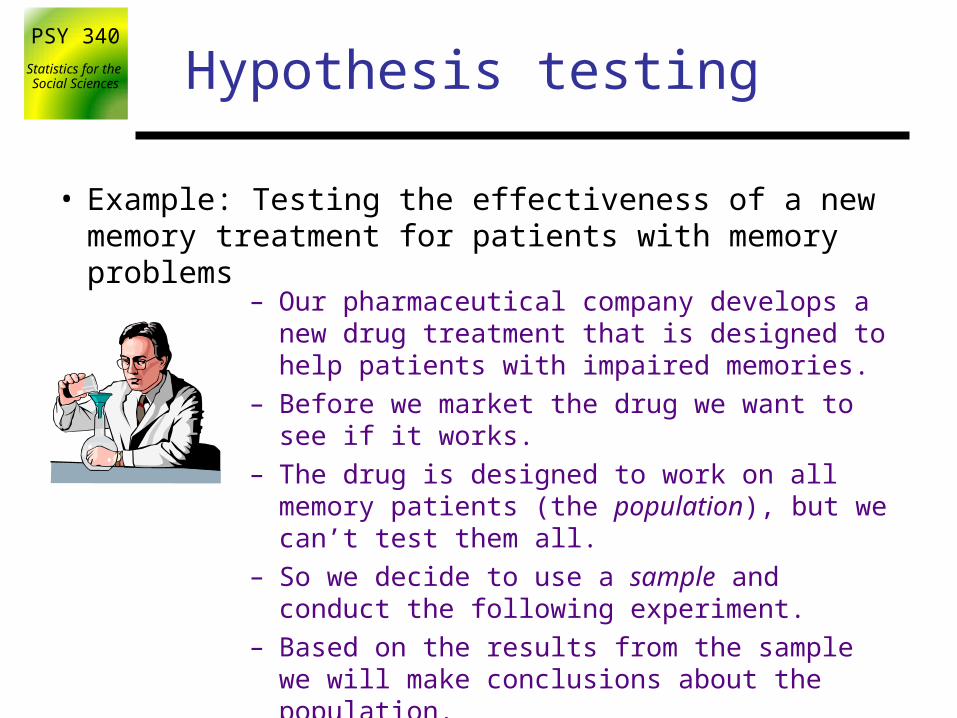
• Example: Testing the effectiveness of a new memory treatment for patients with memory problems
– Our pharmaceutical company develops a new drug treatment that is designed to help patients with impaired memories.
– Before we market the drug we want to see if it works.
– The drug is designed to work on all memory patients (the population), but we can’t test them all.
– So we decide to use a sample and conduct the following experiment.
– Based on the results from the sample we will make conclusions about the population.
PSY 340Statistics for the
Social Sciences Hypothesis testing
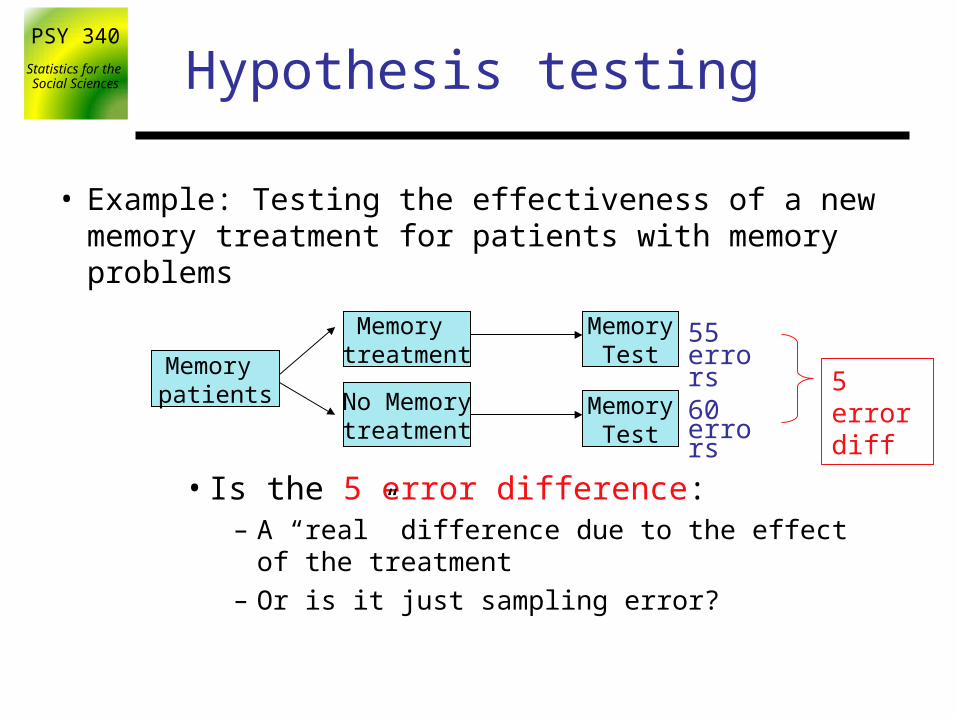
• Example: Testing the effectiveness of a new memory treatment for patients with memory problems
Memory treatment
No Memorytreatment
Memory patients
MemoryTest
MemoryTest
55 errors
60 errors
5 error diff
• Is the 5 error difference: – A “real” difference due to the effect of the treatment
– Or is it just sampling error?
PSY 340Statistics for the
Social Sciences Testing Hypotheses
• Hypothesis testing– Procedure for deciding whether the outcome of a study
(results for a sample) support a particular theory (which is thought to apply to a population)
– Core logic of hypothesis testing• Considers the probability that the result of a study could have
come about if the experimental procedure had no effect
• If this probability is low, scenario of no effect is rejected and the theory behind the experimental procedure is supported
PSY 340Statistics for the
Social Sciences Inferential statistics
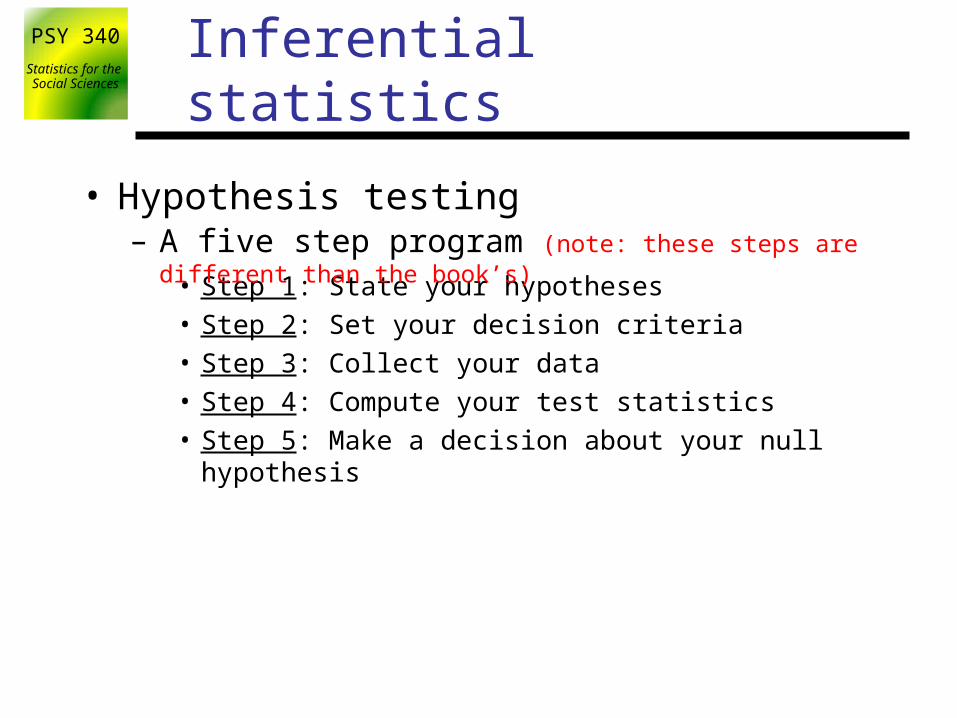
• Hypothesis testing
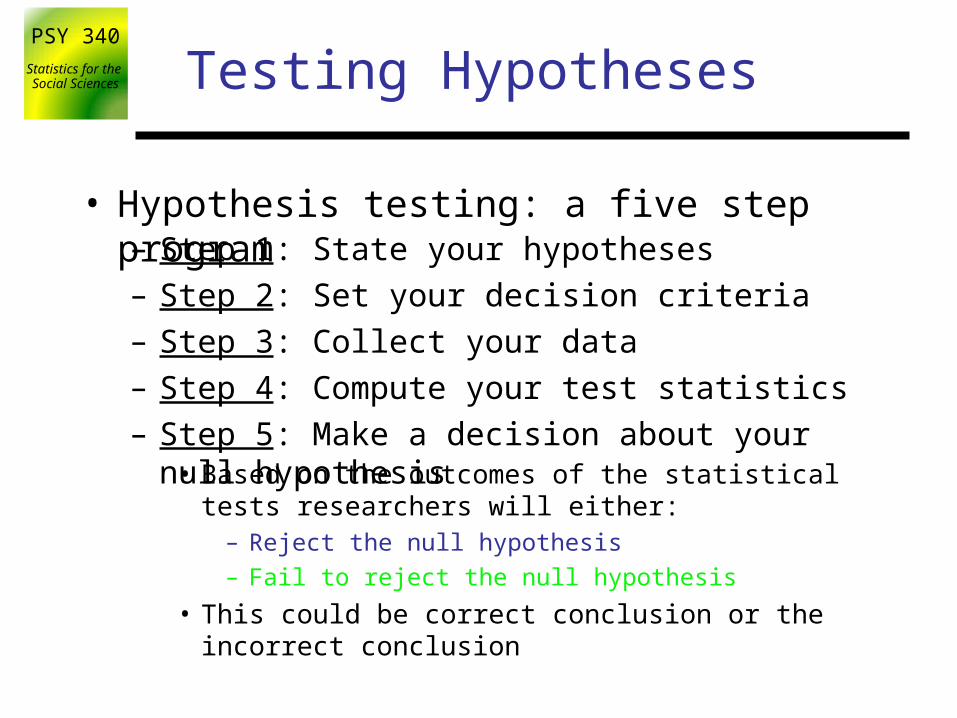
• Step 1: State your hypotheses
• Step 2: Set your decision criteria
• Step 3: Collect your data
• Step 4: Compute your test statistics
• Step 5: Make a decision about your null hypothesis
– A five step program (note: these steps are different than the book’s)

PSY 340Statistics for the
Social Sciences
– Step 1: State your hypotheses: as a research hypothesis and a null hypothesis about the populations
• Null hypothesis (H0)
• Research hypothesis (HA)
Hypothesis testing
• There are no differences between conditions (no effect of treatment)
• Generally, not all groups are equal
This is the one that you test
• Hypothesis testing: a five step program
– You aren’t out to prove the alternative hypothesis
• If you reject the null hypothesis, then you’re left with support for the alternative(s) (NOT proof!)
PSY 340Statistics for the
Social Sciences
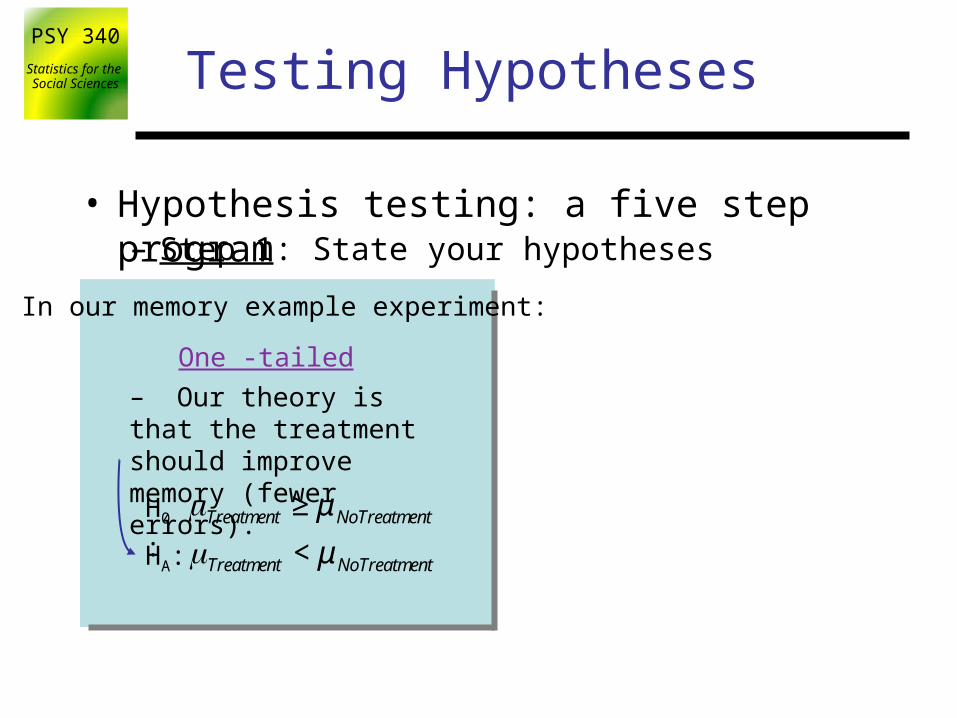
In our memory example experiment:
Testing Hypotheses
H0:
HA:
– Our theory is that the treatment should improve memory (fewer errors).
– Step 1: State your hypotheses
• Hypothesis testing: a five step program
One -tailed
μTreatment ≥ μ NoTreatment
μTreatment < μ NoTreatment

PSY 340Statistics for the
Social Sciences
In our memory example experiment:
Testing Hypotheses
H0:
HA:
– Our theory is that the treatment should improve memory (fewer errors).
– Step 1: State your hypotheses
• Hypothesis testing: a five step program
H0:
HA:
– Our theory is that the treatment has an effect on memory.
One -tailed Two -tailedno direction
specifieddirectionspecified
μTreatment ≥ μ NoTreatment
μTreatment < μ NoTreatment
μTreatment = μ NoTreatment
μTreatment ≠ μ NoTreatment
PSY 340Statistics for the
Social SciencesOne-Tailed and Two-Tailed Hypothesis Tests
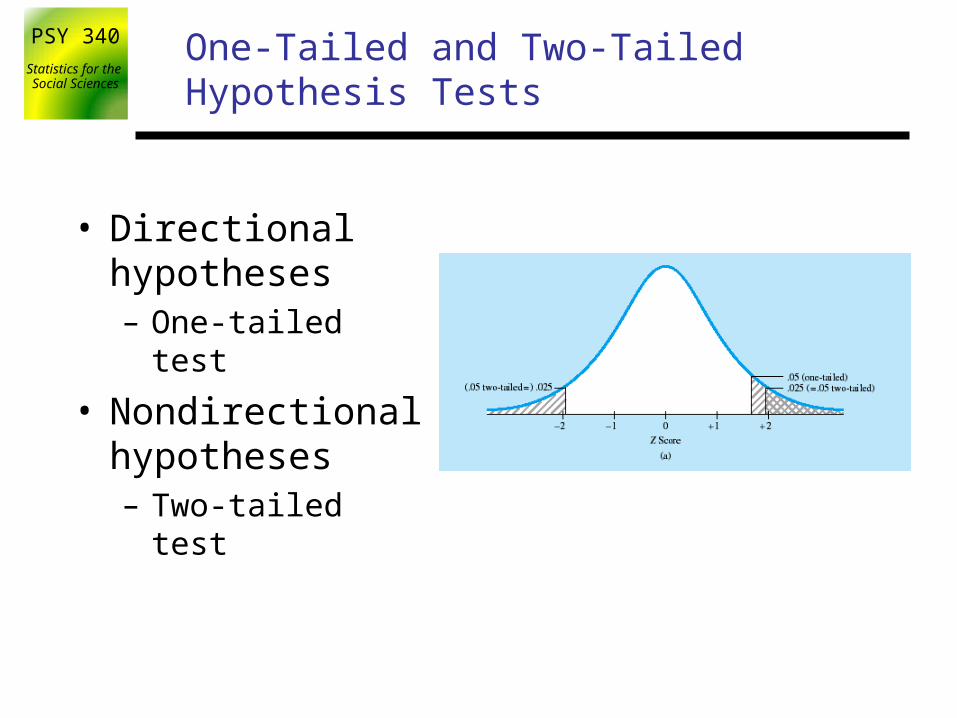
• Directional hypotheses– One-tailed test
• Nondirectional hypotheses– Two-tailed test

PSY 340Statistics for the
Social Sciences Testing Hypotheses
– Step 1: State your hypotheses
– Step 2: Set your decision criteria
• Hypothesis testing: a five step program
• Your alpha (α) level will be your guide for when to reject or fail to reject the null hypothesis.
– Based on the probability of making making an certain type of error
– Essentially this is the process of deciding, in advance of collecting your observations, how big a difference between groups is needed to reject the null hypothesis
PSY 340Statistics for the
Social Sciences Performing your statistical test
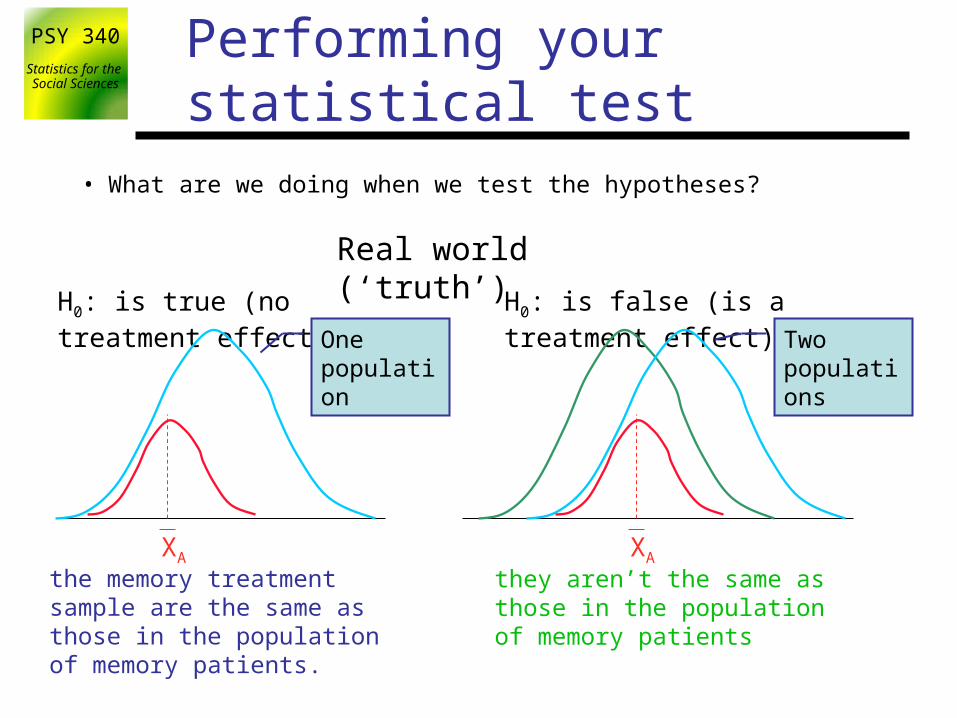
H0: is true (no treatment effect) H0: is false (is a treatment effect)
Two populations
One population
• What are we doing when we test the hypotheses?
Real world (‘truth’)
XA
they aren’t the same as those in the population of memory patients
XA
the memory treatment sample are the same as those in the population of memory patients.

PSY 340Statistics for the
Social Sciences Error types
Real world (‘truth’)
H0 is correct
H0 is wrong
Experimenter’s conclusions
Reject H0
Fail to Reject H0
There really isn’t an effect
One pop
There really isan effect
Two pops

PSY 340Statistics for the
Social Sciences Error types
Real world (‘truth’)
H0 is correct
H0 is wrong
Experimenter’s conclusions
Reject H0
Fail to Reject H0
I conclude that there is an effect
I can’t detect an effect

PSY 340Statistics for the
Social Sciences Error types
Real world (‘truth’)
H0 is correct
H0 is wrong
Experimenter’s conclusions
Reject H0
Fail to Reject H0
Type I error
Type II error
α
β
PSY 340Statistics for the
Social Sciences Error types
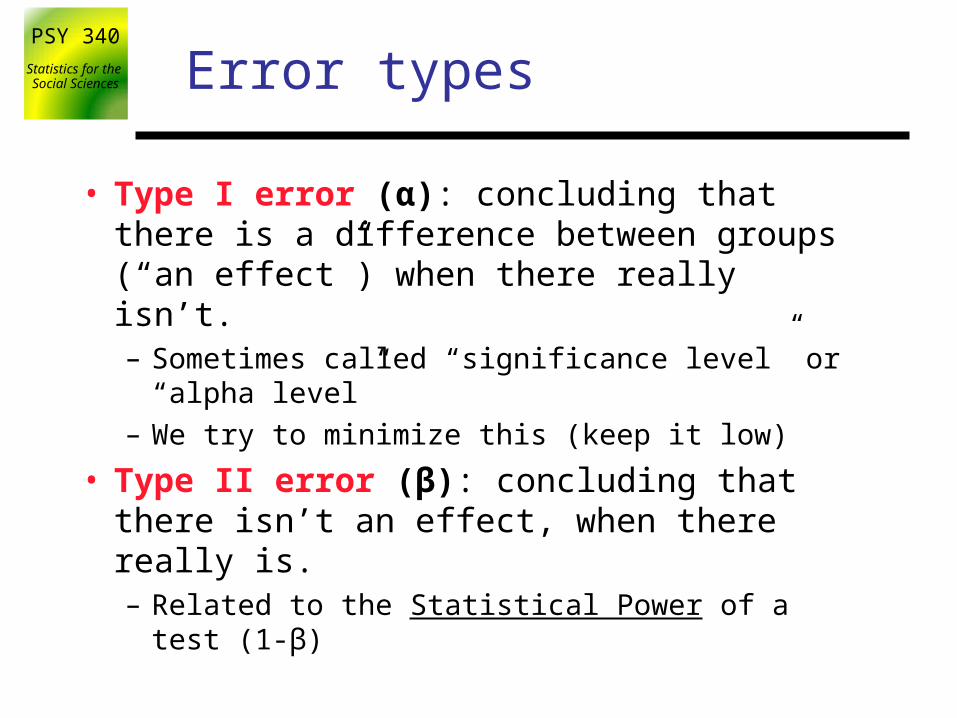
• Type I error (α): concluding that there is a difference between groups (“an effect”) when there really isn’t. – Sometimes called “significance level” or “alpha level”
– We try to minimize this (keep it low)
• Type II error (β): concluding that there isn’t an effect, when there really is.– Related to the Statistical Power of a test (1-β)

PSY 340Statistics for the
Social Sciences Testing Hypotheses
– Step 1: State your hypotheses
– Step 2: Set your decision criteria
– Step 3: Collect your data
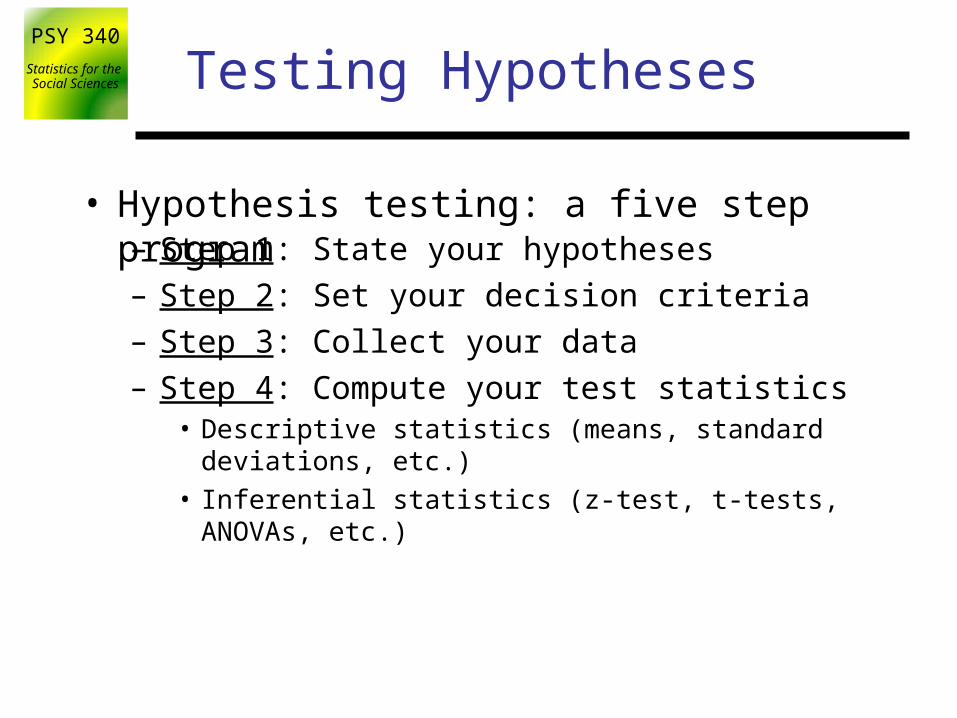
• Hypothesis testing: a five step program
PSY 340Statistics for the
Social Sciences Testing Hypotheses
– Step 1: State your hypotheses
– Step 2: Set your decision criteria
– Step 3: Collect your data
– Step 4: Compute your test statistics
• Hypothesis testing: a five step program
• Descriptive statistics (means, standard deviations, etc.)
• Inferential statistics (z-test, t-tests, ANOVAs, etc.)
PSY 340Statistics for the
Social Sciences Performing your statistical test
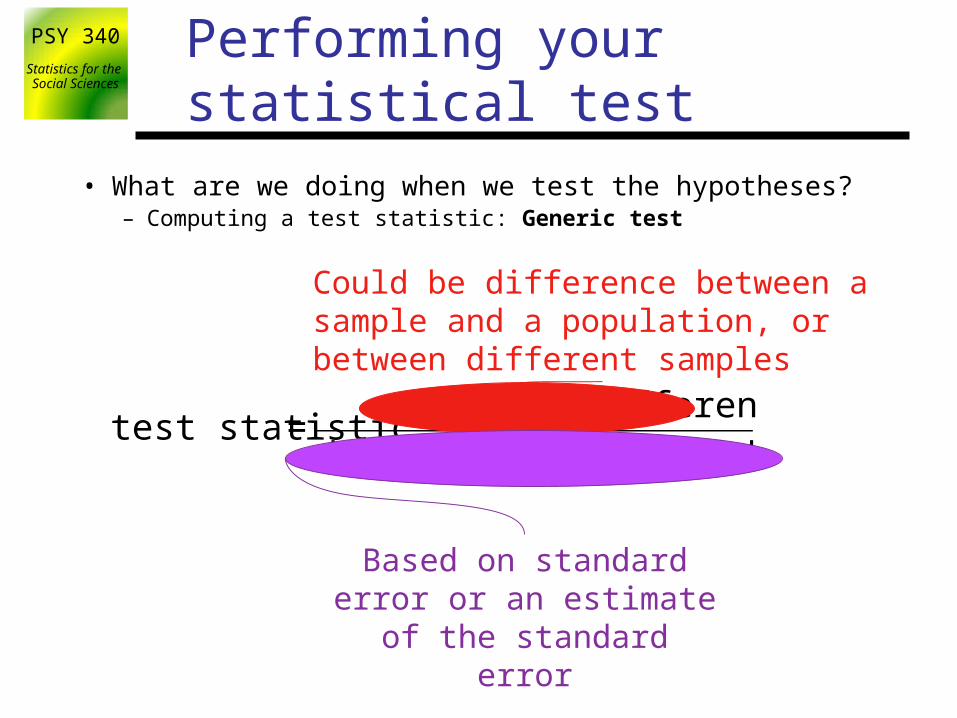
• What are we doing when we test the hypotheses?– Computing a test statistic: Generic test
€
test statistic =observed difference
difference expected by chance
Could be difference between a sample and a population, or between different samples
Based on standard error or an estimate of the standard error
PSY 340Statistics for the
Social Sciences Distribution of sample means
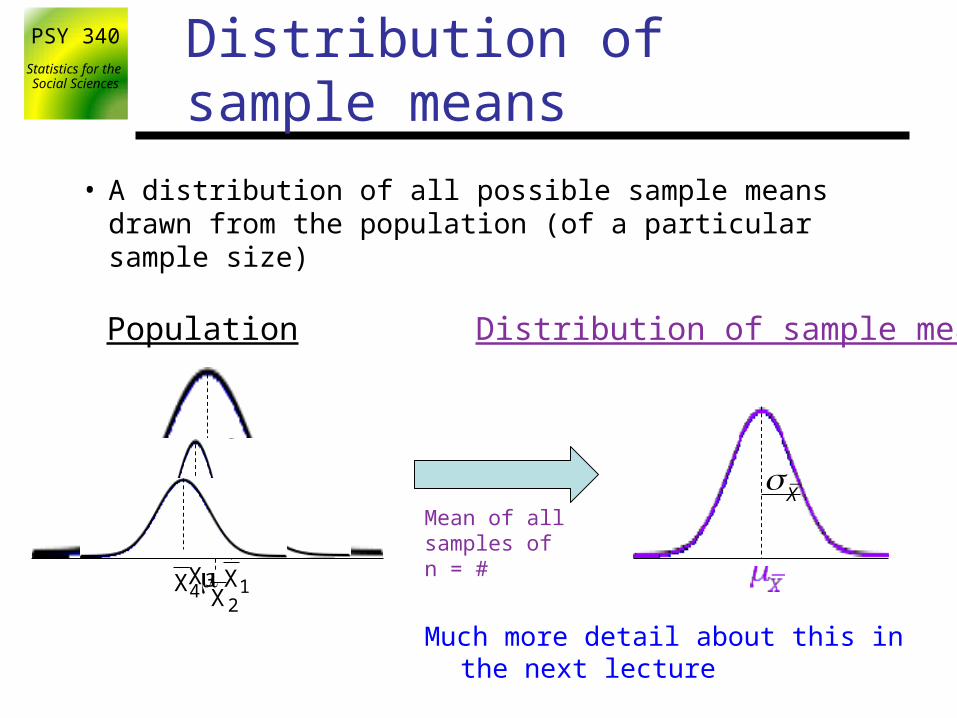
• A distribution of all possible sample means drawn from the population (of a particular sample size)
Population
σ
μ
Distribution of sample means
€
σX
X1X2
X3X4
Mean of all samples of n = #
Much more detail about this in the next lecture

PSY 340Statistics for the
Social Sciences “Generic” statistical test
• The generic test statistic distribution (a transformation of the distribution of sample means)– To reject the H0, you want a computed test statistics that is large– What’s large enough?
• The alpha level gives us the decision criterion
Distribution of the test statistic
α-level determines where these boundaries go
Distribution of sample means
€
σX
Transform to using statistical test
PSY 340Statistics for the
Social Sciences Testing Hypotheses
– Step 1: State your hypotheses
– Step 2: Set your decision criteria
– Step 3: Collect your data
– Step 4: Compute your test statistics
– Step 5: Make a decision about your null hypothesis
• Hypothesis testing: a five step program
• Based on the outcomes of the statistical tests researchers will either:
– Reject the null hypothesis
– Fail to reject the null hypothesis
• This could be correct conclusion or the incorrect conclusion

PSY 340Statistics for the
Social Sciences “Generic” statistical test
If test statistic is here Reject H0
If test statistic is here Fail to reject H0
Distribution of the test statistic
• The generic test statistic distribution (think of this as the distribution of sample means)– To reject the H0, you want a computed test statistics that is large– What’s large enough?
• The alpha level gives us the decision criterion
PSY 340Statistics for the
Social Sciences “Generic” statistical test
Reject H0
Fail to reject H0
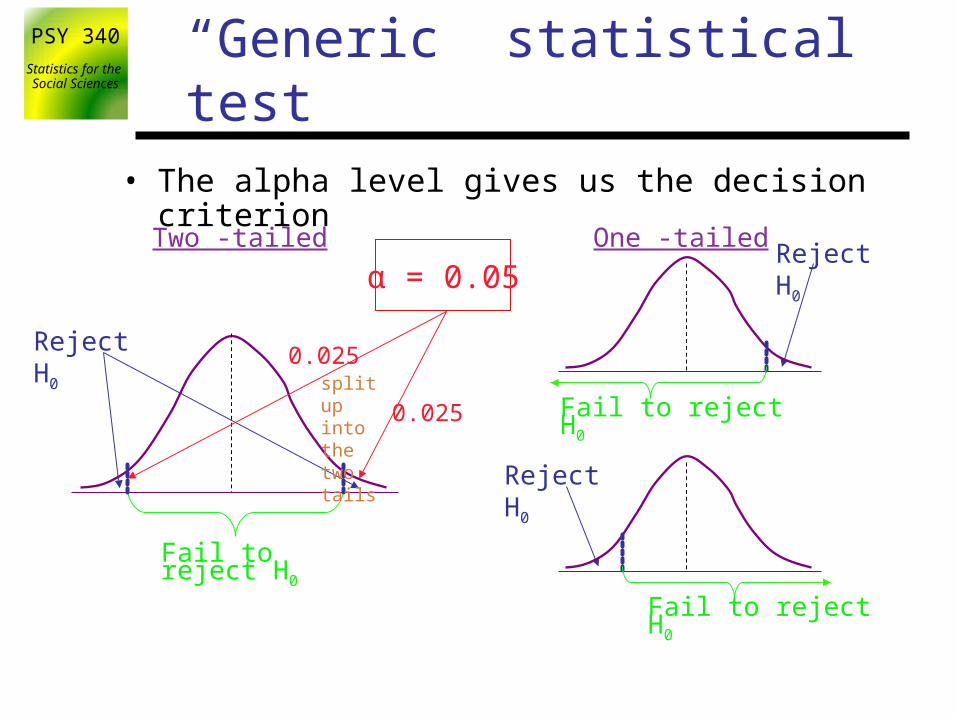
• The alpha level gives us the decision criterion
One -tailedTwo -tailedReject H0
Fail to reject H0
Reject H0
Fail to reject H0
α = 0.05
0.025
0.025split up into the two tails

PSY 340Statistics for the
Social Sciences “Generic” statistical test
Reject H0
Fail to reject H0
• The alpha level gives us the decision criterion
One -tailedTwo -tailedReject H0
Fail to reject H0
Reject H0
Fail to reject H0
α = 0.050.05
all of it in one tail

PSY 340Statistics for the
Social Sciences “Generic” statistical test
Reject H0
Fail to reject H0
• The alpha level gives us the decision criterion
One -tailedTwo -tailedReject H0
Fail to reject H0
Reject H0
Fail to reject H0
α = 0.05
0.05
all of it in one tail
PSY 340Statistics for the
Social Sciences “Generic” statistical test
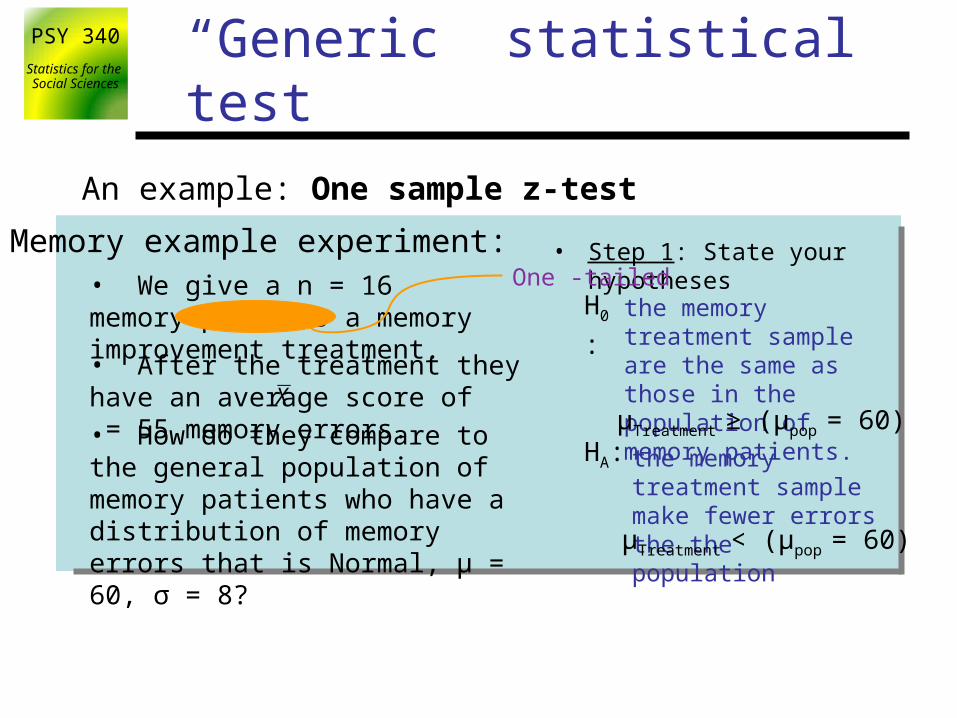
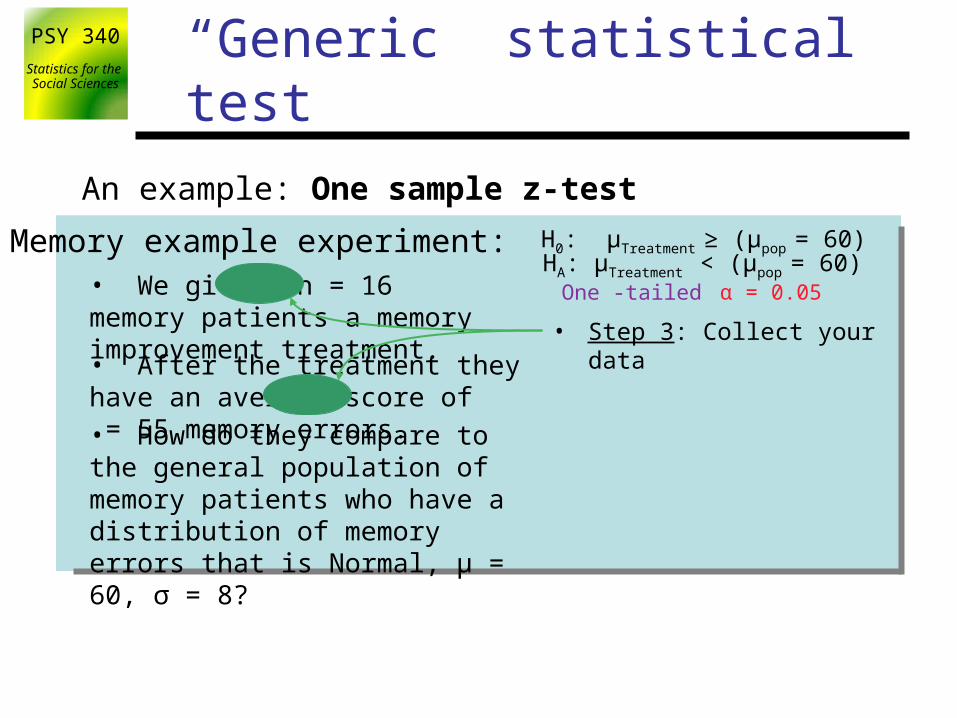
An example: One sample z-test
Memory example experiment:• We give a n = 16 memory patients a memory improvement treatment.
• How do they compare to the general population of memory patients who have a distribution of memory errors that is Normal, μ = 60, σ = 8?
• After the treatment they have an average score of = 55 memory errors.
€
X
• Step 1: State your hypotheses
H0: the memory treatment sample are the same as those in the population of memory patients.
HA: the memory treatment sample make fewer errors the the population
μTreatment ≥ (μpop = 60)
μTreatment < (μpop = 60)
One -tailed
PSY 340Statistics for the
Social Sciences “Generic” statistical test
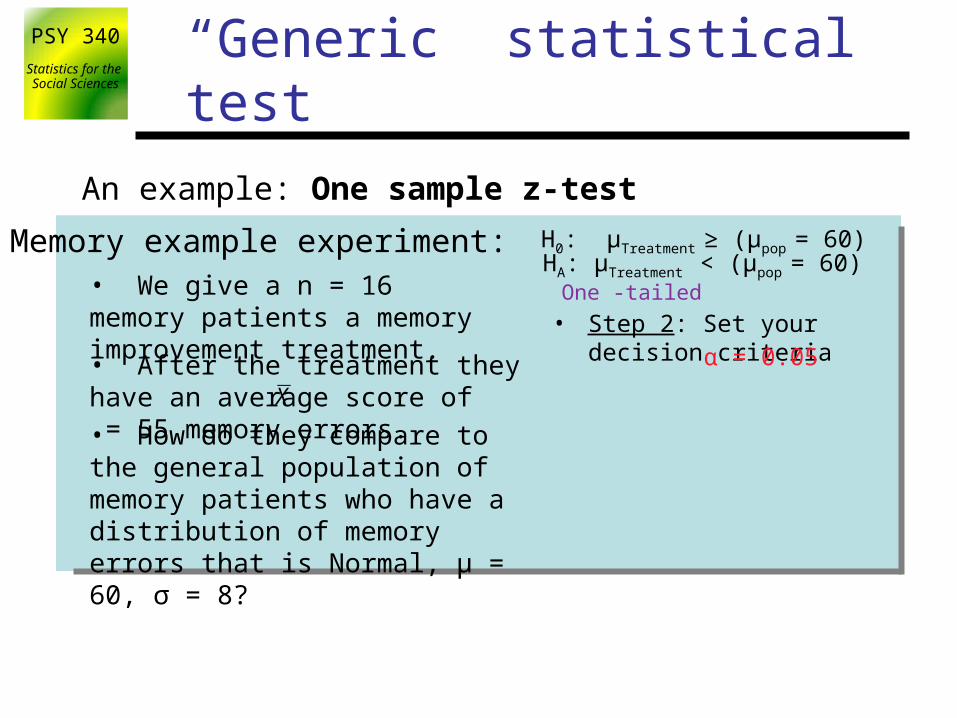
An example: One sample z-test
Memory example experiment:• We give a n = 16 memory patients a memory improvement treatment.
• How do they compare to the general population of memory patients who have a distribution of memory errors that is Normal, μ = 60, σ = 8?
• After the treatment they have an average score of = 55 memory errors.
€
X
• Step 2: Set your decision criteria
H0: μTreatment ≥ (μpop = 60) HA: μTreatment < (μpop = 60)
α = 0.05
One -tailed
PSY 340Statistics for the
Social Sciences “Generic” statistical test
An example: One sample z-test
Memory example experiment:• We give a n = 16 memory patients a memory improvement treatment.
• How do they compare to the general population of memory patients who have a distribution of memory errors that is Normal, μ = 60, σ = 8?
• After the treatment they have an average score of = 55 memory errors.
€
X
α = 0.05One -tailed
• Step 3: Collect your data
H0: μTreatment ≥ (μpop = 60) HA: μTreatment < (μpop = 60)
PSY 340Statistics for the
Social Sciences “Generic” statistical test
An example: One sample z-test
Memory example experiment:• We give a n = 16 memory patients a memory improvement treatment.
• How do they compare to the general population of memory patients who have a distribution of memory errors that is Normal, μ = 60, σ = 8?
• After the treatment they have an average score of = 55 memory errors.
€
X
α = 0.05One -tailed
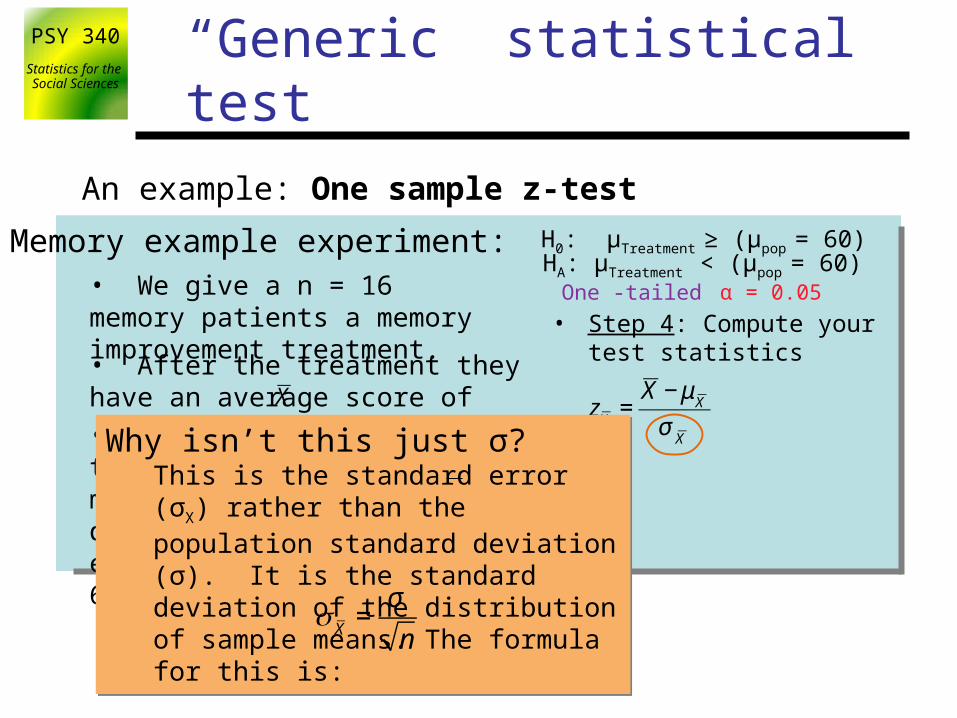
• Step 4: Compute your test statistics
€
zX
=X − μ
X
σX Why isn’t this just σ?
This is the standard error (σX) rather than the population standard deviation (σ). It is the standard deviation of the distribution of sample means. The formula for this is:
We will cover in detail in the next lecture.
Why isn’t this just σ? This is the standard error (σX) rather than the population standard deviation (σ). It is the standard deviation of the distribution of sample means. The formula for this is:
We will cover in detail in the next lecture.
σ X =σ
n
H0: μTreatment ≥ (μpop = 60) HA: μTreatment < (μpop = 60)
PSY 340Statistics for the
Social Sciences “Generic” statistical test
An example: One sample z-test
Memory example experiment:• We give a n = 16 memory patients a memory improvement treatment.
• How do they compare to the general population of memory patients who have a distribution of memory errors that is Normal, μ = 60, σ = 8?
• After the treatment they have an average score of = 55 memory errors.
€
X
α = 0.05One -tailed
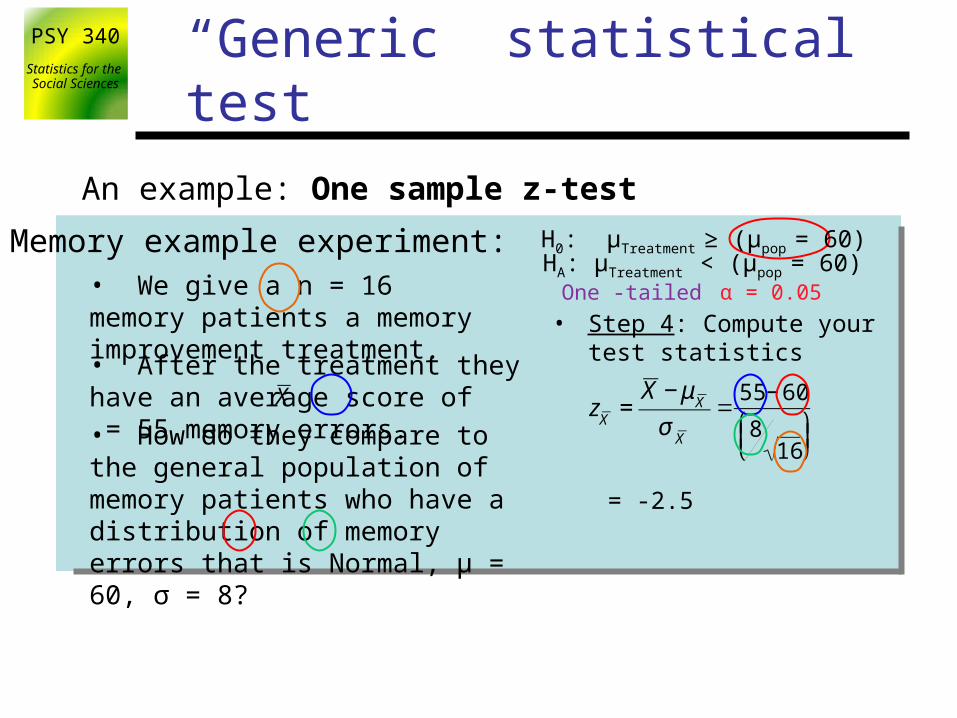
• Step 4: Compute your test statistics
€
zX
=X − μ
X
σX
€
=55 − 60
816
⎛ ⎝ ⎜
⎞ ⎠ ⎟
= -2.5
H0: μTreatment ≥ (μpop = 60) HA: μTreatment < (μpop = 60)
PSY 340Statistics for the
Social Sciences “Generic” statistical test
An example: One sample z-test
Memory example experiment:• We give a n = 16 memory patients a memory improvement treatment.
• How do they compare to the general population of memory patients who have a distribution of memory errors that is Normal, μ = 60, σ = 8?
• After the treatment they have an average score of = 55 memory errors.
€
X
α = 0.05One -tailed
€
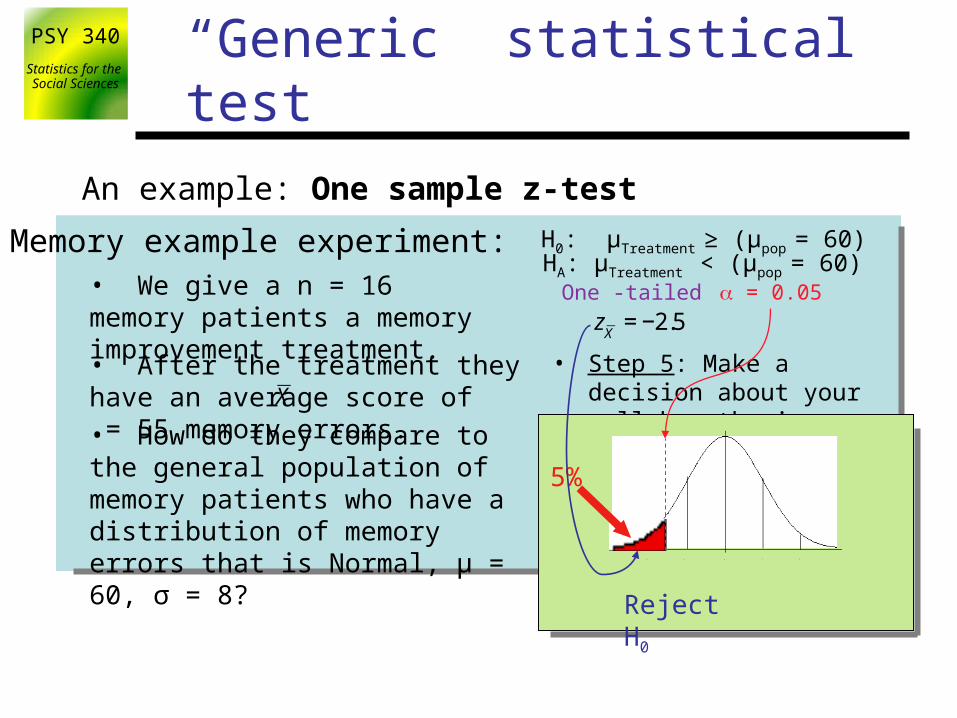
zX
= −2.5
• Step 5: Make a decision about your null hypothesis
μ-1-2 1 2
5%
Reject H0
H0: μTreatment ≥ (μpop = 60) HA: μTreatment < (μpop = 60)
PSY 340Statistics for the
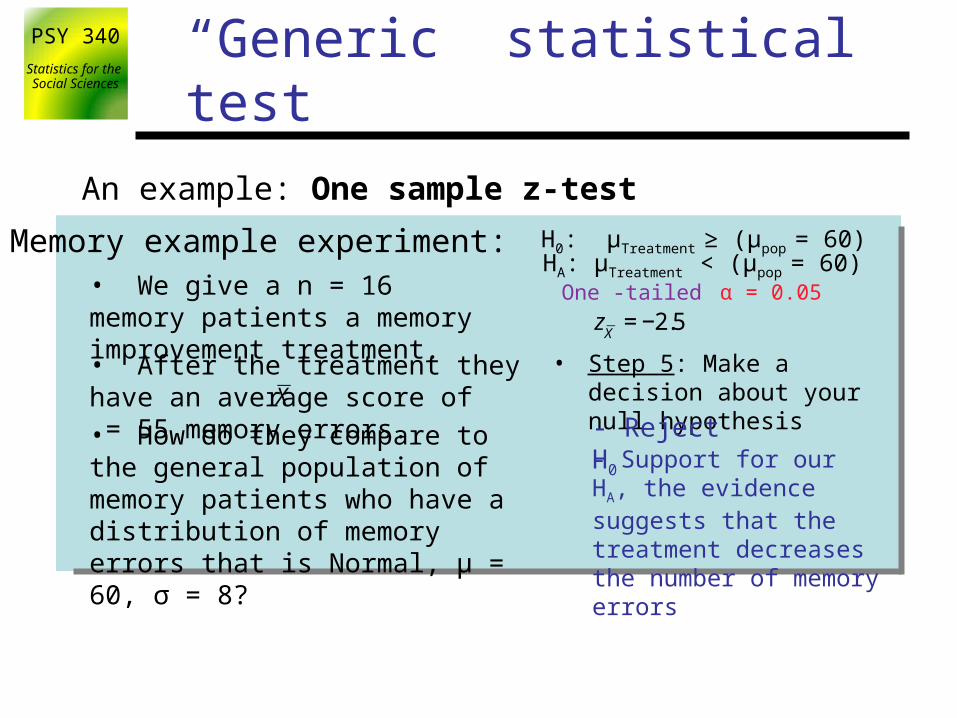
Social Sciences “Generic” statistical test
An example: One sample z-test
Memory example experiment:• We give a n = 16 memory patients a memory improvement treatment.
• How do they compare to the general population of memory patients who have a distribution of memory errors that is Normal, μ = 60, σ = 8?
• After the treatment they have an average score of = 55 memory errors.
€
X
α = 0.05One -tailed
€
zX
= −2.5
• Step 5: Make a decision about your null hypothesis
- Reject H0
- Support for our HA, the evidence suggests that the treatment decreases the number of memory errors
H0: μTreatment ≥ (μpop = 60) HA: μTreatment < (μpop = 60)