statistics for the social sciences psychology 340 spring 2005 sampling distribution
Post on 19-Dec-2015
212 views
TRANSCRIPT

Statistics for the Social Sciences
Psychology 340Spring 2005
Sampling distribution

Statistics for the Social Sciences
Outline
• Review 138 stuff: – What are sample distributions– Central limit theorem– Standard error (and estimates of)– Test statistic distributions as transformations
Statistics for the Social Sciences
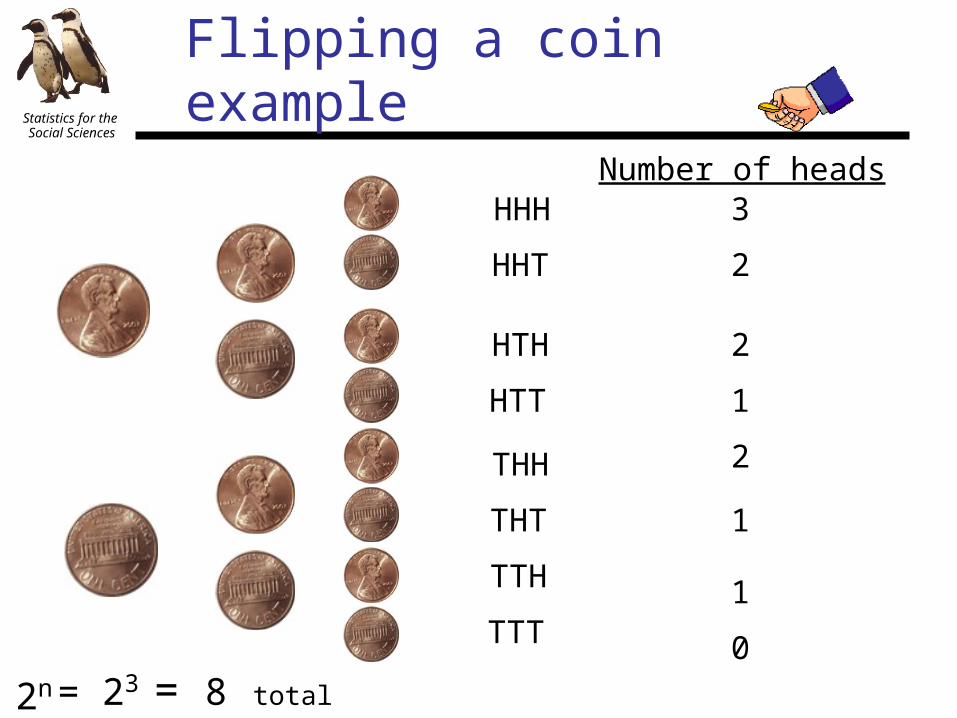
Flipping a coin example
HHH
HHT
HTH
HTT
THH
THT
TTH
TTT
Number of heads3
2
1
0
2
2
1
1
2n= 23 = 8 total outcomes
Statistics for the Social Sciences
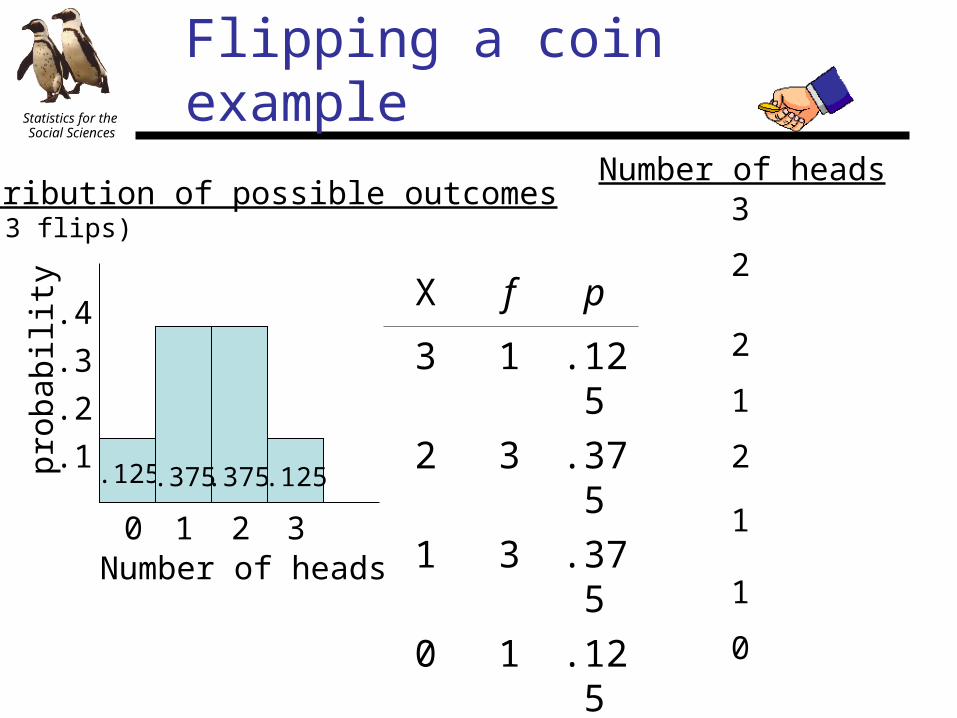
Flipping a coin example
Number of heads3
2
1
0
2
2
1
1
X f p
3 1 .125
2 3 .375
1 3 .375
0 1 .125
Number of heads0 1 2 3
.1
.2
.3
.4
probability
.125 .125.375.375
Distribution of possible outcomes(n = 3 flips)

Statistics for the Social Sciences
Hypothesis testing
Can make predictions about likelihood of outcomes based on this distribution.
Distribution of possible outcomes(of a particular sample size, n)
• In hypothesis testing, we compare our observed samples with the distribution of possible samples (transformed into standardized distributions)
• This distribution of possible outcomes is often Normally Distributed
Statistics for the Social Sciences
Distribution of sample means
• Comparison distributions considered so far were distributions of individual scores
• Mean of a group of scores– Comparison distribution is distribution of means
Statistics for the Social Sciences
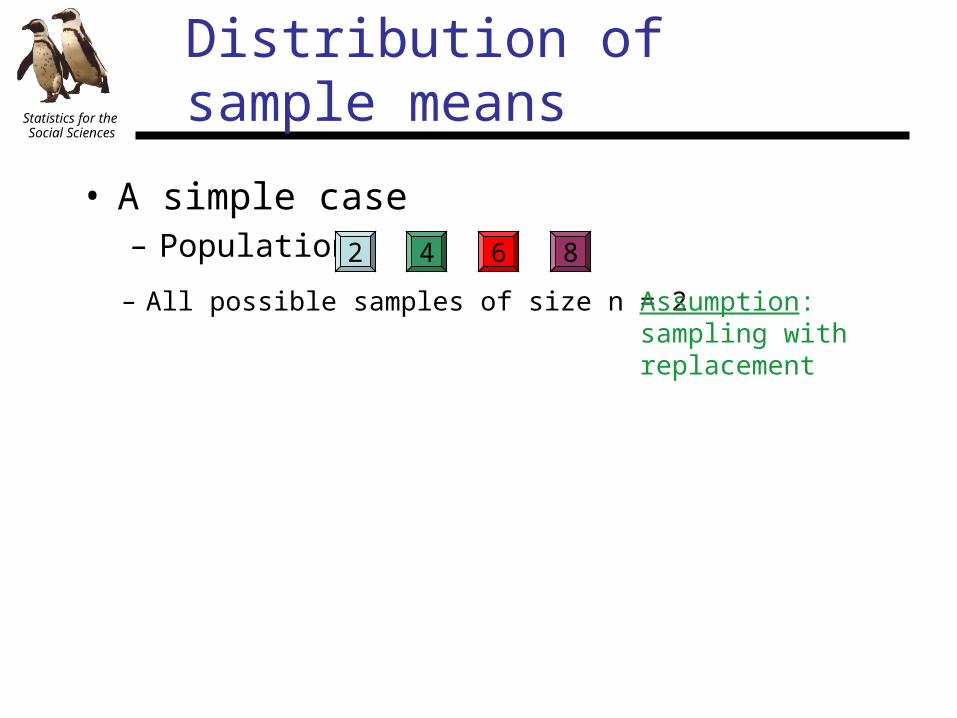
Distribution of sample means
• A simple case– Population:
– All possible samples of size n = 2
2 4 6 8
Assumption: sampling with replacement
Statistics for the Social Sciences
Distribution of sample means
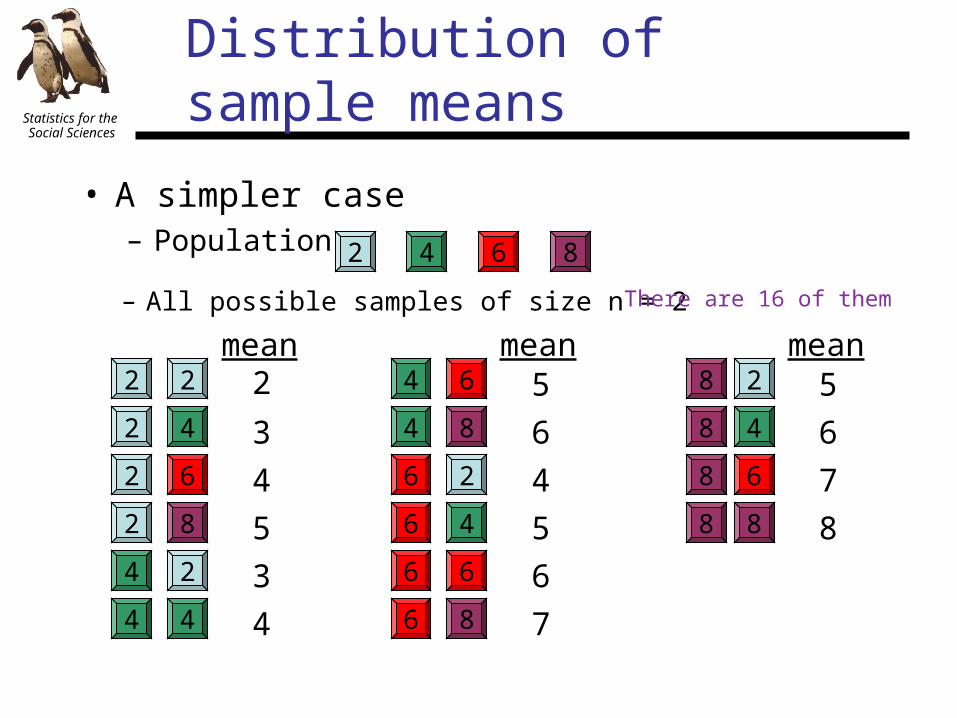
• A simpler case– Population:
– All possible samples of size n = 2
2 4 6 8
2
4
62
2
82
2
4 4
4
6
8
28
8
8
8
84
64
6
6
6
6
4
6
8
2
4 2
mean mean mean2
3
4
5
3
4
5
6
4
5
6
7
5
6
7
8
There are 16 of them

Statistics for the Social Sciences
Distribution of sample means
2
4
6
8
2
4
6
8
2
4 6
2
6
2
6
4 6
4
6
8
28
8
8
8
4
4
4
6
8
2
2
mean mean mean2
3
4
5
3
4
5
6
4
5
6
7
5
6
7
8
means2 3 4 5 6 7 8
5
234
1
In long run, the random selection of tiles leads to a predictable pattern
Statistics for the Social Sciences
Distribution of sample means
means2 3 4 5 6 7 8
5
234
1
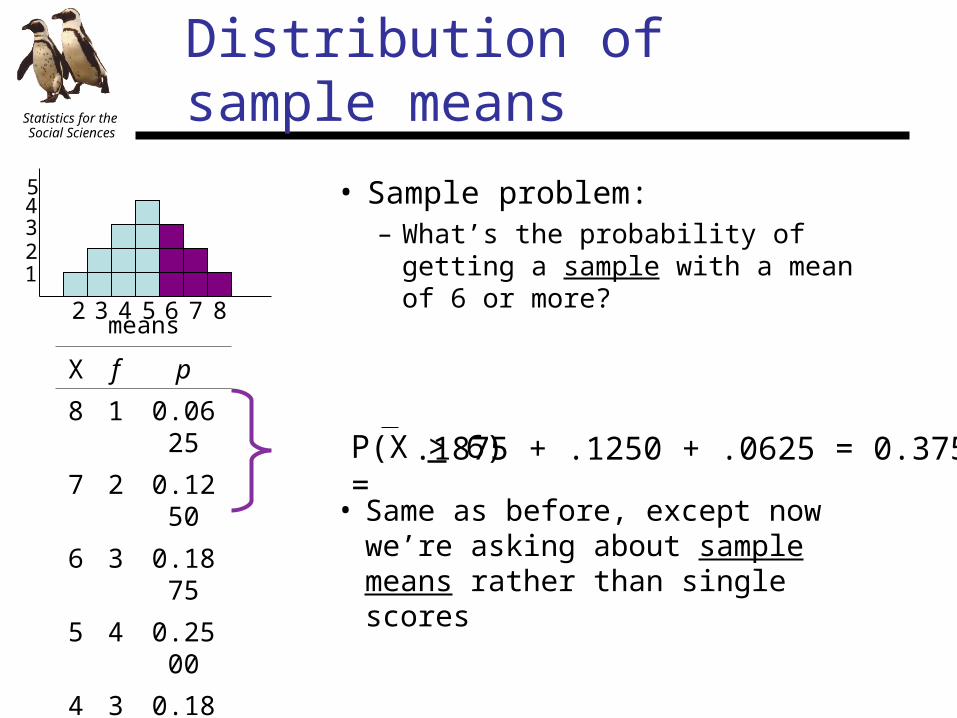
X f p
8 1 0.0625
7 2 0.1250
6 3 0.1875
5 4 0.2500
4 3 0.1875
3 2 0.1250
2 1 0.0625
• Sample problem:– What’s the probability of getting a sample with a mean of 6 or more?
P(X > 6) =
.1875 + .1250 + .0625 = 0.375
• Same as before, except now we’re asking about sample means rather than single scores

Statistics for the Social Sciences
Distribution of sample means
• Distribution of sample means is a “virtual” distribution between the sample and population
PopulationDistribution of sample meansSample
Statistics for the Social Sciences
Properties of the distribution of sample means
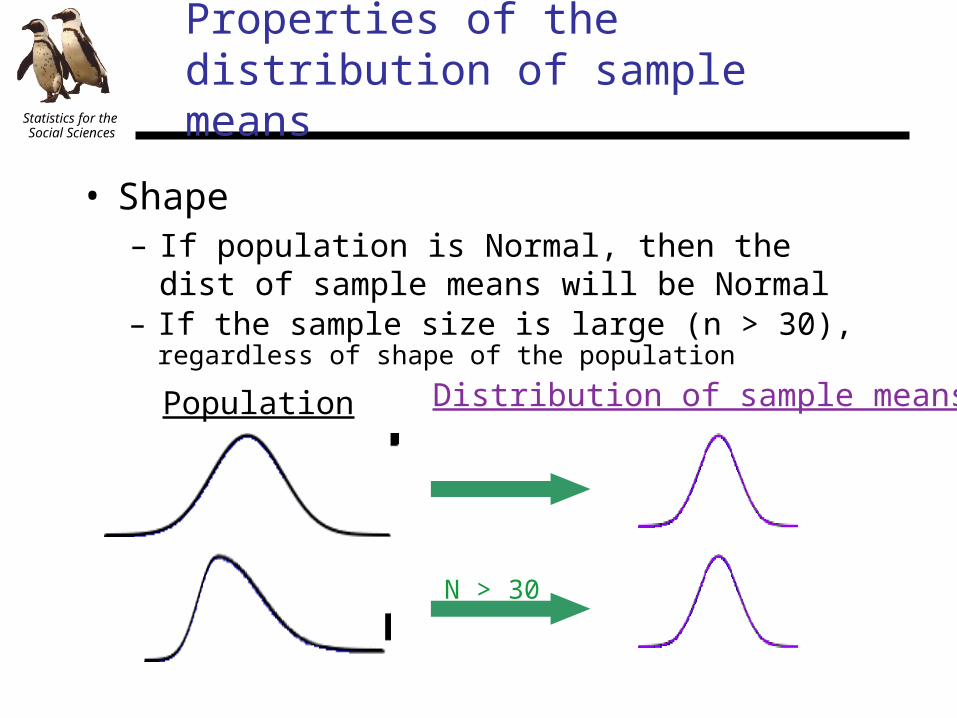
• Shape– If population is Normal, then the dist of sample means will be Normal
Population Distribution of sample means
N > 30
– If the sample size is large (n > 30), regardless of shape of the population
Statistics for the Social Sciences
Properties of the distribution of sample means
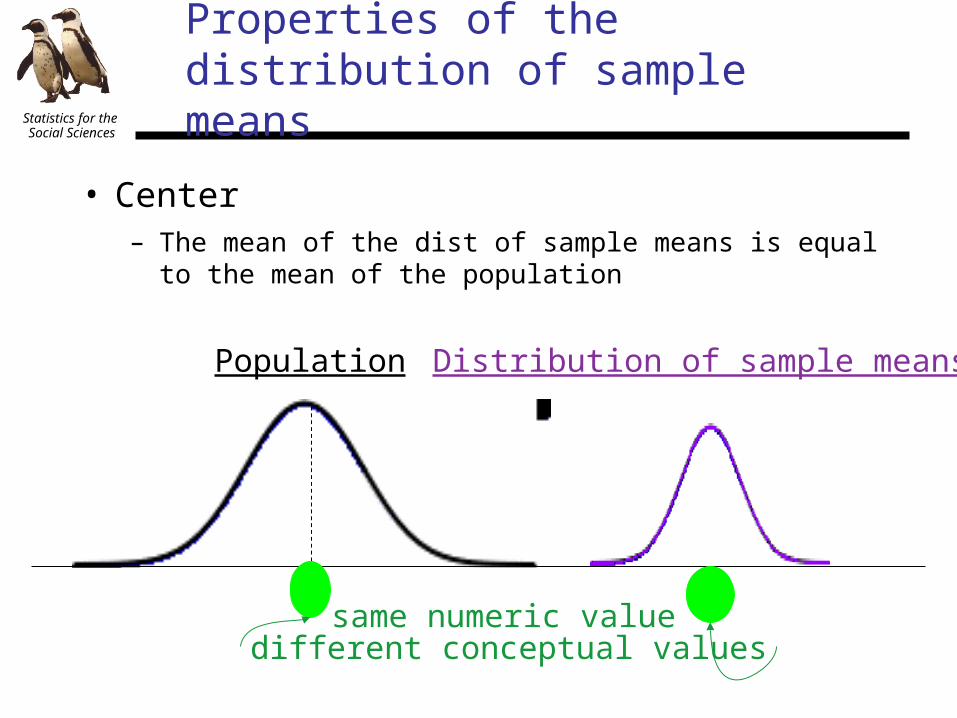
– The mean of the dist of sample means is equal to the mean of the population
Population Distribution of sample means
€
μsame numeric value
different conceptual values
• Center

Statistics for the Social Sciences
Properties of the distribution of sample means
• Center– The mean of the dist of sample means is equal to the mean of the population
– Consider our earlier example
2 4 6 8
Population
μ =2 + 4 + 6 + 84= 5
Distribution of sample means
means2 3 4 5 6 7 8
5
234
1
2+3+4+5+3+4+5+6+4+5+6+7+5+6+7+816
=
= 5
Statistics for the Social Sciences
Properties of the distribution of sample means
• Spread– The standard deviation of the distribution of sample mean depends on two things• Standard deviation of the population• Sample size

Statistics for the Social Sciences
Properties of the distribution of sample means
• Spread• Standard deviation of the population
μX1X2
X3 μX1X2
X3
• The smaller the population variability, the closer the sample means are to the population mean
Statistics for the Social Sciences
Properties of the distribution of sample means
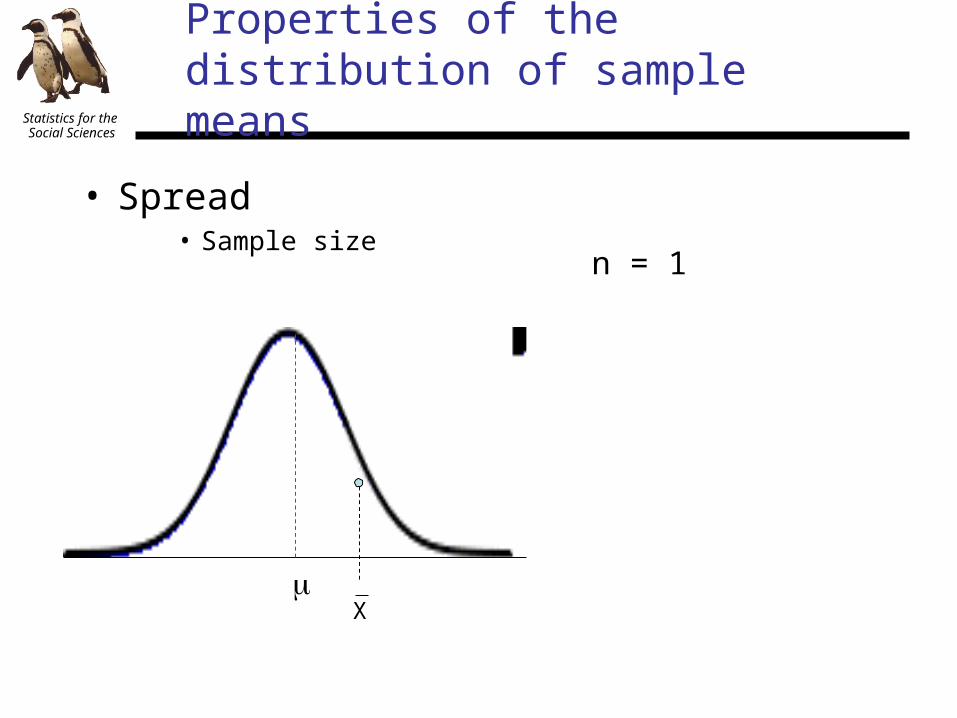
• Spread• Sample size
μ
n = 1
X

Statistics for the Social Sciences
Properties of the distribution of sample means
• Spread• Sample size
μ
n = 10
X
Statistics for the Social Sciences
Properties of the distribution of sample means
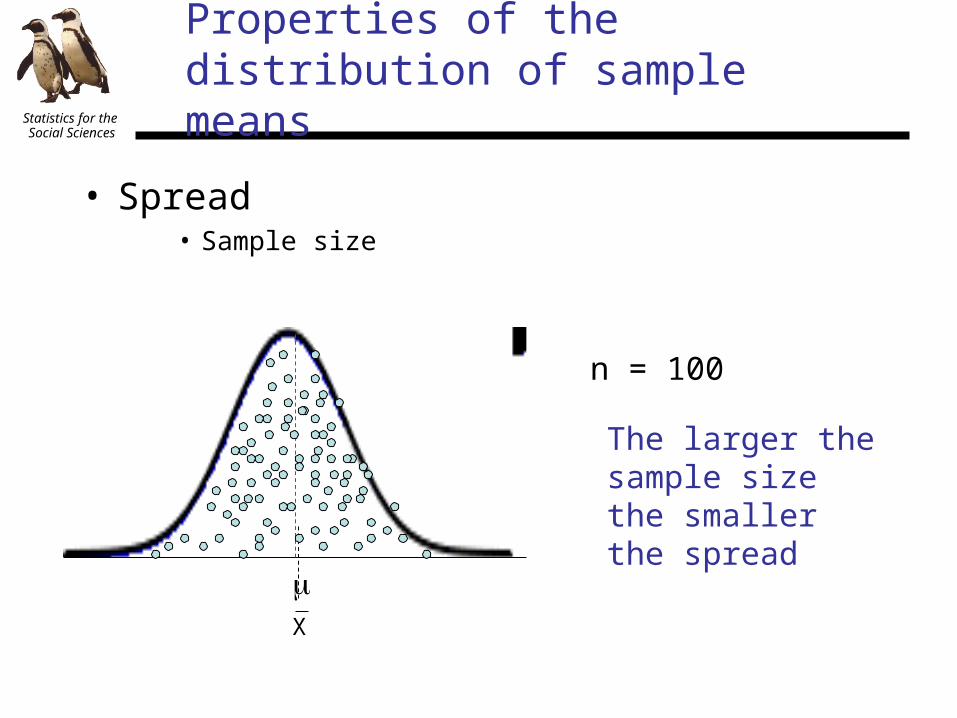
• Spread• Sample size
μ
n = 100
X
The larger the sample size the smaller the spread
Statistics for the Social Sciences
Properties of the distribution of sample means
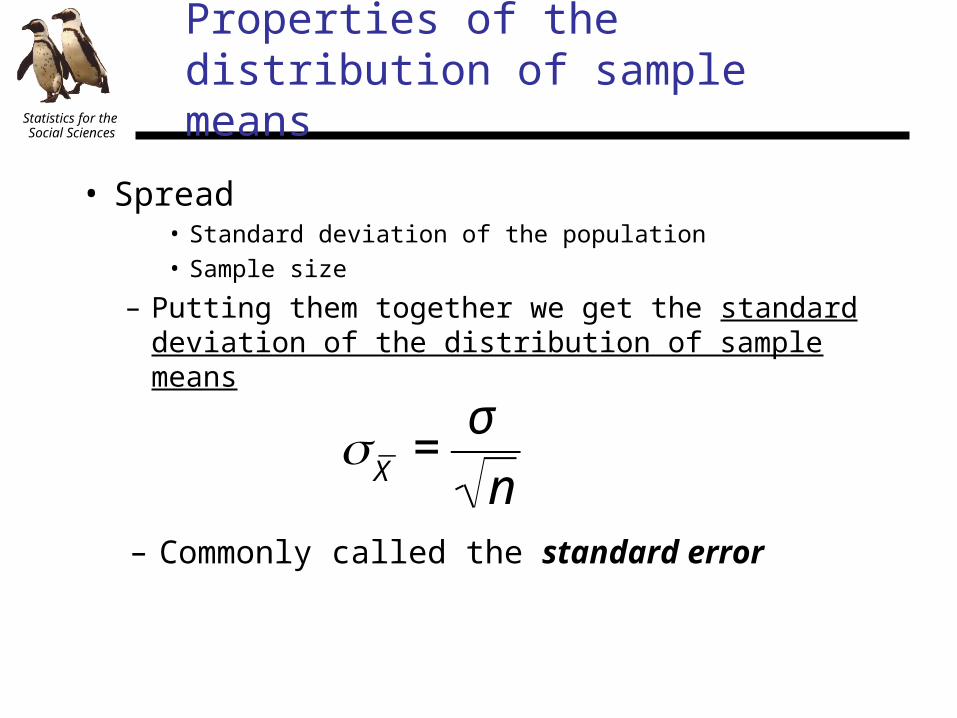
• Spread• Standard deviation of the population• Sample size
– Putting them together we get the standard deviation of the distribution of sample means
€
σX
=σ
n– Commonly called the standard error

Statistics for the Social Sciences
Standard error
• The standard error is the average amount that you’d expect a sample (of size n) to deviate from the population mean– In other words, it is an estimate of the error that you’d expect by chance (or by sampling)

Statistics for the Social Sciences
Distribution of sample means
• Keep your distributions straight by taking care with your notation
Sample
s
X
Population
σ
μ
Distribution of sample means
€
σX
Statistics for the Social Sciences
Properties of the distribution of sample means
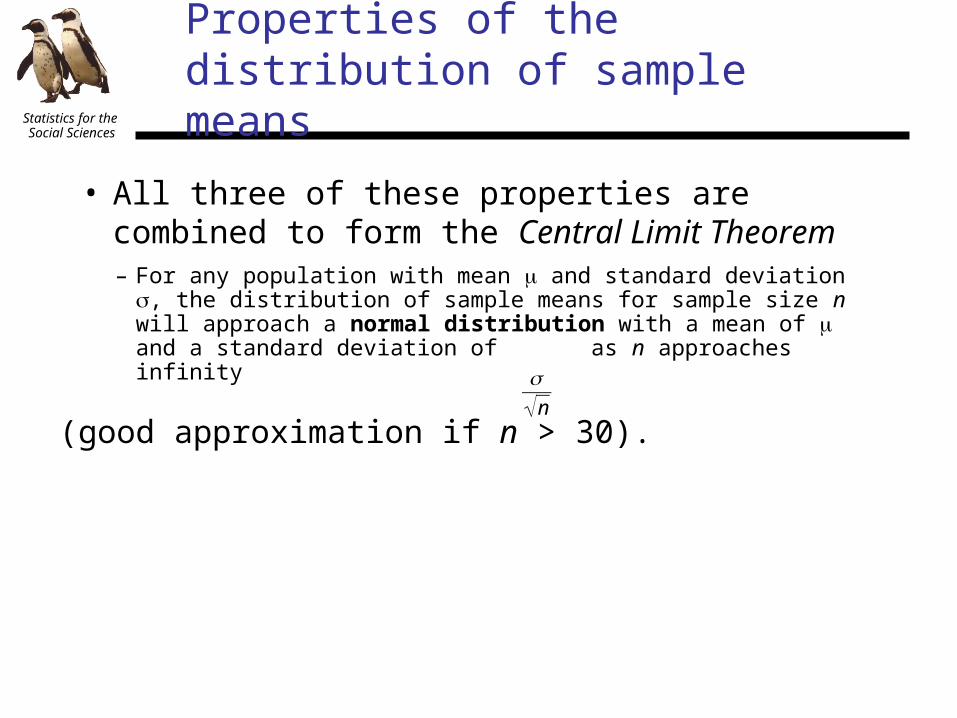
• All three of these properties are combined to form the Central Limit Theorem
– For any population with mean μ and standard deviation σ, the distribution of sample means for sample size n will approach a normal distribution with a mean of μ and a standard deviation of as n approaches infinity
€
σn
(good approximation if n > 30).

Statistics for the Social Sciences
Performing your statistical test
• What are we doing when we test the hypotheses?– Computing a test statistic: Generic test
€
test statistic =observed difference
difference expected by chance
Could be difference between a sample and a population, or between different samples
Based on standard error or an estimate
of the standard error

Statistics for the Social Sciences
Hypothesis Testing With a Distribution of Means
• It is the comparison distribution when a sample has more than one individual
• Find a Z score of your sample’s mean on a distribution of means
Z =(X−μX )
σ X
Statistics for the Social Sciences
“Generic” statistical test
An example: One sample z-test
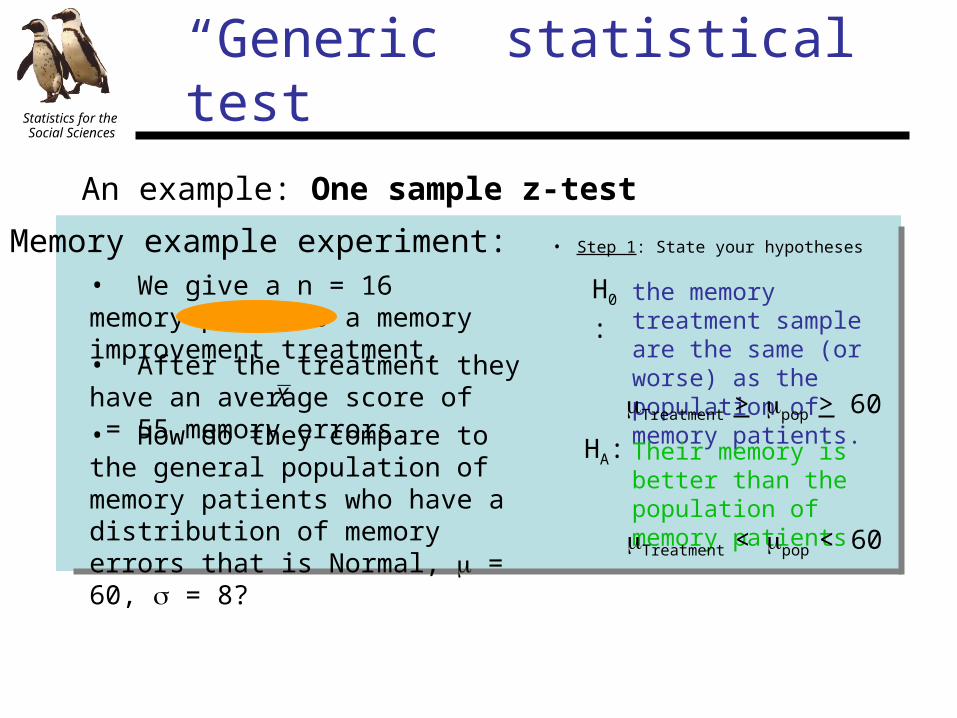
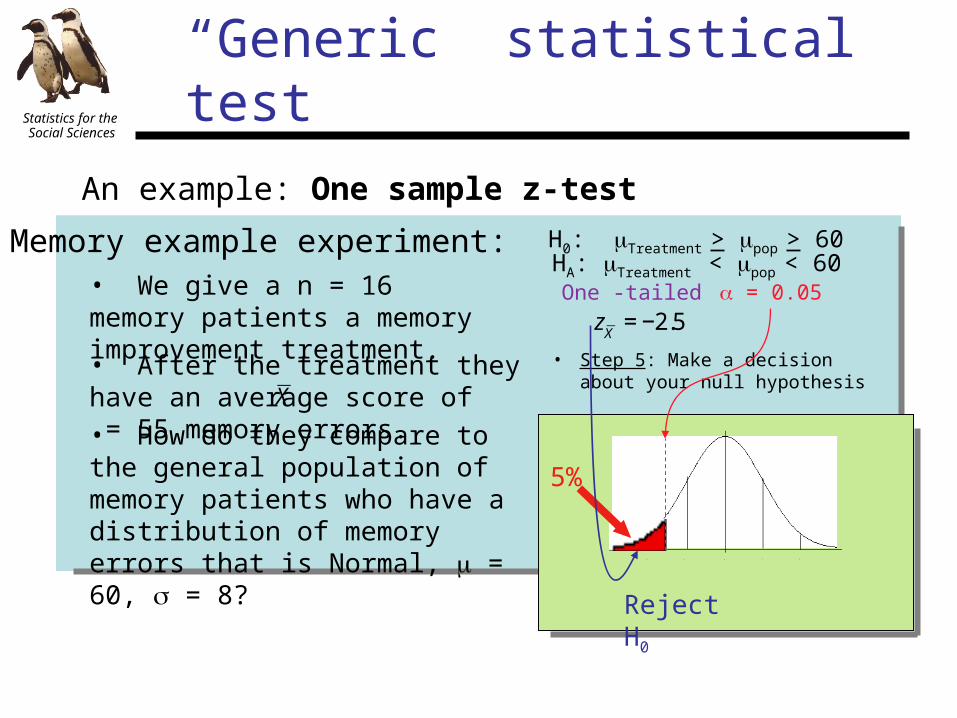
Memory example experiment:• We give a n = 16 memory patients a memory improvement treatment.
• How do they compare to the general population of memory patients who have a distribution of memory errors that is Normal, μ = 60, σ = 8?
• After the treatment they have an average score of = 55 memory errors.
€
X
• Step 1: State your hypotheses
H0
:the memory treatment sample are the same (or worse) as the population of memory patients.HA: Their memory is better than the population of memory patients
μTreatment > μpop > 60
μTreatment < μpop < 60
Statistics for the Social Sciences
“Generic” statistical test
An example: One sample z-test
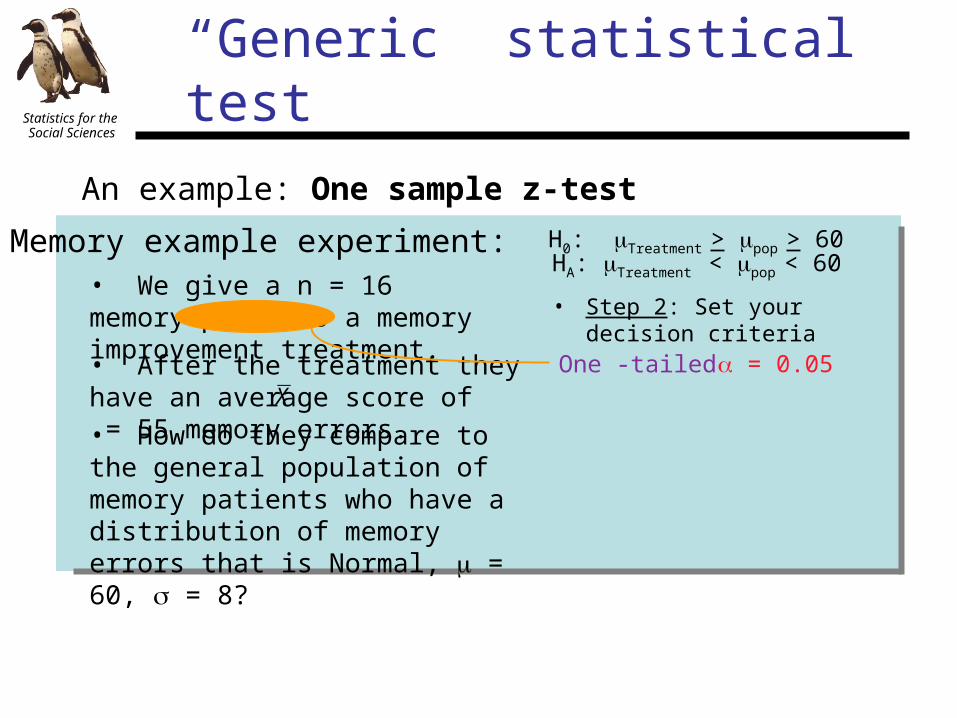
Memory example experiment:• We give a n = 16 memory patients a memory improvement treatment.
• How do they compare to the general population of memory patients who have a distribution of memory errors that is Normal, μ = 60, σ = 8?
• After the treatment they have an average score of = 55 memory errors.
€
X
• Step 2: Set your decision criteria
H0: μTreatment > μpop > 60 HA: μTreatment < μpop < 60
= 0.05One -tailed
Statistics for the Social Sciences
“Generic” statistical test
An example: One sample z-test
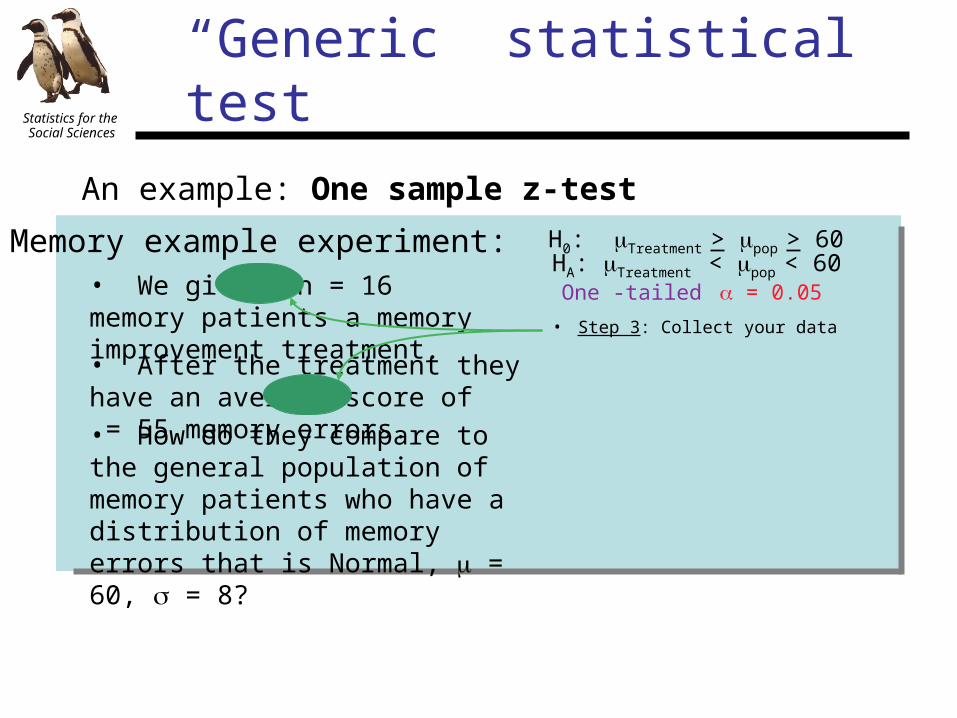
Memory example experiment:• We give a n = 16 memory patients a memory improvement treatment.
• How do they compare to the general population of memory patients who have a distribution of memory errors that is Normal, μ = 60, σ = 8?
• After the treatment they have an average score of = 55 memory errors.
€
X
= 0.05One -tailed
• Step 3: Collect your data
H0: μTreatment > μpop > 60 HA: μTreatment < μpop < 60

Statistics for the Social Sciences
“Generic” statistical test
An example: One sample z-test
Memory example experiment:• We give a n = 16 memory patients a memory improvement treatment.
• How do they compare to the general population of memory patients who have a distribution of memory errors that is Normal, μ = 60, σ = 8?
• After the treatment they have an average score of = 55 memory errors.
€
X
= 0.05One -tailed• Step 4: Compute your
test statistics
€
zX
=X − μ
X
σX
€
=55 − 60
816
⎛ ⎝ ⎜
⎞ ⎠ ⎟
= -2.5
H0: μTreatment > μpop > 60 HA: μTreatment < μpop < 60
Statistics for the Social Sciences
“Generic” statistical test
An example: One sample z-test
Memory example experiment:• We give a n = 16 memory patients a memory improvement treatment.
• How do they compare to the general population of memory patients who have a distribution of memory errors that is Normal, μ = 60, σ = 8?
• After the treatment they have an average score of = 55 memory errors.
€
X
= 0.05One -tailed
€
zX
= −2.5
• Step 5: Make a decision about your null hypothesis
μ-1-2 1 2
5%
Reject H0
H0: μTreatment > μpop > 60 HA: μTreatment < μpop < 60
Statistics for the Social Sciences
“Generic” statistical test
An example: One sample z-test
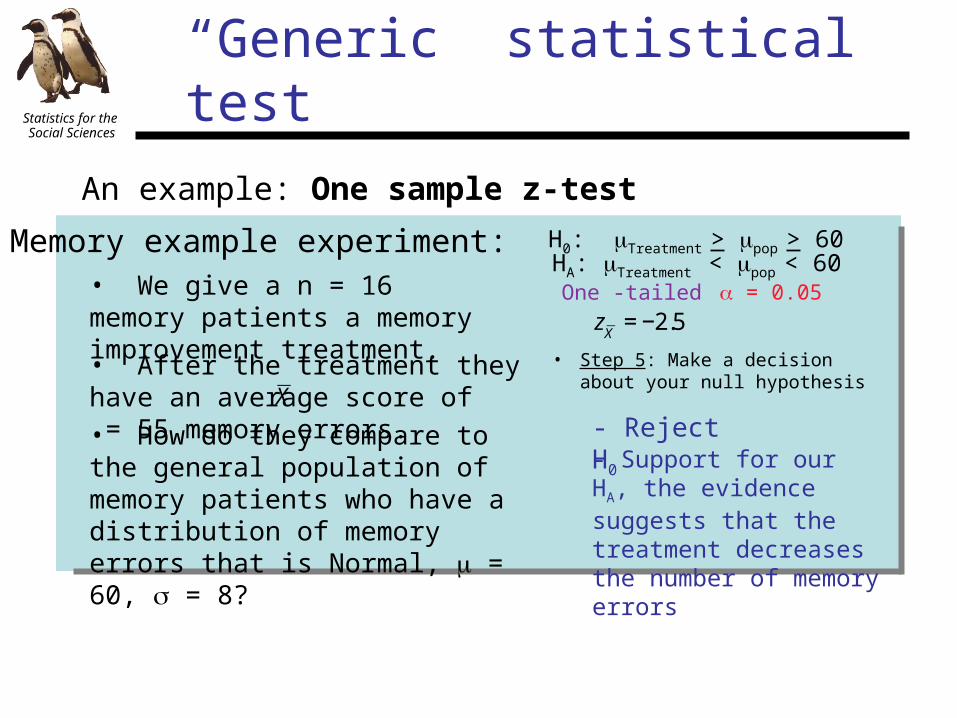
Memory example experiment:• We give a n = 16 memory patients a memory improvement treatment.
• How do they compare to the general population of memory patients who have a distribution of memory errors that is Normal, μ = 60, σ = 8?
• After the treatment they have an average score of = 55 memory errors.
€
X
= 0.05One -tailed
€
zX
= −2.5
• Step 5: Make a decision about your null hypothesis
- Reject H0- Support for our HA, the evidence suggests that the treatment decreases the number of memory errors
H0: μTreatment > μpop > 60 HA: μTreatment < μpop < 60