hydrological impacts of land use/land cover change in a large river basin in central–northern...
TRANSCRIPT

INTERNATIONAL JOURNAL OF CLIMATOLOGYInt. J. Climatol. 30: 1917–1930 (2010)Published online 30 March 2010 in Wiley Online Library(wileyonlinelibrary.com) DOI: 10.1002/joc.2131
Hydrological impacts of land use/land cover change in alarge river basin in central–northern Thailand†
Pakorn Petchprayoon,a Peter D. Blanken,a* Chaiwat Ekkawatpanit,b and Khalid Husseinc
a Department of Geography, University of Colorado, Boulder, CO 80309, USAb Civil Engineering Department, King Mongkut’s University of Technology Thonburi, Bangkok, Thailand
c Earth Science & Observation Center (ESOC), CIRES, University of Colorado, Boulder, CO 80309, USA
ABSTRACT: The purpose of this study is to determine the hydrological impacts of land use/land cover (LULC) change inthe Yom watershed in central–northern Thailand over a 15-year period using an integration of remote sensing, GeographicInformation System, statistical methods, and hydrological modelling. The LULC changes showed an expansion of urbanareas by 132% (from 210 km2 in 1990 to 488 km2 in 2006). The Yom River’s daily discharge long-term trend significantlyincreased at most of the measurement stations (p value <0.05), and the rate of increase in discharge at areas downstreamof the rapid urbanisation was significantly greater than that at areas upstream. There were no significant long-term trendsin precipitation characteristics in the basin, except for one station. The rate of change in discharge after changes in LULCshowed a systematic increase over a range from 0.0039 to 0.0180 m3 s−1 day−1 over a 15-year period, with the increasein urbanised area spanning a range from 81 to 149% in two flood-prone provinces. A rainfall-runoff model simulated asmall increase (∼10%) in peak flows. The coupling of surface observations, remote sensing, and rainfall-runoff modelingdemonstrated the impacts of changes in LULC on peak river discharge, hence flooding behaviour, of a major river incentral–northern Thailand. Copyright 2010 Royal Meteorological Society
KEY WORDS remote sensing; land use change; river discharge; rainfall-runoff model
Received 6 October 2008; Revised 15 January 2010; Accepted 18 February 2010
1. Introduction
Thailand is one of the most flood-prone countries inSoutheast Asia. Every year during the rainy season, Thai-land is faced with severe flooding in the north, northeastand central parts of the country. For example, the YomRiver Basin is typically flooded in August and Septem-ber during each rainy season (May–October), yet thebasin is very dry through the November-to-April dryseason (Geo-Informatics and Space Technology Devel-opment Agency (GISTDA), 2005). Over-bank floodinginundates the urban and agriculture areas located alongthe Yom River, especially in the lower portions of thebasin. According to the report by the Department of Dis-aster Prevention and Mitigation, Ministry of Interior, 25%of the villages are severely affected by flooding everyyear (Ministry of Agriculture and Cooperatives (MOAC)and Ministry of Natural Resource and Environment(MONRE), 2005). To address this problem, the RoyalThai Government has tried to examine potential causesfor this flooding. Apart from the pronounced monsoonclimate mentioned above, geographical and hydrological
* Correspondence to: Peter D. Blanken, Department of Geography,University of Colorado, Boulder, CO 80309, USA.E-mail: [email protected]† This article was published online on 30 March 2010. An error wassubsequently identified. This notice is included in the online and printversions to indicate both have been corrected 16 April 2010.
features, deforestation, and particularly urbanisation areclaimed as major causes. With urban development, imper-vious surface areas (e.g. roads, sidewalks, driveways,parking areas, rooftops) decrease infiltration and increasethe rate and volume of surface runoff (Fitzpatrick et al.,2005). Thus, urbanised areas would become a potentiallygreater cause of water inundation under conditions ofhigh rainfall intensity. Without research to support theseclaims, however, conflicts and debate about how to makeappropriate decisions to mitigate the flooding problemremains.
Understanding the role and impacts of land use/landcover (LULC) change in flood-prone areas could play asignificant role in alleviating the flooding problem. Thestudy of the impacts of LULC change on flood behaviouris a very complex and time-consuming process becausethe factors that determine river flow and flood intensityvary both spatially and temporally. These problems canbe addressed by using a Geographic Information System(GIS) that is efficient for spatial data analysis togetherwith remote-sensing data, which can provide widely,regularly updated, and reliable data. Then, rainfall- runoffmodels can be used to help further understand and predictchanges in river flow behaviour.
In this study, we explore the impacts of LULC change,particularly urbanisation, in the Yom River’s dischargebehaviour and contribute to discussions regarding thenature of this impact in relation to floods in the basin.
Copyright 2010 Royal Meteorological Society

1918 P. PETCHPRAYOON et al.
The specific objectives of this study are to (1) determinehow land use has changed in the Yom watershed overa period of 15 years; (2) determine the characteris-tics and long-term changes in precipitation and dis-charge in the watershed; (3) investigate the relationshipbetween land cover change and discharge response; and(4) assess the impact of LULC changes on river peakflow behaviours. We first describe the study site, andthen assess how LULC has changed in the Yom water-shed. Next, we determine the characteristics and long-term changes in precipitation and discharge, followed bya rainfall- runoff model investigation of the relationshipbetween increases in urbanisation and the river discharge
response. The last section presents the summary andconclusions.
2. Study area
Yom River Basin is located in the central–northernpart of Thailand between longitude 99°13′ –100°5′ Eand latitude 15°51′ –19°24′ N (Figure 1). The basinarea is 25 180 km2, the second largest watershed inthe region. The Yom River flows in a north-to-southdirection, is 735 km in length, and the elevation ofthe river ranges from 360 to 20 m above mean sealevel at the watershed outlet at Chumsang District
Figure 1. Satellite images from Landsat – 5 TM bands 3, 4, and 5 (BGR) showing the study area. This figure is available in colour online atwileyonlinelibrary.com/journal/joc
Copyright 2010 Royal Meteorological Society Int. J. Climatol. 30: 1917–1930 (2010)

HYDROLOGICAL IMPACTS OF LAND USE/LAND COVER CHANGE IN THAILAND 1919
A M J J A S O N D J F MMonth
Pre
cipita
tion (
mm
)
A M J J A S O N D J F M
Month
Air
Tem
pera
ture
(°C
)
250
200
150
100
50
0
32
30
28
26
24
22
20
Figure 2. Average monthly air temperature and total monthly precipitation in the study area. This figure is available in colour online atwileyonlinelibrary.com/journal/joc
Nakhon Sawan Province (Department of Water Resources(DWR), 2005).
Geographically, the basin is divided into two character-istic parts, the upper and lower river basins. Most of theupper basin is mountainous, with 51% forest cover con-taining the only large teak forest remaining in the country(GISTDA, 2005), and 49% agriculture (in the river val-leys) and urban areas. The lower basin is essentiallythe river’s floodplain, and is well suited for cultivation.Therefore, the land use in the lower basin is mostly agri-culture and urban with 26% forest (Srethasirote, 2007).The average annual precipitation in the study area is1160 mm (ranges from 1000 to 1600 mm) and the aver-age annual air temperature ranges from 25 to 28 °C(Figure 2; Royal Irrigation Department (RID), 2003). Theclimate is dominated by the tropical southwest mon-soon, with over 90% of the annual precipitation occurringbetween May and October (Figure 2).
3. Methods
3.1. Assessment of LULC change
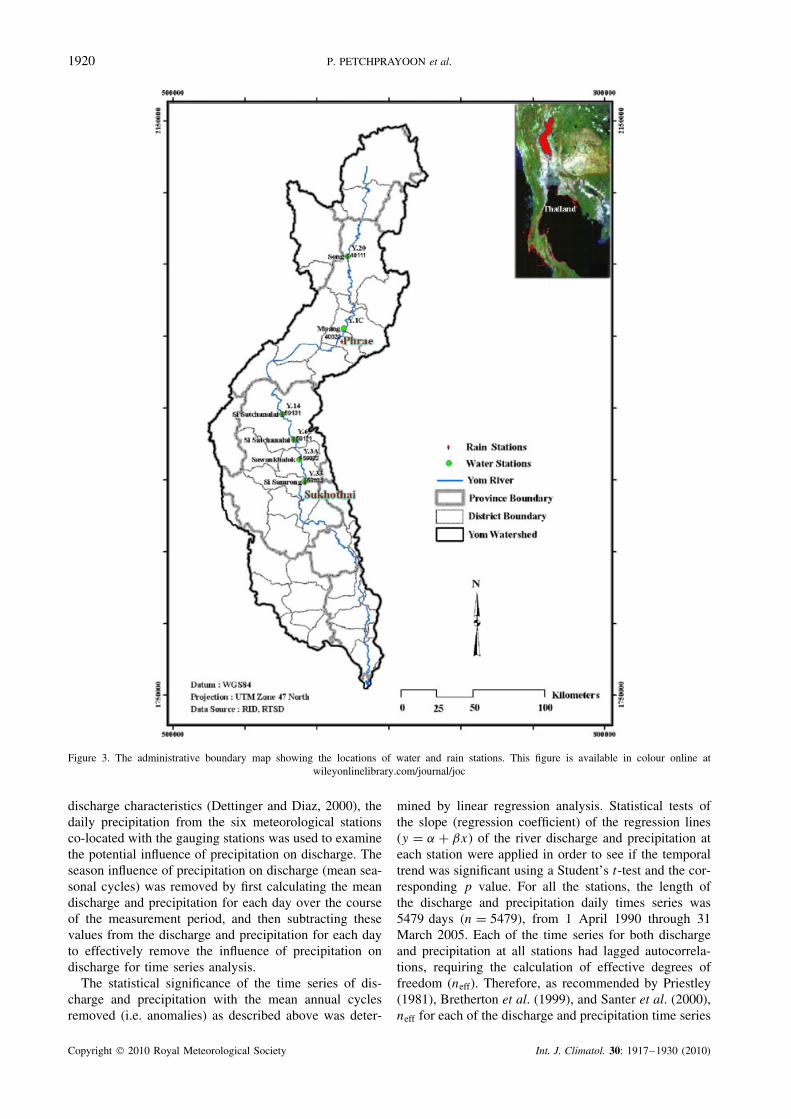
To investigate the relationship between urbanisation anddischarge, urban areas in two flood-prone provinceswere delineated from remote-sensing data, and dischargetrends for stations along the Yom River were anal-ysed. The interactions of urban growth and dischargewere examined within administrative boundaries of thefive districts in the two provinces (Figure 3). The dis-charge trend at each station of the six stations (Y.20located in Song District, Phrea Province, Y.1C in MuangDistrict, Phrea Province, Y.14 in Si Satchanalai Dis-trict, Sukhothai Province, Y.6 in Si Satchanalai Dis-trict, Sukhothai Province, Y.3A in Sawankhalok District,Sukhothai Province, and Y.33 in Si Samrong District,Sukhothai Province) were compared with the increase inurban area from 1990 to 2004 around each station.
Landsat satellite (5 and 7) images of spectral band3 (0.63–0.69 µm), 4 (0.78–0.90 µm), and 5 (1.55–1.75 µm) of Thematic Mapper (TM) and EnhancedThematic Mapper Plus (ETM+) sensors acquired in 1990(TM), 1994 (TM), 1998 (ETM+), 2002 (ETM+), and2006 (ETM+), provided by the GISTDA were used toproduce a time series of LULC change on a 4-year
interval. The selected images were free of signal errorfrom the sensor and were cloud free.
For LULC classification, remote-sensing computer-processing techniques (supervised classification) andvisual interpretation (manual interpretation) were appliedto classify the images into four land use categories includ-ing forests, agriculture, urban and water bodies.
The maximum likelihood method for supervised clas-sification was applied for this study because of its robust-ness and its easy availability in almost any image-processing software (Lu and Weng, 2007), and theassumption of normally distributed data was met. How-ever, the maximum likelihood method requires morecomputations per pixel than other techniques like paral-lelepiped or minimum distance classification algorithms(Jensen, 2005). This classification was based on the stan-dards formulated by the Land Development Department(LDD), Thailand. The classified images were convertedto ArcGIS files format for investigating change detection.The Raster Calculation technique in the Spatial Analystmodule was applied for calculating LULC changes from1990 to 2006, for identifying areas where rapid changesoccurred, as well as for investigating LULC conversionprocesses that occurred in the watershed.
3.2. Hydrological and meteorological data and analysis
Daily precipitation and discharge data in the Yom RiverBasin for 15 water years (1990–2004) were obtainedfrom the RID, Thailand. The study was conducted intwo flood-prone provinces; the Phrae and SukhothaiProvinces. The former is located in the upper part of thebasin, and the later is located in the central–lower part ofthe basin (Figure 3). The temporal trends of precipitationand river discharge from each province were spatially andtemporally analysed and compared using the proceduresdescribed below. Data from six stream gauging stationslocated along the Yom River, namely, Y. 20, Y.1C, Y.14,Y.6, Y.3A, and Y.33, were used (Figure 3).
The daily observations of discharge from the six gaug-ing stations showed that river discharge was generallylow during the dry season (November–April) and highduring the wet season (May–October), with the peak dis-charge generally occurring in July or August. As precip-itation can be one of the main causes of changes in river
Copyright 2010 Royal Meteorological Society Int. J. Climatol. 30: 1917–1930 (2010)
1920 P. PETCHPRAYOON et al.
Figure 3. The administrative boundary map showing the locations of water and rain stations. This figure is available in colour online atwileyonlinelibrary.com/journal/joc
discharge characteristics (Dettinger and Diaz, 2000), thedaily precipitation from the six meteorological stationsco-located with the gauging stations was used to examinethe potential influence of precipitation on discharge. Theseason influence of precipitation on discharge (mean sea-sonal cycles) was removed by first calculating the meandischarge and precipitation for each day over the courseof the measurement period, and then subtracting thesevalues from the discharge and precipitation for each dayto effectively remove the influence of precipitation ondischarge for time series analysis.
The statistical significance of the time series of dis-charge and precipitation with the mean annual cyclesremoved (i.e. anomalies) as described above was deter-
mined by linear regression analysis. Statistical tests ofthe slope (regression coefficient) of the regression lines(y = α + βx) of the river discharge and precipitation ateach station were applied in order to see if the temporaltrend was significant using a Student’s t-test and the cor-responding p value. For all the stations, the length ofthe discharge and precipitation daily times series was5479 days (n = 5479), from 1 April 1990 through 31March 2005. Each of the time series for both dischargeand precipitation at all stations had lagged autocorrela-tions, requiring the calculation of effective degrees offreedom (neff). Therefore, as recommended by Priestley(1981), Bretherton et al. (1999), and Santer et al. (2000),neff for each of the discharge and precipitation time series
Copyright 2010 Royal Meteorological Society Int. J. Climatol. 30: 1917–1930 (2010)

HYDROLOGICAL IMPACTS OF LAND USE/LAND COVER CHANGE IN THAILAND 1921
Table I. Area (km2) and the overall amount of change (%) in LULC of Yom watershed over the period 1990–2006.
LULCtype
1990(km2)
Percent ofstudyarea
2006(km2)
Percent ofstudyarea
Amount ofchange(km2)
Percentagegrowth
Forest 11 943 47.42 11 644 46.23 – 299.85 −2.51Agriculture 12 987 51.57 12 978 51.53 −9.86 −0.08Urban 210 0.83 488 1.94 277.79 132.20Water 43 0.17 75 0.30 31.92 74.56Total 25 184 100 25 184 100 0
was estimated as neff = n[1 − r/1 + r], [Correction madehere after initial online publication] where r is the lag-oneautocorrelation coefficient calculated from the regressionresiduals (Tables II and III). Finally, the discharge trendsat consecutive upstream versus downstream water sta-tions were compared (two stations in the Phrae Province;four in the Sukhothai Province).
3.3. Modelling the effects of LULC change ondischargeThe differences between river discharge response beforeand after LULC changes were examined under simi-lar precipitation conditions by using the rainfall–runoffmodel MIKE 11/Nedbør-Afrstrømnings-Model (NAM)(DHI Software, 2004). The NAM model is one of thelumped conceptual models similar to simple nonlinearrainfall–runoff model composed of tanks with outletson the side and bottom of each tank (e.g. Tank Mod-els; Sugawara et al., 1974). Tank models have been usedto predict LULC change, for example, in northern Japan,where runoff simulations showed that expanded agricul-tural development had decreased infiltration resulting inan increase in surface runoff (Nagasaki and Nakamura,1999). The NAM and tank models have been foundto give results similar to ours in Thailand river basins(Tingsanchali and Gautam, 2000), and given that theNAM model requires fewer parameters with a simplercalibration procedure, the NAM model was used in thisstudy. The lumped model has been successfully appliedto evaluate the effects of LULC changes on water-shed hydrology around the world (Lorup et al., 1998;Nagasaka and Nakamura, 1999).
The NAM hydrologic model is characterised as a deter-ministic, lumped, and conceptual model that simulatesthe rainfall–runoff processes at the catchment scale. Themodel operates by continuously accounting for the soilmoisture content in three different and commonly inter-related storages that represent overland flow, interflow,and base flow. As NAM is a lumped model, it treatseach sub-basin as one unit, therefore the parameters andvariables are considered to represent average values forall the sub-basins. Irrigation or groundwater pumping ofwater can also be accounted for in this model. This studycombined statistical methods with the hydrological modelto discriminate between the effects of climate variabilityand land use change.
As changes in runoff are difficult to measure in thefield, these were calculated using the model in order to
explore how the changes in land use affect the hydro-logic regime of the upper Yom River Basin. The PhraeProvince, located in the upper part of the basin, is oneof the areas that experienced rapid LULC change, par-ticularly urbanisation; therefore, this area was selectedto compare the discharge between before urbanisation.The watershed area (7624 km2) of the Y1C river gaug-ing station was selected as the terminus of river flowfrom the study area. The model’s parameters werederived objectively by an automatic calibration appli-cation routine based on a multi-objective optimisationstrategy, in which three calibration objectives were sat-isfied, namely, (1) agreement between the daily averagesimulated and observed discharge; (2) agreement of theshape of the hydrograph; and (3) agreement of the peakand low flows with respect to timing and rate (Madsen,2000).
To capture the potential effects of LULC changeson discharge, the model was run for a period of onewater year at the beginning and end of the 15-yearstudy period (1 April 1990–31 March 1991; 1 April2004–31 March 2005). As precipitation was differentin each of these years, and changes in precipitation cancompound the influence of LULC changes on discharge(Tomer and Schilling, 2009); the same precipitation datawere used for each model run to determine if changesin discharge were indeed due to changes in LULC.Differences in discharge, and the associated changesin model parameters, were therefore associated withchanges in LULC.
4. Results
4.1. LULC change
Through the interpretation of satellite images, the Yomwatershed was mostly occupied by agriculture followedby forest areas, urban areas, and water bodies through-out the study period (Table I; Figure 4). Between 1990and 1994, agricultural and urban areas exhibited progres-sive increases, whereas the forest areas were declining.Between 1994 and 2006, there was a notable increasein urban areas, with forest and agricultural areas bothdecreasing slightly. The area of open water slightlyincreased (by ∼30 km2) due to the construction of reser-voirs for agriculture, but the percentage of change isnot comparable to that of urbanisation (by ∼278 km2,
Copyright 2010 Royal Meteorological Society Int. J. Climatol. 30: 1917–1930 (2010)

1922 P. PETCHPRAYOON et al.
Figure 4. Changes in the area of each LULC class from 1990 to 2006. This figure is available in colour online at wileyonlinelibrary.com/journal/joc
an increase of 132% compared the initial 210 km2;Figure 4).
On the basis of the change detection analysis fromthe LULC data, the urban area in the basin increasedfrom 210 km2 in 1990 to 488 km2 in 2006, with atrend to increase over time. The main land conversionprocess was from agriculture to urban land. In addition,agriculture areas had expanded into steep terrain, which,as a result, accelerated the removal of forest cover onthe slopes. Figure 5 shows the change detection map,which indicates major land use conversion processes.Each colour represents a characteristic activity, e.g. redindicates the conversion of agricultural area into urbanland, blue indicates the conversion of forest areas to waterbodies, and green indicates the reforestation areas etc.
4.2. Characteristics and long-term change of dischargeand precipitation
Regression analyses and trend lines of daily discharge atthe six main river stations along the Yom River are shownin Table II and Figure 6. The regression coefficients (orslope indicating the long-term trend in discharge orprecipitation) for discharge were positive and statisticallysignificant (p < 0.05) at all stations, except at stationsY.14 and Y.6, which were statistically significant at lowerconfidence levels (p value 0.10 and 0.06, respectively). Inthe Phrae Province, the daily discharge trends of Y.20 andY.1C were compared (the former is located upstream andthe later downstream). The slope for discharge at Y.20
Table II. Regression analysis results for daily discharge timeseries over the time period from 1 April 1990 through 31 March
2005.
StationID
Province Effectivedegrees offreedom
Slope(m3 s−1 day−1)
p
value
Y.20 Phrae 722 0.0039 0.0159Y.1C Phrae 398 0.0065 0.0216Y.14 Sukhothai 282 0.0059 0.1094Y.6 Sukhothai 268 0.0076 0.0681Y.3A Sukhothai 214 0.0130 0.0115Y.33 Sukhothai 215 0.0180 0.0001
was 0.0039 m3 s−1 day−1, which is significantly lowerthan that at Y.1C (0.0065 m3 s−1 day−1). According tothese results, the discharge at the downstream locationincreased at a higher rate than that at the upstreamarea during the same time period. The same patternswere found in the Sukhothai Province; the slopes of thelong-term discharge trends (all in m3 s−1 day−1) movingprogressively from upstream to downstream stationswere 0.0180 (Y.33), 0.0130 (Y.3A), 0.0076 (Y.6), and0.0059 (Y.14), with each increase being statisticallysignificant.
The regression analysis of daily precipitation timeseries revealed that there were both increases anddecreases in the regression slopes, with only one beingstatistically significant (station 59 121; p = 0.05) over
Copyright 2010 Royal Meteorological Society Int. J. Climatol. 30: 1917–1930 (2010)

HYDROLOGICAL IMPACTS OF LAND USE/LAND COVER CHANGE IN THAILAND 1923
Figure 5. Change detection map of the Yom watershed from 1990 to 2006. This figure is available in colour online atwileyonlinelibrary.com/journal/joc
the 15-year study period (Table III; Figure 6). For exam-ple, stations 40 111 and 40 022 (Phrae Province) had aslight decrease in precipitation, as did stations 59 131 and590 032 (Sukhothai Province). In contrast, stations 59 121and 59 072 (Sukhothai) showed a small positive slope inthe long-term precipitation trend. These results indicatedthat, except for one station, there were no significantchanges in precipitation, similar to the results of Cookand Buckley (2009) that found no significant trend in theonset, withdrawal, or monsoon season length (p < 0.05)in central Thailand from 1951 to 2005. Generally if pre-cipitation changed, the river discharge should also havechanged proportionally if there was no change in LULC
Table III. Regression analysis results for daily rainfall timeseries over the time period from 1 April 1990 through 31 March
2005.
StationID
Province Effectivedegrees offreedom
Slope(mm day−1)
p
value
40 111 Phrae 4232 0.000029 0.369240 022 Phrae 3711 0.000120 0.119759 131 Sukhothai 4052 −0.000020 0.416859 121 Sukhothai 3840 0.000150 0.050059 032 Sukhothai 3918 −0.000003 0.486559 072 Sukhothai 4046 0.000045 0.3206
Copyright 2010 Royal Meteorological Society Int. J. Climatol. 30: 1917–1930 (2010)

1924 P. PETCHPRAYOON et al.
(a)
(b)
Figure 6. Precipitation (upper panel) and discharge (bottom panel) anomalies at stations Y.20, 40 111 (a) and Y1C, 40 022 (b) in the YomRiver at Phrea Province during the period 1 April 1990–31 March 2005 with their trends imposed. This figure is available in colour online at
wileyonlinelibrary.com/journal/joc
characteristics in the watershed. As described previously,however, the discharge significantly increased withoutsignificant changes in precipitation in the basin (Figures 6and 7), except for the one station where the cause(s) of theincrease in precipitation are unknown. This suggests thatoverall there was a change in discharge due to changesin LULC of the watershed.
4.3. Effects of urbanisation on discharge
The changes in urbanised areas and river discharge ofthe five districts in two provinces that experienced rapidurbanisation are shown in Table IV. The river dischargechanges exhibited positive temporal trends in relationto the urban expansion. These results support the ideathat the increasing discharge was directly related to theincrease in urbanised areas in the watershed. The rangein the slopes of the river discharge temporal trendsincreased between 0.0039 and 0.0180 m3 s−1 day−1 over
the 15-year period, corresponding to a range in theincrease in urban areas from 6 to 16 km2, or 80–149%growth (only 0.02–0.08% of the total catchment area).The district with the greatest increase in urban area (SiSatchanalai 20 km2; 282% growth), however, had theleast statically significant increase in discharge and theslope (0.0076 m3 s−1 day−1) ranked third amongst thefive stations due to the type of LULC change within theurban class (see Section 5).
The results of the calibrated NAM rainfall–runoffmodel at the Phrea Province run during the start (wateryear 1990–1991) and end (water year 2004–2005) ofthe measurement period are shown in Figure 8(a) and(b) respectively, and the resulting model parameters foreach period are shown in Table V. In general, the lowflows and the peak flows were simulated well, withoccasional underestimation and overestimation of themedium high peak flows. To simulate the differences
Copyright 2010 Royal Meteorological Society Int. J. Climatol. 30: 1917–1930 (2010)

HYDROLOGICAL IMPACTS OF LAND USE/LAND COVER CHANGE IN THAILAND 1925
(a)
(b)
Figure 7. Precipitation (upper panel) and discharge (bottom panel) anomalies at stations Y.14, 59 131 (a), Y6, 59 121 (b), Y3A,59 032 (c), andY33, 59 072 (d) in the Yom River at Sukhothai Province during the precipitation period 1 April 1990–31 March 2005 with their trends imposed.
This figure is available in colour online at wileyonlinelibrary.com/journal/joc
between river discharge (especially peak flows) beforeand after LULC changes including the increase in urbanarea, the model parameters derived during the start ofthe study period were compared with those derived atthe end of the study period to simulate discharge underthe same precipitation regimes (Figure 9(a) and (b)). Anincrease in peak discharge for both of the simulatedyears using the model parameters to reflect the changein LULC was apparent (an average increase in peak flowof ∼10%), even when the model was run using the sameprecipitation data.
5. Discussion
The largest LULC changes over the study period in termsof actual area were a decrease in forest cover (300 km2)and nearly an equal increase in urban cover (278 km2).
More land was converted into urban areas at the expenseof agriculture, and this was mainly due to commercial andindustrial growth (Department of Environmental QualityPromotion (DEQP), 2007). Navanukgraha (1997) alsostated that agriculturally productive land and forests inThailand have been converted into residential and otheruses. For example, in the northern part of Thailand, theurban area of Chiang Mai increased from 15 km2 in 1952to 339 km2 in 2000 due to the economic and populationgrowth (Sangawongse et al., 2005).
On the basis of the results presented in this study(both observations and simulations), LULC changes canaffect river discharge, implying changes in the hydro-logical characteristics of the watershed. With less stor-age available for water in urban areas and more rapidrunoff, the water level of rivers in urban areas rises morequickly during storms and has a higher peak discharge
Copyright 2010 Royal Meteorological Society Int. J. Climatol. 30: 1917–1930 (2010)

1926 P. PETCHPRAYOON et al.
(c)
(d)
Figure 7. (Continued).
Table IV. The urbanisation and river discharge trends for the five districts.
Urbanisation Discharge
District 1990(km2)
2006(km2)
AreaChange(km2)
Growth%
% Change ofcatchmentto urban
Station Slope(m3 s−1 day−1)
Trend(at 95 significance
levels)
Song 7.39 13.36 5.97 80.86 0.02 Y.1C 0.0039 UpwardsMuang 16.89 31.76 14.86 88.00 0.06 Y.20 0.0065 UpwardsSi Satchanalai 7.11 27.18 20.07 282.44 0.08 Y.6 0.0076 UpwardsSawankhalok 12.96 28.11 15.16 117.00 0.06 Y.3A 0.0130 UpwardsSi Samrong 10.92 27.18 16.26 148.81 0.06 Y.33 0.0180 Upwards
rate than rural rivers (Illinois Association for Flood-plain and Stormwater Management (IAFSM), 2004), thusincreasing the watershed’s flood potential (Liu et al.,2004). Several others have reported changes in watershedcharacteristics (e.g. discharge) associated with changes inLULC. For example, Cowden et al. (2006) stated that the
urbanisation of the Clinton River watershed in Southeast-ern Michigan strongly impacted the hydrology becauseof changes in channel alteration, impervious surface, andsoil characteristics. Noorazuan et al. (2003) also foundthat urban extent and changes in urban-related LULCcould affect river discharge behaviour by increasing the
Copyright 2010 Royal Meteorological Society Int. J. Climatol. 30: 1917–1930 (2010)

HYDROLOGICAL IMPACTS OF LAND USE/LAND COVER CHANGE IN THAILAND 1927
(a)
(b)
Figure 8. (a). Simulated (black line) and observed (blue line) river discharge in the Yom River at Phrea Province during the precipitation period1 April 1990–31 March 1991. (b) Simulated (black line) and observed (blue line) river discharge in the Yom River at Phrea Province during
the precipitation period 1 April 2004–31 March 2005. This figure is available in colour online at wileyonlinelibrary.com/journal/joc
Table V. Model parameters for Y1C (Phrae Province) in 1990–1991 and 2004–2005. See DHI software (2004) for a completedescription on model parameters.
Parameter Period
1990–1991 2004–2005
Umax: Surface water storage (mm) 19 18Lmax: root zone water storage (mm) 130 100CQOF: Overland flow runoff coefficient (−) 0.50 0.456CKIF: Time constant for interflow (h) 804.7 845.6CK12: Runoff routing constant (h) 55.6 53.5TOF: Root zone threshold (−) 0.369 0.338TIF: Root zone threshold for interflow (−) 0.812 0.936TG: Root zone threshold for overland flow (−) 0.925 0.828CKBF: baseflow time constant (h) 2558 2897Carea: Ratio of groundwater catchment to topographic catchment area (−) 1 1
Copyright 2010 Royal Meteorological Society Int. J. Climatol. 30: 1917–1930 (2010)

1928 P. PETCHPRAYOON et al.
Table V. (Continued ).
Parameter Period
1990–1991 2004–2005
Sy: Specific yield (−) 0.1 0.1GWLBF0: Maximum groundwater depth causing baseflow (m) 10 10GWLBF1: Groundwater depth for unit capillary flow (m) 0 0CQlow: Proportion of recharge to lower groundwater storage (−) 79 98.8CKlow: Time constant for routing lower baseflow (h) 27902.7 27003.6
(a)
(b)
Figure 9. (a) Comparison simulated hydrograph before (blue line) and after (black line) urbanisation in the Yom River at Phrae Province underthe same the precipitation period 1 April 1990–31 March 1991. (b) Comparison simulated hydrograph before (blue line) and after (black line)urbanisation in the Yom River at Phrae Province under the same precipitation period 1 April 2004–31 March 2005. This figure is available in
colour online at wileyonlinelibrary.com/journal/joc
surface runoff in the Langat river basin, Malaysia, South-east Asia. Shi et al. (2007) studied the effect of LULCchange on surface runoff in the Shenzhen region, China,and concluded that urbanisation led to increases in themaximum flood discharge. Lastly, Sebastian (2005) found
that the increase in the impervious surface area fromurbanisation in the Mapocho basin, Santiago de Chile,South America caused an increase in winter mean andpeak discharge flows, as well as an increase in the streamlevels.
Copyright 2010 Royal Meteorological Society Int. J. Climatol. 30: 1917–1930 (2010)

HYDROLOGICAL IMPACTS OF LAND USE/LAND COVER CHANGE IN THAILAND 1929
Our results are similar to these other studies, inthat a relatively small change in LULC relative to thesize of the entire watershed had a small but detectablehydrological basin impact. Four of the five districtsshowed a small increase in the long-term (15-year)discharge corresponding to an increase in urban landarea. The Si Satchanalai District, however, which had thelargest increase in urban area (20 km2; 282% increase),did not have the largest increase in long-term discharge(0.0076 m3 s−1 day−1). This may be attributed to thefact that urban areas of Si Satchanalai District havedifferent characteristics compared to the other districts,e.g. the district had a lower coverage of commercial andindustrial areas. As we have used first-level categories toclassify LULC, the commercial and industrial areas arerepresented by one category in the urban LULC class,thus preventing us from identifying these potentiallyimportant subclasses of LULC.
Our results indicated a small but statistically significant(p 0.0001–0.1094) increase in discharge and small(∼10%) increases in peak discharge corresponding torelatively small changes in the absolute areal coverageof urban and forested areas of the watershed. WhereasHurkmans et al. (2009) found small impacts on dischargein the Rhine River Basin from simulated projectedincreases in urbanisation due to compensatory decreasesin other vegetated LULC, the changes we report here maybe due to the location of the land use change within thewatershed. In addition to factors such as compensatorychanges in other LULC, changes in river dimensions(e.g. width and depth), and the changes in hydrologicalparameters such as surface and root zone water storagebefore and after LULC changes, the location of the LULCchange may be important in interpreting our results. Forexample, in our study, the conversion from agriculturalto urban land use occurred directly along the banksof the Yom River, thus resulting in a faster peak-flowdischarge response compared to urbanisation occurringfurther away for the river. Water storage capacity withLULC changes located further from the river shouldalso buffer the peak-flow discharge response, but such adecrease in discharge, however, was unlikely due to thesmall net increase in reservoir area (∼30 km2) and largedistance of the reservoirs from the Yom River (∼50 km).
6. Conclusions
From the results of the study, the following conclusionscan be drawn:
• Satellite remote sensing is useful in classifying andstudying LULC and detection of change in the Yomwatershed. The area was subjected to urbanisation andthis was mainly at the expense of agricultural area.Higher resolution satellite imagery would be helpfulin identifying subclasses on LULC, especially in urbanareas.
• A slight increase occurred concurrently in the long-term discharge with changes in LULC, especially an
increase in urban areas and a decrease in forested areas.The relatively small increase in the areal coverage ofurban areas may have had a disproportionally largeimpact on discharged behaviour (mean and extremeflows) due to the location of these LULC changesadjacent to the banks of the Yom River.
• As the Yom watershed has been characterised byurbanisation along the river over the last decadeand may continue to experience extensive landscapechange in the future, the potential for increased dis-charge and urban flooding is probable. The informationprovided in this study can be useful in planning foremergency urban floods, disaster announcement mea-sures, and evacuation of the people living in flood-riskarea. In addition, this type of analysis can support rele-vant organisations in public sectors for future land useand flood management plans in order to protect andreduce the impact on life and the assets of governmentand local people in the northern central watershed ofThailand.
References
Bretherton CS, Widmann M, Dymnikov VP, Wallace JM, Blade I.1999. The effective number of spatial degrees of freedom in a time-varying field. Journal of Climate 12: 1990–2009.
Cook BI, Buckley BM. 2009. Objective determination of monsoonseason onset, withdrawal, and length. Journal of GeophysicalResearch 114: D23109.
Cowden JR, Watkins D, Croley TE. 2006. Investigating urban land useeffects on runoff by using the distributed large basin runoff model.Proceedings of The World Environmental and Water ResourcesCongress 2006, May 2006, Nebraska, USA.
Department of Environmental Quality Promotion (DEQP). 2007. Theimprovement water quality classification plan in the Yom Watershed.Project report. Ministry of Natural Resources and Environment,Bangkok, Thailand.
Department of Water Resources (DWR). 2005. The master plan formanagement and administration in the Yom Watershed. Final report,Ministry of Natural Resources and Environment, Bangkok, Thailand.
Dettinger MD, Diaz HF. 2000. Global characteristics of streamflow seasonality and variability. Journal of Hydrometeorology 1:289–310.
DHI Software. 2004. MIKE 11: a modelling system for rivers andchannels reference manual. Hørsholm, Denmark, 514 pp.
Fitzpatrick FA, Diebel MW, Harris MA, Arnold TL, Lutz MA,Richards KD. 2005. Effects of urbanization on the geomorphology,habitat, hydrology, and fish index of biotic integrity of streams inthe Chicago area, Illinois and Wisconsin. American Fisheries SocietySymposium 47: 87–115.
Geo-Informatics and Space Technology Development Agency(GISTDA). 2005. Satellite Imagery of Flooding. Siam M&BPublishing: Bangkok, Thailand.
Hurkmans RTWL, Terink W, Uijlenhoet R, Moors EJ, Troch PA,Verburg PH. 2009. Effects of land use changes on streamflowgeneration in the Rhine basin. Water Resources Research 45:W06405, DOI:10.1029/2008WR007574.
Illinois Association for Floodplain and Stormwater Management(IAFSM). 2004. Effects of urban development on flood. IAFSMNews, Spring 2004.
Jensen JR. 2005. Introductory Digital Image Processing: A RemoteSensing Perspective, 3rd edn. Prentice Hall: Upper Saddle River,NJ.
Liu YB, Smedt FD, Hoffmann L, Pfister L. 2004. Assessing land useimpacts on flood processes in complex terrain by using GIS andmodeling approach. Environmental Modeling and Assessment 9:227–235.
Lorup JK, Refsgaard JC, Mazvimari D. 1998. Assessing the effect ofland use change on catchment runoff by combined use of statisticaltests and hydrological modelling: case studies from Zimbabwe.Journal of Hydrology 205: 147–163.
Copyright 2010 Royal Meteorological Society Int. J. Climatol. 30: 1917–1930 (2010)

1930 P. PETCHPRAYOON et al.
Lu D, Weng Q. 2007. A survey of image classification methods andtechniques for improving classification performance. InternationalJournal of Remote Sensing 28: 823–870.
Madsen H. 2000. Automatic calibration of a conceptual rainfall–runoffmodel using multiple objectives. Journal of Hydrology 235:276–288.
Ministry of Agriculture and Cooperatives (MOAC), Ministry of NaturalResource and Environment (MONRE). 2005. Strategies for waterresource management in Yon River Basin, Bangkok, Thailand.
Nagasaka A, Nakamura F. 1999. The influences of land-use changeson hydrology and riparian environment in a northern Japaneselandscape. Landscape Ecology 14: 543–556.
Navanugraha C. 1997. Preliminary findings from validation of amethodology for landuse and landcover change study in Thailand.Proceedings of the Synthesis Workshop on Greenhouse Gas Emission.Aerosols, Landuse and Landcover Changes in Southeast Asia, 76–80.
Noorazuan MH, Rainis R, Juahir H, Sharifuddin, Zain M, Jaafar N.2003. GIS application in evaluating land use-land cover change andits impact on hydrological regime in Langat River basin, Malaysia.Proceeding of the 2nd Annual Asian Conference of Map Asia, October2003, Kuala Lumpur, Malaysia.
Priestley MB. 1981. Spectral Analysis and Time Series, vol. 1Academic Press: New York.
Royal Irrigation Department (RID). 2003. Master plan for waterresource and irrigation management, Bangkok Thailand.
Sangavongse S, Sun CH, Tsai BW. 2005. Urban growth and landcover change in Chiang Mai and Taipei: results from The SLEUTHmodel. Proceedings of the International Congress on Modelling
and Simulation, Advances and Applications for Management andDecision Making, December 2005, Melbourne, Australia.
Santer BD, Wigley TML, Boyle JS, Gaffen DJ, Hnilo JJ, Nychka D,Parker DE, Taylor KE. 2000. Statistical significance of trends andtrend differences in layer-average atmospheric temperature timeseries. Journal of Geophysical Research 105: 7337–7356.
Sebastian AL. 2005. Impacts of impervious surface on runoff behavior,Santiago de Chile, 1973–2002: a watershed approach combiningstatistical methods, remote sensing, and geographic informationsystem. MA thesis, University of Colorado at Boulder.
Shi PJ, Yuan Y, Zheng J, Wang Jing-Ai GY, Qiu GY. 2007. The effectof land use/cover change on surface runoff in Shenzhen region,China. Catena 69: 31–35.
Srethasirote B. 2007. The Development of Strategic EnvironmentalAssessment and Decision Making Process for Healthy Public Policy:The case study of water resource management in Yom Basin. Projectreport, Health Systems Research Institute, Thailand.
Sugawara M, Ozaki E., Watanabe I, Katsuyama Y. 1974. Tank modeland its application to Bird Creek, Wollombi Brook, Bikin River,Kitsu River, Sanaga River, and Nam Mune. Research Note ofthe National Research Center for Disaster Prevention 11, Tsukuba,Japan, 1–64.
Tingsanchali T, Gautam MR. 2000. Application of tank, NAM, ARMAand neural network models to flood forecasting. HydrologicalProcesses 14: 2473–2478.
Tomer MD, Schilling KE. 2009. A simple approach to distinguish land-use and climate-change effects on watershed hydrology. Journal ofHydrology 376: 24–33.
Copyright 2010 Royal Meteorological Society Int. J. Climatol. 30: 1917–1930 (2010)