hydrogeology in the vicinity of the proposed
TRANSCRIPT
HYDROGEOLOGY IN THE VICINITY OF THE PROPOSED CALIFORNIA VALLEY SOLAR RANCH SAN LUIS OBISPO COUNTY, CALIFORNIA Prepared for: SunPower Corporation, Systems 1414 Harbour Way South Richmond, California 94804 Prepared by:
2625 South Miller Street, Suite 104 Santa Maria, California 93455 (805) 349-7000 v Fax: (805) 739-1135 URS Project Number 28910017 December 18, 2009
CVSR HYDROGEOLOGY REPORT
\\Fsspbk01\departments\UPP-NA\Public - Read Only\Permitting Docs\CVSR Working Docs\Dec 2009 Submittal 1 to SLO\Volume 1\Hydrogeology Report Dec 2009\Final Draft Hydrogeology Report(121909) LARSON.doc i
TABLE OF CONTENTS Section Page 1.0 INTRODUCTION....................................................................................................... 1-1 1.1 SITE LOCATION ................................................................................................ 1-1 1.2 PROJECT DESCRIPTION .................................................................................. 1-1 1.3 PROJECTED WATER USE................................................................................ 1-2 1.4 SITE HISTORICAL USES OF GROUNDWATER ........................................... 1-3 1.5 PREVIOUS STUDIES IN THE AREA ................................................................1.3 2.0 HYDROGEOLOGY ................................................................................................... 2-1 2.1 GEOLOGIC AND HYDROGEOLOGIC SETTING .......................................... 2-1 2.1.1 Alluvium .................................................................................................. 2-1 2.1.2 Paso Robles Formation ............................................................................ 2-1 2.1.3 Morales Formation ................................................................................... 2-2 2.2 GROUNDWATER SUPPLY .............................................................................. 2-2 2.2.1 Upper Aquifer .......................................................................................... 2-2 2.2.2 Lower Aquifer .......................................................................................... 2-2 2.3 GROUNDWATER DATA RESEARCH AND LAND SURVEY ..................... 2-3 2.3.1 DWR Well Data Request ......................................................................... 2-3 2.3.2 Historical Data Research .......................................................................... 2-3 2.3.3 URS Land Well Survey ........................................................................... 2-3 2.3.4 Groundwater Data Research and Land Survey Results ........................... 2-3 2.4 GROUNDWATER BUDGET ............................................................................. 2-4 2.5 SUNPOWER PROJECT WELL INFORMATION............................................. 2-5 2.5.1 Groundwater Quality ............................................................................... 2-5 2.5.2 Pump Test ................................................................................................ 2-5 3.0 GROUNDWATER MODELING ANALYSIS ......................................................... 3-1 3.1 MODEL CODES AND SOFTWARE ................................................................. 3-1 3.1.1 Groundwater Modeling System Interface ................................................ 3-1 3.1.2 MODFLOW Groundwater Flow Model .................................................. 3-1 3.2 NUMERICAL MODEL DEVELOPMENT ........................................................ 3-2 3.2.1 Model Domain and Grid……………. ..................................................... 3-2 3.2.2 Hydraulic Conductivity….………………. .............................................. 3-3 3.2.3 Specific Yield and Specific Storage ........................................................ 3-3 3.2.4 Pumping….………………. ..................................................................... 3-3 3.2.5 Recharge and Evapotranspiration….………………. .............................. 3-4 3.2.6 Boundary Conditions ............................................................................... 3-4 3.3 SCENARIOS SIMULAION ................................................................................ 3-4 3.3.1 No-project (Pre-Construction) Scenario .................................................. 3-5 3.3.2 Project Scenario ....................................................................................... 3-5
CVSR HYDROGEOLOGY REPORT
\\Fsspbk01\departments\UPP-NA\Public - Read Only\Permitting Docs\CVSR Working Docs\Dec 2009 Submittal 1 to SLO\Volume 1\Hydrogeology Report Dec 2009\Final Draft Hydrogeology Report(121909) LARSON.doc ii
Section Page 4.0 CONCLUSIONS ......................................................................................................... 4-1 5.0 MODEL LIMITATIONS ........................................................................................... 5-1 6.0 REFERENCES ............................................................................................................ 6-1 List of Tables Table 1-1 Estimate of CVSR Water Use During Construction and Operation ...................... 1-2
All of the Following Tables are at the end of the Report Table 2-1 Summary of Available Well Completion Data Table 2-2 Summary of Available DWR Groundwater Elevation Data Table 2-3 Summary of URS Well Land Survey Data Table 2-4 Summary of Groundwater Quality Data from CVSR Well #2 Table 3-1 Model of Simulated Drawdown by Project-Specific Pumping List of Figures
All Figures are at the End of the Report Figure 1 Site Vicinity Figure 2 Carrizo Plain Hydrologic Unit Figure 3a Regional Geology Map Figure 3b Regional Geology Map Legend Figure 4 Results of Well Record Search and Survey Figure 5 Wells in the Project Vicinity with Groundwater Elevation Data Figure 6 Groundwater Elevation Figure 7 Domain and Boundary Conditions of Groundwater Flow Model (all model layers) Figure 8a Horizontal Finite-difference Discretization (model grid) Figure 8b Details of Finite-difference Discretization in Project Area Figure 9a Vertical Discretization (Model Layers) in Cross Sections A-A’, B-B’, and C’-C’ Figure 9b Vertical Discretization (Model Layers) in Cross Sections D-D’, E-E’, and F-F’ Figure 10 Simulated Groundwater Elevation in Upper Aquifer (Model Layer 1) Figure 11 Simulated Groundwater Elevation in Lower Aquifer (Model Layer 3) Figure 12 Simulated Drawdown Caused by SunPower Project Pumping as a Function of
Time Figure 13 Simulated Drawdown Caused by Topaz Project Pumping as a Function of Time Figure 14 Simulated Drawdown Caused by Ausra Project Pumping as a Function of Time
CVSR HYDROGEOLOGY REPORT
\\Fsspbk01\departments\UPP-NA\Public - Read Only\Permitting Docs\CVSR Working Docs\Dec 2009 Submittal 1 to SLO\Volume 1\Hydrogeology Report Dec 2009\Final Draft Hydrogeology Report(121909) LARSON.doc iii
Figure 15 Simulated Drawdown caused by project pumping at the end of construction (T=3 years)
Figure 16 Simulated Drawdown caused by project pumping after thirty years of project operation (T=33 years)
List of Appendices Appendix A Stratigraphic Column Carrizo Plains Appendix B Historical Reports and Publications Appendix C Well Completion Report for Project Well Appendix D Laboratory Report Appendix E Pump Test Data
CVSR HYDROGEOLOGY REPORT
\\Fsspbk01\departments\UPP-NA\Public - Read Only\Permitting Docs\CVSR Working Docs\Dec 2009 Submittal 1 to SLO\Volume 1\Hydrogeology Report Dec 2009\Final Draft Hydrogeology Report(121909) LARSON.doc 1-1
SECTION 1.0 INTRODUCTION
URS Corporation (URS) has prepared this Hydrogeology Report (report) on behalf of SunPower Corporation (SunPower) for the California Valley Solar Ranch project (CVSR). 1.1 PROJECT LOCATION
The project site is located within approximately 4,365 acres owned by SunPower within the Carrizo Plain region in eastern San Luis Obispo County, California. The location of the site is approximately 60 miles east of the City of San Luis Obispo on both sides of State Route 58 (SR 58) and on the north side of the partially developed California Valley subdivision (Figure 1). The project would consist of a series of solar panel arrays and ancillary equipment located on about 2,000 acres of the property south of SR 58. The surrounding land is generally vacant or used for agricultural/grazing purposes. Sparse residential uses are located south, east, and west of the site. The project site is vacant, with abandoned farming structures and equipment, and is currently used for limited cattle grazing. An abandoned gypsum surface mine is located in the south central portion of the project site, and similar gypsum mines are located to the south.
1.2 PROJECT DESCRIPTION
The proposal would develop a 250-megawatt (MW) solar photovoltaic (PV) power plant on 1,966 acres of the property south of SR-58. The power plant would include approximately 88,000 SunPower “T20” tracker units within eight array areas, separated by several corridors containing access roads, habitat areas, and buffer areas. A new 230 kilovolt transmission line would be constructed from the project site northward for a distance of about 2.5 miles to connect to an existing 230 kV transmission line owned by Pacific Gas and Electric. The SunPower ownership north of SR 58 would be retained essentially in its present condition for habitat and conservation purposes.
Stormwater runoff within this developed area south of SR-58 would be controlled by a series of drainage channels, designed bioswales, and detention/retention basins that would generally retain the surface flow characteristics of the site. Pits remaining from the abandoned gypsum mine on the site would be reclaimed and used in the drainage system to retain the current pattern of runoff.
The construction of the project is expected to start in late 2010 and to last approximately three years. The project is expected to operate for 30 years. More details of the project description can be obtained from the application for Conditional Use Permit and related items on file with San Luis Obispo County Department of Planning and Building (Case No. DRC 2008-00097).

CVSR HYDROGEOLOGY REPORT
\\Fsspbk01\departments\UPP-NA\Public - Read Only\Permitting Docs\CVSR Working Docs\Dec 2009 Submittal 1 to SLO\Volume 1\Hydrogeology Report Dec 2009\Final Draft Hydrogeology Report(121909) LARSON.doc 1-2
At the time of the SunPower project application (early 2009) there were two other solar energy projects proposed in the Carrizo Plain region. These were the Topaz Solar Farm, a solar photovoltaic plant proposed originally by Optisolar, which was purchased by First Solar, and a solar thermal project proposed by Ausra and being processed through the California Energy Commission. In late 2009, the Ausra project withdrew its application and its property was acquired by First Solar to be incorporated into the Topaz Solar Farm project. Since most of the analysis in this report had been completed by that point in time, the assumed water use by all three projects is retained in this report. The effect of this late change, however, will be to reduce overall projected water consumption by eliminating the anticipated water use of the Ausra project. The results in this report, therefore, represent a worse case assumption by retaining all three projects.
1.3 PROJECTED WATER USE
Groundwater will serve as a source of water during the construction and operation of the facility. SunPower recently installed and developed a new well on the property, and will construct a new 271,000-gallon water storage tank to supply the needs of the project, including fire flow requirements established by the County Fire department. Table 1 below summarizes the anticipated water use from the project.
TABLE 1-1 Estimate of CVSR Water Use During Construction and Operation
Daily Demand
(gallons/day) Annual Demand (acre-feet/year)
Construction Phase Use Concrete manufacturing 800 0.9 Dust Control 20,000 22.4 Panel Washing 2,350 2.6 Sanitary Uses 3,000 3.4 Landscaping 5,000 5.6 Reverse osmosis reject water 10,280 11.5 Total 41,430 46.40 Operation Phase Use Panel Washing 4,700 5.3 Sanitary Uses 830 0.9 Landscaping 1,250 1.4 Reverse osmosis reject water 2,237 2.5 Total 9,018 10.1 The amount for dust control in the above table includes the access road north of SR 58 which will be used in construction of the transmission line and for transport of material to and from a surface mine in that area, and dust control at the surface mine itself, as well as dust control within the project site. The project will also include a small packaged water treatment plant using reverse osmosis to reduce the salinity of the groundwater to acceptable levels for use at the project; and an allowance for the brine reject water from the treatment plant is included in the above estimates.
CVSR HYDROGEOLOGY REPORT
\\Fsspbk01\departments\UPP-NA\Public - Read Only\Permitting Docs\CVSR Working Docs\Dec 2009 Submittal 1 to SLO\Volume 1\Hydrogeology Report Dec 2009\Final Draft Hydrogeology Report(121909) LARSON.doc 1-3
1.4 SITE HISTORICAL USES OF GROUNDWATER
Based on a review of historic air photographs, the property was vacant grazing land from the 1950s until the mid-1970s. At various times from the mid-1970s until the late 1980s, the property was dry farmed in a grain crop. For the last 20 years, the project site has been used for non-irrigated pasture land. Although there is an older well on the property, it does not appear to have been in use at least during the last 20 years. During this period, water for livestock was piped onto the property from a well and tank located on the north side of SR 58. The estimated water use for the minimal grazing on the property (approximately 50 head of cattle for about six months per year) is less than one acre-foot per year.
1.5 PREVIOUS STUDIES IN THE AREA Figure 2 shows the boundaries and context of the Carrizo Plain Hydrologic Unit, which approximates the extent of the groundwater basin. The area is listed as California Hydrologic Unit 311.00 in the Water Quality Basin Plan (California Regional Water Quality Control Board 1994:Figure 2-1). The California Department of Water Resources (DWR) publishes descriptions of groundwater resources throughout the state on a periodic basis in its Bulletin 118. Several editions of Bulletin 118 are available dating from 1958 through the most recent update in 2004. The area is The Carrizo Plain groundwater basin is identified as Basin No. 3-19 in Bulletin 118. The 1958 edition of Bulletin 118 estimated the safe yield of the Carrizo Plain groundwater basin at 600 acre feet/year (afy), which was also the estimated groundwater consumption at that time. Subsequent editions of Bulletin 118 have categorized the basin as having insufficient data to allow an assessment of groundwater balance. DWR has also published several regional data sets of groundwater elevation measurements covering periods from a few years to decades for several wells in the project vicinity. These reports are listed in the References section.
The County Department of Public Works also conducts measurements of groundwater levels in wells in the project vicinity. Data from five wells were available, but not all were measured regularly over the entire course of the monitoring. Depending on the specific well, these measurements occurred over periods ranging from one to five decades, between the 1950s and the present.
The County Water Master Plan (San Luis Obispo County 2001) provides a review of water supply and demand for separate Water Planning Areas (WPAs) throughout the County. The existing Water Master Plan dates from 1998, but has had several sections updated since then and is undergoing a complete update at the present time (2009). The existing Water Master Plan designates the California Valley region as WPA-8. The Water Master Plan section addressing WPA-8 was updated by the County Water Resources Advisory Committee in 2001, and bases its assessment of groundwater water supply on the 1958 edition of DWR Bulletin 118. The Water Master Plan includes a thoroughly documented estimate of existing and projected future water demands for both rural residential and agricultural uses in the
CVSR HYDROGEOLOGY REPORT
\\Fsspbk01\departments\UPP-NA\Public - Read Only\Permitting Docs\CVSR Working Docs\Dec 2009 Submittal 1 to SLO\Volume 1\Hydrogeology Report Dec 2009\Final Draft Hydrogeology Report(121909) LARSON.doc 1-4
region. A recent Technical Memorandum prepared as part of the Water Master Plan Update (Wallace Group 2009:34-35) re-numbers the Carrizo Plain basin to WPA-10 but retains the previous descriptive information for the area.
A thorough review of groundwater resources in the Carrizo Plain was prepared by Kemnitzer (1967). While unpublished, this report is cited by other studies, including Bulletin 118, and is easily available from the County Planning and Building Department and Public Works Department. Cooper (1990) prepared a master’s thesis dealing with the structure of the Carrizo Plain groundwater basin based on geophysical measurements. This thesis includes groundwater elevation measurements from wells in the project vicinity in 1989. Finally, URS Corporation (2008) prepared a review of available hydrogeologic data and a modeling assessment of the effects of the Ausra project, including a cumulative assessment of the Ausra project in conjunction with the Topaz Solar Farm, on the groundwater resources of the northern portion of the Carrizo Plain. This report was peer-reviewed and its results were incorporated into the draft “Final Staff Assessment” for the Ausra project by the California Energy Commission.
Most of the discussion of the geologic and hydrogeologic setting in the following pages is derived from one or more of the above sources.

CVSR HYDROGEOLOGY REPORT
\\Fsspbk01\departments\UPP-NA\Public - Read Only\Permitting Docs\CVSR Working Docs\Dec 2009 Submittal 1 to SLO\Volume 1\Hydrogeology Report Dec 2009\Final Draft Hydrogeology Report(121909) LARSON.doc 2-1
SECTION 2.0 HYDROGEOLOGY
2.1 GEOLOGIC AND HYDROGEOLOGIC SETTING
The Carrizo Plain Groundwater Basin is situated in a valley that lies between the Caliente Range to the west and the Temblor Range to the east (Figure 2). The San Andreas Fault trends northwest to southeast through the basin and dominating the geology. The fault significantly affects groundwater movement within the basin and forms the plains northeastern boundary. The fault scrap is located within project site boundary. Figure 3a and 3b shows the geologic map of the region.
A stratigraphic column showing the geologic units of the Carrizo Plain is provided in Appendix A. The majority of the Temblor and Caliente Ranges are composed of Miocene-age sedimentary rock consisting of sandstone, shale, conglomerate, and siltstone that have been folded. These materials were originally deposited in marine and non-marine environments. These Tertiary-age sedimentary rocks and Cretaceous-age strata overlie a granitic complex of Mesozoic age. Similarly fault movements, uplift, folding and erosion of these formations has resulted in a complicated stratigraphic sequence. Although the topographic basin containing the Carrizo Plain is closed, and in the project vicinity surface drainage is towards the south into Soda Lake, the underlying geologic basement and the water bearing sedimentary formations are tilted generally towards the north and east (Kemnitzer 1967:35). The primary aquifers in the Carrizo Plain are found in alluvium, the Paso Robles and Morales Formations. Each water-bearing stratigraphic unit is described below. 2.1.1 Alluvium
The surface sediments of the Carrizo Plain consist of Quaternary-age alluvium. The alluvium is present at up to several hundred feet thick, and is at its thickest beneath Soda Lake. The upper Pleistocene to Holocene alluvium consists of unconsolidated to loosely consolidated sands, gravels, and silts with a few beds of compacted clays. 2.1.2 Paso Robles Formation
The alluvium is underlain by the Paso Robles Formation, which outcrops in the hills along the northeast side of the plain. The Paso Robles Formation is a Pleistocene-age alluvial deposit and is about 3,000 feet thick near the San Andreas Fault (Kemnitzer 1967:26, 35). It consists of poorly sorted, mostly loosely consolidated gravels, sands, and silts. Both the younger alluvium and the Paso Robles Formation are derived from material eroded off the surrounding mountains. According to Kemnitzer (1967:35), the western portion of the basin where the formation is thinnest, is relatively more permeable, but most of the formation has
CVSR HYDROGEOLOGY REPORT
\\Fsspbk01\departments\UPP-NA\Public - Read Only\Permitting Docs\CVSR Working Docs\Dec 2009 Submittal 1 to SLO\Volume 1\Hydrogeology Report Dec 2009\Final Draft Hydrogeology Report(121909) LARSON.doc 2-2
sufficient permeability and/or faulting to transmit and store groundwater in useable quantities. The lower portion of the Paso Robles Formation is fine grained and serves as an aquitard and barrier to the mixing of fresh water with poorer quality water that may be present at depth below this formation. 2.1.3 Morales Formation
Morales Formation: The Paso Robles Formation unconformably overlies the Morales Formation. The upper Pliocene Morales Formation consists of sands, gravels, and silts, which are generally more stratified and compacted than those in the overlying Paso Robles. The Morales Formation ranges in thickness from just a few feet to more than 3,000 feet. The Morales is conformable with the underlying Miocene-age strata. 2.2 GROUNDWATER SUPPLY
Groundwater supply in the site vicinity is generally produced from two aquifers, an upper aquifer that is generally less than 300 feet and a lower aquifer that exist in the region at a depth of approximately 450 to 600 feet below the ground surface (bgs). These are referred to as the Upper and Lower Aquifers, respectively, in this document. In some discussions, these are called the upper and lower zones of the shallow aquifer underlying the region, in order to avoid confusion with much deeper water bearing layers that are not affected by groundwater pumping. 2.2.1 Upper Aquifer
Based on review of well information (See Section 2.3), potable water supplied to most residences and ranches for domestic use is derived from shallow wells typically within a depth of about 50 to 300 feet bgs. Kemnitzer (1967) refers to these wells as “Household and Livestock Wells”. In 1967, he identified 89 wells penetrating the Upper Aquifer. No yields were reported for these wells. Based on the well survey conducted by URS in March 2008 for the Ausra project, these shallow wells penetrating the Upper Aquifer probably yield from a few gpm up to 40 gallons per minute (gpm) (URS 2008). In the water budget of Kemnitzer (1967) for the basin, he assumed an average annual production from the 89 household and livestock wells to be approximately 6 afy. With continuous pumping, the average use by these wells would be approximately 4 gpm. 2.2.2 Lower Aquifer
The Lower Aquifer is typically present at a depth of greater than 450 feet. According to Kemnitzer (1967), wells extending to the Lower Aquifer typically yield on the order of 500 to 1,100 gpm. He identified 11 irrigation wells in 1967 and of these, it appears that six were generally greater than 300 feet bgs. These wells are typically used for irrigation. He also identified three “community wells.” One was drilled into this Lower Aquifer. The other two

CVSR HYDROGEOLOGY REPORT
\\Fsspbk01\departments\UPP-NA\Public - Read Only\Permitting Docs\CVSR Working Docs\Dec 2009 Submittal 1 to SLO\Volume 1\Hydrogeology Report Dec 2009\Final Draft Hydrogeology Report(121909) LARSON.doc 2-3
in California Valley, were drilled to depths of 1,019 and 1,865 feet—extending beneath the Lower Aquifer (or lower zone of the shallow aquifer) into deeper layers not tapped by most wells in the region. No data on these well yields are noted by Kemnitzer (1967:12). 2.3 GROUNDWATER DATA RESEARCH AND LAND SURVEY
2.3.1 DWR Well Data Request
Aspen Environmental Group (AEG) a consultant for the County of San Luis Obispo submitted a request for private well completion reports from DWR. On retrieval of the well completion reports AEG reviewed the reports for the location information, surface elevation, installation date, drilling method, construction details, groundwater water levels and well type. AEG assigned unique well identification numbers to the wells, and submitted to URS a well data set with a total of 198 wells (see Table 2-1 and Figure 4).
In addition, a request for available groundwater data was made to the San Luis Obispo County, Department of Public Works. The Department provided a data set of historical groundwater elevation measurements prepared for the DWR from the early 1950s through early 2009. A summary of this groundwater elevation data is provided in Table 2-2.
2.3.2 Historical Data Research
Research of groundwater elevation data from historical DWR publications and other historical reports was also conducted. A summary of the historical groundwater elevation data is also provided in Table 2-2, and the well locations are shown in Figures 4 and 5. Copies of the DRW publications and other reports used are provided in Appendix B.
2.3.3 URS Land Well Survey
On November 17, 2009, a URS geologist and personnel from Filipponi & Thompson Drilling, Inc. conducted a survey of approximately 16 private wells within four-miles of the site. The depth to water in each well was measured using a water level indicator and the locations of each well were recorded using a Global Positioning System (GPS) capable of submeter accuracy. Table 2-3 contains the groundwater elevation results from this survey, and the well locations are labeled in Figure 5. Well owners/residents were interviewed regarding their knowledge of well depth, screening intervals and pumping rate.
2.3.4 Groundwater Data Research and Land Survey Results
The groundwater data research and land survey identified a total of 226 groundwater wells in the vicinity, generally within about six miles of the SunPower project site. A majority of the wells identified were domestic wells that penetrated the Upper Aquifer (or upper zone of the shallow aquifer) from 100 to 300 feet bgs. These wells typically had well yields ranging from

CVSR HYDROGEOLOGY REPORT
\\Fsspbk01\departments\UPP-NA\Public - Read Only\Permitting Docs\CVSR Working Docs\Dec 2009 Submittal 1 to SLO\Volume 1\Hydrogeology Report Dec 2009\Final Draft Hydrogeology Report(121909) LARSON.doc 2-4
4 to 100 gpm. Wells that appeared to penetrate the lower groundwater zone were mostly irrigation wells with flow rates varying from 4 to 500 gpm. A review of the historical groundwater elevation data retrieved from the County Department of Public Works and from other sources indicates that groundwater levels in the basin are relatively stable. Kemnitzer (1967: Table 8 and Figure 10) provides data and groundwater level contours based on 1967 measurements. This information indicates that the groundwater table in the southwest portion of the project is at an elevation of about 1,960 to 1,970 feet above mean sea level. The recent well survey done as part of this report, shows groundwater elevations in this same area ranging between 1,950 and 2,000 feet—virtually identical to the levels over 40 years ago (See Table 2-3 and Figure 6). To the northwest of the project site, along SR 58 in the area of the Simmler townsite and Carrizo Plain School, Kemnitzer (1967:Figure 10) showed that the groundwater was at an elevation of about 1,980 feet. Cooper (1990:Figure 8) shows 1989 groundwater elevations in this same area ranging from 1,980 to 1,990 feet above mean sea level—again not significantly different from groundwater elevations 30 years earlier. A review of data from DWR and the County Department of Public Works in Table 2-2 confirms that there was been very little change in groundwater elevations in this area by 1996 (see wells 30S/18E-01B01, 30S/18E-01C01, and 30S/18E-03D01 in Figure 5) when groundwater elevations ranged generally from 1,970 to 1,990 feet msl). In fact, a review of data from all of the wells in Table 2-2 indicates that most show little or no change over the long period of time. There are seasonal fluctuations, and short trends up to a few years of change either up or down in all of the wells. One or two wells seem to indicate slight declines in groundwater level. For example 30S/18E-01C01 seems to show a general decrease of about 5 feet between 1996 and the present. The overall result, however, is that regional groundwater elevations appear to be stable over the last 40 years or so. This result is consistent with the conclusion of Kemnitzer (1967:62-63) that groundwater elevations remain relatively constant over time. This result is explained by the fact that a significant loss of groundwater via underflow to the north balances excess recharge to the basin and maintains the groundwater elevation at a near constant level, as discussed further in the next section. 2.4 GROUNDWATER BUDGET
According to Kemnitzer (1967: 38-39) the gross annual recharge of the basin is approximately 177,000 acre feet (af). Approximately 118,000 af of the gross recharge is lost annually through evapotranspiration and other nature processes. This leaves approximately 59,000 afy of recharge, which Kemnitzer indicates that 4,000 afy is pumped out via wells and 55,000 afy passes out of the basin as underflow into the northern adjacent groundwater basins. Based on the assumption that approximately 55,000 afy of recharge is passing out of

CVSR HYDROGEOLOGY REPORT
\\Fsspbk01\departments\UPP-NA\Public - Read Only\Permitting Docs\CVSR Working Docs\Dec 2009 Submittal 1 to SLO\Volume 1\Hydrogeology Report Dec 2009\Final Draft Hydrogeology Report(121909) LARSON.doc 2-5
the basin, this volume could be used annually without affecting the overall groundwater levels of the basin. According to the review of historical groundwater elevation data (Section 2.3) it appears that groundwater levels in the basin are relatively stable. While the amount of underflow to the north may not be known exactly, and the exact amount of recharge may vary annually, the relative stability of the groundwater table elevations over time lends support to the description of the groundwater basin above. 2.5 SUNPOWER PROJECT WELL INFORMATION
On January 15 through 16, 2009, Filipponi & Thompson (F&T) drilled and installed water well 2008-325 for the SunPower project. A 10-inch bore hole was drilled via mud rotary drilling methods to a total depth of 400 feet bgs. On completion of drilling the bore hole was backfilled to 330 feet bgs with filter pack. The well casing was constructed with F-480 Polyvinyl Chloride (PVC) 0.40-slot screen from 330 to 150 feet bgs and solid F-480 PVC riser from 150 to the surface. The annular space was backfilled with filter pack from 330 to 50 feet and bentonite grout from 50 feet bgs to the surface. An air lift pump test conducted by the driller indicated an estimated well yield of 45 to 50 gpm. The well completion report for the project well is provided in Appendix C. 2.5.1 Groundwater Quality Samples of groundwater from the project well were submitted to Creek Environmental Laboratories (CEL) in San Luis Obispo, California for water quality analysis. The results of the laboratory analysis are summarized in Table 2-4. The laboratory report from CEL for the water quality analysis is provided in Appendix D. 2.5.2 Pump Test A review of the data and analyses of the pumping test conducted on the project well on March 27, 2009 by F&T indicates that the well is capable meeting the project water requirements for project construction and operation. The static level of water in the well before pumping was 123.7 feet bgs and the pumping rate was set to 25 gpm for a 72 hour period. There was 50.5 feet of drawdown, resulting in a water level of 174.2 feet bgs. At the end of the pump test a 1 hour recovery test was conducted, groundwater levels recovered to 136.5 feet bgs. The pump test data from F&T is provided in Appendix D.
CVSR HYDROGEOLOGY REPORT
\\Fsspbk01\departments\UPP-NA\Public - Read Only\Permitting Docs\CVSR Working Docs\Dec 2009 Submittal 1 to SLO\Volume 1\Hydrogeology Report Dec 2009\Final Draft Hydrogeology Report(121909) LARSON.doc 4-1
SECTION 3.0
GROUNDWATER MODELING AND ANALYSIS
A three-dimensional groundwater flow model was constructed to evaluate the effects of pumping groundwater for the proposed Project from the project well within the Carrizo Plain basin located in San Luis Obispo County, California. The groundwater flow model was developed to evaluate the potential net impacts of project-specific pumping on the aquifer system under and adjacent to the project sites. MODFLOW, a groundwater modeling program developed by the U.S. Geological Survey (USGS), was used for model development and simulations.
The primary objective of this groundwater flow model is to evaluate the net effects of project-specific pumping by:
• Simulating net changes of groundwater flow conditions and aquifer response to project-specific pumping;
• Providing sufficiently fine grid spacing to simulate groundwater pumping via extraction wells
3.1 MODEL CODES AND SOFTWARE
This section briefly describes model computer codes used to build the model.
3.1.1 Groundwater Modeling System Interface
The computer software program chosen as the graphical interface for the modeling effort was the U.S. Department of Defense Groundwater Modeling System (GMS), version 6.0. GMS is a comprehensive graphical user interface (GUI) for performing groundwater simulations. GMS provides a graphical preprocessor and postprocessor interface to several groundwater modeling codes: MODFLOW, MODPATH, MT3DMS, RT3D, FEMWATER, SEEP2D, NUFT, and UTCHEM. The GMS interface was developed by the Environmental Modeling Research Laboratory of Brigham Young University in partnership with the U.S. Army Engineering Waterways Experiment Station. GMS was used to develop a simplified site conceptual hydrogeological model and to convert it into a groundwater flow model.
3.1.2 MODFLOW Groundwater Flow Model
The computer code selected to model groundwater conditions was MODFLOW. MODFLOW is a three-dimensional, cell-centered, finite difference, saturated flow model developed by the USGS (McDonald and Harbaugh, 1988). GMS provides an interface to the updated version, MODFLOW 2000 (Hill et al, 2000). Based on the information available, the uncertainty associated with site information, and the modeling objectives of evaluating
CVSR HYDROGEOLOGY REPORT
\\Fsspbk01\departments\UPP-NA\Public - Read Only\Permitting Docs\CVSR Working Docs\Dec 2009 Submittal 1 to SLO\Volume 1\Hydrogeology Report Dec 2009\Final Draft Hydrogeology Report(121909) LARSON.doc 4-2
the potential net effects of project-specific pumping, MODFLOW was considered an appropriate groundwater flow code.
3.2 NUMERICAL MODEL DEVELOPMENT
A basin wide model was developed to simulate the groundwater conditions and to evaluate the potential effects that the proposed groundwater withdrawals for the proposed projects may have on surrounding wells and the aquifers. The data used to develop the groundwater flow model was primarily provided by URS (2008), the historic well records discussed above in Section 2.3, published reports by Kemnitzer (1967), and others, and the pump test conducted by F&T (Section 2.5).
3.2.1 Model Domain and Grid
The domain of the existing model (URS 2008) was extended to encompass the entire Carrizo Plain basin in which the three projects are located. As shown in Figure 7, the model domain is bounded laterally by the watershed divide for the Carrizo Plain. Vertically, the boundaries include the ground surface elevation at the top, and the bedrock and low-permeability strata at the bottom below the deepest aquifer. The model domain is approximately 46 miles long in the northwest-southeast direction, and has a variable width range from 5 to 12 miles, and covers an area of approximately 427 square miles.
Unlike the existing model, non-uniform grids were used in model finite-difference discretization over the model domain. Specifically, the model domain was spatially discretized into 205 rows and 224 columns, and contains a total of 25,785 active model cells in each model layer. The model grid is refined in the vicinity of the proposed project pumping. A lateral cell size of 50×50 feet was specified in the vicinity of the proposed project pumping, and was increase gradually towards the model domain boundaries. The maximum cell size, at the model boundary, is 2,000×2,000 at the model boundaries, as shown in Figures 8a and 8b.
Vertically, the new model directly used the existing model layers. That is, the water- bearing formations were divided into six model layers: Layers 1 through 3 represent the shallow aquifer (upper and lower zones), and layers 4 and 5 represent the deep aquifer (a deeper, high-permeability water-bearing formation that is below the depth affected by most wells), Layer 6 includes bedrock and low-permeability strata at greater depth. In the shallow aquifer, Layer 1 represents the Upper Aquifer discussed in this report that supplies domestic, livestock, and some irrigation water, and Layer 3 represents the Lower Aquifer that includes most of the large irrigation wells in the region and the screen intervals of the proposed pumping wells of the three projects. All these model layers have spatially-variable thickness, and become thicker from west to east, and south to north. Typical cross-sections along the east-west and south-north directions near the project sites are shown in Figures 9a and 9b.

CVSR HYDROGEOLOGY REPORT
\\Fsspbk01\departments\UPP-NA\Public - Read Only\Permitting Docs\CVSR Working Docs\Dec 2009 Submittal 1 to SLO\Volume 1\Hydrogeology Report Dec 2009\Final Draft Hydrogeology Report(121909) LARSON.doc 4-3
3.2.2 Hydraulic Conductivity
The hydraulic conductivity (K) values were based on the previous and recent aquifer test data, geologic interpretation, and the flow model calibration conducted as part of the current modeling exercise. The horizontal K value (Kh) varies spatially within each model layer. The specified Kh values of the Upper and Lower aquifers range from 0.1 to 3.0 feet/day. The higher end of this range is consistent with the recent pumping test results. Lower Kh values were assigned near Soda Lake and east of the San Andreas Fault. The specified Kh values of the Deeper Aquifers (model layers 4 and 5) range from 15 to 45 feet/day. The high Kh values in the Deep Aquifers are consistent with the presence of ancestral channels of a stream that flowed northward. The Kh value for layer 6 was specified as 0.02 feet/day.
In alluvial aquifer systems of this type vertical hydraulic conductivity is less than the horizontal hydraulic conductivity in unconsolidated sediments. The vertical anisotropic ratio, defined as the ratio of horizontal hydraulic conductivity to the vertical hydraulic conductivity (Kh/Kv ), ranges from approximately 20 to 300 for the 6 model layers. The low vertical hydraulic conductivity is consistent with the well logs that indicate substantial heterogeneity with a significant volume fraction of clay.
3.2.3 Specific Yield and Specific Storage
Since no site-specific data are available on the specific yield (Sy) and the specific storage (Ss), these two input parameters were set to their typical literature value of 0.2 and 0.00001 (1/ft). Since the project pumping is from the confined Lower Aquifer (model layer 3), the value of Sy has little effect on the drawdown caused by project-specific pumping. Since the hydraulic conductivity is relatively high in the Lower Aquifer, the effects of specific storage are also small.
3.2.4 Pumping
A total of 264 pumping wells were identified in the model domain and incorporated into the model, including the 118 wells from the existing model. Wells with an estimated capacity were assigned pumping rate with 25-100% of the capacity, depending on the well capacity and types. Domestic wells were assigned a steady-state of 12 gpm. When no information on well capacity was available, wells were assigned a steady-state of 12 gpm. Wells were assigned to the respective model layer based on the reported screen intervals where available, otherwise wells were assumed to be screened in the shallow aquifer.
The model also simulates project-specific pumping from the proposed pumping wells. The proposed pumping locations are shown in Figure 7. The proposed projects are assumed to pumping groundwater from Lower Aquifer (model layer 3), and the proposed pumping rates for all three projects are discussed in Model Simulation Section.
CVSR HYDROGEOLOGY REPORT
\\Fsspbk01\departments\UPP-NA\Public - Read Only\Permitting Docs\CVSR Working Docs\Dec 2009 Submittal 1 to SLO\Volume 1\Hydrogeology Report Dec 2009\Final Draft Hydrogeology Report(121909) LARSON.doc 4-4
3.2.5 Recharge and Evapotranspiration (ET)
The precipitation on the Carrizo Plain is reportedly 7 to 9 inches per year, and it is sporadic, infrequent and undependable. Infiltration of a portion of the stormwater that falls on the site will offset the makeup water requirement for the facility and also serve to recharge the Upper Aquifer that is used by the local community as a drinking water supply. Recharge within the model domain is primarily attributable to infiltration from irrigation and infiltration from precipitation.
Annual recharge rates ranging from 1.8 to 4.0 inch/year were applied to layer 1 of the model. The estimated recharge varies spatially to represent greater precipitation rates in the northwest region of the basin (Kemnitzer 1967), the ground surface condition, and the evapotranspiration (ET) of the farm land. The final recharge rate distribution was derived from flow calibration. The overall modeled rate of recharge to the aquifer is approximately 59,000 afy.
ET process was also modeled using the MODFLOW ET package. The maximum ET rate was estimated at 5.5 feet/year and the extinction depth (i.e., the depth at which there is no ET) was estimated at 15 feet below ground surface.
3.2.6 Boundary Conditions
Similar to the existing model, no-flow boundary conditions were set to all model edges except at the northern end of the model domain where general-head boundaries (GHB) were applied. The GHB at the northern end of the model domain represented underflow from the basin at its northern end into the adjacent La Yeguas and the San Juan subsurface drainage area.
The San Andreas Fault is assumed to impede the flow of groundwater from northeast to southwest. The hydraulic effects of the San Andreas Fault are simulated with horizontal flow barriers (HFBs) using the MODFLOW HFB package. The locations of HFBs corresponding to the San Andreas Fault are shown on Figure 7.
To fully use the information from the input and output of an existing model developed for the Carrizo Plain basin, the groundwater flow model using MODFLOW was developed by modifying the existing flow model.
3.3 SCENARIOS SIMULATION
The model was used to simulate groundwater response associated with the project-specific pumping. The groundwater model was conducted for scenarios of with and without project pumping, and the differences between the modeled hydraulic heads derived from model simulations with and without project pumping represent the net impacts of the project-specific pumping.

CVSR HYDROGEOLOGY REPORT
\\Fsspbk01\departments\UPP-NA\Public - Read Only\Permitting Docs\CVSR Working Docs\Dec 2009 Submittal 1 to SLO\Volume 1\Hydrogeology Report Dec 2009\Final Draft Hydrogeology Report(121909) LARSON.doc 4-5
3.3.1 No-project (Pre-Construction) Scenario
The model was first run for non-project scenario (Pre-construction). Although groundwater fluctuates seasonally as a result of recharge and discharge (groundwater pumping and outflow from the basin), a steady-state flow representing the average groundwater conditions was simulated without including the project pumping. Figures 10 and 11 show the model simulated steady-state (average) groundwater head distributions in the Upper and Lower Aquifers before the construction of the projects.
As shown in Figure 10, groundwater in the Upper Aquifer (model layer 3) generally follows the topography and is directed towards Soda Lake (lowest surface elevations) at the center of model domain. However, at the northwest there is substantial subsurface flow in a northwest direction out of the basin, which is consistent with the interpretation by Kemnitzer (1967). In the Lower Aquifer (model layer 3), the groundwater flows towards northwest boundary and out of the basin, as shown in Figure 11.
3.3.2 Project Scenario
In project scenario simulation, the steady-state head distribution derived from the no-project scenario was used as the initial condition. Consequently, the simulated changes in hydraulic heads over the initial condition (initial heads) are the net changed in hydraulic head caused by project-specific pumping.
The scenario simulation was run for the 3 years of project construction and 30 years of project operation. In addition, the scenarios were run for additional 10 years after the project shutdown so that the groundwater recovery processes can also be evaluated. The project-specific pumping is assumed to be from the Lower Aquifer (model layer 3). For simplicity, the project pumping is assumed to be continuous throughout the 3 years construction and 30 year operation. During the operation phase, SunPower will be required to keep the on-site water tank full in order to meet fire flow requirements of the County. This requirement will preclude the option of scheduling pumping for only a portion of the year, and will require pumping as a low and consistent rate throughout the year during the entire operation phase. The project pumping includes:
SunPower: • 3 years of construction, with project pumping of 46.4 afy. • 30 years of operation, with project pumping of 10.1 afy
Ausra: • 3 years of construction and 30 years of operation, both with project
pumping of 20.8 afy

CVSR HYDROGEOLOGY REPORT
\\Fsspbk01\departments\UPP-NA\Public - Read Only\Permitting Docs\CVSR Working Docs\Dec 2009 Submittal 1 to SLO\Volume 1\Hydrogeology Report Dec 2009\Final Draft Hydrogeology Report(121909) LARSON.doc 4-6
Topaz: • 3 years of construction and 30 years of operation, both with project
pumping of 26.8 afy
For the Ausra and Topaz facilities, the total volume of water used during construction will be less than the total estimated volume of water that will be used during the operation of the facility each year. Therefore, inclusion of the volume used for operations in model simulations for construction activities is considered to be conservative.
To show the net changes in hydraulic head caused by project-specific pumping, observation points were added at locations of 100, 200, 400, 800 feet, and 0.25, 0.5, 1.0, 2.0 miles from the respective pumping wells. The modeled drawdowns caused by the project-specific pumping at specific locations are shown Figures 12, 13, and 14 for SunPower, Topaz, and Ausra project, respectively. The results are also listed in Table 3-1.
As shown in the table and figures, the impacts of project-specific pumping are limited to the area within approximately 0.5 mile from the pumping well. The maximum drawdown at a distance of 0.5 mile from the pumping well is approximately 0.2 feet for each of the three projects
The snapshot of net changes of hydraulic head caused by project-specific pumping are also derived. Specifically, the net drawdowns at the end of construction, and at the end of 30 years during the operation are plotted in Figures 15 and 16, respectively. The modeled drawdown in 6 months after the shutdown of the projects is essentially “0” (net drawdown of less than 0.15 foot at each pumping site) so no figure of this recovery is included.
CVSR HYDROGEOLOGY REPORT
\\Fsspbk01\departments\UPP-NA\Public - Read Only\Permitting Docs\CVSR Working Docs\Dec 2009 Submittal 1 to SLO\Volume 1\Hydrogeology Report Dec 2009\Final Draft Hydrogeology Report(121909) LARSON.doc 4-1
SECTION 4.0 CONCLUSIONS
Based on this study, the following conclusions are offered:
1. The Carrizo Plain groundwater basin is in a steady state, with annual recharge offset by the relatively small volume of groundwater pumping used for domestic, livestock watering, and some irrigation, and the outflow of groundwater towards the north. This conclusion is supported by the fact that extensive long-term records covering about a dozen wells in the region indicate little or no change in groundwater elevations from the 1960s to the present day. Small variations and limited short-term trends are seen, but there is no consistent pattern that would indicate overdraft of the basin caused by groundwater pumping.
2. The estimated recharge of 600 afy year in the 1958 edition of Bulletin 118 was apparently based on estimates of groundwater use and the fact that the water table appeared to be unaffected by that rate of use. This estimate did not account for any other losses from the basin, such as underflow to the north.
3. The later estimates by Kemnitzer (1967) are summarized as follows:
Recharge to aquifer (Upper and Lower Aquifers as used in this report): 59,000 afy
Approximate groundwater pumping for domestic and agricultural uses: 4,000 afy
Underflow (from both Upper and Lower Aquifers) to the north: 55,000 afy
From these estimates, Kemnitzer (1967) concludes that 55,000 afy are available for additional groundwater development.
4. Model results indicate modest drawdown of the water table (approximately 2.5 feet) in the immediate vicinity of the project well, and in the vicinity of each of the other project wells in this study. At relatively short distances from each of the wells, the drawdown quickly reduces to very low values (a small fraction of one foot).
5. Within the 30-year model period, there is no combination effect between the SunPower project well and either of the other two solar project wells (Ausra and Topaz). There is a small, but insignificant overlap of effects from the other two projects, which is only apparent in the model results for drawdown of a small fraction of a foot.
CVSR HYDROGEOLOGY REPORT
\\Fsspbk01\departments\UPP-NA\Public - Read Only\Permitting Docs\CVSR Working Docs\Dec 2009 Submittal 1 to SLO\Volume 1\Hydrogeology Report Dec 2009\Final Draft Hydrogeology Report(121909) LARSON.doc 5-1
SECTION 5.0 MODEL LIMITATIONS
The model was constructed in a cost-effective way to meet the objectives of this study: to evaluate the effect of the proposed pumping on the groundwater elevation in the general vicinity of the project. Any groundwater model, including this screening-type model, is a simplification of the natural environment and therefore has recognized limitations.
CVSR HYDROGEOLOGY REPORT
\\Fsspbk01\departments\UPP-NA\Public - Read Only\Permitting Docs\CVSR Working Docs\Dec 2009 Submittal 1 to SLO\Volume 1\Hydrogeology Report Dec 2009\Final Draft Hydrogeology Report(121909) LARSON.doc 6-1
SECTION 6.0 RERERENCES
California Department of Water Recourses (DWR), 1961. Water Supply Conditions in Southern California During 1959-60, Volume II, Water Level Data, Central Coastal and Las Angeles Region, DWR Bulletin 39-60. December 1962.
1965. Hydrologic Data: 1963, Volume V: Southern California, Appendix C: Groundwater Measurements, Part 1, Central Coastal and Los Angeles Drainage Provinces, DWR Bulletin 130-63. July 1965.
1966. Hydrologic Data: 1964, Volume V: Southern California, Appendix C: Groundwater Measurements, Part 1, Central Coastal and Los Angeles Drainage Provinces, DWR Bulletin 130-64. July 1966.
1965. Hydrologic Data: 1966, Volume V: Southern California, Appendix C: Groundwater Measurements, DWR Bulletin 130-65. July 1967.
2003. California's Groundwater Bulletin 118, Hydrological Region Central Coast, Carrizo Plain Groundwater Basin (No. 3-19). Last viewed on December 16, 2009 at http://www.water.ca.gov/groundwater/bulletin118/statewide_regionspecific.cfm http://www.groundwater.water.ca.gov/bulletin118/prev_b118_rpts/index.cfm.
California Regional Water Quality Control Board. 1994. Water Quality Control Plan. Amended
through 2008. California RWQCB, Central Coast Region, San Luis Obispo, CA. Cooper, J. W., 1990. A Geophysical study of the Hydrogeology of the Carrizo Plain Area, San Luis
Obispo County, California, M.S. Thesis, San Jose State University. May. Dibblee, Jr., T. W., 1962. Displacements on the San Andreas Rift Zone and Related Structures in
Carrizo Plain and San Andreas Fault, San Joaquin Geological Society, Bakersfield, California.
Dibblee, Jr., T.W., Graham, S.E., Mahony, T.M., Blissenbach, J.L., Mariant, J.J., and Wentworth,
C.M., 1999. “Regional Geologic Map of San Andreas and Related Faults in Carrizo Plain, Temblor, Caliente, and La Panza Ranges and Vicinity, California: A Digital Database,” USGS Open File Report 99.
Jennings, Charles W., 1994. Fault Activity Map of California and Adjacent Areas, with Locations and
Ages of Recent Volcanic Eruptions, California Division of Mines and Geology, California Geologic Data Map Series, Map No. 6.
Kemnitzer, William J., 1967, Groundwater in the Carrizo Plain, Economic Geologist, Menlo Park,
California. Unpublished paper available from the County of San Luis Obispo Planning and Building Department.
CVSR HYDROGEOLOGY REPORT
\\Fsspbk01\departments\UPP-NA\Public - Read Only\Permitting Docs\CVSR Working Docs\Dec 2009 Submittal 1 to SLO\Volume 1\Hydrogeology Report Dec 2009\Final Draft Hydrogeology Report(121909) LARSON.doc 6-2
San Luis Obispo County. 2001. Master Water Plan. Prepared by EDAW, 1998, and the County Water Resources Advisory Committee for the County Department of Public Works, Division of Water Resources, San Luis Obispo, CA. Last viewed on December 16, 2009 at: http://www.slocountywater.org/site/Frequent%20Downloads/Master%20Water%20Plan/Table%20of%20Contents/index.htm
Triton Environmental Group, Inc., 2002. Groundwater Resources Evaluation, California Springs
Lodge & Resort, California Valley. July 3. United States Geologic Survey (USGS), various years. USGS Topographic Quad Maps (California
Valley 1966, La Panza NE 1973, Simmler 1982, Las Yeguas Ranch 1973). URS Corporation, 2008. Hydrology and Hydrogeology Report for the Vicinity of the Proposed
Carrizo Energy Solar Farm San Luis Obispo County, California, Carrizo Energy, June, 26 Wallace Group. September 29, 2009. Technical Memorandum No. 2, Task C.3 Water Supply
Inventory and Assessment – Description of Water resources. Prepared for Carollo Engineers and available from the Water Resources Division of the San Luis Obispo County Department of Public Works, San Luis Obispo, CA. Last viewed December 2009 at: http://www.slocountywater.org/site/index.htm

TABLES
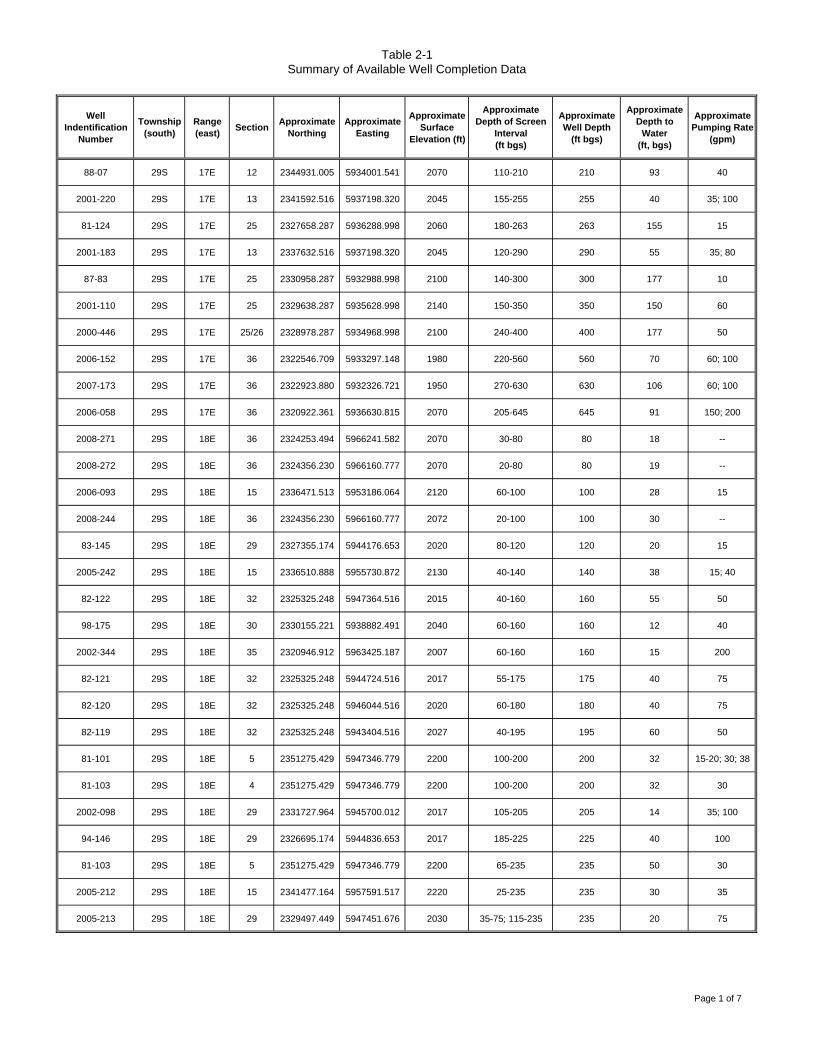
Table 2-1Summary of Available Well Completion Data
Well Indentification
Number
Township (south)
Range (east) Section Approximate
NorthingApproximate
Easting
Approximate Surface
Elevation (ft)
Approximate Depth of Screen
Interval (ft bgs)
Approximate Well Depth
(ft bgs)
Approximate Depth to
Water(ft, bgs)
Approximate Pumping Rate
(gpm)
88-07 29S 17E 12 2344931.005 5934001.541 2070 110-210 210 93 40
2001-220 29S 17E 13 2341592.516 5937198.320 2045 155-255 255 40 35; 100
81-124 29S 17E 25 2327658.287 5936288.998 2060 180-263 263 155 15
2001-183 29S 17E 13 2337632.516 5937198.320 2045 120-290 290 55 35; 80
87-83 29S 17E 25 2330958.287 5932988.998 2100 140-300 300 177 10
2001-110 29S 17E 25 2329638.287 5935628.998 2140 150-350 350 150 60
2000-446 29S 17E 25/26 2328978.287 5934968.998 2100 240-400 400 177 50
2006-152 29S 17E 36 2322546.709 5933297.148 1980 220-560 560 70 60; 100
2007-173 29S 17E 36 2322923.880 5932326.721 1950 270-630 630 106 60; 100
2006-058 29S 17E 36 2320922.361 5936630.815 2070 205-645 645 91 150; 200
2008-271 29S 18E 36 2324253.494 5966241.582 2070 30-80 80 18 --
2008-272 29S 18E 36 2324356.230 5966160.777 2070 20-80 80 19 --
2006-093 29S 18E 15 2336471.513 5953186.064 2120 60-100 100 28 15
2008-244 29S 18E 36 2324356.230 5966160.777 2072 20-100 100 30 --
83-145 29S 18E 29 2327355.174 5944176.653 2020 80-120 120 20 15
2005-242 29S 18E 15 2336510.888 5955730.872 2130 40-140 140 38 15; 40
82-122 29S 18E 32 2325325.248 5947364.516 2015 40-160 160 55 50
98-175 29S 18E 30 2330155.221 5938882.491 2040 60-160 160 12 40
2002-344 29S 18E 35 2320946.912 5963425.187 2007 60-160 160 15 200
82-121 29S 18E 32 2325325.248 5944724.516 2017 55-175 175 40 75
82-120 29S 18E 32 2325325.248 5946044.516 2020 60-180 180 40 75
82-119 29S 18E 32 2325325.248 5943404.516 2027 40-195 195 60 50
81-101 29S 18E 5 2351275.429 5947346.779 2200 100-200 200 32 15-20; 30; 38
81-103 29S 18E 4 2351275.429 5947346.779 2200 100-200 200 32 30
2002-098 29S 18E 29 2331727.964 5945700.012 2017 105-205 205 14 35; 100
94-146 29S 18E 29 2326695.174 5944836.653 2017 185-225 225 40 100
81-103 29S 18E 5 2351275.429 5947346.779 2200 65-235 235 50 30
2005-212 29S 18E 15 2341477.164 5957591.517 2220 25-235 235 30 35
2005-213 29S 18E 29 2329497.449 5947451.676 2030 35-75; 115-235 235 20 75
Page 1 of 7

Table 2-1Summary of Available Well Completion Data
Well Indentification
Number
Township (south)
Range (east) Section Approximate
NorthingApproximate
Easting
Approximate Surface
Elevation (ft)
Approximate Depth of Screen
Interval (ft bgs)
Approximate Well Depth
(ft bgs)
Approximate Depth to
Water(ft, bgs)
Approximate Pumping Rate
(gpm)
90-459 29S 18E 30 2330155.221 5938882.491 2045 140-240 240 40 100
81-165 29S 18E 29 2327355.174 5945496.653 2020 130-250 250 20 150
88-312 29S 18E 29 2327355.174 5946816.653 2020 115-155, 175-255 255 15 150
81-16 29S 18E 30 2326855.221 5942182.491 2025 100-263 263 30 150
81-283 29S 18E 29 2328675.174 5945496.653 2020 40-300 300 15 30
2005-309 29S 18E 22 2334577.328 5953237.071 2080 35-195; 235-315 315 40 25
81-178 29S 18E 29 2328675.174 5945496.653 2020 280-360 360 10 300+
82-232 29S 18E 34 2323055.489 5956169.151 -- 155-195, 220-280, 340-380 380 -- --
84-67 29S 18E 35 2320946.912 5960785.187 2005 530-550, 570-600 600 27 300
29S/18E-28 29S 18E 28 2328519.448 5950914.145 2031.9 75-630 630 30 500
2008-245 29S 18E 36 2322712.502 5967453.712 2075 -- -- -- --
86-05 29S 19E 30 2329347.203 5973542.408 2200 40-140; 200-248 248 20 25
91-407 29S 19E 24 2332717.600 5998885.024 3400 40-160; 180-200 200 35 100
92-172 29S 19E 5 2349267.620 5978020.000 2900 70-180 180 55 15-20
2008-147 30S 17E 26 2300656.107 5926099.041 1750 120-500 500 100 7
74-364 30S 18E 4 2319225.538 5952003.261 2010 60-80 80 27 --
2000-281 30S 18E 23 2303679.489 5961633.261 2030 -- 100 60 5
2005-389 30S 18E 24 2300881.723 5969069.220 1965 60-100 100 14 20
73-198 30S 18E 24 2301573.655 5966275.961 1960 65-105 105 12 --
90-648 30S 18E 24 2299593.655 5965615.961 1975 100-120 120 15 15
90-647 30S 18E 24 2299593.655 5965615.961 1975 100-120 120 18 15
96-142 30S 18E 23 2301039.489 5960313.261 2000 80-120 120 41 --
96-143 30S 18E 23 2301039.489 5960313.261 2000 80-120 120 32 --
2007-311 30S 18E 24 5968099.492 2300969.099 1959 30-120 120 10 50
2007-328 30S 18E 24 5968900.796 2301660.972 1954 30-120 120 10 50+
2007-329 30S 18E 24 5968934.930 2302965.072 1953 30-120 120 10 75
80-64 30S 18E 23 2302359.489 5961633.261 2030 80-128 128 80 25
2007-312 30S 18E 25 5968147.422 2299198.480 1964 35-135 135 10 50
89-297 30S 18E 10 2313774.004 5954563.940 2000 20-160 160 15 70+
Page 2 of 7
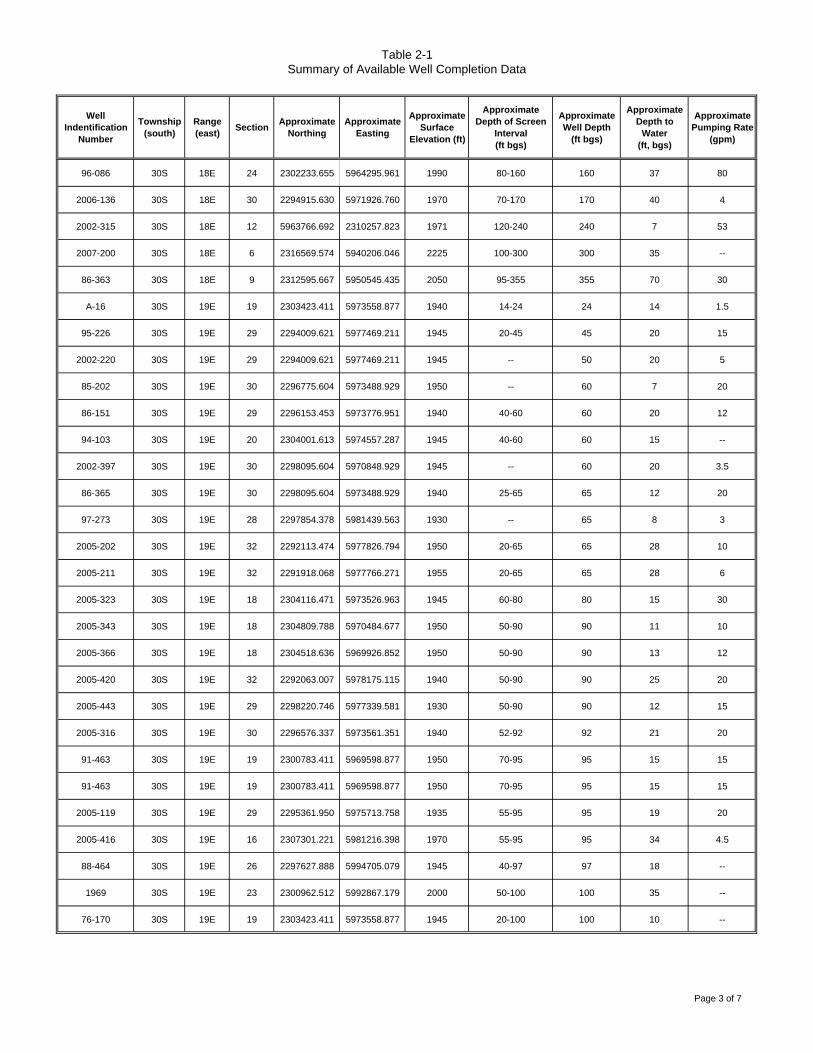
Table 2-1Summary of Available Well Completion Data
Well Indentification
Number
Township (south)
Range (east) Section Approximate
NorthingApproximate
Easting
Approximate Surface
Elevation (ft)
Approximate Depth of Screen
Interval (ft bgs)
Approximate Well Depth
(ft bgs)
Approximate Depth to
Water(ft, bgs)
Approximate Pumping Rate
(gpm)
96-086 30S 18E 24 2302233.655 5964295.961 1990 80-160 160 37 80
2006-136 30S 18E 30 2294915.630 5971926.760 1970 70-170 170 40 4
2002-315 30S 18E 12 5963766.692 2310257.823 1971 120-240 240 7 53
2007-200 30S 18E 6 2316569.574 5940206.046 2225 100-300 300 35 --
86-363 30S 18E 9 2312595.667 5950545.435 2050 95-355 355 70 30
A-16 30S 19E 19 2303423.411 5973558.877 1940 14-24 24 14 1.5
95-226 30S 19E 29 2294009.621 5977469.211 1945 20-45 45 20 15
2002-220 30S 19E 29 2294009.621 5977469.211 1945 -- 50 20 5
85-202 30S 19E 30 2296775.604 5973488.929 1950 -- 60 7 20
86-151 30S 19E 29 2296153.453 5973776.951 1940 40-60 60 20 12
94-103 30S 19E 20 2304001.613 5974557.287 1945 40-60 60 15 --
2002-397 30S 19E 30 2298095.604 5970848.929 1945 -- 60 20 3.5
86-365 30S 19E 30 2298095.604 5973488.929 1940 25-65 65 12 20
97-273 30S 19E 28 2297854.378 5981439.563 1930 -- 65 8 3
2005-202 30S 19E 32 2292113.474 5977826.794 1950 20-65 65 28 10
2005-211 30S 19E 32 2291918.068 5977766.271 1955 20-65 65 28 6
2005-323 30S 19E 18 2304116.471 5973526.963 1945 60-80 80 15 30
2005-343 30S 19E 18 2304809.788 5970484.677 1950 50-90 90 11 10
2005-366 30S 19E 18 2304518.636 5969926.852 1950 50-90 90 13 12
2005-420 30S 19E 32 2292063.007 5978175.115 1940 50-90 90 25 20
2005-443 30S 19E 29 2298220.746 5977339.581 1930 50-90 90 12 15
2005-316 30S 19E 30 2296576.337 5973561.351 1940 52-92 92 21 20
91-463 30S 19E 19 2300783.411 5969598.877 1950 70-95 95 15 15
91-463 30S 19E 19 2300783.411 5969598.877 1950 70-95 95 15 15
2005-119 30S 19E 29 2295361.950 5975713.758 1935 55-95 95 19 20
2005-416 30S 19E 16 2307301.221 5981216.398 1970 55-95 95 34 4.5
88-464 30S 19E 26 2297627.888 5994705.079 1945 40-97 97 18 --
1969 30S 19E 23 2300962.512 5992867.179 2000 50-100 100 35 --
76-170 30S 19E 19 2303423.411 5973558.877 1945 20-100 100 10 --
Page 3 of 7
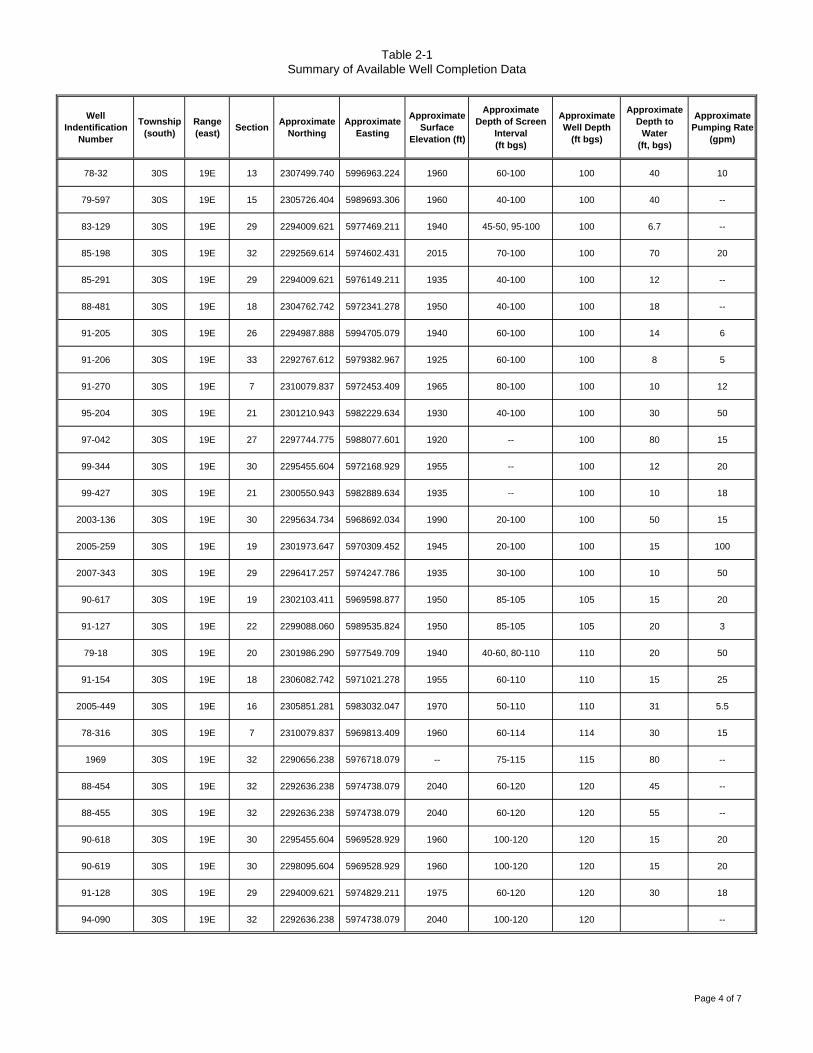
Table 2-1Summary of Available Well Completion Data
Well Indentification
Number
Township (south)
Range (east) Section Approximate
NorthingApproximate
Easting
Approximate Surface
Elevation (ft)
Approximate Depth of Screen
Interval (ft bgs)
Approximate Well Depth
(ft bgs)
Approximate Depth to
Water(ft, bgs)
Approximate Pumping Rate
(gpm)
78-32 30S 19E 13 2307499.740 5996963.224 1960 60-100 100 40 10
79-597 30S 19E 15 2305726.404 5989693.306 1960 40-100 100 40 --
83-129 30S 19E 29 2294009.621 5977469.211 1940 45-50, 95-100 100 6.7 --
85-198 30S 19E 32 2292569.614 5974602.431 2015 70-100 100 70 20
85-291 30S 19E 29 2294009.621 5976149.211 1935 40-100 100 12 --
88-481 30S 19E 18 2304762.742 5972341.278 1950 40-100 100 18 --
91-205 30S 19E 26 2294987.888 5994705.079 1940 60-100 100 14 6
91-206 30S 19E 33 2292767.612 5979382.967 1925 60-100 100 8 5
91-270 30S 19E 7 2310079.837 5972453.409 1965 80-100 100 10 12
95-204 30S 19E 21 2301210.943 5982229.634 1930 40-100 100 30 50
97-042 30S 19E 27 2297744.775 5988077.601 1920 -- 100 80 15
99-344 30S 19E 30 2295455.604 5972168.929 1955 -- 100 12 20
99-427 30S 19E 21 2300550.943 5982889.634 1935 -- 100 10 18
2003-136 30S 19E 30 2295634.734 5968692.034 1990 20-100 100 50 15
2005-259 30S 19E 19 2301973.647 5970309.452 1945 20-100 100 15 100
2007-343 30S 19E 29 2296417.257 5974247.786 1935 30-100 100 10 50
90-617 30S 19E 19 2302103.411 5969598.877 1950 85-105 105 15 20
91-127 30S 19E 22 2299088.060 5989535.824 1950 85-105 105 20 3
79-18 30S 19E 20 2301986.290 5977549.709 1940 40-60, 80-110 110 20 50
91-154 30S 19E 18 2306082.742 5971021.278 1955 60-110 110 15 25
2005-449 30S 19E 16 2305851.281 5983032.047 1970 50-110 110 31 5.5
78-316 30S 19E 7 2310079.837 5969813.409 1960 60-114 114 30 15
1969 30S 19E 32 2290656.238 5976718.079 -- 75-115 115 80 --
88-454 30S 19E 32 2292636.238 5974738.079 2040 60-120 120 45 --
88-455 30S 19E 32 2292636.238 5974738.079 2040 60-120 120 55 --
90-618 30S 19E 30 2295455.604 5969528.929 1960 100-120 120 15 20
90-619 30S 19E 30 2298095.604 5969528.929 1960 100-120 120 15 20
91-128 30S 19E 29 2294009.621 5974829.211 1975 60-120 120 30 18
94-090 30S 19E 32 2292636.238 5974738.079 2040 100-120 120 --
Page 4 of 7
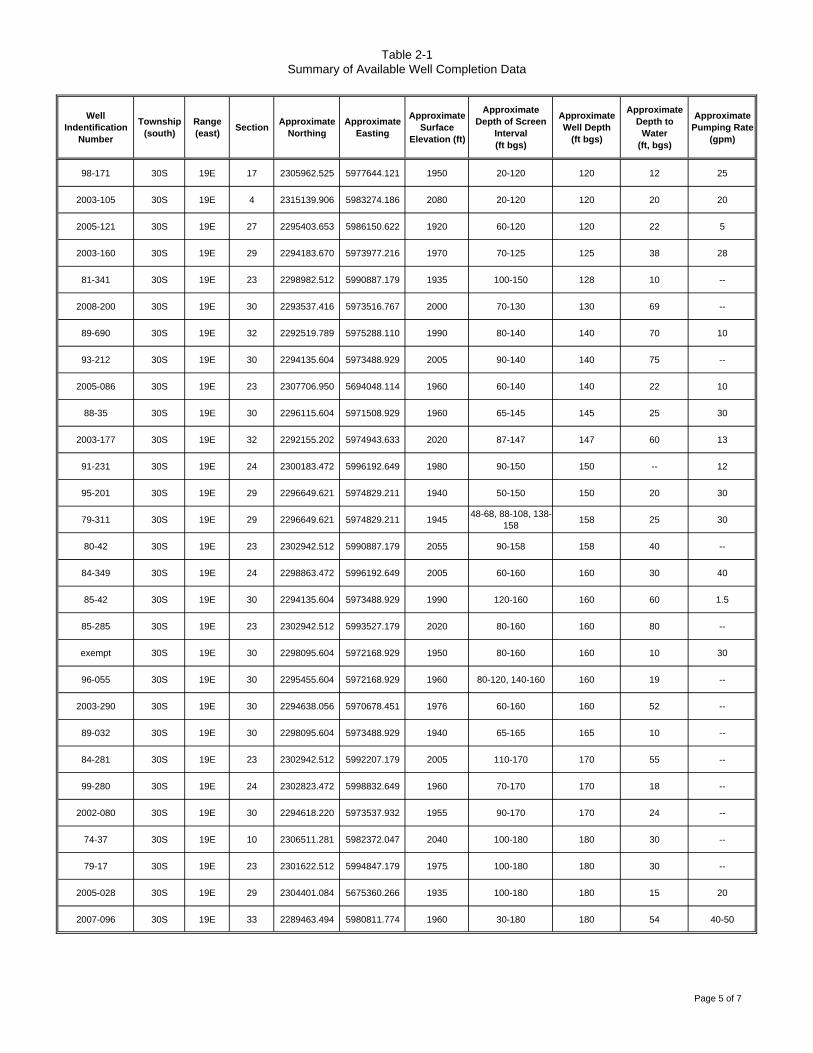
Table 2-1Summary of Available Well Completion Data
Well Indentification
Number
Township (south)
Range (east) Section Approximate
NorthingApproximate
Easting
Approximate Surface
Elevation (ft)
Approximate Depth of Screen
Interval (ft bgs)
Approximate Well Depth
(ft bgs)
Approximate Depth to
Water(ft, bgs)
Approximate Pumping Rate
(gpm)
98-171 30S 19E 17 2305962.525 5977644.121 1950 20-120 120 12 25
2003-105 30S 19E 4 2315139.906 5983274.186 2080 20-120 120 20 20
2005-121 30S 19E 27 2295403.653 5986150.622 1920 60-120 120 22 5
2003-160 30S 19E 29 2294183.670 5973977.216 1970 70-125 125 38 28
81-341 30S 19E 23 2298982.512 5990887.179 1935 100-150 128 10 --
2008-200 30S 19E 30 2293537.416 5973516.767 2000 70-130 130 69 --
89-690 30S 19E 32 2292519.789 5975288.110 1990 80-140 140 70 10
93-212 30S 19E 30 2294135.604 5973488.929 2005 90-140 140 75 --
2005-086 30S 19E 23 2307706.950 5694048.114 1960 60-140 140 22 10
88-35 30S 19E 30 2296115.604 5971508.929 1960 65-145 145 25 30
2003-177 30S 19E 32 2292155.202 5974943.633 2020 87-147 147 60 13
91-231 30S 19E 24 2300183.472 5996192.649 1980 90-150 150 -- 12
95-201 30S 19E 29 2296649.621 5974829.211 1940 50-150 150 20 30
79-311 30S 19E 29 2296649.621 5974829.211 1945 48-68, 88-108, 138-158 158 25 30
80-42 30S 19E 23 2302942.512 5990887.179 2055 90-158 158 40 --
84-349 30S 19E 24 2298863.472 5996192.649 2005 60-160 160 30 40
85-42 30S 19E 30 2294135.604 5973488.929 1990 120-160 160 60 1.5
85-285 30S 19E 23 2302942.512 5993527.179 2020 80-160 160 80 --
exempt 30S 19E 30 2298095.604 5972168.929 1950 80-160 160 10 30
96-055 30S 19E 30 2295455.604 5972168.929 1960 80-120, 140-160 160 19 --
2003-290 30S 19E 30 2294638.056 5970678.451 1976 60-160 160 52 --
89-032 30S 19E 30 2298095.604 5973488.929 1940 65-165 165 10 --
84-281 30S 19E 23 2302942.512 5992207.179 2005 110-170 170 55 --
99-280 30S 19E 24 2302823.472 5998832.649 1960 70-170 170 18 --
2002-080 30S 19E 30 2294618.220 5973537.932 1955 90-170 170 24 --
74-37 30S 19E 10 2306511.281 5982372.047 2040 100-180 180 30 --
79-17 30S 19E 23 2301622.512 5994847.179 1975 100-180 180 30 --
2005-028 30S 19E 29 2304401.084 5675360.266 1935 100-180 180 15 20
2007-096 30S 19E 33 2289463.494 5980811.774 1960 30-180 180 54 40-50
Page 5 of 7

Table 2-1Summary of Available Well Completion Data
Well Indentification
Number
Township (south)
Range (east) Section Approximate
NorthingApproximate
Easting
Approximate Surface
Elevation (ft)
Approximate Depth of Screen
Interval (ft bgs)
Approximate Well Depth
(ft bgs)
Approximate Depth to
Water(ft, bgs)
Approximate Pumping Rate
(gpm)
2003-393 30S 19E 17 2305146.273 5975594.298 1950 30-130, 150-190 190 14 40
2005-253 30S 19E 30 2297958.096 5971791.487 1945 135-195 195 43 12
2005-244 30S 19E 18 2309481.252 5970512.007 1960 140-200 200 10 35
78-315 30S 19E 7 2313379.837 5970473.409 1980 100-204 204 60 30
2004-124 30S 19E 19 2304135.440 5969605.946 1950 40-80, 140-200, 220-235 235 14 --
78-31 30S 19E 13 2307499.740 5996963.224 1960 80-240 240 16 --
89-371 30S 19E 28 2297854.378 5982759.563 1930 200-250 250 18 --
73-66 30S 19E 10 2311719.325 5987827.546 -- 140-265 265 30 --
78-314 30S 19E 19 2302103.411 5972238.877 1945 160-265 265 30 30
83-265 30S 19E 25 2295517.160 5998029.558 2000 125-265 265 160 15
88-18 30S 19E 14 2307588.562 5994294.961 1975 95-275 275 18 100
79-515 30S 19E 14 2304288.562 5990994.961 2040 100-280 280 120 10
84-357 30S 19E 25 2297497.160 5997369.558 1985 246-290 290 -- --
92-79 30S 19E 23 2300302.512 5994847.179 1980 15-35, 95-155, 275-295 295 30 10
88-486 30S 19E 34 2287921.460 5985260.761 1920 180-300 300 -- --
2003-513 30S 19E 23 2303496.316 5958754.702 2050 100-300 300 50 --
2008-325 30S 19E 3 2315521.642 5989343.305 2190 150-330 330 125 45-50
80-54 30S 19E 29 2294009.621 5976149.211 1935 -- -- -- --
80-222 30S 19E 26 2296307.888 5994705.079 1930 -- -- -- --
81-78 30S 19E 8 2313925.937 5979077.014 2070 66-128 -- 30 5+
91-251 30S 19E 30 2294135.604 5972168.929 2010 -- -- 74 15
98-112 30S 19E 22 2300408.060 5986895.824 1940 -- -- -- --
99-432 30S 19E 7 2314505.691 5973569.376 2020 -- -- 50 5
2008-324 30S 19E 10 2311651.325 5987655.413 2095 -- -- -- --
91-116 30S 20E 29 2296624.049 6007336.760 2120 80-110 110 16 12
1972 30S 20E 19 2300730.704 6003457.273 2080 -- 119 -- --
91-122 30S 20E 30 2296725.046 6002029.100 2065 80-120 120 30 7
80-223 30S 20E 31 2292069.316 6005204.947 2000 90-160 160 66 7+
2006-050 30S 20E 18 2307244.844 6004707.753 2240 125-165 165 97 10
Page 6 of 7
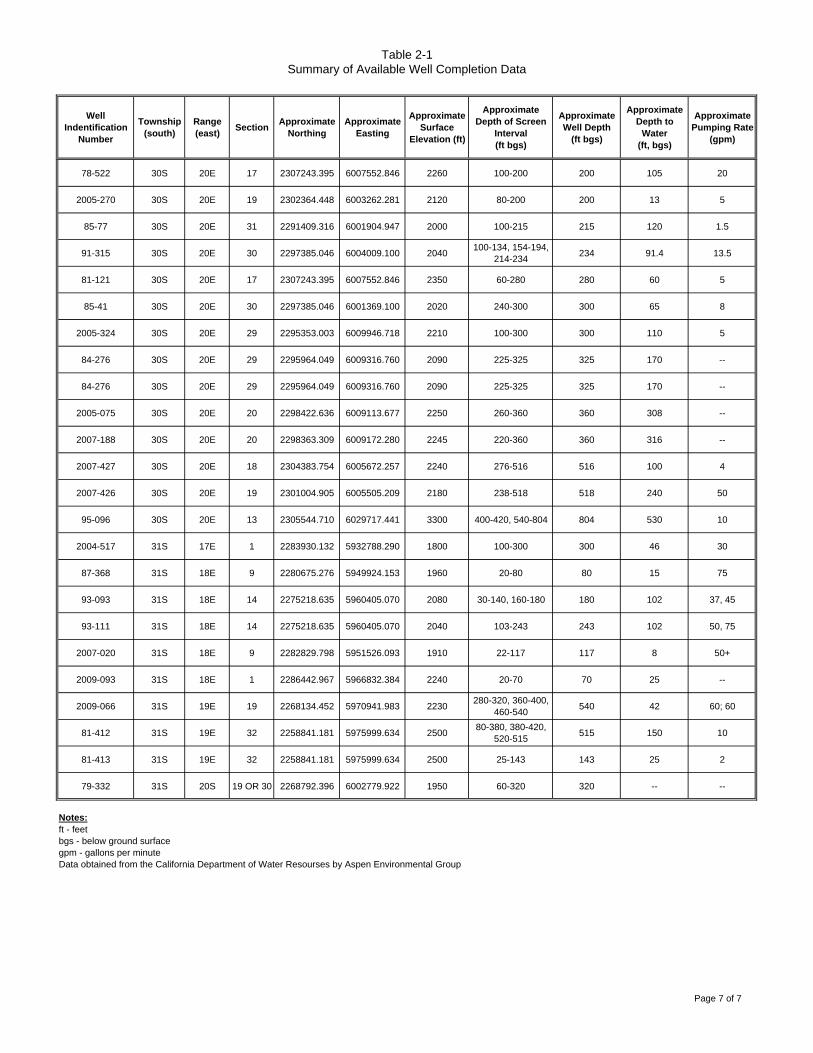
Table 2-1Summary of Available Well Completion Data
Well Indentification
Number
Township (south)
Range (east) Section Approximate
NorthingApproximate
Easting
Approximate Surface
Elevation (ft)
Approximate Depth of Screen
Interval (ft bgs)
Approximate Well Depth
(ft bgs)
Approximate Depth to
Water(ft, bgs)
Approximate Pumping Rate
(gpm)
78-522 30S 20E 17 2307243.395 6007552.846 2260 100-200 200 105 20
2005-270 30S 20E 19 2302364.448 6003262.281 2120 80-200 200 13 5
85-77 30S 20E 31 2291409.316 6001904.947 2000 100-215 215 120 1.5
91-315 30S 20E 30 2297385.046 6004009.100 2040 100-134, 154-194, 214-234 234 91.4 13.5
81-121 30S 20E 17 2307243.395 6007552.846 2350 60-280 280 60 5
85-41 30S 20E 30 2297385.046 6001369.100 2020 240-300 300 65 8
2005-324 30S 20E 29 2295353.003 6009946.718 2210 100-300 300 110 5
84-276 30S 20E 29 2295964.049 6009316.760 2090 225-325 325 170 --
84-276 30S 20E 29 2295964.049 6009316.760 2090 225-325 325 170 --
2005-075 30S 20E 20 2298422.636 6009113.677 2250 260-360 360 308 --
2007-188 30S 20E 20 2298363.309 6009172.280 2245 220-360 360 316 --
2007-427 30S 20E 18 2304383.754 6005672.257 2240 276-516 516 100 4
2007-426 30S 20E 19 2301004.905 6005505.209 2180 238-518 518 240 50
95-096 30S 20E 13 2305544.710 6029717.441 3300 400-420, 540-804 804 530 10
2004-517 31S 17E 1 2283930.132 5932788.290 1800 100-300 300 46 30
87-368 31S 18E 9 2280675.276 5949924.153 1960 20-80 80 15 75
93-093 31S 18E 14 2275218.635 5960405.070 2080 30-140, 160-180 180 102 37, 45
93-111 31S 18E 14 2275218.635 5960405.070 2040 103-243 243 102 50, 75
2007-020 31S 18E 9 2282829.798 5951526.093 1910 22-117 117 8 50+
2009-093 31S 18E 1 2286442.967 5966832.384 2240 20-70 70 25 --
2009-066 31S 19E 19 2268134.452 5970941.983 2230 280-320, 360-400, 460-540 540 42 60; 60
81-412 31S 19E 32 2258841.181 5975999.634 2500 80-380, 380-420, 520-515 515 150 10
81-413 31S 19E 32 2258841.181 5975999.634 2500 25-143 143 25 2
79-332 31S 20S 19 OR 30 2268792.396 6002779.922 1950 60-320 320 -- --
Notes:ft - feetbgs - below ground surfacegpm - gallons per minuteData obtained from the California Department of Water Resourses by Aspen Environmental Group
Page 7 of 7

Table 2-2Summary of Available DWR Groundwater Elevation Data
Well Indentification Number
Approximate Surface Elevation
(ft)
Approximate Depth to
Water(ft, bgs)
Approximate Groundwater
Elevation(ft, bgs)
Groundwater Level
Measurement Date
29S/17E-13R01 2038 35 2003 11/17/582038 36 2002 3/9/592038 35.1 2002.9 10/9/592038 35 2003 1/8/602038 34 2004 3/18/602038 33.3 2004.7 12/13/602038 35.9 2002.1 4/12/612038 36.5 2001.5 11/1/612038 33.8 2004.2 4/10/622038 34 2004 10/22/622038 35.1 2002.9 4/16/632038 34.7 2003.3 10/10/632038 36 2002 10/22/652038 35.8 2002.2 4/22/662038 36 2002 10/11/662038 34.5 2003.5 5/11/672038 42.5 1995.5 10/28/672038 42.8 1995.2 4/19/682038 35.6 2002.4 10/22/682038 30.4 2007.6 4/15/692038 49.5 1988.5 11/18/702038 48.5 1989.5 4/27/712038 43.4 1994.6 12/7/782038 49.9 1988.1 4/24/792038 51.7 1986.3 10/22/792038 45.9 1992.1 4/13/812038 46.5 1991.5 11/4/822038 47 1991 4/25/902038 48.8 1989.2 10/16/902038 43.4 1994.6 4/18/912038 44.8 1993.2 10/21/912038 43.1 1994.9 4/8/922038 47.2 1990.8 10/20/922038 39.5 1998.5 4/15/932038 41.8 1996.2 10/21/932038 41 1997 4/15/942038 42.4 1995.6 10/28/942038 38.2 1999.8 4/10/952038 39.6 1998.4 10/31/952038 39.3 1998.7 4/9/962038 39.8 1998.2 10/17/962038 37.3 2000.7 4/24/972038 41 1997 10/20/972038 32.4 2005.6 4/17/982038 37 2001 10/19/982038 38.1 1999.9 4/19/992038 56.3 1981.7 10/22/992038 37.2 2000.8 4/10/002038 39.1 1998.9 4/18/012038 44.6 1993.4 10/5/012038 38 2000 10/18/002038 50.2 1987.8 4/30/022038 46.2 1991.8 10/23/022038 15.19 2022.81 4/29/042038 43.4 1994.6 4/11/052038 47.8 1990.2 10/22/042038 51.6 1986.4 10/14/052038 43.3 1994.7 10/10/062038 47.3 1990.7 4/12/06
Page 1 of 8

Table 2-2Summary of Available DWR Groundwater Elevation Data
Well Indentification Number
Approximate Surface Elevation
(ft)
Approximate Depth to
Water(ft, bgs)
Approximate Groundwater
Elevation(ft, bgs)
Groundwater Level
Measurement Date
29S/17E-13R01 (Con.) 2038 37 2001 4/10/072038 37.75 2000.25 4/8/082038 37.7 2000.3 10/5/082038 40.5 1997.5 10/12/072038 37.07 2000.93 4/10/09
29S/17E-13R02 2039.5 56.3 1983.2 4/20/722039.5 43.1 1996.4 10/3/722039.5 66 1973.5 4/16/732039.5 63.8 1975.7 11/15/732039.5 56.5 1983 4/22/742039.5 45.7 1993.8 11/4/742039.5 82.2 1957.3 10/16/752039.5 87.7 1951.8 10/31/772039.5 32.6 2006.9 11/17/832039.5 80.4 1959.1 5/3/852039.5 80.7 1958.8 10/16/852039.5 31.6 2007.9 4/21/862039.5 86 1953.5 4/22/872039.5 86.2 1953.3 11/12/872039.5 86 1953.5 4/7/882039.5 82 1957.5 10/17/882039.5 84 1955.5 4/12/892039.5 66 1973.5 10/27/892039.5 85 1954.5 4/25/902039.5 84.8 1954.7 10/16/902039.5 89.3 1950.2 10/21/912039.5 88.4 1951.1 4/8/922039.5 89.1 1950.4 10/20/922039.5 90.2 1949.3 4/15/932039.5 89 1950.5 10/21/932039.5 89.2 1950.3 4/15/942039.5 109 1930.5 10/28/942039.5 38.2 2001.3 4/10/952039.5 84.4 1955.1 10/31/952039.5 114 1925.5 4/24/972039.5 115.6 1923.9 10/20/972039.5 119 1920.5 4/17/982039.5 113.3 1926.2 4/10/002039.5 108 1931.5 10/19/982039.5 122 1917.5 4/19/992039.5 128 1911.5 10/19/992039.5 126.7 1912.8 4/18/012039.5 44.9 1994.6 10/5/012039.5 110.3 1929.2 10/18/002039.5 47.8 1991.7 10/23/022039.5 108.8 1930.7 4/30/022039.5 38.7 2000.8 4/22/032039.5 48 1991.5 10/28/032039.5 46.8 1992.7 4/29/042039.5 46.9 1992.6 4/11/052039.5 43.1 1996.4 10/22/042039.5 148.75 1890.75 10/14/052039.5 124.75 1914.75 4/12/062039.5 127.95 1911.55 10/10/062039.5 123.7 1915.8 4/10/072039.5 41.5 1998 10/12/072039.5 40.2 1999.3 4/8/082039.5 41.36 1998.14 10/5/082039.5 39.82 1999.68 4/10/09
Page 2 of 8

Table 2-2Summary of Available DWR Groundwater Elevation Data
Well Indentification Number
Approximate Surface Elevation
(ft)
Approximate Depth to
Water(ft, bgs)
Approximate Groundwater
Elevation(ft, bgs)
Groundwater Level
Measurement Date
29S/18E-10D01 1493 11.9 1481.1 4/15/941493 13.1 1479.9 10/28/941493 5.9 1487.1 4/10/951493 11.8 1481.2 10/31/951493 9.5 1483.5 4/9/961493 12.1 1480.9 10/17/961493 14 1479 4/24/971493 12.95 1480.05 10/20/971493 5.5 1487.5 4/17/981493 13 1480 4/10/001493 12.3 1480.7 10/19/981493 12.7 1480.3 4/19/991493 13.3 1479.7 10/22/991493 12.5 1480.5 4/18/011493 14.6 1478.4 10/5/011493 14.4 1478.6 10/18/001493 14.5 1478.5 5/1/021493 15.3 1477.7 10/23/021493 15.4 1477.6 4/22/031493 14.08 1478.92 4/11/051493 14 1479 10/14/051493 11.55 1481.45 10/10/061493 8.5 1484.5 4/12/061493 12.6 1480.4 4/10/071493 12.9 1480.1 10/12/071493 11.9 1481.1 4/8/081493 13.53 1479.47 10/5/081493 13.2 1479.8 4/10/09
29S18E28G01M 2022 54.5 1967.5 4/15/692022 125.5 1896.5 4/13/702022 67.2 1954.8 11/18/702022 63.1 1958.9 4/27/712022 75.5 1946.5 10/20/712022 225 1797 4/10/722022 135 1887 4/20/722022 64 1958 11/9/722022 58.7 1963.3 4/16/732022 62 1960 11/15/732022 59.6 1962.4 11/4/742022 59.7 1962.3 10/16/752022 93.6 1928.4 4/27/762022 67 1955 10/25/762022 89.5 1932.5 5/3/772022 63.8 1958.2 10/31/772022 53.8 1968.2 5/8/782022 50.9 1971.1 12/7/78
29S/18E-28K01M 2020 34.5 1985.5 10/9/592020 33.9 1986.1 1/8/602020 33.8 1986.2 3/18/602020 30.2 1989.8 10/22/622020 31.1 1988.9 4/16/632020 31.8 1988.2 10/10/632020 33.9 1986.1 10/7/642020 38.7 1981.3 4/14/652020 31.5 1988.5 10/22/652020 31.7 1988.3 4/22/662020 31.9 1988.1 10/11/662020 32.2 1987.8 5/11/672020 32 1988 10/28/67
Page 3 of 8

Table 2-2Summary of Available DWR Groundwater Elevation Data
Well Indentification Number
Approximate Surface Elevation
(ft)
Approximate Depth to
Water(ft, bgs)
Approximate Groundwater
Elevation(ft, bgs)
Groundwater Level
Measurement Date
29S/18E-28K01M (Con.) 2020 32.3 1987.7 4/19/682020 34.3 1985.7 10/22/682020 25 1995 4/15/692020 27.8 1992.2 4/13/702020 28.8 1991.2 11/18/702020 28.2 1991.8 4/27/712020 28.9 1991.1 4/20/722020 30.2 1989.8 11/9/722020 28.9 1991.1 4/16/732020 29.2 1990.8 11/15/732020 30.8 1989.2 4/24/742020 29.5 1990.5 11/4/742020 30.3 1989.7 4/28/752020 30.2 1989.8 10/16/752020 32 1988 4/26/762020 30.9 1989.1 10/25/762020 31.7 1988.3 5/3/772020 31 1989 10/31/772020 19.2 2000.8 4/8/782020 23.7 1996.3 12/7/78
29S18E28L01M 2020 28 1992 1/8/602020 33 1987 3/18/602020 27.2 1992.8 10/10/632020 31.9 1988.1 4/2/642020 33.9 1986.1 10/7/642020 27.7 1992.3 4/14/652020 26 1994 10/22/19652020 33.7 1986.3 4/22/19662020 32 1988 10/22/19662020 31.1 1988.9 4/19/19682020 33 1987 10/22/19682020 19.9 2000.1 4/15/19692020 24 1996 4/13/19702020 29.3 1990.7 11/18/19702020 24.9 1995.1 4/27/19712020 29 1991 10/20/19712020 22.8 1997.2 4/20/19722020 26.3 1993.7 11/9/19722020 24.8 1995.2 4/16/19732020 25.1 1994.9 11/15/19732020 26.8 1993.2 4/24/19742020 26.1 1993.9 11/4/19742020 27.2 1992.8 4/28/19752020 26.8 1993.2 10/16/19752020 29.4 1990.6 4/27/19762020 28.6 1991.4 10/25/19762020 39.8 1980.2 5/3/19772020 29.5 1990.5 10/31/19772020 16.6 2003.4 5/8/19782020 20.4 1999.6 12/7/1978
30S/18E-01B02 2010.5 52.4 1958.1 10/28/672010.5 57 1953.5 4/19/682010.5 48.3 1962.2 10/22/682010.5 45.5 1965 4/15/692010.5 43.8 1966.7 4/13/702010.5 43.2 1967.3 11/18/702010.5 43.4 1967.1 10/20/712010.5 43.1 1967.4 4/20/722010.5 44.2 1966.3 11/9/72
Page 4 of 8
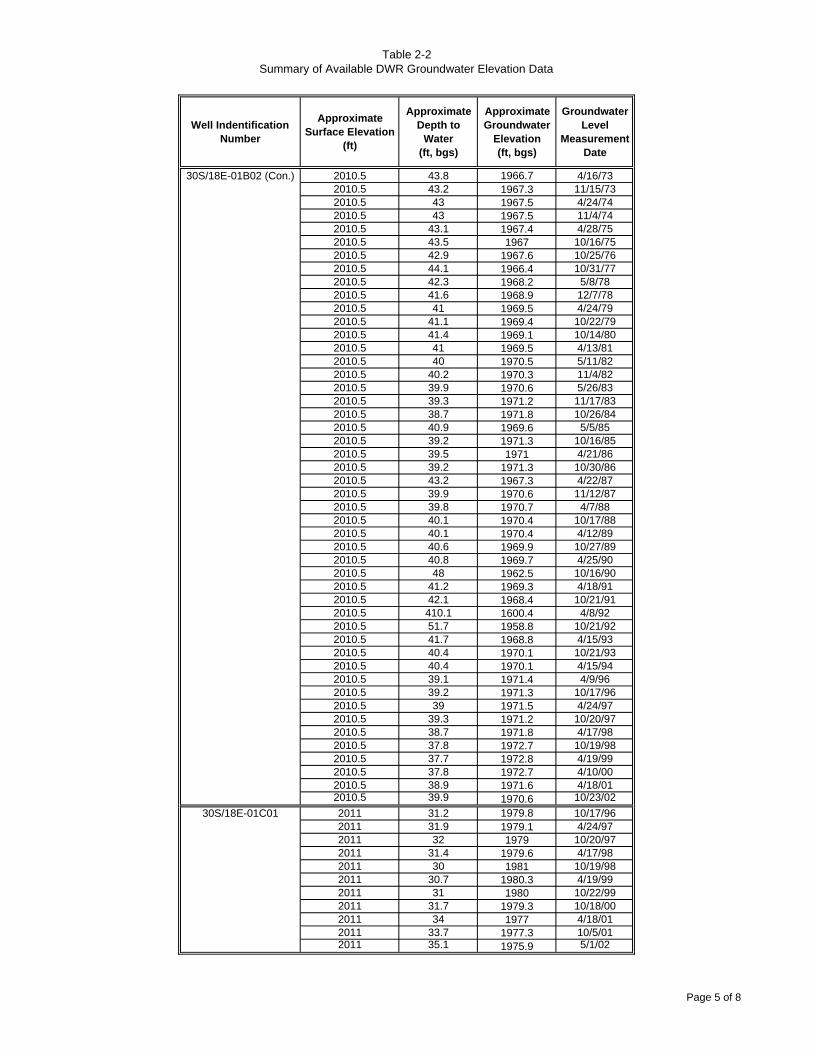
Table 2-2Summary of Available DWR Groundwater Elevation Data
Well Indentification Number
Approximate Surface Elevation
(ft)
Approximate Depth to
Water(ft, bgs)
Approximate Groundwater
Elevation(ft, bgs)
Groundwater Level
Measurement Date
30S/18E-01B02 (Con.) 2010.5 43.8 1966.7 4/16/732010.5 43.2 1967.3 11/15/732010.5 43 1967.5 4/24/742010.5 43 1967.5 11/4/742010.5 43.1 1967.4 4/28/752010.5 43.5 1967 10/16/752010.5 42.9 1967.6 10/25/762010.5 44.1 1966.4 10/31/772010.5 42.3 1968.2 5/8/782010.5 41.6 1968.9 12/7/782010.5 41 1969.5 4/24/792010.5 41.1 1969.4 10/22/792010.5 41.4 1969.1 10/14/802010.5 41 1969.5 4/13/812010.5 40 1970.5 5/11/822010.5 40.2 1970.3 11/4/822010.5 39.9 1970.6 5/26/832010.5 39.3 1971.2 11/17/832010.5 38.7 1971.8 10/26/842010.5 40.9 1969.6 5/5/852010.5 39.2 1971.3 10/16/852010.5 39.5 1971 4/21/862010.5 39.2 1971.3 10/30/862010.5 43.2 1967.3 4/22/872010.5 39.9 1970.6 11/12/872010.5 39.8 1970.7 4/7/882010.5 40.1 1970.4 10/17/882010.5 40.1 1970.4 4/12/892010.5 40.6 1969.9 10/27/892010.5 40.8 1969.7 4/25/902010.5 48 1962.5 10/16/902010.5 41.2 1969.3 4/18/912010.5 42.1 1968.4 10/21/912010.5 410.1 1600.4 4/8/922010.5 51.7 1958.8 10/21/922010.5 41.7 1968.8 4/15/932010.5 40.4 1970.1 10/21/932010.5 40.4 1970.1 4/15/942010.5 39.1 1971.4 4/9/962010.5 39.2 1971.3 10/17/962010.5 39 1971.5 4/24/972010.5 39.3 1971.2 10/20/972010.5 38.7 1971.8 4/17/982010.5 37.8 1972.7 10/19/982010.5 37.7 1972.8 4/19/992010.5 37.8 1972.7 4/10/002010.5 38.9 1971.6 4/18/012010.5 39.9 1970.6 10/23/02
30S/18E-01C01 2011 31.2 1979.8 10/17/962011 31.9 1979.1 4/24/972011 32 1979 10/20/972011 31.4 1979.6 4/17/982011 30 1981 10/19/982011 30.7 1980.3 4/19/992011 31 1980 10/22/992011 31.7 1979.3 10/18/002011 34 1977 4/18/012011 33.7 1977.3 10/5/012011 35.1 1975.9 5/1/02
Page 5 of 8

Table 2-2Summary of Available DWR Groundwater Elevation Data
Well Indentification Number
Approximate Surface Elevation
(ft)
Approximate Depth to
Water(ft, bgs)
Approximate Groundwater
Elevation(ft, bgs)
Groundwater Level
Measurement Date
30S/18E-01C01 (Con.) 2011 33 1978 10/23/022011 33.5 1977.5 4/22/032011 34.3 1976.7 10/28/032011 34.2 1976.8 4/29/042011 34.1 1976.9 10/22/042011 33.66 1977.34 4/11/052011 34.9 1976.1 10/14/052011 34.55 1976.45 10/10/062011 34.45 1976.55 4/12/062011 34.85 1976.15 4/10/072011 35.2 1975.8 10/12/072011 35.62 1975.38 4/8/082011 36.2 1974.8 10/5/082011 36.05 1974.95 4/10/09
30S/18E-03D01 2000.5 43.1 1957.4 10/22/682000.5 56.8 1943.7 4/13/702000.5 37 1963.5 11/18/702000.5 51.7 1948.8 10/20/712000.5 29 1971.5 4/16/732000.5 34.1 1966.4 11/15/732000.5 34.5 1966 11/4/742000.5 46 1954.5 10/25/762000.5 43.4 1957.1 10/31/772000.5 27.5 1973 5/9/782000.5 27.9 1972.6 12/7/782000.5 22.6 1977.9 4/22/792000.5 26.5 1974 10/22/792000.5 27.1 1973.4 10/14/802000.5 17.8 1982.7 4/13/812000.5 24.3 1976.2 11/4/812000.5 17.4 1983.1 4/11/822000.5 17.8 1982.7 11/4/822000.5 10.8 1989.7 5/26/832000.5 17 1983.5 11/17/832000.5 13.3 1987.2 10/26/842000.5 28.1 1972.4 5/5/852000.5 10.2 1990.3 10/16/852000.5 11.2 1989.3 10/30/862000.5 34 1966.5 4/22/872000.5 13 1987.5 11/12/872000.5 30.5 1970 4/7/882000.5 10 1990.5 10/17/882000.5 10.1 1990.4 10/27/892000.5 11.1 1989.4 4/25/902000.5 16.4 1984.1 10/16/902000.5 9.65 1990.85 4/18/912000.5 11.4 1989.1 10/21/912000.5 9 1991.5 4/8/922000.5 10.5 1990 10/20/922000.5 7.2 1993.3 4/25/932000.5 7.5 1993 10/21/932000.5 8.4 1992.1 10/28/942000.5 2.6 1997.9 4/10/952000.5 6 1994.5 10/31/952000.5 6 1994.5 4/9/962000.5 7 1993.5 10/17/962000.5 4.9 1995.6 4/24/972000.5 6.6 1993.9 10/20/972000.5 6.2 1994.3 4/10/00
Page 6 of 8
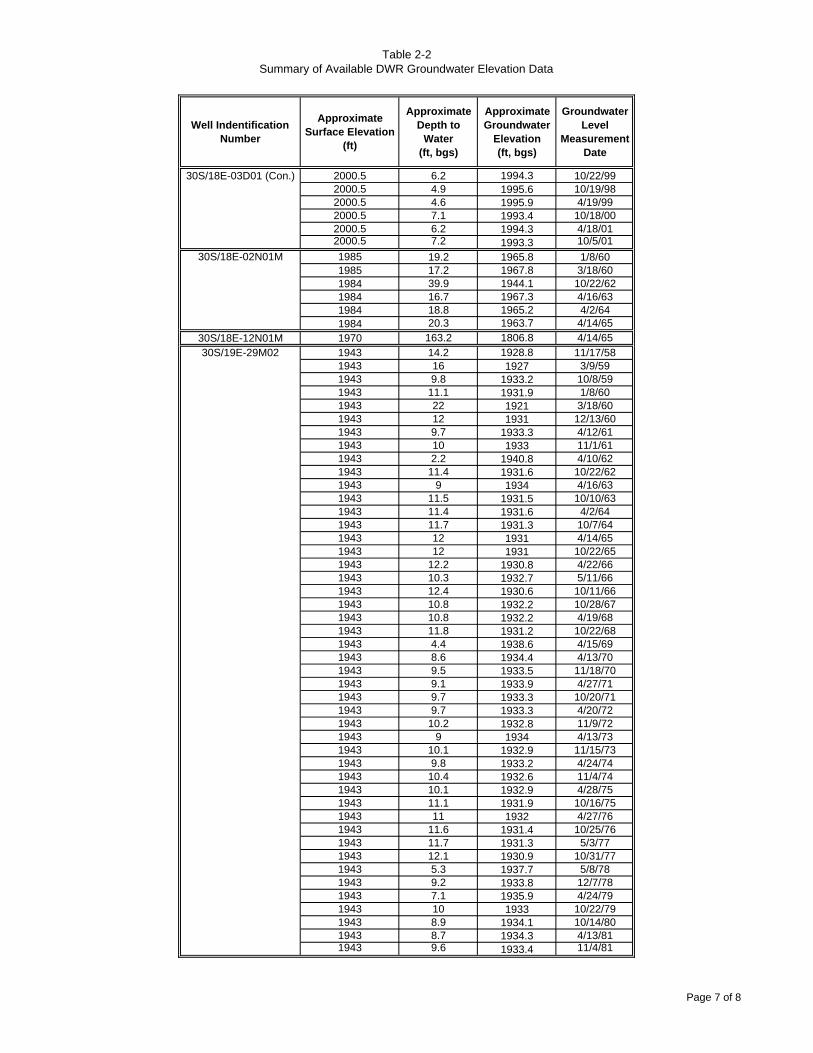
Table 2-2Summary of Available DWR Groundwater Elevation Data
Well Indentification Number
Approximate Surface Elevation
(ft)
Approximate Depth to
Water(ft, bgs)
Approximate Groundwater
Elevation(ft, bgs)
Groundwater Level
Measurement Date
30S/18E-03D01 (Con.) 2000.5 6.2 1994.3 10/22/992000.5 4.9 1995.6 10/19/982000.5 4.6 1995.9 4/19/992000.5 7.1 1993.4 10/18/002000.5 6.2 1994.3 4/18/012000.5 7.2 1993.3 10/5/01
30S/18E-02N01M 1985 19.2 1965.8 1/8/601985 17.2 1967.8 3/18/601984 39.9 1944.1 10/22/621984 16.7 1967.3 4/16/631984 18.8 1965.2 4/2/641984 20.3 1963.7 4/14/65
30S/18E-12N01M 1970 163.2 1806.8 4/14/6530S/19E-29M02 1943 14.2 1928.8 11/17/58
1943 16 1927 3/9/591943 9.8 1933.2 10/8/591943 11.1 1931.9 1/8/601943 22 1921 3/18/601943 12 1931 12/13/601943 9.7 1933.3 4/12/611943 10 1933 11/1/611943 2.2 1940.8 4/10/621943 11.4 1931.6 10/22/621943 9 1934 4/16/631943 11.5 1931.5 10/10/631943 11.4 1931.6 4/2/641943 11.7 1931.3 10/7/641943 12 1931 4/14/651943 12 1931 10/22/651943 12.2 1930.8 4/22/661943 10.3 1932.7 5/11/661943 12.4 1930.6 10/11/661943 10.8 1932.2 10/28/671943 10.8 1932.2 4/19/681943 11.8 1931.2 10/22/681943 4.4 1938.6 4/15/691943 8.6 1934.4 4/13/701943 9.5 1933.5 11/18/701943 9.1 1933.9 4/27/711943 9.7 1933.3 10/20/711943 9.7 1933.3 4/20/721943 10.2 1932.8 11/9/721943 9 1934 4/13/731943 10.1 1932.9 11/15/731943 9.8 1933.2 4/24/741943 10.4 1932.6 11/4/741943 10.1 1932.9 4/28/751943 11.1 1931.9 10/16/751943 11 1932 4/27/761943 11.6 1931.4 10/25/761943 11.7 1931.3 5/3/771943 12.1 1930.9 10/31/771943 5.3 1937.7 5/8/781943 9.2 1933.8 12/7/781943 7.1 1935.9 4/24/791943 10 1933 10/22/791943 8.9 1934.1 10/14/801943 8.7 1934.3 4/13/811943 9.6 1933.4 11/4/81
Page 7 of 8
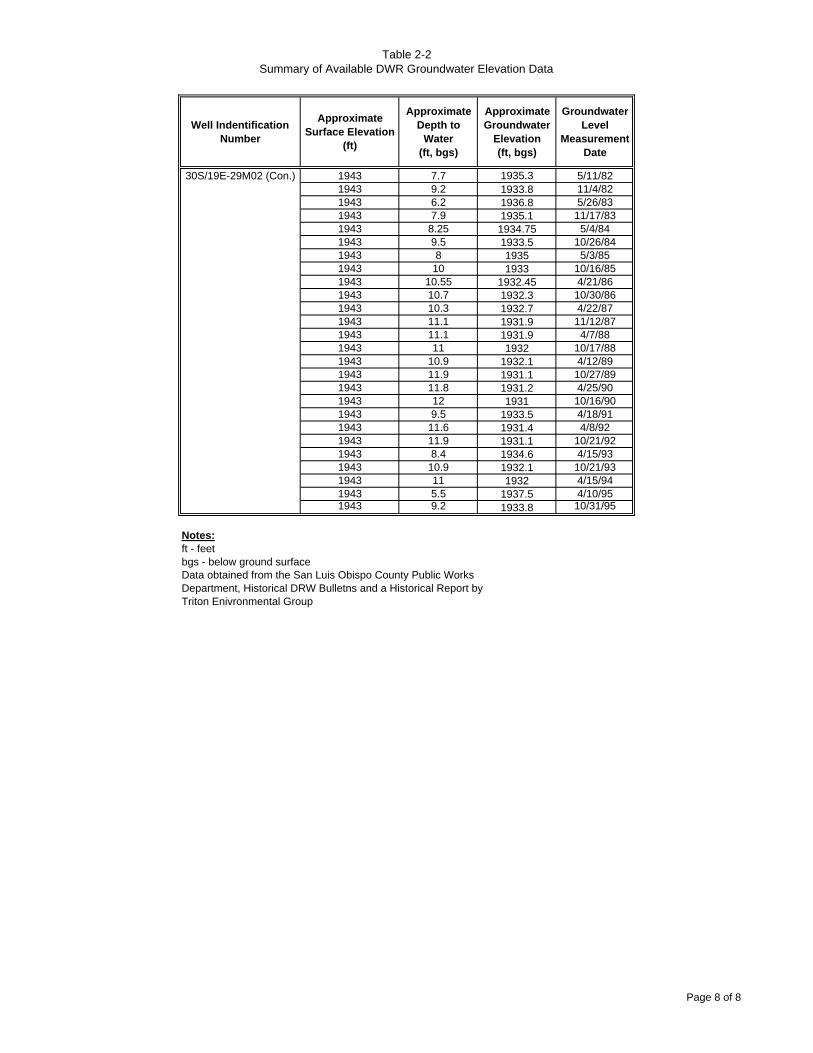
Table 2-2Summary of Available DWR Groundwater Elevation Data
Well Indentification Number
Approximate Surface Elevation
(ft)
Approximate Depth to
Water(ft, bgs)
Approximate Groundwater
Elevation(ft, bgs)
Groundwater Level
Measurement Date
30S/19E-29M02 (Con.) 1943 7.7 1935.3 5/11/821943 9.2 1933.8 11/4/821943 6.2 1936.8 5/26/831943 7.9 1935.1 11/17/831943 8.25 1934.75 5/4/841943 9.5 1933.5 10/26/841943 8 1935 5/3/851943 10 1933 10/16/851943 10.55 1932.45 4/21/861943 10.7 1932.3 10/30/861943 10.3 1932.7 4/22/871943 11.1 1931.9 11/12/871943 11.1 1931.9 4/7/881943 11 1932 10/17/881943 10.9 1932.1 4/12/891943 11.9 1931.1 10/27/891943 11.8 1931.2 4/25/901943 12 1931 10/16/901943 9.5 1933.5 4/18/911943 11.6 1931.4 4/8/921943 11.9 1931.1 10/21/921943 8.4 1934.6 4/15/931943 10.9 1932.1 10/21/931943 11 1932 4/15/941943 5.5 1937.5 4/10/951943 9.2 1933.8 10/31/95
Notes:ft - feetbgs - below ground surfaceData obtained from the San Luis Obispo County Public Works Department, Historical DRW Bulletns and a Historical Report byTriton Enivronmental Group
Page 8 of 8
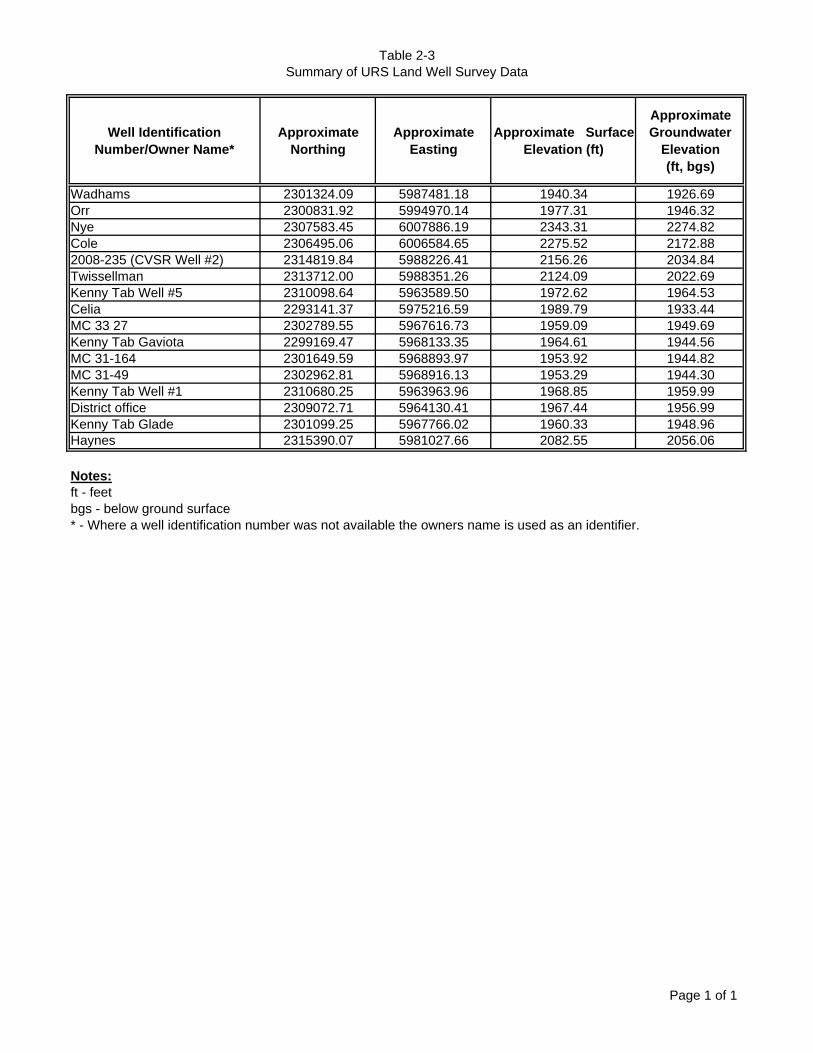
Table 2-3Summary of URS Land Well Survey Data
Well Identification Number/Owner Name*
Approximate Northing
Approximate Easting
Approximate Surface Elevation (ft)
Approximate Groundwater
Elevation(ft, bgs)
Wadhams 2301324.09 5987481.18 1940.34 1926.69Orr 2300831.92 5994970.14 1977.31 1946.32Nye 2307583.45 6007886.19 2343.31 2274.82Cole 2306495.06 6006584.65 2275.52 2172.882008-235 (CVSR Well #2) 2314819.84 5988226.41 2156.26 2034.84Twissellman 2313712.00 5988351.26 2124.09 2022.69Kenny Tab Well #5 2310098.64 5963589.50 1972.62 1964.53Celia 2293141.37 5975216.59 1989.79 1933.44MC 33 27 2302789.55 5967616.73 1959.09 1949.69Kenny Tab Gaviota 2299169.47 5968133.35 1964.61 1944.56MC 31-164 2301649.59 5968893.97 1953.92 1944.82MC 31-49 2302962.81 5968916.13 1953.29 1944.30Kenny Tab Well #1 2310680.25 5963963.96 1968.85 1959.99District office 2309072.71 5964130.41 1967.44 1956.99Kenny Tab Glade 2301099.25 5967766.02 1960.33 1948.96Haynes 2315390.07 5981027.66 2082.55 2056.06
Notes:ft - feetbgs - below ground surface* - Where a well identification number was not available the owners name is used as an identifier.
Page 1 of 1
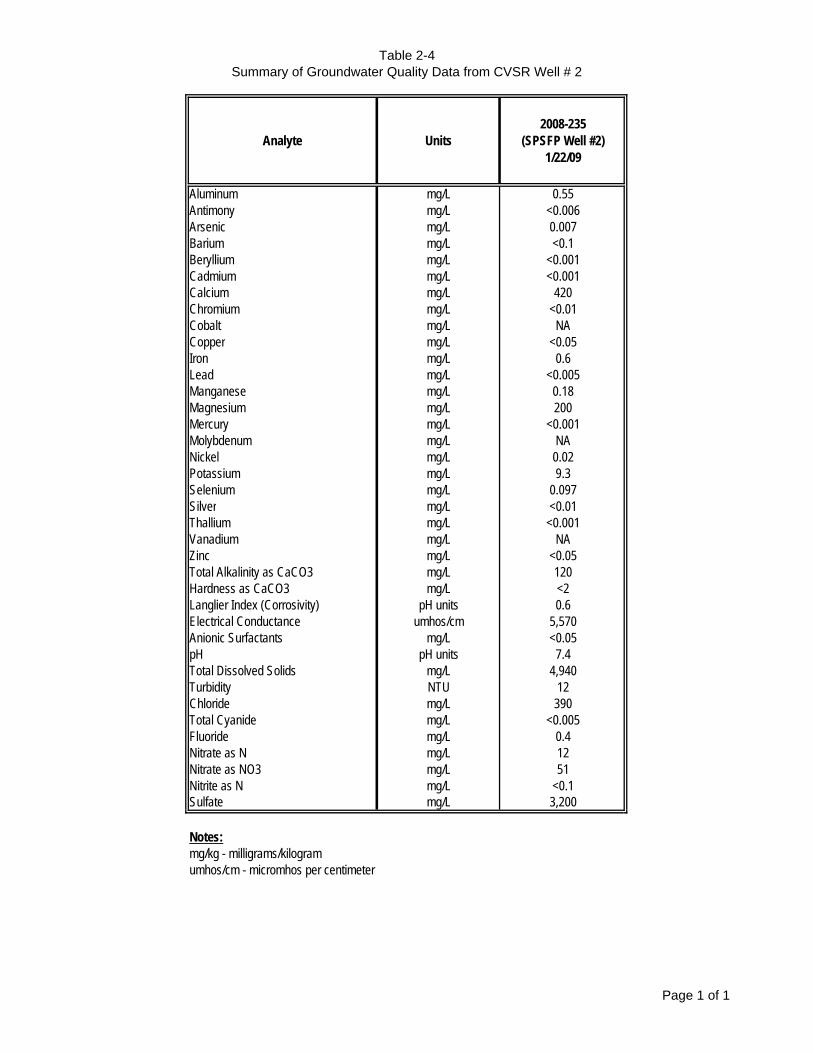
Table 2-4Summary of Groundwater Quality Data from CVSR Well # 2
Analyte Units2008-235
(SPSFP Well #2) 1/22/09
Aluminum mg/L 0.55Antimony mg/L <0.006Arsenic mg/L 0.007Barium mg/L <0.1Beryllium mg/L <0.001Cadmium mg/L <0.001Calcium mg/L 420Chromium mg/L <0.01Cobalt mg/L NACopper mg/L <0.05Iron mg/L 0.6Lead mg/L <0.005Manganese mg/L 0.18Magnesium mg/L 200Mercury mg/L <0.001Molybdenum mg/L NANickel mg/L 0.02Potassium mg/L 9.3Selenium mg/L 0.097Silver mg/L <0.01Thallium mg/L <0.001Vanadium mg/L NAZinc mg/L <0.05Total Alkalinity as CaCO3 mg/L 120Hardness as CaCO3 mg/L <2Langlier Index (Corrosivity) pH units 0.6Electrical Conductance umhos/cm 5,570Anionic Surfactants mg/L <0.05pH pH units 7.4Total Dissolved Solids mg/L 4,940Turbidity NTU 12Chloride mg/L 390Total Cyanide mg/L <0.005Fluoride mg/L 0.4Nitrate as N mg/L 12Nitrate as NO3 mg/L 51Nitrite as N mg/L <0.1Sulfate mg/L 3,200
Notes:mg/kg - milligrams/kilogramumhos/cm - micromhos per centimeter
Page 1 of 1

Table 3-1Model of Simulated Drawdown by Project-Specific Pumping
Year 1 Year 2 Year 3 Year 5 Year 10 Year 15 Year 20 Year 25 Year 30 Year 5 Year 10100 feet from well 2.15 2.17 2.19 2.21 2.22 2.23 2.24 2.25 2.25 0.07 0.06200 feet from well 1.54 1.56 1.58 1.60 1.61 1.62 1.63 1.64 1.64 0.07 0.06400 feet from well 1.00 1.02 1.04 1.06 1.07 1.08 1.09 1.10 1.10 0.07 0.06
Topaz 800 feet from well 0.54 0.56 0.58 0.60 0.61 0.62 0.63 0.64 0.64 0.07 0.061/4 mile from well 0.30 0.32 0.33 0.35 0.36 0.37 0.38 0.39 0.40 0.07 0.061/2 mile from well 0.11 0.13 0.15 0.17 0.18 0.19 0.20 0.21 0.21 0.07 0.061.0 mile from well 0.06 0.08 0.09 0.11 0.12 0.14 0.14 0.15 0.16 0.07 0.062.0 miles from well 0.05 0.07 0.08 0.10 0.11 0.12 0.13 0.13 0.14 0.07 0.05
100 feet from well 2.15 2.17 2.18 2.20 2.21 2.23 2.23 2.24 2.25 0.07 0.06200 feet from well 1.43 1.45 1.47 1.49 1.50 1.51 1.52 1.53 1.54 0.07 0.06400 feet from well 0.83 0.85 0.87 0.89 0.90 0.91 0.92 0.93 0.93 0.07 0.06
Ausra 800 feet from well 0.38 0.40 0.42 0.44 0.45 0.46 0.47 0.48 0.49 0.07 0.061/4 mile from well 0.19 0.21 0.22 0.24 0.26 0.27 0.28 0.29 0.29 0.07 0.061/2 mile from well 0.08 0.10 0.12 0.14 0.15 0.16 0.17 0.18 0.18 0.07 0.061.0 mile from well 0.06 0.08 0.09 0.11 0.12 0.13 0.14 0.14 0.15 0.07 0.062.0 miles from well 0.04 0.07 0.08 0.09 0.11 0.12 0.12 0.13 0.14 0.07 0.05
100 feet from well 2.42 2.44 2.45 0.82 0.83 0.84 0.84 0.85 0.85 0.06 0.05
200 feet from well 1.82 1.83 1.85 0.63 0.64 0.65 0.65 0.66 0.66 0.06 0.05
400 feet from well 1.25 1.27 1.28 0.45 0.46 0.47 0.47 0.48 0.49 0.06 0.05
SunPower 800 feet from well 0.75 0.77 0.78 0.29 0.30 0.31 0.32 0.33 0.33 0.06 0.05
1/4 mile from well 0.46 0.48 0.49 0.20 0.21 0.22 0.22 0.23 0.24 0.06 0.05
1/2 mile from well 0.17 0.19 0.20 0.11 0.12 0.13 0.14 0.14 0.15 0.06 0.05
1.0 mile from well 0.06 0.08 0.09 0.08 0.09 0.10 0.10 0.11 0.11 0.06 0.05
2.0 miles from well 0.04 0.06 0.07 0.07 0.08 0.09 0.10 0.11 0.11 0.06 0.05
Note:Yellow highlighted indicates the greatest drawdown at specific locations.Draw down reported in feet
Project LocationConstruction Operation Recovery
Page 1 of 1