hydrogeology and groundwater resources of the … 2009-1338_508.pdf · hydrogeology and groundwater...
TRANSCRIPT
U.S. Department of the InteriorU.S. Geological Survey
Circular 1338
Hydrogeology and Groundwater Resources of the Coastal Aquifers of Southeastern Massachusetts
Prepared in cooperation with the Massachusetts Department of Environmental Protection

Cover. Great Neck, Wareham MA. View is to the north with the Agawam River in the background. Photograph (copyright) Joseph R. Melanson of www.skypic.com.
Hydrogeology and Groundwater Resources of the Coastal Aquifers of Southeastern Massachusetts
By John P. Masterson and Donald A. Walter
Prepared in cooperation with the Massachusetts Department of Environmental Protection
Circular 1338
U.S. Department of the InteriorU.S. Geological Survey
Hydrogeology and Ground-Water Resources of the Coastal Aquifers of Southeastern Massachusetts
U.S. Department of the InteriorKEN SALAZAR, Secretary
U.S. Geological SurveySuzette M. Kimball, Acting Director
U.S. Geological Survey, Reston, Virginia: 2009
For more information on the USGS—the Federal source for science about the Earth, its natural and living resources, natural hazards, and the environment, visit http://www.usgs.gov or call 1-888-ASK-USGS
For an overview of USGS information products, including maps, imagery, and publications, visit http://www.usgs.gov/pubprod
To order this and other USGS information products, visit http://store.usgs.gov
Any use of trade, product, or firm names is for descriptive purposes only and does not imply endorsement by the U.S. Government.
Although this report is in the public domain, permission must be secured from the individual copyright owners to reproduce any copyrighted materials contained within this report.
Suggested citation:Masterson, J.P., and Walter, D.A., 2009, Hydrogeology and groundwater resources of the coastal aquifers of southeastern Massachusetts: U.S. Geological Survey Circular 1338, 16 p.
Masterson, John P. Hydrogeology and ground-water resources of the coastal aquifers of southeastern Massachusetts / by John P. Masterson and Donald A. Walter. p. cm. -- (Circular ; 1338) Includes bibliographical references. ISBN 978-1-4113-2510-4 (alk. paper) 1. Hydrogeology--Massachusetts. 2. Groundwater--Massachusetts. 3. Groundwater flow--Massachusetts. I. Walter, Donald A. II. Geological Survey (U.S.) III. Title. IV. Title: Hydrogeology and ground water resources of the coastal aquifers of southeastern Massachusetts. V. Series: U.S. Geological Survey circular ; no. 1338. GB1025.M4M365 2009 551.4909744--dc22 2009027918
iii
Hydrogeology and Ground-Water Resources of the Coastal Aquifers of Southeastern Massachusetts
Contents
Abstract ...........................................................................................................................................................1Introduction ....................................................................................................................................................1Hydrogeologic Setting...................................................................................................................................2Groundwater Resources...............................................................................................................................3
Source of Water ...................................................................................................................................4Water Table ............................................................................................................................................4Water Budget ........................................................................................................................................6Effects of Changes in Pumping and Recharge ................................................................................7Potential Effects of Climate Change ................................................................................................11
Summary........................................................................................................................................................15References Cited..........................................................................................................................................15
Figures 1. Map showing simulated water-level contours in the Cape Cod and Plymouth-
Carver-Duxbury-Kingston aquifer systems in southeastern Massachusetts for current (2000–2005) conditions ...................................................................................................2
2. Map showing location of continental ice sheets and direction of ice movement across southeastern Massachusetts 15,000 years ago .........................................................3
3. Diagrams showing ice sheets and terminal moraines ...........................................................4 4. Diagrams showing groundwater-flow paths in unconfined aquifer
systems such as (A) the outer part of Cape Cod and (B) western Cape Cod and the coastal areas in Plymouth and Duxbury in southeastern Massachusetts ...................5
5. Diagrams showing the area at the water table contributing recharge to the pumped well in (A) cross-sectional view and in (B) map view .............................................6
6. Photograph showing the kettle-hole ponds of Lower Cape Cod, Massachusetts ............7 7. Map showing simulated recharge areas in southeastern Massachusetts ........................8 8. Graphs showing average monthly (A) water levels (1961–2006) at observation well
WFW–51 in Wareham; (B) streamflow (1966–2005) at Jones River, Kingston; recharge and precipitation (1931–2006) at the weather station in East Wareham, Massachusetts ..........................................................................................................9
9. Graph showing total annual precipitation and recharge at East Wareham weather station, and annual mean water levels at well WFW–51, Wareham, Massachusetts ...10
10. Charts showing the hydrologic budget of the coastal aquifers of southeastern Massachusetts ............................................................................................................................11
11. Map showing changes in water levels between current (2005) and proposed (2030) pumping and recharge conditions in the Plymouth-Carver-Kingston-Duxbury aquifer system in southeastern Massachusetts ...................................................................12
12. Diagram of an unconfined aquifer before and after pumping under conditions of (A) no pumping, (B) pumping at a low rate, and (C) pumping at an increased rate ........13
iv
Hydrogeology and Ground-Water Resources of the Coastal Aquifers of Southeastern Massachusetts
13. Graph showing simulated monthly changes in streamflow in the Eel River, Plymouth, Massachusetts, with and without wastewater return flow ..............................14
14. Photograph showing algal bloom in Salt Pond, Eastham, Massachusetts. .....................14 15. Photograph showing cranberry bogs in Mashpee, southeastern Massachusetts .........15
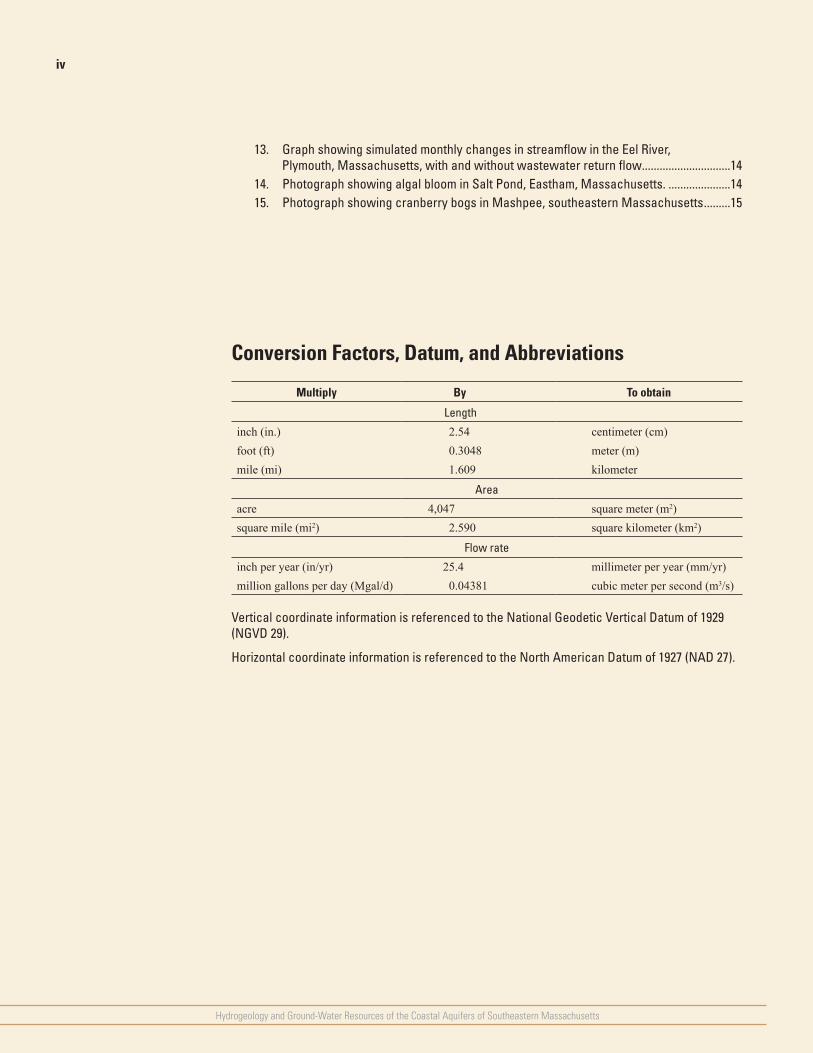
Conversion Factors, Datum, and Abbreviations
Multiply By To obtain
Length
inch (in.) 2.54 centimeter (cm)foot (ft) 0.3048 meter (m)mile (mi) 1.609 kilometer
Area
acre 4,047 square meter (m2)square mile (mi2) 2.590 square kilometer (km2)
Flow rate
inch per year (in/yr) 25.4 millimeter per year (mm/yr)million gallons per day (Mgal/d) 0.04381 cubic meter per second (m3/s)
Vertical coordinate information is referenced to the National Geodetic Vertical Datum of 1929 (NGVD 29).
Horizontal coordinate information is referenced to the North American Datum of 1927 (NAD 27).

Hydrogeology and Ground-Water Resources of the Coastal Aquifers of Southeastern Massachusetts
Hydrogeology and Groundwater Resources of the Coastal Aquifers of Southeastern MassachusettsBy John P. Masterson and Donald A. Walter
AbstractThe glacially derived aquifer systems of southeastern
Massachusetts compose the largest groundwater reservoir in the State. Population increases, land-use changes, and climate change in this area could lead to three primary environmental effects that relate directly to groundwater resources—(1) increases in pumping that could adversely affect environmentally sensitive groundwater-fed surface waters, such as ponds, streams, and wetlands; (2) changes in land use that could affect the quality of water in the aquifer; and (3) changes in precipitation and mean sea level that can affect water levels, streamflow, and the position of the freshwater/saltwater boundary. Therefore, understanding groundwater flow and the factors that can affect it is critical to managing and protecting this vital resource.
Introduction The coastal aquifers of southeastern Massachusetts
are known for their abundant water resources and unique ecosystems. Groundwater is the sole source of drinking water for many communities in this area and also is the primary source of water for the numerous kettle-hole ponds, streams, and wetlands throughout the region (fig. 1). Groundwater discharge also helps to maintain the biological diversity and productivity of estuaries and salt marshes.
Rapid population growth, however, has resulted in increased competition among agricultural, commercial, ecological, and residential demands for water resources. As land development and water demand increase, and as wastewater continues to be returned to these coastal-aquifer systems through domestic septic systems and centralized wastewater-treatment facilities, water-resources managers are becoming concerned about possible long-term effects of these activities on the water resources of this region. Possible effects include
the (1) depletion of streamflow, (2) lowering of surface-water levels in ponds and wetlands, (3) decrease in freshwater flow to coastal waters, (4) increase in the risk for saltwater intrusion, and (5) degradation of water quality owing to land disposal of wastewater.
In response to these concerns, the U.S. Geological Survey (USGS) has conducted water-resources investigations of the Cape Cod and Plymouth-Carver-Kingston-Duxbury aquifer systems in cooperation with the Massachusetts Department of Environmental Protection (MassDEP), National Park Service, Installation Restoration Program at the Massachusetts Military Reservation, Cape Cod Commission, and the Towns of Eastham, Provincetown, Truro, and Wellfleet. Groundwater-flow models were developed as part of these investigations and served as valuable tools to describe the hydrogeology of this region and to assess the possible hydrologic effects of proposed water-management strategies.
This report, produced in cooperation with the MassDEP, provides a brief overview of the hydrogeology of the coastal aquifers of southeastern Massachusetts and the importance of groundwater levels and flow to the ecology of the freshwater and estuarine ecosystems of the region. The report also includes a discussion of the effects of potential future changes to the groundwater system on the water resources of the region.
For a more detailed description and analysis of the hydrogeology of the Lower Cape Cod aquifer system, refer to USGS Scientific Investigations Report 2004–5014 (Masterson, 2004); for the Mid- and Upper Cape Cod aquifer system, refer to USGS Hydrologic Investigations Atlas HA–741 (Masterson and others, 1997) and USGS Scientific Investigations Report 2004–5181 (Walter and Whealan, 2005); and for the Plymouth-Carver-Kingston-Duxbury (PCKD) aquifer system, refer to USGS Scientific Investigations Report 2009–5063 (Masterson and others, 2009).
2
Hydrogeology and Ground-Water Resources of the Coastal Aquifers of Southeastern Massachusetts
Hydrogeologic SettingThe shallow, unconfined aquifers that underlie this region
are composed mostly of glacially deposited sediments, ranging in size from clay to boulders, and are the result of a complex series of retreats and readvances of three large sheets of ice—the Buzzards Bay, Cape Cod Bay, and South Channel ice sheets (Oldale, 1992). These sediments were deposited approximately 15,000 years ago as meltwater from glaciers carried sediments that were originally trapped in the ice and deposited them in large deltas in glacial lakes in the present-day Cape Cod Bay and Nantucket Sound (Oldale, 1992) (fig. 2). The surficial deposits overlie Paleozoic crystalline bedrock that ranges in altitude from about 100 ft above the National Geodetic Vertical Datum of 1929 (NGVD 29, referred to as sea level in this report) in Middleborough to more than 1,000 ft below NGVD 29 in Truro (Larson, 1980).
At the time when the glacial sediments were being deposited, global sea levels were lower than current levels because of the large quantity of water contained in the
enormous ice sheets. As the ice sheets melted and retreated, sea level rose, and erosion of the glacial shoreline began. The remnants of the once much larger deltaic deposits, or outwash plains, continue to be eroded. In areas such as the Lower Cape, the Atlantic Ocean coastline has been retreating about 2 to 3 ft per year because of this erosion (Giese and Aubrey, 1987), and this rate of retreat is likely to increase as sea level continues to rise in the future (Thieler and Hammar-Klose, 2000).
The primary water-bearing deposits in the coastal-aquifer systems of southeastern Massachusetts are the large glacial outwash-plain deposits found throughout the area. These deposits are composed of sediments that were transported by meltwater from the retreating Buzzards Bay, Cape Cod Bay, and South Channel ice sheets and created deltas in a large glacial lake that formed in the wake of the retreating ice sheets (fig. 3). The general trend in grain size in the outwash-plain deposits is a decrease with distance from the retreating ice margin and with depth as the deltas advanced farther into the glacial lakes and deposited coarser sediments on top of older, finer grained sediments.
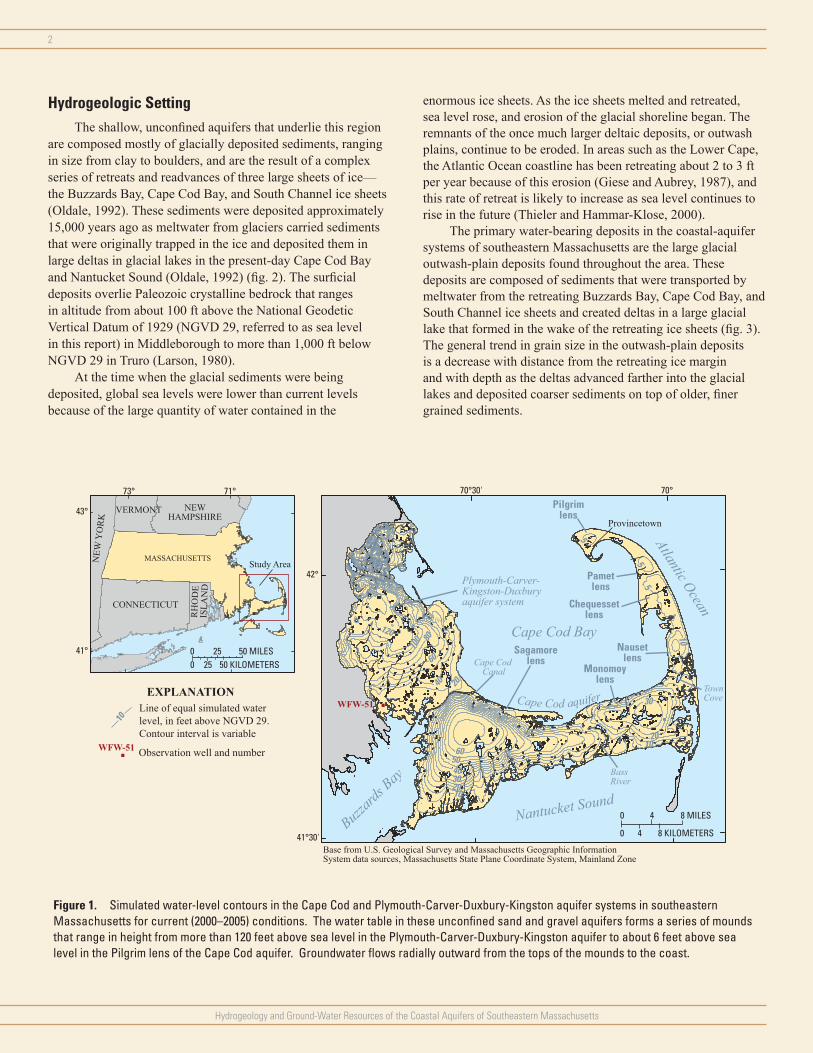
Figure 1. Simulated water-level contours in the Cape Cod and Plymouth-Carver-Duxbury-Kingston aquifer systems in southeastern Massachusetts for current (2000–2005) conditions. The water table in these unconfined sand and gravel aquifers forms a series of mounds that range in height from more than 120 feet above sea level in the Plymouth-Carver-Duxbury-Kingston aquifer to about 6 feet above sea level in the Pilgrim lens of the Cape Cod aquifer. Groundwater flows radially outward from the tops of the mounds to the coast.
Base from U.S. Geological Survey and Massachusetts Geographic InformationSystem data sources, Massachusetts State Plane Coordinate System, Mainland Zone
70°30' 70°
42°
41°30'
Nantucket Sound
Atlantic Ocean
Buzzard
s Bay
Town Cove
BassRiver
Cape Cod Bay
Cape Cod aquifer
Cape Cod Canal
Jones River.
Eel River.
20
403010
5060
30
1020
5
10
5
5
Pilgrimlens
Sagamorelens
Plymouth-Carver-Kingston-Duxburyaquifer system
Nausetlens
Pametlens
Chequessetlens
Monomoylens
Line of equal simulated waterlevel, in feet above NGVD 29.Contour interval is variable
EXPLANATION
8040
100
60
120
20
10
WFW-51
WFW-51
Provincetown
Observation well and number
0
0 8 KILOMETERS
8 MILES4
4
MASSACHUSETTS
71°73°
43°
41° 0 25 50 MILES0 25 50 KILOMETERS
Study Area
CONNECTICUT
RH
OD
EIS
LAN
D
NEW
YO
RK
VERMONT NEWHAMPSHIRE
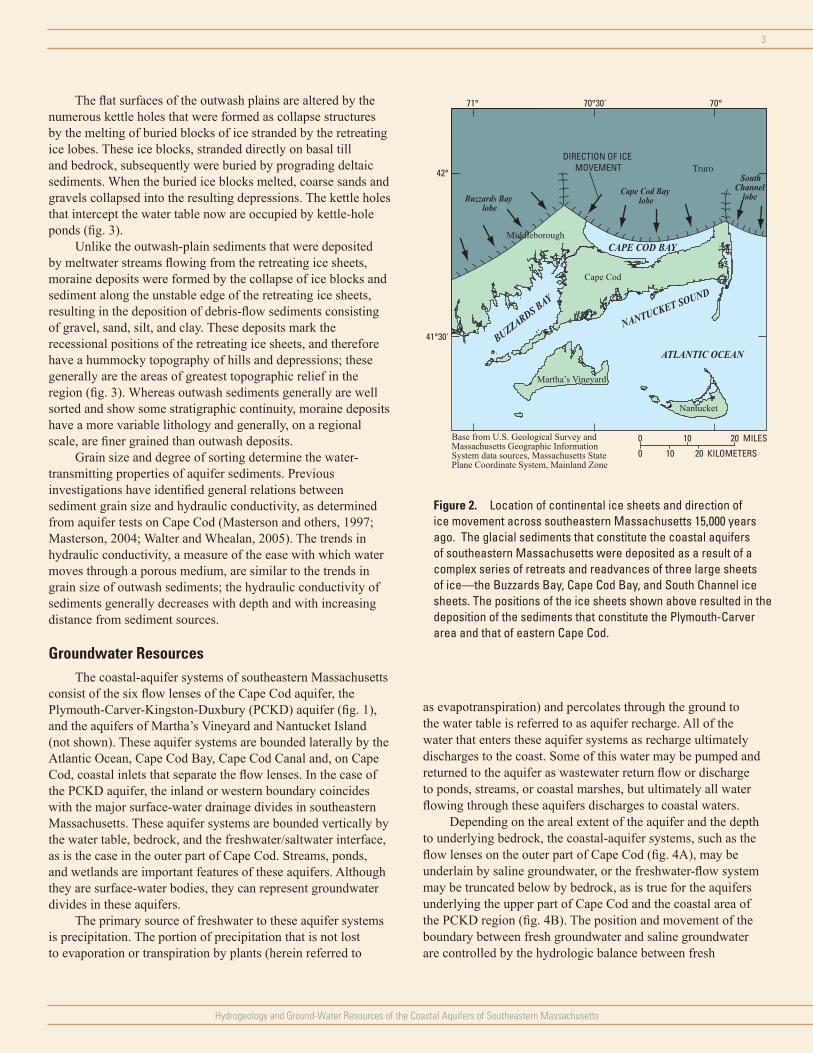
Figure 2. Location of continental ice sheets and direction of ice movement across southeastern Massachusetts 15,000 years ago. The glacial sediments that constitute the coastal aquifers of southeastern Massachusetts were deposited as a result of a complex series of retreats and readvances of three large sheets of ice—the Buzzards Bay, Cape Cod Bay, and South Channel ice sheets. The positions of the ice sheets shown above resulted in the deposition of the sediments that constitute the Plymouth-Carver area and that of eastern Cape Cod.
20 KILOMETERS
0
0
20 MILES
10
10
70°70°30'
DIRECTION OF ICE MOVEMENT
71°
42°
41°30'
ATLANTIC OCEAN
CAPE COD BAY
Buzzards Bay lobe
Cape Cod Bay lobe
South Channel
lobe
NANTUCKET SOUND
BUZZARDS BAY
Martha’s Vineyard
Nantucket
Cape Cod
Middleborough
Truro
Base from U.S. Geological Survey andMassachusetts Geographic InformationSystem data sources, Massachusetts StatePlane Coordinate System, Mainland Zone
Hydrogeology and Ground-Water Resources of the Coastal Aquifers of Southeastern Massachusetts
3
The flat surfaces of the outwash plains are altered by the numerous kettle holes that were formed as collapse structures by the melting of buried blocks of ice stranded by the retreating ice lobes. These ice blocks, stranded directly on basal till and bedrock, subsequently were buried by prograding deltaic sediments. When the buried ice blocks melted, coarse sands and gravels collapsed into the resulting depressions. The kettle holes that intercept the water table now are occupied by kettle-hole ponds (fig. 3).
Unlike the outwash-plain sediments that were deposited by meltwater streams flowing from the retreating ice sheets, moraine deposits were formed by the collapse of ice blocks and sediment along the unstable edge of the retreating ice sheets, resulting in the deposition of debris-flow sediments consisting of gravel, sand, silt, and clay. These deposits mark the recessional positions of the retreating ice sheets, and therefore have a hummocky topography of hills and depressions; these generally are the areas of greatest topographic relief in the region (fig. 3). Whereas outwash sediments generally are well sorted and show some stratigraphic continuity, moraine deposits have a more variable lithology and generally, on a regional scale, are finer grained than outwash deposits.
Grain size and degree of sorting determine the water-transmitting properties of aquifer sediments. Previous investigations have identified general relations between sediment grain size and hydraulic conductivity, as determined from aquifer tests on Cape Cod (Masterson and others, 1997; Masterson, 2004; Walter and Whealan, 2005). The trends in hydraulic conductivity, a measure of the ease with which water moves through a porous medium, are similar to the trends in grain size of outwash sediments; the hydraulic conductivity of sediments generally decreases with depth and with increasing distance from sediment sources.
Groundwater ResourcesThe coastal-aquifer systems of southeastern Massachusetts
consist of the six flow lenses of the Cape Cod aquifer, the Plymouth-Carver-Kingston-Duxbury (PCKD) aquifer (fig. 1), and the aquifers of Martha’s Vineyard and Nantucket Island (not shown). These aquifer systems are bounded laterally by the Atlantic Ocean, Cape Cod Bay, Cape Cod Canal and, on Cape Cod, coastal inlets that separate the flow lenses. In the case of the PCKD aquifer, the inland or western boundary coincides with the major surface-water drainage divides in southeastern Massachusetts. These aquifer systems are bounded vertically by the water table, bedrock, and the freshwater/saltwater interface, as is the case in the outer part of Cape Cod. Streams, ponds, and wetlands are important features of these aquifers. Although they are surface-water bodies, they can represent groundwater divides in these aquifers.
The primary source of freshwater to these aquifer systems is precipitation. The portion of precipitation that is not lost to evaporation or transpiration by plants (herein referred to
as evapotranspiration) and percolates through the ground to the water table is referred to as aquifer recharge. All of the water that enters these aquifer systems as recharge ultimately discharges to the coast. Some of this water may be pumped and returned to the aquifer as wastewater return flow or discharge to ponds, streams, or coastal marshes, but ultimately all water flowing through these aquifers discharges to coastal waters.
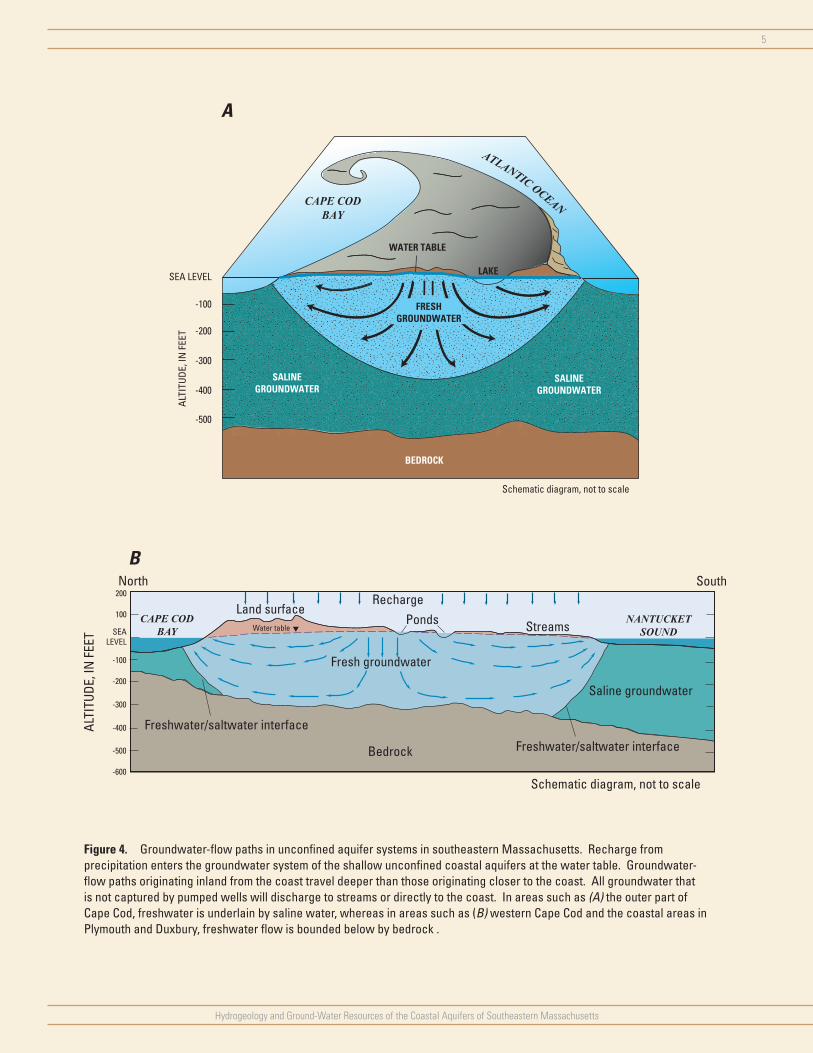
Depending on the areal extent of the aquifer and the depth to underlying bedrock, the coastal-aquifer systems, such as the flow lenses on the outer part of Cape Cod (fig. 4A), may be underlain by saline groundwater, or the freshwater-flow system may be truncated below by bedrock, as is true for the aquifers underlying the upper part of Cape Cod and the coastal area of the PCKD region (fig. 4B). The position and movement of the boundary between fresh groundwater and saline groundwater are controlled by the hydrologic balance between fresh
4
Hydrogeology and Ground-Water Resources of the Coastal Aquifers of Southeastern Massachusetts
groundwater and the surrounding denser saline groundwater. Changes to the freshwater-flow system that alter this balance result in shifts in the position of this boundary.
Source of Water
The source of water to pumped wells, streams, coastal marshes, and beaches can be determined by mapping the water-table area that, multiplied by the recharge rate, equals the total flow to the receptor. The concept of the source of water to a pumped well is illustrated schematically in figure 5; the amount of water pumped from the well must be provided by a water-table area that is sufficiently large to capture enough aquifer recharge to equal the amount of pumped water. This concept can be applied to any hydrologic feature that receives groundwater discharge, such as kettle-hole ponds, streams, and coastal areas (figs. 6 and 7) (Masterson and Walter, 2000; Walter and others, 2004). Identifying the sources of water to all hydrologic features in the coastal-aquifer systems of southeastern Massachusetts is necessary to prevent land-use activities from degrading the quality of water that discharges to these resources.
Water Table
The height of the water table is typically referred to as the altitude above mean sea level—the National Geodetic Vertical Datum of 1929 (NGVD 29). The height of the water table varies throughout the coastal-aquifer systems of southeastern Massachusetts and ranges from a high of about 120 ft in Plymouth to a low of about 6 ft above NGVD 29 in Truro
(fig. 1). The height and configuration of the water table are affected by factors such as recharge and pumping conditions, the interaction between groundwater and surface water, and the hydrogeologic framework. In general, groundwater flows from the highest point of the water table toward natural discharge boundaries such as streams and coastal water bodies. Some water flows through kettle-hole ponds prior to discharging to the coast, and some water is removed from the system for water supply.
The height of the water table varies seasonally and annually because aquifer-recharge rates vary with changes in precipitation and evapotranspiration. These rates also may vary throughout the coastal-aquifer systems of southeastern Massachusetts because of differences in land use, vegetation, depth to the water table, and local rainfall. Changes in precipitation and evapotranspiration and therefore aquifer recharge also result in changes in water levels, which are generally highest in the spring months and lowest in the fall months.
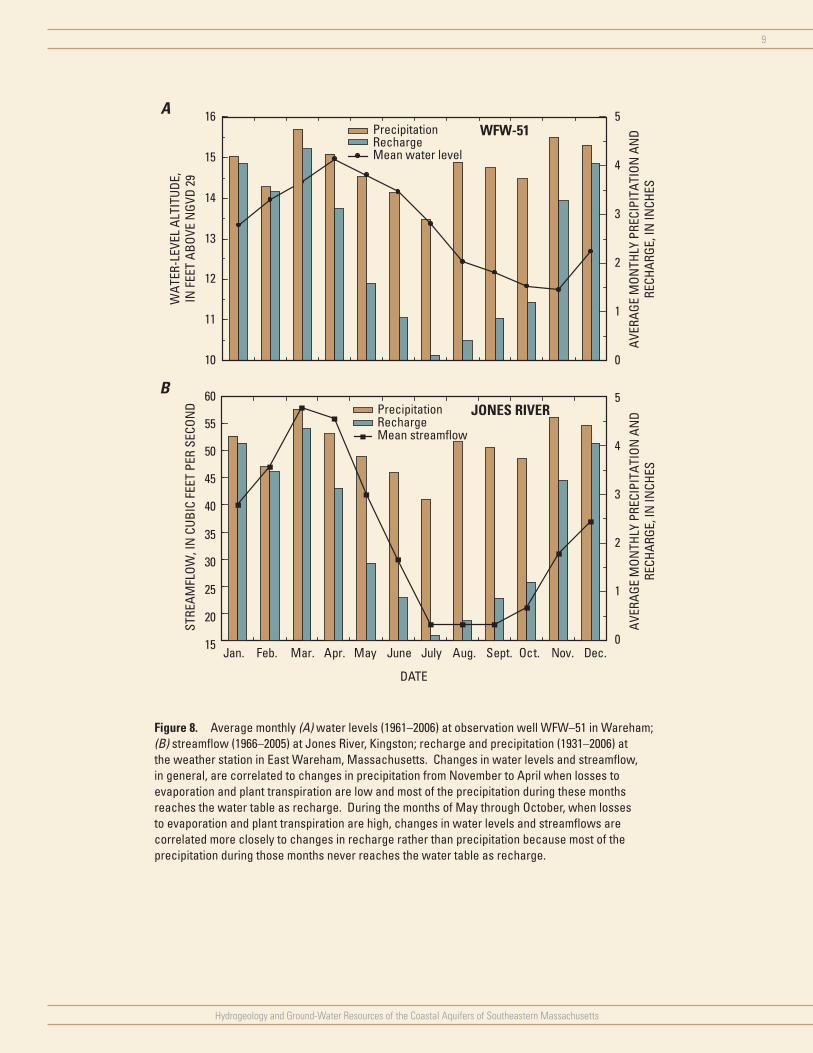
Water levels at observation well WFW–51 in Wareham and streamflow in the Jones River at Kingston (fig. 1), in general, correlated with rainfall measured at the national weather station in East Wareham; the declines in water levels and streamflows from April to July were consistent with the decrease in precipitation over the same period (fig. 8). From August to November, however, water levels and streamflows continued to decline even though precipitation amounts were similar to those in the spring months.
Stagnant, melting ice
Outwash plain
Knob-and-kettleCrevasse
TunnelIce
Till
Ice block
Outwashchannel
Ice block
Terminal moraine
Pitted outwash plain
Kettle ponds
Till
Old channel
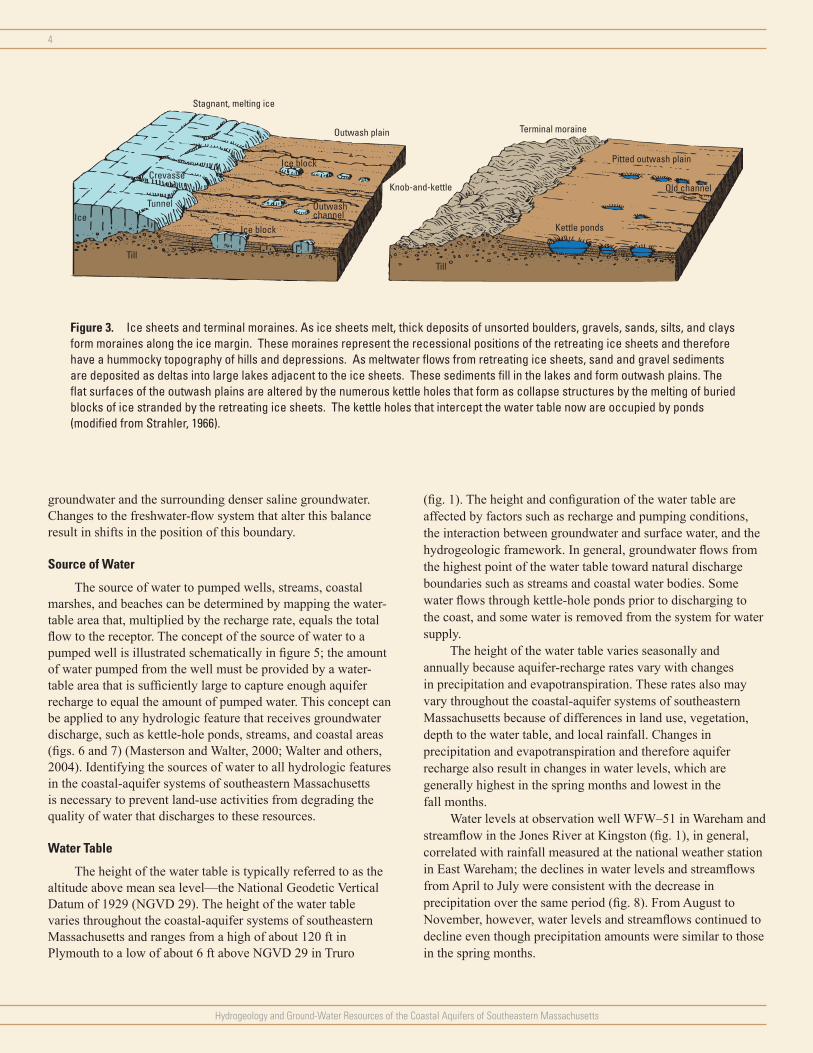
Figure 3. Ice sheets and terminal moraines. As ice sheets melt, thick deposits of unsorted boulders, gravels, sands, silts, and clays form moraines along the ice margin. These moraines represent the recessional positions of the retreating ice sheets and therefore have a hummocky topography of hills and depressions. As meltwater flows from retreating ice sheets, sand and gravel sediments are deposited as deltas into large lakes adjacent to the ice sheets. These sediments fill in the lakes and form outwash plains. The flat surfaces of the outwash plains are altered by the numerous kettle holes that form as collapse structures by the melting of buried blocks of ice stranded by the retreating ice sheets. The kettle holes that intercept the water table now are occupied by ponds (modified from Strahler, 1966).
Hydrogeology and Ground-Water Resources of the Coastal Aquifers of Southeastern Massachusetts
5
Figure 4. Groundwater-flow paths in unconfined aquifer systems in southeastern Massachusetts. Recharge from precipitation enters the groundwater system of the shallow unconfined coastal aquifers at the water table. Groundwater-flow paths originating inland from the coast travel deeper than those originating closer to the coast. All groundwater that is not captured by pumped wells will discharge to streams or directly to the coast. In areas such as (A) the outer part of Cape Cod, freshwater is underlain by saline water, whereas in areas such as (B) western Cape Cod and the coastal areas in Plymouth and Duxbury, freshwater flow is bounded below by bedrock .
SALINEGROUNDWATER
SALINEGROUNDWATER
CAPE CODBAY
ATLANTIC OCEAN
WATER TABLE
LAKE
SALINEGROUNDWATER
BEDROCK
Schematic diagram, not to scale
FRESHGROUNDWATER
SEA LEVEL
-100
-200
-300
-400
-500
ALT
ITU
DE,
IN F
EET
A
SALINEGROUNDWATER
SALINEGROUNDWATER
SALINEGROUNDWATER
Saline groundwater
StreamsPonds
Bedrock Freshwater/saltwater interface
SEALEVEL
-100
-200
-300
200
100
North South
NANTUCKETSOUND
CAPE CODBAY
-400
-500
-600
Schematic diagram, not to scale
ALTI
TUDE
, IN
FEE
T
Freshwater/saltwater interface
Fresh groundwater
Water table
Land surfaceRecharge
B

6
Hydrogeology and Ground-Water Resources of the Coastal Aquifers of Southeastern Massachusetts
Figure 5. The area at the water table contributing recharge to the pumped well can be delineated in (A) cross-sectional view and in (B) map view (modified from Reilly and Pollock, 1993). The area contributing recharge can be disconnected from the well site in map view. The location, shape, and size of this area depends on the pumping rate, slope of the water table, and depth of the well screen below the water table.
Well screen
ArealrechargeArea
contributingrecharge
Pumpingwell
Landsurface
Water table
Saturatedzone
Areacontributing
recharge Pumpingwell
Boundingflow lines
Not to scale
Not to scale
A Cross-sectional view
B Map view of saturated zone
Well screen
ArealrechargeArea
contributingrecharge
Pumpingwell
Landsurface
Water table
Saturatedzone
Areacontributing
recharge Pumpingwell
Boundingflow lines
Not to scale
Not to scale
A Cross-sectional view
B Map view of saturated zone
Although variations in precipitation have some effect on water levels and streamflows, particularly during wet and dry periods, water levels and streamflows on a seasonal basis respond mostly to the balance between precipitation and evapotranspiration; precipitation varies somewhat seasonally on average, but evapotranspiration varies greatly. This difference causes a substantial average seasonal variation in recharge.
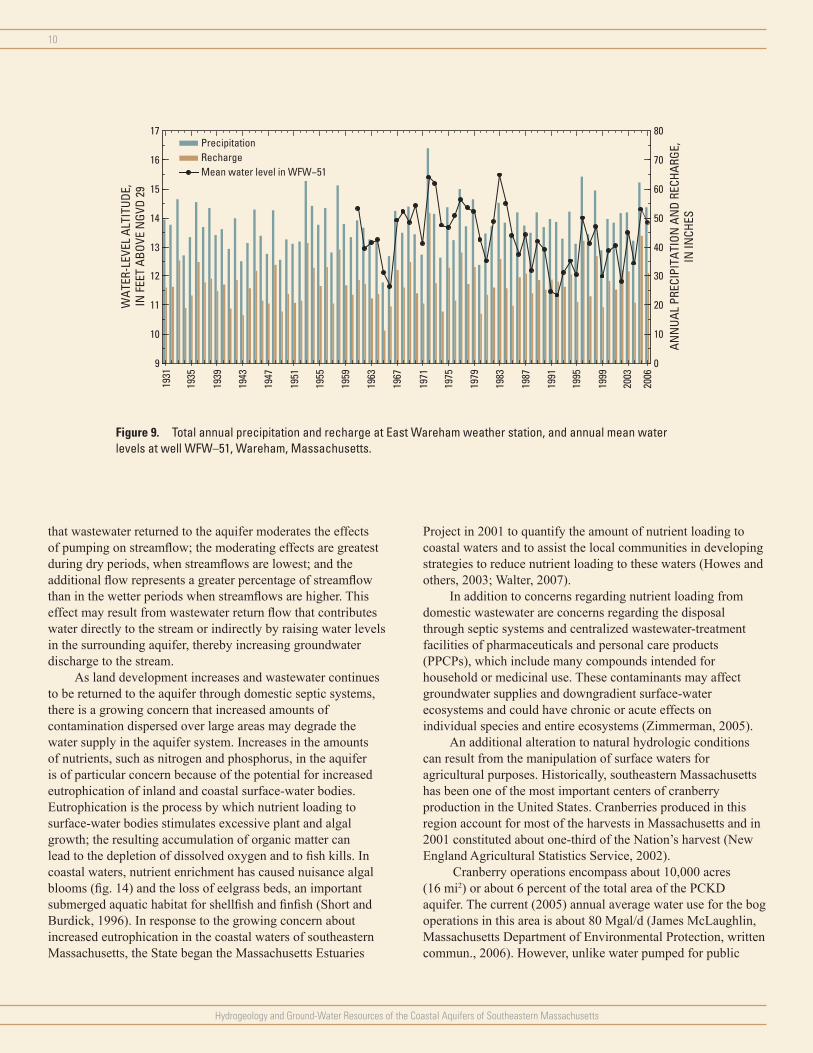
In addition to seasonal changes, water levels and streamflows also vary annually in response to long-term changes in precipitation and evapotranspiration. Water levels at observation well WFW-51 varied annually by as much 4 ft between the drought of the mid-1960s and the subsequent wet period in the early 1970s (fig. 9). Changes in water levels and streamflows also occur in response to changes in groundwater withdrawals and the return of treated wastewater to the aquifer. These changes are superimposed on natural seasonal and long-term variations; therefore, long-term data are needed to identify the causes of water-level and streamflow fluctuations.
Water Budget
Precipitation is the primary source of freshwater to the coastal-aquifer systems of southeastern Massachusetts. On average, the rainfall rate ranges from about 42 to 47 in/yr from west to east across the region. It is assumed that about 43 percent of the water (18–20 in/yr) is removed by evaporation and plant transpiration before reaching the water table; the remaining water (24–27 in/yr) enters the aquifer as recharge. If a recharge rate of 24–27 in/yr is assumed over the region,
then freshwater continually flows through and discharges from this entire coastal-aquifer system at a rate of about 270 billion gallons per year, or about 740 Mgal/d.
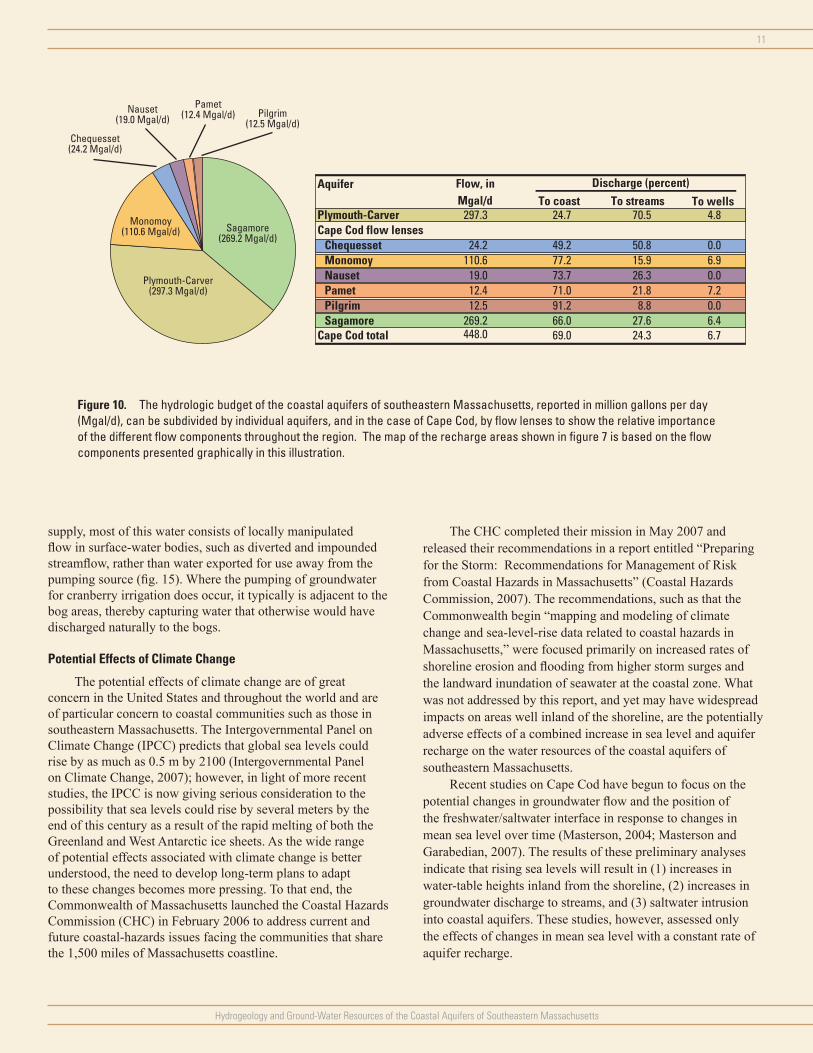
Groundwater-flow simulations were conducted to determine how much of this freshwater discharges directly to the coast through the seabed or reaches the coast as streamflow (Masterson, 2004; Walter and Whealan, 2005; Masterson and others, 2009). The total water budget for each coastal-aquifer system can be subdivided into individual flow components (fig. 10). This division allows for a better understanding of the distribution of flow to the various hydrologic features than can be obtained from the total water budget for the entire aquifer system. For instance, the total amount of groundwater discharge to streams is about 318 Mgal/d, or 43 percent of the total water budget for the entire coastal-aquifer system, but nearly 66 percent of that streamflow occurs in the PCKD aquifer system.
Groundwater withdrawals account for about 44 Mgal/d of water in the entire coastal-aquifer system and represent about 6 percent of the total water budget; however, most of the water pumped for water supply is returned to the aquifers as wastewater return flow through septic systems and centralized wastewater-treatment facilities. Although the total withdrawals represent a small percentage of the total groundwater flow through the aquifer systems, and most of the pumped water is returned to the aquifer systems, the effects of pumping need to be considered locally on a site-by-site and well-by-well basis.
Hydrogeology and Ground-Water Resources of the Coastal Aquifers of Southeastern Massachusetts
7
Effects of Changes in Pumping and Recharge
Withdrawals of groundwater from these coastal aquifers change the water levels, the flow directions, and the rate of groundwater discharge into streams and coastal water bodies. Although most pumped water is returned to the aquifer at the water table, the effects of pumping and redistribution of water on the hydrologic system are greatest near pumped wells, where there are local net losses of water, and near centralized wastewater-treatment facilities, where there are local net gains of water.
An example from the PCKD aquifer system shows the predicted water-level changes that could result from pumping-rate increases between 2005 and 2030 (fig. 11). Negative water-level changes, or drawdowns (shown in red), result from increases in pumping rates at existing wells or from the addition of new wells. Increases in water levels (shown in blue) result from the redistribution of water from the areas being pumped
to the areas receiving wastewater return flow along water-distribution lines or at wastewater-treatment facilities and from decreases in pumping at wells from current to future conditions.
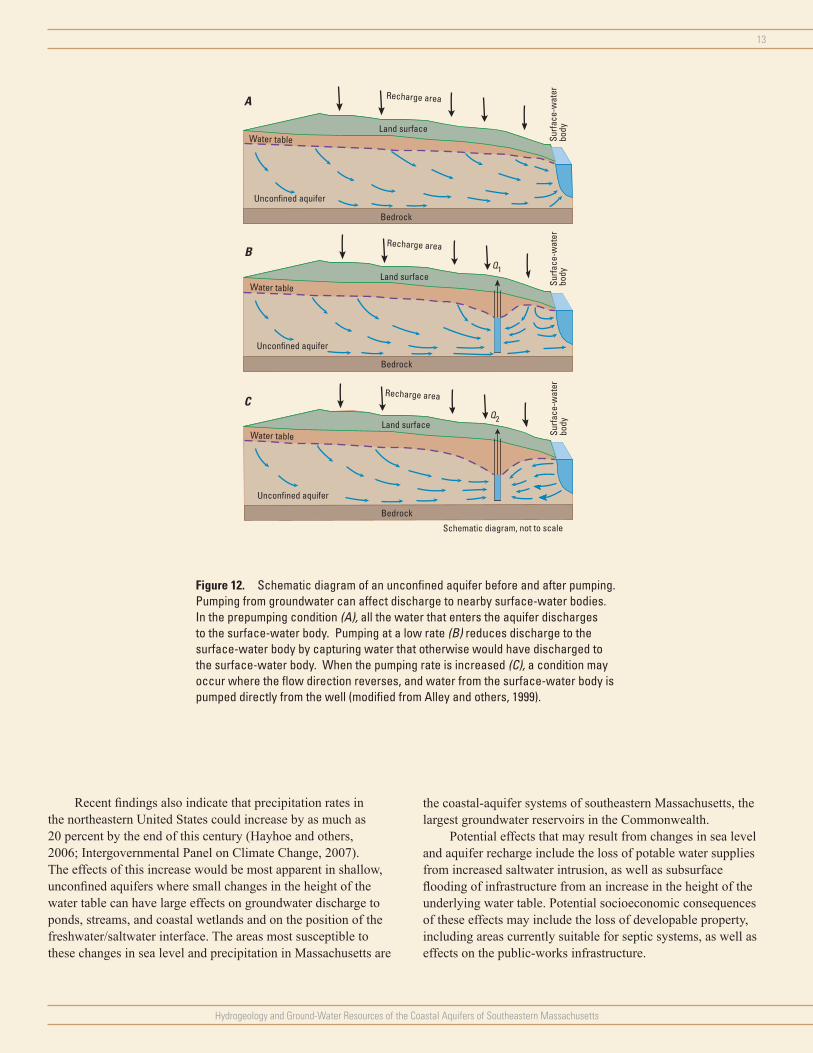
The pumping of a well can alter groundwater discharge to downgradient surface-water bodies by capturing water that would otherwise have discharged to these bodies (figs. 12A, B) and if the pumping rate is great enough, by reversing the flow direction so that the surface-water bodies contribute water directly to the pumped well (fig. 12C). This pumping can cause declines in pond levels, increases in the depth to the water table beneath inland wetlands, reductions in streamflow, and reductions in groundwater discharge to the coast. These changes can reduce the water available to shoreline plants, decrease the flooding depth and duration of vernal pools, impede migratory-fish passage, and alter the salinity of estuaries; all of these changes can reduce the diversity of a biotic community.
Saltwater intrusion is another potentially adverse effect of increased pumping on the groundwater-flow system. Saltwater
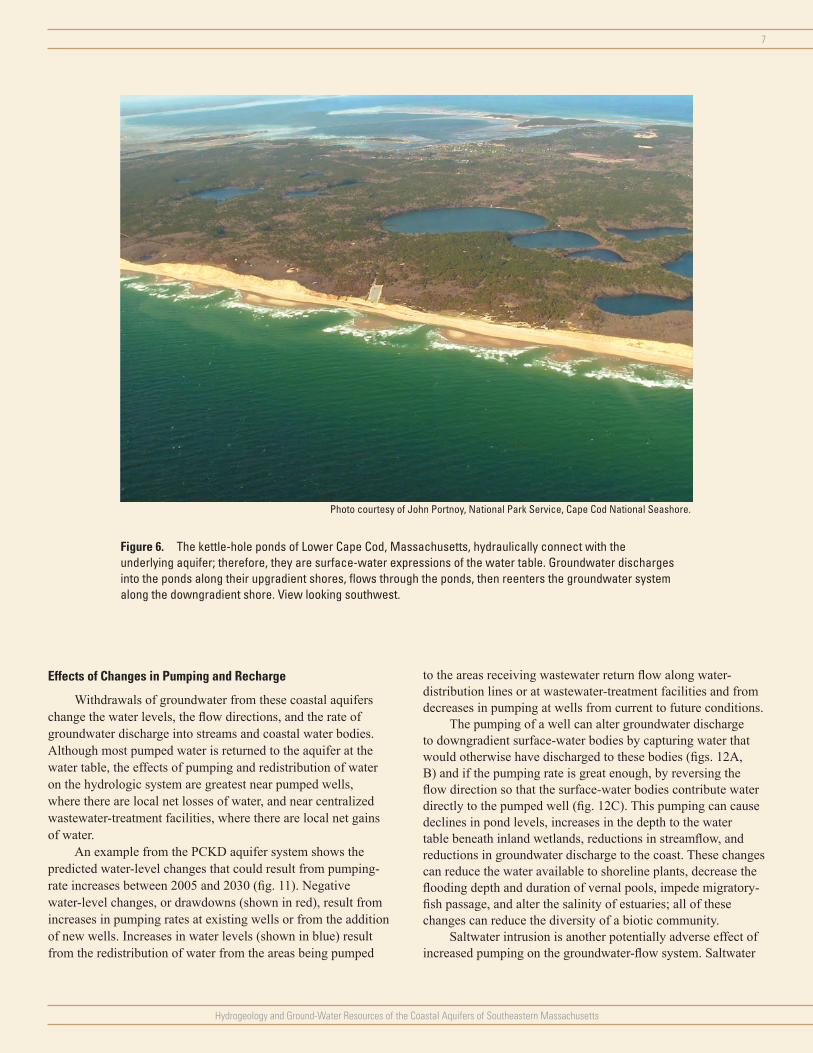
Figure 6. The kettle-hole ponds of Lower Cape Cod, Massachusetts, hydraulically connect with the underlying aquifer; therefore, they are surface-water expressions of the water table. Groundwater discharges into the ponds along their upgradient shores, flows through the ponds, then reenters the groundwater system along the downgradient shore. View looking southwest.
Photo courtesy of John Portnoy, National Park Service, Cape Cod National Seashore.
8
Hydrogeology and Ground-Water Resources of the Coastal Aquifers of Southeastern Massachusetts
intrudes locally into freshwater when a pumped well removes enough fresh groundwater to cause the interface between freshwater and saltwater to move in from the coast or upward from the underlying saline part of the aquifer. Saltwater intrusion also can occur regionally if enough groundwater is pumped and removed from the aquifer, thereby affecting the amount of groundwater discharge that occurs along the coast. This is of particular concern in the flow lenses of the outer part of Cape Cod, where groundwater is pumped from the Pamet flow lens and exported to the Pilgrim flow lens to provide drinking water to the residents of Provincetown (fig. 1).
Pumped water returned to the aquifer as wastewater return flow by way of domestic septic systems or as treated effluent from centralized wastewater-treatment facilities can lessen the effects of pumping on water quantity in these coastal aquifers in that most of the water pumped is returned to the groundwater
system. Wastewater return flow can, in some cases, raise water levels in areas where water that was distributed for public supply is returned to the aquifer away from the area where it was withdrawn. In some instances water levels may actually increase above their prepumping levels, as is the case in the western part of the Town of Duxbury and the central part of the town of Kingston (fig. 11).
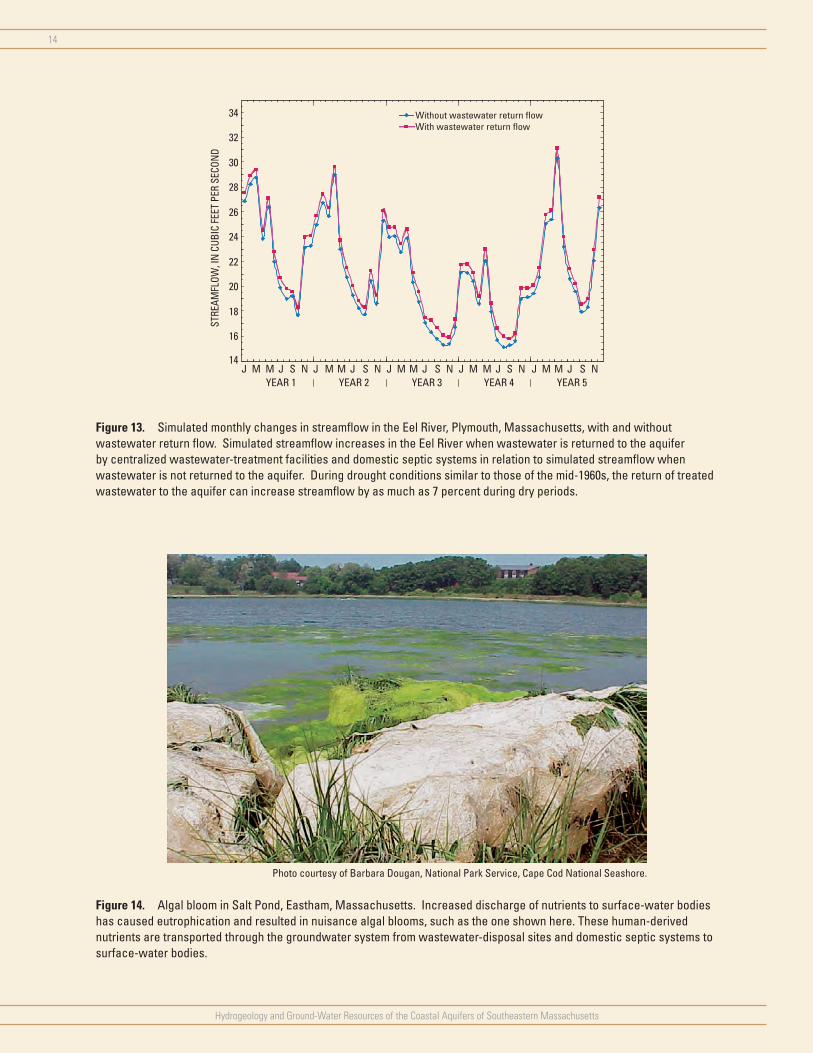
Streamflow also can be augmented by the return of wastewater to the aquifer. An example of this is the Eel River in Plymouth, where model simulations were made of streamflow under current (2005) pumping conditions during a drought similar to the one that occurred in the mid-1960s with and without wastewater returned to the aquifer. Results indicate that the return of wastewater to the aquifer accounts for about 7 percent of the streamflow during dry periods such as August of drought YEAR4 (fig. 13). These results indicate
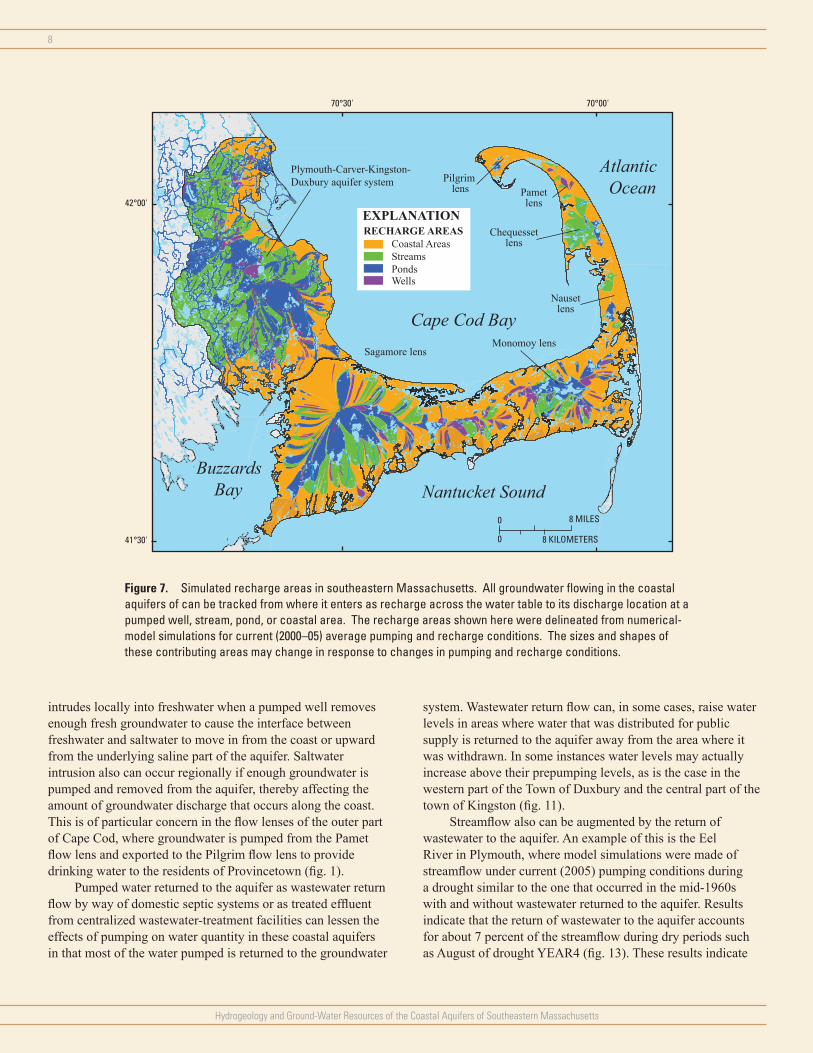
Figure 7. Simulated recharge areas in southeastern Massachusetts. All groundwater flowing in the coastal aquifers of can be tracked from where it enters as recharge across the water table to its discharge location at a pumped well, stream, pond, or coastal area. The recharge areas shown here were delineated from numerical- model simulations for current (2000–05) average pumping and recharge conditions. The sizes and shapes of these contributing areas may change in response to changes in pumping and recharge conditions.
Cape Cod Bay
Atlantic Ocean
Nantucket Sound
EXPLANATIONRECHARGE AREAS
Coastal AreasStreamsPondsWells
Plymouth-Carver-Kingston-Duxbury aquifer system
Sagamore lensMonomoy lens
Pametlens
Pilgrim lens
Chequessetlens
Nausetlens
Buzzards Bay
70°00'70°30'
42°00'
41°30'
0
0 8 KILOMETERS
8 MILES
Hydrogeology and Ground-Water Resources of the Coastal Aquifers of Southeastern Massachusetts
9
Figure 8. Average monthly (A) water levels (1961–2006) at observation well WFW–51 in Wareham; (B) streamflow (1966–2005) at Jones River, Kingston; recharge and precipitation (1931–2006) at the weather station in East Wareham, Massachusetts. Changes in water levels and streamflow, in general, are correlated to changes in precipitation from November to April when losses to evaporation and plant transpiration are low and most of the precipitation during these months reaches the water table as recharge. During the months of May through October, when losses to evaporation and plant transpiration are high, changes in water levels and streamflows are correlated more closely to changes in recharge rather than precipitation because most of the precipitation during those months never reaches the water table as recharge.
Precipitation Recharge Mean water level
A
B
June July Aug. Sept. Oct. Nov. Dec.Jan. Feb. Mar. Apr. May
STRE
AMFL
OW, I
N C
UBIC
FEE
T PE
R SE
CON
D
AVER
AGE
MON
THLY
PRE
CIPI
TATI
ON A
ND
RECH
ARGE
, IN
INCH
ES
JONES RIVER
0
1
2
3
4
5 Precipitation Recharge Mean streamflow
15
20
25
30
35
40
45
50
55
60
WAT
ER-L
EVEL
ALT
ITUD
E,IN
FEE
T AB
OVE
NGV
D 29
AVER
AGE
MON
THLY
PRE
CIPI
TATI
ON A
ND
RECH
ARGE
, IN
INCH
ES
WFW-51
10
11
12
13
14
15
16
0
1
2
3
4
5
DATE
10
Hydrogeology and Ground-Water Resources of the Coastal Aquifers of Southeastern Massachusetts
that wastewater returned to the aquifer moderates the effects of pumping on streamflow; the moderating effects are greatest during dry periods, when streamflows are lowest; and the additional flow represents a greater percentage of streamflow than in the wetter periods when streamflows are higher. This effect may result from wastewater return flow that contributes water directly to the stream or indirectly by raising water levels in the surrounding aquifer, thereby increasing groundwater discharge to the stream.
As land development increases and wastewater continues to be returned to the aquifer through domestic septic systems, there is a growing concern that increased amounts of contamination dispersed over large areas may degrade the water supply in the aquifer system. Increases in the amounts of nutrients, such as nitrogen and phosphorus, in the aquifer is of particular concern because of the potential for increased eutrophication of inland and coastal surface-water bodies. Eutrophication is the process by which nutrient loading to surface-water bodies stimulates excessive plant and algal growth; the resulting accumulation of organic matter can lead to the depletion of dissolved oxygen and to fish kills. In coastal waters, nutrient enrichment has caused nuisance algal blooms (fig. 14) and the loss of eelgrass beds, an important submerged aquatic habitat for shellfish and finfish (Short and Burdick, 1996). In response to the growing concern about increased eutrophication in the coastal waters of southeastern Massachusetts, the State began the Massachusetts Estuaries
Project in 2001 to quantify the amount of nutrient loading to coastal waters and to assist the local communities in developing strategies to reduce nutrient loading to these waters (Howes and others, 2003; Walter, 2007).
In addition to concerns regarding nutrient loading from domestic wastewater are concerns regarding the disposal through septic systems and centralized wastewater-treatment facilities of pharmaceuticals and personal care products (PPCPs), which include many compounds intended for household or medicinal use. These contaminants may affect groundwater supplies and downgradient surface-water ecosystems and could have chronic or acute effects on individual species and entire ecosystems (Zimmerman, 2005).
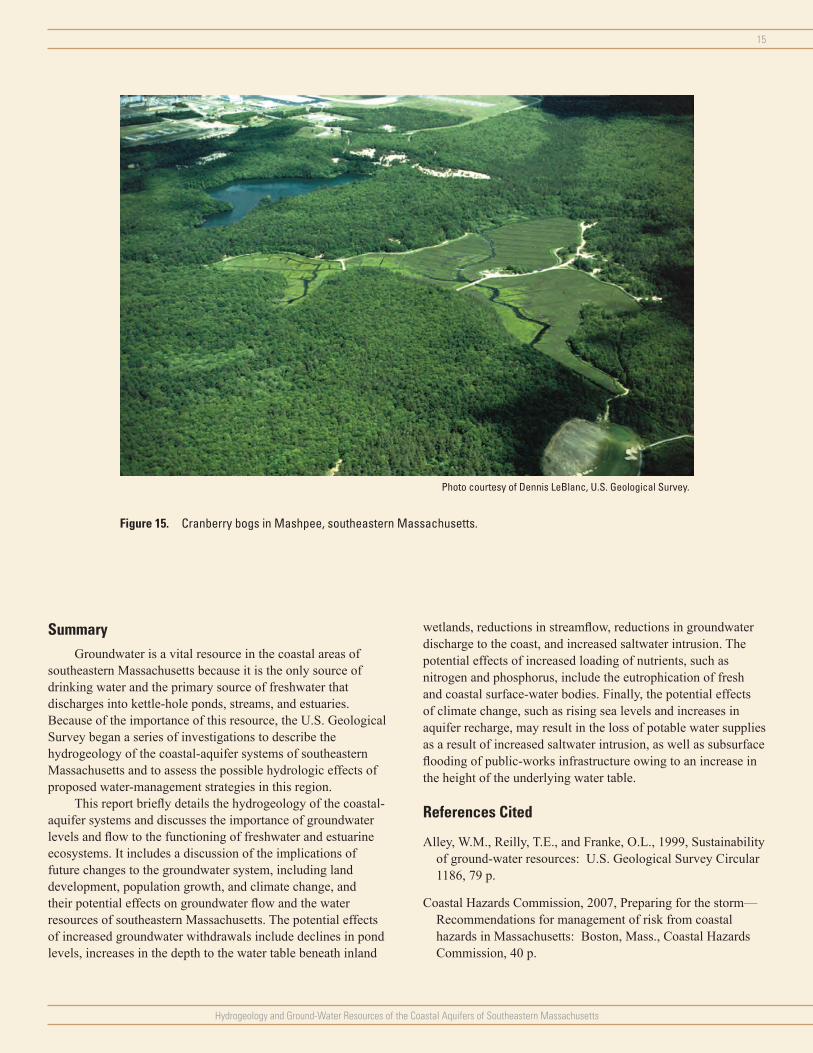
An additional alteration to natural hydrologic conditions can result from the manipulation of surface waters for agricultural purposes. Historically, southeastern Massachusetts has been one of the most important centers of cranberry production in the United States. Cranberries produced in this region account for most of the harvests in Massachusetts and in 2001 constituted about one-third of the Nation’s harvest (New England Agricultural Statistics Service, 2002).
Cranberry operations encompass about 10,000 acres (16 mi2) or about 6 percent of the total area of the PCKD aquifer. The current (2005) annual average water use for the bog operations in this area is about 80 Mgal/d (James McLaughlin, Massachusetts Department of Environmental Protection, written commun., 2006). However, unlike water pumped for public
PrecipitationRechargeMean water level in WFW−51
1931
1935
1939
1943
1947
1951
1955
1959
1963
1967
1971
1975
1979
1983
1987
1991
1995
1999
2003
2006
WAT
ER-L
EVEL
ALT
ITUD
E,IN
FEE
T AB
OVE
NGV
D 29
ANN
UAL
PREC
IPIT
ATIO
N A
ND
RECH
ARGE
,
IN IN
CHES
9 0
17 80
10
11
12
13
14
15
16
10
20
30
40
50
60
70
Figure 9. Total annual precipitation and recharge at East Wareham weather station, and annual mean water levels at well WFW–51, Wareham, Massachusetts.
Hydrogeology and Ground-Water Resources of the Coastal Aquifers of Southeastern Massachusetts
11
Figure 10. The hydrologic budget of the coastal aquifers of southeastern Massachusetts, reported in million gallons per day (Mgal/d), can be subdivided by individual aquifers, and in the case of Cape Cod, by flow lenses to show the relative importance of the different flow components throughout the region. The map of the recharge areas shown in figure 7 is based on the flow components presented graphically in this illustration.
Sagamore(269.2 Mgal/d)
Plymouth-Carver(297.3 Mgal/d)
Monomoy(110.6 Mgal/d)
Chequesset(24.2 Mgal/d)
Nauset(19.0 Mgal/d) Pilgrim
(12.5 Mgal/d)
Pamet(12.4 Mgal/d)
Aquifer Flow, in Discharge (percent) Mgal/d To coast To streams
Plymouth-Carver 297.3 24.7 70.5 4.8Cape Cod flow lenses
Chequesset 24.2 49.2 50.8 0.0Monomoy 110.6 77.2 15.9 6.9Nauset 19.0 73.7 26.3 0.0Pamet 12.4 71.0 21.8 7.2Pilgrim 12.5 91.2 8.8 0.0Sagamore 269.2 66.0 27.6 6.4
Cape Cod total 448.0 69.0 24.3 6.7
To wells
supply, most of this water consists of locally manipulated flow in surface-water bodies, such as diverted and impounded streamflow, rather than water exported for use away from the pumping source (fig. 15). Where the pumping of groundwater for cranberry irrigation does occur, it typically is adjacent to the bog areas, thereby capturing water that otherwise would have discharged naturally to the bogs.
Potential Effects of Climate Change
The potential effects of climate change are of great concern in the United States and throughout the world and are of particular concern to coastal communities such as those in southeastern Massachusetts. The Intergovernmental Panel on Climate Change (IPCC) predicts that global sea levels could rise by as much as 0.5 m by 2100 (Intergovernmental Panel on Climate Change, 2007); however, in light of more recent studies, the IPCC is now giving serious consideration to the possibility that sea levels could rise by several meters by the end of this century as a result of the rapid melting of both the Greenland and West Antarctic ice sheets. As the wide range of potential effects associated with climate change is better understood, the need to develop long-term plans to adapt to these changes becomes more pressing. To that end, the Commonwealth of Massachusetts launched the Coastal Hazards Commission (CHC) in February 2006 to address current and future coastal-hazards issues facing the communities that share the 1,500 miles of Massachusetts coastline.
The CHC completed their mission in May 2007 and released their recommendations in a report entitled “Preparing for the Storm: Recommendations for Management of Risk from Coastal Hazards in Massachusetts” (Coastal Hazards Commission, 2007). The recommendations, such as that the Commonwealth begin “mapping and modeling of climate change and sea-level-rise data related to coastal hazards in Massachusetts,” were focused primarily on increased rates of shoreline erosion and flooding from higher storm surges and the landward inundation of seawater at the coastal zone. What was not addressed by this report, and yet may have widespread impacts on areas well inland of the shoreline, are the potentially adverse effects of a combined increase in sea level and aquifer recharge on the water resources of the coastal aquifers of southeastern Massachusetts.
Recent studies on Cape Cod have begun to focus on the potential changes in groundwater flow and the position of the freshwater/saltwater interface in response to changes in mean sea level over time (Masterson, 2004; Masterson and Garabedian, 2007). The results of these preliminary analyses indicate that rising sea levels will result in (1) increases in water-table heights inland from the shoreline, (2) increases in groundwater discharge to streams, and (3) saltwater intrusion into coastal aquifers. These studies, however, assessed only the effects of changes in mean sea level with a constant rate of aquifer recharge.

12
Hydrogeology and Ground-Water Resources of the Coastal Aquifers of Southeastern Massachusetts
70°37'30"70°47'30"
42°00'
41°45'
From USGS and MassGIS data sources, Massachusetts State PlaneCoordinate System, Mainland Zone.
Inactive model area
Surface waterStream
Water-level change (in feet)
Wastewater-treatment facility
EXPLANATION
Model cells with year-2030 water-distribution lines
Production well2005 and 20302030 only
2005 only
> 3 to 5
> 5
> 1 to 3
> 0.7 to 1
> 0.5 to 0.7
> 0.3 to 0.5
> 0.1 to 0.3
0.1 to < -0.1
-0.1 to < -0.3
-0.3 to < -0.5
-0.5 to < -0.7
-0.7 to < -1
-1 to < -3
-3 to < -5
< -5
PlymouthCarver
Rochester
Plympton
Middleborough
Halifax
Pembroke
Duxbury
Marshfield
Marion
Wareham
Kingston
Bourne
0 2 MILES
0 2 KILOMETERS
Figure 11. Changes in water levels between current (2005) and proposed (2030) pumping and recharge conditions in the Plymouth-Carver-Kingston-Duxbury aquifer system in southeastern Massachusetts. Changes are presented in plan view to depict areas where water levels will be lower in the future (shown in red) and where they will be higher in the future (shown in blue) than they are at present (2005). Decreases in water levels are the result of increased groundwater withdrawals, whereas increases in water levels are the result of increased recharge of wastewater from centralized wastewater-treatment facilities and domestic septic systems and future reductions in current pumping from existing wells.
Hydrogeology and Ground-Water Resources of the Coastal Aquifers of Southeastern Massachusetts
13
Schematic diagram, not to scale
Unconfined aquifer
Unconfined aquifer
Q1
Q2
Recharge area
Land surfaceWater table
C
B
A
Land surface
Land surface
Surfa
ce-w
ater
body
Surfa
ce-w
ater
body
Surfa
ce-w
ater
body
Unconfined aquifer
Water table
Water table
Bedrock
Bedrock
Bedrock
Recharge area
Recharge area
Figure 12. Schematic diagram of an unconfined aquifer before and after pumping. Pumping from groundwater can affect discharge to nearby surface-water bodies. In the prepumping condition (A), all the water that enters the aquifer discharges to the surface-water body. Pumping at a low rate (B) reduces discharge to the surface-water body by capturing water that otherwise would have discharged to the surface-water body. When the pumping rate is increased (C), a condition may occur where the flow direction reverses, and water from the surface-water body is pumped directly from the well (modified from Alley and others, 1999).
Recent findings also indicate that precipitation rates in the northeastern United States could increase by as much as 20 percent by the end of this century (Hayhoe and others, 2006; Intergovernmental Panel on Climate Change, 2007). The effects of this increase would be most apparent in shallow, unconfined aquifers where small changes in the height of the water table can have large effects on groundwater discharge to ponds, streams, and coastal wetlands and on the position of the freshwater/saltwater interface. The areas most susceptible to these changes in sea level and precipitation in Massachusetts are
the coastal-aquifer systems of southeastern Massachusetts, the largest groundwater reservoirs in the Commonwealth.
Potential effects that may result from changes in sea level and aquifer recharge include the loss of potable water supplies from increased saltwater intrusion, as well as subsurface flooding of infrastructure from an increase in the height of the underlying water table. Potential socioeconomic consequences of these effects may include the loss of developable property, including areas currently suitable for septic systems, as well as effects on the public-works infrastructure.
14
Hydrogeology and Ground-Water Resources of the Coastal Aquifers of Southeastern Massachusetts
Figure 14. Algal bloom in Salt Pond, Eastham, Massachusetts. Increased discharge of nutrients to surface-water bodies has caused eutrophication and resulted in nuisance algal blooms, such as the one shown here. These human-derived nutrients are transported through the groundwater system from wastewater-disposal sites and domestic septic systems to surface-water bodies.
Without wastewater return flowWith wastewater return flow
16
18
20
22
24
26
28
30
32
34
J M MYEAR 1 YEAR 2 YEAR 3 YEAR 4 YEAR 5
J S N J M M J S N J M M J S N J M M J S N J M M J S N
STRE
AMFL
OW, I
N C
UBIC
FEE
T PE
R SE
CON
D
14
Figure 13. Simulated monthly changes in streamflow in the Eel River, Plymouth, Massachusetts, with and without wastewater return flow. Simulated streamflow increases in the Eel River when wastewater is returned to the aquifer by centralized wastewater-treatment facilities and domestic septic systems in relation to simulated streamflow when wastewater is not returned to the aquifer. During drought conditions similar to those of the mid-1960s, the return of treated wastewater to the aquifer can increase streamflow by as much as 7 percent during dry periods.
Photo courtesy of Barbara Dougan, National Park Service, Cape Cod National Seashore.
Hydrogeology and Ground-Water Resources of the Coastal Aquifers of Southeastern Massachusetts
15
SummaryGroundwater is a vital resource in the coastal areas of
southeastern Massachusetts because it is the only source of drinking water and the primary source of freshwater that discharges into kettle-hole ponds, streams, and estuaries. Because of the importance of this resource, the U.S. Geological Survey began a series of investigations to describe the hydrogeology of the coastal-aquifer systems of southeastern Massachusetts and to assess the possible hydrologic effects of proposed water-management strategies in this region.
This report briefly details the hydrogeology of the coastal-aquifer systems and discusses the importance of groundwater levels and flow to the functioning of freshwater and estuarine ecosystems. It includes a discussion of the implications of future changes to the groundwater system, including land development, population growth, and climate change, and their potential effects on groundwater flow and the water resources of southeastern Massachusetts. The potential effects of increased groundwater withdrawals include declines in pond levels, increases in the depth to the water table beneath inland
wetlands, reductions in streamflow, reductions in groundwater discharge to the coast, and increased saltwater intrusion. The potential effects of increased loading of nutrients, such as nitrogen and phosphorus, include the eutrophication of fresh and coastal surface-water bodies. Finally, the potential effects of climate change, such as rising sea levels and increases in aquifer recharge, may result in the loss of potable water supplies as a result of increased saltwater intrusion, as well as subsurface flooding of public-works infrastructure owing to an increase in the height of the underlying water table.
References Cited
Alley, W.M., Reilly, T.E., and Franke, O.L., 1999, Sustainability of ground-water resources: U.S. Geological Survey Circular 1186, 79 p.
Coastal Hazards Commission, 2007, Preparing for the storm— Recommendations for management of risk from coastal hazards in Massachusetts: Boston, Mass., Coastal Hazards Commission, 40 p.
Figure 15. Cranberry bogs in Mashpee, southeastern Massachusetts.
Photo courtesy of Dennis LeBlanc, U.S. Geological Survey.
16
Hydrogeology and Ground-Water Resources of the Coastal Aquifers of Southeastern Massachusetts
Geise, G.S., and Aubrey, D.G., 1987, Bluff erosion on outer Cape Cod, in Kraus, N.C., ed., Coastal Sediments ’87, v. 2: New York, American Society of Civil Engineers, p. 1871–1875.
Hayhoe, K., Wake, C.P., Huntington, T.G., Lou, L., Schwartz, M.D., Sheffield, J., Wood, E., Anderson, B., Bradbury, J., DeGaetano, A., Troy, T.J., and Wolfe, D., 2006, Past and future changes in climate and hydrological indicators in the U.S. Northeast: Climate Dynamics, v. 28, no. 4, p. 381–407.
Howes, D.L., Samimy, Roland, and Dudley, Brian, 2003, Massachusetts Estuary Project—Site specific nitrogen thresholds for southeastern Massachusetts embayments—critical indicators: Dartmouth, Mass., University of Massachusetts School of Marine Science and Technology, 28 p.
Intergovernmental Panel on Climate Change, 2007, Working Group I—The physical science basis of climate change, accessed January 11, 2007, at http://www.ipcc-wg1.ucar.edu/wg1/wg1-report.html
Larson, G. J., 1980, Nonsynchronous retreat of ice lobes from southeastern Massachusetts, in Larson, G.J. and Stone, B.D., eds., Late Wisconsinan glaciation of New England: Dubuque, Iowa, Kendall/Hall Publishing Co., p. 101–114.
Masterson, J.P., Carlson, C.S., Massey, A.J., and Walter, D.A., 2009, Hydrogeology and simulation of groundwater flow in the Plymouth-Carver-Kingston-Duxbury aquifer system, southeastern Massachusetts: U.S. Geological Survey Scientific Investigations Report 2009–5063, 116 p.
Masterson, J.P., 2004, Simulated interaction between freshwater and saltwater and effects of ground-water pumping and sea-level change, Lower Cape Cod aquifer system, Massachusetts: U.S. Geological Survey Scientific Investigations Report 2004–5014, 72 p.
Masterson, J.P., and Garabedian, S.P., 2007, Effects of sea-level rise on ground-water flow in a coastal aquifer system: Ground Water, v. 45, no. 2, p. 209–217.
Masterson, J.P., Stone, B.D., Walter, D.A., and Savoie, Jennifer, 1997, Hydrogeologic framework of western Cape Cod, Massachusetts: U.S. Geological Survey Hydrologic Investigations Atlas 741, 1 pl.
Masterson, J.P., and Walter, D.A., 2000, Delineation of ground-water recharge areas, western Cape Cod, Massachu setts: U.S. Geological Survey Water-Resources Investiga tions Report 00–4000, 1 pl.
New England Agricultural Statistics Service, 2002, U.S. cranberry production down 5 percent, in Cranberries: East Wareham, Mass., NEASS, a field office of the National Agricultural Statistics Service, U.S. Department of Agriculture, 2 p.
Oldale, R.N., 1992, Cape Cod and the islands—The geologic story: East Orleans, Mass., Parnassus Imprints, 205 p.
Reilly, T.E., and Pollock, D.W., 1993, Factors affecting areas contributing recharge in shallow aquifers: U.S. Geological Survey Water-Supply Paper 2412, 21 p.
Short, F.T., and Burdick, D.M., 1996, Quantifying eelgrass habitat loss in relation to housing development and nitrogen loading in Waquoit Bay, Massachusetts: Estuaries, v. 19, p. 730–739.
Strahler, A.N., 1966, A geologist’s view of Cape Cod: Garden City, New York, The Natural History Press, 115 p.
Theiler, E.R., and Hammar-Klose, E.S., 2000, National assessment of coastal vulnerability to sea-level rise—Preliminary results for the U.S. Atlantic coast: U.S. Geological Survey Open-File Report 99–593, 1 sheet.
Walter, D.A., 2007, Use of numerical models to simulate transport of sewage-derived nitrate in a coastal aquifer, central and western Cape Cod, Massachusetts: U.S. Geological Survey Scientific Investigations Report 2007–5254, 54 p.
Walter, D.A., Masterson, J.P., and Hess, K.M., 2004, Ground-water recharge areas and travel times to pumped wells, ponds, streams, and coastal water bodies, Cape Cod, Massachusetts: U.S. Geological Survey Scientific Investigations Map I–2857, 1 sheet.
Walter, D.A., and Whealan, A.T., 2005, Simulated water sources and effects of pumping on surface and ground water, Sagamore and Monomoy flow lenses, Cape Cod, Massachusetts: U.S. Geological Survey Scientific Investigations Report 2004–5181, 85 p.
Zimmerman, M.J., 2005, Occurrence of organic wastewater contaminants, pharmaceuticals, and personal care products in selected water supplies, Cape Cod, Massachusetts, June 2004: U.S. Geological Survey Open-File Report 2005–1206, 16 p.

Prepared by the Pembroke Publishing Service Center.
For more information concerning the research in this report, contact: Director USGS Massachusetts-Rhode Island Water Science Center10 Bearfoot Road Northborough, MA 01532
or visit our Web site at:http://ma.water.usgs.gov

Masterson and W
alter—H
ydrogeology and Ground-W
ater Resources of the Coastal Aquifers of Southeastern M
assachusetts—Circular 1338