hydrogen sulfide oxidation and sewer...
TRANSCRIPT

Hydrogen Sulfide Oxidation and Sewer Corrosion Including the articles:
Description of the hydrogen sulfide induced corrosion of concrete sew-
er systems - a new approach.
Hydrogen sulfide uptake rates and biomass concentration of microorganisms
from corroded concrete
Spring 2009
Mark Kalhøj Department of Biotechnology, Chemistry and
Environmental Engineering at Aalborg University

2

3
Title: Hydrogen Sulfide Oxidation
and Sewer Corrosion
Project period: 15th of August 2008 – 15th of June 2009
Author: Mark Kalhøj
Supervisors: Asbjørn Haaning Nielsen
Associate Professor
Section of Environmental Engineering
Aalborg University, Denmark
Jes Vollertsen
Professor (with special responsibilities)
Section of Environmental Engineering
Aalborg University, Denmark
Printed copies: 10
Number of pages: 40
________________________________
Mark Kalhøj

4 Preface
Preface
This Master’s thesis is produced at Aalborg University and consists of 2 articles in the
area of hydrogen sulfide oxidation and sewer corrosion. The study was written with
supervisors Associate Professor Asbjørn Haaning Nielsen and Professor, with special
responsibilities, Jes Vollertsen, at the section of Environmental Engineering, from De-
partment of Biotechnology, Chemistry and Environmental Engineering at Aalborg
University in Denmark.
The 1st article, ―Description of the hydrogen sulfide induced corrosion of concrete
sewer systems - a new approach ‖, concerns corrosion of concrete sewers, parameters
for estimation of annual corrosion rates and influence of sewer atmosphere velocity on
hydrogen sulfide removal rates.
The 2nd article, ―Hydrogen sulfide uptake rates and biomass concentration of microor-
ganisms from corroded concrete‖, concerns the relationship between the hydrogen sul-
fide removal rate and the biomass of hydrogen sulfide oxidizing microorganisms,
measured in a suspension bioreactor. Furthermore, it concerns methyl mercaptane
oxidation kinetics.
I would like to dedicate a special thanks to:
- Post-doctoral Researcher Henriette Stokbro Jensen for her help with the reac-
tor setup, used in article 2.
- Associate Professor Jeppe Lund Nielsen for help with determination of the
microbial diversity of reactor samples, used in article 2.
- Laboratory Technician Jytte Dencker for help in the laboratory.
- Associate Professor Peter Roslev for help with selection of method for bio-
mass determination, used in article 2.
- Assistant Professor Kai Bester for general counseling.
- Line Winther, Helene Winther and Mia Busch Agergaard who contributed in
various ways.
I would furthermore like to thank all the people associated to institute 18, Department
of Biotechnology, Chemistry and Environmental Engineering at Aalborg University,
for many experiences that implicit has contributed to this thesis.
The results of this thesis are accessible by contact to e-mail [email protected]
and will be applied to www.kalhoej.com.

5
Table of contents
Preface ........................................................................................................................... 4 Description of the hydrogen sulfide induced corrosion of concrete sewer systems - a
new approach ................................................................................................................. 6 Introduction ............................................................................................................... 6 Materials and Methods .............................................................................................. 8
Calculations ........................................................................................................ 12 Results and Discussion ............................................................................................ 13 Conclusion .............................................................................................................. 20 References ............................................................................................................... 21
Hydrogen sulfide uptake rates and biomass concentration of microorganisms from
corroded concrete ......................................................................................................... 22 Introduction ............................................................................................................. 22 Materials and Methods ............................................................................................ 24
Calculations ........................................................................................................ 28 Results and Discussion ............................................................................................ 28
Protein concentration .......................................................................................... 32 Methyl mercaptane ............................................................................................. 36
Conclusion .............................................................................................................. 37 References ............................................................................................................... 38

6 Description of the hydrogen sulfide induced corrosion of concrete sewer systems - a new approach
Description of the hydrogen sulfide induced corro-sion of concrete sewer systems - a new approach
Abstract
Hydrogen sulfide is removed from the sewer gas phase by absorption and oxidized on the
exposed concrete surface, which results in concrete corrosion. The relation between actual and
potential corrosion was investigated and described as a corrosion reduction factor. A study on
the fate of partly oxidized hydrogen sulfide that is immobilized in corroded concrete was
performed. This determined that the sulfur compounds immobilized in the corroded matrix has a
significant corrosive potential. The immobilized sulfur compounds were oxidized to sulfuric
acid and corroded the sewer, when a lack of hydrogen sulfide occurred. Furthermore, an
investigation of the influence of atmosphere velocity on hydrogen sulfide removal rate in sewer
systems was performed. This investigation indicated a significant increase in hydrogen sulfide
removal with increasing sewer atmosphere velocities.
Introduction
Hydrogen sulfide formation in drainage systems often is a result of the wastewater transport to
large centralized treatment plants. This results in long transport distances and requires pumping
the wastewater through pressure pipes. In the pressure pipes, there is no reaeration of the
wastewater as in the gravity pipes, which lead to anaerobic conditions and sulfide production
because of microbial activity [Danish Environmental Protection Agency, 1988].
Sulfide is primarily produced in the sewer biofilm covering the submerged sewer walls. In a
gravity sewer, where oxygen is present in the wastewater, the sulfide is oxidized back to sulfate,
and usually does not cause any problems. Figure 1 illustrates the reduction of sulfate in the
biofilm and the oxidation of sulfide back into sulfate. This process contributes to the oxygen
consumption of the biofilm, thus a fall in DO concentration when it penetrates the biofilm.
Figure 1. Sulfate cycle in submerged sewer biofilms and the DO concentration.

7 Description of the hydrogen sulfide induced corrosion of concrete sewer systems - a new approach
In pressure pipes where the DO concentration is zero in the wastewater phase, due to lack of
reaeration, the sulfide cannot be oxidized and it diffuses from the biofilm into the liquid phase,
as illustrated by the dotted arrow in Figure 1. At the outlet of a pressure pipe, where it becomes
a gravity sewer again, the sulfide is partly released to the gas phase as hydrogen sulfide
[Hvitved-Jacobsen, 2002].
From a facility standpoint, hydrogen sulfide corrodes the concrete pipes and wells of up to 5
mm per year [Mori et. al., 1991]. This means that parts of the drainage systems must be
replaced earlier than expected [Hvitved-Jacobsen, 2002]. The magnitude of the corrosion
problems are concentration dependent and can be displayed in a simplified manner, as shown in
Table 2.
Table 1. The facility consequences caused by different total sulfide concentrations in the wastewater
[Hvitved-Jacobsen, 2002].
Sulfide concentration [mg S ∙ L-1
] Corrosion problems
<0,5 Small
0,5-2 Medium
>2 Significant
Low concentrations of sulfide in wastewater are not very problematic because it normally
contains metals that will precipitate with the sulfide as relatively inert metal-sulfides. Total
sulfide concentrations of 0.5 [mg S ∙ L-1] does not necessarily give significant problems in the
sewers, but should be monitored. Serious problems can occur when sulfide concentrations
exceed 2 [mg S ∙ L-1], and depending on the individual situation, a reduction of the hydrogen
sulfide quantities should be considered.
The traditional approach for predicting H2S related concrete corrosion is base on the postulate
that all the hydrogen sulfide that can be released, is released into gas phase when the wastewater
is exiting a pressurized pipe [US EPA, 1974]. Furthermore, it is assumed that all hydrogen
sulfide is oxidized on the concrete surface and reacts with alkaline components of concrete.
This does not correspond with what actually is observed, because moisture droplets on the
concrete surface are assumed to drip into the wastewater, thus all the hydrogen sulfide does not
react with the concrete. Even more significant is the fact that not all hydrogen sulfide is
completely oxidized, but just partly oxidized, and ends up as immobilized elemental sulfur on
the sewer wall [Parker, 1945; Jensen et. al., in preparation]. These conditions were described as
a corrosion reduction factor for the first time by US EPA [1974]. The factor was suggested to be
between 0.3 and 1 depending on the hydrogen sulfide load, but without any references
[Hvitved-Jacobsen, 2002; US EPA, 1974]. This hydrogen sulfide load dependency is not fully
understood and is mentioned in a new report from the Water Environment Research
Foundations as one of the largest research gaps of sewer processes right now [WERF, 2007].
The value of the corrosion reduction factor is actually unknown and so is the role of elemental
sulfur in the corroded concrete matrix.

8 Description of the hydrogen sulfide induced corrosion of concrete sewer systems - a new approach
The Water Environment Research Foundation, WERF, has made a profound literature study
[WERF, 2007] of the research on odors and corrosion in sewer systems, which resulted in, inter
alia, a list of research gaps, where 2 of the 4 top-priority research gaps are:
Improving understanding of the nature of sewer system ventilation.
Improving understanding of the relationship between H2S gas phase concentrations
and corrosion.
There are three main objectives of this study; the first is to describe the relation between actual
and potential corrosion in a corroded concrete sewer matrix. The second is to investigate the
fate of the immobilized sulfur compounds in the corroded matrix. This pool of sulfur
compounds, which is stored by the microorganisms in the corroded concrete on the sewer wall,
is potentially corrosive and this study will investigate the actual corrosive effect. The third
objective is to describe the relation between sewer atmosphere velocity and the rate of hydrogen
sulfide removal on the sewer wall.
Materials and Methods Hydrogen sulfide oxidation in sewer systems is investigated in a pilot scale setup at a sewer
research and monitoring station in the town of Frejlev, a few kilometers west of Aalborg,
Denmark [Vollertsen et. al., 2008]. The Frejlev sewer monitoring station is located below the
ground with easy access to a continuous supply of wastewater from a purely residential
catchment of approximately 2000 inhabitants.
The experiments of this study are performed in 2 different pilot scale setups. The first setup is
described right below and the second setup is described later. The first setup is used to
investigate the relation between actual and potential corrosion of concrete sewers when exposed
to hydrogen sulfide. The same setup is used to describe the actual corrosive effects of
immobilized sulfur compounds, which is performed by comparing the corrosion caused during
hydrogen sulfide addition and the corrosion by a period after hydrogen sulfide addition, referred
to as post exposure corrosion. In order to describe these relationships, a setup of concrete
sewers is constructed; in this case an already existing setup is modified to the purpose of this
experiment. The setup is in a pilot scale, with 6 separate sewer reactors of concrete pipe
segments that were cut from a standard Portland cement concrete pipe. Each reactor consists of
10 concrete pipe segments with an individual length of 0.2 meters, which gives the reactor a
total length of approximately 2 meters. To make the reactor as similar as possible to real sewer
pipes, it has an air circulation system, a wastewater circulation system, a wastewater renewal
system, a wastewater depth of 0.05 m and a hydrogen sulfide gas injector. The air circulation
system consisted of a 3.0 m PVC pipe with an inner diameter of 22 mm and a fan blower. The
resulting gas velocity inside the reaction chamber was 0.053±0.007 [m ∙ s-1] measured with a
flow-meter at the outlet of the PVC pipe [Nielsen, et. al., 2008]. This result in a circulation time
of approximately 40 s and is comparable to velocities measured in real sewers [Madsen et. al.,
2006]. The wastewater circulation is done by a centrifugal pump with capacity of pumping
more than 1 ls-1, but due to hydrostatic reduction in the system, the flow is approximately 0.3 ls-
1, which is a lower velocity than found in a real sewer of this size. The same applies for the
wastewater renewal system where there is a renewal pumping session every third hour that
exchanges 20% of the total volume, which means that the wastewater has an average cycling

9 Description of the hydrogen sulfide induced corrosion of concrete sewer systems - a new approach
time of 15 hours. The wastewater parameters should not affect oxidation of hydrogen sulfide on
the pipe wall significantly, because the oxidation in the water phase is a small fraction of the
total oxidation. The hydrogen sulfide oxidation primarily takes place on concrete wall in contact
with the gas phase [Vollertsen et. al., 2008]. The two wastewater parameters, velocity and
renewal, has a more significant influence on the hydrogen sulfide production under anaerobic
conditions, but this reactor setup receives hydrogen sulfide from an external source to ensure a
consistent gas phase concentration throughout the experiment. In order to ensure complete
mixing of injected hydrogen sulfide in the sewer atmosphere and to avoid jet streams from the
air circulation, a diffuser that covers both outlets is installed. The system is air and watertight
and to avert a pressure buildup, a 1 mm pressure equalizer drilling is made in the back PVC
plate.
Figure 2. A principal figure of a reactor used to simulate corrosion process in sewers.
The whole system of each reactor is controlled by a Programmable Logic Controller (PLC) that
operates the components of the system; this is an indispensable part of the reactor setup, which
enables the operator to run the system with many different configurations. In this setup, the
parameter configuration results in a hydrogen sulfide injection every hour and every injection
makes the hydrogen sulfide gas phase concentration increase to an average of approximately
1100 ppmv. Injecting every hour ensures that all hydrogen sulfide is absorbed before the next
injection, which prevents a buildup of hydrogen sulfide gas [Nielsen, et. al., 2008]. To
document the absorption of hydrogen sulfide, the removal rate is measured 15 days into and
throughout the experiment. According to Nielsen et. al. (2008), an increase in hydrogen sulfide
removal rate to a range of 100 – 500 [mg S m-2 h-1] at 100 ppmv is expected. In order to
document this, an Odalog gas detector (App-Tek International Pty Ltd, Brendale, Australia) was
installed in the air circulation system. To ensure a precise measurement, the gas detector was
calibrated using 100 ppmv H2S calibration gas (Euro-Gas Management Services Ltd, Plymouth,
UK). The Odalog gas detector measures the hydrogen sulfide concentration in the atmosphere
and stores it every 15 seconds. There was no temperature control and no continuous temperature
measurements, but the pilot scale structure is placed underground and random temperature
measurements indicate an average of 10ºC. The alkalinity of a concrete pipe was analyzed
according to Snell et. al. (1966–1974). The method was modified for larger samples of
approximately 5 g concrete and resulted in CaCO3 equivalents of 0.181 g CaCO3 / g concrete
[Vollertsen et. al, 2008].
The experiment consists of concrete reactors that are paired up, Table 1. Reactor pair A consists
of reactors I and IV, both reactors were exposed to H2S for 48 days. After 48 days of exposure,
half of the concrete segments from each reactor were washed and weighed. In order to
compensate for H2S injection point related complications, mentioned by Vollertsen et. al.
(2008), the segments washed are a, c, e, g and i of reactor I and b, d, f, h and j of reactor IV,
shown in Figure 3.

10 Description of the hydrogen sulfide induced corrosion of concrete sewer systems - a new approach
Table 1. Parameters describing the reactor setup.
Pipe pairs A B C
I IV II V III VI
Period of H2S exposure 28-08-08 – 15-10-08 28-08-08 – 12-11-08 28-08-08 – 15-12-08
Exposure time [days] 48 76 109
Period of post exposure 15-10-08 – 20-12-08 12-11-08 – 17-01-09 15-12-08 – 19-02-09
Post exposure time [days] 66 66 66
When the start weight is subtracted the end-weight, the amount of corroded concrete is deter-
mined. Then, the reactors are reassembled and run for another 66 days without hydrogen sulfide
addition, which should enable the bacteria to fully oxidize the sulfur to sulfuric acid on the un-
disturbed concrete segments [Jensen et. al., in preparation]. After 66 days, the other half of the
reactors are washed and weighed. The amount of corroded concrete is again determined by sub-
tracting the end-weight from the start weight. This also accounts for the other reactors. The only
difference is that the pair, II and V, is exposed to H2S in 76 days, and the pair, III and VI, is ex-
posed to H2S in 109 days. All reactors have a post exposure period of 66 days after the period of
hydrogen sulfide exposure.
Figure 3. The experiment setup with six reactors consisting of 10 concrete segments each.
Figure 3 shows the reactor setup with the 6 reactors and the concrete segment distribution. The
hydrogen sulfide injection point is at concrete segment A.
The second experiment setup is used to investigate the relationship between sewer atmosphere
velocity and hydrogen sulfide removal rate. The first setup was reorganized to the purpose of
ventilation experiment after the corrosion reduction factor and post exposure corrosion experi-
ment was performed. The new setup is performed under the same circumstances as mentioned
in the first setup, with two major changes; the first is that the setup was reorganized into two
pipes, each consisting of 23 concrete segments instead of 6 pipes consisting of 10 segments
each. The second is the air circulation system. The two pipes are connected in each end by two
3.5‖ rubber tubes and in one of the pipe ends, a centrifugal fan blower is fitted (ebm-papst Mul-
fingen GmbH & Co., Mulfingen, Germany). The blower is regulated by a volt signal 0 – 10 volt
and is capable of generating a sewer atmosphere velocity of 1.9 [m ∙ s-1]. The ventilation setup
is illustrated in Figure 4.

11 Description of the hydrogen sulfide induced corrosion of concrete sewer systems - a new approach
Figure 4. The ventilation setup consists of 2 pipe section of 4.6 meters each, a centrifugal fan blower
and 4 hydrogen sulfide measuring points.
The ventilation setup has 9.2 meters of concrete segments, which results in 3.9 m2 of hydrogen
sulfide exposed area. 4 hydrogen sulfide measuring points are fitted into the setup and in each
end of the concrete pipes; a sewer atmosphere mixing plate is fitted to avoid jet streams and en-
sure full mixing of the sewer atmosphere when it is entering and exiting the 3.5‖ rubber tubes.
The experiment was performed at an average temperature of 20ºC and a wastewater depth of
0.05 m. A picture of the reorganized setup is shown in Figure 5.
Figure 5. Picture of the ventilation experiment setup.
The ventilation experiment is executed by injecting hydrogen sulfide every 20 minutes, which
results in an instantaneous increase of the hydrogen sulfide concentration to approximately 200
ppmv. This was performed at five different sewer atmosphere velocities, whilst measuring the
hydrogen sulfide concentration with Odaloggers. The five sewer atmosphere velocities used in
the experiment are shown in Table 2. The velocities were measured with a flow meter at the
outlet of the rubber tube in the opposite end of the fan blower (Windmaster 2, Kaindl electronic,
Germany). The measurements were converted to velocities in the concrete reactor before being
displayed in Table 2. The optimal determination of the sewer atmosphere velocity would be a
measurement inside the concrete reactor with the recirculation system fully closed. This was not
possible due to limitations of the flow meter, regarding low velocities, but the conversion con-
firmed by a measurement at maximum velocity.
Table 2. Sewer atmosphere velocities investigated during ventilation experiments.
No. Velocity [m s-1]
1 0.1
2 0.5
3 0.7
4 1.1
5 1.9

12 Description of the hydrogen sulfide induced corrosion of concrete sewer systems - a new approach
In order to achieve steady state in the reactor, it has been running for 50 days before starting the
experiment, which ensures that a corroded matrix is established. Furthermore, the experiments
were executed in one day.
Calculations During the experiments, the hydrogen sulfide concentration is measured in order to document
the removal. The data is used to calculate a removal rate of hydrogen sulfide.
When calculating the total removal, it is divided into two processes, the atmosphere–concrete
wall mass transfer and the atmosphere–wastewater mass transfer. According to Vollertsen et. al.
[2008], the atmosphere–wastewater mass transfer is insignificant in concrete sewers due to the
high removal rate on the concrete sewer wall, thus it was neglected in the calculation of the hy-
drogen sulfide removal, which then is described by an n-order kinetics equation:
(1)
where pH2S is the partial pressure of H2S (ppmv), t is time in hours, c is the reaction constant
( ) and n is the reaction order (-).
The removal of hydrogen sulfide is described as rate of hydrogen sulfide absorption dependent
of the time:
(2)
where f is the surface-specific hydrogen sulfide absorption rate (mg S m-2 h-1), V is the volume
of the sewer atmosphere (m3), A is the pipe wall area exposed to the gas phase (m2), P is the
pressure (atm), R is the gas constant (m3 atm K-1 mol-1), T is the temperature (K), and Mw is the
molar weight of sulfur (g mol-1).
The hydrogen sulfide removal described in Equation 2 is used to describe the potential corro-
sion by converting it into a corrosion rate, rcorr [USEPA, 1974].
(3)
where rcorr is the corrosion rate of the concrete surface (g m-2 h-1), f is the hydrogen sulfide ab-
sorption rate on the concrete wall and A is the alkalinity of the concrete in units of CaCO3. The
corrosion rate describes the ratio between H2S-S and CaCO3, which potentially could react in a
ratio of respectively 32 grams and 100 grams.

13 Description of the hydrogen sulfide induced corrosion of concrete sewer systems - a new approach
The equation can be reformed by dividing with the density of concrete, ρconcrete = 2.4 * 106 g m-
3; the corrosion rate is transformed to corrosion depth per time:
(4)
where cpotential is the corrosion depth [mm y-1]. The equation describes the corrosion depth in
relation to a total oxidation of all hydrogen sulfide to sulfuric acid and a total reaction with the
concrete. This is not the case, due to intermediates and runoff with condensed water, why the
equation is expressed:
(5)
where cactual is the actual corrosion depth [mm y-1] and k is the corrosion reduction factor (-).
The correction factor is usually between 0.3 – 0.4 under conditions where the concrete is ex-
posed to high amounts of hydrogen sulfide, but at low exposure the factor approaches 1.0.
k, the corrosion reduction factor is calculated as:
(6)
where the actual corrosion depth [mm] is the observed corrosion depth and the potential corro-
sion depth is theoretical corrosion depth based on the hydrogen sulfide load.
The actual corrosion depth must be determined, in order to determine k. the actual corrosion is
calculated as:
(7)
where mcorroded concrete is the weight loss of the concrete due to corrosion and AH2S is the area ex-
posed to hydrogen sulfide.
Results and Discussion
The hydrogen sulfide addition results in an instantaneous increase in hydrogen sulfide
concentration in the reactor. As mentioned in the method, the hydrogen sulfide is added every
hour, which is substantiated by the Odalog measurements of Figure 6.
14 Description of the hydrogen sulfide induced corrosion of concrete sewer systems - a new approach
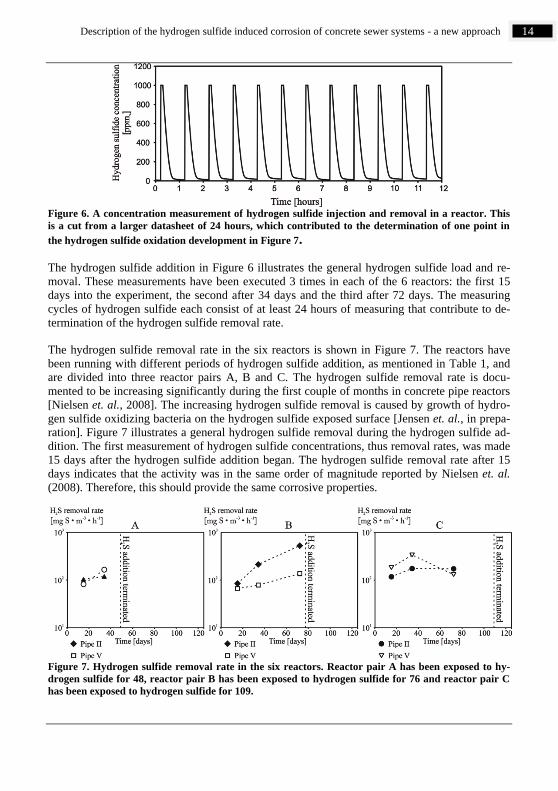
Figure 6. A concentration measurement of hydrogen sulfide injection and removal in a reactor. This
is a cut from a larger datasheet of 24 hours, which contributed to the determination of one point in
the hydrogen sulfide oxidation development in Figure 7.
The hydrogen sulfide addition in Figure 6 illustrates the general hydrogen sulfide load and re-
moval. These measurements have been executed 3 times in each of the 6 reactors: the first 15
days into the experiment, the second after 34 days and the third after 72 days. The measuring
cycles of hydrogen sulfide each consist of at least 24 hours of measuring that contribute to de-
termination of the hydrogen sulfide removal rate.
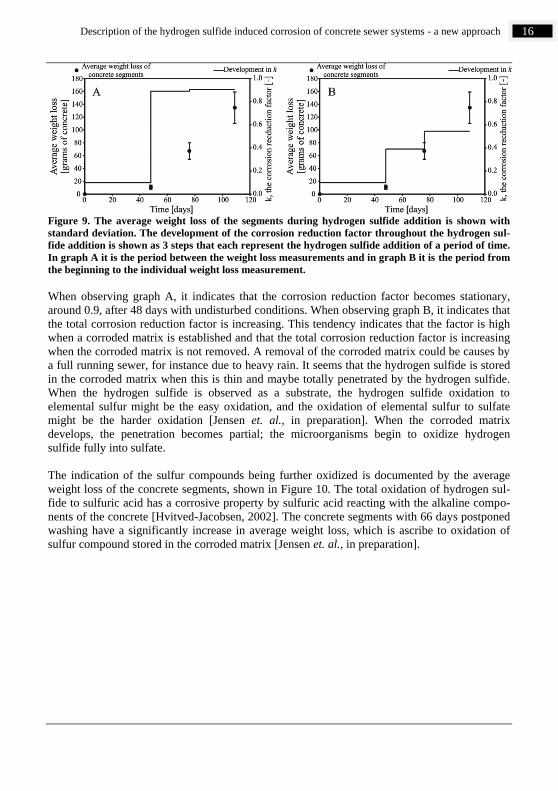
The hydrogen sulfide removal rate in the six reactors is shown in Figure 7. The reactors have
been running with different periods of hydrogen sulfide addition, as mentioned in Table 1, and
are divided into three reactor pairs A, B and C. The hydrogen sulfide removal rate is docu-
mented to be increasing significantly during the first couple of months in concrete pipe reactors
[Nielsen et. al., 2008]. The increasing hydrogen sulfide removal is caused by growth of hydro-
gen sulfide oxidizing bacteria on the hydrogen sulfide exposed surface [Jensen et. al., in prepa-
ration]. Figure 7 illustrates a general hydrogen sulfide removal during the hydrogen sulfide ad-
dition. The first measurement of hydrogen sulfide concentrations, thus removal rates, was made
15 days after the hydrogen sulfide addition began. The hydrogen sulfide removal rate after 15
days indicates that the activity was in the same order of magnitude reported by Nielsen et. al.
(2008). Therefore, this should provide the same corrosive properties.
Figure 7. Hydrogen sulfide removal rate in the six reactors. Reactor pair A has been exposed to hy-
drogen sulfide for 48, reactor pair B has been exposed to hydrogen sulfide for 76 and reactor pair C
has been exposed to hydrogen sulfide for 109.

15 Description of the hydrogen sulfide induced corrosion of concrete sewer systems - a new approach
The corrosion of the reactor pipes was visible at the point of washing, although not as much at
the first washing step as later. The washing resulted in aggregates and gypsum to fall off, but
before the washing, the concrete segments were visually inspected. The inspection revealed a
significant difference between the concrete segments that was washed immediately after the
termination of hydrogen sulfide addition and the segments with 66 days postponed washing.
The segments washed immediately after the termination of hydrogen sulfide addition had small
yellow grains, which is often seen in corroded concrete and is assumed to be deposits of ele-
mental sulfur [Parker, 1945; Islander et. al., 1991]. The concrete segments with 66 days post-
poned washing had significantly less yellow grains, which indicate a further oxidation of the
sulfur compounds [Jensen et. al., in preparation].
Figure 8. The hydrogen sulfide causes the concrete to corrode and swell up as white gypsum, as
shown in the left picture. The washing of the concrete segments causes aggregates and gypsum to fall
off.
The reactor segments was, as previously mentioned, washed in two stages to create a post
exposure corrosion. The first washing of each reactor is shown in Figure 9. The average weight
loss of the segments during hydrogen sulfide addition is shown with standard deviation.
Simultaneously, as three steps, the development of the corrosion reduction factor is illustrated.
In graph A, each of the 3 steps represents the corrosion reduction factor of the added hydrogen
sulfide respective to each of the 3 periods. This means that the first step is calculated with basis
in the first 48 days of hydrogen sulfide addition, the second step with basis in the next 28 days
and third with basis in the last 33 days. In graph B, each of the 3 steps represents the corrosion
reduction factor of the total amount of added hydrogen sulfide respective to each of the 3
periods. This means that the first step is calculated with basis in the first 48 days of hydrogen
sulfide addition, the second step with basis in 76 days of hydrogen sulfide addition and third
with basis in 109 days of hydrogen sulfide addition.
16 Description of the hydrogen sulfide induced corrosion of concrete sewer systems - a new approach
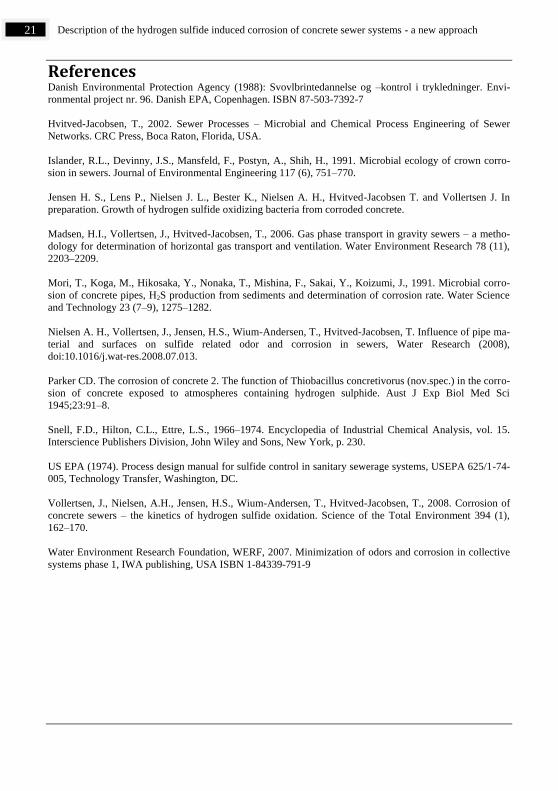
Figure 9. The average weight loss of the segments during hydrogen sulfide addition is shown with
standard deviation. The development of the corrosion reduction factor throughout the hydrogen sul-
fide addition is shown as 3 steps that each represent the hydrogen sulfide addition of a period of time.
In graph A it is the period between the weight loss measurements and in graph B it is the period from
the beginning to the individual weight loss measurement.
When observing graph A, it indicates that the corrosion reduction factor becomes stationary,
around 0.9, after 48 days with undisturbed conditions. When observing graph B, it indicates that
the total corrosion reduction factor is increasing. This tendency indicates that the factor is high
when a corroded matrix is established and that the total corrosion reduction factor is increasing
when the corroded matrix is not removed. A removal of the corroded matrix could be causes by
a full running sewer, for instance due to heavy rain. It seems that the hydrogen sulfide is stored
in the corroded matrix when this is thin and maybe totally penetrated by the hydrogen sulfide.
When the hydrogen sulfide is observed as a substrate, the hydrogen sulfide oxidation to
elemental sulfur might be the easy oxidation, and the oxidation of elemental sulfur to sulfate
might be the harder oxidation [Jensen et. al., in preparation]. When the corroded matrix
develops, the penetration becomes partial; the microorganisms begin to oxidize hydrogen
sulfide fully into sulfate.
The indication of the sulfur compounds being further oxidized is documented by the average
weight loss of the concrete segments, shown in Figure 10. The total oxidation of hydrogen sul-
fide to sulfuric acid has a corrosive property by sulfuric acid reacting with the alkaline compo-
nents of the concrete [Hvitved-Jacobsen, 2002]. The concrete segments with 66 days postponed
washing have a significantly increase in average weight loss, which is ascribe to oxidation of
sulfur compound stored in the corroded matrix [Jensen et. al., in preparation].

17 Description of the hydrogen sulfide induced corrosion of concrete sewer systems - a new approach
Figure 10. The average weight loss of the concrete segments with immediately and 66 days postponed
washing.
Figure 10 shows significant differences in weight loss between immediate and postponed wash-
ing. This indicates more total oxidation of hydrogen sulfide, and therefore, more sulfuric acid
that reacts with the alkaline components of the concrete, when the washing is postponed. As
mentioned in Table 1, each reactor has been exposed to hydrogen sulfide for different periods.
This might have an influence on the corrosion, as the activity is low in the startup phase of the
reactors and increases due to development of the hydrogen sulfide oxidizing matrix on the sew-
er wall. The average weight loss of the concrete segments, when they are exposed to hydrogen
sulfide, has a tendency of linearity with a lag phase in the start period.
The development in the average weight loss in Figure 10 indicates a significant further oxida-
tion of the added hydrogen sulfide in the postponed washing segments. This tendency is also
illustrated by the corrosion depths of Table 3. The corrosion depth of the immediately washed
concrete segments, that has been exposed in 48 days, is significantly less than the corrosion
depth of the 66 days postponed washing concrete segments. This is also indicated by the ratio
between immediately and postponed washed segments.
Table 3. The hydrogen sulfide induced corrosion depths
Days of hydro-
gen sulfide ad-
dition
Corrosion depth of the
hydrogen sulfide exposed
area of the reactor [mm]
Ratio
[Immediately
/ Postponed]
Immediately
washed
66 days
postponed
48 0.078 0.341 4.37
79 0.484 0.700 1.44
109 0.970 1.736 1.78

18 Description of the hydrogen sulfide induced corrosion of concrete sewer systems - a new approach
The concrete segments that have been exposed to hydrogen sulfide for 48 days have a much
higher ratio between immediately and postponed washing than the ones that has been exposed
for 79 and 109 days. This indicates that a large percentage of the added hydrogen sulfide is ac-
cumulated as elemental sulfur when the corroded matrix just has been removed. Furthermore, it
indicates that when the corroded matrix has been left undisturbed for a longer period of time,
the ratio between immediately oxidized and accumulated hydrogen sulfide decreases. This indi-
cates that the hydrogen sulfide oxidizing microorganisms produce larger amounts of elemental
sulfur in the development of in the corroded matrix than when a certain amount of biomass in
the matrix is established. This might be caused by the diffusion boundary into the corroded con-
crete matrix on the sewer wall, which is created by the increasing oxidation capability of the
biomass. The diffusion boundary might be forcing the microorganisms located deep inside the
matrix to oxidize the elemental sulfur in greater extent than when all the microorganisms are
exposed to high amount of hydrogen sulfide. Another way of describing this is that the microbi-
al activity increases, and at some point, it is so high that the microorganisms is in a state of star-
vation and degrade all accessible hydrogen sulfide.
In order to assess the effect of the hydrogen sulfide in the reactors, the efficiency of the added
hydrogen sulfide to each reactor is calculated, which is expressed as an observed corrosion re-
duction factor, k-factor, shown in Figure 11. The observed corrosion reduction factors in Figure
11 are calculated on basis of the total amount of hydrogen sulfide added to the reactor.
Figure 11. The corrosion reduction factors of the 3 reactor pairs are shown. The columns illustrate
the actual corrosion of the pipe segments as a fraction of the potential corrosion that the amount of
hydrogen sulfide could cause.
The tendency of Figure 11, where the actual corrosion of the 3 reactor pairs is shown as a ratio
of the potential corrosion cause by the added amount of hydrogen sulfide, is a significant corro-
sion efficiency of postponed washed segments. This is illustrated by a significant increase in the
corrosion reduction factor. The corrosion reduction factor is nearly 1 after postponed washing in
reactor pair C, which indicates that the actual corrosion is nearly 100% of the potential corro-
sion. In this case, the post exposure is responsible of 44% of the corrosion. The corrosion reduc-
tion factor varies from 10% to 98% in efficiency throughout the experiment, which indicates
that different parameters affect the corrosion efficiency strongly. The experiments and the lite-

19 Description of the hydrogen sulfide induced corrosion of concrete sewer systems - a new approach
rature indicate that the three significant parameters are the growth and establishment of hydro-
gen sulfide oxidizing matrix, the hydrogen sulfide load, and post exposure periods.
These parameters should be considered and a corrosion equation should be expressed, but the
amount of parameters would complicate this too much. This could only be executed a full mod-
eling of the sewers. Even so the parameter can be used separately in order to enable a wise
choice of corrosion reduction factor.
The second reactor setup was, as mentioned, used to perform a ventilation experiment. The ven-
tilation experiment was performed at 5 sewer atmosphere velocities and in an interval of 0 – 200
ppmv of hydrogen sulfide. This is represented by the hydrogen sulfide removal rate at 10 ppmv
with the velocity as a variable, Figure 12.
Figure 12. The influence of sewer atmosphere velocity on the hydrogen sulfide removal rate at 10
ppmv
The relation between the hydrogen sulfide removal rate and the sewer atmosphere velocity in
Figure 12 indicates that the absorption of hydrogen sulfide into the corroded matrix is depen-
dent on the sewer atmosphere velocity. It is not linearly dependent, but has a tendency of going
towards a maximum oxidation rate as the velocity increases. It could be an n-order dependency,
with n < 1, in this and then a max as when velocity goes towards ∞. When the velocity depen-
dency is considered, the corrosion of the sewer could be distributed to either a small section of a
sewer or to a much bigger part of the sewer by ventilating the sewer at a high velocity, which is
due to the non linear dependency of velocity.

20 Description of the hydrogen sulfide induced corrosion of concrete sewer systems - a new approach
Conclusion The investigation of the relation between actual and potential corrosion, by hydrogen sulfide
oxidation in concrete sewer, indicates a significant loss of corrosion potential when the corroded
matrix is largely removed. The corrosion was reduced to 10% of the potential in a period of 48
days after the corroded matrix was largely removed. When the matrix was established again, it
results in a much higher corrosion reduction factor, thus an actual corrosion of approximately
90% of the potential corrosion. The experiment showed that the actual corrosion remained at
90% when the corroded matrix was undisturbed. This knowledge could be implemented as a
corrosion prevention method, as it indicates that the intermediates from hydrogen sulfide oxida-
tion are stored in the corroded matrix, for a period of time and could be washed off.
The consequences of hydrogen sulfide oxidation were studied, with the post exposure corrosion
as one of the main objectives. The results of the experiments indicate that the post exposure has
a significant influence on the total corrosion of concrete sewers. The original assumption that
the hydrogen sulfide, that did not react with the concrete, ran off the sewer walls, is very uncer-
tain according to these results. The actual corrosion was nearly 100% of the total potential cor-
rosion after 109 days of hydrogen sulfide exposure and 66 days post exposure. In this case, the
post exposure was responsible of 44% of the corrosion.
This is the first time the corrosion reduction factor, k-factor, actually has been determined and
documented. The general perspective is that the k-factor is low, k ≈ 0.1, in a period of 1-2
months after the corroded matrix is largely removed, thus the corrosion is insignificant despite a
large potential. The k-factor is increasing linearly after 1-2 months and becomes more and more
significant. Furthermore, it is indicated that a post exposure period of 2 months enables a very
high k-factor, k > 0.9. This indicates a significant corrosion potential of concrete sewer when
the corroded matrix is undisturbed.
The dependency of sewer atmosphere velocity in relation to the hydrogen sulfide removal rate is
relevant, in order to predict where the hydrogen sulfide oxidation is occurring. In addition, it is
relevant in relation to modeling the hydrogen sulfide oxidation in sewers. The results of the ex-
periment indicate that the hydrogen sulfide removal on the corroded sewer surface is velocity
dependent and that it is increasing towards a maximum hydrogen sulfide removal rate at high
velocities. It is the first time that a sewer atmosphere velocity dependency of the hydrogen sul-
fide removal rate has been determined and it seems to be a significant parameter in the descrip-
tion of the hydrogen sulfide removal rate. The hydrogen sulfide removal rate dependency of
sewer atmosphere velocity was investigated in a velocity interval of 0.1 – 2 [m ∙ s-1] and the hy-
drogen sulfide removal rate increased 260% within this interval.
21 Description of the hydrogen sulfide induced corrosion of concrete sewer systems - a new approach
References Danish Environmental Protection Agency (1988): Svovlbrintedannelse og –kontrol i trykledninger. Envi-
ronmental project nr. 96. Danish EPA, Copenhagen. ISBN 87-503-7392-7
Hvitved-Jacobsen, T., 2002. Sewer Processes – Microbial and Chemical Process Engineering of Sewer
Networks. CRC Press, Boca Raton, Florida, USA.
Islander, R.L., Devinny, J.S., Mansfeld, F., Postyn, A., Shih, H., 1991. Microbial ecology of crown corro-
sion in sewers. Journal of Environmental Engineering 117 (6), 751–770.
Jensen H. S., Lens P., Nielsen J. L., Bester K., Nielsen A. H., Hvitved-Jacobsen T. and Vollertsen J. In
preparation. Growth of hydrogen sulfide oxidizing bacteria from corroded concrete.
Madsen, H.I., Vollertsen, J., Hvitved-Jacobsen, T., 2006. Gas phase transport in gravity sewers – a metho-
dology for determination of horizontal gas transport and ventilation. Water Environment Research 78 (11),
2203–2209.
Mori, T., Koga, M., Hikosaka, Y., Nonaka, T., Mishina, F., Sakai, Y., Koizumi, J., 1991. Microbial corro-
sion of concrete pipes, H2S production from sediments and determination of corrosion rate. Water Science
and Technology 23 (7–9), 1275–1282.
Nielsen A. H., Vollertsen, J., Jensen, H.S., Wium-Andersen, T., Hvitved-Jacobsen, T. Influence of pipe ma-
terial and surfaces on sulfide related odor and corrosion in sewers, Water Research (2008),
doi:10.1016/j.wat-res.2008.07.013.
Parker CD. The corrosion of concrete 2. The function of Thiobacillus concretivorus (nov.spec.) in the corro-
sion of concrete exposed to atmospheres containing hydrogen sulphide. Aust J Exp Biol Med Sci
1945;23:91–8.
Snell, F.D., Hilton, C.L., Ettre, L.S., 1966–1974. Encyclopedia of Industrial Chemical Analysis, vol. 15.
Interscience Publishers Division, John Wiley and Sons, New York, p. 230.
US EPA (1974). Process design manual for sulfide control in sanitary sewerage systems, USEPA 625/1-74-
005, Technology Transfer, Washington, DC.
Vollertsen, J., Nielsen, A.H., Jensen, H.S., Wium-Andersen, T., Hvitved-Jacobsen, T., 2008. Corrosion of
concrete sewers – the kinetics of hydrogen sulfide oxidation. Science of the Total Environment 394 (1),
162–170.
Water Environment Research Foundation, WERF, 2007. Minimization of odors and corrosion in collective
systems phase 1, IWA publishing, USA ISBN 1-84339-791-9
22 Hydrogen sulfide uptake rates and biomass concentration of microorganisms from corroded concrete
Hydrogen sulfide uptake rates and biomass concen-tration of microorganisms from corroded concrete
Abstract
Hydrogen sulfide oxidation in sewer systems was investigated in a bench scale bioreactor, with
corroded concrete in suspension. The hydrogen sulfide concentration and the oxygen
concentration were measured continuously during the run of the bioreactor. Samples for protein
analysis were taken throughout the experiments. The results of these experiments indicate a
variation in activity between different hydrogen sulfide oxidizing microorganisms. As an
attempt to achieve a monoculture of the most active hydrogen sulfide oxidizing
microorganisms, the reactor experiment was started by inoculating from a running reactor. This
resulted in a better relation between hydrogen sulfide removal rates and protein concentration,
as the bacterial diversity approached a culture of Acidithiobacillus.
As a sub study, the kinetics of methyl mercaptane oxidation in sewer systems was investigated
in the same bioreactor. The results of the methyl mercaptane oxidation showed that the diversity
of microorganisms in corroded concrete enabled oxidation of methyl mercaptane. Furthermore,
the results indicate that the culture of Acidithiobacillus that were achieved by inoculation, were
unable to oxidize methyl mercaptane.
Introduction Hydrogen sulfide causes many problems in sewer systems. These problems have origin in
sulfide formation. Sulfide is primarily formed by sulfate respiration where heterotrophic
anaerobic bacteria oxidize organic compounds with sulfate as terminal electron donor.
Carbohydrates, amino acids and alcohols are good substrates for sulfur-reducing bacteria
[Tanaka and Hvitved-Jacobsen, 2001; Nielsen et. al., 1998]. Apart from sulfate, other sulfur
compounds like thiosulfate, sulfite and elemental sulfur are available to be reduced to sulfide
[Tchobanoglous, 1981]. The term ―hydrogen sulfide‖ describes the substance in the gas phase
H2S(g) and dissolved phase H2S(aq), whereas sulfide describes sulfide ions in the liquid phase, all
shown in Equation 8. The equation illustrates the relationship of hydrogen sulfide in gas phase
and aqueous dissolved phase, which can be expressed by Henry's Law. Furthermore, it describes
the distribution of aqueous dissolved sulfide that is evenly distributed between H2S and HS- at
pH 7. S2- is only found in measurable quantities at pH above 12 [Hvitved-Jacobsen, 2002].
Equation 8. The equilibrium equation between sulfide and hydrogen sulfide gas.
Water-air transfer pKa1=7.0 pKa2=14
2
)aq(2)g(2 SHSSHSH
Hydrogen sulfide is problematic in several ways because it has an unpleasant smell, even at low
concentrations, which can be annoying for residents in the vicinity of a pressure pipe outlet
[Hvitved-Jacobsen, 2002]. Higher concentrations of hydrogen sulfide are toxic. Concentrations
and effects of hydrogen sulfide are shown in Table 4.

23 Hydrogen sulfide uptake rates and biomass concentration of microorganisms from corroded concrete
Table 4. Odor and health effects of hydrogen sulfide in the atmosphere, recording to U.S. National
Research Council, 1979 and ASCE, 1989.
Effect Concentration in the
atmosphere [ppmv]
Limit for odor detection 0.0001-0.0002
Unpleasant smell 0.5-30
Headache, nausea and also eye,
nose and throat irritations 10-50
Inactivation of the sense of smell ≈50
Serious eye and respiration
problems 50-300
Life threatening 300-500
Instant death >700
Furthermore, hydrogen sulfide is a compound with corrosive properties when it is oxidized and
converted to sulfuric acid [Hvitved-Jacobsen, 2002]. This happens through the oxidation of
emitted hydrogen sulfide on the sewer wall, where it is absorbed in the humid film on the
concrete wall, and oxidized either chemically or biologically by aerobic autotrophic bacteria to
sulfuric acid [Vincke et. al., 2000]. Sulfuric acid is neutralized by the concrete alkalinity, which
degrades the concrete surface to gypsum, whereby the concrete loses its physical strength
[Hvitved-Jacobsen, 2002; Parker, 1945]. A simple stoichiometric example of concrete corrosion
is shown below.
Equation 9. Simplified concrete corrosion [Hvitved-Jacobsen, 2002].
422342 CaSOCOOHCaCOSOH
Usually, the worst corroded areas are just above the water level and at the sewer crown [Danish
Environmental Protection Agency, 1988]. This might be due to the higher humidity just above
the water level and at the sewer crown, why sulfuric acid reacts easier. Hydrogen sulfide is not
the only compound produced under anaerobic conditions that causes problems in the sewers.
There are many compounds with vast odorous complications; one is methyl mercaptane, an
organic sulfur compound, which is produced under anaerobic conditions in the sewer. Methyl
mercaptane is sometimes observed in higher concentrations than hydrogen sulfide [Hwang, Y,
1995]. The growth parameters of hydrogen sulfide oxidizing microorganisms are relevant in
order to describe the corrosion of sewers in further detail. This study will contribute to a better
understanding of the hydrogen sulfide oxidation kinetics, which is a one of the controlling
parameters in modeling concrete sewer corrosion [Article 1], thus this study will contribute to a
better prediction of concrete sewer corrosion.
The growth characteristics of hydrogen sulfide oxidizing microorganisms from corroded
concrete, with the hydrogen sulfide uptake rate as growth parameter, were determined in Jensen
et. al. [In preparation], but that study does not relate the growth activity to the actual biomass
concentration. The objective of the present study is to investigate the relationship between the
biomass and the hydrogen sulfide uptake rate with protein analysis throughout a growth
experiment. As an addendum, a sub-study of methyl mercaptane oxidation is performed. This
has an objective of investigating the oxidation of other odorous sulfur compounds by hydrogen
sulfide oxidizing microorganisms from corroded sewer concrete.
24 Hydrogen sulfide uptake rates and biomass concentration of microorganisms from corroded concrete
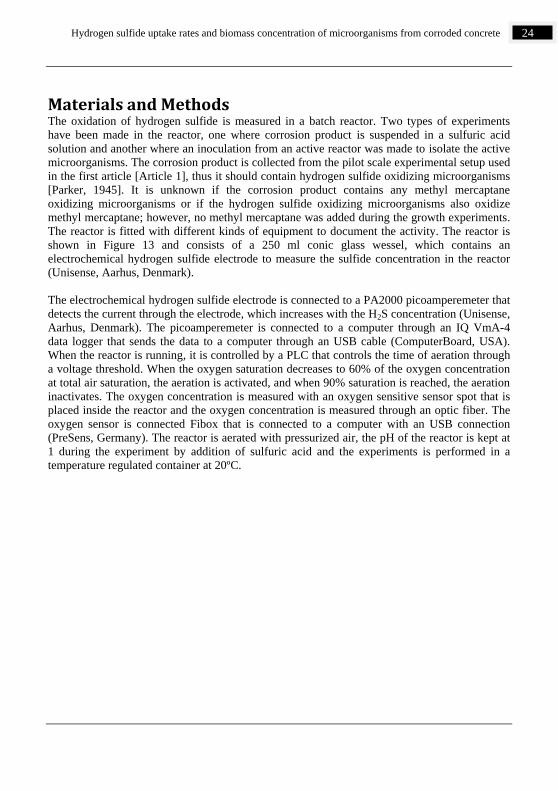
Materials and Methods The oxidation of hydrogen sulfide is measured in a batch reactor. Two types of experiments
have been made in the reactor, one where corrosion product is suspended in a sulfuric acid
solution and another where an inoculation from an active reactor was made to isolate the active
microorganisms. The corrosion product is collected from the pilot scale experimental setup used
in the first article [Article 1], thus it should contain hydrogen sulfide oxidizing microorganisms
[Parker, 1945]. It is unknown if the corrosion product contains any methyl mercaptane
oxidizing microorganisms or if the hydrogen sulfide oxidizing microorganisms also oxidize
methyl mercaptane; however, no methyl mercaptane was added during the growth experiments.
The reactor is fitted with different kinds of equipment to document the activity. The reactor is
shown in Figure 13 and consists of a 250 ml conic glass wessel, which contains an
electrochemical hydrogen sulfide electrode to measure the sulfide concentration in the reactor
(Unisense, Aarhus, Denmark).
The electrochemical hydrogen sulfide electrode is connected to a PA2000 picoamperemeter that
detects the current through the electrode, which increases with the H2S concentration (Unisense,
Aarhus, Denmark). The picoamperemeter is connected to a computer through an IQ VmA-4
data logger that sends the data to a computer through an USB cable (ComputerBoard, USA).
When the reactor is running, it is controlled by a PLC that controls the time of aeration through
a voltage threshold. When the oxygen saturation decreases to 60% of the oxygen concentration
at total air saturation, the aeration is activated, and when 90% saturation is reached, the aeration
inactivates. The oxygen concentration is measured with an oxygen sensitive sensor spot that is
placed inside the reactor and the oxygen concentration is measured through an optic fiber. The
oxygen sensor is connected Fibox that is connected to a computer with an USB connection
(PreSens, Germany). The reactor is aerated with pressurized air, the pH of the reactor is kept at
1 during the experiment by addition of sulfuric acid and the experiments is performed in a
temperature regulated container at 20ºC.
25 Hydrogen sulfide uptake rates and biomass concentration of microorganisms from corroded concrete
Figure 13. Reactor setup for the hydrogen sulfide oxidation experiment with different equipment fit-
ted in a 250 ml glass wessel.
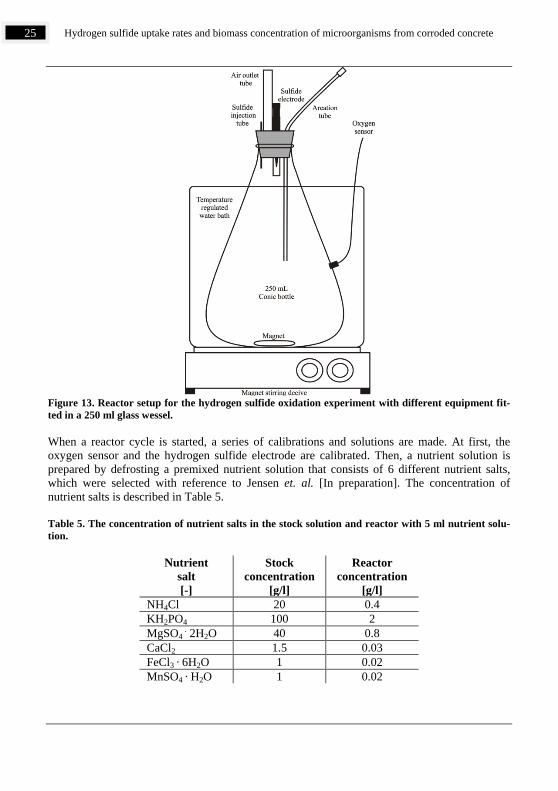
When a reactor cycle is started, a series of calibrations and solutions are made. At first, the
oxygen sensor and the hydrogen sulfide electrode are calibrated. Then, a nutrient solution is
prepared by defrosting a premixed nutrient solution that consists of 6 different nutrient salts,
which were selected with reference to Jensen et. al. [In preparation]. The concentration of
nutrient salts is described in Table 5.
Table 5. The concentration of nutrient salts in the stock solution and reactor with 5 ml nutrient solu-
tion.
Nutrient
salt
[-]
Stock
concentration
[g/l]
Reactor
concentration
[g/l]
NH4Cl 20 0.4
KH2PO4 100 2
MgSO4 . 2H2O 40 0.8
CaCl2 1.5 0.03
FeCl3 · 6H2O 1 0.02
MnSO4 · H2O 1 0.02

26 Hydrogen sulfide uptake rates and biomass concentration of microorganisms from corroded concrete
The nutrient salts were used in other similar projects and selected with consideration of
microbial growth [Jensen et. al., in preparation]. In order to grow, the hydrogen sulfide
oxidizing microorganisms need an electron donor. In this case, sulfide is used and it is added as
disodium sulfide in a water solution, which is an alkaline solution, pH > 12. The sodium sulfide
solution contains approximately 1% w/v sodium sulfide and when this alkaline solution is
injected into the reactor that has pH of 1, a new pH equilibrium is reached. However, due to the
strong acidity of the reactor, the pH of 1 is maintained. The low pH makes hydrogen sulfide
available for the hydrogen sulfide oxidizing microorganisms, Equation 8. The hydrogen sulfide
is added after aeration of the reactor using a peristaltic pump, where approximately 2 ml of the
solution is added.
Consumption of oxygen is primarily caused by hydrogen sulfide oxidation. Consequently, both
oxygen and hydrogen sulfide concentrations are measured throughout the experiment with an
interval of 15 seconds. The hydrogen sulfide oxidation has different reaction pathways [Brüser
et. al., 2000]. The hydrogen sulfide oxidation to elemental sulfur, the further oxidation of
elemental sulfur to sulfate and the direct oxidation of hydrogen sulfide to sulfate are described
in Table 6. Sulfur has different oxidation stages in these reaction pathways, and when the
hydrogen sulfide is fully oxidized to sulfate, the O2/S ratio is 2.
Table 6. Different oxidation pathways of hydrogen sulfide, and the appertaining ratio between oxygen
and hydrogen sulfide.
Reaction
[mol/mol]
0.5
1.5
2
In order to describe the uptake of hydrogen sulfide performed by microorganisms, the abiotic
hydrogen sulfide removal processes are determined. These processes are the diffusion out of the
reactor and chemical hydrogen sulfide oxidation, which is subtracted from the total oxidation of
hydrogen sulfide. Furthermore, the reoxygenation of the reactor is determined and is added to
the oxygen uptake rate. The determination of these parameters is done in two different
experiments. First, a continuous measurement of reoxygenation in the reactor, and then, a linear
regression of the data in the interval used in the reactor experiments, which is 60 - 90% of the
oxygen concentration at total air saturation. Second, a continuous measurement of hydrogen
sulfide being removed from the reactor, followed by a linear regression of the data in the
interval used in the reactor experiments, which is 0 – 0.5 mg S / l. The regression results are
shown in Table 7.
Table 7. The chemical oxidation and diffusion of sulfide as hydrogen sulfide removal rate and the
reoxygenation rate.
Sulfide 0.2 mg S / hour
Oxygen 0.05 mg O2 / hour
As mentioned, Table 7 contains two parameters, the abiotic hydrogen sulfide removal rate and
the reoxygenation rate. The abiotic sulfide rate is represented by the sum of sulfide diffusion
from the wessel as hydrogen sulfide and the chemically oxidized sulfide. The reoxygenation and
27 Hydrogen sulfide uptake rates and biomass concentration of microorganisms from corroded concrete
the diffusion of hydrogen sulfide happen through the leaks of the reactor, which mainly is the
air outlet tube, shown in Figure 13. These parameters are implemented in all the measurements
before they are presented.
During the experiments, 5 ml samples were taken out for protein analysis. These were frozen
and analyzed at the same time with BiCinchoninic Acid (BCA) assay. The assay is a Micro
BCA Protein Assay that combines the well-known reduction of Cu2+ to Cu1+ by protein in an
alkaline medium with the highly sensitive and selective colorimetric detection of the cuprous
cation (Cu1+) by BCA [Pierce Protein Research Products, 2008]. The samples are acidic at the
point of defrosting and the pH is adjusted to approximately 9 with sodium hydroxide, in order to
make the reduction of cobber possible.
The experiments are divided into 2 different types, depending on how they are started. The first
with 14 grams corroded concrete added to the reactor, as an experiment start. The second is
started with 5 ml of reactor fluid from a reactor that is running, as an inoculation. This is
performed in order to reach monoculture that should give a better correlation between activity
and biomass concentration. The corroded concrete contains a variety of microorganisms
[Okabe, 2007]. This can have influence on the ratio between hydrogen sulfide oxidation and the
biomass, due to variation in the activity. Furthermore, at the end of 3 experiments, Table 8,
methyl mercaptane is added to observe the microorganisms’, grown on hydrogen sulfide, ability
to oxidize methyl mercaptane.
The oxidation of methyl mercaptane may be done by microorganisms represented in the
corroded concrete, which also contains hydrogen sulfide oxidizing microorganisms. The sodium
methyl mercaptane solution contains 0.5% methyl mercaptane. The methyl mercaptane is also
available for the microorganisms upon injection due to pH change.
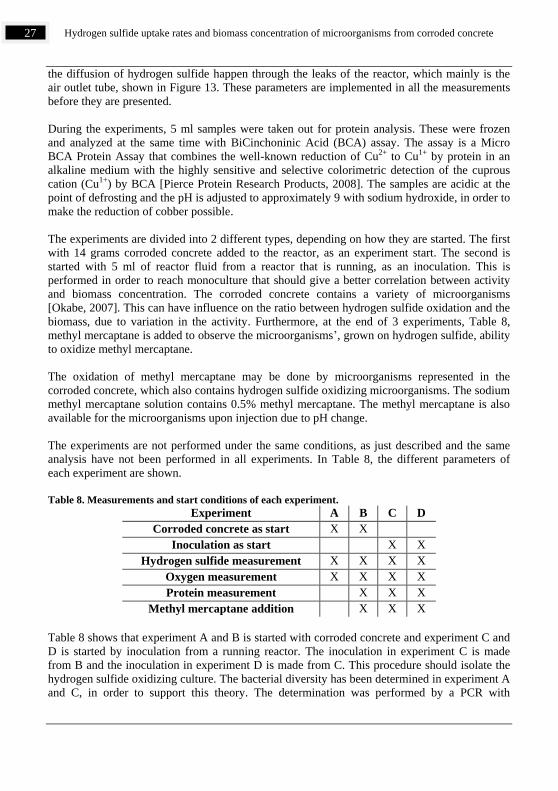
The experiments are not performed under the same conditions, as just described and the same
analysis have not been performed in all experiments. In Table 8, the different parameters of
each experiment are shown.
Table 8. Measurements and start conditions of each experiment.
Experiment A B C D
Corroded concrete as start X X
Inoculation as start X X
Hydrogen sulfide measurement X X X X
Oxygen measurement X X X X
Protein measurement X X X
Methyl mercaptane addition X X X
Table 8 shows that experiment A and B is started with corroded concrete and experiment C and
D is started by inoculation from a running reactor. The inoculation in experiment C is made
from B and the inoculation in experiment D is made from C. This procedure should isolate the
hydrogen sulfide oxidizing culture. The bacterial diversity has been determined in experiment A
and C, in order to support this theory. The determination was performed by a PCR with

28 Hydrogen sulfide uptake rates and biomass concentration of microorganisms from corroded concrete
nonspecific 16S ribosomal primers, followed by a cloning and sequencing. These sequencings
was analyzed by phylogeny and compared with available public database.
Calculations There are different calculations involved in the data analysis. The hydrogen sulfide uptake rate
(SUR) is calculated as:
(10)
where is the sulfide concentration [g S m-3] dt is time [hours] and SUR is the hydrogen
sulfide uptake rate [g S m-3 h-1].
The increase in hydrogen sulfide uptake is assumed to be caused by an increase in hydrogen
sulfide oxidizing organisms, which enables the description of SUR as a function of biomass:
(11)
where is the biomass concentration [g m-3] and is the yield constant of biomass with
respect to hydrogen sulfide [g biomass (g S)-1]
The oxygen uptake rate (OUR) is calculated as:
(12)
where is the oxygen concentration [g O2 m-3] OUR is the oxygen uptake rate [g O2 m
-3 h-1]
When the uptake rates are compared, the stoichiometric of hydrogen sulfide oxidation is
discovered as the ratio between oxygen and hydrogen sulfide:
(13)
The ratio is used to determine the variation in the reaction stoichiometry throughout the
experiment.
Results and Discussion The experiments with hydrogen sulfide oxidation are, as mentioned in the method, divided into
two different experiments with either corroded concrete or inoculation as experiment start. The
experiments differ in activity, depending on these start conditions. The oxygen concentration
throughout an experiment started with corroded concrete is shown in principal in Figure 14.

29 Hydrogen sulfide uptake rates and biomass concentration of microorganisms from corroded concrete
Figure 14. The oxygen curve describes the oxygen uptake through an experiment with corroded con-
crete as start condition in principal.
Figure 14 indicates a low activity at first, but a steady increase in oxygen uptake until the
addition of disodium sulfide stops, after which the oxygen uptake suddenly decreases. The
oxygen uptake increases again after the termination of sodium sulfide addition. When all sulfur
is oxidized into sulfate, the activity decreases to a much lower level.
The other start condition is when the experiment is started by inoculation and this result in an
oxygen uptake tendency, which is indicated in principal by Figure 15.
Figure 15. The oxygen curve describes the oxygen uptake through an experiment with inoculation as
start condition in principal.
Figure 15 indicates low oxygen uptake in the beginning, which increases until the addition of
sodium sulfide stops. The oxygen uptake decreases after termination of sodium sulfide addition.
The tendency of the hydrogen sulfide concentration is similar to the tendency oxygen. The
hydrogen sulfide concentration is zero at the time of hydrogen sulfide addition due to the
aeration of the reactor, which causes a striping of the hydrogen sulfide. It is assumed that the
hydrogen sulfide uptake continues, during the period of aeration, with the rate determined
before the aeration. This means that the hydrogen sulfide uptake rate is unaffected by stripping
hydrogen sulfide.
The two different experiments are both executed twice, which resulted in four hydrogen sulfide
removal rate curves and four oxygen uptake rate curves that all are shown in Figure 16.

30 Hydrogen sulfide uptake rates and biomass concentration of microorganisms from corroded concrete
Figure 16. The 4 hydrogen sulfide removal rate curves and 4 oxygen uptake rate curves that are cor-
responding. Furthermore, they are paired, where A and B are started with corroded concrete, and
the curves of C and D are started with inoculation.
The hydrogen sulfide removal rate has a tendency to be increasing exponentially during the dis-
odium sulfide addition in all experiments. The tendency of oxygen uptake differs between the
two different experiments with either corroded concrete or inoculation as experiment start. The
experiments with corroded concrete as start has an exponential tendency in oxygen uptake dur-
ing the hydrogen sulfide addition, and at the end of hydrogen sulfide addition, there is a sudden
drop in oxygen uptake. A build-up phase in oxygen uptake follows the sudden drop, which
could be caused by a partly oxidation of the injected sulfide, to elemental sulfur, and then a fur-
ther oxidation to sulfate, as the reaction patterns of Table 6 indicate [Jensen et. al., in prepara-
tion]. In the experiment with inoculation as experiment start, the oxygen uptake has an exponen-
tial tendency during the hydrogen sulfide addition phase. This is similar to the tendency in the
experiment with corroded concrete as an experiment start. However, there is a difference be-
cause the hydrogen sulfide uptake rate is lower than the oxygen uptake rate in experiment C and
D, which is the opposite of experiment A and B. Furthermore, the following phase has a differ-
ent tendency, where the oxygen uptake decreases to zero instead of a build-up phase. The dif-
ference of the uptake rate indicates different ratios between hydrogen sulfide and oxygen in the
different experiments. The ratio between consumed oxygen and oxidized hydrogen sulfide is
shown in Figure 17.

31 Hydrogen sulfide uptake rates and biomass concentration of microorganisms from corroded concrete
Figure 17. Ratio between oxygen and hydrogen sulfide uptake rates, which are corresponding with
the plots in Figure 16.
The oxygen-hydrogen sulfide ratios show that different amounts of oxygen are used to oxidize
hydrogen sulfide. The A and B experiments have a ratio between 0.5 and 0.9. Experiment A has
a constant ratio and the ratio in experiment B is increasing throughout the experiment. The C
and D experiments have a ratio around 1.4 with variations. Both starting low and building up to
a stable level, although the D experiment has a slight tendency to decrease in the end. The aver-
age values of the ratio between oxygen and hydrogen sulfide are shown in Table 9.
Table 9. The average oxidation values of hydrogen sulfide, with reoxygenation, hydrogen sulfide
stripping and chemical oxidation taken into account.
Oxidation plot A B C D
Reaction stoichiometry during
hydrogen sulfide addition [O2/S] 0.55 0.60 1.40 1.41
Total reaction stoichiometry
[O2/S] 1.50 1.90 2.18 2.58
The total oxidation ratio in Table 9 shows different tendencies that vary from the theoretical
total oxidation, which would result in a ratio of 2 O2/S. Experiment A and B have a tendency to
be partly oxidized, which may be caused by the production of non-biodegradable elemental

32 Hydrogen sulfide uptake rates and biomass concentration of microorganisms from corroded concrete
sulfur. The total oxidation ratio of C and D have a tendency to be fully oxidized and to use more
oxygen to oxidize the added hydrogen sulfide than actually possible, which may be caused by
inaccuracy of the hydrogen sulfide electrode that was especially unstable during experiment D.
Protein concentration The protein concentration measurements, which were performed during 3 of the experiments,
are shown together with the hydrogen sulfide and oxygen uptake rates in Figure 18.
Figure 18. Protein concentration measurements shown together with the oxygen and hydrogen sulfide
uptake rates during the experiments
The measurements of oxygen and hydrogen sulfide uptake rates and protein concentration all
have an increasing tendency, thus an exponential increasing rate is calculated for each of the
measurements. These fitted tendencies are referred to as the growth rate and the rates are dis-
played in Table 10. The growth characteristics, indicated by the protein measurements, are that
the hydrogen sulfide oxidizing microorganisms grow during the hydrogen sulfide addition.

33 Hydrogen sulfide uptake rates and biomass concentration of microorganisms from corroded concrete
Table 10. Growth rate described by oxygen uptake, hydrogen sulfide oxidation and protein concen-
tration.
Rate O2 [d-1
] H2S [d-1
] Protein [d-1
]
A 1.5 1.5
B 1.4 1.1 0.6
C 0.8 0.9 0.5
D 1.0 1.3 1.2
The growth rates of Table 10 indicate that the protein concentration does not follow the others
entirely. This might be caused by the variation of microorganisms, thus a difference in the activ-
ity. Earlier studies of biomass concentration and activity in sewage have been addressed by this
problem [Vollertsen et. al., 2000]. The complications should be less significant in a monocul-
ture, thus the inoculation. The experiments of Figure 18 are steps of inoculation, and Figure 19
shows the development in ratio between the oxygen growth rate and the protein growth rate, and
hydrogen sulfide growth rate and the protein growth rate.
Figure 19. The ratio between protein and oxygen growth rates, and protein and hydrogen sulfide
growth rates, through the inoculation steps.
The growth rate ratios of Figure 19 indicate an increasing proportionality between growth rates,
calculated from protein measurements and both the hydrogen sulfide and oxygen uptake rates,
when the inoculation is performed to isolates the active microorganisms. Although the first

34 Hydrogen sulfide uptake rates and biomass concentration of microorganisms from corroded concrete
inoculation indicates a drop in ratio, regarding hydrogen sulfide, Figure 19. This drop could be
caused by the measurements of protein concentration being inadequate in the growth stage of
experiment C, Figure 18. The tendency in protein concentration of experiment D, Figure 18,
which is the second inoculation, is very similar to the tendency of the oxygen and hydrogen
sulfide uptake rates. This is further supported by growth rate ratios in Figure 19, which shows
that the growth rate calculated from the protein concentrations is higher than the one calculated
from the oxygen uptake rate. The growth rate ratio between protein and hydrogen sulfide at the
second inoculation shows that they are very similar. When observing Figure 18, with the protein
concentration measurements, a fast decrease in protein concentration is observed, shortly after
the termination of hydrogen sulfide addition. This could be caused by a high decay rate of the
microorganisms due to the extreme conditions of their environment. The decreasing protein
concentration could furthermore be caused by a reorganization of the intercellular protein as a
preparation to a hibernation mode, due to the lack of hydrogen sulfide. In order to describe such
parameters, a further investigation, with more advanced molecular microbiology, is needed.
The used of more advanced molecular microbiology has begun. The bacterial diversity, at the
point of hydrogen sulfide addition termination in experiment A and C, has been determined.
The sample from experiment A had a broad diversity of bacteria and the sample from
experiment C showed two bacteria; Acidithiobacillus thiooxidans and Acidithiobacillus
ferrooxidans, which are closely related. The bacterial diversity of the samples is shown in
Figure 20 in a phylogenetic tree. The phylogenetic tree consists of the bacteria found in the 2
samples, the bacteria found by Okabe et. al. (2007) and the bacteria found by Vincke et. al.
(2001), who both have performed similar studies.
The bacterial diversity of the phylogenetic tree in Figure 20, shows that the reactor experiment
A, started with corroded concrete, has a higher diversity of organisms than reactor experiment C
that has been started by inoculation. Furthermore the general bacterial diversity is similar to the
one of Okabe et. al. (2007) and Vincke et. al. (2001).

35 Hydrogen sulfide uptake rates and biomass concentration of microorganisms from corroded concrete
Figure 20. Phylogenetic tree of the bacterial diversity in experiment A and C, supported by the diver-
sity found by Okabe et. al. (2007) and Vincke et. al. (2001) in similar experiments.

36 Hydrogen sulfide uptake rates and biomass concentration of microorganisms from corroded concrete
The phylogenetic tree shows that there are large genetic differences of the microorganisms in
the sample from experiment A, compared to the sample from experiment C. This is illustrated
by length of the lines of the phylogenetic tree. Two bacteria far from each other have less in
common genetically than two bacteria close two each other. The bacteria from experiment A
has a diversity similar to the one determined by Okabe et. al. (2007). This indicates a general
bacterial diversity in corroded concrete. The close related bacterial diversity of experiment C is
also found to be active in the oxidation of hydrogen sulfide by Vincke et. al. (2001).
The results of experiment with biomass dependency of the hydrogen sulfide uptake rate
combined with the results of the bacterial diversity determination indicates that the biomass
concentration can be use to describe the hydrogen sulfide uptake rate when working with a
genetically close related culture of microorganisms. Furthermore it indicates that the genetic
diversity of microorganisms in corroded concrete results in a sum of different uptake kinetics
that can not be described by the biomass concentration.
Methyl mercaptane The microorganisms were exposed to methyl mercaptane at the end of 3 growth experiments of
hydrogen sulfide oxidizing microorganisms. This was done in experiment B, C and D, Table 8.
The microorganisms instantly began to oxidize methyl mercaptane in experiment B, which is
shown in Figure 21 as a tendency of the oxygen concentration.
Figure 21. The oxygen concentration, during the methyl mercaptane oxidation, in experiment B.
An increase of the oxygen uptake was only present in experiment B and nothing was detected in
experiments C and D. The methyl mercaptane addition and uptake of oxygen in experiment B is
shown in Figure 22, as a tendency of the oxygen uptake rate.

37 Hydrogen sulfide uptake rates and biomass concentration of microorganisms from corroded concrete
Figure 22. The total oxygen uptake rate of the experiment including methyl mercaptane oxidation
with methyl mercaptane oxidation being from 260 to 350 hours, which is cut from the total oxidation
rate.
Figure 22 shows the total oxygen uptake rate of experiment B. The methyl mercaptane addition
begins at 260 hours. In order to view the methyl mercaptane uptake, a zoom cut is made as
shown in Figure 22.
When observing the oxidation curve from experiment B, the methyl mercaptane uptake seems
to happen with an instantaneous change in activity followed by an increasing activity with a
tendency of growth. Furthermore, methyl mercaptane was added to experiment C and D without
any real effect, although experiment C had an insignificant rise in oxygen uptake of 0.05 mg
O2∙L-1∙h-1. The tendency that inoculation eliminated methyl mercaptane oxidation indicates that
the varying culture of microorganisms in corroded concrete has different energy sources and
that the, at pH 1, highly active hydrogen sulfide oxidizing microorganisms do not oxidize me-
thyl mercaptane. The fact that two experiments resulted in no methyl mercaptane reinforces the
tendency of the methyl mercaptane being biologically degraded in experiment B. Furthermore,
it supports the fact that the microbial diversity was higher in experiment B than in experiment C
and D.
Conclusion The study of hydrogen sulfide uptake rate shows that the development in protein concentration
is non-proportional with the hydrogen sulfide uptake rate in corroded concrete, due to the
variation in microorganisms. This shows that it is not possible to use the development in
biomass concentration in corroded concrete to describe the hydrogen sulfide uptake rate. The
bacterial diversity of reactor approached a monoculture of Acidithio-bacillus through
inoculation. This resulted in an increasing proportionality between protein concentration and
hydrogen sulfide uptake rate. The results indicate that the hydrogen sulfide uptake rate is
proportional with the biomass concentration of the individual microorganisms, but not with the
mixed culture.
The experiments with methyl mercaptane indicate that the microorganisms in corroded concrete
are able to oxidize and grow on methyl mercaptane. Furthermore, it is indicated that the Acidi-
thiobacillus, isolated through inoculation, are unable to consume methyl mercaptane.

38 Hydrogen sulfide uptake rates and biomass concentration of microorganisms from corroded concrete
References
Article 1: Description of the hydrogen sulfide induced corrosion of concrete sewer systems - a new ap-
proach.
ASCE (1989), Sulfide in wastewater collection and treatment systems, ASCE (American Society of Civil
Engineers) Manuals and Reports on Engineering Practice 69, 324.
Brüser T., Lens P. N. L. and Trüper H. G., 2000: The biological sulfur cycle. In: Lens, P., Pol, L.H. (Eds.),
Environmental Technologies to Treat Sulfur Pollution. IWA Publishing, London, UK.
Danish Environmental Protection Agency, 1988. Svovlbrintedannelse og –kontrol i trykledninger. miljø-
projekt nr. 96. miljøstyrelsen, København. ISBN 87-503-7392-7
Hvitved-Jacobsen, T., 2002. Sewer Processes – Microbial and Chemical Process Engineering of Sewer
Networks. CRC Press, Boca Raton, Florida, USA.
Hwang, Y., T. Matsuo, K. Hanaki, and N. Suzuki (1995), Identification and quantification of sulfur and
nitrogen containing odorous compounds in wastewater, Water Res., 29(2), 711–718.
Jensen, H. S., Nielsen, A. H., Hvitved-Jacobsen T. and Vollertsen J., 2008: Survival of hydrogen sulfide
oxidizing bacteria on corroded concrete surfaces of sewer systems, IWA Publishing 2008 Water Science &
Technology—WST, Issue 57 no. 11 pp 1721-1726
Jensen H. S., Lens P., Nielsen J. L., Bester K., Nielsen A. H., Hvitved-Jacobsen T. and Vollertsen J. In
preparation. Growth of hydrogen sulfide oxidizing bacteria from corroded concrete.
Nielsen P. H., Raunkjær K. and Hvitved-Jacobsen T. (1998): Sulfide production and wastewater quality in
pressure mains, Water Science and Technology, Vol. 37, no. 1, pp 97-104, 1998. IAWQ. Published by
Elsevier Science Ltd., Great Britain.
Okabe S., Odagiri M. Ito T and Satoh H, 2007: Succession of Sulfur-Oxidizing Bacteria in the Microbial
Community on Corroding Concrete in Sewer Systems. Applied and environmental microbiology, Vol. 73,
No. 3, p. 971–980. American Society for Microbiology
Parker CD. The corrosion of concrete 1. The isolation of a species of bacterium associated with the corro-
sion of concrete exposed to atmospheres containing hydrogen sulphides. Aust J Exp Biol Med Sci
1945;23:81–90.
Pierce Protein Research Products, 2008. Thermo Fisher Scientific Inc. 2008, purchased VWR/Bie &
Berntsen February 2009, http://www.piercenet.com/Objects/View.cfm?type=Fi-le&ID=0412, 23-10-2008.
Tanaka, N. and T. Hvitved-Jacobsen (2001), Sulfide production and wastewater quality — investigations in
a pilot plant pressure sewer, Water Science and Technology, 43(5), 129–136.
Tchobanoglous, G. (1981): Wastewater engineering: collection and pumping of wastewater. Metcalf & Ed-
dy. McGraw-Hill Book Company, USA. ISBN 0-07-041680-X
U.S. National Research Council, Division of Medical Sciences (1979) Hydrogen sulfide, report by Commit-
tee on Medical and Biological Effects of Environmental Pollutants, Subcommittee on H2S.

39 Hydrogen sulfide uptake rates and biomass concentration of microorganisms from corroded concrete
Vincke E., Boon N. and Verstraete W. (2001): Analysis of the microbial communities on corroded concrete
sewer pipes - a case study. Applied microbiology and biotechnology vol. 57 issue 5-6 pp. 776 -785
Vincke, E., Monteny, J., Beeldens, A., de Belie, N., Taerwe, L., van Gemert, D., Verstraete, W.H., 2000.
Recent developments in research on biogenic sulfuric acid attack of concrete. In: Lens, P., Pol, L.H. (Eds.),
Environmental Technologies to Treat Sulfur Pollution. IWA Publishing, London, UK.
Vollertsen J., Jahn A., Nielsen J. L., Hvitved-Jacobsen T. and Nielsen P. H., 2000: Comparison of methods
fpr determination of microbial biomass in wastewater, Environmental Engineering Laboratory, Aalborg
University, Denmark. Water Research Vol. 35, No. 7, pp. 1649–1658. Elsevier Science Ltd., Great Britain

40 Hydrogen sulfide uptake rates and biomass concentration of microorganisms from corroded concrete
This Master thesis is produced at Aalborg University and consists of 2 articles, in the area of hydrogen sulfide oxidation and sewer corrosion, describing:
The relation between actual and potential corrosion was investigated and
described as a corrosion reduction factor.
A study on the fate of partly oxidized hydrogen sulfide that is immobilized
in corroded concrete was performed.
An investigation of the influence of atmosphere velocity on the hydrogen
sulfide removal rate in sewer systems was performed.
Hydrogen sulfide oxidation in sewer systems was investigated in a bench
scale bioreactor
A study on the kinetics of methyl mercaptane oxidation in sewer systems
was performed