hydrogen peroxide, methyl hydroperoxide, and …...hydrogen peroxide, methyl hydroperoxide, and...
TRANSCRIPT
Hydrogen peroxide, methyl hydroperoxide, and formaldehyde over
North America and the North Atlantic
Julie A. Snow,1 Brian G. Heikes,2 Haiwei Shen,2 Daniel W. O’Sullivan,3 Alan Fried,4
and Jim Walega4
Received 3 July 2006; revised 8 December 2006; accepted 2 February 2007; published 3 May 2007.
[1] Hydrogen peroxide (H2O2), methyl hydroperoxide (CH3OOH), and formaldehyde(CH2O) were measured over North America and the North Atlantic during the INTEX-NA, TOPSE, and SONEX aircraft campaigns. An overview of H2O2, CH3OOH, andCH2O across the geographic and temporal range of these campaigns is presented. H2O2,CH3OOH, and CH2O mixing ratios and variability were larger during INTEX-NAcompared to TOPSE and SONEX. Mean H2O2, CH3OOH, and CH2O were 1390, 440, and480 pptv, respectively, more than two times higher than TOPSE measurements and anorder of magnitude higher than SONEX measurements. This is attributed to higher solarradiation levels and the more polluted conditions of INTEX-NA. Mixing ratios andvariability decreased with altitude for all three gases and on all three campaigns, except forCH3OOH during TOPSE. The impact of convection on H2O2, CH3OOH, and CH2O isalso discussed. Using the ratio H2O2/CH3OOH, convectively influenced air parcelswere found to be enhanced in CH3OOH, CH2O, CO, NO, and NO2 while H2O2 and HNO3
were depleted by wet removal. Biomass burning was also shown to increase H2O2,CH3OOH, and CH2O mixing ratios up to 1.5, 2, and 1 ppbv, respectively, even after4–5 days of transit. Results from this study show considerable variability in H2O2,CH3OOH, and CH2O throughout the North American and North Atlantic troposphere. Thevariability in the upper troposphere is driven by local photochemical production andtransport via regional convection and long-range pathways, suggesting transportmechanisms are important factors to include in photochemical models simulating H2O2,CH3OOH, CH2O, and HOx.
Citation: Snow, J. A., B. G. Heikes, H. Shen, D. W. O’Sullivan, A. Fried, and J. Walega (2007), Hydrogen peroxide, methyl
hydroperoxide, and formaldehyde over North America and the North Atlantic, J. Geophys. Res., 112,
D12S07, doi:10.1029/2006JD007746.
1. Introduction
[2] The NASA Intercontinental Transport Experiment–North America (INTEX-NA) mission investigated the out-flow of pollution from North America to the North Atlanticwith a focus on understanding the transport and evolutionof ozone (O3) and O3 precursors. INTEX-NA, the firstphase of the NASA INTEX campaign, was conductedfrom June to August 2004 with twenty flights extendingfrom California to the mid North Atlantic (Figure 1)[Singh et al., 2006]. A full suite of chemical specieswas investigated during this mission including HOx
precursors, hydrogen peroxide (H2O2), methyl hydroper-oxide (CH3OOH), and formaldehyde (CH2O). A criticalanalysis of the distribution of hydroxyl radical precursors,along with the hydroxyl radical (HO), the perhydroxylradical (HO2), nitrogen oxides (NOx), and hydrocarbons(HCs), is necessary to understand O3 production overNorth America and the North Atlantic during the summer.[3] H2O2, CH3OOH, and CH2O contribute about 30% of
the gross odd-hydrogen production in the troposphere withthe remainder of production coming from the photolysis ofozone in the presence of water vapor [Lee et al., 1997]. Inregions where water vapor is limited, such as in the uppertroposphere (UT), H2O2, CH3OOH, and CH2O becomemore important HOx reservoirs [Finlayson-Pitts and Pitts,1986; Jaegle et al., 2000, 1999; Tan et al., 2000]. CH3OOHhas the potential to produce one HO and up to three HO2
molecules when photolyzed and the subsequent photolysisof CH2O is considered [Logan et al., 1981]. Hydrogenperoxide has a much smaller impact on UT HOx levelsbecause of its high solubility and resulting removal byprecipitation and in-cloud reactions with SO2 [O’Sullivanet al., 1999; Crawford et al., 2000]. However, low SO2
JOURNAL OF GEOPHYSICAL RESEARCH, VOL. 112, D12S07, doi:10.1029/2006JD007746, 2007ClickHere
for
FullArticle
1Department of Geography, Geology, and the Environment, SlipperyRock University, Slippery Rock, Pennsylvania, USA.
2Center for Atmospheric Chemistry Studies, Graduate School ofOceanography, University of Rhode Island, Narragansett, Rhode Island,USA.
3Department of Chemistry, United States Naval Academy, Annapolis,Maryland, USA.
4National Center for Atmospheric Research, Boulder, Colorado, USA.
Copyright 2007 by the American Geophysical Union.0148-0227/07/2006JD007746$09.00
D12S07 1 of 17

mixing ratios during INTEX-NA, indicate in-cloud reac-tions with SO2 were not significant. As HOx sinks, theirsequestration in H2O2 and CH3OOH followed by the loss ofthese compounds, results in the removal of three HO2
radicals and an organic peroxy radical. This loss is a limitto net ozone production.[4] Typically H2O2, CH3OOH, and CH2O have lower
mixing ratios at higher altitudes. Therefore determining howthese gases become elevated in the UT is of great interest.One possible source of H2O2 and CH3OOH to the UT isconvective vertical transport [Prather and Jacob, 1997]. Forexample, strong convective uplift in thunderstorms,typhoons [Newell et al., 1996], and widespread convectiveactivity in regions such as the South Pacific ConvergenceZone (SPCZ) and Inter Tropical Convergence Zone (ITCZ)[Pickering et al., 1992; Cohan et al., 1999; Gregory et al.,1999] may be important mechanisms for transporting HOx
precursors to the UT. UT enhancements of CH3OOH intropical and subtropical regions have been previously ob-served [Heikes et al., 1996a; Lee et al., 1995; Pickering etal., 1995; Newell et al., 1996; O’Sullivan et al., 1999] andthese authors suggest convectively lifted boundary layer(BL) air, elevated in CH3OOH, was the source of theobserved enhancements. Although UT measurements ofperoxides and CH2O are limited over continents, elevatedCH3OOH associated with tropical air [Snow et al., 2003]and elevated CH2O associated with long-range transport ofits precursors [Fried et al., 2003a; A. Fried et al., The role
of convection in redistributing formaldehyde to the uppertroposphere over North America and the North Atlanticduring the summer 2004 INTEX campaign, unpublishedmanuscript, 2007, hereinafter referred to as Fried et al.,unpublished manuscript, 2007] have been observed overNorth America.[5] Care must be exercised in the interpretation of ele-
vated CH2O at high altitudes. The lifetime of CH2O withrespect to photolysis and OH is at most a few hours undersunlit conditions. Elevated CH2O near clouds may be fromconvective injection, but a more likely scenario is CH2O iselevated because of the injection of reactive hydrocarbonstherefore serving as a tracer of lofted boundary layerreactive hydrocarbons (J. Crawford, personal communica-tion, 2006; Fried et al., unpublished manuscript, 2007).[6] Tropospheric photochemistry point models have been
unable to exactly capture the vertical structure of HOx,particularly in the UT where models both underestimate andoverestimate HOx levels [Jaegle et al., 1997; Wang andPrinn, 2000; X. Ren et al., HOx observations and modelcomparison during INTEX-NA 2004, submitted to Journalof Geophysical Research, 2006, hereinafter referred to asRen et al., submitted manuscript, 2006]. Model studies haveshown that peroxides impact HOx levels when they areintroduced into the UT through transport [Lee et al., 1995;Jaegle et al., 1997; Prather and Jacob, 1997; Folkins et al.,1998; Cohan et al., 1999; Crawford et al., 2000]. Theresults in Crawford et al. [2000] showed elevated CH3OOH
Figure 1. Flight tracks of INTEX-NA (over North America during the summer 2004), TOPSE (northand south transects over North America and Canada during the winter-spring 2000), and SONEX (overthe North Atlantic during the fall 1997).
D12S07 SNOW ET AL.: PEROXIDES AND CH2O OVER NORTH AMERICA
2 of 17
D12S07
increased HO mixing ratios by 30–60% over a 50-hourperiod. Jaegle et al. [1997] predicted that the injection ofCH3OOH would cause large increases in UT HOx concen-trations for more than a week downwind of the convectiveevent. However, more recently, during INTEX-NA, pointmodels under predicted HO2 and HO by a factor of 3 above8 km pointing to an unknown source of HOx (Ren et al.,submitted manuscript, 2006). Studies have also shownCH2O to be an important UT HOx source [McKeen et al.,1997]. In convective outflow over biomass burning regions,CH2O is a significant source of HOx and may stimulate UTO3 production [Lee et al., 1998]. Conclusions from modelresults indicate the injection of peroxides and CH2O to theUT may be a source of not only local UT HOx, but may alsoimpact global HOx distributions [Jaegle et al., 1997].[7] It is important to note that these model studies [Lee et
al., 1995; Jaegle et al., 1997; Prather and Jacob, 1997;Folkins et al., 1998; Cohan et al., 1999; Crawford et al.,2000] take place over tropical regions where peroxides andCH2O are highly elevated in the BL and water vapor levelsare relatively high. Over North America, HOx production isprimarily dominated by reactions of O(1D) and H2O at lowlatitudes and by CH2O at high latitudes [Weinstein-Lloyd etal., 1998; Cantrell et al., 2003; Snow et al., 2003]; H2O2
and CH3OOH were shown to make only small contributionsto the total UT HOx budget. However, previously recordedmeasurements of peroxides spanning the troposphere overNorth America are limited, making INTEX-NA an impor-tant addition to peroxide distributions in this region, partic-ularly during the summer months when photochemicalproduction of peroxides is at a maximum.[8] In this study we utilize in situ measurements from the
INTEX-NA campaign and meteorological analyses to exam-ine the hypothesis that convective transport is a source ofHOx precursors, H2O2, CH3OOH, and CH2O to the UT overNorth America and the North Atlantic. A companion paperby Fried and colleagues (Fried et al., unpublished manu-script, 2007) further examines the role of CH2O in this regard.In addition, this study compares the results of the INTEX-NAcampaign to two earlier aircraft campaigns, TroposphericOzone Production about the Spring Equinox (TOPSE) [Atlaset al., 2003; Cantrell et al., 2003; Snow et al., 2003] andSubsonic Assessment of Ozone and Nitrogen (SONEX)[Singh et al., 1999; Thompson et al., 2000], conducted overNorth America and the North Atlantic during differentseasons (Figure 1).
2. Methods
2.1. H2O2 and CH3OOH
[9] Measurements of H2O2 and CH3OOH were madeusing a technique described by Lee et al. [1995]. Ambientair was sampled through an inlet on the side of the NASA-DC-8 and mixed with a collection solution in a continuousflow scrubbing coil. This technique scrubs peroxides fromthe ambient air into a collection solution (pH 6) based on theHenry’s Law equilibrium partitioning. The aqueous solutionwas then analyzed using high-performance liquid chroma-tography with C-18 columns. The separated peroxides werethen reacted with peroxidase and p-hydroxyphenyl-aceticacid to produce a fluorescent hydroperoxide derivative thatwas quantified using fluorescence detection. The gas phase
limits of detection (LOD) for H2O2 and CH3OOH were25 pptv and 20 pptv (2 sigma), respectively and theuncertainties were LOD ±30% of the ambient mixing ratiofor 2 minute averaged samples. This technique has success-fully been employed aboard the NASA DC-8, the NASAP3-B, and the NCAR C-130 research aircraft during previ-ous airborne experiments [Heikes, 1992; Heikes et al.,1996a, 1996b; O’Sullivan et al., 1999, 2004; Snow et al.,2003]. H2O2 was also measured using a new CIMS tech-nique [Crounse et al., 2006].
2.2. CH2O
[10] CH2O was measured using two separate techniques;the University of Rhode Island and United States NavalAcademy (URI-USNA) group used a fluorometric methodand the National Center for Atmospheric Research (NCAR)group used a tunable diode laser absorption spectroscopic(TDLAS) instrument (Fried et al., unpublished manuscript,2007). A comparison of results from these two techniques isfound in section 2.2.3.2.2.1. CH2O (URI-USNA)[11] CH2O was measured with an automated fluorometric
method adapted from Lazrus et al. [1988]. Gas phase CH2Ois removed from the atmosphere by mixing ambient sampleswith a pH 2 collection solution in glass stripping coils. TheCH2O reacts with H2O to form the adduct dihydroxymethane(CH2(OH)2) which in the presence of the catalyst formal-dehyde dehydrogenase (FDH) reacts with nicotinamideadenine dinucleotide (NAD+) to produce NADH. Thefluorescence of NADH is proportional to the mixing ratioof CH2O in the ambient sample. Prior to the mission, gasphase standards were added at the inlet under differentpressures to calibrate the in-flight collection efficiency.Liquid standards were analyzed before each flight to cali-brate the instrument. The CH2O 2 sigma LOD was 50 pptvwith an estimated uncertainty of 50 pptv ±30% of theambient value for 1 minute averaged samples. The techniquehas been employed on previous aircraft and ground basedexperiments [Heikes, 1992; Lee et al., 1998; O’Sullivan etal., 2004].2.2.2. CH2O (NCAR)[12] CH2O was measured by the NCAR group using a
tunable diode laser absorption spectroscopic (TDLAS)instrument. A detailed description of this instrument isfound in Fried et al. [2003a, 2003b] and Wert et al.[2003]; therefore only a brief explanation will be givenhere. Sample air was pulled in through a heated PFATefloninlet (�35�C and 1.3 cm OD) at �9 standard liters perminute. The air then passed through a multipass Herriott cellwhere it absorbed the infrared (IR) radiation (3.5 mm,2831.6 cm�1) from a tunable diode laser passing back andforth through the cell (total path length of 100 m). An IRdetector was used to measure the amount of IR absorptionby the ambient CH2O. This technique, with minor modifi-cations, has been previously used to measure CH2O on anumber of aircraft campaigns [e.g., Fried et al., 2003a,2003b; Wert et al., 2003]. Averaged over the entire cam-paign, the 2 sigma LOD for 1-min measurements was78 pptv. Starting with flight 14 on 31 July 2004 improve-ments in the mechanical stability of various optical compo-nents improved the LOD to 66 pptv. The systematicuncertainty at the 2 sigma level was estimated at 12% of
D12S07 SNOW ET AL.: PEROXIDES AND CH2O OVER NORTH AMERICA
3 of 17
D12S07
the ambient CH2O mixing ratio, and the total uncertainty foreach measurement is determined from the quadrature addi-tion of the LOD with the systematic uncertainty (Fried et al.,unpublished manuscript, 2007).2.2.3. Comparison of CH2O Measurements[13] Coincident CH2O measurements by the URI-USNA
group and the NCAR group have occurred on severalaircraft missions providing a series of comparison data.During INTEX-NA, URI-USNA CH2O measurements wereapproximately 70% of NCAR CH2O, more in the UT, witha weighted bivariate linear regression yielding an r2 of 0.89(Fried et al., unpublished manuscript, 2007). The agreementbetween URI-USNA and NCAR also improved throughoutthe INTEX-NA mission. This result is opposite of measure-ments made during the NASA TRACE-P missions whereURI-USNA CH2O was greater. However, at present wehave no explanation for the discrepancy and the apparentchange with mission or with time. For a more completeexplanation of the instrument comparison see Fried et al.(unpublished manuscript, 2007).
3. Results and Discussion
[14] H2O2, CH3OOH, and CH2O mixing ratios weremeasured during three aircraft missions across North Amer-ica and the North Atlantic covering a broad temporal range.The flight tracks and dates of each mission are shown inFigure 1. Singh et al. [2006], Atlas et al. [2003], and Singhet al. [1999] and Thompson et al. [2000] provide overviewsof the INTEX-NA, TOPSE, and SONEX aircraft cam-paigns, respectively.
3.1. Comparison of H2O2, CH3OOH, and CH2ODuring INTEX-NA, TOPSE, and SONEX
[15] The mean and median H2O2 measured duringINTEX-NA (1390 and 1070 pptv) were about ten timeslarger than those observed during TOPSE and SONEX(170, 150 and 120, 80 pptv) (Table 1). The higherINTEX-NA mixing ratios are consistent with increasedphotochemical production during the summer months com-pared to production during the winter-spring samplingperiod of TOPSE and the fall sampling period of SONEX.In addition to the time of sampling, the relative locations ofeach mission impacted the H2O2 mixing ratios. INTEX-NAflew over continental regions and along the northeast coastof the United States, often sampling in the BL, whileTOPSE sampled at higher latitudes and SONEX sampleda larger portion of UT air. H2O2 mixing ratios are typicallylower at higher latitudes and higher altitudes and thereforeare expected to be lower during TOPSE and SONEX.During INTEX-NA, H2O2 ranged from a minimum ofLOD (12.5 pptv) to a maximum of 13 ppbv. Previous
studies over the United States during the summer haveobserved H2O2 mixing ratios that ranged by a factor of 10,from �150 pptv to �5 ppbv, during the study [Boatman etal., 1990; Daum et al., 1990; Balasubramanian and Husain,1997; Weinstein-Lloyd et al., 1998]. The high H2O2 valuesmeasured during INTEX-NA are notable as they are someof the highest observed over North America. However,H2O2 values in this range have been encountered beforein PEM-West and TRACE-P in Asian outflow [Heikes etal., 1996a; O’Sullivan et al., 2004] and in TRACE-A inBrazilian outflow [Heikes et al., 1996b].[16] The range of observed H2O2 during INTEX-NA is
much larger than recorded during TOPSE and SONEXwhich also measured a minimum value of LOD (25 pptv)but observed maximum H2O2 levels of only 1330 pptv and670 pptv respectively. This most likely reflects the largevariability in air mass type encountered during INTEX-NA.The mission sampled heavily polluted outflow from theeastern United States and biomass burning plumes fromAlaska, containing elevated H2O2, and stratospheric intru-sions, containing low H2O2. In contrast to INTEX-NA, theair masses sampled during TOPSE and SONEX were morehomogeneous in origin.[17] It has also been observed that during the transition
from winter to spring, peroxides become more variablebecause of changes in atmospheric transport as the polarfront moves north [Snow et al., 2003]. Highly variabletransport patterns over the United States and decreasedphotochemical lifetime of peroxides also occur during thesummer [Jaegle et al., 2000; Cantrell et al., 2003] increas-ing H2O2 variability. Furthermore, INTEX-NA was highlyinfluenced by scattered convective activity [Bertram et al.,2006; Fried et al., unpublished manuscript, 2007] in whichH2O2 was removed by precipitation further increasing itsvariability. Discussions of cases showing convective trans-port and long-range transport of biomass burning plumesare found in sections 3.3 and 3.4 of this paper.[18] During INTEX-NA, H2O2 mixing ratios dropped
significantly above 6 km (Figure 2a). Median mixing ratiosof H2O2 were �2 ppbv in the BL (<1 km) and themiddle troposphere (MT, 1–6 km) while above 6 km, themedian H2O2 dropped to 400 pptv. These observationsagree well with other summertime studies conducted overNorth America [Boatman et al., 1990; Daum et al., 1990;Balasubramanian and Husain, 1997; Weinstein-Lloyd et al.,1998]. The range of H2O2 measurements also droppedabove 6 km. Below 6 km, H2O2 levels ranged from theLOD to above 13 ppbv while above 6 km, the highest H2O2
mixing ratio observed was �5 ppbv. The highest H2O2
levels in the UT were observed at lower latitudes with adifference of 8 ppb in the observed maximum between30 and 50� latitude. These H2O2 values are significantly
Table 1. Mean/Median and (Range) of H2O2, CH3OOH, and CH2O Mixing Ratios for Each Missiona
INTEX-NA TOPSE SONEX
H2O2 1390/1070 (LOD-13180) 170/150 (LOD-1330) 120/80 (LOD-670)CH3OOH 440/350 (LOD-2150) 180/150 (LOD-1400) 50/30 (LOD-340)CH2O-URI-USNA 480/210 (LOD-4220) 70/30 (LOD-460)CH2O-NCAR 790/360 (LOD-6780) 120/90 (LOD-1340)
aLOD indicates the value was below the limit of detection. Unit is parts per trillion by volume (pptv).
D12S07 SNOW ET AL.: PEROXIDES AND CH2O OVER NORTH AMERICA
4 of 17
D12S07
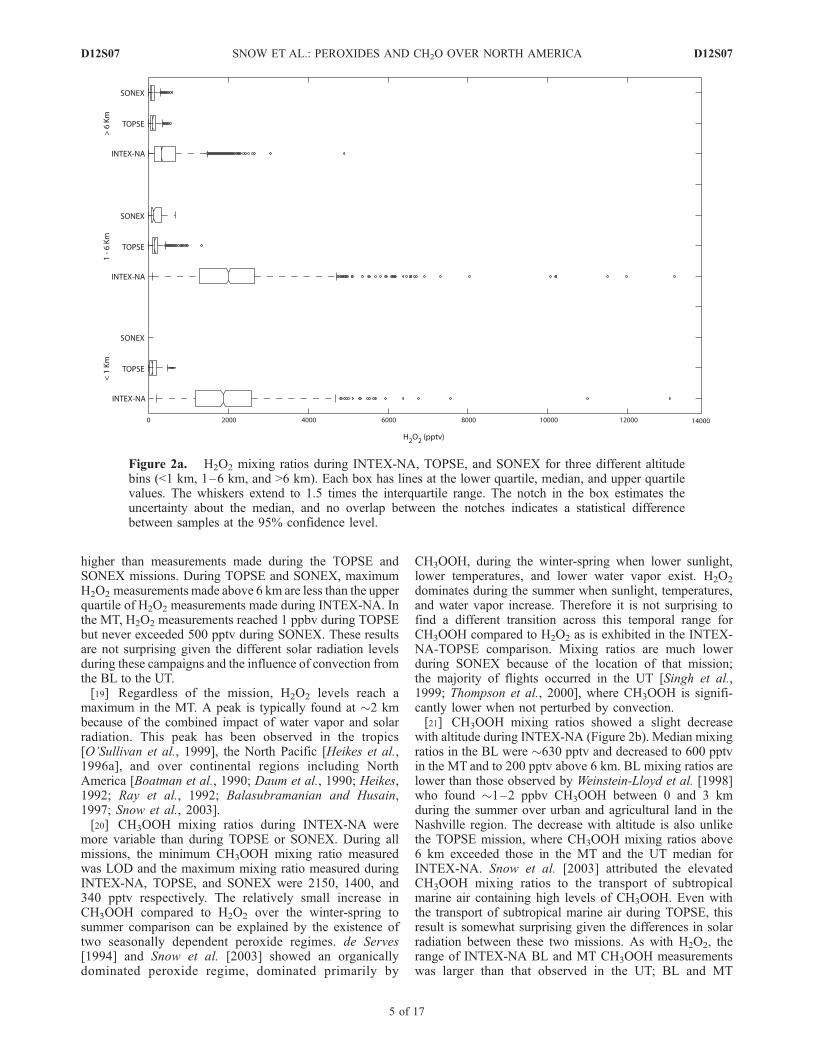
higher than measurements made during the TOPSE andSONEX missions. During TOPSE and SONEX, maximumH2O2 measurements made above 6 km are less than the upperquartile of H2O2 measurements made during INTEX-NA. Inthe MT, H2O2 measurements reached 1 ppbv during TOPSEbut never exceeded 500 pptv during SONEX. These resultsare not surprising given the different solar radiation levelsduring these campaigns and the influence of convection fromthe BL to the UT.[19] Regardless of the mission, H2O2 levels reach a
maximum in the MT. A peak is typically found at �2 kmbecause of the combined impact of water vapor and solarradiation. This peak has been observed in the tropics[O’Sullivan et al., 1999], the North Pacific [Heikes et al.,1996a], and over continental regions including NorthAmerica [Boatman et al., 1990; Daum et al., 1990; Heikes,1992; Ray et al., 1992; Balasubramanian and Husain,1997; Snow et al., 2003].[20] CH3OOH mixing ratios during INTEX-NA were
more variable than during TOPSE or SONEX. During allmissions, the minimum CH3OOH mixing ratio measuredwas LOD and the maximum mixing ratio measured duringINTEX-NA, TOPSE, and SONEX were 2150, 1400, and340 pptv respectively. The relatively small increase inCH3OOH compared to H2O2 over the winter-spring tosummer comparison can be explained by the existence oftwo seasonally dependent peroxide regimes. de Serves[1994] and Snow et al. [2003] showed an organicallydominated peroxide regime, dominated primarily by
CH3OOH, during the winter-spring when lower sunlight,lower temperatures, and lower water vapor exist. H2O2
dominates during the summer when sunlight, temperatures,and water vapor increase. Therefore it is not surprising tofind a different transition across this temporal range forCH3OOH compared to H2O2 as is exhibited in the INTEX-NA-TOPSE comparison. Mixing ratios are much lowerduring SONEX because of the location of that mission;the majority of flights occurred in the UT [Singh et al.,1999; Thompson et al., 2000], where CH3OOH is signifi-cantly lower when not perturbed by convection.[21] CH3OOH mixing ratios showed a slight decrease
with altitude during INTEX-NA (Figure 2b). Median mixingratios in the BL were �630 pptv and decreased to 600 pptvin the MT and to 200 pptv above 6 km. BL mixing ratios arelower than those observed by Weinstein-Lloyd et al. [1998]who found �1–2 ppbv CH3OOH between 0 and 3 kmduring the summer over urban and agricultural land in theNashville region. The decrease with altitude is also unlikethe TOPSE mission, where CH3OOH mixing ratios above6 km exceeded those in the MT and the UT median forINTEX-NA. Snow et al. [2003] attributed the elevatedCH3OOH mixing ratios to the transport of subtropicalmarine air containing high levels of CH3OOH. Even withthe transport of subtropical marine air during TOPSE, thisresult is somewhat surprising given the differences in solarradiation between these two missions. As with H2O2, therange of INTEX-NA BL and MT CH3OOH measurementswas larger than that observed in the UT; BL and MT
Figure 2a. H2O2 mixing ratios during INTEX-NA, TOPSE, and SONEX for three different altitudebins (<1 km, 1–6 km, and >6 km). Each box has lines at the lower quartile, median, and upper quartilevalues. The whiskers extend to 1.5 times the interquartile range. The notch in the box estimates theuncertainty about the median, and no overlap between the notches indicates a statistical differencebetween samples at the 95% confidence level.
D12S07 SNOW ET AL.: PEROXIDES AND CH2O OVER NORTH AMERICA
5 of 17
D12S07

Figure 2b. CH3OOH mixing ratios during INTEX-NA, TOPSE, and SONEX for three different altitudebins (<1 km, 1–6 km, and >6 km). Each box has lines at the lower quartile, median, and upper quartilevalues. The whiskers extend to 1.5 times the interquartile range. The notch in the box estimates theuncertainty about the median, and no overlap between the notches indicates a statistical differencebetween samples at the 95% confidence level.
Figure 2c. CH2O mixing ratios during INTEX-NA, TOPSE, and SONEX for three different altitudebins (<1 km, 1–6 km, and >6 km). CH2O measurements were made by URI-USNA and NCAR and theappropriate group is indicated along the y axis. Each box has lines at the lower quartile, median, andupper quartile values. The whiskers extend to 1.5 times the interquartile range. The notch in the boxestimates the uncertainty about the median, and no overlap between the notches indicates a statisticaldifference between samples at the 95% confidence level.
D12S07 SNOW ET AL.: PEROXIDES AND CH2O OVER NORTH AMERICA
6 of 17
D12S07
CH3OOHmeasurements ranged from the LOD to�2.5 ppbvwhile UT measurements were from the LOD to �1.5 ppbv.[22] Measurements of CH3OOH over marine regions
compared to those over continental regions yielded asignificant difference during INTEX-NA. Mean and medianCH3OOH over marine regions were �20% greater thanmeasurements made over the North American continent inthe BL and UT. This could be a result of continentaloutflow, however observations of enhanced H2O2 andCH2O were not observed over marine regions. In fact, theopposite observation was made; H2O2 and CH2O wereelevated over the North American continent and decreasedover marine regions (Fried et al., unpublished manuscript,2007).[23] It is important to note that CH2O was measured by
two techniques. The two CH2O techniques were usedsimultaneously only on INTEX-NA; CH2O was measuredby NCAR on TOPSE and by URI-USNA on SONEX. Forease of discussion, when referring to CH2O measurementsmade during INTEX-NA, the authors will be referring to theURI-USNA measurements unless otherwise noted by theNCAR designation.[24] The comparison of CH2O between field missions is
similar to that of CH3OOH with a larger range of mixingratios observed during INTEX-NA; about a 4 ppbv range onINTEX-NA compared to�1 ppbv on TOPSE and�400 pptvon SONEX. Nearly an order of magnitude difference wasobserved between the CH2O mean and median duringINTEX-NA (480 and 210 pptv) compared to SONEX (70and 30 pptv). Mean and median CH2O mixing ratiosmeasured on INTEX-NA are higher by a factor of 3–4,but within an order of magnitude of those sampled onTOPSE (120 pptv and 90 pptv). During INTEX-NA,CH2O decreased sharply above the BL dropping from amedian of 1300 pptv to 600 pptv in the MT and 100 pptv inthe UT (Figure 2c). These observations are about a factor of
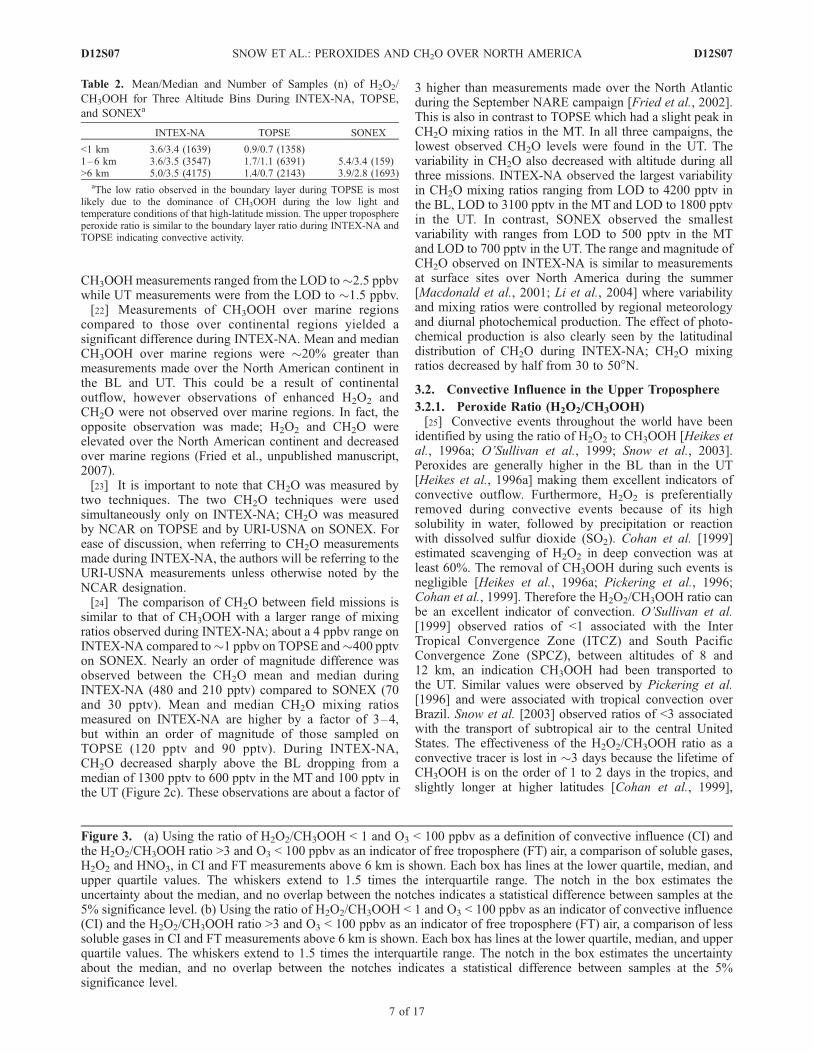
3 higher than measurements made over the North Atlanticduring the September NARE campaign [Fried et al., 2002].This is also in contrast to TOPSE which had a slight peak inCH2O mixing ratios in the MT. In all three campaigns, thelowest observed CH2O levels were found in the UT. Thevariability in CH2O also decreased with altitude during allthree missions. INTEX-NA observed the largest variabilityin CH2O mixing ratios ranging from LOD to 4200 pptv inthe BL, LOD to 3100 pptv in the MT and LOD to 1800 pptvin the UT. In contrast, SONEX observed the smallestvariability with ranges from LOD to 500 pptv in the MTand LOD to 700 pptv in the UT. The range and magnitude ofCH2O observed on INTEX-NA is similar to measurementsat surface sites over North America during the summer[Macdonald et al., 2001; Li et al., 2004] where variabilityand mixing ratios were controlled by regional meteorologyand diurnal photochemical production. The effect of photo-chemical production is also clearly seen by the latitudinaldistribution of CH2O during INTEX-NA; CH2O mixingratios decreased by half from 30 to 50�N.
3.2. Convective Influence in the Upper Troposphere
3.2.1. Peroxide Ratio (H2O2/CH3OOH)[25] Convective events throughout the world have been
identified by using the ratio of H2O2 to CH3OOH [Heikes etal., 1996a; O’Sullivan et al., 1999; Snow et al., 2003].Peroxides are generally higher in the BL than in the UT[Heikes et al., 1996a] making them excellent indicators ofconvective outflow. Furthermore, H2O2 is preferentiallyremoved during convective events because of its highsolubility in water, followed by precipitation or reactionwith dissolved sulfur dioxide (SO2). Cohan et al. [1999]estimated scavenging of H2O2 in deep convection was atleast 60%. The removal of CH3OOH during such events isnegligible [Heikes et al., 1996a; Pickering et al., 1996;Cohan et al., 1999]. Therefore the H2O2/CH3OOH ratio canbe an excellent indicator of convection. O’Sullivan et al.[1999] observed ratios of <1 associated with the InterTropical Convergence Zone (ITCZ) and South PacificConvergence Zone (SPCZ), between altitudes of 8 and12 km, an indication CH3OOH had been transported tothe UT. Similar values were observed by Pickering et al.[1996] and were associated with tropical convection overBrazil. Snow et al. [2003] observed ratios of <3 associatedwith the transport of subtropical air to the central UnitedStates. The effectiveness of the H2O2/CH3OOH ratio as aconvective tracer is lost in �3 days because the lifetime ofCH3OOH is on the order of 1 to 2 days in the tropics, andslightly longer at higher latitudes [Cohan et al., 1999],
Table 2. Mean/Median and Number of Samples (n) of H2O2/
CH3OOH for Three Altitude Bins During INTEX-NA, TOPSE,
and SONEXa
INTEX-NA TOPSE SONEX
<1 km 3.6/3.4 (1639) 0.9/0.7 (1358)1–6 km 3.6/3.5 (3547) 1.7/1.1 (6391) 5.4/3.4 (159)>6 km 5.0/3.5 (4175) 1.4/0.7 (2143) 3.9/2.8 (1693)
aThe low ratio observed in the boundary layer during TOPSE is mostlikely due to the dominance of CH3OOH during the low light andtemperature conditions of that high-latitude mission. The upper troposphereperoxide ratio is similar to the boundary layer ratio during INTEX-NA andTOPSE indicating convective activity.
Figure 3. (a) Using the ratio of H2O2/CH3OOH < 1 and O3 < 100 ppbv as a definition of convective influence (CI) andthe H2O2/CH3OOH ratio >3 and O3 < 100 ppbv as an indicator of free troposphere (FT) air, a comparison of soluble gases,H2O2 and HNO3, in CI and FT measurements above 6 km is shown. Each box has lines at the lower quartile, median, andupper quartile values. The whiskers extend to 1.5 times the interquartile range. The notch in the box estimates theuncertainty about the median, and no overlap between the notches indicates a statistical difference between samples at the5% significance level. (b) Using the ratio of H2O2/CH3OOH < 1 and O3 < 100 ppbv as an indicator of convective influence(CI) and the H2O2/CH3OOH ratio >3 and O3 < 100 ppbv as an indicator of free troposphere (FT) air, a comparison of lesssoluble gases in CI and FT measurements above 6 km is shown. Each box has lines at the lower quartile, median, and upperquartile values. The whiskers extend to 1.5 times the interquartile range. The notch in the box estimates the uncertaintyabout the median, and no overlap between the notches indicates a statistical difference between samples at the 5%significance level.
D12S07 SNOW ET AL.: PEROXIDES AND CH2O OVER NORTH AMERICA
7 of 17
D12S07

Figure 3
D12S07 SNOW ET AL.: PEROXIDES AND CH2O OVER NORTH AMERICA
8 of 17
D12S07
making the H2O2/CH3OOH ratio uniquely suited for detect-ing recent convection.[26] Table 2 shows the mean and median H2O2/CH3OOH
ratio in the BL, MT, and UT during INTEX-NA, TOPSE,and SONEX. The median peroxide ratio during TOPSE(0.7) was driven below 1 by the dominance of organicperoxides during the cold, dark winter periods [Snow et al.,2003]. The mean BL H2O2/CH3OOH ratio poleward of 50 Nin March was 0.7 indicating a strong dominance ofCH3OOH. The ratio reached 1.2 by May but neverexceeded 1.5 suggesting an increase in H2O2 due toincreased solar radiation and a decrease in CH3OOH dueto a decrease in hydrocarbon mixing ratios at lower altitudes[Blake et al., 2003]. During INTEX-NA, the median BLH2O2/CH3OOH ratio was 3.4. This indicates a peroxideregime dominated by H2O2. This also agrees well withde Serves [1994] who found a shift from an organicperoxide dominated to H2O2 dominated atmosphere whentemperature and solar radiation increased.[27] In the MT the median INTEX-NA H2O2/CH3OOH
ratio was 3.5, similar to the MT ratio observed duringSONEX (3.4). An increase in the MT ratio was alsoobserved during TOPSE although the ratio was still muchlower, �1. During TOPSE and SONEX, the median H2O2/CH3OOH ratio decreased in the UT, suggesting someconvective influence, but remained constant duringINTEX-NA. The INTEX-NA UT ratio is surprisingly highgiven Bertram et al. [2006] estimated 30–56% of theatmosphere sampled during INTEX-NA had been cloudprocessed within the past two days, which is an indication
of strong convective activity and would suggest removal ofH2O2. However, it is possible that the UT H2O2/CH3OOHratio is being driven by local photochemistry. Crawford etal. [1999] suggest local photochemistry driven by high H2O(666 ppmv) in tropical convective outflow, not convectivetransport itself, may be the most important factor in UTH2O2 variability. During INTEX-NA, however, the UTconditions were drier (median UT H2O was 340 ppmv)and therefore would result in less photochemical productionof HOx, leading to lower H2O2. Another important factor isthe low UT SO2 observations (median UT SO2 �24 pptv),making heterogeneous removal of H2O2 by SO2 small. Inactuality, transport, local photochemical production, andheterogeneous reactions are most likely all factors control-ling the UT H2O2/CH3OOH ratio over North America.3.2.2. Convective Enhancements During INTEX-NA[28] Convective influence (CI) in the UT was defined as
the H2O2/CH3OOH ratio <1 and O3 < 100 ppbv (to excludestratospheric samples). The cut off point of 1 is consistentwith other studies that have used the peroxide ratio toidentify convection [Heikes et al., 1996a; O’Sullivan etal., 1999; Snow et al., 2003]. The distribution of theINTEX-NA H2O2/CH3OOH ratio in the BL was used todetermine the ratio for free unperturbed UT (FT) as theH2O2/CH3OOH ratio >3 and O3 < 100, ppbv above 6 km.Note that the definition of FT for this study means thosesamples not influenced by recent convection (within 3–4 days) or by the stratosphere. Using this definition of CIand FT, a comparison of soluble and less soluble species arepresented in Figures 3a and 3b. The mean H2O2 and HNO3
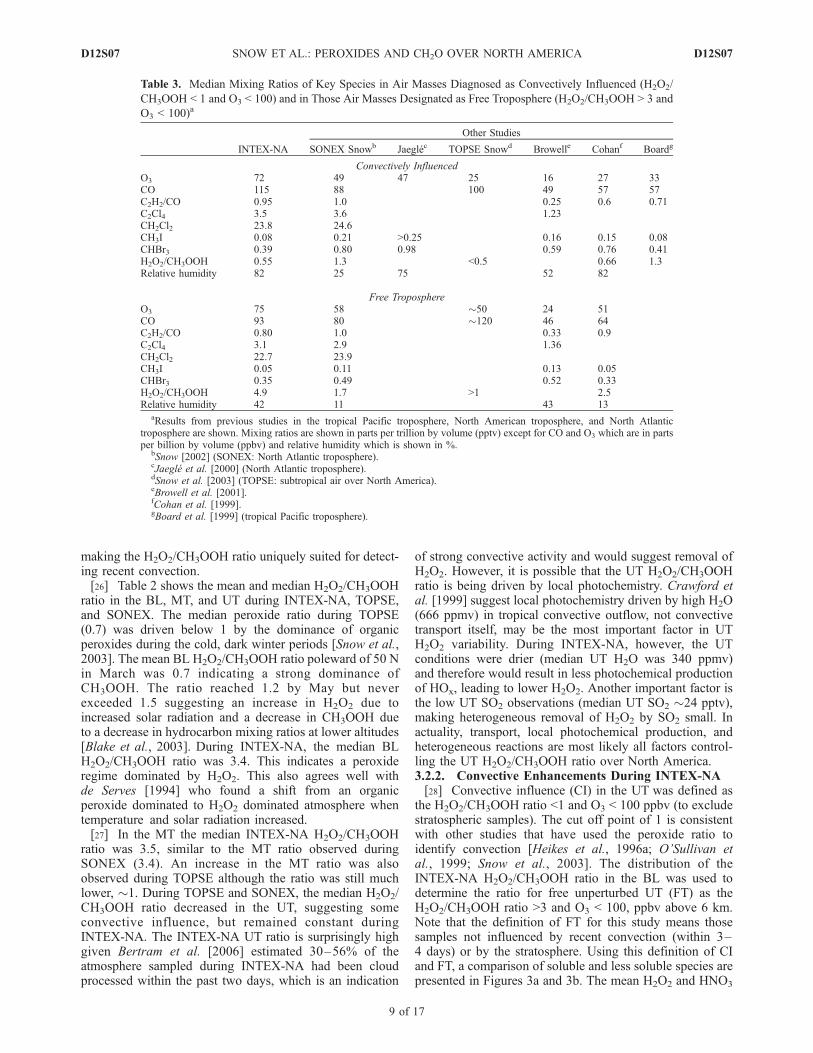
Table 3. Median Mixing Ratios of Key Species in Air Masses Diagnosed as Convectively Influenced (H2O2/
CH3OOH < 1 and O3 < 100) and in Those Air Masses Designated as Free Troposphere (H2O2/CH3OOH > 3 and
O3 < 100)a
INTEX-NA
Other Studies
SONEX Snowb Jaeglec TOPSE Snowd Browelle Cohanf Boardg
Convectively InfluencedO3 72 49 47 25 16 27 33CO 115 88 100 49 57 57C2H2/CO 0.95 1.0 0.25 0.6 0.71C2Cl4 3.5 3.6 1.23CH2Cl2 23.8 24.6CH3I 0.08 0.21 >0.25 0.16 0.15 0.08CHBr3 0.39 0.80 0.98 0.59 0.76 0.41H2O2/CH3OOH 0.55 1.3 <0.5 0.66 1.3Relative humidity 82 25 75 52 82
Free TroposphereO3 75 58 �50 24 51CO 93 80 �120 46 64C2H2/CO 0.80 1.0 0.33 0.9C2Cl4 3.1 2.9 1.36CH2Cl2 22.7 23.9CH3I 0.05 0.11 0.13 0.05CHBr3 0.35 0.49 0.52 0.33H2O2/CH3OOH 4.9 1.7 >1 2.5Relative humidity 42 11 43 13
aResults from previous studies in the tropical Pacific troposphere, North American troposphere, and North Atlantictroposphere are shown. Mixing ratios are shown in parts per trillion by volume (pptv) except for CO and O3 which are in partsper billion by volume (ppbv) and relative humidity which is shown in %.
bSnow [2002] (SONEX: North Atlantic troposphere).cJaegle et al. [2000] (North Atlantic troposphere).dSnow et al. [2003] (TOPSE: subtropical air over North America).eBrowell et al. [2001].fCohan et al. [1999].gBoard et al. [1999] (tropical Pacific troposphere).
D12S07 SNOW ET AL.: PEROXIDES AND CH2O OVER NORTH AMERICA
9 of 17
D12S07

levels in CI samples are lower than those samples identifiedas FT, the difference is statistically significant at the 95%confidence level. Soluble species such as H2O2 and HNO3
are removed during the convective process through precip-itation and cloud processing [Cohan et al., 1999; O’Sullivanet al., 1999] and the lower mixing ratio found in CI samplesis expected. In contrast, less soluble species, such asCH3OOH and CO, show a statistically higher mean in theCI samples than in the FT samples (Figure 3b) providingevidence of the UT enhancement of CH3OOH via convec-tive outflow. The difference between the mean of the twosample groups is significant at the 95% confidence level.With a lifetime of �2 months [Warneck, 2000], CO isexpected to be well mixed in the UT. However, given theperoxide ratio method detects fresh convection and most ofthe INTEX-NA storms occurred over the eastern UnitedStates where BL CO is highly elevated, it is not surprisingto see a statistically higher median in CI samples comparedto FT. Pooled URI-USNA and NCAR CH2O observationswere high in CI samples compared to FT samples. It isworth noting that the CH2O increase between the CI and FTtime periods is much larger in measurements acquired bythe NCAR group. Lightning, an UT source of NOx [Luke etal., 1992], or anthropogenic emissions, a BL source of NOx,are most likely responsible for the elevated levels of NOx
observed in the CI samples.[29] Table 3 presents a comparison of CI air masses to FT
air masses during aircraft campaigns over different regions.In general INTEX-NA measured relatively high O3, CO,C2Cl4, and CH2Cl2 in CI samples compared to other studies.This ismost likely due to the location of sampling; INTEX-NA
sampled over continental regions where BL mixing ratios arehigher than over marine regions. CH3I and CHBr3 werecomparably lower during INTEX-NA, most likely due to thelack of marine influence on the convective outflow comparedto the other aircraft missions, which took place over theAtlantic and Pacific Oceans.3.3. Evidence of Convective Outflow: A Case Study ofINTEX-NA Flights 7 and 18
[30] Although convective influence was detectedthroughout the UT over North America and along theeastern coast during INTEX-NA, flights 7 and 18 presentespecially clear cases demonstrating the influence of con-vection on peroxides and CH2O in the UT. Figure 4 showsthe flight tracks of flights 7 and 18. Flight 7 occurred on12 July and flew over the central United States and sampledfresh convective outflow along the southeastern leg of theflight over the southeastern United States. This region wasdominated by a high-pressure system located over thenorthern Gulf of Mexico, just to the south of the flighttrack. The anticyclonic flow of this dominant systemproduced onshore southerly winds along the western Gulfcoast and offshore northerly winds along the eastern Gulfcoast. High-pressure conditions are typically associatedwith subsiding air and are not associated with significantconvective activity. However, on 12 July, the winds werelight, ranging from 5–20 knots at 3 km to �20 knots at10 km. The light UT winds, in particular, resulted in littlemovement of air previously lifted into the UT by convectionup to 3 days earlier. Figure 5 shows the pathway ofconvected air parcels and potential convection cells on aGOES water vapor image taken 36 hours prior to sampling.
Figure 4. Flight tracks of flight 7 and flight 18 showing the regions of convectively influenced airhighlighted with shaded dots.
D12S07 SNOW ET AL.: PEROXIDES AND CH2O OVER NORTH AMERICA
10 of 17
D12S07
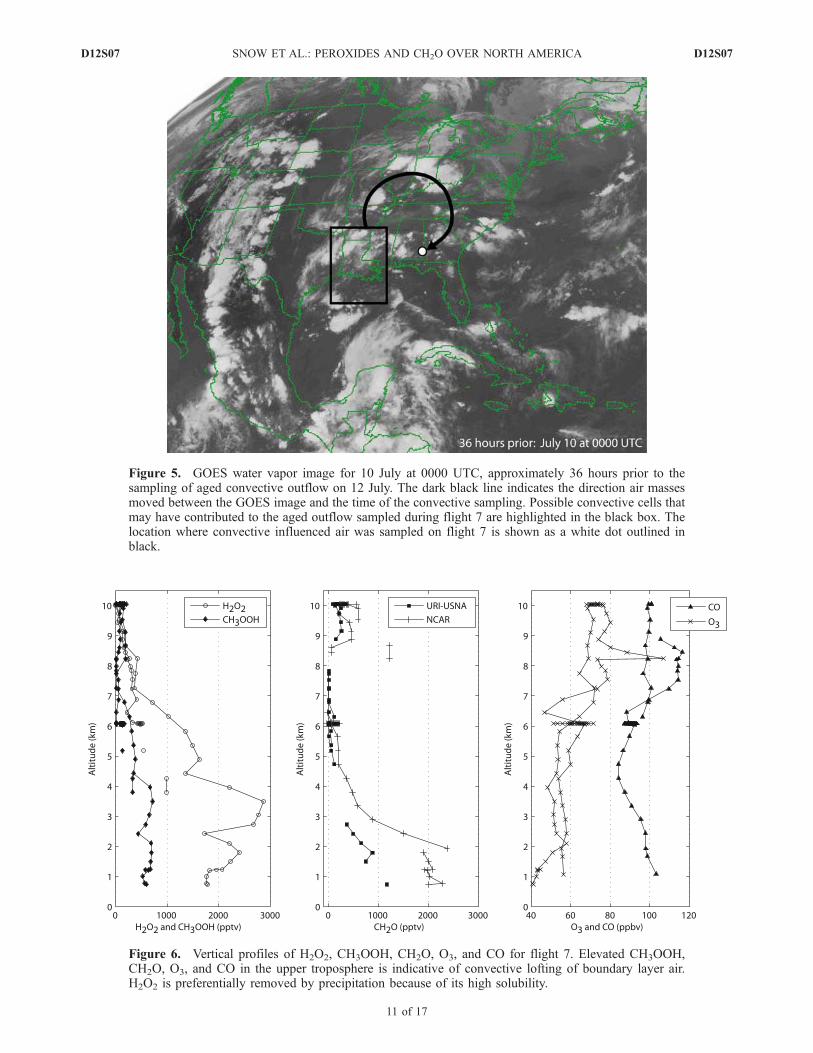
Figure 5. GOES water vapor image for 10 July at 0000 UTC, approximately 36 hours prior to thesampling of aged convective outflow on 12 July. The dark black line indicates the direction air massesmoved between the GOES image and the time of the convective sampling. Possible convective cells thatmay have contributed to the aged outflow sampled during flight 7 are highlighted in the black box. Thelocation where convective influenced air was sampled on flight 7 is shown as a white dot outlined inblack.
Figure 6. Vertical profiles of H2O2, CH3OOH, CH2O, O3, and CO for flight 7. Elevated CH3OOH,CH2O, O3, and CO in the upper troposphere is indicative of convective lofting of boundary layer air.H2O2 is preferentially removed by precipitation because of its high solubility.
D12S07 SNOW ET AL.: PEROXIDES AND CH2O OVER NORTH AMERICA
11 of 17
D12S07
Using this meteorological analysis, the age of the convec-tive outflow is determined to be �3 days. The lifetime ofCH3OOH in the summer troposphere is �3 days, within theage of this convected plume.[31] Figure 6 shows an altitude profile collected as the
aircraft approached the convective outflow. Both H2O2 andCH3OOH exhibited the typical decrease with altitude.
However, above 8 km, H2O2 continued to decrease whileCH3OOH showed a slight enhancement of �200 pptv. TheCH3OOH enhancement is a result of BL air, convectivelylifted and transported to the UT while the same processsubsequently removed H2O2. CH2O is enhanced above 8 kmand reaches 600 pptv compared to 50 pptv observedbetween 5 and 8 km. Because the lifetime of CH2O is
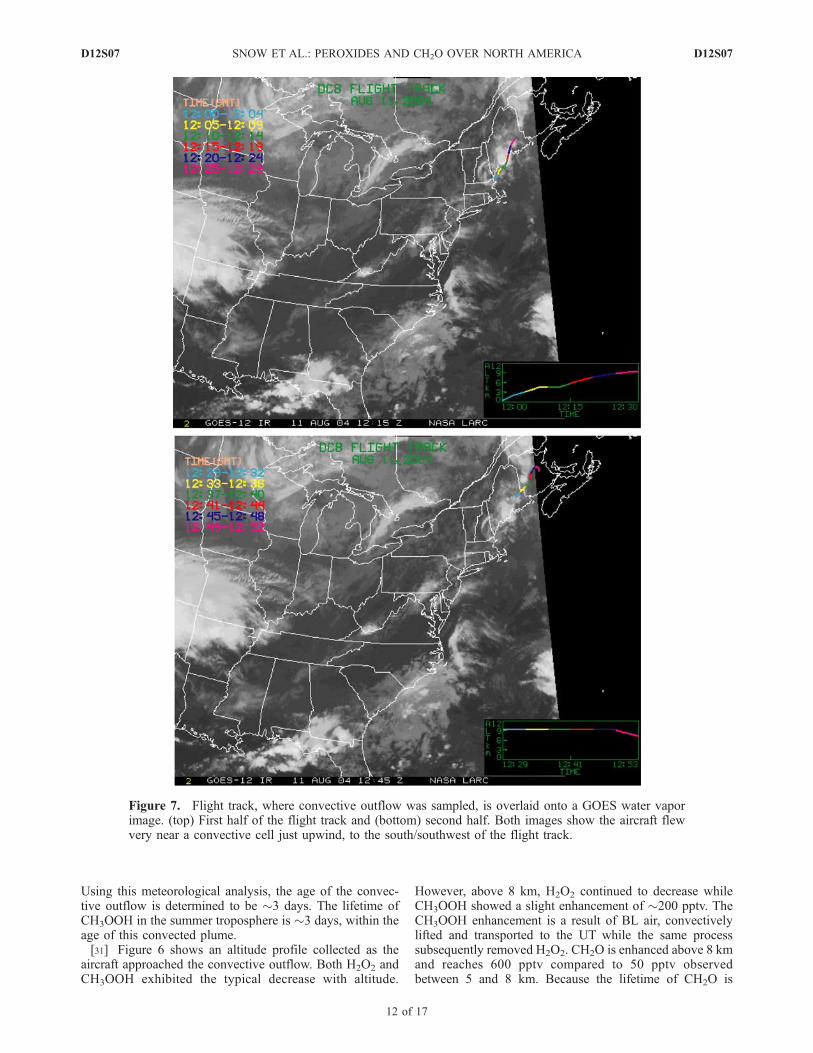
Figure 7. Flight track, where convective outflow was sampled, is overlaid onto a GOES water vaporimage. (top) First half of the flight track and (bottom) second half. Both images show the aircraft flewvery near a convective cell just upwind, to the south/southwest of the flight track.
D12S07 SNOW ET AL.: PEROXIDES AND CH2O OVER NORTH AMERICA
12 of 17
D12S07
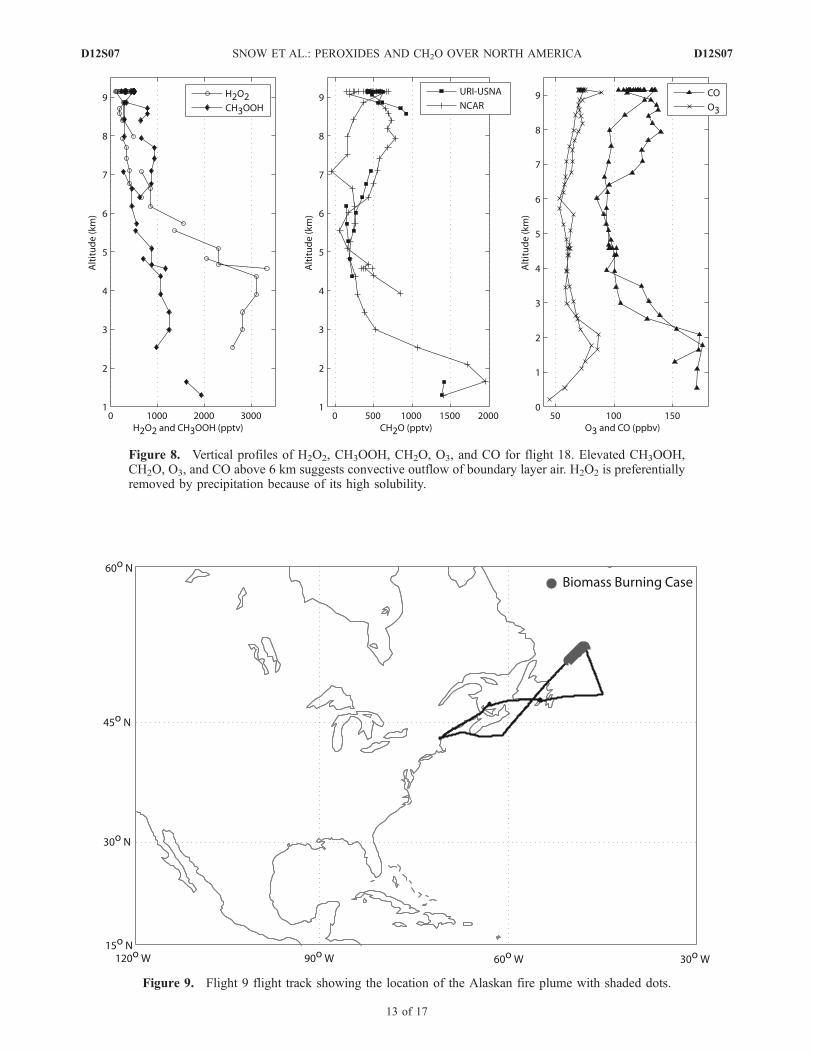
Figure 8. Vertical profiles of H2O2, CH3OOH, CH2O, O3, and CO for flight 18. Elevated CH3OOH,CH2O, O3, and CO above 6 km suggests convective outflow of boundary layer air. H2O2 is preferentiallyremoved by precipitation because of its high solubility.
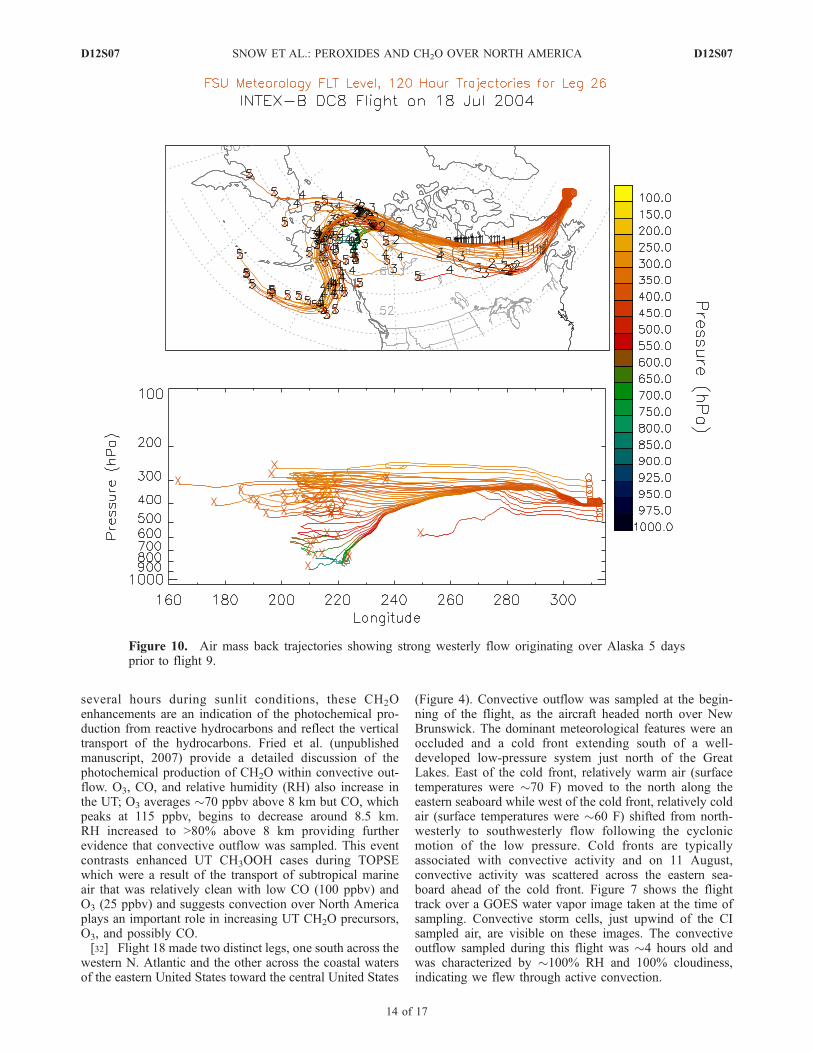
Figure 9. Flight 9 flight track showing the location of the Alaskan fire plume with shaded dots.
D12S07 SNOW ET AL.: PEROXIDES AND CH2O OVER NORTH AMERICA
13 of 17
D12S07
several hours during sunlit conditions, these CH2Oenhancements are an indication of the photochemical pro-duction from reactive hydrocarbons and reflect the verticaltransport of the hydrocarbons. Fried et al. (unpublishedmanuscript, 2007) provide a detailed discussion of thephotochemical production of CH2O within convective out-flow. O3, CO, and relative humidity (RH) also increase inthe UT; O3 averages �70 ppbv above 8 km but CO, whichpeaks at 115 ppbv, begins to decrease around 8.5 km.RH increased to >80% above 8 km providing furtherevidence that convective outflow was sampled. This eventcontrasts enhanced UT CH3OOH cases during TOPSEwhich were a result of the transport of subtropical marineair that was relatively clean with low CO (100 ppbv) andO3 (25 ppbv) and suggests convection over North Americaplays an important role in increasing UT CH2O precursors,O3, and possibly CO.[32] Flight 18 made two distinct legs, one south across the
western N. Atlantic and the other across the coastal watersof the eastern United States toward the central United States
(Figure 4). Convective outflow was sampled at the begin-ning of the flight, as the aircraft headed north over NewBrunswick. The dominant meteorological features were anoccluded and a cold front extending south of a well-developed low-pressure system just north of the GreatLakes. East of the cold front, relatively warm air (surfacetemperatures were �70 F) moved to the north along theeastern seaboard while west of the cold front, relatively coldair (surface temperatures were �60 F) shifted from north-westerly to southwesterly flow following the cyclonicmotion of the low pressure. Cold fronts are typicallyassociated with convective activity and on 11 August,convective activity was scattered across the eastern sea-board ahead of the cold front. Figure 7 shows the flighttrack over a GOES water vapor image taken at the time ofsampling. Convective storm cells, just upwind of the CIsampled air, are visible on these images. The convectiveoutflow sampled during this flight was �4 hours old andwas characterized by �100% RH and 100% cloudiness,indicating we flew through active convection.
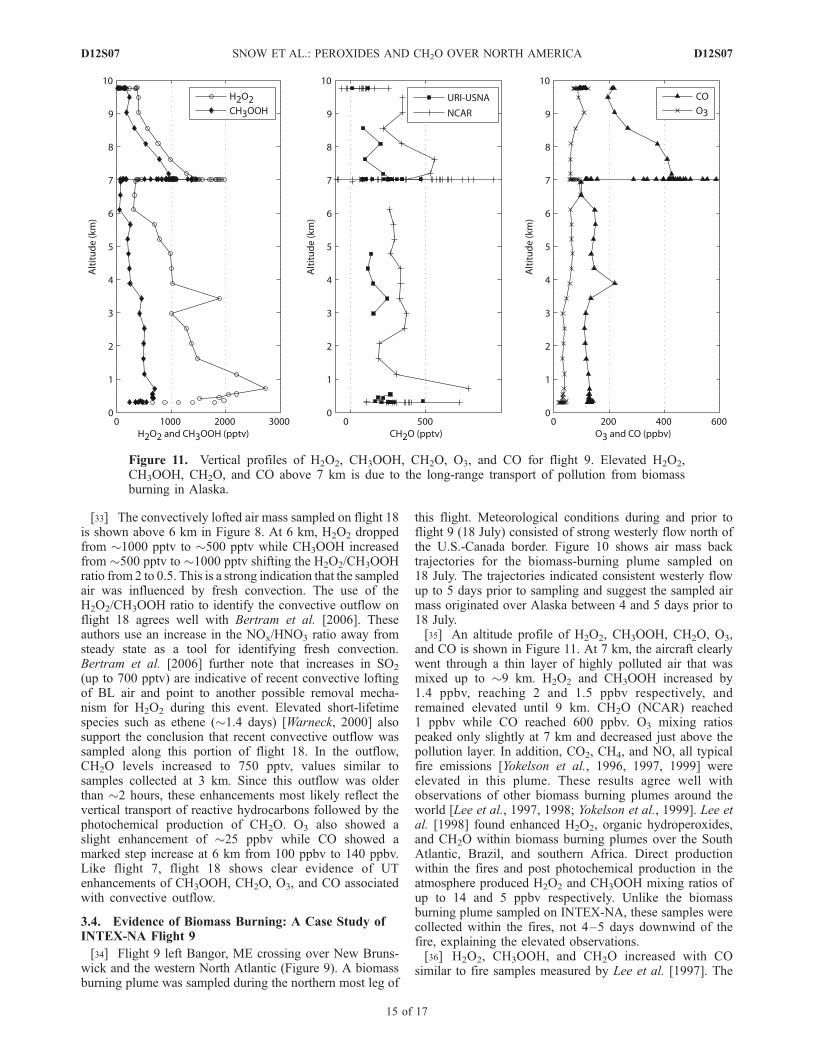
Figure 10. Air mass back trajectories showing strong westerly flow originating over Alaska 5 daysprior to flight 9.
D12S07 SNOW ET AL.: PEROXIDES AND CH2O OVER NORTH AMERICA
14 of 17
D12S07
[33] The convectively lofted air mass sampled on flight 18is shown above 6 km in Figure 8. At 6 km, H2O2 droppedfrom �1000 pptv to �500 pptv while CH3OOH increasedfrom �500 pptv to �1000 pptv shifting the H2O2/CH3OOHratio from 2 to 0.5. This is a strong indication that the sampledair was influenced by fresh convection. The use of theH2O2/CH3OOH ratio to identify the convective outflow onflight 18 agrees well with Bertram et al. [2006]. Theseauthors use an increase in the NOx/HNO3 ratio away fromsteady state as a tool for identifying fresh convection.Bertram et al. [2006] further note that increases in SO2
(up to 700 pptv) are indicative of recent convective loftingof BL air and point to another possible removal mecha-nism for H2O2 during this event. Elevated short-lifetimespecies such as ethene (�1.4 days) [Warneck, 2000] alsosupport the conclusion that recent convective outflow wassampled along this portion of flight 18. In the outflow,CH2O levels increased to 750 pptv, values similar tosamples collected at 3 km. Since this outflow was olderthan �2 hours, these enhancements most likely reflect thevertical transport of reactive hydrocarbons followed by thephotochemical production of CH2O. O3 also showed aslight enhancement of �25 ppbv while CO showed amarked step increase at 6 km from 100 ppbv to 140 ppbv.Like flight 7, flight 18 shows clear evidence of UTenhancements of CH3OOH, CH2O, O3, and CO associatedwith convective outflow.
3.4. Evidence of Biomass Burning: A Case Study ofINTEX-NA Flight 9
[34] Flight 9 left Bangor, ME crossing over New Bruns-wick and the western North Atlantic (Figure 9). A biomassburning plume was sampled during the northern most leg of
this flight. Meteorological conditions during and prior toflight 9 (18 July) consisted of strong westerly flow north ofthe U.S.-Canada border. Figure 10 shows air mass backtrajectories for the biomass-burning plume sampled on18 July. The trajectories indicated consistent westerly flowup to 5 days prior to sampling and suggest the sampled airmass originated over Alaska between 4 and 5 days prior to18 July.[35] An altitude profile of H2O2, CH3OOH, CH2O, O3,
and CO is shown in Figure 11. At 7 km, the aircraft clearlywent through a thin layer of highly polluted air that wasmixed up to �9 km. H2O2 and CH3OOH increased by1.4 ppbv, reaching 2 and 1.5 ppbv respectively, andremained elevated until 9 km. CH2O (NCAR) reached1 ppbv while CO reached 600 ppbv. O3 mixing ratiospeaked only slightly at 7 km and decreased just above thepollution layer. In addition, CO2, CH4, and NO, all typicalfire emissions [Yokelson et al., 1996, 1997, 1999] wereelevated in this plume. These results agree well withobservations of other biomass burning plumes around theworld [Lee et al., 1997, 1998; Yokelson et al., 1999]. Lee etal. [1998] found enhanced H2O2, organic hydroperoxides,and CH2O within biomass burning plumes over the SouthAtlantic, Brazil, and southern Africa. Direct productionwithin the fires and post photochemical production in theatmosphere produced H2O2 and CH3OOH mixing ratios ofup to 14 and 5 ppbv respectively. Unlike the biomassburning plume sampled on INTEX-NA, these samples werecollected within the fires, not 4–5 days downwind of thefire, explaining the elevated observations.[36] H2O2, CH3OOH, and CH2O increased with CO
similar to fire samples measured by Lee et al. [1997]. The
Figure 11. Vertical profiles of H2O2, CH3OOH, CH2O, O3, and CO for flight 9. Elevated H2O2,CH3OOH, CH2O, and CO above 7 km is due to the long-range transport of pollution from biomassburning in Alaska.
D12S07 SNOW ET AL.: PEROXIDES AND CH2O OVER NORTH AMERICA
15 of 17
D12S07
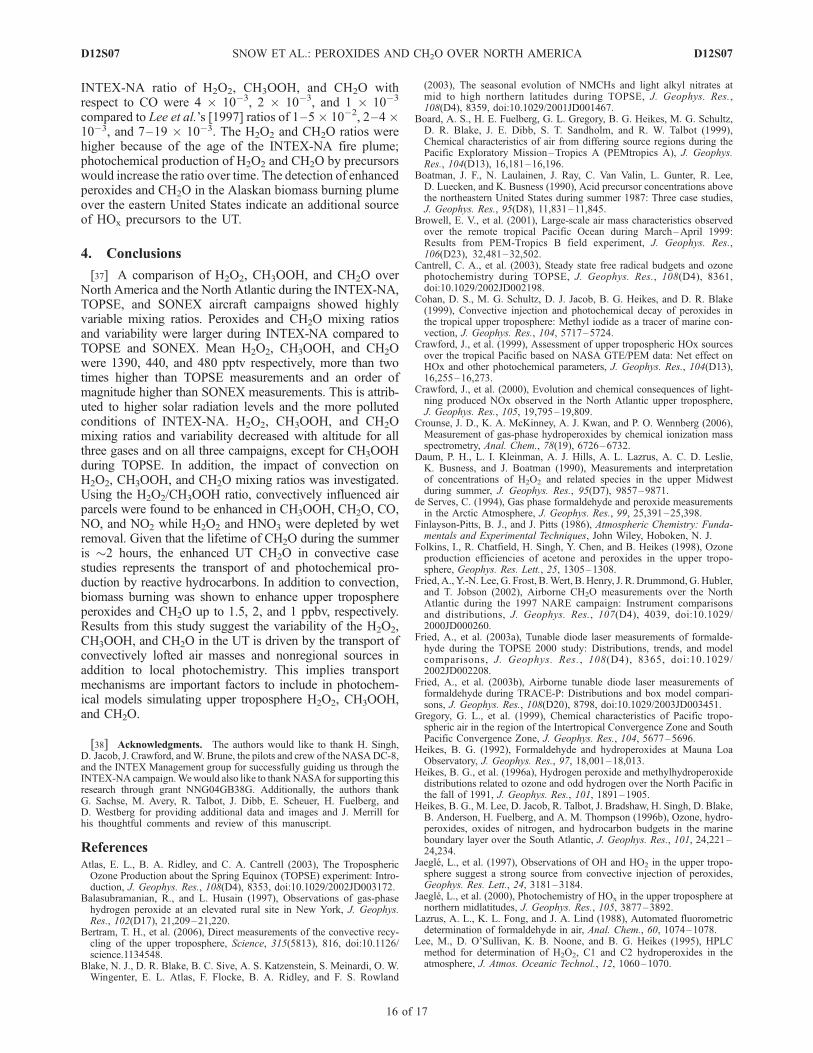
INTEX-NA ratio of H2O2, CH3OOH, and CH2O withrespect to CO were 4 � 10�3, 2 � 10�3, and 1 � 10�3
compared to Lee et al.’s [1997] ratios of 1–5� 10�2, 2–4�10�3, and 7–19 � 10�3. The H2O2 and CH2O ratios werehigher because of the age of the INTEX-NA fire plume;photochemical production of H2O2 and CH2O by precursorswould increase the ratio over time. The detection of enhancedperoxides and CH2O in the Alaskan biomass burning plumeover the eastern United States indicate an additional sourceof HOx precursors to the UT.
4. Conclusions
[37] A comparison of H2O2, CH3OOH, and CH2O overNorth America and the North Atlantic during the INTEX-NA,TOPSE, and SONEX aircraft campaigns showed highlyvariable mixing ratios. Peroxides and CH2O mixing ratiosand variability were larger during INTEX-NA compared toTOPSE and SONEX. Mean H2O2, CH3OOH, and CH2Owere 1390, 440, and 480 pptv respectively, more than twotimes higher than TOPSE measurements and an order ofmagnitude higher than SONEX measurements. This is attrib-uted to higher solar radiation levels and the more pollutedconditions of INTEX-NA. H2O2, CH3OOH, and CH2Omixing ratios and variability decreased with altitude for allthree gases and on all three campaigns, except for CH3OOHduring TOPSE. In addition, the impact of convection onH2O2, CH3OOH, and CH2O mixing ratios was investigated.Using the H2O2/CH3OOH ratio, convectively influenced airparcels were found to be enhanced in CH3OOH, CH2O, CO,NO, and NO2 while H2O2 and HNO3 were depleted by wetremoval. Given that the lifetime of CH2O during the summeris �2 hours, the enhanced UT CH2O in convective casestudies represents the transport of and photochemical pro-duction by reactive hydrocarbons. In addition to convection,biomass burning was shown to enhance upper troposphereperoxides and CH2O up to 1.5, 2, and 1 ppbv, respectively.Results from this study suggest the variability of the H2O2,CH3OOH, and CH2O in the UT is driven by the transport ofconvectively lofted air masses and nonregional sources inaddition to local photochemistry. This implies transportmechanisms are important factors to include in photochem-ical models simulating upper troposphere H2O2, CH3OOH,and CH2O.
[38] Acknowledgments. The authors would like to thank H. Singh,D. Jacob, J. Crawford, andW. Brune, the pilots and crew of the NASADC-8,and the INTEX Management group for successfully guiding us through theINTEX-NAcampaign.Wewould also like to thankNASA for supporting thisresearch through grant NNG04GB38G. Additionally, the authors thankG. Sachse, M. Avery, R. Talbot, J. Dibb, E. Scheuer, H. Fuelberg, andD. Westberg for providing additional data and images and J. Merrill forhis thoughtful comments and review of this manuscript.
ReferencesAtlas, E. L., B. A. Ridley, and C. A. Cantrell (2003), The TroposphericOzone Production about the Spring Equinox (TOPSE) experiment: Intro-duction, J. Geophys. Res., 108(D4), 8353, doi:10.1029/2002JD003172.
Balasubramanian, R., and L. Husain (1997), Observations of gas-phasehydrogen peroxide at an elevated rural site in New York, J. Geophys.Res., 102(D17), 21,209–21,220.
Bertram, T. H., et al. (2006), Direct measurements of the convective recy-cling of the upper troposphere, Science, 315(5813), 816, doi:10.1126/science.1134548.
Blake, N. J., D. R. Blake, B. C. Sive, A. S. Katzenstein, S. Meinardi, O. W.Wingenter, E. L. Atlas, F. Flocke, B. A. Ridley, and F. S. Rowland
(2003), The seasonal evolution of NMCHs and light alkyl nitrates atmid to high northern latitudes during TOPSE, J. Geophys. Res.,108(D4), 8359, doi:10.1029/2001JD001467.
Board, A. S., H. E. Fuelberg, G. L. Gregory, B. G. Heikes, M. G. Schultz,D. R. Blake, J. E. Dibb, S. T. Sandholm, and R. W. Talbot (1999),Chemical characteristics of air from differing source regions during thePacific Exploratory Mission–Tropics A (PEMtropics A), J. Geophys.Res., 104(D13), 16,181–16,196.
Boatman, J. F., N. Laulainen, J. Ray, C. Van Valin, L. Gunter, R. Lee,D. Luecken, and K. Busness (1990), Acid precursor concentrations abovethe northeastern United States during summer 1987: Three case studies,J. Geophys. Res., 95(D8), 11,831–11,845.
Browell, E. V., et al. (2001), Large-scale air mass characteristics observedover the remote tropical Pacific Ocean during March–April 1999:Results from PEM-Tropics B field experiment, J. Geophys. Res.,106(D23), 32,481–32,502.
Cantrell, C. A., et al. (2003), Steady state free radical budgets and ozonephotochemistry during TOPSE, J. Geophys. Res., 108(D4), 8361,doi:10.1029/2002JD002198.
Cohan, D. S., M. G. Schultz, D. J. Jacob, B. G. Heikes, and D. R. Blake(1999), Convective injection and photochemical decay of peroxides inthe tropical upper troposphere: Methyl iodide as a tracer of marine con-vection, J. Geophys. Res., 104, 5717–5724.
Crawford, J., et al. (1999), Assessment of upper tropospheric HOx sourcesover the tropical Pacific based on NASA GTE/PEM data: Net effect onHOx and other photochemical parameters, J. Geophys. Res., 104(D13),16,255–16,273.
Crawford, J., et al. (2000), Evolution and chemical consequences of light-ning produced NOx observed in the North Atlantic upper troposphere,J. Geophys. Res., 105, 19,795–19,809.
Crounse, J. D., K. A. McKinney, A. J. Kwan, and P. O. Wennberg (2006),Measurement of gas-phase hydroperoxides by chemical ionization massspectrometry, Anal. Chem., 78(19), 6726–6732.
Daum, P. H., L. I. Kleinman, A. J. Hills, A. L. Lazrus, A. C. D. Leslie,K. Busness, and J. Boatman (1990), Measurements and interpretationof concentrations of H2O2 and related species in the upper Midwestduring summer, J. Geophys. Res., 95(D7), 9857–9871.
de Serves, C. (1994), Gas phase formaldehyde and peroxide measurementsin the Arctic Atmosphere, J. Geophys. Res., 99, 25,391–25,398.
Finlayson-Pitts, B. J., and J. Pitts (1986), Atmospheric Chemistry: Funda-mentals and Experimental Techniques, John Wiley, Hoboken, N. J.
Folkins, I., R. Chatfield, H. Singh, Y. Chen, and B. Heikes (1998), Ozoneproduction efficiencies of acetone and peroxides in the upper tropo-sphere, Geophys. Res. Lett., 25, 1305–1308.
Fried, A., Y.-N. Lee, G. Frost, B.Wert, B. Henry, J. R. Drummond, G. Hubler,and T. Jobson (2002), Airborne CH2O measurements over the NorthAtlantic during the 1997 NARE campaign: Instrument comparisonsand distributions, J. Geophys. Res., 107(D4), 4039, doi:10.1029/2000JD000260.
Fried, A., et al. (2003a), Tunable diode laser measurements of formalde-hyde during the TOPSE 2000 study: Distributions, trends, and modelcomparisons, J. Geophys. Res., 108(D4), 8365, doi:10.1029/2002JD002208.
Fried, A., et al. (2003b), Airborne tunable diode laser measurements offormaldehyde during TRACE-P: Distributions and box model compari-sons, J. Geophys. Res., 108(D20), 8798, doi:10.1029/2003JD003451.
Gregory, G. L., et al. (1999), Chemical characteristics of Pacific tropo-spheric air in the region of the Intertropical Convergence Zone and SouthPacific Convergence Zone, J. Geophys. Res., 104, 5677–5696.
Heikes, B. G. (1992), Formaldehyde and hydroperoxides at Mauna LoaObservatory, J. Geophys. Res., 97, 18,001–18,013.
Heikes, B. G., et al. (1996a), Hydrogen peroxide and methylhydroperoxidedistributions related to ozone and odd hydrogen over the North Pacific inthe fall of 1991, J. Geophys. Res., 101, 1891–1905.
Heikes, B. G., M. Lee, D. Jacob, R. Talbot, J. Bradshaw, H. Singh, D. Blake,B. Anderson, H. Fuelberg, and A. M. Thompson (1996b), Ozone, hydro-peroxides, oxides of nitrogen, and hydrocarbon budgets in the marineboundary layer over the South Atlantic, J. Geophys. Res., 101, 24,221–24,234.
Jaegle, L., et al. (1997), Observations of OH and HO2 in the upper tropo-sphere suggest a strong source from convective injection of peroxides,Geophys. Res. Lett., 24, 3181–3184.
Jaegle, L., et al. (2000), Photochemistry of HOx in the upper troposphere atnorthern midlatitudes, J. Geophys. Res., 105, 3877–3892.
Lazrus, A. L., K. L. Fong, and J. A. Lind (1988), Automated fluorometricdetermination of formaldehyde in air, Anal. Chem., 60, 1074–1078.
Lee, M., D. O’Sullivan, K. B. Noone, and B. G. Heikes (1995), HPLCmethod for determination of H2O2, C1 and C2 hydroperoxides in theatmosphere, J. Atmos. Oceanic Technol., 12, 1060–1070.
D12S07 SNOW ET AL.: PEROXIDES AND CH2O OVER NORTH AMERICA
16 of 17
D12S07
Lee, M., B. Heikes, D. Jacob, G. Sachse, and B. Anderson (1997), Hydro-gen peroxide, organic hydroperoxide, and formaldehyde as primary pol-lutants from biomass burning, J. Geophys. Res., 102(D1), 1301–1309.
Lee, M., B. Heikes, and D. Jacob (1998), Enhancements of hydroperoxidesand formaldehyde in biomass burning impacted air and their effect onatmospheric oxidant cycles, J. Geophys. Res., 103(D11), 13,201–13,212.
Li, Y. Q., K. L. Demerjian, M. S. Zahniser, D. D. Nelson, J. B. McManus,and S. C. Herndon (2004), Measurement of formaldehyde, nitrogendioxide, and sulfur dioxide at Whiteface Mountain using a dual tunablediode laser system, J. Geophys. Res., 109, D16S08, doi:10.1029/2003JD004091.
Logan, J. A., M. J. Prather, S. C. Wofsy, and M. B. McElroy (1981),Tropospheric chemistry: A global perspective, J. Geophys. Res., 86,7210–7254.
Luke, W. T., R. R. Dickerson, W. F. Ryan, K. E. Pickering, and L. J.Nunnermacker (1992), Tropospheric chemistry over the lower GreatPlains of the United States: 2. Trace gas profiles and distributions,J. Geophys. Res., 97(D18), 20,647–20,670.
Macdonald, A. M., P. A. Makar, K. G. Anlauf, K. L. Hayden, J. W.Bottenheim, D. Wang, and T. Dann (2001), Summertime formaldehydeat a high-elevation site in Quebec, J. Geophys. Res., 106(D23), 32,361–32,374.
McKeen, S. A., T. Gierczak, J. B. Burkholder, P. O. Wennberg, R. F.Hanisco, E. R. Keim, R.-S. Gao, S. C. Liu, A. R. Ravishankara, andD. W. Fahey (1997), The photochemistry of acetone in the upper tropo-sphere: A source of odd-hydrogen radicals, Geophys. Res. Lett., 24,3177–3180.
Newell, R. E., Y. Zhu, E. V. Browell, W. G. Read, and J. W. Waters(1996), Walker circulation and tropical upper troposphere water vapor,J. Geophys. Res., 101, 1961–1974.
O’Sullivan, D. W., B. G. Heikes, M. Lee, W. Chang, G. Gregory, D. Blake,and G. Sachse (1999), Distribution of hydrogen peroxide and methylhy-droperoxide over the Pacific and south Atlantic Oceans, J. Geophys. Res.,104, 5635–5646.
O’Sullivan, D. W., B. G. Heikes, J. Snow, P. Burrow, M. Avery, D. R.Blake, G. W. Saschse, R. W. Talbot, D. C. Thornton, and A. R. Brandy(2004), Long-term and seasonal variations in the levels of hydrogenperoxide and methylhydroperoxide, and selected compounds over thePacific Ocean, J. Geophys. Res., 109, D15S13, doi:10.1029/2003JD003689.
Pickering, K. E., A. M. Thompson, R. J. Scala, W.-K. Tao, R. R. Dickerson,and J. Simpson (1992), Free tropospheric ozone production followingentrainment of urban plumes into deep convection, J. Geophys. Res.,97, 17,985–18,000.
Pickering, K. E., A. M. Thompson, W.-K. Tao, R. D. Rood, D. P.McNamara, and A. M. Molod (1995), Vertical transport by convectiveclouds: Comparisons of three modeling approaches, Geophys. Res.Lett., 22, 1089–1092.
Pickering, K. E., et al. (1996), Convective transport of biomass burningemission over Brazil during Trace A, J. Geophys. Res., 101, 23,993–24,012.
Prather, M. J., and D. J. Jacob (1997), A persistent imbalance in HOx andNOx photochemistry of the upper troposphere driven by deep convection,Geophys. Res. Lett., 24, 3189–3192.
Ray, J. D., C. C. Van Valin, and J. F. Boatman (1992), The vertical dis-tribution of atmospheric H2O2: A case study, J. Geophys. Res., 97, 2507–2517.
Singh, H. B., A. M. Thompson, and H. Schlager (1999), SONEX airbornemission and coordinated POLINAT-2 activity: Overview and accomplish-ments, J. Geophys. Res., 26, 3053–3056.
Singh, H. B., W. H. Brune, J. H. Crawford, D. J. Jacob, and P. B. Russell(2006), Overview of the summer 2004 Intercontinental Chemical Trans-port Experiment –North America (INTEX-A), J. Geophys. Res., 111,D24S01, doi:10.1029/2006JD007905.
Snow, J. A. (2002), Convective transport of HOx precursors to the uppertroposphere, Ph.D. dissertation, Univ. of R. I., Kingston.
Snow, J. A., B. G. Heikes, J. T. Merrill, A. J. Wimmers, J. L. Moody, andC. A. Cantrell (2003), Winter-spring evolution and variability of HOx
reservoir species, hydrogen peroxide, and methyl hydroperoxide, in thenorthern middle to high latitudes, J. Geophys. Res., 108(D4), 8362,doi:10.1029/2002JD002172.
Tan, D., I. Faloona, W. H. Brune, L. Jaegle, D. Jacob, B. Heikes, J. Snow,R. Shetter, M. Muller, and H. Singh (2000), Observations of HOx
and its relationship with NOx in the upper troposphere during SONEX,J. Geophys. Res., 105, 3771–3783.
Thompson, A. M., H. B. Singh, and H. Schlager (2000), Introduction tospecial section: Subsonic Assessment Ozone and Nitrogen Oxide Experi-ment (SONEX) and Pollution From Aircraft Emissions in the NorthAtlantic Flight Corridor (POLINAT 2), J. Geophys. Res., 105, 3595–3603.
Wang, C., and R. G. Prinn (2000), On the roles of deep convective clouds intropospheric chemistry, J. Geophys. Res., 105, 22,269–22,297.
Warneck, P. (2000), Chemistry of the Natural Atmosphere, 2nd ed.,Elsevier, New York.
Weinstein-Lloyd, J. B., J. H. Lee, P. H. Daum, L. I. Kleinman, L. H.Nunnermacker, S. R. Springston, and L. Newman (1998), Measurementsof peroxides and related species during the 1995 summer intensive of theSouthern Oxidants Study in Nashville, Tennessee, J. Geophys. Res.,103(D17), 22,361–22,373.
Wert, B. P., A. Fried, S. Rauenbuehler, J. Walega, and B. Henry (2003),Design and performance of a tunable diode laser absorption spectrometerfor airborne formaldehyde measurements, J. Geophys. Res., 108(D12),4350, doi:10.1029/2002JD002872.
Yokelson, R., D. Griffith, J. Burkholder, and D. Ward (1996), Accuracy andadvantages of synthetic calibration of smoke spectra, in Optical RemoteSensing for Environmental and Process Monitoring, pp. 365–376, Airand Waste Manage. Assoc., Pittsburgh, Pa.
Yokelson, R., D. Ward, R. Susott, J. Reardon, and D. Griffith (1997),Emissions from smoldering combustion of biomass measured by open-path Fourier transform infrared spectroscopy, J. Geophys. Res., 102,18,865–18,877.
Yokelson, R., J. Goode, D. Ward, R. Susott, R. Babbitt, D. Wade,I. Bertschi, D. Griffith, and W. Hao (1999), Emissions of formaldehyde,acetic acid, methanol, and other trace gases from biomass fires in NorthCarolina measured by airborned Fourier transform infrared spectroscopy,J. Geophys. Res., 104(D23), 30,109–30,125.
�����������������������A. Fried and J. Walega, National Center for Atmospheric Research,
Boulder, CO 80307, USA.B. G. Heikes and H. Shen, Center for Atmospheric Chemistry Studies,
Graduate School of Oceanography, University of Rhode Island,Narragansett, RI 02882, USA.D. W. O’Sullivan, Department of Chemistry, United States Naval
Academy, Annapolis, MD 21402, USA.J. A. Snow, Department of Geography, Geology, and the Environment,
Slippery Rock University, Slippery Rock, PA 16057, USA. ([email protected])
D12S07 SNOW ET AL.: PEROXIDES AND CH2O OVER NORTH AMERICA
17 of 17
D12S07