determination of the hydroperoxide potential … · determination of the hydroperoxide potential of...
TRANSCRIPT

CRC Report No. 559 S
SIIIC FILE COP
01
DETERMINATION OF THEHYDROPEROXIDE POTENTIAL
OF JET FUELS
DTICELECTEI
JN0 2198
SJUNApril 1988
Nrmsvw FOR rUsuc MUMzSE DISTBUTIN UnUuuu
,,COORDINATING RESEARCH COUNCIL, INC.219 PERIMETER CENTER PARKWAY, ATLANTA, GEORGIA 30346

The Coordinating Research Council, Inc. (CRC) is a non-profit corporationsupported by the petroleum and automotive equipment industries. CRC oper-ates through committees made up of technical experts from industry and .
government who voluntarily participate. The four main areas of research withinCRC are: air pollution (atmospheric and engineering studies); aviation fuels,lubricants, and equipment performance; heavy-duty vehicle fuels, lubricants,and equipment performance (e.g., diesel trucks); and light-duty vehicle fuels,lubricants, and equipment performance (e.g., passenger cars). CRC's functionis to provide the mechanism for joint research conducted by the two industriesthat will help in determining the optimum combinations of petroleum productsand automotive equipment. CRC's work is limited to research that is mutuallybeneficial to the two industries involved, and all information is available to thepublic.
S
or
0

COORDINATING RESEARCH COUNCIL-NCORPORATEO
21 9 PERIMETER CENTER PA KWAY
ATL-ANTA. GEORGIA 30346
(404) 396-3400 0
DETERMINATION OF THE HYDROPEROXIDE 0
POTENTIAL OF JET FUELS
IN FORMULATING AND APPROVING REPORTS, THEAPPROPRIATE CCO4MITTEE OF THE COORDINATINGRESEARCH COUNCi., INC. HAS NOT INVESTIGATEDOR CONSIDERED PATENTS WHICH MAY APPLY TOTHE SUBJECT MATTER. PROSPECTIVE USERS OF THEREPORT ARE RESPONSIBLE FOR PROTECTING THEM-SELVES AGAINST LIABILITY FOR INFRINGEMENT OFPATENTS.
Prepared by the
Hydroperoxide Potential of Jet Fuels Panel
of the 0
CRC Oxidation Stability of Gas Turbine Fuels Group
Apri l 1988
-1
Aviation Vehicle Fuel, Lubricant, and Equipment Research Committee
of the
Coordinating Research Council, Inc.
!% /1",

I.
TABLE OF CONTENTS
TEXT
I. SUMMARY ............................................... ...... 1
II. INTRODUCTION ................................................. 1
III. TEST METHOD DEVELOPMENT ...................................... 2
A. Initial US Navy Tests ................................... 2B. Cooperative Test Program I and 2 ........................ 2C. Cooperative Test Program 3 .............................. 4
IV. CONCLUSIONS .................................................. 11
TABLES
Table I - Test Fuels ............................................. 15
Table II - Accelerated Test Time Needed to DistinguishBetween Stable and Unstable Jet Fuels .................. 16
FIGURES 1be
Figure 1 - Average Peroxide Number vs. Stress Time - Fuel 1 ....... 17
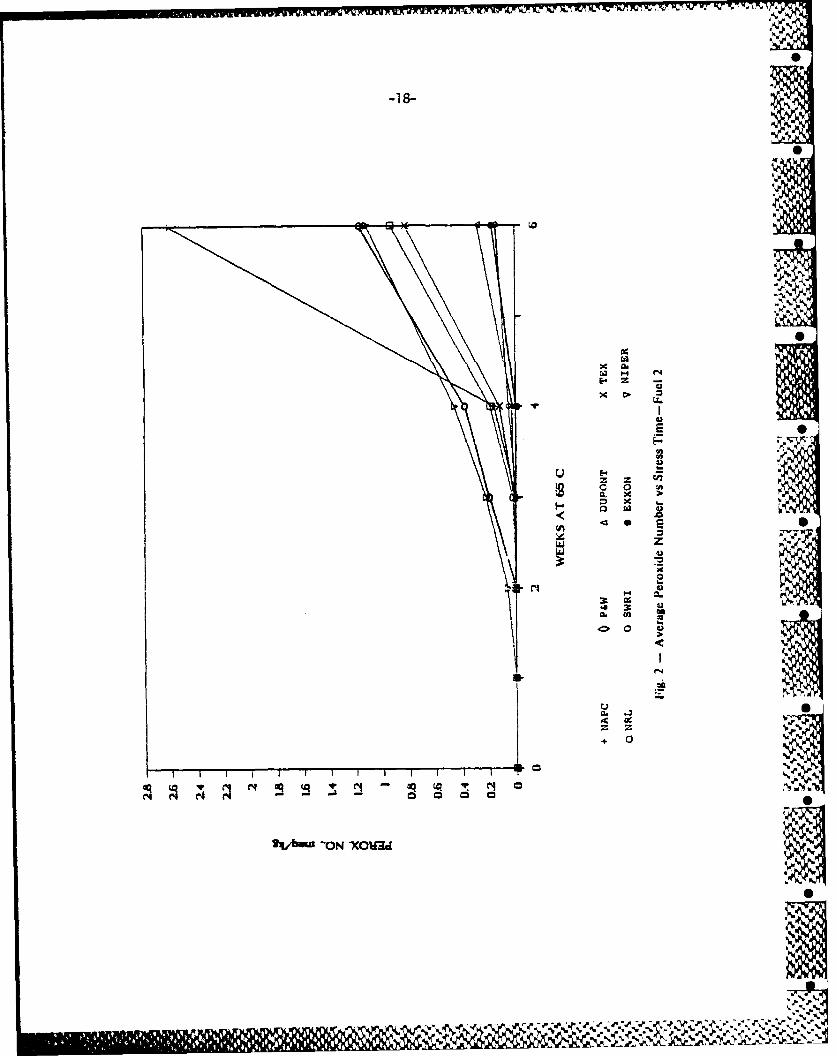
Figure 2 - Average Peroxide Number vs. Stress Time - Fuel 2....... 18
Figure 3 -Average Peroxide Number vs. Stress Time -Fuel 3 ....... 19
Figure 4 - Average Peroxide Number vs. Stress Time - Fuel 4...... 20
Figure 5 - Average Peroxide Number vs. Stress Time - Fuel 5 ....... 21 ton For
Figure 6 - Average Peroxide Number vs. Stress Time - Fuel 6 ....... 22 a C
-iced F .Figure 7 - Average Peroxide Number vs. Stress Time - Fuel 7 ....... 23 . .ton'--
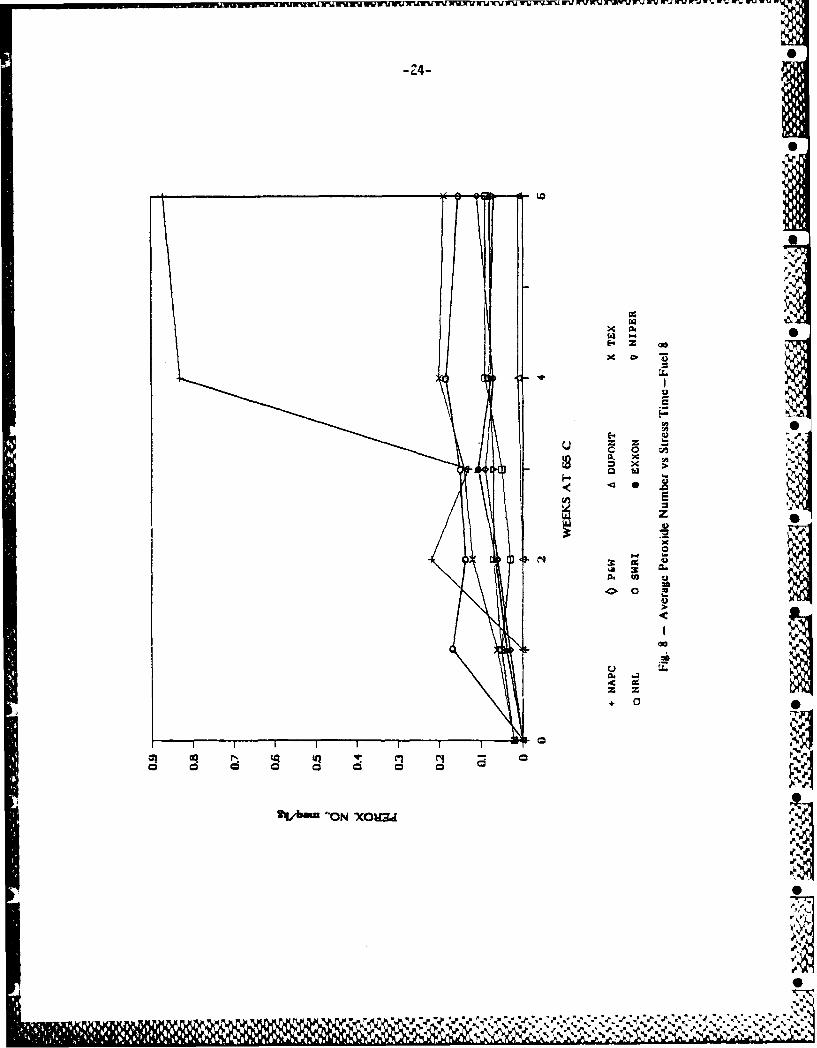
Figure 8 - Average Peroxide Number vs. Stress Time - Fuel 8....... 24
Figure 9 - Average Peroxide Number vs. Stress Time - Fuel 9 ....... 25 1 t°/
;all and/orDist Special
-1- I
FIGURES - Continued
Page
Figure 10 - Average Peroxide Number vs. Stress Time - Fuel 4,Expanded Scale ....................................... 26
Figure 11 - Average Peroxide Number vs. Stress Time - Fuel 5,Expanded Scale ....................................... 27
Figure 12 - Average Peroxide Number vs. Stress Time - Fuel 6,Expanded Scale ....................................... 28
Figure 13 - Average Peroxide Number vs. Stress Time - Fuel 7,Expanded Scale ....................................... 29
Figure 14 - Average Peroxide Number vs. Stress Time - Fuel 9,Expanded Scale ....................................... 30
APPENDICES
APPENDIX A - PANEL MEMBERSHIP AND PARTICIPATING LABORATORIES ..... A-I
APPENDIX B - REPORT ON STUDIES TO DEVELOP A TEST TO DETERMINEPOTENTIAL OF FUEL FOR HYDROPEROXIDE FORMATION ....... B-1
APPENDIX C - DETAILED RESULTS OF COOPERATIVE TEST PROGRAM 1 ...... C-I
APPENDIX D - REPORT TO CRC FROM NRL - HYDROPEROXIDE TESTS 0AT FOUR TEMPERATURES ................................ D-1
APPENDIX E - INSTRUCTIONS FOR THE SECOND COOPERATIVE TESTPROGRAM ............................................. E-1
APPENDIX F - DETAILED RESULTS OF COOPERATIVE TEST PROGRAM 2 ...... F-1
APPENDIX G - INSTRUCTIONS FOR THE THIRD COOPERATIVE TESTPROGRAM ............................................. G-1
APPENDIX H - DETAILED RESULTS OF COOPERATIVE TEST PROGRAM 3 ...... H-i
-ii- 0

1. StMARY
4n 1963 and in 1976, peroxide attack on certain engine rubber parts
was found on some Far Eastern fuels. The problem was corrected byrequiring oxidation inhibitor be added to fuels meeting SpecificationsDERD 2494 and MIL-T-5624. Because the majority of commercial aviationturbine fuel had not shown significant peroxide formation, CRC wasrequested to develop a technique which would identify thehy roperoxide-forming tendencies of jet fuels. Heating the fuel at
65 't for four weeks and measuring the peroxide number after four weeksis concluded to be an adequate Go/No Go test. A'] ' c__ ,
II. INTRODUCTION
The first instances of rubber attack by peroxides were found by theBritish in the Far East in 1962. Both neoprene and nitrile rubbercomponents hardened in high temperature regions and split onsubsequent flexing. Failures occurred after a few hundred hoursinstead of the normal 8,000 hours. Heating fuel at 1000C in thepresence of rubber and measuring peroxide content identified theproblem fuels. It was concluded that hydrogen treating had removednatural antioxidants, leading to the formation of peroxides duringfuel storage. Either the addition of antioxidants or blending thefuel with non-hydrotreated stocks prevented the problem. Rather thantry to identify and correct individual potential problem fuels,Specification DERD 2494 was changed to require the addition ofapproved oxidation inhibitors to all hydrotreated stocks.
Because the problem had not occured on hydrotreated fuels made inother parts of the world, there was reason to believe that the type orseverity of hydrotreating played a major role. It was consideredlikely that mild, low-pressure hydrotreating (sometimes called"hydrosweetening") did not destroy the natural antioxidants whilesevere, high-pressure hydrotreating might. Because the bulk of theworld's jet fuel was not severely hydrotreated and no rubber problemshad occurred, other specifications were not changed at that time.
In Spring 1976, the US Navy found cracking of rubber fuel controldiaphragms when engines were operated on certain Japanese JP-5 fuels.Specification MIL-T-5624K was amended in November 1976 to require theaddition of oxidation inhibitors to all JP-5 fuels and to JP-4 fuelscontaining hydrotreated blending stocks. This action seems to have S
0Jll
Kt - 2°*

-2-
S
prevented further such problems in US military fuels. Interestingly,the Royal Thai Air Force reported elastomer problems in 1984 withuninhibited JP-4. Reportedly, these problems disappeared after addi-tive addition and a change in elastomers.
Although the additive inclusion prevented further performanceproblems, inhibitor shortages in 1974 and later created supply diffi-culties and highlighted the need for a procedure which would identifyperoxide-forming problem fuels. As a result, the CRC Group onOxidation Stability of Jet Fuels agreed in 1980 to form the Hydro-peroxide Potential of Jet Fuels Panel to develop such a procedure. %Panel membership and participants in the three round robin programsare shown in Appendix A.
III. TEST METHOD DEVELOPMENT
A. Initial US Navy Tests
Initial test development was carried out by the Naval ResearchLaboratory who tested one Jet A and a number of JP-5 fuels at 100°C, Smeasuring hydroperoxide content by ASTM D1563. A more detailed sum-mary of this work is given in Appendix B. Based on other work*, amaximum of 1 milliequivalent per kilogram (meq/kg) was considered anacceptable level of hydroperoxide formation. The Laboratory concludedthat the test gave reasonable repeatability, distinguished betweendifferent samples and noted that antioxidants inhibited the peroxida-tion of petroleum-derived fuels, but not that of shale-derived fuels.
B. Cooperative Test Programs 1 and 2
The first test program consisted of testing duplicate samples ofseven fuels at 100*C in six laboratories. Fuel peroxide levels werechecked by ASTM D3707 after 3, 7, 24, 48, 72, 96, and 168 hours.Fuels included a severely hydrotreated JP-5 with and without antioxi-dant; JP-4 without antioxidant; a moderately treated Jet A withoutantioxidant; and a severely hydrotreated, uninhibited JP-5 made fromoil shale. ASTM D3707 was modified to use 1,1,2-trichloro-1,2,2-trifluoroethane (Freon 113) instead of carbon tetrachloride. Testresults are contained in Appendix C. Again, the agreement between
* R. H. Shertzer, "Aircraft Systems Fleet Support/Orydnic Peroxides inJP-5 Investigation," Final Report NAPC-LR-78-20, Naval AirPropulsion Center, Trenton, NJ, September 27, 1978.
% %

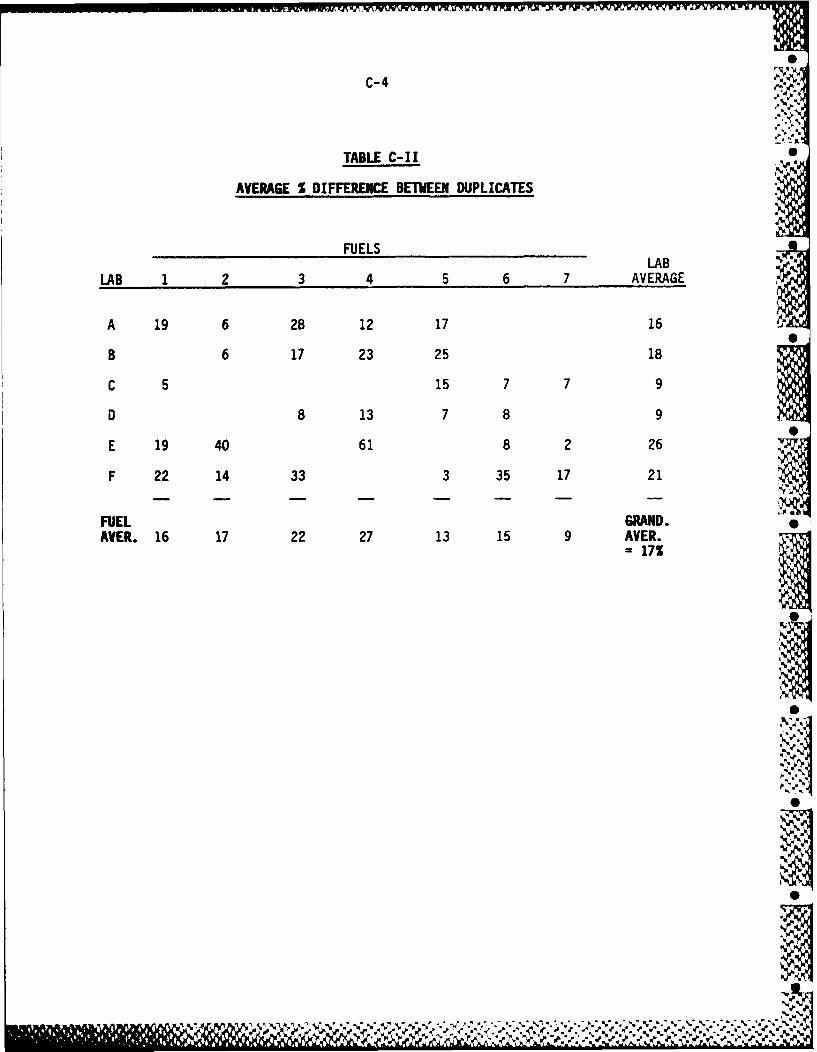
duplicate samples at the same laboratory was acceptable but large
differences were noted between laboratories on specific fuels. It was
also found that antioxidants delayed but did not inhibit peroxide
formation in two heavily hydrotreated fuels at this test temperature.
These findings encouraged the Panel to consider lower test tempera-
tures and to closely review test apparatus and possible other differ-
ences between laboratories.
To establish the temperature effect, the Naval Researach
Laboratory tested four fuels from the first program at 43, 65, and
800 C. The results are detailed in Appendix D, but data analysis
indicated that for at least two of the fuels the results at lower
temperatures could not be related to results obtained at 80 and 100°C.
High temperature results therefore may be unable to predict peroxide
formation at normal storage temperatures and another program was
proposed to run at 65C for ten weeks.
The second cooperative program included a severely treated JP-5
with and without oxidation inhibitor; a severely treated, shale-
derived inhibited JP-4; a petroleum-derived JP-4; and a moderately
treated JP-5, all to be stressed at 650C + 10C. In this program,
samples were purged with and shipped under nitrogen. Six laboratories
participated and samples were run in duplicate as before. A sample of
a stable hydroperoxide was circulated to check possible analyticalerror. All ovens were calibrated. Program instructions for the
second cooperative test program are included in Appendix E. The
results of the second program will be found in Appendix F. Unfor-
tunately, it had not been possible to obtain all the desired fuels
with the result that four of the five fuels contained oxidation
inhibitor and did not form high levels of hydroperoxide after fifty-
six days. The fuel which formed high levels of peroxide again showed
high laboratory-to-laboratory variability with more consistent results
within laboratories. It was therefore decided that the 650C test
would not serve as a quantitative predictor of peroxide levels but
could serve as a go/no-go test to identify fuels with high peroxide-
forming potential. A third program, however, with more fuels was
considered desirable to more firmly establish the test's potential.
A useful portion of the second program was the testing and analy-
sis of the stable hydroperoxide sample to establish the effect of the
analytical method on data variability. Here it was found that the
with-in laboratory spreads (the immediate repeatability based on two
sets of quadruplicates) for the calibration standard varied from 0.2
to 15.4 percent, with an average value of 6.2 percent. The corres-
ponding pooled standard deviation and repeatability values were 3.5
and 9.8 percent, respectively. The laboratory averages for peroxide
number (reproducibility) varied from 9.20 to 10.51 meq/kg, giving a
spread of 13 percent. The corresponding standard deviation was 14.6
percent and the repeatability was 41 percent. These relatively low
values indicated that the analytical method contributed only a minorcomponent to the variablity of the accelerated test results.
I.9,I

-4-
C. Cooperative Test Program 3
1. Experimental Work
The third test program was planned to enlarge on theprevious programs and to ensure that a majority of the sample fuelswould develop significant levels of peroxides (more than 1 mec,/kg).For the latter goal, fuels were selected carefully from a broaaerrange of sources and it was stipulated that they had to have beenhdrotreated and contain no anti-oxidant. Samples chosen included JP-5's, Jet A's, blending stocks and a shale JP-4. These are identifiedin Table I. Ten or fifty gallons of each fuel were obtained and 2/3gallon each was supplied to the laboratories. Each fuel was stated bythe supplier to contain no anti-oxidant. Fuels #5 and #8 werelabelled as having no additives. Fuel samples were shipped underargon but were to be aerated before putting in the oven. The plancalled for nine fuels and eight laboratories, as compared to the 5x6matrix in the second round robin, and three sample bottles of eachfuel instead of two. This was to permit improved statistical con-clusions. The instructions called for putting 400 ml samples in eachbottle so that at least 50 ml could be taken at each sampling time.Note that only one analysis per bottle was made at each time. Oneanalysis on each of three identical samples (bottles) at each time ismore useful than triplicate analyses on one bottle.
Thus, each laboratory set up twenty-seven samples instead often in Rnnd Robin 2, but the number of sampling times was six instead ',
of eight. It was intended originally to limit the time at 650C to twoor three weeks. However, screening tests at NRL indicated that alonger time was needed in order to develop more peroxides. Thus, thetime was extended to six weeks with analyses at 0, 7, 14, 21, 28 and42 days. Greater access of samples to atmospheric oxygen while in the Soven was provided in this program. A calibration sample, as describedabove for the previous program, was furnished again to check thevariability due to the analytical method alone (and also biasesbetween laboratories). The hydroperoxide level this time wasapproximately 3 instead of 10 meq/kg. Instructions and notes onprocedure were distributed to participants in a letter dated April 7,1986 (shown in Appendix G).
2. Analysis of Results
Detailed analytical results of the accelerated test programare included in Appendix H. The averages are graphed in Figures 1through 9. These results should be studied in comparison with theresults of the second round robin, which are shown in Appendix C.Note that Texaco conducted duplicate rather than triplicate bottletests and duPont omitted analysis at three weeks. It is apparent thatappreciable variation exists between bottles and between laboratories.Development of hydroperoxides in ftcls involves free radic"l reactionsamong hundreds of compounds and appears to be inherently variable.
ZN

The components of variability are discussed in the following sections.These include variability of the analytical method, variabilitybetween triplicate fuel samples within one laboratory, and variabilitybetween laboratories. In spite of such variability it appears, oncareful examination of the results, that the 650C test can distinguishbetween stable and unstable fuels in about three weeks (see 2-f below).
a. Analytical Variability
The non-stressed control sample (see 2-d below) pro-vided the primary data on variability attributable to the iodometric %analytical method. Additional information was obtained from duplicate Nfuel analyses. Such duplicate results (same bottle, same day) were .%.reported by Texaco, NIPER, and Exxon. (Repeat analyses had beenrequested whenever a set of triplicate bottles varied by more than 15 Spercent or 0.3 meq/kg in the case of results below 1 meq/kg). Theclose agreement of these 76 pairs of data supports strongly the con-clusion that the differences between bottles (see below) are real. Ananalysis of the data is as follows:
Range of differences between duplicatesa 0-40%Average difference 5.0%Pooled standard deviation of individual
valuesD 6.0%Repeatability rc 16.8%
a difference x 100 0
mean
b P.S.D. = rd where d = % difference and n
nn Zno. of pairs*
C r = 2 4-2x standard deviation
Note that differences and standard deviations must beshown on a percentage rather than an absolute basis because peroxidevalues vary with fuel and time. The agreement shown by these datarepresents the repeatability of the analytical method - as applied tojet fuels. The repeatability "r", as used by ASTM, can be calculatedfrom the standard deviation as shown above. It is defined as "thedifference between two successive test results, obtained by the sameoperator with the same apparatus under constant operating conditions .4identical test material would, in the long run, in the normal andcorrect operation of the test method, exceed the following values onlyin one case in twenty: 0.15X, where X = the average of the two testresults." The 16.8 percent above compares closely with 12.2 percentfor the control sample in this round robin, 9.8 percent in the secondround robin (see below), and 15 percent stated in ASTM Method D-3703-85 for "r".
* J. H. Youden, Statistical Methods for Chemists, Krieger Publishing
Co., Huntington, New York, 1977.
S.
Y~~~ VY'"

.,,,, .. .5-
Pratt & Whitney and Southwest Research Institute alsocarried out some repeat analyses one to four days later than theoriginals. Since the peroxide values were changing very rapidly withstress time, it is not possible to compare these paired values.However, when graphed as a function of the number of days at 650C, thePratt & Whitney data support the conclusion above that the bottledifferences do represent real differences in reaction rates betweenbottles and are not due to sampling or titration techniques. Further-more the percent spreads for repeat sets of triplicates were as greatas for the initial set. On the other hand, the Southwest Researchanalyses showed appreciable decreases as well as increases with theadditional one to three days at 650C. .*,
b. Variability of Triplicate Fuel Samples (Bottles)
Variations between triplicate bottles as expected were %significantly greater than the analytical variability. It is obviousthat bottle differences were real. These variations are shown in twoways. In Appendix H, Table H-I, variations greater than 1.5 to 1 andgreater than 3 to I are indicated by superscripts on the averages.Including cases where all three bottles were zero, and excluding a few S
cases where peroxide numbers were small and of questionable signifi-cance, 62 percent of variations were less than 1.5 to 1, 17 percentwere 1.5-3 to 1 and 13 percent were greater than 3 to 1. Table H-II '
shows the percent difference between the highest and lowest of eachset of triplicates. These vary from 0 to 302 percent of mean with anaverage of 45 percent (40 percent is equivalent to 1.5 to 1). The S
average spread between duplicate bottles in the previous round robinwas 16 percent. This was based on fewer data and is not altogethercomparable here. Triplicate variability by either method above isonly a little higher (possibly not significantly) for the high per-oxide fuels (#4-7) and slightly lower for the low fuels (#1, 2, 3, 8,and 9).
The values in Appendix H, Table H-II varied signifi-cantly between laboratories as follows (for all fuels and stresstimes):
Laboratory Mean Std. Dev.
NRL 66% 84%NAPC 68 93 e"P&W 16 21duPont 16 22Texaco 26 22NIPER 77 82SwRI 60 77Exxon 38 57
Average 45% 57%
Note: "Mean" and "Std. Dev." refer to all the values listed inTable H-II for each laboratory
- ~ V % %7~

-7-
Also the repeatability "r" (i.e., within sets oftriplicates, or within laboratories) was calculated for some represen-tative combinations of fuel and stress time where the peroxide numberswere not zero. Values obtained from the data at four weeks, forexample, varied from 20 to 461 percent of gean with an average of 209percent. Note that "r" is calculated as 212 times the pooled standarddeviation of triplicate sets, sw .
c. Variation Between Laboratories
Variations between laboratories were appreciable andgreater than the variability of triplicates. Also they were greaterthan in the second round robin, which produced much less data.Averages for each fuel, time period and laboratory are plotted inFigures 1-9. Some points or labs in the plots appear to be outliers,e.g., NAPC - fuels 2, 3, 8, 9 and Texaco - fuel 5. A rough measure ofthe interlab variability is the ratio of the highest to the lowest labusing the averages of triplicates. This ratio exceeded 10 in a numberof sets and even exceeded 100 in a few cases. In cooperative program2 the ratios were mostly in the range 3:1 to 10:1. The current dataalso show that with longer stress times and consequently higherperoxide levels the ratio did not increase. In other words therelative variation between labs was as great at low peroxide levels as id
at high levels. The reproducibility "R" for all labs was calculatedfor particular combinations of fuel and stress time. Using all fuels •at four weeks, R was 311-909 percent of mean with an average of 515 .percent. "Mean" is the mean of the eight labs for each fuel.
The data reveal that biases between laboratories doexist, ie., some laboratories fairly consistently found higher orlower peroxide than others. For example, duPont and Pratt & Whitneywere lowest in almost all cases. Texaco and NAPC were highest withfive of the fuels and NIPER with three. However, NAPC was high withthe low fuels and low with the high fuels while Texaco and NIPER werehigh with the high fuels and low with the low fuels. NAPC's highvalues at six weeks may be related to the fact that analyses at sixweeks (and "C" bottles at four weeks) were performed by a differentoperator. With fuels #6 and #7 there was a sharp division into a highgroup (Texaco, NIPER, NRL) and a low group (duPont, Pratt & Whitney,NAPC). These results correlate generally with those from the controlsample (see below).
Fuels which peroxidized readily were replotted inFigures 10-14 on an expanded scale. With fuels #5-7 the labs foundconsiderable variation in induction time. "Induction time" refers tothe time (one to four weeks here) when the production of peroxideschanged from a slow rate to a fast rate. This variable inductionperiod explains much of the variation between laboratories.
ill llil11 2 1! ll il i l 11 11'4 W 1
I I I

_%IOL1 Vr -L W Vr~jlILI .7 Xr .
-8-
d. Control Sample
As indicated above, a control sample was prepared andportions were distributed to the laboratories to obtain data on therepeatability of the analytical method used in the accelerated testprogram. The original data are listed in Appendix H, Table H-Ill,with averages and percent range added. Corresponding times forstressed samples are noted only for identification purposes. Thecontrol samples were directed to be stored in a refrigerator and nochange with time was expected and none was found except in the case ofNAPC. Here use of three different operators may have been a factor.
The percent range or spread of each set of quadrupli-cates varied from 2.0 percent to 17.0 percent with an average of 7.3percent. Compare with the average of 6.2 percent in Round Robin 2.The pooled standard deviation of individual values (s ) was 0.0905 or4.3 percent of the mean peroxide number of 2.09 meq/Ig. This agreeswell with the 6.0 percent shown above for duplicate fuel analyses.The comparable value of s in the second round robin was 3.5 percent.Repeatability "r' for Re current data then equals 2 2s = 12.2percent. The foregoing refers to "immediate repeatability . Thesevalues may be compared with the values for duplicate fuel analysesabove, which also indicate the immediate repeatability of the analy-tical method. Calculated values for non-immediate repeatability(i.e., the variation between averages at different times, as two andfour weeks, at the same laboratory) were 2.2 percent average rangeand 1.7 percent for the pooled standard deviation.*
Reproducibility (the variation between laboratories) isshown by the following data (extracted from Table H-Ill of AppendixH):
Laboratory Average Peroxide No.
NAPC (2, 6 weeks) 3.33 meq/kgSwRI 2.41NIPER 2.35NRL (25 ml) 2.31Texaco 2,14 .P&W 2.04DuPont 1.87Exxon 1.54
Grand average(excluding NAPC) 2.09
gran av X 100grand average

-9-
Statistical values calculated from the data in Table H-III, Appendix H, and corresponding values for Cooperative Program 2are shown below:
Statistic Round Robin 3 Round Robin 2
Grand average, meq/kg 2.09 9.91Spread between averages 0.87 = 42%* 1.31 = 13%*Sb** 40.6% 14.6%Reproducibility R (2 2 Sb) 115% 41%Average spread within labs 7.3% 6.2%sw 4.3% 3.5%Repeatability r (2 2 sw ) 12.2% 9.8%
* Percent of average peroxide number for all labs (2.09 and9.91 )-. W'
** Standard deviation between labs. Calculated as shown inStatistical Methods for Chemists, p. 32, J.H. Youden, KriegerPublishing Co., Huntington, N.Y., 1977
Note: NAPC data in Round Robin 3 were excluded.
Obviously the variation between laboratories is muchgreater than that within laboratories. See also the comments aboveunder interlab variation of fuel results concerning laboratories thatgave more or less consistently high or low results. The reproduci-bility R = 115 percent above is disappointingly high and is to becompared with the 41 percent found in the second round robin and the60 percent stated officially for ASTM Method D-3703. The calculationof R from sb depends on the definition of R, namely, "The differencebetween two single and independent results, obtained by different -
operators working in different laboratories on identical test materialwould, in the long run, in the normal and correct operation of thetest method, exceed the following values only in one case in twenty:R = O.60X, where X = the average of two test results." "'9.
e. Effect of Sample Size
Some observations on the control sample (Table H-Ill,Appendix H) indicated that peroxide number varies (inversely) withsample size:
I *.d' ' C ' .. 'X

-10-
Laboratory Sample Size Average Peroxide No. S
NRL 10 ml ( 8.06 g) 2.58325 ml (20.16 g) 2.31050 ml (40.3 g) 2.060
NIPER 15 g 2.47321 g 2.37023 g 2.32426 g 2.31128 g 2.31031 g 2.264
The NRL and NIPER data give a single smooth plot forP.N. vs. sample size. Other laboratories did not report sample size.Unrelated experience at NRL with peroxide determination in fuels hasshown no such effect. This effect may explain some of the differencesbetween laboratories.
f. Evaluation of Go/No-Go Test Potential
The military specification for Aviation Turbine Fuel*sets a peroxide number maximum of 1.0 meq/kg for JP-5. We thereforeexamined the Round Robin 3 data to evaluate the P.N. requirement of1.0 vs. the various test times at 650 C.
Table II lists the number of laboratori !s which
exceeded the 1.0 limit at the different test times. A high number, 7or 8, indicates agreement between laboratories with respect to failure(P.N. > 1.0). Note that Fuels #4 and #6 were rated as failing inthree weeks by all labs (7 of 7) and Fuels #5 and #7 failed on mosttests at four weeks. However, two fuels (#1 and #9) which showed goodstability at three weeks or less, were rated as fails by one lab eachat four weeks. At longer times (six weeks), additional failures wereobserved.
On the basis of the bulk of the data, Fuels 1, 2, 3, 8,and 9 can be classified as satisfactory and Fuels 4, 5, 6 and 7 ratedas unacceptable. At stress times of three or four weeks, a peroxide 'Unumber of 1.0 meq/kg is a good criterion for distinguishing the twosets of fuels. Although other values of the P.N. could be consideredto improve the distinction between good and bad fuels, a P.N. of 1.0 -is favored on the basis of elastomer tests.
• MIL-T-5624L with Amendment 2, "Turbine Fuel, Aviation, Grades JP-4and JP-5," August 10, 1983.
IIII 'l I ' l 'l I Ila1
-11-
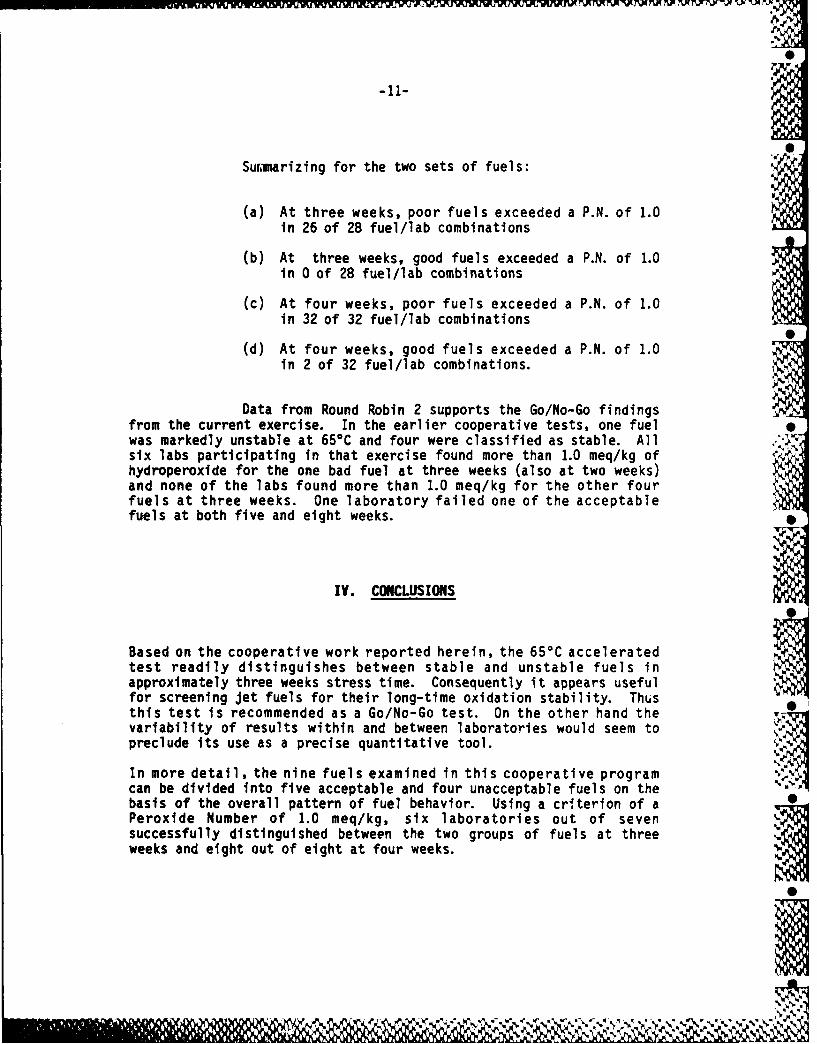
Summarizing for the two sets of fuels:
(a) At three weeks, poor fuels exceeded a P.N. of 1.0in 26 of 28 fuel/lab combinations
(b) At three weeks, good fuels exceeded a P.N. of 1.0in 0 of 28 fuel/lab combinations
(c) At four weeks, poor fuels exceeded a P.N. of 1.0in 32 of 32 fuel/lab combinations
(d) At four weeks, good fuels exceeded a P.N. of 1.0in 2 of 32 fuel/lab combinations.
Data from Round Robin 2 supports the Go/No-Go findingsfrom the current exercise. In the earlier cooperative tests, one fuelwas markedly unstable at 650C and four were classified as stable. Allsix labs participating in that exercise found more than 1.0 meq/kg ofhydroperoxide for the one bad fuel at three weeks (also at two weeks)and none of the labs found more than 1.0 meq/kg for the other fourfuels at three weeks. One laboratory failed one of the acceptablefuels at both five and eight weeks.
IV. CONCLUSIONS
Based on the cooperative work reported herein, the 65*C acceleratedtest readily distinguishes between stable and unstable fuels inapproximately three weeks stress time. Consequently it appears usefulfor screening jet fuels for their long-time oxidation stability. Thusthis test is recommended as a Go/No-Go test. On the other hand thevariability of results within and between laboratories would seem topreclude its use as a precise quantitative tool.
In more detail, the nine fuels examined in this cooperative programcan be divided into five acceptable and four unacceptable fuels on thebasis of the overall pattern of fuel behavior. Using a criterion of a--Peroxide Number of 1.0 meq/kg, six laboratories out of sevensuccessfully distinguished between the two groups of fuels at threeweeks and eight out of eight at four weeks.
I|

-12-
Data were obtained on the repeatability r (within laboratories) andreproducibility R (between laboratories) of the analytical method,ASTM D3703, applied to jet fuels by measurements on a non-heat-stressed control sample. The value for r was 12 percent of mean.This was confirmed by the corresponding value of 17 percent for 76pairs of duplicate fuel analyses. On the other hand the repeatabilityin the accelerated test between triplicate stressed fuel sampleswithin laboratories was 20-461 percent of mean in selected cases offuel and stress time. The reproducibility R between laboratories was272-909 percent of mean. Some of the latter variability was due tolaboratory bias, i.e., some laboratories were consistently high orlow. Thus the analytical variability was small while variabilitybetween identical stressed fuel samples and between laboratories wasgreat.
I

WWI -J P~YI V V -,^
AND
I

-15-
0
TABLE I
TEST FUELS
FuelNo. Type Source Hydrotreatment
1 Jet A Texaco Mildly Hydrotreated
2 Blending Shell, Thornton, UK ModeratelyStock Hydroprocessed
3 Blending Shell, Thornton, UK SeverelyStock Hydroprocessed
4 Petro-Canada, Montreal Hydrotreated
5 Shale Wright-Patterson AFB Hydrotreated
6 Jet A ESSO Petroleum Corp. HydrofinedBlending Research Division,Stock Sarnia, Ontario
7 Jet A ESSO Petroleum Corp. HydrocrackedBlending Research Division,Stock Sarnia, Ontario
8 JP-5 Exxon, Baton Rouge No Hydrotreatment
9 JP-5 Exxon, Benicia Moderately :-
Hydrotreated
XV

--- --- EM1UMW
-16-
TAML Ii
ACCELERATED TEST TIME NEEDED TO DISTINGUISH
ETWEEN STABLE AND UNSTABLE JET FUELS
No. of Labs With Peroxide NIumberGreater Than I meg/kgWeeks Stressed at 65'C
Fuel No. 1. 2 3* 4 6
3.0 0 0 1 2
2 0 0 0 03
3 0 0 0 0 0
4 2 8 7 8 8
5 0 2 6 8 8
6 2 7 788
80 0 0 0 0
9 0 0 0 13
*7 labs reported Instead of 8.
Note: Fuels #1,2,3,8,9 are classified as stable fuels and 44-7as unstable fuels. *..
F F

a.W~ w. 3 ~u-
7 z
t~~bmn~ -O -XM
" .N
0. ~ S
i Rn
4. - .
w .
x .
4)
2: 0cu CO
+)
-ON -XU

* ~ : 7jj~~'~J\.~ i~MP~ r~m7~A)\Prw b"'~' -~ - - -
"Olt
.Jl.
IX.> 0
C4
z
% A.
0. -4
% )e

-20-
ca "
0
c 0 V
0..a
0
% %

-21z
x D..
c 0a( . x .
z- z*1~ +
l~b "ON XOVE
r W~rk

-22-
E. z.
SS
c 0
4>4
S z z
% A$

x 13.
x a.
z- z t
c 0 )
zz
a. %
-24-0
x 00
X m.
C 0
z zC+
a. ,-m
L . r.z

-25-
x C)
u z z )
c 0 10. x ~D x
4.
4)
z 2
+ 0
to.tqb -ON -XOU3.
0l

-26-
NI
e- z
lz ca 1
Co
+- LL.co to U
Vqb- -O -O~
C-,

-27-
IR
,c 0.
7( . Z.
+
ccz
t~b12 *-O OMU
L~l vx

x 0.K- I0
EA
4> 0
04 Cz z+
t~bm. -ON -XOW
%z .

IIl
1 l'.. v
c U
t~bm "ON~
?^11 px I

-30-
x a-
(4 b.4
E-. Z
c 0
0
zEa
-ON -XoMo

A P PE N DI X
PANELMEMBRS'I
APPENDI A
PARTICIPATING LABORATORIES
2VV

S
A-1 j
NEMBERSHIP OF THE HYDROPEROXIDE POTENTIAL OF JET FUELS PANEL
OF THE CRC OXIDATION STABILITY OF GAS TURBINE FUELS GROUP
Name Affiliation
J. M. HALL Geo-Centers, Inc.S
W. G. DUKEK Consultant (Retired from Exxon)
C. P. HENRY E. I. du Pont de Nemours & Co.
R. E. HILEMAN Texaco, Inc.0
R. W. MORRIS Air Force AeroPropulsion Labs
K. H. STRAUSS Consultant
W. A. SUTTON Ashland Oil Company
L. C. TURNER Naval Air Propulsion Center
P. A. WARNER Pratt & Whitney Aircraft
I, % -r

A-2
PARTICIPATING LABORATORIES
Cooperative Program 1
Naval Air Propulsion Laboratory Clarence Nowack
Naval Research Laboratory Robert Hazlett
Southwest Research Institute John Goetzinger
Texaco Inc. Mike Caggiano
Wright-Patterson Air Force Base Tim Dues,Robert Morris
Cooperative Program 2
E. I. duPont de Nemours Tayman Phillips
Naval Research Laboratory Jim Hall
Naval Air Propulsion Center Linda Craig
Pratt & Whitney Aircraft Linda Neubauer,Paul Warner
Texaco Inc. Salvatore Rand
Southwest Research Institute Pat Cuellar
Cooperative Progrm 3
E. I. duPont de Nemours & Co. Tayman Phillips
Exxon Research & Engineering Co. William Taylor
Naval Research Laboratory Jim Hall
Naval Air Propulsion Center Lynda Turner
National Institute for Petroleum John Goetzingerand Energy Research
Pratt & Whitney Aircraft Linda NeubauerPaul Warner
Southwest Research Institute Pat Cuellar
Texaco Inc. Salvatore Rand
,Jk'=

.1I
IAPPENDIX B
REPORT ON STUDIES TO DEVELOP A TEST TO DETERM1INE
POTENTIAL OF FUEL FOR HYDROPEOXDE FORMATION.
0"%,
I, ,,-. _':
.,W,' i
S M •"

B-1 - *
COORDINATING RESEARCH COUNCIL -1'GROUP ON OXIDATION STABILITY OF GAS TURBINE FUELS
May 1, 1981 0
R. N. Hazlett and J. M. HallNaval Research LaboratoryWashington, D. C. 20375
Studies to Develoo a Test to Determine the Potential of a Fuel Sfor Hydroperoxide Formation
The test described is based on experience at Rolls-Roycein the 1960's and made available to the Group by Mr. Arthur Peat.
A jet fuel sample of 250 ml was placed in a clean, brown 0borosilicate bottle (500 ml). The capped bottle was placed inan explosion-proof oven controlled at 1000C. The bottle wasremoved periodically from the oven, cooled, and sampled foranalysis. Hydroperoxide content was determined by ASTM MethodD1563.
Repeatability - Several samples have been stressed induplicate or triplicate. Both new and used bottles have beenutilized but no bias has been observed. Triplicate tests fora Shale-1I JP-5 are presented in Figure 1. The three testsare quite comparable particularly during the buildup period(0-5 days). It is noteworthy that this sample, even though itcontained a hindered phenol antioxidant, attained high concen-trations of hydroperoxide. Further, the peroxide number droppedsharply after reaching maxima in 5 to 10 days.
Three tests with a Jet A (Exxon) are depicted in Figure 2.Again the tests gave very good repeatability. Note the scaledifference for this figure. The peroxide numbers rose rapidlyin the first two days but peaked at values well below one. Thisfuel had been hydrotreated but contained no antioxidant.
JP-5 Tests - Nine current production JP-5's were stressedat 1000C. The results for three of the fuels are graphed inFigure 3. All other samples fell within the range shown. Fourfuels gave patterns very similar to the upper curve and fourothers mimicked the lower curve. The maximum peroxide numbersfor these fuels, all of which contained antioxidant, were wellunder one.
Shale-II JP-5 Comparisons - Several samples obtained duringthe Shale-Il refining operation at Sohio were peroxidized. Whereasthe repeatability for any one sample was good, similar samplestaken at different times exhibited markedly different behavior.Figure 4 illustrates this for four samples, two containing anti-oxidant and two free of antioxidant. The four samples peroxidized
%'% *w V 16"1.1 I-
111 11 W

B-2_
in unique patterns. The antioxidant appears to moderate hvdro-peroxide formation but the P.N. reached a maximum of60fo nsampic with A.0. A fifth JP-5 sample from the Shale-I: refininggave I?.N.'S as high as 40 (Figure 1.).
Shale-Il Diesel Fuel Marine (DFM) Comoarisons - The Sohio
shale DFM was also subjected to stress at 100*C. The repeat-ability for one sample is shown in Figure S. P.N.'s for three
ability is good but different samples exhibit great variability.
Antioxidant is not a sure control of peroxidation.
Conclusions - The test described gives reasonable repeat-ability.urther, the test readily distinguishes between differentsamples. Petroleum derived JP-5's containing antioxidant peroxidizeonly slightly. Shale-11 fuels (JP-5 and DFM) peroxidize readilyand antioxidants are ineffective in controlling the behavior ofthese fuels.
AttachmentsFigures 1 through 6
'e
2"
III, 1 0 -L.

~PA M.t~ L'~ M ~' ~ 'X L~-v ~L'ncWvP'xY'JWV W~ WV WVW~ V~V.. ~ -VI0
B-3
Fig. ~ PEROXIDATION CF A SHALE II
* JP-5 SAMPLE IN TRIPLICATE I0I0
/ \
:0 1 \ I/ 0I
* U
I S '5-.
1/a 1/3 5
~- 0:~fl-I
- iiii S
w - If0~ I'is
I'iii
*)**~ *,.
III SIIt
~ "VIII
.5, I:~i-
DAYS AT 100 dec. C~kt
~ E~

B-4
Fig. 2. PEROXIDATION OF EXXON HYOROTREATED
i - JET A w/o ANTIOXIDANT
LLS
>4.
I 0
0.1 4f
mS
DAYS T 100deg.

B-5
Fig. 3. PEROXIDATION OF 3
PETROLEUM JP-5's
T
TU
C:,
C-P
DAYS AT 100 deg.
-del

B-6
Fig. 4. PEROXIDATiON OF 4 JP-5's
FROM SHALE i!I
n-o A. CIM
IZ I
A. C.
.0
(.1LUL
Tw/7 A
1',07
0. w/A. 0.
DAYS AT 100 deg. C•

B- 7
Fig.5. EROXIDATION OF A SHALE II100 e- 7OFM SAMPLE IN TRIPLICATE
A. 0. pr.eerit
T.
*1o
10D
II
DAY AT 10 eg

B-8
Fig. 6. PEROXIDATION OF 3
DFM SAMPLES FROM SHALE II
100,
1 //.0101S /T10dg

AP EN I C .
DETALED ESUTS O COPERAIVE ESTPRO6AM0
.% 'u
S,,,%
.4'L

c- 1
TABLE C-1
RESULTS OF COOPERATIVE TEST PROGRAM
PEROXIDE NUMBER, MEQ/KG
HOURS AT 1000CLAB 3 7 24 48 72 96 168
FUEL #1 -J22 (Shale) (JP-5) (with A.0.)
WPAFB .16 .20 2.09 3.18 12.69 3.98 1.30---- 3.43 3.09 12.06 3.34 1.05
P & w .89 1.13 1.82 2.87 3.89 6.42 13.20.85 1.07 1.91 2.72 3.68 6.70 13.83
SWRI .70 .75 1.48 2.19 3.82 8.12 5.62.71 .64 1.64 2.42 4.74 7.98 3.25eA
NRL .83 1.06 2.54 8.48 24.82 23.23 1.16.87 1.03 2.78 9.73 21.78 15.80 .62
FUEL 12 - JP-5 (no A.O.)
WPAFB 0 .19 3.99 2.96 18.50 23.60 16.35---- 3.87 2.95 14.85 22.98 16.45
NAPC 1.30 5.97 21.89 32.93 49.26 42.48 49.941.46 6.29 22.83 34.45 48.32 46.75 136.07
SwRI .004 .09 4.07 15.23 29.47 -- 60.42.006 .51 8.15 9.40 19.76 32.14 65.70
NRL 1.86 5.48 22.55 45.55 59.92 67.01 60.501.36 5.56 26.63 50.44 73.55 76.85 57.51
FUEL #3 - JP-5 (with A.0)
WPAFB -- .25 .70 3.24 3.19 .52 .20.40 .24 1.29 2.96 2.87 .66 .36
NAPC 0 0 .23 2.02 24.97 54.38 57.860 0 .21 2.41 27.44 45.07 69.98
TEXACO -- 0 .10 .26 .46 1.00 23.59-- 0 .08 .26 .48 .94 25.31
NRL 0 0 0 .26 .57 1.62 42.880 0 0 .31 .98 2.99 43.12

C-2
TABLE C- I(Contin ued)
PEROXIDE NUMBER, MEQ/KG
HOURS AT 1000CLAB 3 7 24 48 72 96 168
FUEL #4 - JET A (no A.0.)
WPAFB .21 .21 .57 3.10 3.10 2.82 12.62-- .20 .59 3.29 2.84 1.81 13.07
NAPC 0 0 .12 5.19 18.54 21.51 37.44O 0 .14 5.51 24.33 18.23 58.78
TEXACO -- 0 0 .31 1.03 5.39 25.66-- 0 0 .28 1.27 6.33 27.04
SwRI .002 0 .03 .11 .68 3.13 11.77.01 0 .02 .05 .30 1.07 13.45
WPAFB .53 .40 .41 .06 -- .20 .51.49 .49 .34 .01 -- .21 .71
NAPC 0 0 .32 .61 .45 .30 .26O 0 .32 .47 .28 .39 .33
TEXACO -- .25 .21 .51 .54 .56 .50-- .25 .24 .44 .52 .55 .55
Paw .11 .10 .21 .31 .50 .89 1.48.13 .18 .25 .45 .57 .93 1.56
NRL .02 .09 .22 .23 .22 .26 .21.11 .10 .22 .23 .22 .25 .22
FUEL #6 - JIP-5 IA (with A.0.)
TEXACO -- 0 0 .30 .86 2.32 30.33-- 0 0 .33 .79 2.15 28.44
PAW 0 0 .09 .30 .51 1.93 4.530 0 .17 .34 .55 1.98 4.72
SWRI .02 0 .03 .10 .26 .86 32.400 0 .03 .10 .20 .84 30.97
NRL 0 0 0 .64 2.88 16.55 44.000 0 0 .42 1.50 12.11 45.86
ME611 m

v~mlf U ]Ll A, P I 7V~ x~ l) -XTlulKFXI II-IIVr ;- O rw,.% *I'
C- 3
TABLE C-I(Continued)
PEROXIDE NUMBER, MEQ/KG
HOURS AT 100 0CLAB 3 7 24 48 72 96 168
FUEL V 7 JP-5 18 (no A.0.)
P&W .13 .21 6.40 12.96 21.15 22.84 24.92.10 .13 5.90 13.76 19.13 24.75 26.06
SWRI .02 .23 9.08 17.82 23.00 40.04 53.88.04 .24 9.01 17.80 22.65 39.18 54.03
NRL 1.50 6.27 27.27 44.78 68.23 73.67 55.821.30 5.57 21.61 35.41 55.82 59.18 51.65
So
I 1%S
C- 4
TABLE C-11
AVERAGE % DIFFERENCE BETWEEN DUPLICATES
FUELSLAB
LAB 1 2 3 4 5 6 7 AVERAGE
A 19 6 28 12 17 160
B 6 17 23 25 18
C 5 15 7 7 9
D 8 13 7 8 9
E 19 40 61 8 2 26
F 22 14 33 3 35 17 21
FUEL GRAND.AVER. 16 17 22 27 13 15 9 AVER.
=17%
I4v% No % % e -

A P PEN D IX D
REPORT TO CRCWYDOPEROX IDE TESTS AT FOUR TEMPERATURES
D-1 APPENDIX D
6180-444:RNH:cak
April 27, 1983
MEOADUM4
To: CRC Panel and Test Participants on Jet Fuel HydroperoxidePotential
From: Chairman
NRL has completed testing of four jet fuels for hydroperoxidepotential at four temperatures (Encl. (1)). We are proposing anew test program for the CRC Panel to be conducted at a lowertemperature than the 100 0C used in the 1982 cooperative program.The proposed program will be discussed at the Panel meeting in
-,Dayton, Ohio, May 9, 1:00 p.m.
Please consider offering fuel samples for the cooperative testsand proposing suggestions for improving the 1982 testing.
R.* N.' aZt
Encl: NRL Test Results
I'.I

0-2
REPORT TO CRC
NRL HldroeroxdU Tests .at FQ._= Teme ratur
At the meeting of the CRC Hydroperoxide-Potential-of-Jet-
Fuels Panel on April 19, 1982 a plan to develop an accelerated
test by means of a cooperative test program was adopted. This
program was completed last year. Results were collected and
analyzed by NRL and reported to the CRC and the participants S
and also the Middle Distillate Fuel Stability Conference held at
NRL October 27-28, 1982. In this program, seven jet fuels were
stressed at 1000C for periods up to one week at six laboratories.
At the October 27 meeting of the Hydroperoxide Panel, validity of
the test temperature was discussed. To define the test
temperature effect, NRL agreed to repeat the prior tests at lower
temperatures, viz., 43o, 650 and 800, using four of the same
fuels. Storage times selected for the lower temperatures were
selected in an attempt to find ones equivalent to the times used
at 1000C (3,7,24,48,72,96 and 168 hours)..
These tests were completed recently and are reported
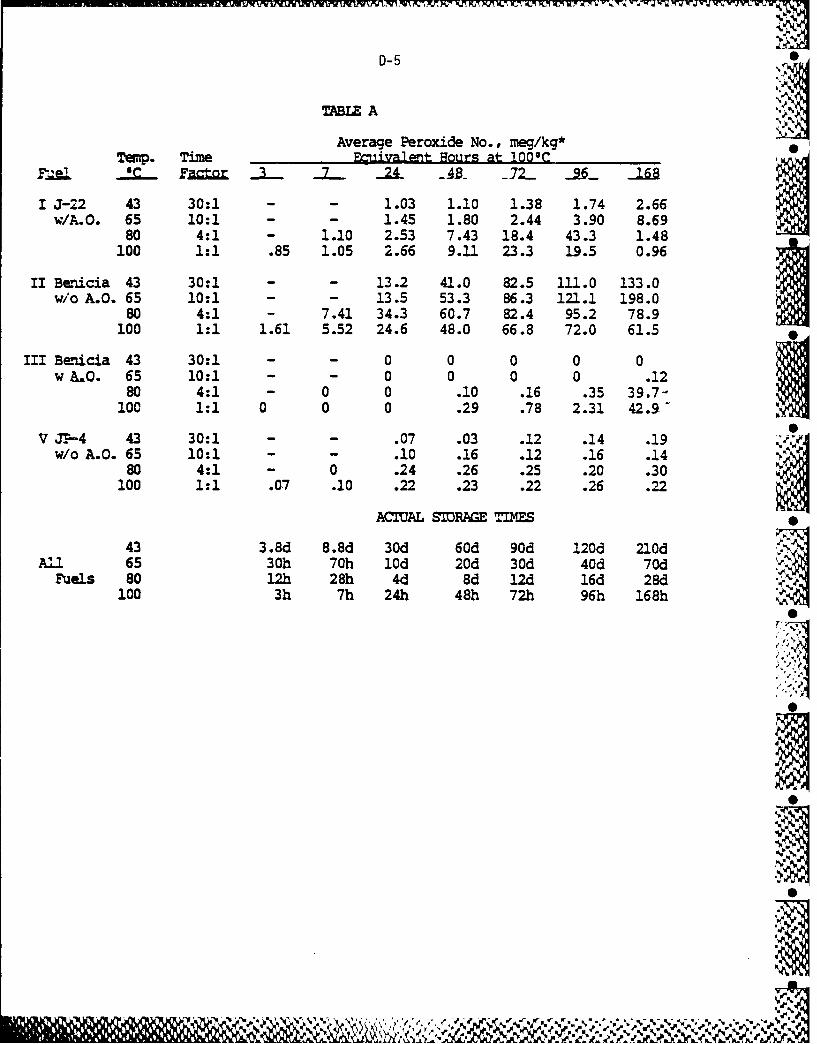
herewith. See Table A and Figures 1-5. The 1000C data were taken
from the previous report. The time periods used were calculated
according to the Arrhenius relation, namely doubling (or
halving) of reaction rate for a 10*C change of temperature,-and
were then modified somewhat based on experience. Thus time
factors of 30:1 and 10:1 were used for 430 and 650 tests instead
of the calculated values of 52:1 and 11.3:1. Note that columns
in the Table and horizontal scales of the graphs are labeled
Enclosure(1

D-3 •
"equivalent hours at 100*C". The actual storage times at the
several temperatures are shown at the end of the data table.
Note also that the vertical scale of the several semi-log plots
varies by two orders of magnitude. A linear plot for one fuel is
also included.
The graphs reveal appreciable variation in peroxide number
as a function of time, temperature and fuel. In the case of two
fuels - Exxon Benicia JP-5 w/o AO and JP-4 w/o AO - there was
fair agreement between the several temperatures based on
equivalent time periods. Also, in at least two cases out of the
four (Benicia JP-5 w/AO and JP-4 w/o AO), peroxide level at all
times was lower at the lower tempertures. With two fuels out of
four, results at the lower test temperatures were quite different
from results at the higher temperatures - and hence not
predictable from the latter. Thus, accelerated fuel stability
tests at 800C or 1000C may not be useful guides to storage
stability at ordinary temperatures. This leads to a proposal to
repeat the 1000 round robin at a lower temperature.
Therefore, NRL proposes a follow-on cooperative test program
with storage at 65' for a period of 10 weeks or 70 days. It is
expected that there will be 5 fuels and 7 laboratories. The •
following have agreed to participate: NRL, WPAFB, P&WA, NAPC,
SWRI, Texaco and duPont. More attention will be paid to various '.
details to improve accuracy and precision. Ten gallons cf each •
fuel instead of five will be procured in order to rinse the
sample cans more thoroughly. Degree of exposure to the
% %-

D-4 A
atmosphere may need controlling. Also container cleaning
procedure may need to be tightened and oven thermometers must be
calibrated. Another aid to improved precision could be a
practice session for each analyst before starting the program but
using a fuel other than one of the test fuels.
9'
James M. Hall
Robert Nte t
0"-
D-5
TABLE A
Average Peroxide No., meg/kg*Tmp. Time Pm-livalant Rours at 100C
11C F__ __ r 3 7 _24 AB- _22- __96 -10
I J-22 43 30:1 - - 1.03 1.10 1.38 1.74 2.66w/A.O. 65 10:1 - - 1.45 1.80 2.44 3.90 8.69
80 4:1 - 1.10 2.53 7.43 18.4 43.3 1.48100 1:1 .85 1.05 2.66 9.11 23.3 19.5 0.96
II Benicia 43 30:1 - - 13.2 41.0 82.5 111.0 133.0w/o A.O. 65 10:1 - - 13.5 53.3 86.3 121.1 198.0
80 4:1 - 7.41 34.3 60.7 82.4 95.2 78.9100 1:1 1.61 5.52 24.6 48.0 66.8 72.0 61.5
III Benicia 43 30:1 - - 0 0 0 0 0w .0. 65 10:1 - - 0 0 0 0 .12
80 4:1 - 0 0 .10 .16 .35 39.7-100 1:1 0 0 0 .29 .78 2.31 42.9 0
V JP--4 43 30:1 - - .07 .03 .12 .14 .19w/o A.O. 65 10:1 - - .10 .16 .12 .16 .14-N
80 4:1 - 0 .24 .26 .25 .20 .30100 1:1 .07 .10 .22 .23 .22 .26 .22
ACTUAL SIORAGE TI MES
43 3.8d 8.8d 30d 60d 90d 120d 210dAll 65 30h 70h 10d 20d 30d 40d 70d
Fuels 80 12h 28h 4d 8d 12d 16d 28d100 3h 7h 24h 48h 72h 96h 168h
I
A -4

8 ~FIGURE D-1__ -
7
J22 WITH ANTIOXIDANT_________
4_ _ _ ------- ~
11G I
ii 0
0-------
Equvaen Hours at 1000C.
~ ilO ... _

87 FIGURE D-2- - -.
6.. -. . ~BENICIA JP-5 WITHOUT ANTIOXIDANT________-
3 t . . ._ _ _ . . .. . . . . .Ii.1 _ _00_ V . > .
9_________' - . . . ______ _____________ v. -
- I 7:7777--I..~.7
0 17 24.4 - -- .--- 72 .. I 1-. . 68 ~ .i i
.......................... t Hor at 1000C
-~~ . -~~-I.~ %.4 . -

- D- 8
BENICIA JP-5 WITHOUT ANTIOXIDANT
180 - -(Linear Plot)_ _-
140
00:1:__ _____-
- -. K -.- - ~ -- W
-t - - 7-
120:.: - , -
160~~I A~-__
~- - Y - -
-~ - : - j~~777 .- L- _
-----
140
- __ ---- I-f--8 %771:k-
C, w tIIAJJ
a ---------1:::Ba s at y8~O: -:-- -------- 29
a ~ - - ----

8. . ~~~FIGURE D-4 ---.-----.
f. BENICIA JP-5 WITH ANTIOXIDANT
5--
_____________________-- -. ----1000C
- ___ ___ _ __ _ __ 800C
Ir.
10
3K12. .
_.1 '7___ ---------- -- --
Equivalent Hor at 1006C_

D-10
_______FIGURE 0-5._____________ WITH ANTIOXIDANT d
6 r-J -
3. %-~
2 ~ v -__ _ _ _ _ _ _ ___
al. .
,do 1.0-
- - - - - -- - - - - - - - - - - - - - -
2 _ _ _ _ _ _ _ _ _ _ r_ _ _ _ _ _.
-I - - - - -
- -- ~ . . .. . . . . -- - -) - - - - - -
-~1 --- 011C-
~ 1. _ _ _ _ _ _ _ _ _ _ _ _ _ _ _ _ _ _ _ _ _ _ _ _ _ _ _ _ _ _ _43 _C
0.1
0. Oil -- - -- -.. - 4 - 6
Equialen Hous at100"
-4--- V"4," -w V, - - _ _

0
1%,
0
'1,p.
9---
r..
APPENDIX E4-
INSTRUCTIONS FOR THE SECOND COOPERATIVE TEST PROGRAMS
I0
I0
.~ 's]
V-. '%.*~I
S
I

E-1
DEPARTMENT OF THE NAVY
NAVAL RESEARCH LABORATORY
WASHINGTON. O.C. Z037S IN REPLY REFER TO,
6180-744:JMH:cakOctober 19, 1983
To: Participants in the Second CRC Cooperative Test Program onHydroperoxide Potential of Jet Fuels S
From: J. M. Hall and R. N. Hazlett, Chemistry Division, Code6180, Naval Research Laboratory, Washington, D. C. 20375
Introduction
At the CRC meeting May 9, 1983 at Dayton, Ohio, it was
proposed to tht Hydroperoxide-Potential-of-Jet-Fuels Panel that a
second cooperative test program be conducted. The proposed
program would be an accelerated test based on 659C rather than
the 1009C previously used. Possible sources of error and
measures to reduce variability of results were discussed. Such S
sources are thought to include trace contamination, oxygen level,
and oven temperature control. This program is scheduled for
January next year to avoid shipment of samples during hot S
weather. The following outlines the proposed plan and procedures
to reduce the excessive variability of results found in the 1982
program. The precautions and extra care noted below will
occasion additional work but they are necessary for a successful
outcome.
Under the auspices of the CRC Panel on Hydroperoxide Poten-
tial of Jet Fuel, a cooperative test program was carried out by 6
laboratories in summer 1982 to develop an accelerated test fcr
hydroperoxide potential. Seven samples of different jet fuels
distributed to each participating laboratory were stored at
U...

E- 2
1001C for 168 hours with portions removed at intervals for hydro-
peroxide analysis. As you know, results were not altogether
acceptable. In many cases there were very wide variations in
peroxide number between laboratories for a particular fuel and
time. The agreement between duplicate bottles, i.e., the "within
laboratorym variation, was reasonably good, averaging 17%.
However, the range was 2-61% and 20% of the results showed a N
difference between duplicate bottles of more than 25%. The 17%
average difference between bottles is three times as high as the
average difference between duplicate analyses as experienced at
NRL.
NRL then conducted similar tests on four of the fuels at
43, 654 and 80C. Periods equivalent to those used at 100 0 C
were calculated based on che Arrhenius law (reaction rates
doubled or halved per 100C difference) with minor adjustment
based on experience. With two fuels there was fair agreement
between the four temperatures based on equivalenL time periods.
In the case of the other two fuels, which contained anti-oxidant,
namely, Shale J-22 and Benicia, there was wide divergence. Thus
it appears that an accelerated test at 100 0C or 80CC may not be
predictive of behavior at lower temperatures, including ordinary
fuel storage conditions.
Proposed Test Plan 0
The Plan follows closely the prior 1982 test plan but with
the addition of procedural improvements to reduce variability of 0
the results. .
L1%

E-3
1. Test Fuels
SalSounrce Hydrotreatment a iidn
1. Benicia JP-5 Exxon Severe No
2. Benicia JP-5 Exxon Severe Yes
3. Shale JP-4 Air Force Severe No(Caribou)
4. Shale JP-4 Air Force Severe Yes(Caribou) S
5. Jet A Suntech Moderate No
These fuels will be shipped tc NRL in 10-gallon amounts to
permit more thorough rinsing of containers. NRL will transfer
samples to clean one-gallon epoxy-lined cans and ship under
nitrogen to the participants. Each laboratory will test g=
fuel in duplicate.
Oxygen content plays a role in the development of hydro-
peroxides in stored fuels. To standardize this factor, fuels
will be purged with nitrogen and shipped under nitrogen. Each
laboratory should then saturate all fuels with air just before
starting stress testing. (Note this in report). Aerate by
bubbling air through samples in the 500 ml bottles for 5 minutes
at a moderate rate. In addition, at each sampling time leave cap %
off bottle for 15-30 minutes to permit replenishment of air.
Fuel samples should be stored at 30-40OF from time of
receipt until beginning of storage.
I

E-4
2. Participating Laboratories
NRL R. N. Hazlett & J. M. Hall
WPAPB Bob Morris
NAPC Lynda Craig
SWRI Charles Rodriguez
P & W (Florida) Bill Purvis
Texaco M. A. Caggiano
Dupont Cy Henry
3. s _- Stress fuels at 650C ± 10C
4. Sampling Times - 0 hour, 24 hr, 72 hr, 168 hr; 14, 21,
35 and 56 days
While pipets are convenient for transferring to the "t
titration flask, each sample must be weighed. The
amount of sample taken should be adjusted to the level
of peroxides starting with 25-50 g. If a delay before
analysis is unavoidable, store weighed samples in &
refrigerator temporarily.
5. S - Place 400 ml of each fuel in each of two 500
ml sample bottles. Aerate before starting and at each
sampling time as described above.
6. Special Calibration Samples -As a check on interlabora-4-n
tuy analytical bias or systematic error, a special fuel
sample containing about 3 meq/kg of a stable hydro- ,
peroxide (e.g., t-butyl hydroperoxide) will be supplied.
Keep in refrigerator except when sampling. This sample
-~ *% .-.-*-

E-5 50
should be run in quadruplicate and all results reported.
This is designed to provide valuable data on labora-
tories' biases using an unchanging sample. It is recom-
mended that this be done to coincide with the 14 day
sampling time. Please report how this was done. If
possible, do a second set of quadruplicate analyses at
the 35 day sampling time.
7. Sample Rottles - 500 ml brown borosilicate bottles with
caps with Teflon liners. Recommended source: Wheaton
Scientific Co., 1000 North Tenth Street, Millville, N.J.
08332, (609) 825-1400, catalog No. 2196U9 Type 500, 24
bott±es per case, w/o caps. Caps #240480, size 33-430, p
100 per case. The above are also available from PGC
Scientific, 9161 Industrial Court, Gaithersburg, MD
20760, (301)840-1111 or American Scientific Products,
8855 McGaw Road, Columbia, Md. 21045, (301)997-3400. If
brown bottles a~e not used, wrap with foil.
Clean bottles and caps before use as directed below.
8. Oven - An explosion-proof oven with forced air circula- N_
tion is recommended. State type of oven used in report.
Thermometers and/or thermocouples (use at least two)
must be iibrat.jl In case a forced draft oven is not
used, check temperature further by monitoring a bottle
of water or fuel appropriately placed in oven. On
removing bottles from oven for sampling, cool them,
e.g., in a hood draft or water bath, before opening. %
% %

E-6
9. Analyss- By ASTM D3703 except for the substitution of
Freon 113 (ll,2-trichlorotrifluoroethane) for carbon
tetrachloride. Source: Miller-Stephenson, Inc. or
Burdick and Jackson Laboratories, Inc. (Note that in
NRL experience the use of Freon 113 in lieu of CClI
causes results to be 5-20% lower with fuels.) For fur-
ther information see "The Determination of Organic .4'..
Peroxides" by Johnson and Siddiqi, Pergamon Press 1970. 0
Normally 500 ml Erlenmeyer flasks are more con- .-
venient for titrptions than 250 ml flasks.
l- I -inalyst, especially if unfamiliar with the
analytical procedure, should practice on an in-house jet
fuel before starting samples i.. the oven. The impor-
tance of such prpctice cannot be overemphasized. (To
provide a fuel with an elevated P. N., heat a suscep-
tible fuel or add a hydroperoxide.)
Observe the precautions noted in D3703. Reagents 0
must be free of peroxides and dissolved oxygen. Boil *4.4;
the water used for dilution and for preparing the KI
solution. Store the KI solution under chloroform or
blanket with nitrogen. Prepare fresh often. Note: KI
from some sources is unsuitable for iodometry. Run iiblanks before starting the program and at least occasio-
nally during it. Use fresh NaSO,. -. ,
,%' .%. .Maximum cleanliness and precautions against contam-
ination should be observed throughout. Clean all glass-
Ile-
A-
A,. )L?444''

E- 7/v'v
ware scrupulously, especially the sample bottles and0
caps. Bottle and cap cleaning is described below. Do
not use strong cleaning agents such as chromic acid.
(a) Fill bottle with high strength solution of labora-
tory detergent (Alconox made by Alconox Inc., NY,
NY 10003 has been found suitable) in tap water,
replace closure and allow to soak for at least 10
minutes.
(b) Vigorously scrub all bottle and closure surfaces g
with detergent solution. -
(c) Repeatedly rinse bottle and closure with hot tap
water until last tendency toward foam formation has
disappeared.
(d) Generously wet closure and allow to soak for at
least 10 minutes.
(e) Add hot tap Water and repeat scrubbing and rinsing
procedure until foaming tendency disappears.
f) Rinse twice more with hot tap water.
(g) Fill with distilled water and let stand 1 hour. 5
(h) Rinse twice more with distilled water. ,
(i) Fill with acetone and let stand 1 hour.
(j) Rinse twice more with acetone. _
(k) Rinse twice with toluene. .% %
(1) Oven dry the bottle and closure separately at
120QC.
%

E-8
Cm) After cooling, replace cloure and store in clean
laboratory until start of test.
(n) One or two days before start of test, fill bottle
with fuel to be tested, close, shake thoroughly and
let stand at least overnight.
(o) Rinse twice with test fuel immediately before add-
ing 400 ml sample to bottle at start of stress.
Calculate peroxide number as milliequivalents of
active oxygen per kilogram of sample (equal to 1/8 the
P. N. in ppm as calculated by D3703). Report all
results, not just averages. This is necessary for
statistical evaluation. Do not round off data. Do not
discard an analytical result solely because it seems to
differ too much from the duplicate bottle or from the
expected value. Tn case results for any pai- of dupli-
cate bottles differ by more than 15-20%. gepeat both
analyses and report all four results.
Randonmize procedure whereever possible. For
example, at the several sampling times vary the order of
analyzing fuels and duplicate bottles. Avoid running
duplicate bottles in succession.
Send results to Panel Chairman.
10. Miscellaneous - Report any unusual observations.
11. h - Some monitoring of acid number and also
sediment formation is desirable. Fluorosilicone O-rings
I,. -• 1/,.

E-9
used in aircraft fuel systems are subject to deteriora-
tion by acids. Volunteers are hereby solicited for one
or both analyses. Procedures: (a) Acid No. ASTM D3242,
650C, 21 and 56 days, 2 bottles, separate from peroxide
tests; (b) Sediment Formation - procedure to be supplied
by NRL, 656C, 56 days, 2 bottles, 1 test each. ". ' -
It is also desirable in this program to obtain
peroxide data at temperatures other than 650C. Again, S
volunteers please. This would involve duplicating the
659 tests at 431, 800 and 1000C. Sampling times would
be the 61' values times the factors 4, 1/3 and 1/10
respectively. V
R. N. Baz J. M. HallCombustion & Fuels Branch Combustion & Fuels BranchChemistry Diviaion Chemistry Division

S
S
l~5~~
I'S1~1
5)~
S
APPENDIX F S
DETAILED RESULTS OF COOPERATIVE TEST PROGRAM 2S
~1I
,p~.
SI
US
*C~~%s.Jkst~..

F-I
*DEPARTMENT OF THE NAVYNAVAL RESEARCH LABORATORY
WASHINGTON. D.C. 20375 IN REPLY REFER TO:
6180-l084:JMH:cem 029 October 1984
From: R.N. Hazlett, Chairman, CRC Hydroperoxide-Potential-of-Jet-Fuels Panel
To: Participants in the Second CRC Cooperative Test Program onHydroperoxide Potential of Jet Fuels(DISTRIBUTION LIST ATTACHED)
Subj: RESULTS OF SECOND COOPERATIVE TEST PROGRAM
Enc!: (1) Two copies of subject report(2) Distribution List
Enclosed is a compilation of results for the recentlycompleted Round Robin II on jet fuel hydroperoxide potential.I wish to extend thanks to you and your organizations for your 0.efforts in carrying out this work. Hopefully, it will lead to animproved method for evaluating fuels of the future.
In addition, on behalf of the Hydroperoxide Panel, I wish tothank Bill Dukek and Bob Morris for supplying fuel samples.
Due to my imminent departure for a year's assignment inAustralia, I have resigned as chairman of the CRC HydroperoxidePanel. The succeeding chairman will be named by Bill Taylor ofExxon R&E Co.
If you have any questions on the enclosed results, pleasecall Jim Hall at 202/767-2673.
I.!e
\J /- LI
ROBERT N. HAZLETTDENNIS HARDY, Acting HeadFuels SectionCombustion & Fuels BranchChemistry Division
,
0-
S7
%~' *

F-2
r DEPARTMENT OF THE NAVY
NAVAL RESEARCH LABORATORY
WASHINGTON. O.C. Z0375 -5000 IN IMPLY NEF90 TO,
6180-616-DRH:cem12 June 1985
From: Dennis Hardy, Fuels Section, Chemistry Division,Naval Research Laboratory
To: Participants in the Second CRC Ccoperative Test Program onHydroperoxide Potential of Jet Fuels
Subj: Correction to "Results of the Test Program", dated V5 October 1984 and distributed to participants 29 October1984
Paragraph "4a" on page 1 is in error. It should read:"Variability of the analytical procedure is shown by the 10 casesof duplicated analyses (1 case each in Fuels 2 and 4 and 8 casesin Fuel 3). The average percent difference between duplicateanalyses was 13% and the range was 1-50%. Individual values were14 (Fuel 2), 2, 45, 42, 5, 21, 1, 3, 3and 17% (Fuel 4) for thefirst sample and 4 (Fuel 2), 7, 50, 7, 1, 18, 2, 1, 1 and 7% (Fuel4) for the second sample." The underlined values are the changesor additions.
Also the value "00.0" shown in Table 3, Fuel 3 for P&W at 56days should be 100.0 and the value ".3" for Tex at 3 days shouldbe .36.
If you have any questions, please call James Hall at202/767-2673.
DEM S HARDY, Acting eadFuels SectionCombustion & Fuels BranchChemistry Division,24
N 2V

F-3
6180-1084A:JMH:cem
5 October 1984
Subj: RESULTS OF THE SECOND CRC COOPERATIVE TEST PROGRAM ONHYDROPEROXIDE POTENTIAL OF JET FUELS
i. The second cooperative hydroperoxide test program was carriedout under CRC auspices to investigate further the development ofan accelerated test for hydroperoxid, potential of jet fuels usingfor analysis ASTM D3703-78 ("Standard Test Method For PeroxideNumber of Aviation Turbine Fuels"). This work is of interestespecially for hydrotreated fuels and fuels from non-petroleumsources. In the first test program, which was carried out in 1982by six laboratories, selected fuels were stored at 100°C for 7days and analyzed periodically for peroxides. Results showed widevariations between laboratories and between duplicate samples.These results plus subsequent work at NRL at 430, 650 and 80°Cindicated that an accelerated test at 80* or 100 0 C is notpredictive of behavior at lower temperatures, including ordinary I %fuel storage conditions.
2. For the second test program, fuels were stored at 65°C for 56days and procedures were improved and tightened to reduceexcessive variability of results. Please refer to the 9-page setof directions sent to each participant by NRL October 19, 1983.
3. Results from the second test program are summarized below.Table 1 lists for reference the laboratories and personnel.Iinvolved. Table 2 identifies the fuel samples supplied to thelaboratories. Unfortunately, two planned fuels were not availableand the substitutes were less appropriate (too stable). Finalperoxide numbers of about 1 and greater were desired.
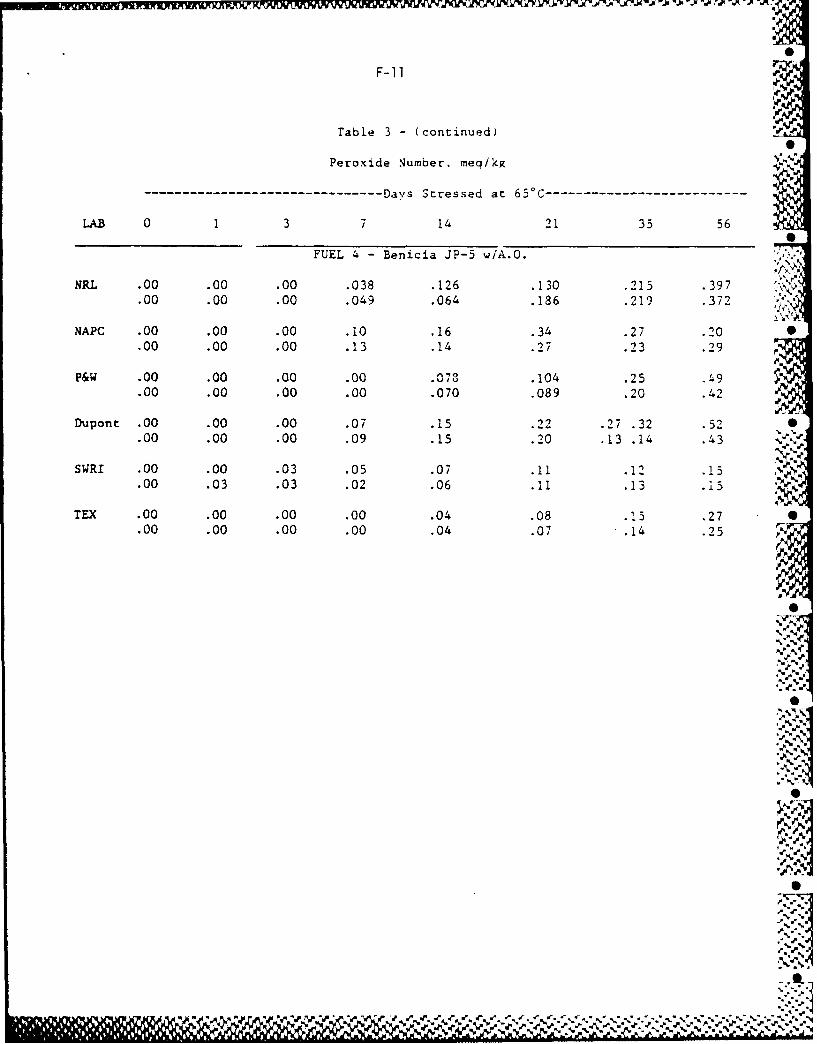
4. Results are shown in Table 3. For each lab the twohorizontal lines represent the two duplicate samples of each fuel.Only Fuel 3 developed appreciable hydroperoxides. None of theother four fuels reached a peroxide number of 1. Repeatabilityand reproducibility may be summarized as follows:
a) Variability of the analytical procedure is shown by the 8cases of duplicated analyses.* The average percent differencebetween duplicate analyses was 8% and the range was 1-21% exceptfor one case of 42%. Individual values were 13, 2, 42, 5, 21, 1,3 and 3% for the first sample and 4, 7, 7, 1, 18, 2, 1 and 1% forthe second sample.
b) Agreement between the duplicate samples of any one fuelt- ,,a l' w4 thin 25% but varied from 0 to over 50%. Individual
values are given in Table 4. These are quite variable and
*Note - Where the two samples differed by more than 15-20%, labs
were instructed to repeat the analysis and report the four Tresults.
%O
.-. ~ ~ ... f or 'K. ~ ~ ~ ~ ~ ~ ~ ~ ~ ,0 % ,, , ,.,.'''''L;'' L ,

F-4
unpredictable. They represent analytical variability plus anyvariability between individual paired samples. It is obvious insome cases that differences between originally identical samplesdid develop on aging at 65°C. Thus fuel behavior towardperoxidation (at elevated temperature) is variable and hence 0predictable only to a limited degree. This agrees with priorexperience.
c) Agreement between laboratories was fair to poor. Forperoxide numbers below 1, the range or spread was typically about3 to l.** SWRI's results for Fuel 5 at 35 and 56 days wereabnormally:(?) high so that the range for those times was over 10to I instead of 3 to i otherwise.- In the case of Fuel 3 the ratioof the high lab to the low lab was over 20 to 1 at 56 days. Thusrepoducibility was perhaps no better than in Round Robin I inspite of added precautions.
5. Results of analyses of a "control sample" are shown in 0Table 5. The average of each set of quadruplicate (or duplicate)analyses is included, and also the ratio of the spread to themean (as a percent). This sample was a dilute solution of a purestable hydroperoxide in a solvent stable to peroxidation. It washeld at low temperature except during shipping. The purpose herewas to obtain better data on the analytical repeatability (withinlabs) and the reproducibility. (between labs) using a stable samplefree from :aY the complexity of having a-mixture of peroxides ofdifferent types and(b) changes due-to accelerated storage. Theaverage of the values for percent spread (the "immediate"repeatability) was 6.2% and the range of these values was 0.2 to15.4%. The 6.2% may be compared roughly to the 8% above. "Non- Iimmediate" repeatability* in the worst case for each lab was asfollows:
NRL 2%p&W 5Dupont 17SWRI 1TEXACO 7
Agreement between labs may be shown by aggregated averages foreach lab (since there were no trends with time):
NRL 10.17NAPC 10.12P&W 9.93Dupont 10.51SWRI 9.53TEXACO 9.20
9.91
The spread here is 13%.
I.e., comparing averages for different times. I** (Ratio of highest value to lowest value)
V
*. . . ',.. w,.,.~rX'r .~ -**... il

F-5
6. To summarize, these data are somewhat encouraging and perhaps 4. ?
the best data yet on the underlying repeatability and reproducibi - NOlity of the analytical method, ASTM D3703. But application to je_fuels introduces additional variability inherent in the fuels.Accelerated testing of fuels then introduces further variability.A further purpose of the control sample was to calibrate the labsabsolutely, assuming the control sample contained a knownconcentration of hydroperoxide (obtained other than by iodinetitration). A sample of t-butyl hydroperoxide was speciallyvacuum distilled for this purpose. Its purity by gas chromato-graphy was 99.6%. However, it was not available in time and the ..sample actually used did not have an accurately known purity.
Problems with the iodometric titration were encountered byseveral laboratories. For one thing, troubles were experiencedwith starch indicator solutions. At times on approaching an end-point, the color changed from purple to a dirty red to paleyellow. In such cases it is impossible to get a good end-pointvalue, especially if the fuel itself is pale yellow. At timesthere was no color at all. Several brands or sources of starch inpowder form and as prepared solutions were utilized, all with thesame problems. At NRL we now prepare starch solution fresh daily.
Another problem involved the blank correction. Variabiltythereof might explain some of the variability of fuel results. =
Some tests at NRL showed that age of the starch solution wascritical. In addition reaction time (see below) had a pronouncedeffect. For example:
Blank, ml of .005N NajSOj IReaction Starch SolutionTime Fresh 1-Day Old I
5 min 0-0.2 0.2-1.6
30mn -- 0.8-2.9
7. The effect of reaction time has been studied at Pratt &Whitney and at NRL with a view to improving the repeatability of S
hydroperoxide analyses. Preliminary work indicated that higherperoxide numbers resulted when a longer reaction time was used. Itwas hoped that use of 10-15 minutes, for example, instead of 5minutes would permit operation on a less steep part of the timecurve. This was not borne out by further work at NRL. Astatistically designed study of the effect of solvent (Freon 113 Svs CC1 4 ) and reaction time (3C vs 5 minutes) was carried outusing 3 fuels having initial peroxide numbers of 3-20 andstandard K2Cr2O7 . Freon 113 was tested to support thechange in procedure to that solvent in place of CCI 4 . The useof Freon usually gave lower peroxide numbers but the differenceswere small (-7 to +6%) and not significant. The effect of 030-minute reaction time varied greatly with fuel type. Again no
N~9
'N..w %% %*

F-6 f
significant effect could be supported statistically in view of Zt --few data and the poor repeatability. Duplicates usually agreed k
within 10% but one fuel was much worse.
8. A further investigation compared results at 5, 10, 15, 30 and45 minutes using Freon as solvent; Four fuels with initialperoxide numbers of 4-116 were utilized. Again the order oftesting was randomized to enhance reliability of results andseparation of. variables (known and unknown). Resulting peroxidenumbers were calculated relative to standard K2Cr 2O 7 at the samereaction times rather than being expressed on an absolute basis.Generally, results were irregular and agreed poorly with previousdata. The effect of reaction time-varied widely with fuel type.In some cases the peroxide number rose irregularly (by up to 20%)with reaction time with a maximum at 15 or 30 minutes followed bya decline. Agreement of duplicates became worse with longerreaction times.
9. Paul Warner of Pratt & Whitney determined changes in fueltotal acid number and fuel sediment formation after stressina at65°C. Triplicate 300 ml aliquots of each fuel were taken for eachtype of test. Results are shown in Tables 6 and 7.
II
*,%'' '
%i

* ~ ~ 1~19."7. ."e
el
F- 7
Table I. PARTICIPATING LABORATORIES
1. NRL Naval Research Laboratory Jim Hall
2-NAPC Naval Air Propulsion Center Linda Craig
3. P&W Pratt & Whitnev Aircraft Bill Purvis,- Linda Neubauer
4.- Dupont. E.I..duPont de Nemours - Tayman.Phillips
5. TEX Texaco, Inc. Salvatore Rand
6. SWRI Southwest Research Institute Pat Cuellar
Note - Wright Field (Bob Morris) and Exxon (Bill Dukek) have been
unable to complete the test program.
Table 2-TEST FUELS
Fuel Anti-No. TyeSource Hydrotreated oxidant
1 JP-5 Andrews AFB ?-Yes?
2 Shale JP-4 Caribou Severe Yesvia WPAFB
3 JP-5 Exxon Benicia Mod. Severe No
4 if if ifYes 15 JP-4 Andrews AFB??
Note -All petroleum-derived except Caribou
re1
V,
% % % %

,., - .
F-S I.%
Table 3 - RESULTS OF 50 C TESTS
Peroxide N mi'Pr. meq/kR
------------------------- Days Stressed ac 650 C-- -
LAB 0 1 3 7 14 21 35 56
FUEL I -- JP-5 (Andrews AFB)
NRL .00 .00 .00 .00 .00 .00 .00 .01 %.00 .00 .00 .00 .00 .00 .00 .00
NAPC .24 .25 .71 .i4 .20 .20 .14 .00
.18 .23 .70 .17 .19 .21 .12 .00 0
p&w .00 .00 .00 .00 .00 .00 .00 .00
.00 .00 .00 .00 .00 .00 .00 .00
Dupont .00 .00 .00 .00 .00 .00 .00 .00
.00 .00 .00 .00 .00 .00 .00 .00 771'2:.
SWRI .01 .02 .01 .01 .04 .05 .09 .07 '
.01 .02 .02 .03 .03 .04 .08 .07
TEX .00 .00 .00 .00 .00 .00 .00 .04
.00 .00 .00 . .00 .00 .00 .03 ;
S.%0
%r %-%
7W'.\
,-;S
• % . , ,@ rw €./ f _ W , ,( . # % " " • % ' %' .- € '- " • # " w . J' . p', . r.V ,M I

F-9
Table 3 - (continued)
Peroxide Number, meq/kg 4_
------------------------------ Days Stressed at 650C --------------
LAB 0 1 3 7 14 21 35 56
FUEL 2- Shale JP-4 (Caribou)
NRL .00 .00 .00 .00 .00 .00 .17 .43
.00 .00 .00 .00 .00 .00 .17 ..48
NAPC .00 .00 .00 .20 .14 .15 .26 .31
.00 .00 .00 .19 .11 .11 .26 .45
P&W .00 .00 .00 .00 .00 .00 .10 .31 .27
.00 .00 .00 .00 .00 .00 .10 .24 .25
Dupont .00 .00 .00 .04 .01 .06 .14 .30
.00 .00 .00 .00 .02 .11 .16 .28
SWRI .00 .00 .03 .07 .06 .06 .08 .17
.00 .01 .02 .04 .05 .06 .08 .18
TEX .00 .00 .00 .00 .00 .04 .08 .27
.00 .00 .00 .00 .00 .04 .09 .24.00 00 .0 .0 .0 .0l, .9 .2 ,
S.,:
.I
S, ,W
., .
a'

X0
F-1 0
-q. n* ' n
Iz LI) - N oz0 f0 CD if 0~- Ile
4 00
c-.ja%
C 1 r
I * -~1.0 en
0 1 C'JCI.J CN 00O
o7 C.4 co aAf- cnCNfe-e)c
e0' C)M -. '0 %0N C1
IfC lC4eC I)-1(I
cm I~ -j 9
-- r- c
Ln 0n 10 IZ C
r0. 0 00 00
4m
z~ z
q.* I
I ~~ ~ %- % 00 f-- % * '
F- 11orl
Table 3 - (continued)
Peroxide Number. mea/kg .
-- -- -- -- -- -- -- -- -- -- - Days Stressed at 65 0 C --- - - - - - - - - - - -
LAB 0 1 3 7 14 21 35 56
FUEL 4 - Benicia JP-5 w/A.0.
NRL .00 .00 .00 .038 .126 .130 .215 .397.00 .00 .00 .049 .064 .186 .219 .372
NAPC .00 .00 .00 .10 .16 .34 .27 .20.00 .00 .00 .13 .14 .27 .23 .29
P&W .00 .00 .00 .00 .03.104 .25 .49.00 .00 .00 .00 .070 .089 .20 .42
Dupont .00 .00 .00 .07 .15 .22 .27 .32 .52.00 .00 .00 .09 .15 .20 .13 .14 .43
SW.RI .00 .00 .03 .05 .07 .11 12.15.00 .03 .03 .02 .06 .11 .13 i15
ME .00 .00 .00 .00 .04 .08 .13 .27 0.00 .00 .00 .00 .04 .07 .14 .25
r~~~~. F -- r r 4rA % % %%
217 %

F-12
Table 3 - (continued)
Peroxide Number, meq/kg 0
- Days Stressed at 650 C --------------------------
LAB 0 1 3 7 14 21 35 5b
FUEL 5 -JP-4 (Andrews AFB) 1
NRL .00 .00 .00 .00 .00 .00 .134 .175 %'
.00 .00 .00 .00 .026 .00 .075 .165
NAPC .35 .37 .34 .26 .43 .45 37 .44
.36 .33 .31 .28 .45 .43 .45 .35
P&W .00 .00 .00 .00 .079 .086 .10 .20
.00 .00 .00 .00 .081 .084 .10 .20
Dupont .02 .01 .01 .17 .13 .14 .13 .14
.04 .03 .00 .10 .14 .12 .14 .14, ,
SWRI .02 .05 .07 .09 .18 .23 1.32 1.66.02 .04 .07 .11 .18 .21 1.30 1.61
T FX .00 .00 .00 .02 .05 .07 .11 .21
.00 .00 .00 .02 .05 .08 .13 .25
%m %
N
r,,
A206w, ,*

F-1 3
I 00Ir 91 I
-~c n
-4 --
t- I
CNN Ct
el a.
Z Z- z a
-We.
-N N
11-17: 1%

F-i14
Tatb1 I e CONTROL SAMPLE REISULTS r.- BuoUH in J P-5*)
Peroxide NUmber. men'.kqr
---------------------------- Davs Stored in Ref;.gpratur- ----------------------
LkB 0 3 7 14 16 21 35 56
NRL 10.30 10.08 10.72 101610.42 10.27 9.66 9.869.80 10.-18* 10.54 10.01 el9.87 1.91%1 10.88 10.34
10.10* 10.30P 10.09* .
6.11% 11 .9% 4.8%"
NAPC 10.1010.789.749.2210.7710.12*15.4%
P&W 10.3 9.510.1 10.010.2 9.810.0 9.610.15;B 9.7w N
3.0% 5.2%
Dupont 10.03 10.13 10.55 11.45 10.25 10.70 9.5510.10 11.20 11.20 10.48 10.95 9.5310.12P 10T.88- 11. 33* 10-.37- 10.33* 9. 54,a0.3% 6.% 2.2% 2. 200 2 .3% 0,2
SWRI 9.34 9.619.03 9.379.92 9.849.62 949.48* 9 .579. 4% 4.9%
TEX 9.13 9.369.00 9.338.87 9.818.55 9.548.89" 9.51a....6.6% 4.
*Fuel I
+ Dupont stored at 40 0 C
*The first value is the average and the second i.s the ratio of the soread to rhe mean Oas a percent.I
* *~ *9v ~ %;;~;, \VIS

F-15
Table 6 -TOTAL ACID NUMBER PER A371 D3242
FUEL SAMPLES BASELINE 2.1 DAYS 56 DAYS
IA .006 .004 .0041B .005 .005 .005ic -- .005 .00or
2A .003 .004 .0032B .003 .003 .00,2C -- .003 .003
3A .001 .004 .0233B .001 .003 .0183C -- .004 .019
4A .001 .001 .0014B .001 .001 .0014C -- .001 .0010
5A .003 .002 .0025B .003 .002 .0025C -- .002 .002

F-16
TABLE 7 - SEDIMENT FORMATION
FUEL SAMPLE FILTERABLE SEDIMENT (a.) ADHERENT GUM (i.) %*, 0
IA -0.0010 + o0. 011B -0.0006 +0.03iC -0.0004 0.05
2A -0.0010 +0.012B -0.0009 -0-2C -0.0008 +0.01
3A +0.0002 +0.053B +0.0007 +0.033C +0.0001 -0- U
4A -0.0003 +0.014B -0- -0-4C -0.0005 +0.01
SSA +0.0002 +0.025 B + 0 . 0 0 0 3 + 0 . 0 1 O., .
, .1i,
",' b"2
! " "9kX'W "m'k'W.,, ~ w ,Th6'9 Z",Z".T.' ..ZG. % 2 •",",r",",, ".". w-.'.,- ,.'.,._..'W Z.',r',,

F-1i7
DISTRIBUJTION LISTNRL Ltr Rect.6180-1084 :JMH:cem
Linda Craig Turner (PE-33) Cyrus P. HenryNaval Air Proculsion Center Petroleum LaboratoryP.O. Box 7176 E.I. duPcnt de Nemours &CO.Trenton, NJ 08628 Wilmington, DE 19898
C.J. Nowack (PE-33) John P. CuellarNaval Air Propulsion Center Southwest Research InstituteP.O. Box 7176 P.O. Drawer 28510Trenton, NJ 08628 6220 Culebra Road
San Antonio, TX 78234William PurvisPratt & Whitney Aircraft W.G. DukekGovernment Products Division Exxon R&D Co.United Technologies Corp. P.O. Box 45P.O. Box 2691 Linden, NJ 07036West Palm Beach, FL 33402
Robert MorrisLinda Neubauer AERO Propulsion LabPratt & Whitney Aircraft AFWAL/PCF-MGovernment Products Division Wright-Patterson AFB, OH 45433United Technologies Corp.
.P.O. Box 2691 Roger OrganWest Palm Beach, FL 33402 Caltex Petroleum Corpo.P.O. Box 61500Salvatore J. Rand Dallas, TX 75261
Texaco, Inc. . .P.O. BOX 509 William TaylorBeacon, NY 12508 Exxon R&D Co.
P.O. Box 45T. A. Phillips LneN 73Petroleum Laboratory LneN 73F.I. duPont de Nemours &Co.
Wilmington, DE 198987 ,
IAI

Il
II

A P PE N DI X
INSTRUCTIONS FOR THE THIRD COOPERATIVE
TEST PROGRAMS
i~lllllp

G-17 April 1986
To: Participants in the Third CRC Cooperative Test Program on HydroperoxidePotential of Jet Fuels
From: J. M. Hall, Geo-Centers, Inc., at Naval Research Laboratory, ChemistryDivision, Code 6180, Washington, D.C. 20375
Subject: Procedure for the Third CRC Test Program
Introduction
The test program for the third peroxide Round Robin will follow the pre-
vious plan in general. Please refer to the enclosed copy of our instructions
dated 19 October 1983 to laboratories participating in the second round robin.
A summary of procedure changes and additions for the third cooperative program
is given next.
Changes For Round Robin III
1. The second round robin was unsatisfactory because of unsuitable fuels.
Only one fuel developed a significant level of peroxide (>0.5 neq/kg).
This time fuels have been selected which have been hydrotreated moderately
or severely and which contain no antioxidant. Hence all were expected to %
develop hydroperoxides readily at 65'C. They have been screened at NRL. ,
2. There are 9 fuel samples and 9 laboratories instead of 5 fuels and 7 labs.
This will permit superior statistical conclusions. Eight of the fuels are
JP-5 and Jet A jet fuels and one is a JP-4 (fuel #5). 2000-2800 ml of 0
each fuel is being supplied. The samples will be shipped under argon in
new, epoxy-lined 1-gallon cans. These were cleaned twice with acetone with
agitation, dried in a 43;C roomand rinsed with fuel, again with overnight
soaking and agitation. %
3. Set up 3 bottles (instead of 2) of each fuel. Place 400 ml of fuel in each
bottle. This allows for 50 ml periodic samples for analysis in the beginning
and for fuels developing only low levels of peroxide. Aerate all samples
just before placing in the oven, as described below.
V,
• , . .. .. ',,

G- 2
4. Sampling times: 0,1,2,3,4 and 6 weeks. Since 27 analyses (9 fuels x 3
bottles) are too many to handle in one day, it is suggested that half (or a
third) be started in the oven on a Monday, for example, and the other half
1 Or 2 days later. Do one analysis per bottle each time. Originally it
was planned to limit the hot stress to 3 weeks but screening tests at NRL
showed that several fuels developed significant hydroperoxide more slowly
than expected. '.4
5. Stress samples at 65 :IC in a forced draft oven as before.
6. Increase access to air as follows. Except for Fuel #5 (more volatile),
screw caps on bottles loosely on puttingor returning to oven. As before,
leave caps off bottles for 15-30 minutes at each sampling time.
Precautions
Sample cans should be stored in a refrigerator from time of receipt until
start of heat stress. Tops of cans should be cleaned carefully before opening
to prevent contamination. Just before putting in the oven, saturatp fuel- with
air by bubbling clean, filtered air thru samples in the 500 ml bottles for 5 '
minutes at a moderate rate, e.g., 3 SCFH.
Start the test program by May 1 if possible.
Analyses.
The analytical method is ASTM D3703-85, Peroxide Number of Aviation Tur-
bine Fuels. (This includes the change to Freon 113 solvent as compared to the
1978 version.) Report peroxide number as meq/kg rather than as ppm.
If, at any time, the 3 bottles differ by more than 15%, repeat analyses on
all 3 and report all six results. For cases of peroxide number below one, use
0.3 peroxide number instead of a percentage.
If the analyst -is not accustomed to running the D3703 procedure, it is
essential to practice before starting the program. Use actual jet fuel samplesIf te aalyt i notaccstoed o rnnin th D303 roceure itis #,1
.... .-w-,- , r '-..w_ . '._r ':. '' ", . .,-'-'.'''>." ' '.- .°>,'-" - '' .' ,"" r - "'.

0G- 3
having both high and low peroxide levels. Samples can be provided by put-
ting aerated fuel in a 100 C oven for I or 2 days or longer.
Control the 5-minute reaction time closely (t4 minute or less). Results
vary with reaction time and vary differently with different fuels.
Run blanks. at least occasionally and report results. •
It is very desirable to randomize the order of analyzing the samples.
For example, don't titrate bottles of the same fuel in succession. Assuming
the 27 bottles are divided into at least 2 groups and titrated on different
days, divide each group of 3 among the 2 or 3 different weekdays.
There have been problems with starch indicator solution, e.g., strange
end-point colors. Age is critical. We now avoid the problem by preparing
fresh solution each day. It may be possible to use it a second day by reboil-
ing before use.
Use deaerated distilled or deionized water to prepare reagents. Make
fresh KI solution each day.
Calibration Sample
As before~a calibration or control sample will be provided, shipped
separately. It will be a solution of t-butyl hydroperoxide in a very stable
JP-5 with a peroxide number of about 3 meq/kg. Keep it in a refrigerator.
DO NOT PUT IN OVEN. Analyze it twice in quadruplicate at, say, 1 and 3 weeks,
or 2 and 4 weeks or similarly.
List of Participants
1. Naval Research Laboratory (Geo-Centers, Inc.) J. M. Hall
2. Naval Air Propulsion Center Lynda Turner
3. Wright-Patterson Air Force Base Tim Dues
4. Southwest Research Institute Pat Cuellar
. National Institute for Petroleum and Dennis BrinkmanEnergy Research John Goetzman

G-4I
6. Pratt-Whitney Co. Paul WarnerLinda Neubauer
7. Dupont Co. Tayman Phillips
8. EXXON R & E Co. William Taylorel
9. Texaco, Inc. Salvatore Rand0
ile pt
N ,-% C.rU-% % ll I Il d. 0 . 0. S
of f .
_N: Ml

S
SI F
0
S
APPENDIX H
.j.
DETAILED RESULTS OF COOPERATiVE TEST PRO6RAM 3
S1*
0
.' .~.
* ~
0
S

H-I
TABLE H-I - RESULTS OF 650C ACCELERATED TEST
Peroxide Number, meqkgBottle Weeks Stressed at 65"C
LAB No. 0 1 2 3 4 I
FUEL i - JET A (Texaco)
NRL A .00 .15 .18 .26 .32 .44B .00 .10 .18 .26 .74 .;4C .00 .12 .22 .27 .38 .51aver. .00 .12 .20 .26 48b .50
NAPC A .00 .00 .41 .55 .76 1.94B .00 .u0 .51 .56 .64 2.03C .00 .00 .44 .85 1.5i 1.59aver. .00 .00 .45 .65 b.85
P & W A .00 .04 .06 .10 • . 3B .00 .04 .07 .11 .14 .16C .00 .02 .07 .11 .12 .16aver. .00 .0 3b .07 .11 .14 .1 r
duPont A .00 .03 .10 .16 .22B .00 .04 .09 .09 .12C .00 .04 .09 .12 .i8aver. .00 .04 .09 . 1 2 ' . 17
TEX A .00 .12 .49 .98 2.22 3.70 V.45 2.31 3.78
B -- .07 .34 .77 1.58 2.92.38 1.63 2.87
aver. .00 .T0b .42 .88 1.94 3.32
NIPER 1 .00 .07 .08 .08 .13 .122 .00 .07 .08 .11 .13 .133 .00 .10 .13 .15 .16 .15aver. .00 .08 .09b 11-D .14 .13
SwRI 1 .01 .30 .27 .55 .41 .432 ".01 .43 .56 .14 .93 .473 <.01 .20 .37 .52 .39 .42aver. <.01 ab .b ,4 0a .44
EXXON A .00 .15 .15 .29 .28 .15B .00 .13 .22 .34 .27 .18C .00 .10 .18 .52 .32 .25aver. .00 .13 .18 .38 .29 'go
a Ratio of highest to lowest bottle >3b Ratio of highest to lowest bottle 1.5-3
b111131 , of11 1 to lowest,1 Aottle 1.5-3 •
I!t . .MM.

L0
H-2
TABLE H-I - Continued
Peroxide Number, rneg/k, ___
Bottle Weeks Stressed at 65-CLAB NIo. 0 1 2 34
FUEL 2 - SHELL, MOD. PROC'D BLENDING ST-CCK
NRL A .00 .00 .00 .00 .20 .0B .00 .00 .00 .05 .21 .76c .00 .00 .00 .00 .16 _
aver. .00 .00 .00 .02 i19
NAPC A .00 .00 .00 .o0 49 4 . 9'B .on .00 .00 .00 .00 1--0C .00 .00 .00 .00 .00 1.64aver. .00 .00 .00 .00 ..a 6 -a
P&W~~~. AN0 0 0 0 3 1
B& .00 .00 .00 .00 .)4 .14B .00 .00 .00 .00 .05 .1
aver. .00 .00 .00 .00 .05 .14
duPont A .00 .00 .00 .00 .24B .00 .00 .00 .00 .9C .00 .00 .00 __.06 -.32aver. .00 .00 .00 .0 -a .28
TEX A .00 .00 .00 .00 .10 .36B - .00 .00 .02 .14 .Raver. .00 .00 .00 .01 .12 .32
NIPER 4 .00 .00 .00 .07 .27 . 92-
5 .00 .00 .00 .18 .36 .95
6 .00 .00 .19 .42 .74 1.45aver. .00 .0 ~ 46 . 2
SwRI 1 .03 <.01 (~.01 .64 1.09 2.202 <.01 /.01 <.01 (.01 .C4 .733 <.01 <.01 <.0l <.01 <.31 .63aver. *0 1a <.01 1.01 .2 1a 3 a 1 .1 -a
EXXON A .00 .00 .01 .00 .00 .27B .00 .00 .00 .00 .00 .14C .00 .00 .00 .00 .00 .2aver. .00 .00 .00 .00 .00 .1 8b1
a Ratio of highest to lowest bottle >')b Rat-10 Of !IIhest to lowest Lott le 1.5-3

H- 3
TABLE H-I - Continued
Peroxide Number, meg/k S:Bottle Weeks Stressed at 65-C __
LAB No. 0 1 2 3_ 4 6
FUEL 3 - SHELL, SEV. PROC'D. BLENDING STOCK
NRL A .00 .00 .00 .00 .08 .1B .00 .00 .00 .01 .07 .40C .00 .00 .00 .06 .11 .43aver. .00 .00 .00 *0)a 0
NAPC A .00 .00 .00 .00 .32.) 0B .00 .00 .00 .00 .18 0C .00 .00 .00 .1/ 1.271 1.97aver. .00 .00 .00 .06a .6 6a
p & W A .00 .00 .00 .05 .01 'IL2B .00 .00 .00 .05 .08 .11C -- .00 .00 .05 .08 .12aver. .00 .00 .00 .05 .08 .1
duPont A .00 .00 .05 .07 .11B .00 .00 .05 .07 .10C .00 .00 .05 _ .08 .1oaver. .00 .00 .05 .07 .10
TEX A .00 .00 .03 .06 .09 .24.00
B -- .00 .04 .06 .09 Z7_aver. .00 .00 .03 .06 .09 .2
NIPER 7 .00 .00 .00 .00 .04 i1i
8 .00 .00 .00 .00 .00 .099 .00 .04 .00 .00 .08 -.22aver. .00 .01 .00 .00 .0 4d 11
SwRI 1 .01 <.01 ".0i <.01 '.01 v.0102 (.01 <.01 \.01 <.01 <~.01 .03 <.01 <.01 <.01 (.0i (.01 <.017aver. .0 1 T. 01 < .0 K.01 .,D
EXXON A .00 .00 .00 .07 .05 .10B .00 .00 .00 .00 .66 .070C .00 .00 .00 .00 .04 .09aver. .00 .00 .00 .02a .05 .09
a Ratio of highest to lowest bottle >3b Ratio of highest to lowest bottle 1.5-3

H-4
TABLE H-I - Continued
Peroxide Number, meq/__Bottle Weeks Stressed at 65'C _
LAB No. 0 1 2 3 4 6
FUEL 4 - PETRO-CANADA
NRL A .00 1.56 31.4 103.0 207.5 361.2B .00 7.32 64.5 158.0 257.0 460.8C .00 2.89 37.2 156.2 236.4 345.0aver. 0 3 .9 2 a 4.4b 1 39 .b 233.6 389.0
NAPC A .00 .00 25.1 67.4 94.6 297.8B .00 .00 27.3 50.3 40.0 110.7C .00 .00 24.6 142.2 288.9 317.5aver. .00 .00 25.7 86. 6b 1 4 1.a 2 4 2 .0b
P & W A .00 .14 11.9 96.1 237 471B .00 .16 19.2 112.2 286 576C -- .16 17.2 110.5 276 481aver. .00 .15 T6,b 106.3 266 509
duPont A .00 .18 7.45 27.6 46.6B .00 .18 9.50 38.4 56.5C .00 .17 8.80 ___ 29.1 106.5aver. .00 .18 8.58 31.7 6 9 .9 D
TEX A .00 5.48 58.1 174.8 237.3 374.35.44 60.4 177.2 237.6
63.9B 10.99 88.1 254.8 403.8 409.5
11.74 76.3 260.1 409.487.1
aver. .00 8.4 1b 72.5 216.7 322.0 391.9
NIPER 10 .00 .41 34.3 127.8 269.6 430.5 0129.8 427.2
11 .00 .00 9.9 64.4 241.9 445.666.4 443.6
12 .00 .51 39.4 154.9 319.8 459.843.9 167.9
aver. .00 .31 2 8 .6a 118.50 277.1 444.4
SwRI 1 .02 .95 24.7 101.4 167.7 527.72 <.01 .93 30.6 97.4 167.9 643.53 <.01 .97 26.0 106.4 160.9 381.1aver. .01 .95 27.1 101.7 165.5 517.4r
EXXON A .00 .00 8.70 38.1 65.0 83.0B .00 .15 7.35 40.4 66.2 97.5C .00 .03 4.38 31.8 64.5 75.3aver. .00 .06a 6, ib 36.8 65.2 85.3
a Ratio of highest to lowest bottle >3b Ratio of highest to lowest bottle 1.5-3

H-5
TABLE H-I - Continued
Peroxide Number, meq/k _
Bottle Weeks Stressed at 65'CLAB No. 0 1 2 _3 4 6
FUEL 5 - SHALE JP-4
NRL A .00 .06 .11 .91 8.01 42.11.11
B .00 .06 .08 .57 26.43 107.2 -C .00 .08 4.65 25.95 63.79 110.7aver. .00 .07 6 2a 9 1 8a 3 2 7 4 a 8 6 .7b
NAPC A .00 .00 .36 4.09 11.07 106.8B .00 .00 .36 4.60 12.67 10.2C .00 .00 .42 4.11 27.46 38.2aver. .00 .00 .38 4.27 1 7 -0 7 b 5 1 .7a
P & W A .00 .00 .12 2.6 20.4 97.1B .00 .00 .12 2.3 19.1 110.6C - .00 .31 3.5 24.8 138.2aver. .00 .00 .18b --f21.4 11
duPont A .00 .00 .07 2.07 52.4B .00 .00 .06 1.89 44.2C .00 .00 .07 1.78 52.8aver. .00 .00 .07 1.91 49.8
TEX A .00 .08 4.54 28.3 75.4 257.54.56 26.4 74.8 0
B -- .18 8.18 35.4 90.9 278.88.01 35.7 90.9 "_aver. .00 .- 6 .3 0b 31.9 83.0 268.2
NIPER 13 .00 .00 .00 .03 .12 5.35.5
14 .00 .00 .00 .06 .33 33.946.7
15 .00 .00 .09 .72 13.9 105.819.9 106.1
aver. .00 .00 .0 3a .27a 5.78a 5 0 .5a
SwRI 1 .06 <.01 .20 1.05 5.88* 60.0 S2 <.01 .04 .33 i.08 15.91 50.93 <.01 .07 .29 .94 11.82 47.8aver. .02a .04a 27b 1.02 13.87 52.9
EXXON A .00 .00 .15 17.2 48.9 67.518.6 49.7
B .00 .00 .13 4.41 19.94.60 18.7 48.8
C .00 .05 2.17 14.1 29.3". 24.2 28.0 51.5
aver. .00 .02 .8 2a 12. 2a 324b 55.9
a Ratio of highest to lowest bottle >3 0b Ratio of highest to lowest bottle 1.5-3• Sample size too large. Omit.
i i i

H-6 0
TABLE H-I - Continued
Peroxide Number, mez/k,1 _
Bottle Weeks Stressed at 65-C
LAB No. 0 1 2 3 4
FUEL 9 - JET A BLENDING STOCK, HYDROF!NED
NRL A .10 .53 1.58 2.71 5.55 70.7B .10 .60 1.21 2.30 6.66 839.6C .10 1.24 6.41 30.04 81.9 297.7
74.0aver. .10 .7 9b 3 .0 7a 1 1.7a 3O.o a 152.7a
NAPC A .39 .00 2.69 5.13 5.14 66.5B .38 .00 2.99 4.91 4.66 51.3C .37 .00 2.65 4.90 10.18 38.2aver. .38 .00 2.78 4.98 6 . 66 b.b
P & W A .08 .41 .90 1.9 3.8 22.2B .09 .39 .91 1.9 4.2 19.0C -- .39 .84 1.8 3.9 1 .1 aver .09 .40 .88 1.9 4.0 20.1
duPont A .09 .70 1.80 7.75 23.8B .09 .76 1.93 6.20 44.5C .09 .66 1.78 6.75 22.1aver. .09 .71 1.84 6.90 3 0 .b
TEX A .08 1.22 6.66 23.4 35.1 139.96.62 23.7 35.7 135.8
B .09 .98 4.50 16.7 46.6 177.74.56 16.7 4F,.7 183.2
aver. .09 1.10 5.59 20.1 41.0 159.2
NIPER 16 .09 .47 1.04 1.72 3.70 20.121.6
17 .09 1.44 3.03 16.08 63.6 225.318.73 70.6 223.3
18 .09 .68 2.11 5.99 18.1 196.3 S5.42 17.5 184.4 r
aver. .09 .8 6a 2 .0 6b 8 .3a 29 .5a 145.2 a
SwRI 1 .20 1.09 1.63 5.54 8.85 88.72 .01 1.18 1.86 6.63 10.70 81.93 .11 .94 2.02 6.17 11.33 l0.1 0aver. .1 4a 1.07 1.84 6.11 10.29 93.6
EXXON A .08 .52 1.11 1.83 3.01 16.3B .07 .46 1.17 i.90 3.05 14.3C .07 .49 1.17 1.77 2.73 11.7aver. .07 .49 1.15 1.83 2.93 14.1
a Ratio of highest to lowest bottle )3b Ratio of highest to lowest bottle 1.5-3

H-7
TABLE H-I - Continued
Peroxide Number, _men/qky -_
Bottle Weeks Stressed at 65'C ______
LAB No. 0 1 2 3 4 6
FUEL 7 -JET A BLENDING' STOCK, HYDROCRACKED
NRL A .00 .13 .41 .35 2.68 102.3B .00 .14 .62 1.63 3.51 122.2C .00 .16 .43 1.15 3.64 79.7aver. .00 .14 . 4 9 b .0 4a 3.28 T0 1 .4b
NAPC A .00 .00 .17 2.38 4.07 56.48 .00 .00 1.08 3.01 3.77 34.9C .00 .00 .54 1.78 5.31 12.8aver. .00 .00 .6 0a 2.3 9b 4 a
P & W A .00 .04 .21 i.10 4.2 39.9B .00 .04 .15 .69 2.6 23.4C -- .04 .20 .80 3.8 29.1aver. .00 .04 .1. 6 5b 3 0 .8 bD
duPont A .00 .13 .35 2.75 26.98 .00 .08 .37 4.12 29.3C .00 .15 .35 ___ 3.70 27.0aver. .00 .12b .36 3 .52 2- 7.7
TEX A .00 .28 2.18 6.04 16.1 59.82.07 6.07 15.7 59.3
B -- .25 2.70 8.61 24.2 156.20___ ___ ___ 2.60 8.55 24.7 156.2
aver. .00 .27 2.39 7.32 20.2 107.91D
NIPER 19 .01 .06 .33 1.48 5.05 65.6 r65.2A
20 .01 .36 2.48 7.52 21.68 98.22.94 3.51 96.8
21 .00 .11 .63 S..67 23.25 161.0___ ___ ___ 6.00 __ 162.3
aver. .01 .17 2 2 5 .1 1 c 1 6 .7a 1 0 2
SwRI 1 .14 .77 1.12 4.65 6.63 63.32 .02 .44 1.09 3.72 6.51 62.03 <.01 .42 1.20 3.65 9.91 55.0aver. .0 5a .5 4b 1.14 4.01 -7-.-8b 60.1
EXXON A .00 .00 2.33 6.94 16.6 50.82.01 16.4
B .00 .00 .96 6.23 17.2 50.11.16 17.2
C .00 .05 1.83 5.75 10.7 34.2___ __ _ _ __ 1.61 _ _ 11.0 _ _
aver. .00 .0 2a 1.65D 6.31 1 4 .9 a 45.0
a Ratio of highest to lowest bottle >3b Ratio of highest to lowest bottle 1.5-3
Iu 14 V,

H -8
TABLE H-I - Continued
Peroxide Number, me/kg0Bottle Weeks Stressed at 65C ___
LAB No. 0 1 2 3 4
FUEL 8 - JP-5 (EXXON, BATON ROUGE)
NRL A .00 .05 .03 .06 .08 .08B .02 .05 .03 .06 .L0 .10C .03 .04 .03 .04 .09 .1"aver. .0 2a 05 .03 .05 .39 .09
NAPC A .00 .00 .16 .00 4.22 c .73B .00 .00 .32 .00 .84 .7' 0C.0 0 .0 0 . 7 .3 9 .395 1
aver. .00 .00 .22b .1 3a .96a .871
P & W A .00 .03 .06 .09 .07 .i1B .00 .02 .06 .09 .07 .ilC -- .04 .06 .09 .08 1aver. .00 .0-b .06 .09 .07 .11
duPont A .00 .00 .00 .03 .0 2B .00 .00 .00 .00 .00C .00 .00 .00 .00 .00aver. .00 .C0 .00 .0a
TEX A .01 .07 .14 .14 .17 .18B .02 .05 .09 .13 .23 .20aver. .0 2b .06 .1 2b .14 .20 .19
NIPER 22 .02 .05 .06 .06 .C7 .0823 .02 .06 .08 .08 .i .0724 .03 .05 .08 .06 .05 .07aver. .02 .05 .07 .07 .08b .07
SwRI I <.01 .20 .02 .11 ".01 .102 <.0 .18 .17 .16 .12 .22
< (.01 .12 .121 .20 .4 1 .19aver. <.01 .T0b .1b .1 b .a 1671
EXXON A .00 .07 .08 .12 .06 .08B .00 .04 .03 .10 .10 .07C .01 .05 .09 .09 .07 .09 0aver. .00 05b .0 7 a .11 .07b .08
a Ratio of highest to lowest bottle >3b Ratio of highest to lowest bottle 1.5-3c Exclude this outlier.
5 *p 5 ~ ~ -
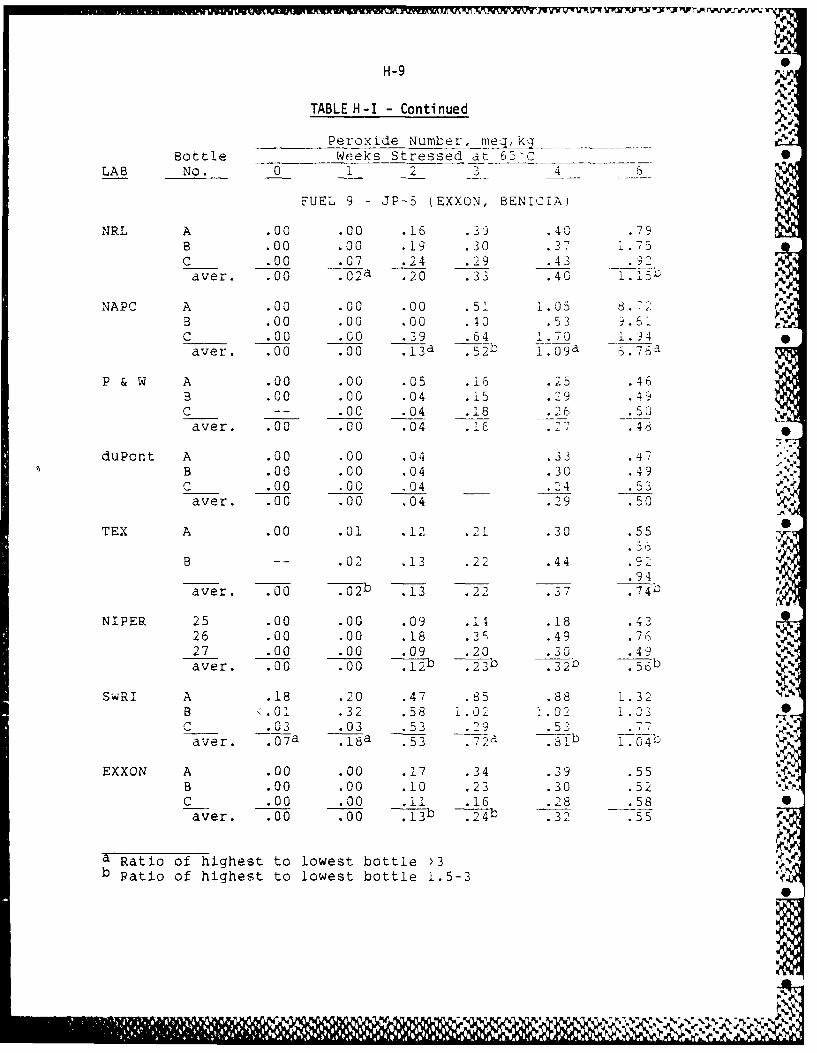
H-9J
TABLE H- I - Continued
Peroxide Number, n~kBottle Wfieks Stressed at 65'C __
LAB No. 0 1 2 34 6,
FUEL 9 - JP-3 (EXXON, BENICIA
NRL A .00 .00 .16 -31) .40 .79B .00 .00 .19 ..30 .3- 1.73C .00 .07 .24 .29 .43.9aver. .00 .0 2a .20 .33 .40 i.1= 'c
NAPC A .00 .00 .00 .51 1.05 8.7-"B .00 .00 .00 .40 .53 9.61c .00 .00 39 .64 1.70 1.)4aver. .00 .00 .1 3a *5 2)b 1p 6 .7 6 ,-
P & W A .00 .00 .05 .16 .25 .46B .00 .00 .04 .i5 .29 .49
C - .00 .04 .18 .26 .50aver. .00 .00 .04 .16 .27 .48
duPont A .00 .00 .04 .33.4B .00 .00 .04 .30 .49c .00 .00 .04 _ 24 S53aver. .00 .00 .04 .29g .50
TEX A .00 .01 .12 .21 .30 .55
B -- .02 .13 .22 .44.9____ __ __ ____.94
aver. .00 7Th2 .13 .2 .37 74T
NIPER 25 .00 .00 .09 .14 .18 .4326 .00 .00 .18 . 3 1 .49 .7 627 .00 .00 .09 .20 .30 .49aver. .00 .00 .12JD *2 ,b .3 2b0 .6
SwRI A .18 .20o .47 .85 .88 1B <.01 .32 .58 1.02- i.02' 1.J3C__ .03 .03 .53 .29 .3 .77aver. .0 7a .1 8a .5 ib h
EXXON A .00 .00 .17 .34 .39 .55B .00 .00 .10 .23 .30 .52C .00 .00 .11 .16 .2)8 .58aver. .00 .00 .1, .2 4b .32' .55
a Ratio of -highest to lowest bottle )3b Ratio of highest to lowest bottle 1.5-3
V All wl V

H-1O
TABLE H-II - VARIABILITY OF TRIPLICATE FUEL SAMPLES . .
Percent Diffrence Between .:' canes-Weeks Stressed at 65'C
LAB 0 1 2 3 4 6
FUEL i
NRL 0 41 21 4 38 -NAPC 0 0 22 46 77 24P & W 0 61 15 9 29duPont 0 27 i1 57TEX 53 27 24NIPER 0 38 52 52SwRI 0 74 73 133 _EXXON 0 39 3 61
FUEL 2
N,'RL 0 0 62'
NAPC 0 0 0 0 ._P & W 0 0 0 0 21 7duPont 0 aTEX C 0 33 13NIPER 0 0 302 159 i34 46SwRI 0 0 300 186EXXON 0 0 0 0 0
FUEL 3
NRL 0 0 0 261 44 75NAPC 0 0 0 300 18i 96P & W 0 0 3 0 13 •duPont 0 0 0 13 1TEX 0 29 0 0 12NIPER 0 0 0 '? _
SwRI 0 0 0 0 0EXXON 0 0 0 4C
* range x 100
Note: A range of 1.5:1 : 40% difference.A range of 3:1 : 100% difference.
.S A ,

H-11
TABLE H-II - Continued
Percent Dif ferenrce Bet wee n T,,! li11' -EWeeks Stressed at 53
LAB 0 1 23 4
FUEL 4
NRL 0 147 75 40 22DNAPC 13 0 1.1 106 '7 6
P &w 0 13 45 15 6SduPont 0 is 24 324 3
TEX0 6O4 32 352NIPER 0 1812SWR T0 4 22 9 4EXXON 0 63 23 32
FUEL 5
NRL 0 37 280 2 7 6 17NAPC 0 0 16 12 10'3 -
P &W 0 0 100 4 3 67duPont 0 0 15 .5 1TEX 0 77 57 23 19NIPER 0 0 256 2.91 199
EXXON 0 2411 23
FUEL 6
NRL 0 90 202 233 241 26NAPC 5 0 12 5 8 2 54p &w 12 5 10 5CC 6duPont 0 14 8 22 74TEX 12 22 38 34 213 2)8
N:PER 0 113 97 139 21i5 140SwRI 173 22 21 18 24 30EXXON 14 121 5 7 133
0
*rangeNl
mean X 100Note: A range of 1.5:1 = 40% difference.
A range of 3:1 =100% difference.
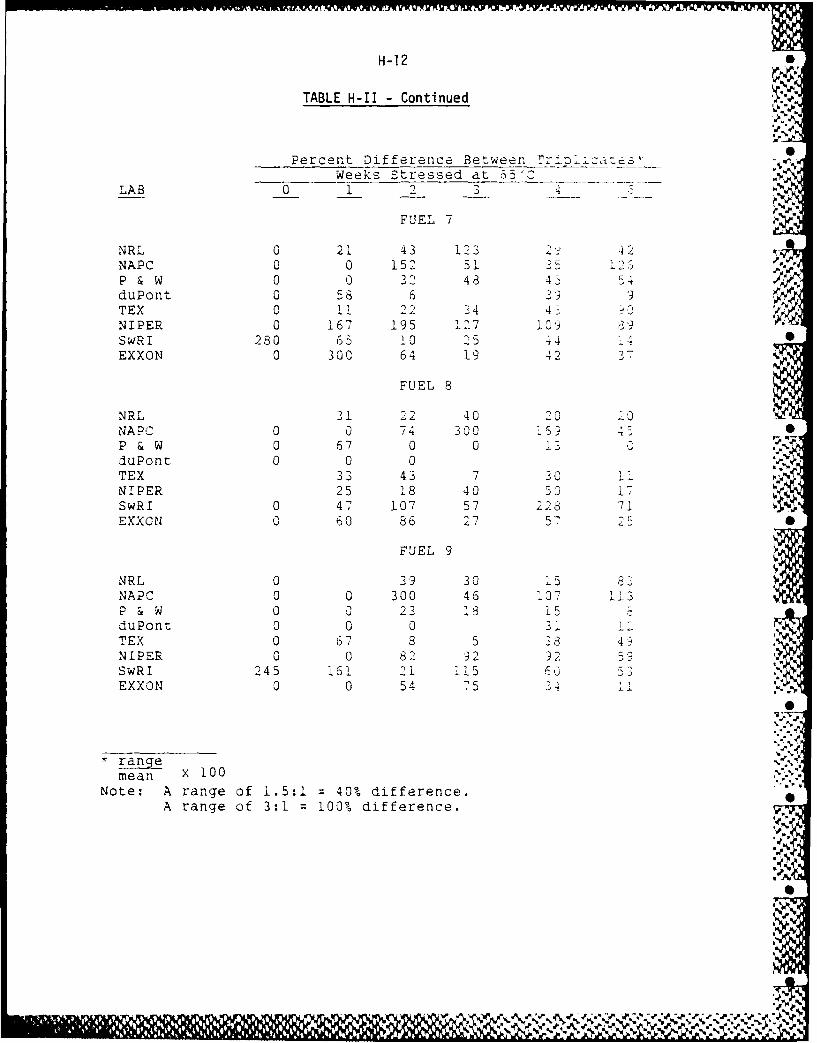
H-12
TABLE H-l - Continued JI.
Percent Difference BetweenTri es,Weeks Stressed at 65'C
LAB 0 1 2 3 4
FUEL 7
NRL 0 21 43 123 2-' 42NAPC 0 0 152 51 123P & W 0 0 2 43 43 -4duPont 0 5 8 6 3 99TEX 0 11 2 2 4 439NIPER 0 167 195 -27 109 89SwRI 230 65 10 25 44 14 0
EXXON 0 300 64 19 42
FUEL 8NRL 31 22 40 20 20
NA P C 0 0 74 300 16 5p&w 0 67 0 0 1 ,duPont 0 0 0TEX 33 43 7 30 Li ,NIPER 25 18 40 50 17SwRI 0 47 107 57 228 71EXXON 0 60 86 27 57 25
FUEL 9
NRL 0 39 30 15 3NAPC 0 0 300 46 107 I132 & W 0 C 23 13 15duPont 0 0 0 31 12TEX 0 67 3 5 33 4NIPER 0 0 82 92 92 5 I.
SwRI 245 161 21 115 --. 3 33EXXON 0 0 54 ,5 3 4 .1 N,
*range %mean x 100
Note: A range of 1.5:1 40% difference.A range of 3:1 = 100% difference.
,%
V, N"0
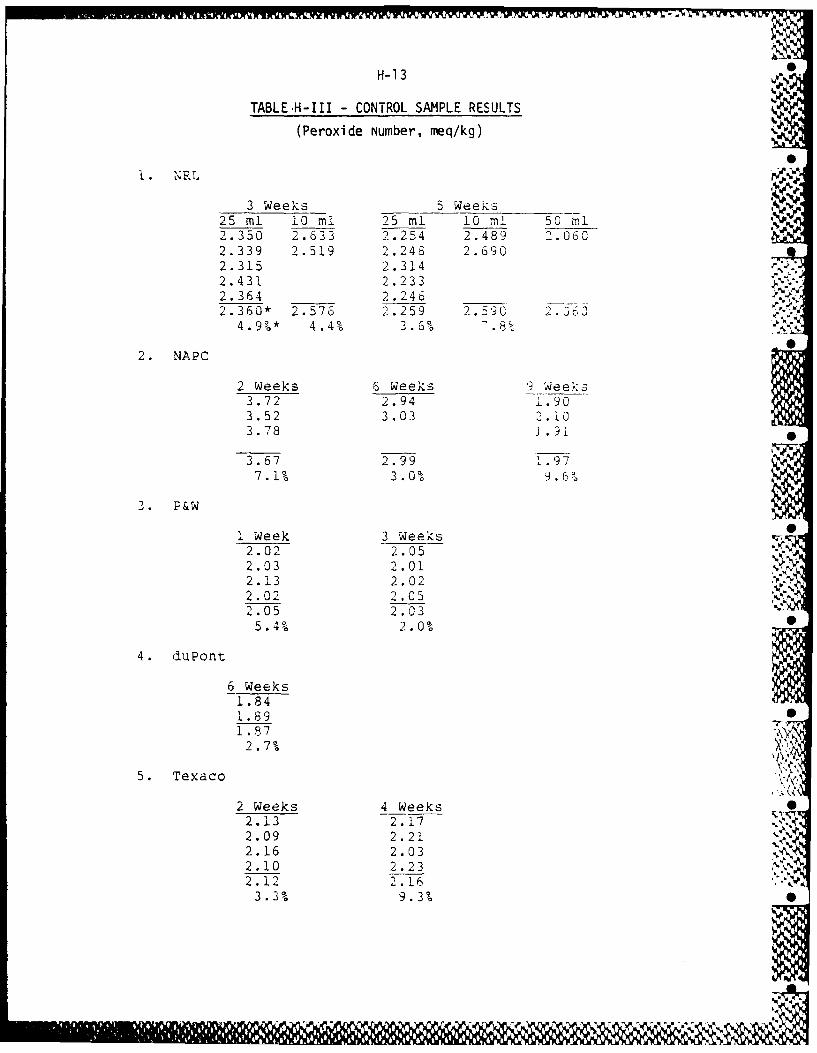
H-1 3
TABLE *H-III - CONTROL SAMPLE RESULTS(Peroxide Number, meq/kg)
SO
3 Weeks 5 Weeks -s25 ml 10 ml 25 ml 10 Ml 50-M ml2.350 2.633 2.254 2.489 2.0602.339 2.519 24.248 2.6902.315 2 .3142. 431 2 .2332.364 __ 2. 246 ___--
2.360* 2.576 2.54.9 .6
4 .9%* 4.4% 3.6q.
2. NAPC
2 Weeks 6 Weeks '9 Weeks3.72 2.94 1.903.52 3.03 2.103.78 19
3.67 2.99 1.977.1% 3. 00% 9.6%
3. P&W
1 Week 3 Weeks2 .02 2. 052.03 2. 0 12.13 2.022.02 2052.05 2.035 .4010 2.00-.
4. duPont
6 Weeks1.841.691 872 .70-
5 . Texaco
2 Weeks 4 Weeks2.13 2. 172.09 2 .212.16 2.03 ~N2.10 2.23 *
2.12 2. 163 .3% 9 .3%
lZA~JI

H-14
TABLE H-Ill - Continued
,. NTPER 0
2 Weeks 4 Weeks2 3 10 ?.3
2.425 2.2872.334 2.3532,.473 2 .324
2642.3 2.312
6.8% 3,g%
7. SwRI
2 Weeks 4 Weeks2.25 2.302.54 2.232.50 2.602.63 -222.48 2.3415.3% 16.2%
8. EXXON ',
Initial (8/27/86) 2 Weeks1.6783 1. 510-1.5844 . 29]71.6635 1.37!1.7252 53811.6629 . 49
8.5% 17 0o
The first value is the average and the econd is the ratioof the range to the average as a percent._•
_I.

7p
_.. ,-_. .. . . %. .. ,