hydrodec group plc/media/files/h/hyrdrodec/investor-docs/results... · this presentation has been...
TRANSCRIPT
HYDRODEC GROUP PLC 2011 Results Presentation April 2012

PRECAUTIONARY STATEMENT
This presentation has been issued by Hydrodec Group plc (“Hydrodec”) and is personal to the recipient. This presentation and these slides may not be reproduced or published in whole or in part for any purpose. This presentation and associated discussion includes forward-looking statements. Certain information contained in this presentation relating to Hydrodec has been compiled from public sources. All statements other than statements of historical fact included in this presentation, including without limitation those regarding the plans, objectives and expected performance of Hydrodec, are forward-looking statements. Hydrodec has based these forward-looking statements on its current expectations and projections about future events, including numerous assumptions regarding its present and future business strategies, operations, and the environment in which it will operate in the future. Forward-looking statements generally can be identified by the use of forward-looking terminology such as 'ambition', 'may', 'will', 'could', 'would', 'expect', 'intend', 'estimate', 'anticipate', 'believe', 'plan', 'seek' or 'continue', or negative forms or variations of similar terminology. Such forward-looking statements involve known and unknown risks, uncertainties, assumptions and other factors related to Hydrodec. By their nature, forward-looking statements involve risks, uncertainties and assumptions and many relate to factors which are beyond the control of Hydrodec, such as future market and economic conditions, external factors affecting operations and the behaviour of other market participants. Actual results may differ materially from those expressed in forward-looking statements. Given these risks, uncertainties, and assumptions, you are cautioned not to put undue reliance on any forward-looking statements. In addition, the inclusion of such forward-looking statements should under no circumstances be regarded as a representation by Hydrodec that Hydrodec will achieve any results set out in such statements or that the underlying assumptions used will in fact be the case. Other than as required by applicable law or the applicable rules of any exchange on which securities of Hydrodec may be listed, Hydrodec has no intention or obligation to update or revise any forward-looking statements included in this presentation. This presentation is for information only and does not constitute or form part of any offer or invitation to sell, or any solicitation of any offer to purchase, any shares in Hydrodec or any other securities, nor shall it or any part of it nor the fact of its distribution form the basis of, or be relied upon in connection with, any contract or investment decision related thereto.
“A fresh start to growth…” What to expect in this presentation:
3
Reflections – Introduction
Business Environment
2011 Results
1Q 2012 Update and Strategic Themes
Section 1: Reflections
“2011 has been a year of improved financial performance and growing operational momentum which has continued into 2012…”
“The technology is unique and proven; and there is real potential to apply it to new products and markets…”
“The sustainability of the process has the potential to be an “absolute good” – the aspiration remains to have an oil product with an associated carbon credit..!”
“Three distinct business models offer a fresh start to grow th, beginning to deliver on the longer-term potential of the Company and its technology…”
5
Section 1: Reflections - Introduction
Adding capability
A proven, commercial technology
The sustainable “closed-loop” business model
Three platforms for growth

Building a strong, experienced management capability…
Ian Smale Chief Executive
Paul Manchester Finance Director
David Robertson Chief Operating
Officer
Lee Taylor Head of Corporate
Development
Mark McNamara Head of Technology
and International Projects
Takuichi Murachi President,
Hydrodec Japan
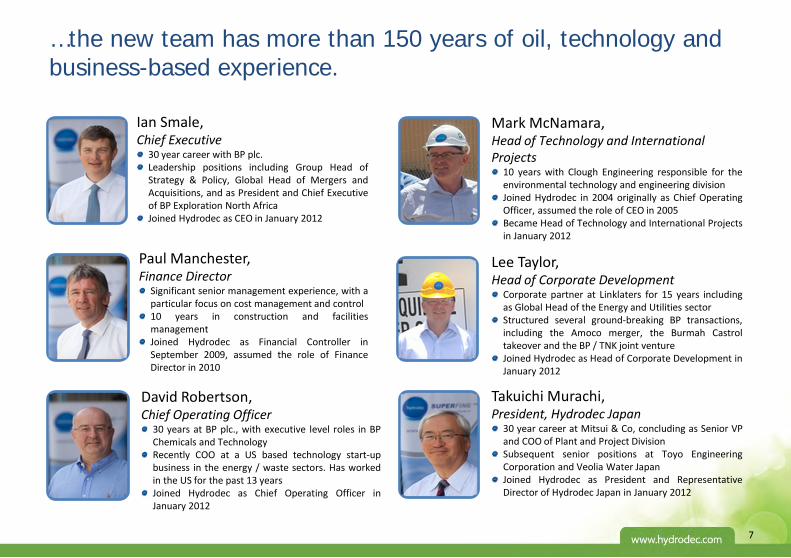
Ian Smale, Chief Executive
30 year career with BP plc. Leadership positions including Group Head of Strategy & Policy, Global Head of Mergers and Acquisitions, and as President and Chief Executive of BP Exploration North Africa Joined Hydrodec as CEO in January 2012
Paul Manchester, Finance Director
Significant senior management experience, with a particular focus on cost management and control 10 years in construction and facilities management Joined Hydrodec as Financial Controller in September 2009, assumed the role of Finance Director in 2010
David Robertson, Chief Operating Officer
30 years at BP plc., with executive level roles in BP Chemicals and Technology Recently COO at a US based technology start-up business in the energy / waste sectors. Has worked in the US for the past 13 years Joined Hydrodec as Chief Operating Officer in January 2012
Mark McNamara, Head of Technology and International Projects
10 years with Clough Engineering responsible for the environmental technology and engineering division Joined Hydrodec in 2004 originally as Chief Operating Officer, assumed the role of CEO in 2005 Became Head of Technology and International Projects in January 2012
Lee Taylor, Head of Corporate Development
Corporate partner at Linklaters for 15 years including as Global Head of the Energy and Utilities sector Structured several ground-breaking BP transactions, including the Amoco merger, the Burmah Castrol takeover and the BP / TNK joint venture Joined Hydrodec as Head of Corporate Development in January 2012
Takuichi Murachi, President, Hydrodec Japan
30 year career at Mitsui & Co, concluding as Senior VP and COO of Plant and Project Division Subsequent senior positions at Toyo Engineering Corporation and Veolia Water Japan Joined Hydrodec as President and Representative Director of Hydrodec Japan in January 2012
7
…the new team has more than 150 years of oil, technology and business-based experience.
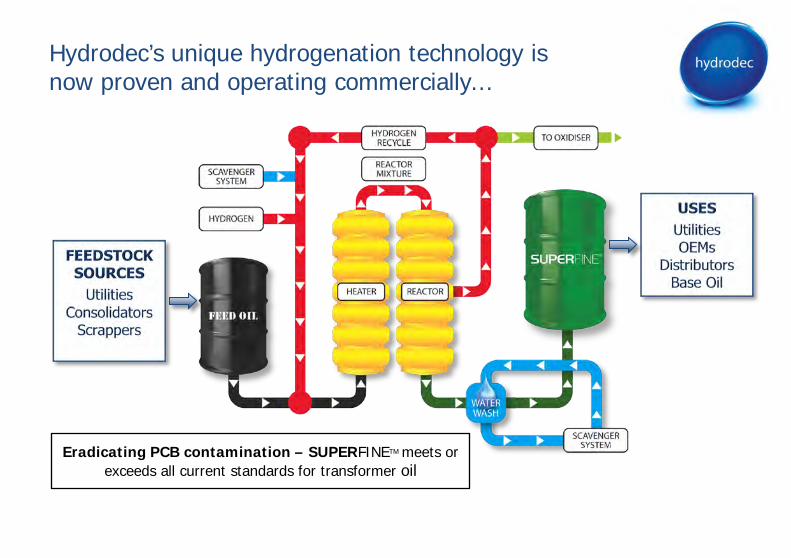
Hydrodec’s unique hydrogenation technology is now proven and operating commercially…
Eradicating PCB contamination – SUPERFINETM meets or exceeds all current standards for transformer oil

The technology, originally designed to treat PCB (polychlorinated biphenyl) contamination, was developed in Australia;
We estimate that our trade secrets and know-how provide at least 5 years of competitive IP protection;
The process is extremely efficient, rendering PCB contamination into an inert residue and recovering 99.9% of the original oil;
The SUPERFINETM branded product is equivalent if not better than new mineral transformer oil, and ultimately sustainable.
9
…beyond patent protection, six years of operating experience have simplified and consolidated the technical IP.

The sustainable “closed-loop” clean-tech lubricant solution…
Cost competitive
High Quality & Performance –
meets or exceeds standards
Low Carbon Emissions
Used Transformer Oil (with/without PCB
contamination)
Replaces new mineral oil supply
UTILITIES
PCB eradication
Competes with incineration as most likely alternative to
manage liability risk
Near 100% recovery factor Potential Carbon
Credit
The virtual “closed-loop” business model remains an aspiration;
The used oil market is fragmented and increasingly competitive – especially in the US;
The closed-loop offers “liability management” for used, contaminated oil. Incineration is the key disposal alternative, and industry conservatism the major challenge;
The offer does not rely on regulatory support; but regulation does influence the business model most likely to be effective;
A methodology is being prepared to test against the United Nations Framework Convention on Climate Change and Verified Carbon Standard for full carbon qualification.
…has the potential to be an “absolute good” – potentially the first oil product that could be delivered with an associated carbon credit!
11

There are three platforms for growth…

13
…2011 has been a turning point, a year of improving financial performance and operational momentum.
Young, NSW, Australia pilot plant 2004 commercial plant commissioned April 2006 productive capacity 6.5m litres pa
Canton, Ohio, USA plant commissioned Oct 2008 productive capacity 27m litres pa EPA licence to treat PCB material – expected 2012
Japan Strategic Alliance with Kobelco Eco-Solutions March 2010 first operating JV agreement signed July 2011 first plant commissioning, expected in 2013

This slide has been left intentionally blank

Section 2: Business Environment
Global demand for Transformer oil is growing at ca. 2% per annum…
Like all oil products, price benchmarks can be a useful guide to price and margin expectations…
Regulation varies; it can help define the market structure…
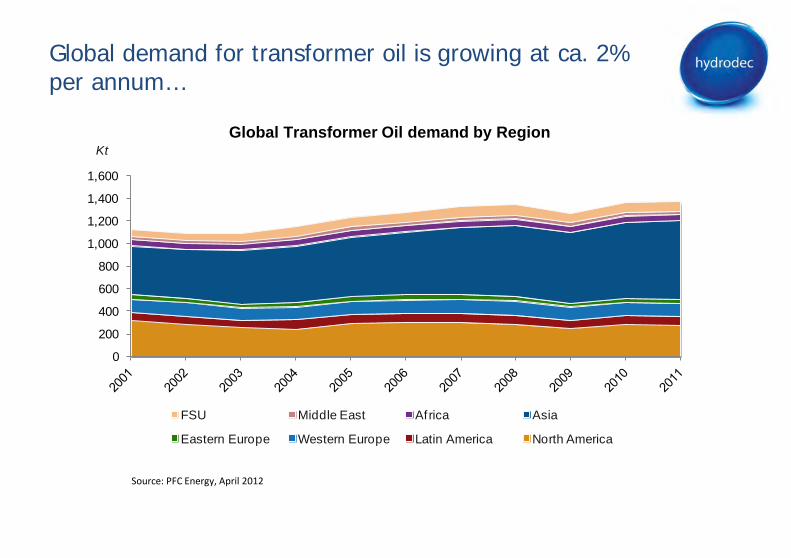
Global demand for transformer oil is growing at ca. 2% per annum…
0
200
400
600
800
1,000
1,200
1,400
1,600
KtTransformer Oil Demand by Region
FSU Middle East Africa Asia
Eastern Europe Western Europe Latin America North America
Global Transformer Oil demand by Region
Source: PFC Energy, April 2012

Global demand for transformer oil grew at an average of 2% pa. over the past 10 years driven by demand for power;
Most of the new oil demand came from Asia at 5% pa., where China, India and Vietnam drive new demand;
Flat demand in North America and Europe has reversed recently with increased investment in new transmission and decommissioning,
The exact scale of the used transformer oil market is difficult to assess but market evidence suggests at least 250-300 million litres pa. of used oil in the US;
There is also evidence that specific crudes that supply the transformer oil market are in decreasing supply.
… the link between new oil demand and contaminated oil for recycling is best developed in the legacy power generation and transmission infrastructure of the US, and other OECD countries.
17

$0.00
$1.20
Jan-10 Jan-11 Jan-12
ICIS (Avg $/Lit) Sales Price (indicative)
WTI ($/Lit)
Like all oil products, benchmarks can be a useful guide to price and margin expectations…
Revenue: Sales pricing correlates well with ICIS Pale 60 posted price
Cost: Feedstock prices trend similarly to NYH Ultra Low Sulfur No. 2 Diesel
ICIS: petrochemical market information provider Platts New York Harbour Ultra Low Sulfur No.2 Diesel
$0.00
$1.20
Jan-10 Jan-11 Jan-12
NYH Ultra Low Sulfur No. 2 Diesel ($/Lit)
Feedstock Purchase Cost (indicative)
19
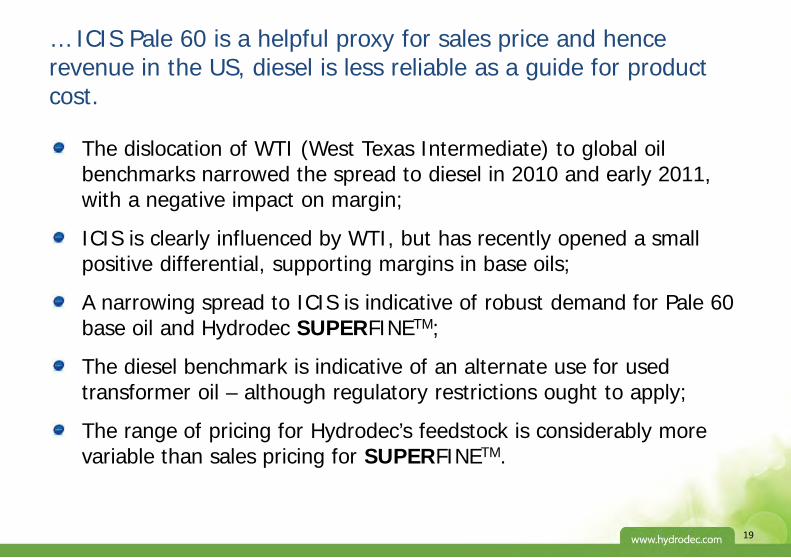
The dislocation of WTI (West Texas Intermediate) to global oil benchmarks narrowed the spread to diesel in 2010 and early 2011, with a negative impact on margin;
ICIS is clearly influenced by WTI, but has recently opened a small positive differential, supporting margins in base oils;
A narrowing spread to ICIS is indicative of robust demand for Pale 60 base oil and Hydrodec SUPERFINETM;
The diesel benchmark is indicative of an alternate use for used transformer oil – although regulatory restrictions ought to apply;
The range of pricing for Hydrodec’s feedstock is considerably more variable than sales pricing for SUPERFINETM.
… ICIS Pale 60 is a helpful proxy for sales price and hence revenue in the US, diesel is less reliable as a guide for product cost.
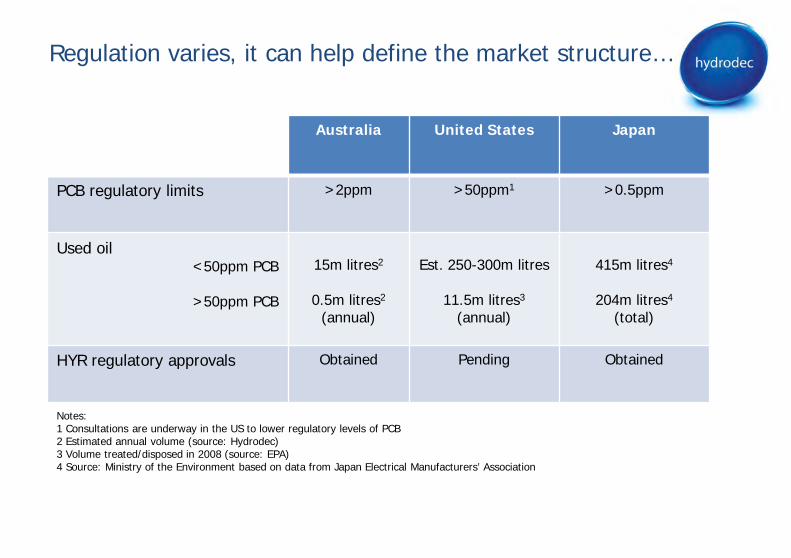
Regulation varies, it can help define the market structure…
Australia United States Japan
PCB regulatory limits >2ppm >50ppm1 >0.5ppm
Used oil <50ppm PCB
>50ppm PCB
15m litres2
0.5m litres2
(annual)
Est. 250-300m litres
11.5m litres3
(annual)
415m litres4
204m litres4
(total)
HYR regulatory approvals Obtained Pending Obtained
Notes: 1 Consultations are underway in the US to lower regulatory levels of PCB 2 Estimated annual volume (source: Hydrodec) 3 Volume treated/disposed in 2008 (source: EPA) 4 Source: Ministry of the Environment based on data from Japan Electrical Manufacturers’ Association

21
The US threshold level for PCB contamination is relatively high, a lower threshold would create a substantial opportunity;
EPA accreditation in the US will endorse the Hydrodec process and technology, materially enhancing the offer at lower or higher levels of PCB contamination;
Government subsidy in Australia supports a sub-scale commercial operation;
The Hydrodec technology is the only non-destructive treatment process licenced in Japan.
…different business models access different available margin structures, influenced by but not dependent on regulation.

This slide has been left intentionally blank

Section 3: Performance
2011 has been a year of improved financial performance, and operational momentum…
Safe and reliable operations are a priority, and product quality critical…
Revenues have shown strong growth…
A focus on “level loading” the plant at Canton has resulted in a more flexible approach to the market…
Margin improvement has benefited from a widening pricing spread…
Existing facilities are now commercial and can be cash generative at an achievable operating level…
23

2011 has been a year of improving financial performance and operational momentum…
Revenues up 26% to US$22.4 million (2010: US$17.8 million) driven by a more diversified customer and product mix;
SUPERFINE sales volumes of 20.3 million litres improved slightly on prior year (2010: 20.2 million litres), especially in the second half with 2H volumes up 15% on 1H;
Gross unit margins up 31% to US$0.25 per litre (2010: US$0.19 per litre) a function of both pricing and improving utilisation;
Cash outflow from operations down 23% to US$3.5m (2010: US$4.5m)
25
Signed first operating JV agreement for Japan;
Raised £7.5m in debt/equity to fund capability to grow the business;
Appointed key hires in Canton and Japan;
Invested in experience to supplement the existing management team.
… improving operational performance has led to an investment in the business for the future.
… a change in operational philosophy has challenged the assumption that feedstock is the key constraint.
Access to sources of feedstock, especially in the US, has increased with more flexible procurement, although at a higher average price;
Operating cash flow break-even at the current operating capacity is possible.
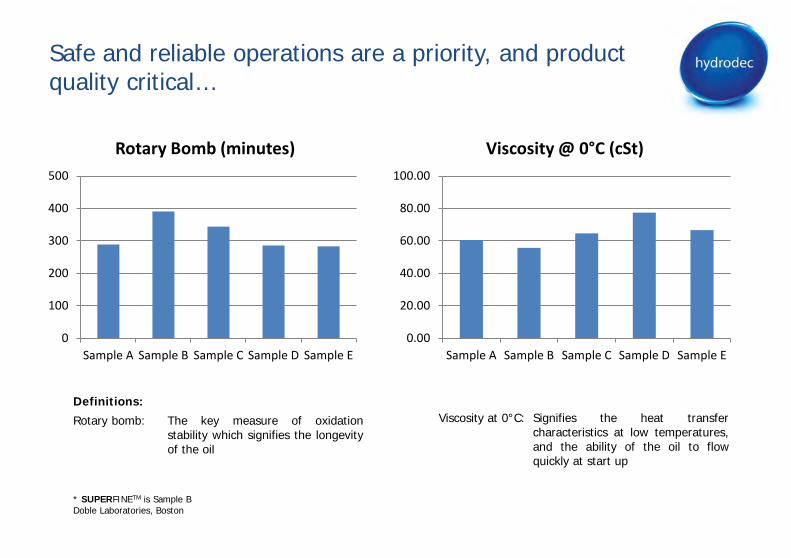
Safe and reliable operations are a priority, and product quality critical…
0
100
200
300
400
500
Sample A Sample B Sample C Sample D Sample E
Rotary Bomb (minutes)
0.00
20.00
40.00
60.00
80.00
100.00
Sample A Sample B Sample C Sample D Sample E
Viscosity @ 0°C (cSt)
Rotary bomb: The key measure of oxidation stability which signifies the longevity of the oil
Viscosity at 0°C: Signifies the heat transfer characteristics at low temperatures, and the ability of the oil to flow quickly at start up
Definitions:
* SUPERFINETM is Sample B Doble Laboratories, Boston

27
There were no lost time working incidents in 2011;
A total of 303 hazard observations and minor incidents were investigated and 92% were actioned as operational improvements;
There were no reportable spills during the year; 26 incidents reportable against our internal systems were retained within the designed infrastructure with no release of contaminated or polluted water or liquid;
Blind quality tests on SUPERFINETM exhibited a very competitive range of attributes verses like products.
Hydrodec SUPERFINETM meets or exceeds all standards and in tests compares well against competitor products.

0%
20%
40%
60%
80%
100%
2010 2011 2010 2011
Scrapper
Consolidator
Utility
Distributor
OEM
Utility
A focus on “level loading” the plant at Canton has resulted in a more flexible approach to the market…
010203040506070
2009 2010 2011
Total Suppliers (US only)
0%
20%
40%
60%
80%
100%
2010 2011 2010 2011
Contract Mix (Group)
Spot
Contract
FEEDSTOCK SALES FEEDSTOCK SALES
0%
20%
40%
60%
80%
100%
2009 2010 2011 2H 2011
Utilisation (Group)
Product Mix (Group)

29
Sources of supply more than doubled, with 39 suppliers greatly improving the diversity and hence the security of supply;
After operational issues mid-year, plant utilisation regained momentum finishing the year at higher than the 60% year average;
Just under 40% of total supply was procured via longer term agreements increasing the predictability of product quality;
39 new sources of supply and 23 new customers were gained in the US in 2011, evidence of more effective procurement and sales;
…and early signs of progress tracking sales volumes directly to utilities have encouraged the team on the basic value of the business model.
… resulting in better access to feedstock and improving operational momentum.

Revenues have shown strong growth…
-
10
20
30
40
2009 2010 2011
Total Customers (US only)
0%20%40%60%80%
100%
2010 2011
Sales by Product Type
Transformer oil Base oil
0%20%40%60%80%
100%
2010 2011
Sales by Destination
Domestic Export
0
5
10
15
20
25
2009 2010 2011
Total Revenue
US$
m

31
Increases in revenue were predominantly driven by higher pricing as a result of improved product and customer mix and favourable market conditions;
Widening of the spread between WTI or ICIS Pale 60 and NYH Low Sulfur No. 2 Diesel contributed about 50% of the improved margin;
Market opportunity and improving plant flexibility allow for some price arbitrage in the spot market, especially into Pale 60 base oil;
A more entrepreneurial approach to feedstock supply reflects a maturing market presence and growing confidence in capability;
Term agreements in the US, Mexico and Canada have provided a base load of demand for SUPERFINETM.
…benefiting from a more diversified customer and product mix.
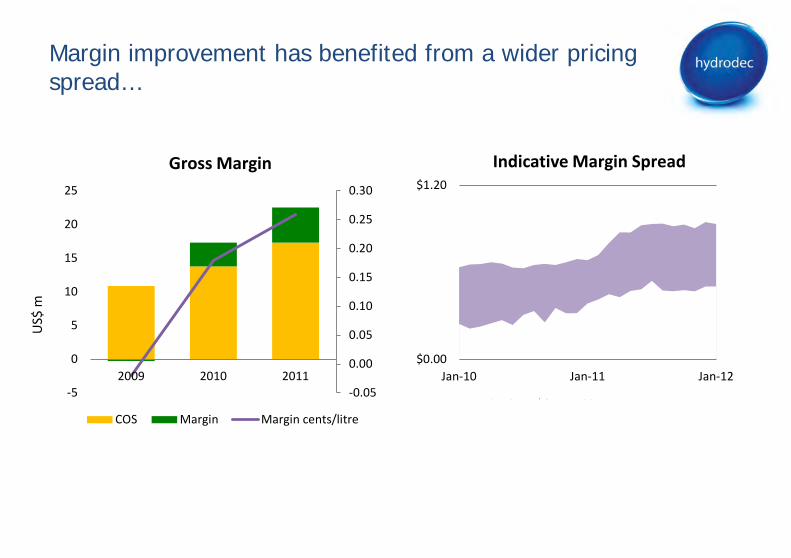
Margin improvement has benefited from a wider pricing spread…
US$
m
-0.05
0.00
0.05
0.10
0.15
0.20
0.25
0.30
-5
0
5
10
15
20
25
2009 2010 2011
Gross Margin
COS Margin Margin cents/litre
$0.00
$1.20
Jan-10 Jan-11 Jan-12
Sales (Avg $/Lit Net)*
Feedstock Purchase (Avg $/Lit Invoiced)
Indicative Margin Spread
33
The differential between average sales price and ICIS Pale 60 has narrowed over the year by 33%;
This reflects the continued focus on customer and supplier mix;
A better mix of spot and contract volumes, and active management of channels of trade have improved margin mix.
… but has been reinforced by better, more diversified feedstock procurement and channel management

0
5
10
15
20
25
30
35
40
1 2
Cash Sources & Uses
Interest/leases
Investing activities (net)
Admin costs
Cost of sales
Debt funding
Equity funding
Opening cash
Revenue
Existing facilities are now commercial and can be cash generative at an achievable operating level…
2011
US$
m
Sources
Uses

35
Increasing revenue is making a bigger contribution to cost and overhead cover;
Operating cash outflow is down 25% to US$3.5m (2010: US$4.5m);
Cash outflow in second half 2011 further improved to US$1.2m (H1 2011: US$2.3m);
Growth expenditure in 2011 accounted for US$0.8m of the admin overhead, this will increase in 2012.
… there is more upside to current performance, and second half momentum is continuing, particularly in the US

This slide has been left intentionally blank
37
Momentum in the existing business will remain a key focus and creates a credible platform for future growth…
Three business models offer different access points for growth…
In the US the virtual “closed loop” offer and a fresh approach to feedstock supply can provide wider access to the very material US market…
In Japan the “waste and liability management” model is a unique non-destructive offer in a stringently regulated and material market…
Australia as a “technology incubator” can offer access to other profitable uses of the technology…
Lessons learnt over seven years of operating and development experience will inform how we progress the business…
Section 4: Update and Strategic Themes – “a fresh start to growth…”
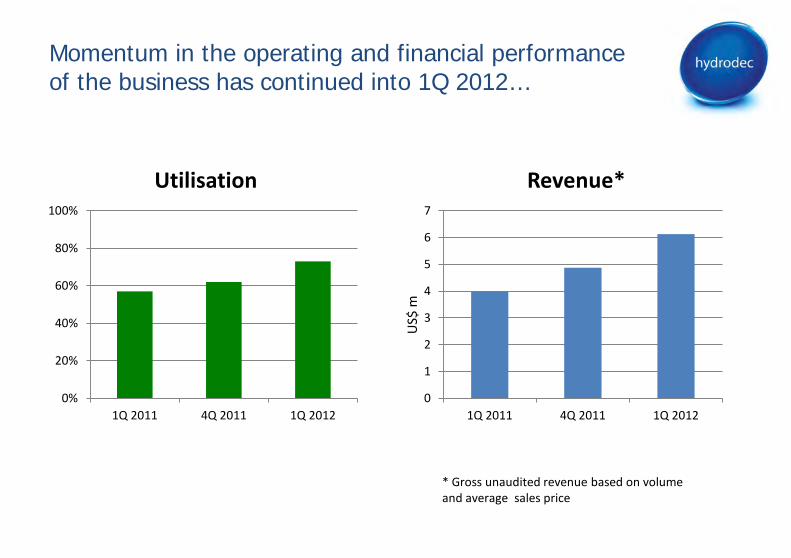
Momentum in the operating and financial performance of the business has continued into 1Q 2012…
0%
20%
40%
60%
80%
100%
1Q 2011 4Q 2011 1Q 2012
Utilisation
US$
m
0
1
2
3
4
5
6
7
1Q 2011 4Q 2011 1Q 2012
Revenue*
* Gross unaudited revenue based on volume and average sales price

39
1Q SUPERFINETM sales volumes of 5.95 million litres are up 12.5% on 4Q 2011, and 14.9% up on 1Q 2011;
Gross margins are up on previous quarter and substantially higher than 1Q 2011, mostly due to self-help;
Plant utilisation has been increasing through the quarter averaging 73% in 1Q, compared to 60% in 2011;
We are confident that cash flow from operations can make an increasing contribution to covering group overheads, where a defined portion is focussed on growth.
… improving organic performance creates the confidence for further investment in capability and options for growth.
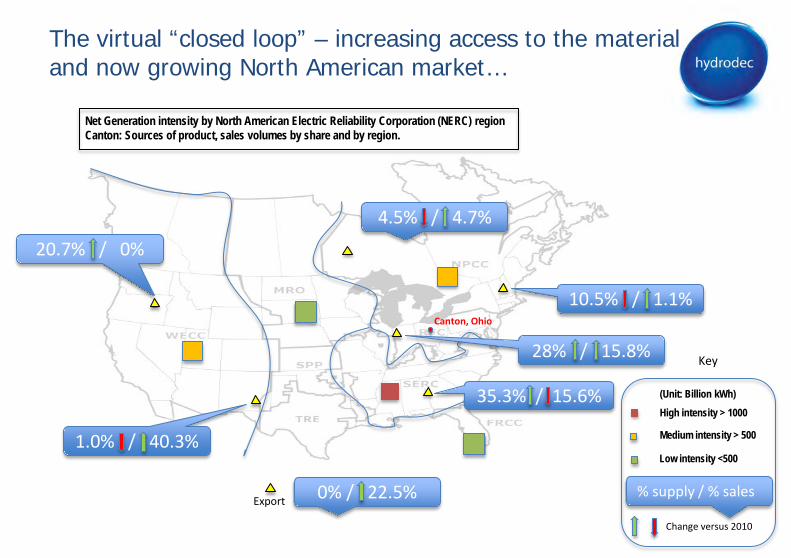
The virtual “closed loop” – increasing access to the material and now growing North American market…
High intensity > 1000 (Unit: Billion kWh)
Net Generation intensity by North American Electric Reliability Corporation (NERC) region Canton: Sources of product, sales volumes by share and by region.
4.5% / 4.7%
Canton, Ohio
Medium intensity > 500
Low intensity <500
Export
10.5% / 1.1%
1.0% / 40.3%
0% / 22.5%
28% / 15.8%
35.3% / 15.6%
20.7% / 0%
% supply / % sales
Change versus 2010
Key

41
The North American market for new transformer oil has grown by 6% pa. over the last two years;
There is an apparent link between new demand and used transformer oil that can be as high as 75%;
Transformer oil is predominantly purchased by or sold to the utilities through equipment manufacturers; in the US, these are focussed in the south east, mid-west and west coast;
The geographical dislocation of electricity generation, supply to and sales from Canton suggests further optimisation is possible;
Further differentiation of Hydrodec’s offer will support increasing access to the US, which would, in turn, support capacity addition in the US.
…the “virtual closed loop” and a fresh approach to feedstock supply are creating operational momentum at Canton.
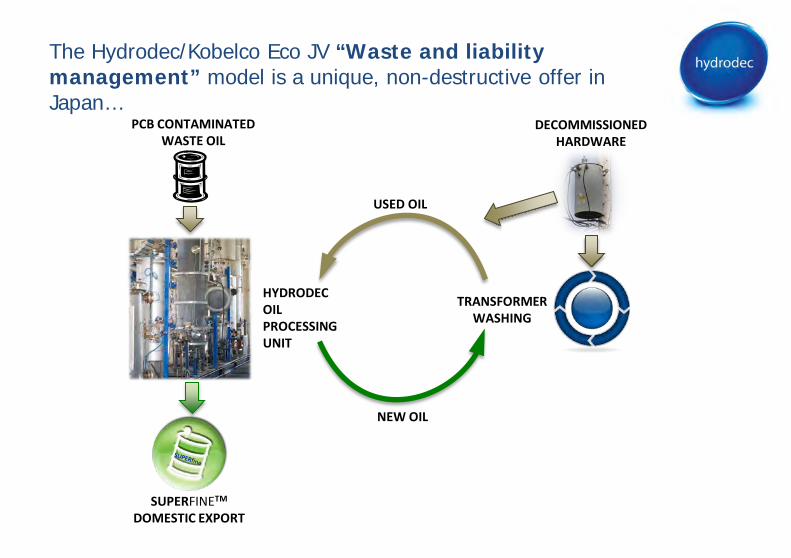
The Hydrodec/Kobelco Eco JV “Waste and liability management” model is a unique, non-destructive offer in Japan…
PCB CONTAMINATED WASTE OIL
SUPERFINETM
DOMESTIC EXPORT
TRANSFORMER WASHING
DECOMMISSIONED HARDWARE
HYDRODEC OIL PROCESSING UNIT
USED OIL
NEW OIL
43
There remains strong evidence of at least 600 million litres of contaminated oil in Japan;
The “Pacific Eco” joint venture has the only certified non-destructive technology for handling this waste;
A “closed loop” exists to supply clean and receive contaminated oil from an associated transformer washing facility;
Excess volumes will be available for export into the rapidly growing Asian market;
To deliver a first plant in 2013 will require a more direct contribution to the joint venture than previously envisaged.
…start up delays have not diminished confidence in the business proposition or the JV’s competitive potential.
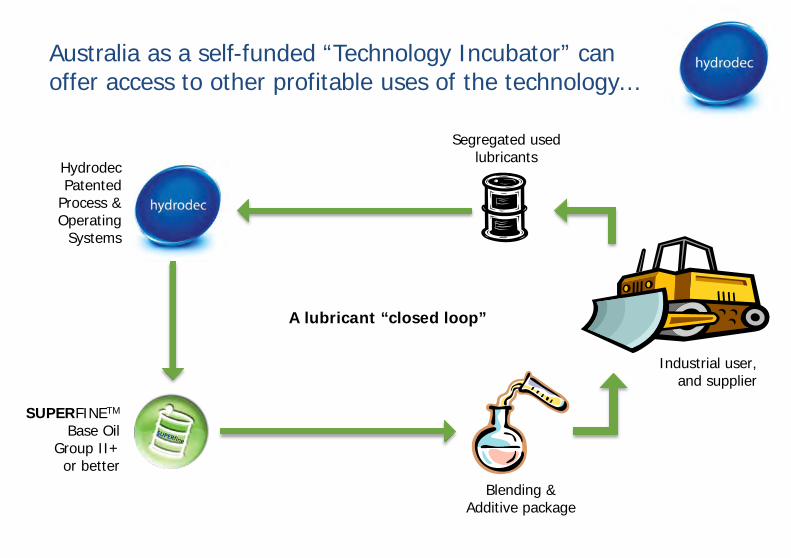
Australia as a self-funded “Technology Incubator” can offer access to other profitable uses of the technology…
Hydrodec Patented
Process & Operating
Systems
SUPERFINETM
Base Oil Group II+ or better
Blending & Additive package
Segregated used lubricants
Industrial user, and supplier
A lubricant “closed loop”
45
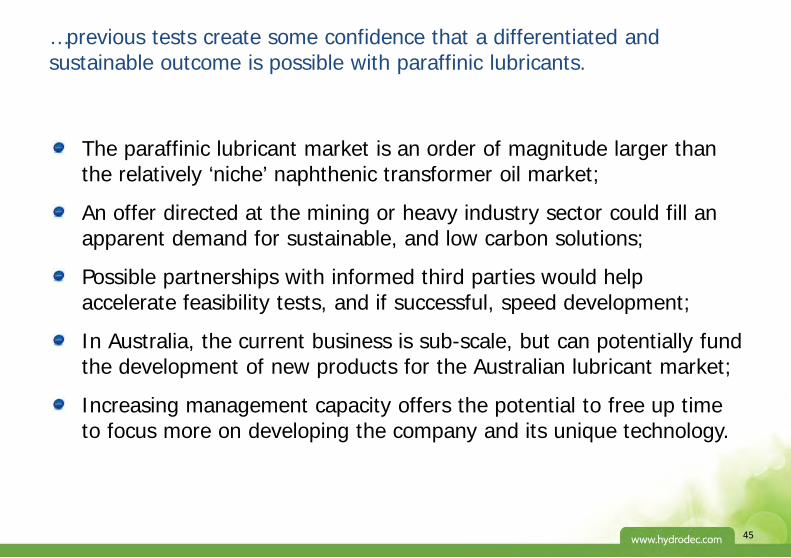
The paraffinic lubricant market is an order of magnitude larger than the relatively ‘niche’ naphthenic transformer oil market;
An offer directed at the mining or heavy industry sector could fill an apparent demand for sustainable, and low carbon solutions;
Possible partnerships with informed third parties would help accelerate feasibility tests, and if successful, speed development;
In Australia, the current business is sub-scale, but can potentially fund the development of new products for the Australian lubricant market;
Increasing management capacity offers the potential to free up time to focus more on developing the company and its unique technology.
…previous tests create some confidence that a differentiated and sustainable outcome is possible with paraffinic lubricants.

Lessons learnt over seven years of operating and development experience will inform how we progress the business…

47
Achieving a measured carbon footprint as well as US EPA accreditation will aid market penetration and support further opportunities;
Serial undercapitalisation has forced a necessary focus on the stability of the operating platform, but investment in capability will be required to support growth;
The potential de-leveraging of the balance sheet with CULS conversion will help create optionality for a future financial framework to support growth;
Active investment in technology development offers the potential to open new markets and applications that would radically change the potential market and product mix for the technology.
… a focused and prudent approach will continue to require investment in capability – first the human capacity, and only then financial.
FUNDRAISING ACTIVITIES: 1 11/06/07 £2.3m placing (25p) 2 21/04/08 £5m placing (50p) 3 23/02/09 £1.9m placing (10p)
4 12/06/09 £3.2m placing (14p)
5 15/12/09 £2.1m placing (12p) 6 23/03/10 £2m placing (10p) 7 24/09/10 £3m placing (6p) 8 25/05/11 £2m debt funding 9 02/11/11 £5.5m placing (10p)

This slide has been left intentionally blank

Income Statement
Cashflow
Balance Sheet
Section 5: Appendix

This slide has been left intentionally blank

Income Statement
12 Months ended 12 Months ended Dec-11 Dec-10 USD$m USD$m Revenue 22.4 17.8 Gross profit 5.0 3.8 Plant overhead 3.3 3.9 Treatment of Young contaminated material 1.2 - Corporate support 7.7 7.0 Growth projects 0.8 0.6 Unrealised FX gain -0.1 -1.1 Operating costs 13.0 10.5 Operating profit/(loss) -8.0 -6.7 Net finance cost -3.9 -3.0 Income tax 0.4 0.8
Profit/(loss) for the year -11.5 -8.8

This slide has been left intentionally blank
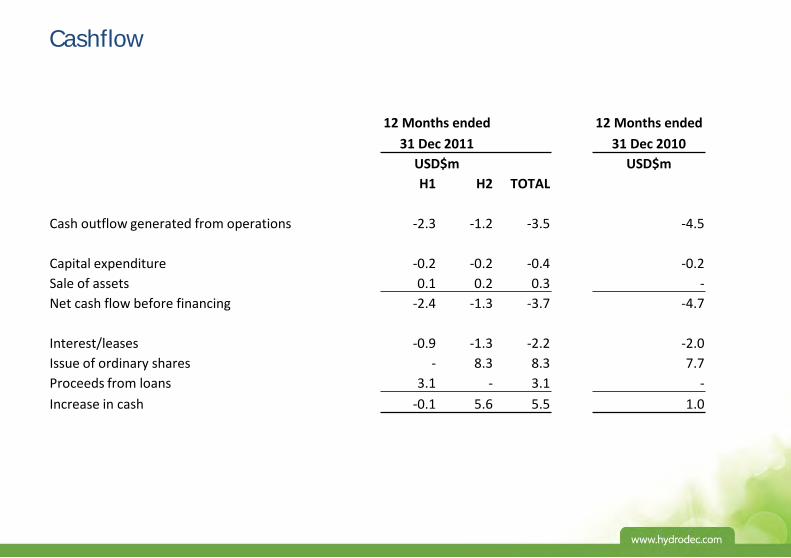
Cashflow
12 Months ended 12 Months ended 31 Dec 2011 31 Dec 2010 USD$m USD$m H1 H2 TOTAL Cash outflow generated from operations -2.3 -1.2 -3.5 -4.5 Capital expenditure -0.2 -0.2 -0.4 -0.2 Sale of assets 0.1 0.2 0.3 - Net cash flow before financing -2.4 -1.3 -3.7 -4.7 Interest/leases -0.9 -1.3 -2.2 -2.0 Issue of ordinary shares - 8.3 8.3 7.7 Proceeds from loans 3.1 - 3.1 - Increase in cash -0.1 5.6 5.5 1.0

This slide has been left intentionally blank

Balance Sheet
Dec-11 Dec-10 USD$m USD$m Fixed assets 23.2 24.4 Intangibles * 22.8 25.0 Non-current assets 46.1 49.4 Cash 7.0 1.7 Other current assets 3.1 2.4 Current liabilities 4.1 4.0 Net current assets 5.9 0.1 Provisons 0.6 0.0 Long term borrowings ** 13.5 8.6 Deferred tax 1.9 2.4 Net assets 36.0 38.5 * Patent, goodwill and Hydrodec technology ** Predominantly Convertible Loan Stock

This slide has been left intentionally blank

This slide has been left intentionally blank
Ian Smale Chief Executive [email protected]
Mike Preen Head of Corporate and Legal Affairs [email protected]
London Office 50 Curzon Street London W1J 7UW Main: +44 (0)20 7907 9220
www.hydrodec.com

This slide has been left intentionally blank