hydroband: the continuous hydration monitoring system
TRANSCRIPT

The University of AkronIdeaExchange@UAkron
Honors Research Projects The Dr. Gary B. and Pamela S. Williams HonorsCollege
Spring 2016
HydroBand: The Continuous HydrationMonitoring SystemKarina E. AtkinsonUniversity of Akron, [email protected]
Catherine P. BenedictUniversity of Akron, [email protected]
Please take a moment to share how this work helps you through this survey. Your feedback will beimportant as we plan further development of our repository.Follow this and additional works at: http://ideaexchange.uakron.edu/honors_research_projects
Part of the Biomedical Devices and Instrumentation Commons, and the Sports SciencesCommons
This Honors Research Project is brought to you for free and open access by The Dr. Gary B. and Pamela S. WilliamsHonors College at IdeaExchange@UAkron, the institutional repository of The University of Akron in Akron, Ohio,USA. It has been accepted for inclusion in Honors Research Projects by an authorized administrator ofIdeaExchange@UAkron. For more information, please contact [email protected], [email protected].
Recommended CitationAtkinson, Karina E. and Benedict, Catherine P., "HydroBand: The Continuous Hydration Monitoring System"(2016). Honors Research Projects. 299.http://ideaexchange.uakron.edu/honors_research_projects/299

1
HydroBand: The Continuous Hydration Monitoring System
Honor’s College Members: Karina Atkinson & Catherine Benedict
Other Group Members: Chris Bender, Ryan Hayes, and Jeffrey Schreiber
Department of Biomedical Engineering
April 26, 2016

2
Table of Contents
Introduction…………………………………………….……3
Background Information………………………………….....4
Project Objectives and Goals………………………………..5
Methods, Procedures, and Manufacturing…………………..7
Performance Testing………………………………………..12
Future Directions………………….………………………..15
Challenges………………………………………………….15
References………………………………………………….16
Appendices
Appendix A: Functional Requirements……………….18
Appendix B: Constraints and Limitations…………….22
Appendix C: Gantt Chart…………………………...…28
Appendix D: Budget Specifications………………......30
Appendix E: Development Plan……………………....33
Appendix F: Testing Data…………………………….35

3
Introduction
After researching the health and fitness market, it was determined that a convenient way to
properly monitor one’s hydration level was not available. Dehydration during exercise is defined
as the dynamic loss of body water that is associated with an increase in core body temperature,
an increase in cardiovascular strain, and decreases in blood sodium levels and stroke volume
(Volpe). In the article Estimation of Pre-practice Hydration Status of National Collegiate
Athletic Association Division I Athletes from the Journal of Athletic Training, “Appropriate
hydration is an important but often overlooked aspect of proper training and competition”
(Volpe). Early signs of dehydration include dry mouth, fatigue, poor elasticity of the skin,
decreased urine output, headaches, and dizziness. If left untreated, dehydration can potentially
lead to fever, low blood pressure, rapid heartbeat, rapid breathing, delirium, and unconsciousness
(“Dehydration”).
Hydration levels in athletes should be monitored in order to prevent dehydration before,
during, and after exercise. The HydroBand™ device works by calculating dehydration levels in
terms of water loss and alerts the user as to how much water is needed to combat dehydration. If
the user’s temperature reaches dangerous levels, the user will be alerted as well. These values are
calculated using an IR temperature sensor that is positioned across the user’s chest. The infrared
(IR) sensor constantly records the user’s core body temperature and relates the change in
temperature to water loss. The mission statement for the HydroBand is as followed:
“HydroBand is devoted to being involved in people’s well-being by empowering them to
control their fitness ambitions.”
Dr. Otterstetter, our primary client, provided additional guidance for this project. Dr.
Otterstetter is an associate professor in the Department of Sport Science and Wellness Education
at The University of Akron. With the help of Dr. Otterstetter, other hydration measuring devices

4
will be used in testing protocols and the labs in the Exercise Science department will be utilized.
By combining Dr. Otterstetter’s expertise on body physiology and the team’s education on
engineering core concepts, the HydroBand solves the unmet medical need of dehydration in
athletes.
Background Information
There are numerous other ways to measure dehydration besides changes in core body
temperature. These range from blood analysis, urine analysis, weight loss, skin elasticity tests,
pH levels in sweat, and the osmolality in saliva. An IP search was performed on existing
products on the market that related to this medical need. Product technicality, functions, and any
patents that existed were researched and noted in the project binder. The fitness wearables
market in the United States is showing steady growth with no signs of a decline. According to
WinterGreen Research, Inc., the sports and fitness performance wearable market was valued at
$3.5 billion in 2014, with a projected market value of $14.9 billion by 2021 (Market Reports
Hub, web). The wearable devices shipment revenue itself is currently valued at $20 billion
(Hunn, web). Numerous existing devices on the market track the user’s temperature, however
none of them apply the mathematical relationship between core temperature and hydration level
that will be implemented in the HydroBand.
One of HydroBand’s leading competitors on the market is a smart baseball cap. The
Spree Smartcap uses biosensors to measure the user’s skin temperature at their forehead. It also
records heart rate, pace/cadence, and distance covered during the workout. The smart cap is also
supported by Bluetooth Smart© for corresponding smartphone app functionality. Most athletes
either find wearing hats impractical or are not allowed to wear one during competition. Another
product discovered during the IP search was the CorTemp® Ingestible Core Body Temperature

5
Sensor. This small capsule contains a sensor that wirelessly transmits core body temperature as it
travels through the digestive tract. One of the major disadvantages with this pill is that it is not
reusable and is expensive. The popular Fitbit and similar wrist watch devices take the skin
temperature at the user’s wrist while tracking and displaying other health factors. The
VitalSense® Dermal Temperature Patch is a disposable sensor patch for wireless skin surface
recordings. The Polar© Heart Rate Chest Belt takes the skin temperature at the chest while also
calculating the user’s heart rate during exercise.
The only device found that relates the temperature reading to hydration is the Cosinuss
Technology wearable in-ear device that continuously monitors core temperature via the tympanic
membrane. If the temperature rises to a dangerous level that indicates dehydration, a
corresponding “warning light” will display. HydroBand differs from what is on the market
because it serves as the only device that will input the temperature reading and convert this into a
specific amount of liquid that needs to be consumed to return the user to a healthy and hydrated
state during strenuous exercise. Since many sports prohibit wearing wrist bands, headbands, and
other outside equipment, the chest band provides a convenient and appropriate location for a
larger variety of athletes. A complete functional and system block diagram and description of
how the HydroBand device works is explained in Appendix A: Functional Requirements.
Project Objectives and Goals
The majority of all project objectives stem from the design process outlined in
Biomedical Engineering Design I and II class and through the assigned textbook, Tools and
Tactics of Design (Kinzel et al.). Original objectives included brainstorming different unmet
medical needs, filtering through ideas, identifying a client, patent and research searches, and
eventually devising solutions to solve these unmet needs. All of these objectives were reached in
6
the fall semester and have been thoroughly recorded. This documentation is shown in the project
binder in the form of Coggle brainstorming charts, patent and research searches, decision
matrices, and meeting minutes from each client and team meeting. After developing solutions,
the objectives for this project started to gear more towards establishing ways to build a prototype
and how this would be accomplished. After an initial alpha prototype was created, the
functionality was evaluated and all issues were addressed in order to begin transition into the
working beta prototype. The end objectives of this project included maintaining a project
notebook, maintaining professional relationships with all mentors, clients, and teammates
involved, writing quarterly reports and presentations, and outlining all design process
requirements. A Development Plan that outlines how the project transpired is included in
Appendix E.
At this phase in the project, the end goal is simple: devise a working beta prototype that
alerts the user of their hydration needs. In order to meet this goal, there were a series of other
goals that had to be accomplished along the way. The first of these goals was to create a working
alpha prototype using a breadboard and Arduino Uno system incorporated with an IR
temperature sensor (all parts used are further explained in the Methods and Manufacturing
section and outlined in the working budget). With the utilization of research and data sheets, the
product development team completed the alpha prototype. The second goal for the alpha
prototype was to implement wireless transmission. After a few snags, the alpha prototype testing
and debugging was pushed back from February 2016 to March 2016. At this point, the
functionality of the prototype was evaluated and further design iterations were brainstormed and
illustrated through the use of mechanical drawings. Design modifications were made and the beta
prototype construction began. In order for the beta prototype to work seamlessly and to complete

7
functionality documentation, additional testing must be completed on a variety of individuals
under different working conditions (discussed in testing procedures). The Beta prototype and the
second phase of testing will be completed by the last week of April. An updated Gantt chart as of
April 4th, 2016 is included in Appendix C. As evident from Gantt Chart updates since first
semester, the alpha and beta prototypes took longer than expected, but are still subject to be
completed on time. To wrap up the design process, a written final report and oral presentation
will be given at the beginning of May to the Design I and II class. The purpose of this final
report is to draw conclusions and outline all important phases of this project.
Methods, Procedures, and Manufacturing
Jeff Schrieber and Chris Bender of HydroBand lead the circuit and coding design of the
product. The initial steps before construction of the concept device were to seek consultation
from Electrical Engineering professors and graduate students at The University of Akron during
December of 2015. Using the advice and knowledge from a series of consultations, the
HydroBand team approved the use of Arduino microcontrollers, which will control the concept
device. At the beginning of January, the first round of parts were ordered to start the first phase
of the alpha prototype. Appendix D includes an up-to-date spreadsheet on all purchases made
thus far as well as a breakdown of the $500 budget. The initial construction included testing the
components with Arduino architecture and the software language C++. The second stage of
alpha construction consisted of debugging the hardware and software. This was completed
during the month of February along with Testing Phase 1. The beta prototype and the next set of
testing began in the middle of March. Karina, Catherine and Ryan will lead testing Phase 1 and
2, which is explained below in Performance Testing. All testing will be completed by the end of
April.

8
The first meeting was conducted with Dr. Nghi Tran, Assistant Professor of Electrical
and Computer Engineering, regarding wireless communication due to his expertise in relay
networks and MIMO systems. Dr. Tran does not have an extensive background in analog
circuits, but recommended his current graduate student, Ardalan Alizadeh for help using ZigBee
nodes. ZigBee nodes consist of low-cost and low power wireless networks that use IEEE
802.15.4 radio specifications and operate in unlicensed frequency bands. The meeting with
Ardalan provided a better understanding on coding the device based on his previous projects.
Dr. Arjuna Madanayake, an Associate Professor in Electrical and Computer Engineering,
was also consulted due to his broad background in circuitry. Dr. Arjuna suggested implementing
microcontrollers into the design due to its small form factor, low power and ability to fulfill the
requirements for the design. Microcontrollers are simply a small computer with memory, RAM,
I/O connections, and a processing unit. His last suggestion was to speak with Dr. Forrest Bao of
the Electrical Engineering Department for his advice on using the Arduino hardware. Dr. Forrest
Sheng Bao, Assistant Professor in Electrical Engineering at The University of Akron, explained
how simple Arduino boards could be implemented using tutorials and videos found online. There
are an abundant amount of accessories, such as simple RF transmitters and receivers,
temperature sensors, and many others, that are compatible with Arduino architecture. After the
series of consultations with Electrical Engineering professors, the team decided to implement
Arduino microcontrollers into the alpha design based on its low cost and simplicity.
To help guide the design process, a thorough list of customer and engineering
requirements was created before prototype construction began (Appendix B). The customer
requirements focus on basic principles Dr. Otterstetter outlined. The engineering requirements
were then generated based on the customer requirements, current product specs, FDA product
9
requirements, and HydroBand team goals. All components of the alpha and beta units were
designed to meet all engineering requirements. Testing procedures were also generated based on
this list and will be addressed in more detail in the testing section.
Jeff Schreiber and Chris Bender conducted HydroBand prototyping. The first step of the
development process was to get familiar with the programming language and hardware. This step
was done by completing online tutorials to gain knowledge on how the Arduino system
performs. After the team was familiar with Arduino setup, testing of the TMP007 sensor was
next. The TMP007 is an infrared thermopile sensor that can measure the temperature of an object
without contact. The HydroBand team researched various types of IR sensors before finally
deciding on the TMP007 and the MLX90614 infrared thermometer because their applications
included skin/body temperature and had low power consumption (low power consumption is one
of the listed engineering requirements found in Appendix B). The prototype team had success in
wiring the TMP007 to the Arduino microprocessor and installing the code for the device. The
installed firmware allowed them to display the temperature readings in both Celsius and
Fahrenheit onto a computer screen.
Following the success of the IR sensor test, displaying the readings onto a seven-segment
display was desired. A seven-segment display was included within the Arduino Uno starter kit.
These displays are commonly used in digital clocks, electronic meters, and basic calculators.
After several attempts of developing a working code for the display, the prototype team was
unable to successfully send the data from the sensor to translate onto the seven-segment display.
Rather than spend more time trying to troubleshoot the seven-segment display, a team decision
was made to implement the use of a LCD screen for the alpha unit based on its simplicity. The
wireless capability with the LCD display was completed in February.

10
The next phase of the alpha unit included testing the wireless communication between the
two microcontrollers. A 433MHz transmitter and receiver were used to communicate between
the two microcontrollers, (Arduino Pro Mini and Arduino Uno). However, programming the
Arduino Pro Mini proved difficult with the lack of a connector. The team was able to get around
this issue by using a small breadboard and jumper wires to serve as a connector. Following
several debugging issues, the program was successfully installed. The Arduino Pro Mini
wirelessly transmitted a message to the Arduino Uno, which then received the message and
displayed it on the computer. Testing procedures for the alpha unit focused on verifying the
display readings on the LCD screen, implementing the equation for water loss due to body
temperature changes, on/off functionality, and finally evaluating the complete system with the
use of wireless communication.
With the completion of the alpha unit, testing was performed to compute the range of the
wireless transmitters and the accuracy of the TMP007 IR sensor. Testing verified the
functionality of the circuit design and coding, but the tests were not meeting the engineering
requirements for accuracy, range, size and mobility. For accuracy testing, Chris and Jeff took
turns measuring the temperature of their palms every four seconds with the TMP007 sensor. The
data were compared to a calibrated infrared gun that was given to the team by the client, Dr.
Otterstetter. The measurements obtained from the TMP007 were a few degrees off from the
infrared gun. These results prompted the team to purchase a new IR temperature sensor, the
MLX90614. The same test was performed for the newly installed IR sensor, and the data
collected proved more accurate and consistent. Chris and Jeff also tested the wireless range of
the 433MHz transmitters. The initial range only proved to be about five feet. The transmitters did
have an option for external antennas to help add to the range, so copper wire was soldered to
11
them. The external antennas helped the range improve up to 35 feet. This was still significantly
less than the engineering requirements. The antennas also took away from the size and mobility
requirements as well. In short, alpha testing helped to improve the functionality of the system
and lead to design iterations to be used in the beta unit. A complete system block diagram and
functionality of the alpha design is available in Appendix A. These diagrams help explain in
more detail how the prototype performs.
Careful planning and consideration was taken when deciding how the team would meet
the engineering requirements and improve upon the alpha prototype. First, new transmitters were
found, the nRF24L01+, a 2.4GHz transceiver with a range of 200 feet, (meets the engineering
requirement). To improve the mobility and condense the size, the Arduino Uno was replaced
with another Arduino Mini Pro. With the switch to a smaller Arduino board implemented, the 5V
output from the Uno was replaced. However, the Arduino Pro Minis and the LCD screen are
powered using 5 volts. This issue was solved with the use of a charge pump, which boosts an
input voltage of 3V to an output voltage of 5V. The batteries themselves were also modified
from the alpha to the beta prototype by originally using two AAA batteries to now only using
one lithium battery. This switch was also needed in order to help save space and keep the design
as condensed as possible. The final additional feature added to the beta unit was a slide switch
used to turn the device on and off. This switch was required in order to help extend the battery
life.
Upon the completion of the circuit design, the project went from a breadboard in the
alpha unit to a PCB board beta unit. The PCB was selected to allow the circuit to be a more
permanent fixture, to keep the electronics soldered in place, and to eliminate errors due to bad
connections. This also fulfilled section 1.7 of the Customer Requirements: to create the small
12
form factor for a wearable device. The PCB also improved the layout by shortening the wires so
the circuit was easier to follow. Once the beta prototype generates acceptable test results, the
design will have a more practical and smaller layout. This will be completed by only using
necessary parts. These parts include a microprocessor rather than an entire Arduino circuit,
switching all resistor and capacitors to a smaller ceramic design, and getting rid of protoboards
by using actual footprints for integrated circuits. A two layer PCB could then be etched with the
circuit design and be massed produced.
With the completion of the circuitry, SolidWorks was utilized to model a custom casing
part to house all of the sensor components. This includes a base and top lid that screws in place
so that the electrical components can be accessed if needed. The team approved the final design
and will be 3D printing the housing parts using ABS. Within the next week or two the final beta
unit will be completed by placing all of the components in the casing and by connecting elastic
bands to the housing unit (to strap around the user’s chest). Final beta testing is outlined below in
performance testing and will be completed no later than the end of April.
Looking towards future years, in order to mass-produce the HydroBand product, an
outside manufacturer must be utilized. A manufacturer will be selected based on costs,
reliability, and how quickly they can manufacture the product. The entire HydroBand team will
meet at the end of the project to discuss future directions.
Performance Testing
After the creation of the alpha prototype in late February, an initial round of general
testing on the overall functionality of the HydroBand was completed. The general operations,
listed in the table below, of the HydroBand system were tested and passed verification within the
team.

13
General Functionalities Pass/Fail
Chest-piece with temperature sensor powers on successfully Pass
Chest-piece with temperature sensor powers off successfully Pass
Water bottle portion powers on successfully Pass
Water bottle portion powers off successfully Pass
Data is wirelessly sent between chest-piece and water bottle portion Pass
Output on the water bottle portion is clear and readable Pass
Data is automatically collected at the proper times (according to the
code)
Pass
The HydroBand system is user-friendly (Based on a survey and general-
use log completed by test subjects)
Pass
An infrared non-contact laser temperature gun (acquired from Dr. Otterstetter) was used
to obtain baseline palm temperature values. Thirty baseline temperatures were taken from the
palm of the first test subject (one of the HydroBand team members). Immediately following the
IR gun temperature collection, the temperature sensor on the HydroBand was used to collect
thirty palm temperature values from the same test subject. The baseline temperature values and
the HydroBand temperature values were compared against each other. The standard deviations
between the IR gun readings and the HydroBand readings were then calculated. The standard
deviations were acceptable based on customer and engineering requirements. A complete table
of the results from this initial testing can be seen in Table 1F of Appendix F.
With the beta unit approaching creation, the HydroBand team enters the second phase of
testing in the upcoming weeks. Table 2F in Appendix F outlines specific tests that will be

14
performed and verified based on the engineering requirements. Urine test strips (obtained from
Dr. Otterstetter) will be used to collect the initial baseline data for hydration values. Various test
scenarios will be outlined (e.g. in the morning before food/drink, immediately before exercise,
immediately following exercise, etc.) and hydration levels will be read from the urine test strips
from one member of the HydroBand team for each scenario. Then, the HydroBand will be tested
and the hydration value outputs will be compared to the levels obtained from the urine strips.
An observation log will be compiled throughout all testing which will contain general
findings, possible functional or feature improvements, and any inconsistencies or outliers. This
log, along with the data collected, will be used as the core foundation for any necessary changes
and adjustments leading up to the Beta prototype.
A third round of testing will then be performed on the Beta prototype. Two volunteer test
subjects (acquaintances of the HydroBand team members) will undergo the testing. In the same
manner as before, general functionalities, core temperature collection, and hydration level
collection will be obtained using both baseline values and the HydroBand’s output. The
HydroBand will be tested in different scenarios that correspond to a specific engineering
requirement. The test subjects will perform testing in both Dr. Otterstetter’s exercise science lab
and in outdoor environments in order to determine any environmental differences or factors that
may affect performance. Data from the tests will be compiled, analyzed, and approved as
acceptable according to the functional specifications and requirements. The test subjects will also
complete a thorough log with general notes, feature requests or improvements, ease of use, and
any problems or troubles that were encountered. This log will be used for any final adjustments
necessary before product completion.

15
Presenting and Implementing the Design (Future Directions)
With the completion of testing the beta prototype, HydroBand will begin the presentation
phase in the middle of April. All research, designs, test data and analysis, progress documents,
company information, and marketing documents will be compiled into the final revision of this
report. A presentation of the completed design process will be conducted to the 2016 Biomedical
Engineering Senior Design class and guests, along with a demo of how the HydroBand solves
the medical need of dehydration in athletes.
Challenges and Recommendations
The team faced several challenges as the HydroBand project progressed. Most of the
major challenges were related to issues with the electronic components. None of the team
members had prior experience in this area. The team also encountered issues with timelines and
deadlines, and with scheduling team meetings and consultations with outside resources.
If the HydroBand device continues to be improved and modified in the future, all group
members would be responsible for familiarizing themselves with electrical wiring, and for
finding a more compact set-up that was more suitable for real world application. If the project
were repeated, a stricter schedule would be followed.

16
References
Amtel Corporation. Atmega48P. 2016. Web. 08 February 2016.
<www.atmel.com/images/atmel-8271-8-bit-avr-microcontroller-atmega48a-48pa-88a-
88pa-168a-168pa-328-328p_datasheet_complete.pdf>
"Arduino - ArduinoBoardProMini." Arduino - ArduinoBoardProMini. N.p., n.d. Web. 08
February 2016. <www.arduino.cc/en/Main/ArduinoBoardProMini>
"Arduino - ArduinoBoardUno." Arduino - ArduinoBoardUno. N.p., n.d. Web. 08 Feb. 2016.
<http://www.arduino.cc/en/Main/ArduinoBoardUno>.
"Dehydration." Mayo Clinic. Mayo Foundation for Medical Education and Research, 2015. Web.
04 December 2015.
"Download MLX90614 Datasheet PDF (Single and Dual Zone Infra Red Thermometer in
TO-39)." N.p., n.d. Web. 08 Feb. 2016.
<http://www.datasheetspdf.com/PDF/MLX90614/798825/1>
"Dr. Forrest Sheng Bao." Individual Faculty Profile : The University of Akron. N.p., n.d. Web.
06 Feb. 2016.
"Dr. Nghi Tran." University of Akron College of Engineering. N.p., n.d. Web. 6 Feb. 2016.
Madanayake, Arjuna. "Bio." Advanced Signal Processing Circuits (ASPC). WordPress,
n.d. Web. 06 Feb. 2016.
Hunn, Nick. “The Market for Smart Wearables 2015 – 2020: A consumer centric
approach.” WiForce Wireless Consulting. March 2015. Web. Accessed 21 April 2016.
<http://www.nickhunn.com/wp-content/uploads/downloads/2014/08/The-Market-for-
Smart-Wearables.pdf>

17
Kinzel, G., Freuler, R., Demel, P. G., Labaugh, D. M., Labaugh, W. M. “Tools and Tactics of
Design.” Wiley. 2000. ISBN-13: 978-0471386483.
“Smart Sports and Fitness Wearables Market to Hit $14.9 Billion by 2021.” Market Reports
Hub. 21 September 2016. Web. Accessed 2 February 2016.
<http://www.prnewswire.com/news-releases/smart-sports-and-fitness-wearables-market-
to-hit-149-billion-by-2021-528461241.html >
Texas Instruments Incorporated. Infrared Thermopile Sensor with Integrated Math Engine (n.d.):
n. pag. Web. www.adafruit.com/datasheets/sbos685.pdf
Volpe, Stella L., Kristen A. Poule, and Erica G. Bland. "Estimation of Pre-practice Hydration
Status of National Collegiate Athletic Association Division I Athletes." Journal of
Athletic Training. The National Athletic Trainers' Association, Inc, n.d. Web. 04
December 2015.
"ZigBee® Wireless Standard." Digi International. N.p., n.d. Web. 07 Feb. 2016.

18
Appendices
Appendix A: Functional
Requirements
(Figure 3.1 System Block Diagram)
19
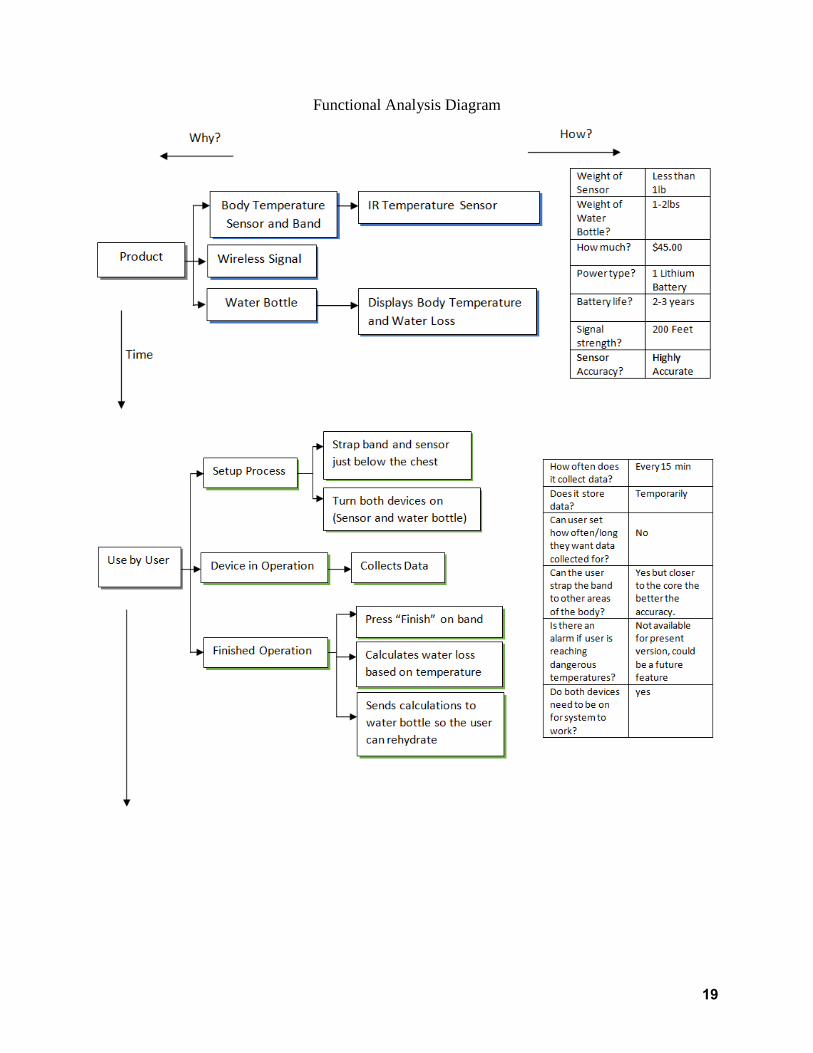
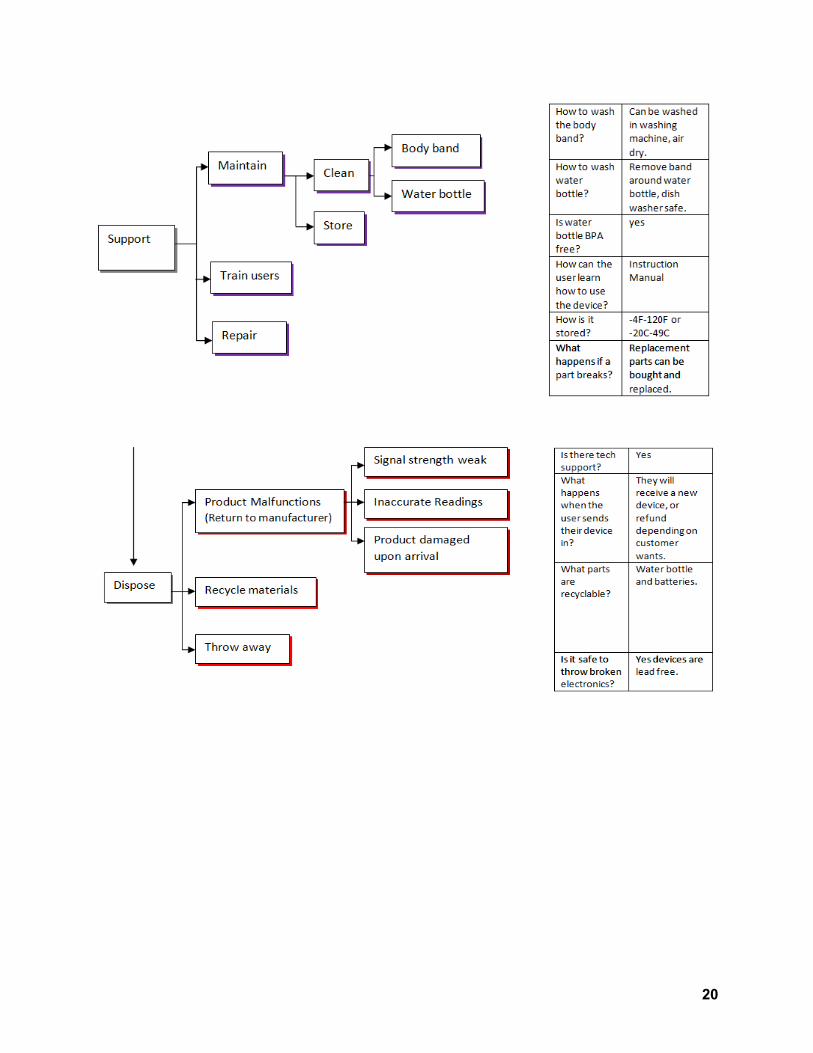
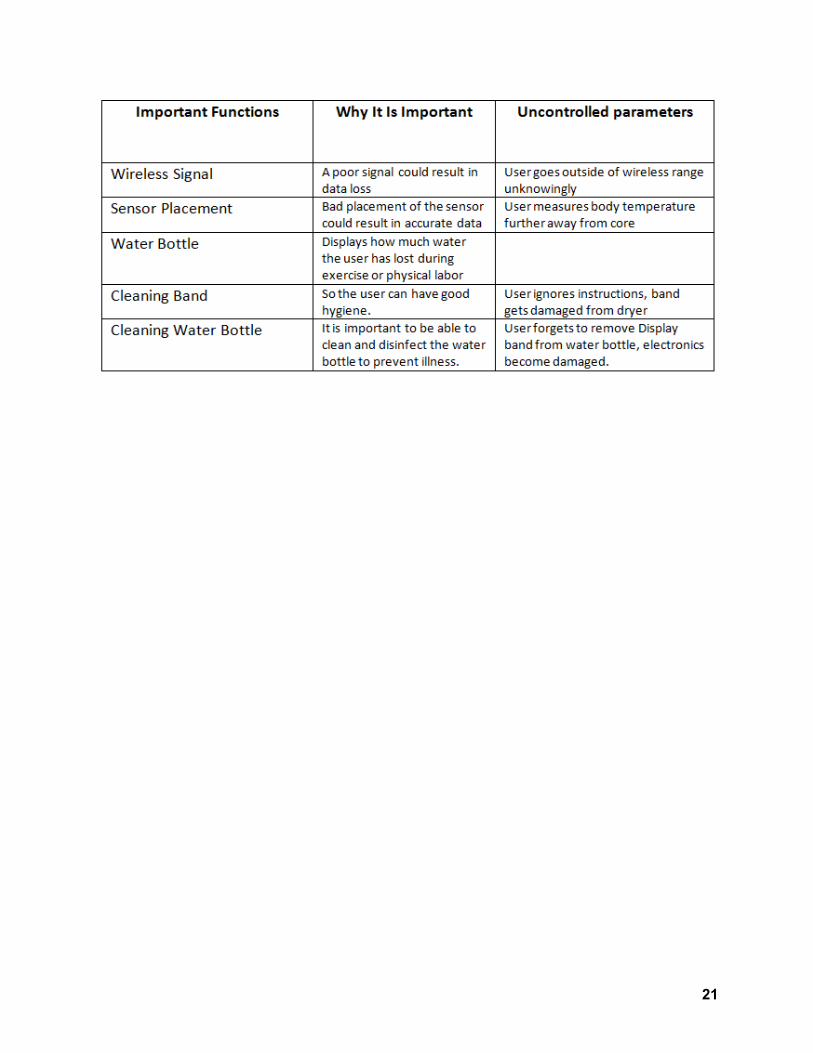
Functional Analysis Diagram
20
21

22
Appendix B: Constraints and Limitations
When determining the constraints & limitations of a device it is important to take into
consideration the requirements of the customer. Customer Requirements are a more general idea
of what is expected while Engineering Requirements are more quantitative. Although
Engineering Requirements are measureable values they do not state exactly how the device will
achieve the requirement. Additionally, all Customer Requirements are addressed by Engineering
Requirements to ensure that they are achieved. To ensure that all requirements are addressed the
Engineering Requirements are broken into different sections. These sections include regulatory,
technical, performance, sales, manufacturing, packaging, and environmental requirements.
For this design the requirements were set so that an athlete would be able to use the
device during a workout to track how much water was lost. Not only does the device have to be
able to accurately transmit the data but it also has to be able to withstand any forces it may
experience over the course of the workout. Other requirements were determined by comparing
the device to those currently on the market in order to stay competitive.
Section 1: Customer Requirements
Section 1: Customer
Number Comment Source
1.1 Temperature Measurement:
Temperature sensor must take accurate readings of the
core temperature.
Dr. Otterstetter
1.2 Data Collection:
Sensor must take multiple readings throughout the
workout.
Dr. Otterstetter
1.3 Data Collection:
Water bottle must tell the user how much water to
consume.
Dr. Otterstetter
1.4 Chest band must not become loose or be too tight on the
user.
Dr. Otterstetter
1.5 Data Collection:
Sensor must have a range greater than the length of the
field.
Athlete
1.6 Power:
Battery must last longer than the length of practice.
Athlete

23
1.7 Device Weight:
Device must be light enough to not interfere with athletic
performance.
Athlete
Section 2: Regulatory and Statutory:
Section 2: Regulatory and Statutory
Number Comment Source
2.1 Basic User Safety Standards Standards Review
2.2 This device must not cause harmful
interference.
Part 15 FCC Rules
2.3 Material:
Material must comply with ISO standards
(Electronic components and elastic band)
FDA recognized consensus
standards. Standards
Review.
2.4 Testing:
All electronic components are subject to to
meet ASTM standards
Standards Review
2.5 This device must accept any interference
received, including interference that may cause
undesired operation.
Part 15 FCC Rules
Section 3: Functional Requirements
Section 3: Technical
Number Comment Source
3.1 Power:
Chest band will require the power of at least 5
volts.
Investigational Reports
3.2 Temperature Measurement:
Must measure temperatures ranging from 14-122
degrees F
Competitor Average
3.3 Water resistance must be at least 15 ft. Competitor Average
3.4 Operating Humidity:
Can be used in totally dry or totally immersed
environments (0-100% humidity)
Investigational Reports
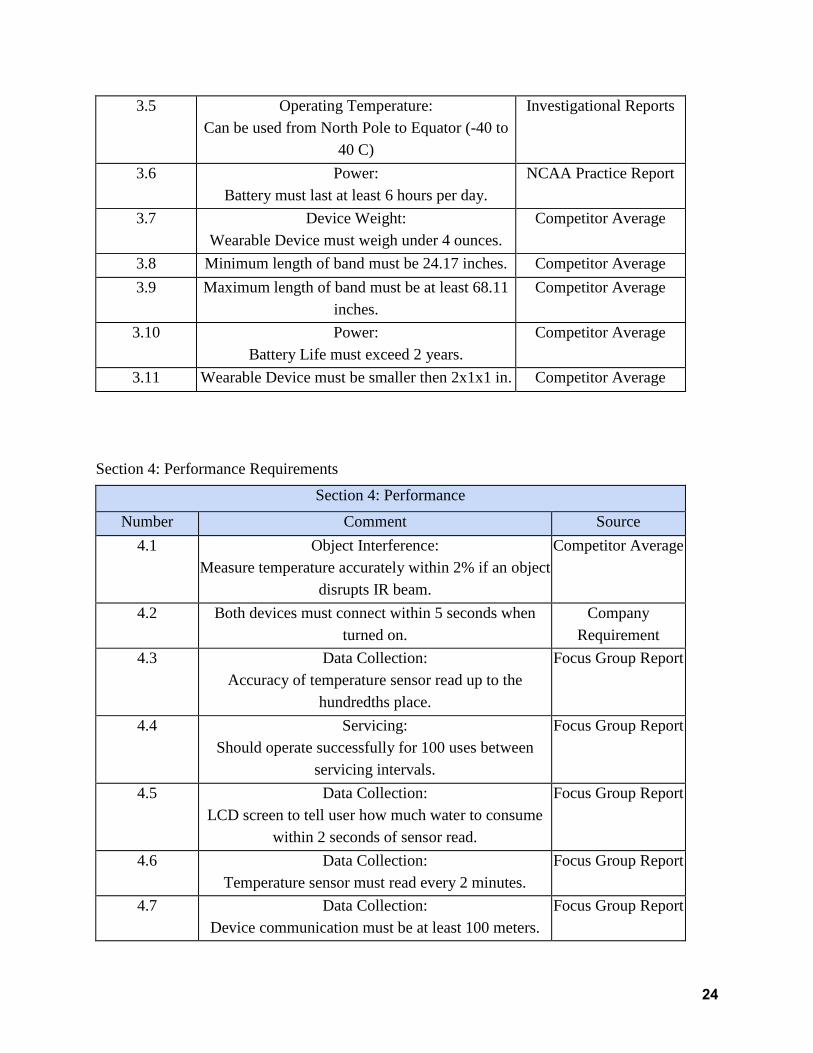
24
3.5 Operating Temperature:
Can be used from North Pole to Equator (-40 to
40 C)
Investigational Reports
3.6 Power:
Battery must last at least 6 hours per day.
NCAA Practice Report
3.7 Device Weight:
Wearable Device must weigh under 4 ounces.
Competitor Average
3.8 Minimum length of band must be 24.17 inches. Competitor Average
3.9 Maximum length of band must be at least 68.11
inches.
Competitor Average
3.10 Power:
Battery Life must exceed 2 years.
Competitor Average
3.11 Wearable Device must be smaller then 2x1x1 in. Competitor Average
Section 4: Performance Requirements
Section 4: Performance
Number Comment Source
4.1 Object Interference:
Measure temperature accurately within 2% if an object
disrupts IR beam.
Competitor Average
4.2 Both devices must connect within 5 seconds when
turned on.
Company
Requirement
4.3 Data Collection:
Accuracy of temperature sensor read up to the
hundredths place.
Focus Group Report
4.4 Servicing:
Should operate successfully for 100 uses between
servicing intervals.
Focus Group Report
4.5 Data Collection:
LCD screen to tell user how much water to consume
within 2 seconds of sensor read.
Focus Group Report
4.6 Data Collection:
Temperature sensor must read every 2 minutes.
Focus Group Report
4.7 Data Collection:
Device communication must be at least 100 meters.
Focus Group Report

25
Section 5: Sales Requirements:
Section 5: Sales
Number Comment Source
5.1 Selling Price:
Not to exceed $75 with production cost under $55.
Marketing
Requirements
5.2 Color:
Colors can be customized to match a team's colors.
Marketing
Requirements
5.3 Sales:
Sell 450 units by the end of 2016.
Marketing
Requirements
5.4 Sales:
Implement device by the end of 2016 year.
Marketing
Requirements
5.5 Sales:
Increase number of unit sales by 40% next year.
Marketing
Requirements
Section 6: Manufacturing
Number Comment Source
6.1 Cleaning:
Device needs to be cleaned post manufacturing.
6.2 3-D printed material must not cause bodily harm.
6.3 Calibration:
A calibration test needs to be done post assemble to
ensure the device's accuracy.
6.4 Device must disassemble for user to change battery.

26
Acceptance Requirements:
Section 7: Packaging and Transportation:
Section 7: Packaging and Transportation
Number Comment Source
7.1 Drop Test:
When packed the device should withstand a drop from a
height of 5 feet.
ASTM D5276
7.2 Instructions for Use:
Each box will contain one set of instructions.
MDD-FDA
7.3 Shelf Life:
The shelf life for the package is to be 5 years.
ASTM F1980
7.4 Packaging Dimensions:
The box will have a footprint of 6x3x3 in.
Packaging Office
7.5 Labeling:
Labels must abide to the code of federal regulations for
labeling, good manufacturing practices and general
electronic products
CFR Part 801
CFR Part 820
CFR Part 1010
7.6 Vibration:
Packaging must be able to withstand a vibration test to
simulate transportation
ISO 8318
ASTM D4728
7.7 External Packaging:
Packaging must be able to complete a water spray test to
ensure device won’t be harmed due to environment
ISO 2875
Section 8: Environmental Requirements:
Section 8: Environmental
Number Comment Source
8.1 External Packaging:
All external packaging to be recyclable.
Focus Group Report
8.2 Disposal:
Device must be returned back to supplier for proper
disposal.
Focus Group Report
27
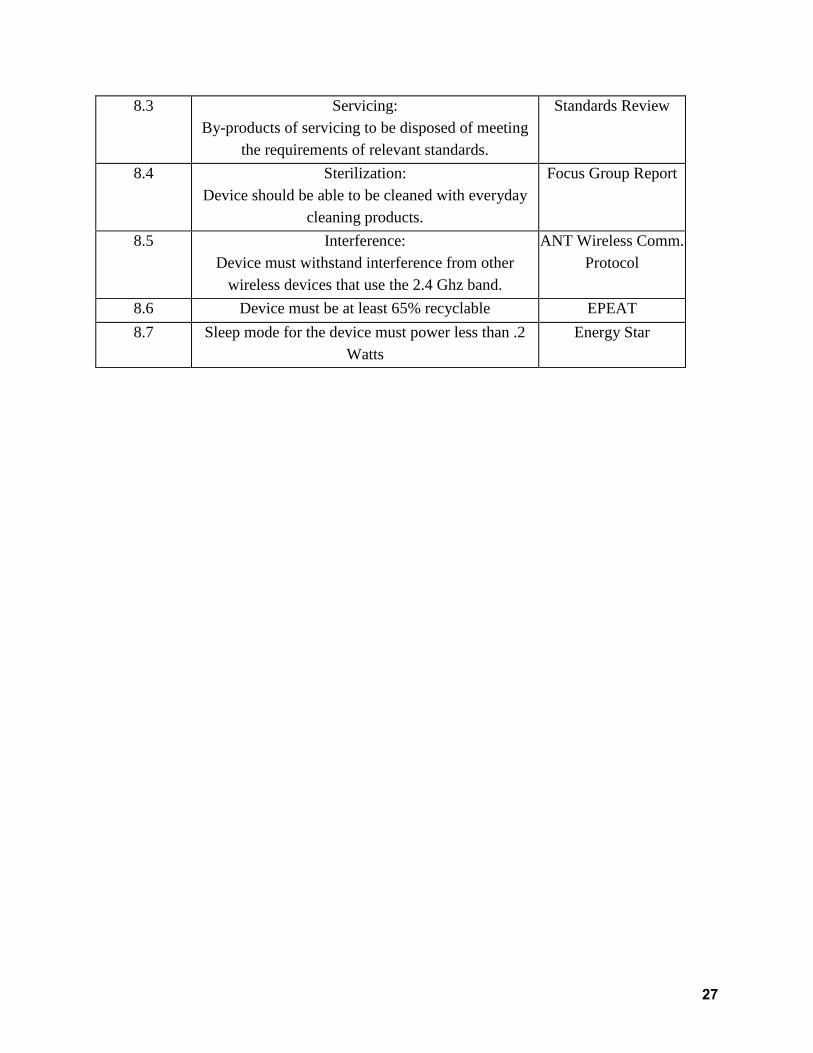
8.3 Servicing:
By-products of servicing to be disposed of meeting
the requirements of relevant standards.
Standards Review
8.4 Sterilization:
Device should be able to be cleaned with everyday
cleaning products.
Focus Group Report
8.5 Interference:
Device must withstand interference from other
wireless devices that use the 2.4 Ghz band.
ANT Wireless Comm.
Protocol
8.6 Device must be at least 65% recyclable EPEAT
8.7 Sleep mode for the device must power less than .2
Watts
Energy Star

28
Appendix C: Timeline
Gantt Chart as of 11/16/15 (1st Semester Completed Timeline):

29
Second Semester Gantt Chart: Updated 4/4/2016

30
Appendix D: Budget Specs (Subject to Change)
Name Description
Receipt
Printed
Cost +
Shipping
Running
Total
Chris
Bender
KT003 Arduino Uno starter
Kit No $24.41 $24.41
Chris
Bender Resistor Kit No $7.99 $32.40
Chris
Bender Capacitor Assortment Kit No $6.49 $38.89
Jeff
Schreiber
TMP007 IR Thermopile
Sensor Yes $12.50 $51.39
Jeff
Schreiber MLX90614 IR Sensor Yes $22.85 $74.24
Jeff
Schreiber Arduino Pro MINI MCU Yes $5.27 $79.51
Jeff
Schreiber 433MHz Transmitter Yes $0.74 $80.25
Jeff
Schreiber 433 MHz Receiver Yes $0.71 $80.96
Jeff
Schreiber 10K ohm potentiometer Yes $1.18 $82.14
Jeff
Schreiber LCD Display Yes $19.50 $101.64
Jeff
Schreiber
DHT11 multi-function
sensor Yes $12.89 $114.53
Jeff
Schreiber Battery Holder Yes $18.27 $132.80
Jeff
Schreiber Slide Switch Yes $1.90 $134.70

31
Jeff
Schreiber
Arduino Pro MINI 328 -
5V/16MHz Yes $19.50 $154.20
Jeff
Schreiber Protoboard SMT No $5.28 $159.48
Jeff
Schreiber Lithium Battery 3V No $23.46 $182.94
Chris
Bender Protoboard PCB No $22.01 $204.95
Chris
Bender Audrino Mini Port No $6.30 $211.25
Chris
Bender Universal Cables No $6.72 $217.97
Chris
Bender nRF24L01+ Transmitters No $14.45 $232.42
Chris
Bender ABS Spool No $35.94 $268.36
Chris
Bender nRF24L01+ Transmitters No $17.46 $285.82
Total Money Spent as of 4/4/2016: $285.82
Currently $215 of the budget is still available for the completion of the beta prototype.
This allows the team to make additional modifications as needed. Most of the Beta prototype
components have been purchased, so additional expenses will only be utilized if parts become
damaged or design iterations are needed. Additional funds have been set aside for the purchase
of the elastic band for the beta unit. In total, the beta prototype will consist of a plastic casing to

32
house the sensor, an attached band, and the water bottle display. Even with these design features,
the HydroBand project will still be under budget at the completion of this project.
33
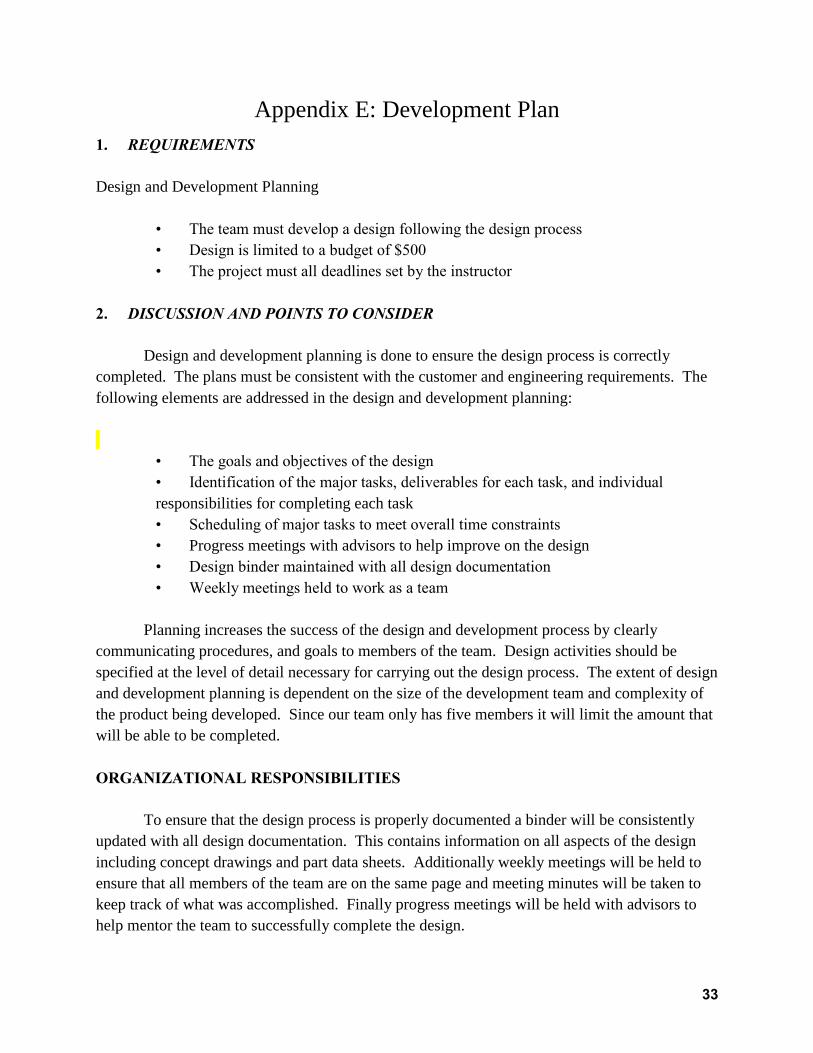
Appendix E: Development Plan
1. REQUIREMENTS
Design and Development Planning
• The team must develop a design following the design process
• Design is limited to a budget of $500
• The project must all deadlines set by the instructor
2. DISCUSSION AND POINTS TO CONSIDER
Design and development planning is done to ensure the design process is correctly
completed. The plans must be consistent with the customer and engineering requirements. The
following elements are addressed in the design and development planning:
• The goals and objectives of the design
• Identification of the major tasks, deliverables for each task, and individual
responsibilities for completing each task
• Scheduling of major tasks to meet overall time constraints
• Progress meetings with advisors to help improve on the design
• Design binder maintained with all design documentation
• Weekly meetings held to work as a team
Planning increases the success of the design and development process by clearly
communicating procedures, and goals to members of the team. Design activities should be
specified at the level of detail necessary for carrying out the design process. The extent of design
and development planning is dependent on the size of the development team and complexity of
the product being developed. Since our team only has five members it will limit the amount that
will be able to be completed.
ORGANIZATIONAL RESPONSIBILITIES
To ensure that the design process is properly documented a binder will be consistently
updated with all design documentation. This contains information on all aspects of the design
including concept drawings and part data sheets. Additionally weekly meetings will be held to
ensure that all members of the team are on the same page and meeting minutes will be taken to
keep track of what was accomplished. Finally progress meetings will be held with advisors to
help mentor the team to successfully complete the design.

34
TASK BREAKDOWN
A Gantt chart is used to help plan out all of the major tasks that need to be accomplished
as well as provide an estimate of the amount of time that will be required for each task. As
development proceeds, the plan will evolve to incorporate more and better information. The
Gantt chart is separated into the three different phases of the design process as well as a section
for ongoing work. For each section all of the major tasks are listed with date they should be
started. Below is a segment of the Gantt chart that shows how all of the tasks are broken down.
To see the current progress of the tasks refer to the most updated copy of the chart.
Phase Task Name Start Finish
Ongoing
Modifications
Deadlines
Team Meetings
Customer Meetings
Supervision/Feedback
Gantt Chart Updates
Consult Outside Resources
Phase 1:
Discovery
Customer Needs 9/1/2015 9/9/2015
Investigate Problem 9/9/2015 9/16/2015
Design Research 9/16/2015 10/30/2015
Strategies and Solutions 9/23/2015 10/30/2015
Phase II: Design
Engineering
Development Plan 10/30/2015 11/6/2015
Select Strategy 10/30/2015 11/6/2015
Conceptual Designs 10/30/2015 11/27/2015
Research on Electrical Components 12/4/2015 12/18/2015
Input for IR Sensor Construction 12/4/2015 12/18/2015
Order Parts for Prototype 12/25/2015 1/22/2016
Phase III:
Building and
Testing
Fabricate IR Sensor and Arduino Uno 1/1/2016 1/29/2016
Sensor Output to screen 1/29/2016
Final Design (tie sensor & band together)
Alpha Prototype
Debugging
Testing Phase 1
Design Alterations
Mechanical Drawings & Modeling
Beta Prototype
Testing Phase 2

35
Appendix F: Testing Data
Table 1F: Data of the initial test on the general temperature functionality of the alpha prototype.
Initial Test
Product: Alpha unit
Date: Mar 15, 2016
Description: Test of palm temperature reading from MLX90614 sensor on the alpha unit versus the IR gun.
Data:
Chris's Palm Jeff's Palm
IR Gun MLX90614 IR Gun MLX90614
Temperature (`F) Temperature (`F) Standard Dev. Temperature (`F) Temperature (`F) Standard Dev.
96.4 96.39 0.005 89.6 92.71 1.555
96.8 96.24 0.28 89.6 92.57 1.485
96.6 96.53 0.035 90.5 92.97 1.235
97.5 96.78 0.36 90.6 92.68 1.04
97.3 96.93 0.185 90.8 92.57 0.885
96.9 96.93 0.015 91 92.57 0.785
97.1 97.18 0.04 91 92.82 0.91
97.7 97.25 0.225 91.2 92.5 0.65
97.5 97.25 0.125 91 92.17 0.585
97.7 97.25 0.225 91.2 92.82 0.81
97.8 97.36 0.22 91.8 92.5 0.35
94.6 96.93 1.165 92.1 92.17 0.035
95.0 97.11 1.055 91.7 92.89 0.595
94.2 97.25 1.525 92.3 93.51 0.605
95.3 97.54 1.12 92.6 92.43 0.085
95.9 97.32 0.71 92.6 92.79 0.095
96.2 97.65 0.725 92.8 93.36 0.28
96.4 97.39 0.495 92.8 93.33 0.265
95.9 97.68 0.89 93 93.58 0.29
96.4 97.79 0.695 93.2 93.79 0.295
96.8 97.75 0.475 93 93.76 0.38
95.5 97.39 0.945 92.6 93.61 0.505
95.3 97.36 1.03 91.7 92.71 0.505
95.9 97.5 0.8 92.1 94.05 0.975
95.3 97.54 1.12 92.8 93.76 0.48
95.7 97.75 1.025 93 93.79 0.395
95.9 97.47 0.785 93.3 94.84 0.77
96.6 97.47 0.435 93.3 93.72 0.21
96.4 97.65 0.625 93.2 94.44 0.62
96.4 97.75 0.675 93.5 94.98 0.74

36
96.9 97.54 0.32 93.5 93.25 0.125
93.3 94.01 0.355
93.7 93.87 0.085
Table 2F: HydroBand Test Plan based on Engineering Requirements.
Test Corresponding Eng.
Rqmts.
Description of Test:
Temperature
Measurement
1.1, 1.2, 3.2, 3.5, 4.1,
4.3, 4.6
Test range of core temperature compared to IR gun. Does the
temperature read up to the hundredths place?
Test range of core temperature compared to IR gun. Is the
temperature reading within 1% of the comparable temperature?
Wear the temperature sensor for a period of 10+ minutes. Using a
stopwatch, record the entire test session. Was the temperature data
sent/read every 2 minutes?
Allow the temperature sensor to sit/perform in a hot room/cold
room environment. Did the sensor work correctly without any
issues?
Find a comparable object temperature at 14 degrees F. Test the
HydroBand temperature sensor on the object. Did the product
successfully read 14 degrees F? Repeat with an object at 122
degrees F and test the temperature sensor. Did the product
successfully read 122 degrees F?
Water bottle
display
1.3, 4.5 Using a stopwatch, time how long it takes for the LCD to display
the water consumption after a temperature reading. Is it within 2
seconds?
Battery life 1.6, 2.4, 3.1, 3.6, 4.0,
4.2, 4.4
The test subject (athlete) will use the HydroBand generally
throughout an entire length of practice. Does the device work
without issue for the duration of practice?
The test group will attempt to power the device with power of less
than 5 volts. Verify that the device does not power on.
Allow the device to sit, idle, but powered on, for at least 6 hours of
the day. Check the device regularly. Verify that the battery stayed
charged and powered on for a full 6 hours. (3.6) Now perform
regular use of the device for 6 hours, and verify that the battery
stayed charged and the device stayed powered on for 6 hours.
Turn the device on and start a stopwatch. Do the devices connect
within 5 seconds?
Cosmetic
specifications
3.7, 3.8, 3.9, 3.11 Weigh the device. Is it under 4 ounces?
Measure the band. Is the band in between the range of 24.17 - 68.11
inches?
Does the device meet the size specifications?
Range 4.7 Measure a distance of 100 meters from the chest band to the water
bottle portion. Are the devices able to communicate at this distance?