hybrid solar wind power plant -1st draft
TRANSCRIPT
MCB 4012 Mechanical System Design 1
PROGRESS REPORT
PROJECT TITLE:
Design of
Hybrid Solar and Wind Power Plant
GROUP MEMBERS:
Muhammad Azwan Ibrahim 13208 Muhamad Amirul Syamin bin Mad Jeli 15022
Salem Omar Bin Dhuban 14633 Yit Man Heng 15984 Mohd Amir Bin Mohd Asmadi 15021
Contents INTRODUCTION ...................................................................................................................................... 5
1.1 Background Study ........................................................................................................................ 5
1.2 Problem Statement ...................................................................................................................... 6
1.3 Objective ...................................................................................................................................... 6
1.4 Scope of Study ............................................................................................................................. 6
LITERATURE REVIEW .............................................................................................................................. 8
2.1 Renewable Energy potential in Malaysia ..................................................................................... 8
2.2 Wind Energy ................................................................................................................................. 8
2.2.1 Type of Wind Turbine .......................................................................................................... 10
2.2.1.1 Comparison between HAWTs and VAWTs ....................................................................... 12
2.2.2 Arrangement of wind turbine for optimum performance ................................................... 12
2.3 Solar Energy ............................................................................................................................... 17
2.3.1.1 Mono-crystalline Silicon Solar Cells .................................................................................. 18
2.3.1.2 Polycrystalline Silicon Solar Cells ...................................................................................... 18
2.3.1.3 Thin-Film Solar Cells (TFSC) .............................................................................................. 19
2.4 Hybrid Wind and Solar power system ........................................................................................ 21
DATUM ................................................................................................................................................ 23
3.1 Datum Selection ......................................................................................................................... 23
3.2 Proposed Location of Project ..................................................................................................... 25
DATA GATHERING ................................................................................................................................ 26
CONCEPT GENERATION ....................................................................................................................... 32
5.1 Morphology Chart ...................................................................................................................... 32
5.2 Schematic Diagram .................................................................................................................... 34
5.3 Process Flow of Power Plant Design .......................................................................................... 35
5.3.1 Components in Solar Generated Electricity Power Plant .................................................... 36
5.3.2 Components in Wind Power Generated Electricity Power Plant ......................................... 37
ENGINEERING DESING DETAIL ............................................................................................................. 38
6.1 Detail Specifications ................................................................................................................... 38
6.1.1 Detail Specifications for Wind turbine ................................................................................ 38
6.1.2 Detail Specifications for Solar Panel .................................................................................... 39
6.1 Load Estimate of Proposed Location .......................................................................................... 40
6.2 General Concept of Solar Collector System ................................................................................ 41
6.3 Efficiency Improvement for Solar Collector System ................................................................... 41

6.3.1 Solar Tracker ....................................................................................................................... 41
6.4 Solar Panel Plant Sizing .............................................................................................................. 43
There are total 240 pieces of solar panel on the solar farm The estimated total area of the solar
panel farm is 695.12m2. ................................................................................................................... 44
6.5 Solar PNID .................................................................................................................................. 44
6.4 Wind Turbine ............................................................................................................................. 46
6.4.1 Power Generation by Wind Turbine .................................................................................... 46
6.4.2 Plant Sizing Calculation ....................................................................................................... 47
6.5 Grid Inter Tied System for Hybrid Solar and Wind Power Plant ................................................. 49
List of Picture:
Figure 2 1: Size and Power of Wind Turbine over the year .................................................................... 9
Figure 2 2: HAWT and VAWT Basic concept ......................................................................................... 10
Figure 2 3: Arrangement of components inside HAWT ........................................................................ 11
Figure 2 4: The arrangement of components inside VAWT ................................................................. 11
Figure 2 5: Design of wind farm arrangement ..................................................................................... 13
Figure 2 6: Power losses vary with misalignment ................................................................................ 20
Figure 2 7: Basic Hybrid wind and solar power system ........................................................................ 21
Figure 2 8: Schematic diagram of hybrid (renewable) solar - wind power sourceError! Bookmark not defined.
Figure 2 9: Block diagram of the solar hybrid system (Wind/solar/diesel) .......................................... 24
Figure 2 10: Location of Kampung Peta, Mersing ................................................................................ 25
Figure 2 11: Mean Power Densities of 10 stations in Malaysia ............................................................ 27
Figure 2 12: Solar Radiation in Malaysia .............................................................................................. 30
Figure 2 13: The schematic diagram of project .................................................................................... 34
Figure 2 14: Process flow chart ............................................................................................................ 35
Figure 2 15: Wind speed vs. estimated power output ......................................................................... 39
Figure 2 16: Single axis solar tracker .................................................................................................... 42
Figure 2 17: Below shows the solar panel distance.............................................................................. 43
Figure 2 18: Solar Farm Layout ............................................................................................................ 44
Figure 2 19: Wiring of solar farm ......................................................................................................... 44
Figure 2 20: Grid interties system with battery backup ....................................................................... 49
List of Table:
Table 1 1: Comparison between HAWTs and VAWTs......................................................................... 12
Table 1 2: Definition of various variables used in calculation ............................................................. 14
Table 1 3: Shows the power losses vary with the angle of incidence .................................................. 20
Table 1 4: Morphology Chart .............................................................................................................. 32
Table 1 5: Components in Solar Generated Electricity Power Plant.................................................... 36
Table 1 6: Components in wind power generated electricity power plant ......................................... 37
Table 1 7: Detailed specification of the wind turbine ......................................................................... 38
Table 1 8: Electrical specifications and estimated price ...................................................................... 39
Table 1 9: Mechanical specifications................................................................................................... 40
Table 1 10: Power consumption classifications .................................................................................. 40
Table 1 11: Assumption for wind turbine calculation ......................................................................... 46
List of Chart
Chart 1 1: Maximum and average wind speed for whole year............................................................ 46
Chart 1 2: Minimum Power produced each month............................................................................. 47
Chart 1 3: Minimum number of wind turbine need each month ........................................................ 48
CHAPTER 1
INTRODUCTION
1.1 Background Study
Solar and wind power is a clean and renewable energy sources. It can be used in the
generation of electricity without polluting the environment. Apart from their advantage, there
are disadvantages. Solar power is not always completely predictable because it depends on
the amount of solar radiation that available. If the weather is not suitable, amount of electric
power generated will be reduced. Other than that, electric power is unable to be generated
during night time. The cost to build a photovoltaic power station is expensive and the energy
payback time is large of the order of around five years. Wind power is irregular is many
location. Consistent wind is needed to ensure continuous of electric power generation. Wind
velocity is also a factor to determine the amount of electric power generated. Therefore, to
overcome the disadvantages from each renewable energy sources, combination of these two
techniques will help to increase the efficiency of electric power generation.
Hybrid electric system that combines wind electric and solar electric technologies
offer more advantages compare to either single system. In some countries, wind speeds are
low in the summer when the sun shines brightest and longest. The wind is strong in the winter
when less sunlight is available. This cause the peak operating times for wind and solar
systems occur at different times of the day and year, hybrid solar wind power systems are
more likely to produce power in different whether and situation.
Figure 1.1 shows a basic design of hybrid solar wind power system. It includes solar
panels, wind generator, charge controller, battery bank and inverter. Solar panel work to
collect sunlight and convert them into electricity. Wind generator works to convert wind
energy to electricity. Charge controller is used to limit the voltage if there is any excessive
voltage that could damage the battery bank. Battery bank is used for electric power storage.
Inverter is used to convert dc voltage to ac voltage.
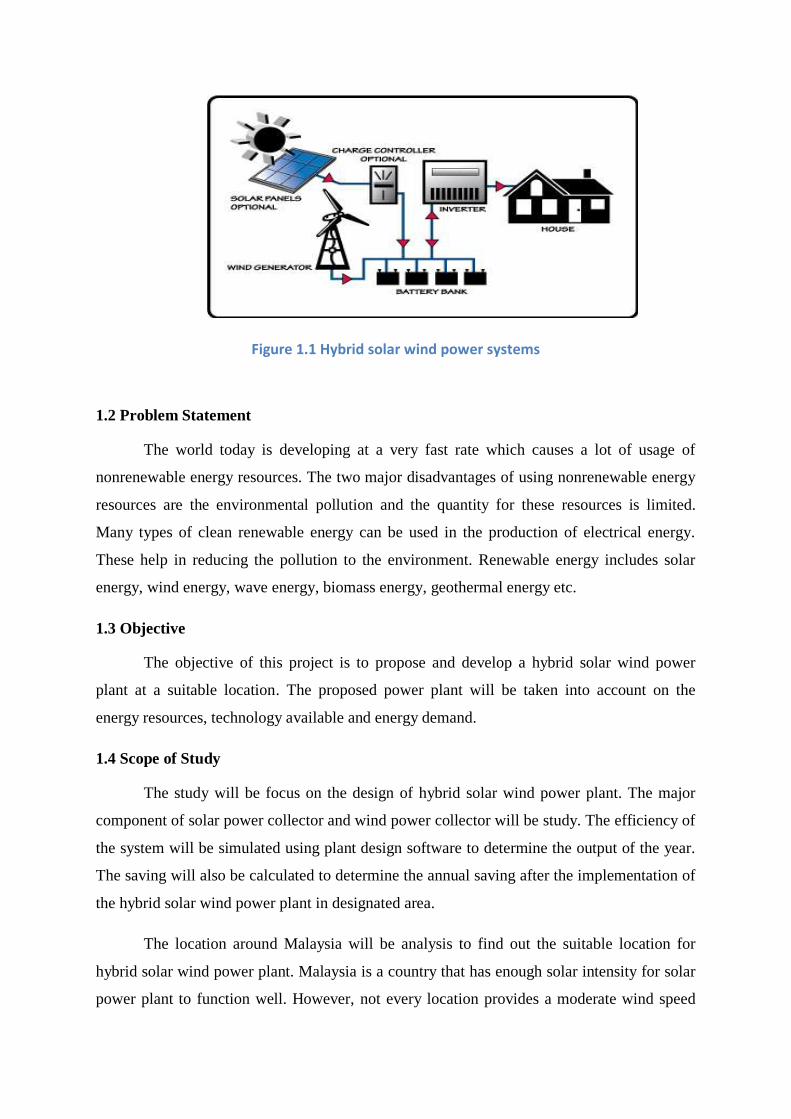
Figure 1.1 Hybrid solar wind power systems
1.2 Problem Statement
The world today is developing at a very fast rate which causes a lot of usage of
nonrenewable energy resources. The two major disadvantages of using nonrenewable energy
resources are the environmental pollution and the quantity for these resources is limited.
Many types of clean renewable energy can be used in the production of electrical energy.
These help in reducing the pollution to the environment. Renewable energy includes solar
energy, wind energy, wave energy, biomass energy, geothermal energy etc.
1.3 Objective
The objective of this project is to propose and develop a hybrid solar wind power
plant at a suitable location. The proposed power plant will be taken into account on the
energy resources, technology available and energy demand.
1.4 Scope of Study
The study will be focus on the design of hybrid solar wind power plant. The major
component of solar power collector and wind power collector will be study. The efficiency of
the system will be simulated using plant design software to determine the output of the year.
The saving will also be calculated to determine the annual saving after the implementation of
the hybrid solar wind power plant in designated area.
The location around Malaysia will be analysis to find out the suitable location for
hybrid solar wind power plant. Malaysia is a country that has enough solar intensity for solar
power plant to function well. However, not every location provides a moderate wind speed

that is suitable for wind power plant. Due to time limitation, the weather data around the area
will be collected from Kementerian Tenaga, Tenologi Hijau dan Air (KeTTHA) Malaysia to
speed up the research on the suitable location to build hybrid solar wind power plant. The
average solar intensity and average wind velocity will be used to determine the suitability of
the area.
CHAPTER 2
LITERATURE REVIEW
2.1 Renewable Energy potential in Malaysia
Renewable Energy is defined as the energy is generate from resource which are
naturally replenished on a human timescale such as sunlight, wind, rain, tides ,waves and
geothermal. Wind and Solar renewable energy have a good potential to be developed in
Malaysia. Malaysia is located at the equator and received about 6 hours of sunshine per day.
However, seasonal and spatial variation in the amount of sunshine received. [1] From official
website of Malaysian Meteorological Department, Alor Setar and Kota Bharu receive about 7
hours per day of sunshine while Kuching receives only 5 hours on the average. On the
extreme, Kuching receives only an average of 3.7 hours per day in the month of January. On
the other end of the scale, Alor Setar receives a maximum of 8.7 hours per day on the average
in the same month. The wind speed over Malaysia is light and variable. Malaysia experience
four wind flow patterns because there are southwest monsoon, northeast monsoon and two
shorter periods of inter-monsoon seasons. During southwest monsoon, the average wind
speed is light which is below 15knots. During northeast monsoon, steady winds of 10 to 20
knots prevail. The winds over the east coast states of Peninsular Malaysia may reach 30 knots
or more during periods of strong surges of cold air from the north.
2.2 Wind Energy
Wind turbine function to convert mechanical rotation into electrical power. The design of a
high efficiency wind turbine consists of different aspect and parameter. Shape and dimension
of the blade determined the aerodynamic performance. [2]Bet’s law calculates the maximum
power than can be extracted from wind. According to Betz’ law, wind turbine can capture not
more than 59.3% of the kinetic energy in wind that based on an open disk actuator. Wind
speed will affect the efficient of power generation. Therefore, wind turbine is designed to
produce power over a range of wind speeds. If the wind speed exceed the power that has to
be limited, control system has to be implement to prevent overpower generation so that the
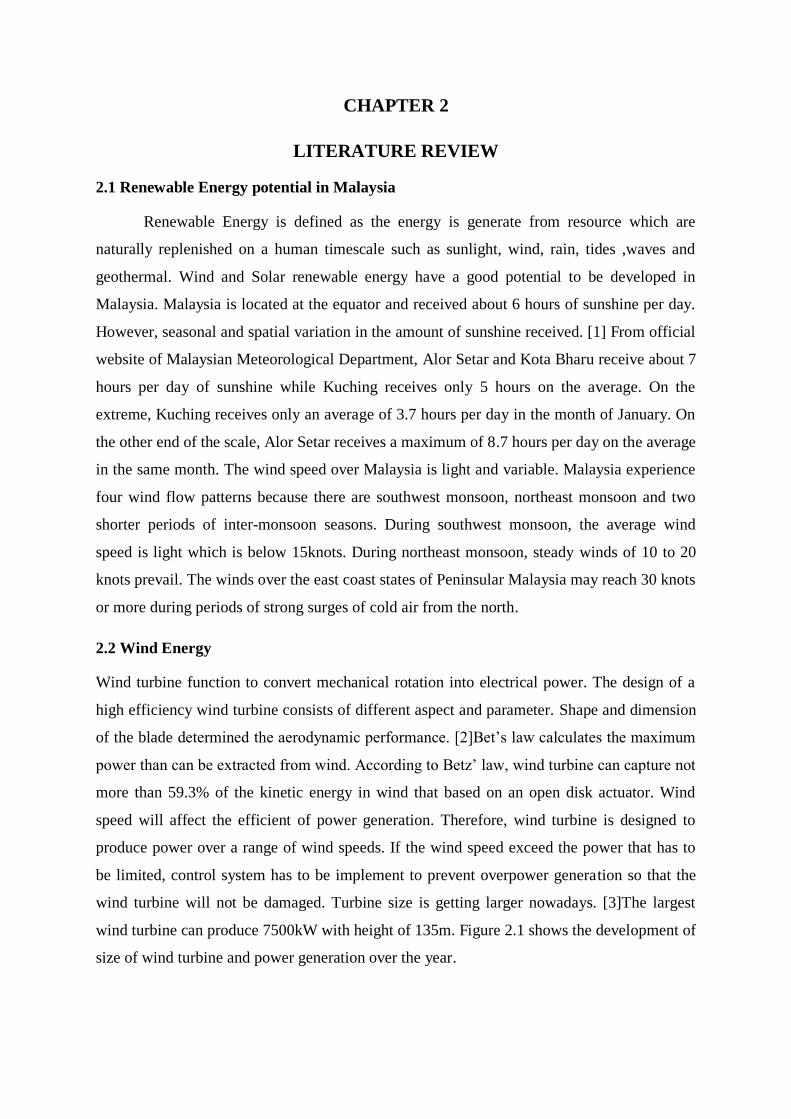
wind turbine will not be damaged. Turbine size is getting larger nowadays. [3]The largest
wind turbine can produce 7500kW with height of 135m. Figure 2.1 shows the development of
size of wind turbine and power generation over the year.
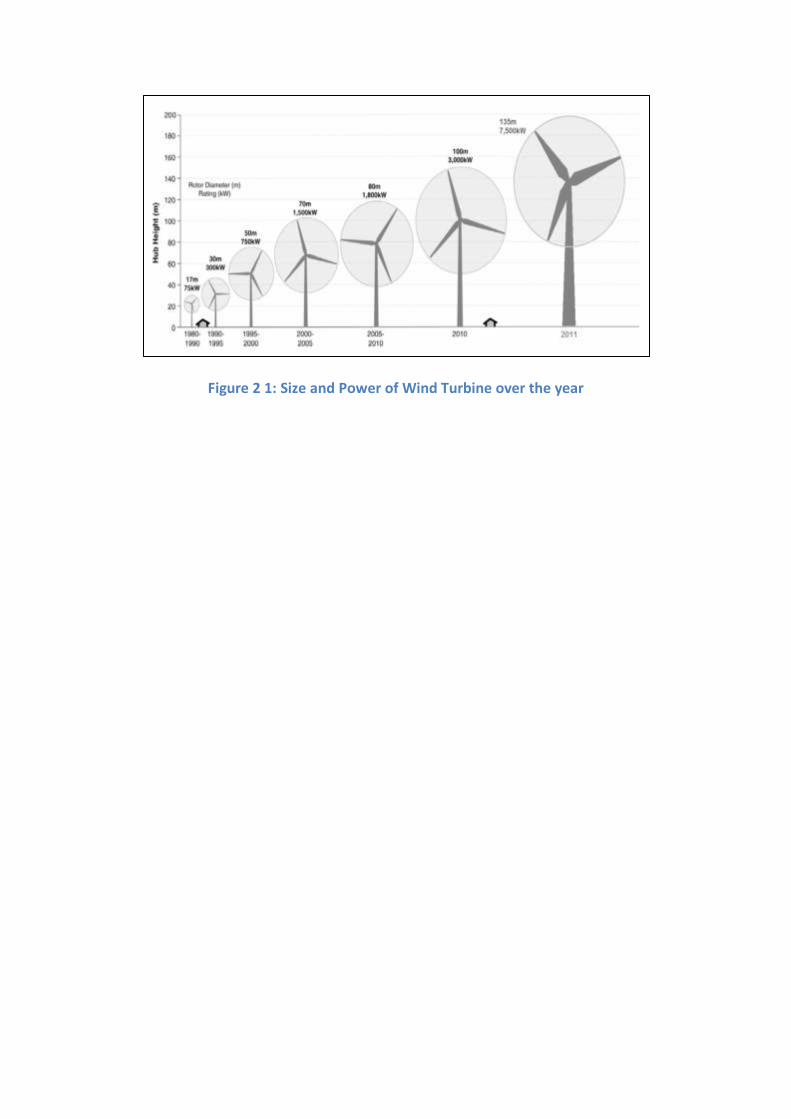
Figure 2 1: Size and Power of Wind Turbine over the year
2.2.1 Type of Wind Turbine
Modern wind turbines can be classified into two main configuration, which are
Horizontal axis wind turbines (HAWTs) and Vertical axis wind turbines (VAWTs).
HAWTs are type of wind turbine which the axis of rotation of the rotor is in line with
the wind direction, sometimes this type of wind turbine also referred as axial-flow
devices.
Meanwhile VAWTs are different type of wind turbine which the axis of
rotation of rotor is perpendicular to the wind direction, this wind turbine also referred
as cross-flow devices. This is shown in Figure 2.2.1.1:
Figure 2 2: HAWT and VAWT Basic concept
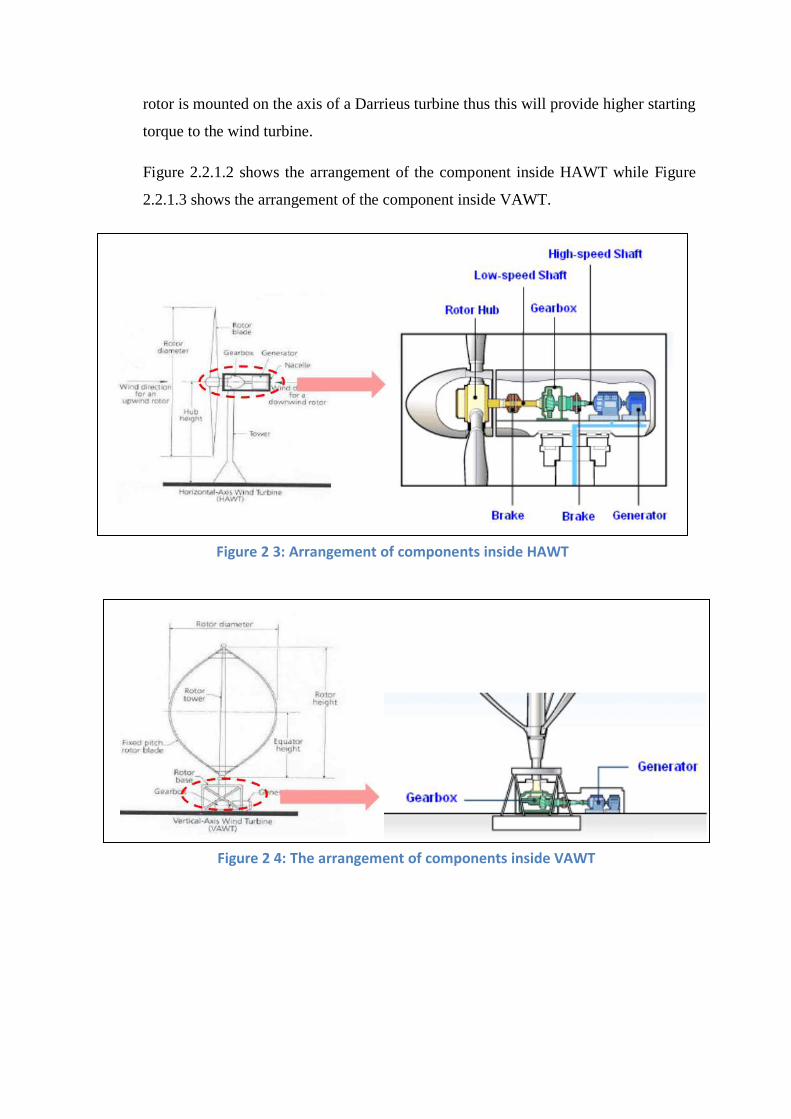
Inside of wind turbine, there is few more component crucial in order to extract energy
from wind to generate electricity. The component including Rotor hub, Brake, low-
speed shaft gearbox, brake high-speed shaft and lastly is generator.
VAWTs also can be classified into two type which is Savonium rotor and Darrieus
turbine, Savonium rotor consist of two curved blades, forming an S-shaped passage
for air flow while Darrieus consist of two or three airfoils attached to a vertical shaft
The Darrieus wind turbine having much better performance compare to Savonium
rotor, however it is not self starting. In order to overcome this problem, A savonius
rotor is mounted on the axis of a Darrieus turbine thus this will provide higher starting
torque to the wind turbine.
Figure 2.2.1.2 shows the arrangement of the component inside HAWT while Figure
2.2.1.3 shows the arrangement of the component inside VAWT.
Figure 2 3: Arrangement of components inside HAWT
Figure 2 4: The arrangement of components inside VAWT

2.2.1.1 Comparison between HAWTs and VAWTs
Table 1 1: Comparison between HAWTs and VAWTs
No HAWTs VAWTs
1 Allow access to stronger wind at
site with tall towers
Do not need to be pointed into the wind,
operation is independent of wind direction,
no yaw mechanism is needed, can operate on
sites where wind direction is highly variable
or has turbulent wind
2 Tall towers allows placements on
uneven lands or at offshore
location
Gearbox, generator and other primary
components can be placed near the ground,
which simplifies routine maintenance
3 Require yaw mechanisms to turn
the blades towards the wind
Smaller VAWTs can be much easier to
transport and install
4 Massive tower structure is
required to support the heavy
blades, gearbox generator and
many more.
Air flow near ground and other objects create
turbulent flow, introduce issues of vibration,
bearing wear and thus increase the
maintenance
5 Tall towers and long blades are
difficult to transport on the sea
and on land.
Rotor are located close to the ground where
wind speed are lower, do not take advantage
of higher wind speed above.
2.2.2 Arrangement of wind turbine for optimum performance
The output of a wind farm at a given wind speed is less than the output of the same number of
isolated wind turbines. This due to the Interference between clustered turbines, as a wind
turbine extracts power from the wind stream; wind power density for some distance behind
the turbine is decreased. This disturbed region behind the turbine is known as wake. By both
increasing turbulence and reduce power density in the wake can degrade the performance of
downstream turbines.
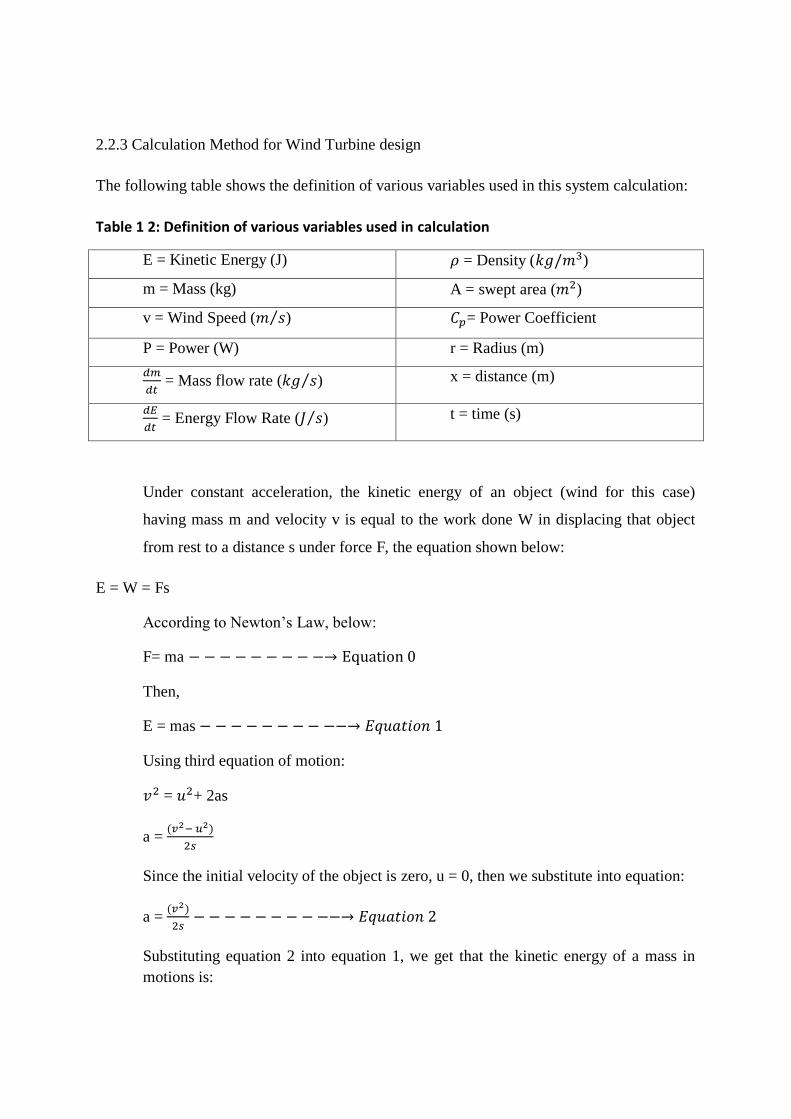
Proposed wind farm optimal placement, based on the wind data also combined with
topographical information, we design the wind farm arrangement as shown at Figure 2.2.2.1:
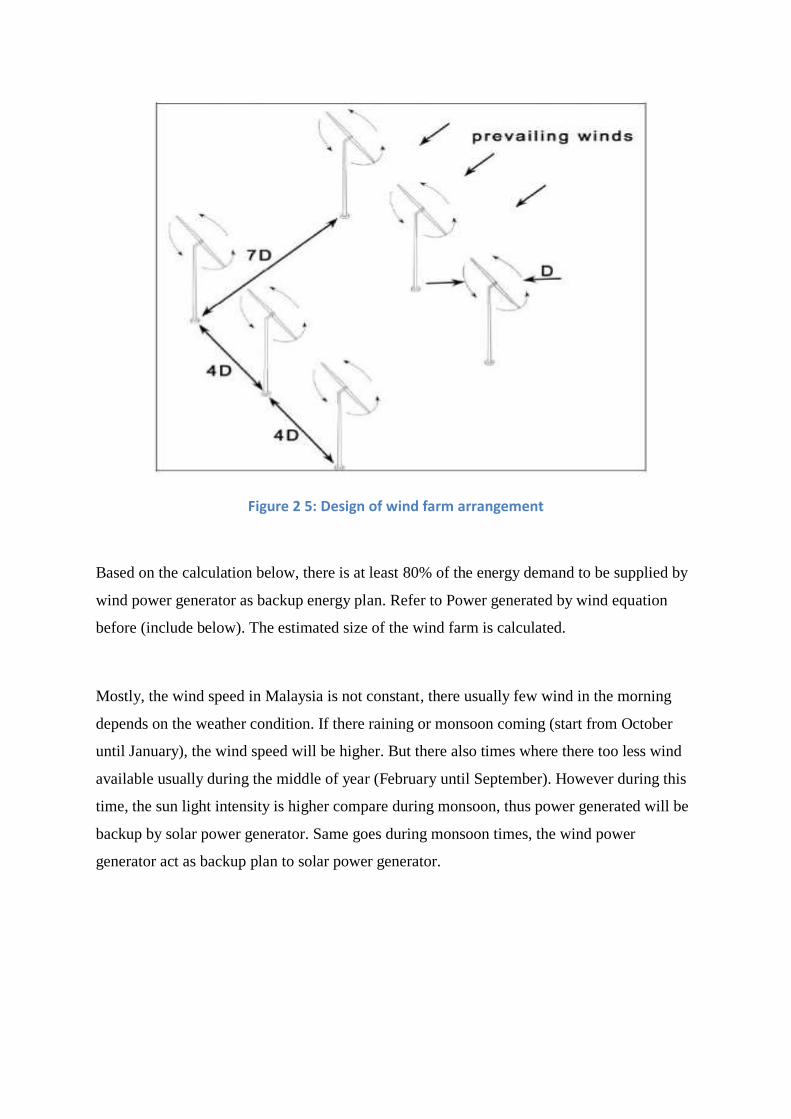
Figure 2 5: Design of wind farm arrangement
Based on the calculation below, there is at least 80% of the energy demand to be supplied by
wind power generator as backup energy plan. Refer to Power generated by wind equation
before (include below). The estimated size of the wind farm is calculated.
Mostly, the wind speed in Malaysia is not constant, there usually few wind in the morning
depends on the weather condition. If there raining or monsoon coming (start from October
until January), the wind speed will be higher. But there also times where there too less wind
available usually during the middle of year (February until September). However during this
time, the sun light intensity is higher compare during monsoon, thus power generated will be
backup by solar power generator. Same goes during monsoon times, the wind power
generator act as backup plan to solar power generator.
2.2.3 Calculation Method for Wind Turbine design
The following table shows the definition of various variables used in this system calculation:
Table 1 2: Definition of various variables used in calculation
E = Kinetic Energy (J) = Density ( )
m = Mass (kg) A = swept area ( )
v = Wind Speed ( ) = Power Coefficient
P = Power (W) r = Radius (m)
= Mass flow rate ( ) x = distance (m)
= Energy Flow Rate ( ) t = time (s)
Under constant acceleration, the kinetic energy of an object (wind for this case)
having mass m and velocity v is equal to the work done W in displacing that object
from rest to a distance s under force F, the equation shown below:
E = W = Fs
According to Newton’s Law, below:
F= ma
Then,
E = mas
Using third equation of motion:
= + 2as
a =
Since the initial velocity of the object is zero, u = 0, then we substitute into equation:
a =
Substituting equation 2 into equation 1, we get that the kinetic energy of a mass in
motions is:

E =
The power in the wind is given by the rate of change of energy:
P =
=
As mass flow rate is given by:
=
Velocity is equal to rate of change of distance:
= v
Substitute 4 into equation 3, we get:
=
Hence, we substitute equation 6 into equation 3, the power can be defined as below:
P =
16
According to Betz’ Law, no wind turbine can convert more than 59.3% of the
kinetic energy of the wind into mechanical energy turning a rotor. This due to friction,
also structure of wind itself which limited to be extracted. The theoretical maximum
power efficiency of any design of wind turbine is 0.59 (59%). This power efficiency
also can be called as “power coefficient” as shown below:
= 0.59
The value is unique to each type of turbine and is a function of wind
speed that the turbine operating in besides cannot perform at maximum limit 0.59.
Today the best designed wind turbines operate best around 0.35-0.45 power
coefficient, this after application of various engineering knowledge and requirements
as well as Betz limit.
If we take into account another factor in a complete wind turbine system such
as gearbox, bearings and generator, the wind turbine capable to extract only 10% - 30%
power of the wind energy which later will be convert to electricity. Thus, the power
coefficients need to be included into power equation below:
P =
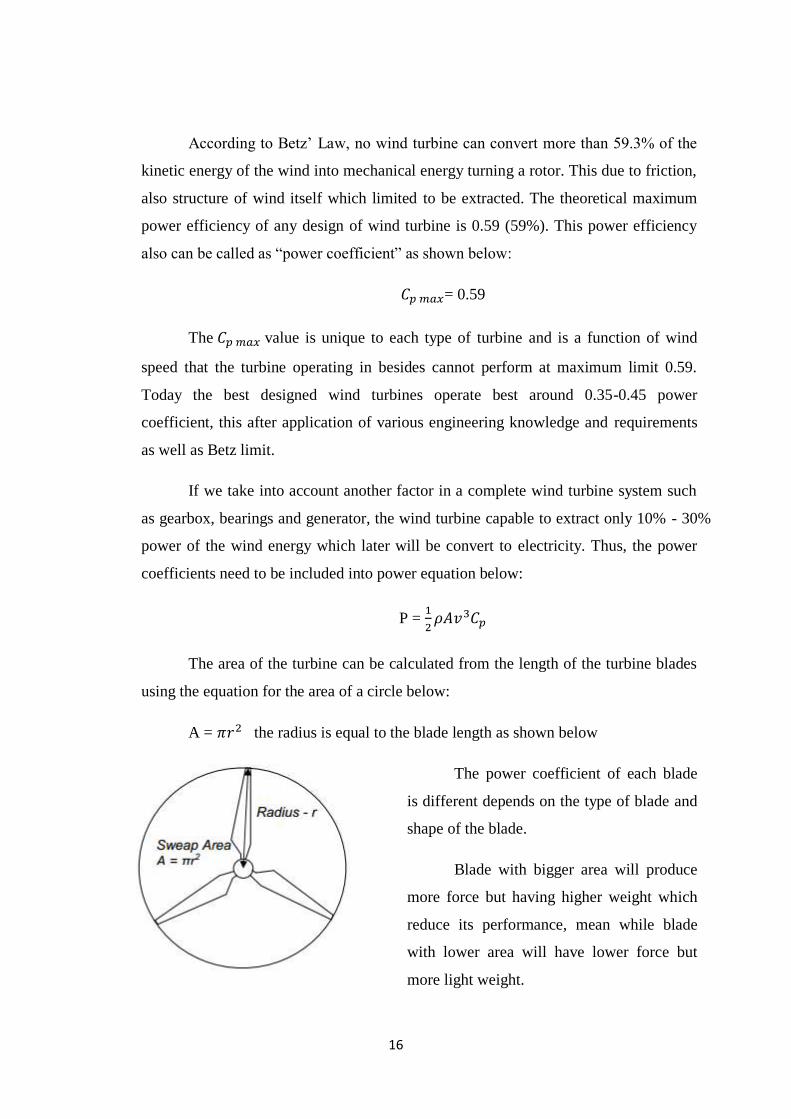
The area of the turbine can be calculated from the length of the turbine blades
using the equation for the area of a circle below:
A = the radius is equal to the blade length as shown below
The power coefficient of each blade
is different depends on the type of blade and
shape of the blade.
Blade with bigger area will produce
more force but having higher weight which
reduce its performance, mean while blade
with lower area will have lower force but
more light weight.
17
2.3 Solar Energy
Solar photovoltaic system functions to convert sunlight into electricity. The electricity
generated can be either stored or used directly. Same to wind turbine, different size of
photovoltaic modules will produce different amount of power. Other than size, the efficiency
of the system may affect the power generation. Overheating reduces the efficiency of solar
panel. Cooling system can be implemented to reduce the heat of the PV. [4]S. Wu and CG.
Xiong have carried out a passive cooling experiment toward PV cells. The passive cooling
method that utilizes rainwater as cooling media and a gas expansion device to distribute
rainwater has successfully increased the electrical efficiency of the PV panel by 8.3%.
Different solar system is also available to increase the performance of the electric
generation.[5] B. Khadidja, K. Dris, A. Boubeker and S. Noureddine has carried out a
experiment on optimisation of a solar tracker system for photovoltaic power plants in
Saharian region. After the experiment, it is found there is a significant gain on the amount of
energy when mounting the PV systems on the trackers. 20-35% of efficiency increase has
been achieved with the two axis tracking system.
2.3.1 Solar Collector System
Major Component for solar system is P.V modules. There are three main types of
photovoltaic solar panels in the market [9]. They are:
Monocrystalline Silicon Solar Cells
Polycrystalline Silicon Solar Cells
Thin-Film Solar Cells
Almost 90% of the World’s photovoltaic are based on some variation of silicon. The silicon
used in PV consists of many forms and the main difference is the purity of the silicon. The
solar cell will have higher efficiency when converting solar energy to electricity when the
silicon molecules are aligned perfectly. However, the process to enhance the purity of silicon
is expensive. Therefore, efficiency in the aspect of purity of silicon should not be the primary
concern.

18
2.3.1.1 Mono-crystalline Silicon Solar Cells
Mono-crystalline silicon (mono-Si) solar cells that made from, also called single crystalline
silicon are made out of silicon ingots which are cylindrical shape. It has efficiency typically of
135-170 Watts/ m2 [10]. The advantages of mono-crystalline solar panels are:-
Higher efficiency with the energy conversion rates of 15-20%.
Space efficient because it has higher performance which allows them to occupy
least amount of space compare to other types of solar panel.
The working life is longer than others.
Perform better in low light conditions.
Disadvantages of monocrystalline solar panels are:
Highest cost among all types of solar panel.
Undergo Czochralski Process to produce monocrystalline silicon will produce
significant amount of silicon waste.
Tend to be more efficient in warm weather. (disadvantage for cold weather country)
2.3.1.2 Polycrystalline Silicon Solar Cells
Polycrystalline Silicon Solar Cells were the first solar panels introduce to the market in 1981.
Polycrystalline do not undergo Czochralski process which produce significant amount of
silicon waste. It has efficiency of typically 120-150 Watts/m2. The advantages for
polycrystalline silicon solar cells are:
Process to make polycrystalline silicon is simpler and cost less.
Amount of waste is less compare to mono-crystalline.
Lower heat tolerance compares to mono-crystalline which mean it will perform
slightly worse when compare to mono-crystalline solar panel in high temperature.
However, this effect is minor.
Disadvantages for Polycrystalline solar panel are:
Lower efficiency with energy conversion rates of 13-16%, this is because of lower
silicon purity.
Lower space efficiency

19
2.3.1.3 Thin-Film Solar Cells (TFSC)
Thin-Film Solar Panel is manufacture by depositing one or several thin layers of photovoltaic
material onto a substrate. It has efficiency of typically 60-80 Watts/m2.The different types of
thin film solar cells are:
Amorphous silicon
Cadmium telluride
Copper indium gallium selenide
Organic photovoltaic cells
Advantage of Thin-Film Solar Cells:
Mass production is simpler and cheaper compare to crystalline based solar cells.
Can be made flexible which give potential for create new application
Less impact on performance in high temperature
Disadvantages of Thin-Film Solar Cells:
Require a lot of space. Size ratio of 4 to 1 when compare to mono-crystalline solar
panel to produce same amount of energy.
Low efficiency with 9% of energy conversion rate
Degrade faster compare to mono and polycrystalline.

20
2.3.2 Solar Tracker System
The effective collection area of a flat-panel solar collector varies with the cosine of the
angle of misalignment of the panel with the Sun. The levels of misalignment can be
categorized by the chart below. Solar collector has a high tolerance towards the angle
misalignment. The significant power loss is less than 1% at 8º and less than 10% at 25º.
However, power collected drop significantly after 30º. Which are 30% at 45º, 50% at 60º and
75% at 75º [11].
Angle of Incidence Power Loss (Percentage)
8º
<1%
25º <10%
30º 15%
45º 30%
60º 50%
75º 75%
Table 1 3: Shows the power losses vary with the angle of incidence
Figure 2 6: Power losses vary with misalignment
21
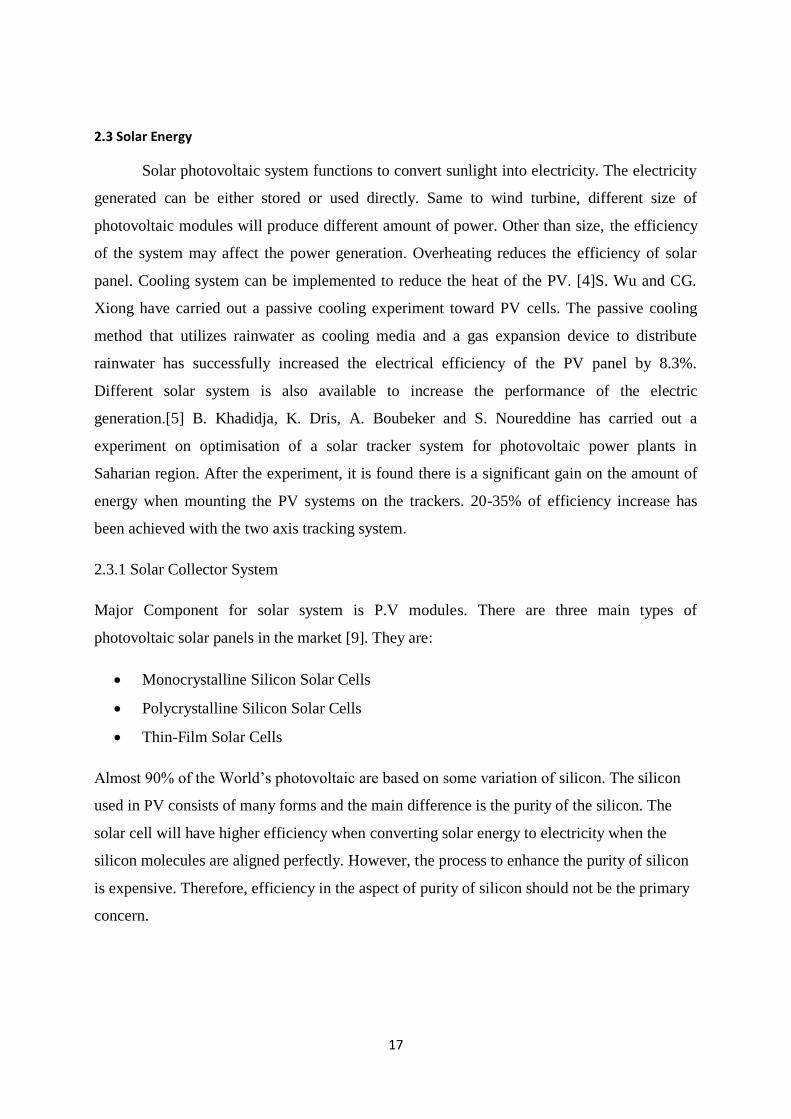
2.4 Hybrid Wind and Solar power system
A hybrid wind and solar power system is system that can convert sunlight and wind
into electricity. [6] Figure 2.2 Show the hybrid system which combine wind and solar power
system.
The basic system includes PV Array, Wind Turbine, Hybrid Controller, Battery Bank,
Inverter and Loads. PV Array functions to collect solar energy. Wind Turbine function to
collect wind energy. Hybrid Controller is used to control battery bank charge and discharge
for reasonable and safety. Battery bank is used to store battery. Inverter function to convert
DC powers into AC power.
Figure 2 7: Basic Hybrid wind and solar power system
There are two major types of power supply system: [13]the off-grid system and grid
inter-tied system. An off grid system is completely disconnect from the traditional electric
power grid. To protect against insufficient of power when solar or wind system is under
producing and batteries is discharged, another power source will back up the energy
production of the system. Usually each system will cover up each other in vice versa. The off-
grid system usually used when there is no utility grid service. It is very economical in
providing electricity in rural area.
For grid inter-tied system, it is directly connected to the home and to the traditional
electric utility grid. Grid inter-tied systems allow the homeowners to get power from either
the home electric system or the utility grid, switching between the residential system and the
grid seamless. The advantage of this system is the ability to balance the system production

22
and home power requirements. When a grid inter-tied system is producing more power than
the home is consuming, the excess can be sold back to utility in a practice known as net
metering. When the system is not producing sufficient power, the home can draw power from
the utility grid. An additional of battery backup can be installed on the grid inter-tied to enable
the system to balance production and demand as to prevent shortage of power. When energy
production exceeds the demand, excess power can be charge and store at the batteries. When
the system produces less electricity than demand, battery can back up the shortfall.

23
CHAPTER 3
DATUM
The objective of this project is to design hybrid solar wind power system. Wind and solar
energy are two forms of energy that are relatively new in Malaysia. A few studies have been
done to explore the possibilities of solar and wind power generation in Malaysia. Furthermore,
there are some projects the have been established to utilize wind and solar power. To perform
this project our group has chosen an integrated solar wind system that has designed and
implemented at the University of Northern Iowa as an instructional resource for teaching
electrical power system and renewable energy concepts. This system is small scale model for
teaching purposes, so in our project the system will be implemented in a larger scale to cover
the demand of the area.
3.1 Datum Selection
The project was to propose Hybrid Solar-Wind power generator system. Thus, in order
to design the system, many references have been looking for in order to design the Hybrid
Solar –wind power generator system. Among the references that have been looking for, our
group has decided to combine 2 established datum in designing the system.
Figure 3.1.1 represent the first datum that we have been using on this project which is
“Hybrid solar and wind power: an essential for information communication technology
infrastructure and people in rural communities” from Nigeria patent. From this datum we
make use on designing the mini power plant.
Figure 3.1 1: Schematic diagram of hybrid (Renewable) solar -wind power source
24
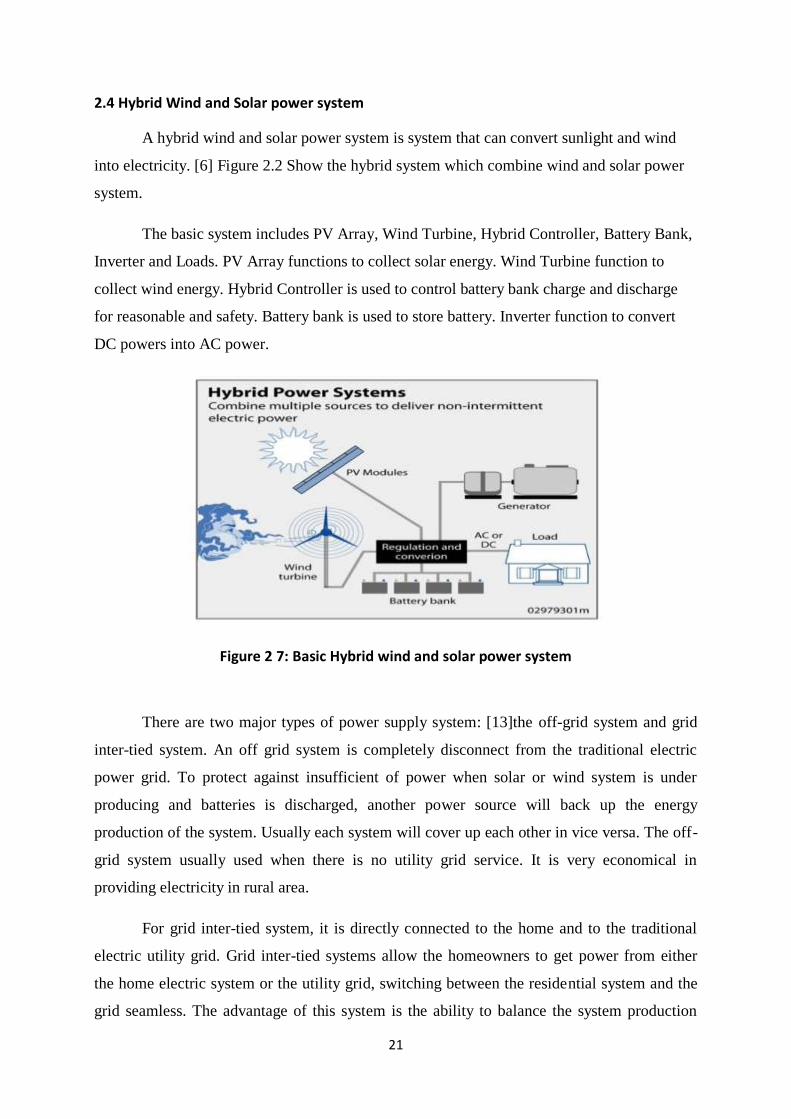
On the other hand, the second datum that we have been using is very important as this
system have been tested in Perhentian Island, Malaysia. Thus this system is more practical
compare to previous system due to different environment condition between Malaysia and
Nigeria. However, this second datum is little bit different with the first datum due to the
hybrid with diesel system together with solar and wind (Figure 3.1.2).
Figure 2 8: Block diagram of the solar hybrid system (Wind/solar/diesel)

25
3.2 Proposed Location of Project
Kampung Peta (Figure 3.2.1) is a village located in Mersing, Johor. This location was chosen
considering the current electricity power supply to that area, which was not supplied by
electricity grid system. Located near to Endau-Rompin National Park and riverside to Kahang
River, it will take two hours travelling from nearby town, Kahang to Kampung Peta. Based on
information given by Jabatan Kemajuan Orang Asli (JKOA) Mersing, it was estimated that
the population of Kampung Peta was 200 people.
Figure 2 9: Location of Kampung Peta, Mersing
26
CHAPTER 4
DATA GATHERING
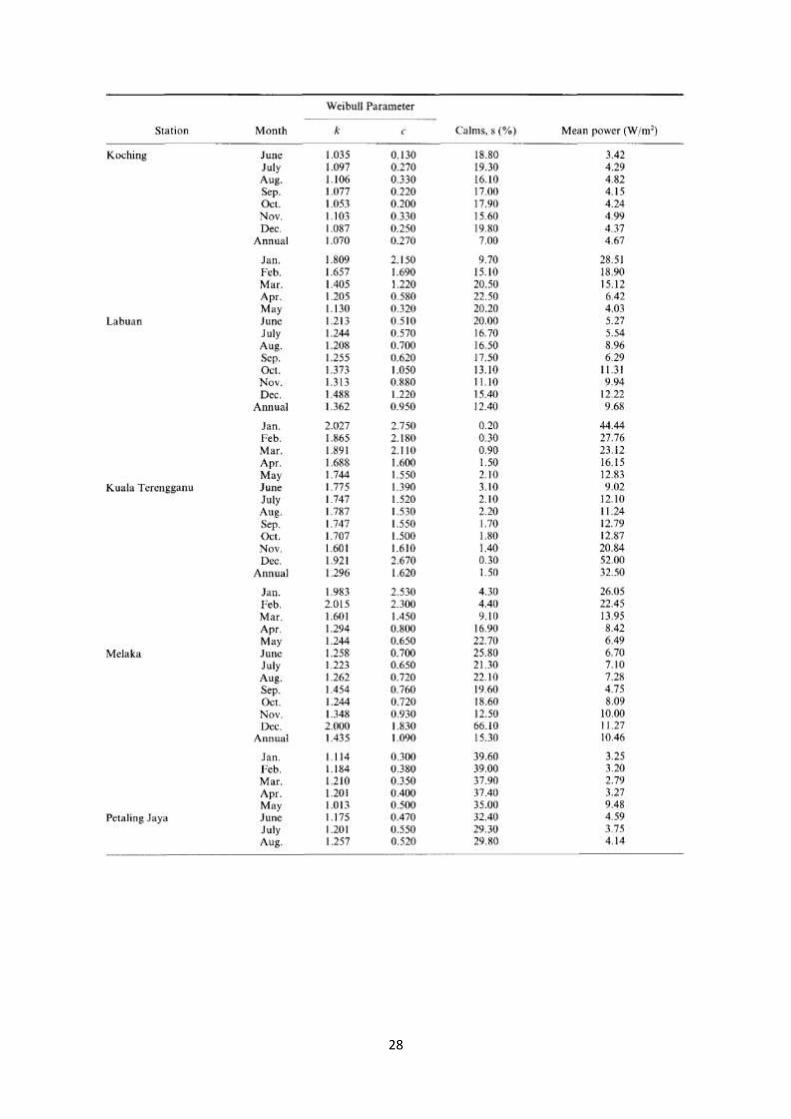
Malaysia lies in the equatorial zone and the climate is governed by the regime of the
Northeast and Southwest monsoons which blow alternately during the course of the year. The
Northeast monsoon blows from approximately October until March, and the Southwest
monsoon blows between May and September. Due to the country's location, winds over the
area are generally light. The strongest wind only occurs on the East coast of Peninsular
Malaysia during the Northeast monsoon. Maximum speeds occur in the afternoon and
minimum speeds occur just before sunrise, a pattern controlled by convection in the surface
boundary layer as the ground is heated by the Sun during the day and cooled by radiation at
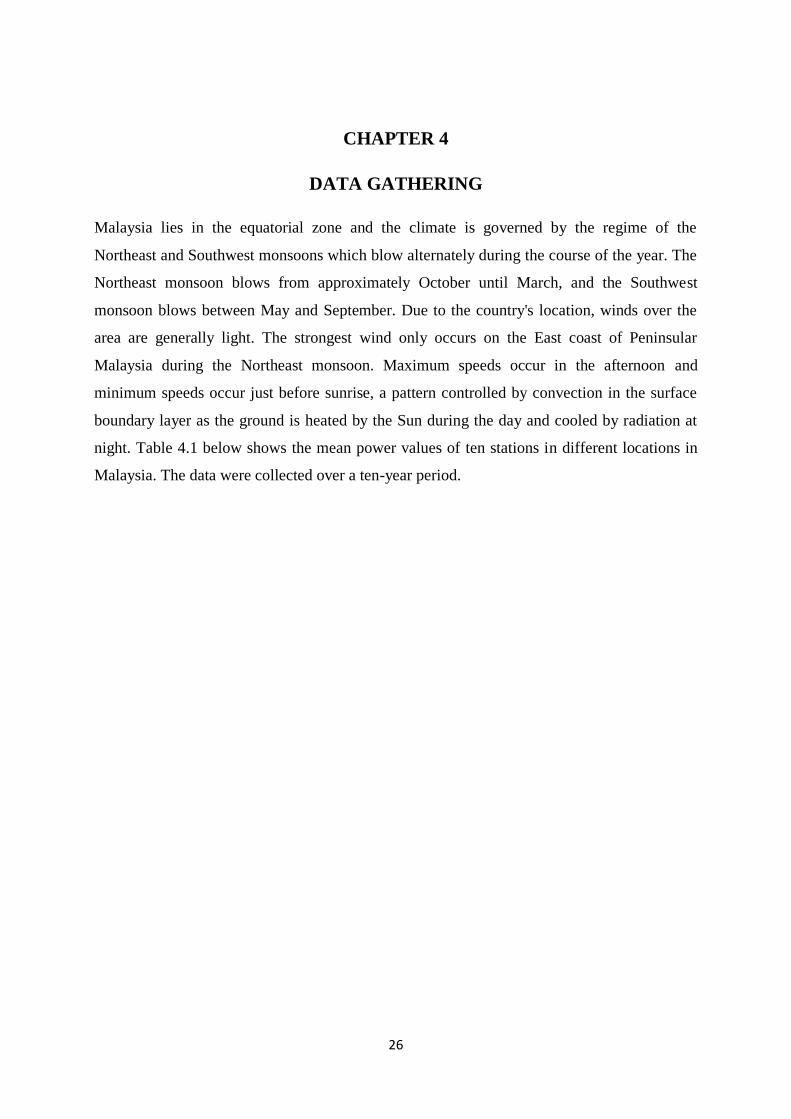
night. Table 4.1 below shows the mean power values of ten stations in different locations in
Malaysia. The data were collected over a ten-year period.

27
Figure 2 10: Mean Power Densities of 10 stations in Malaysia
28
29
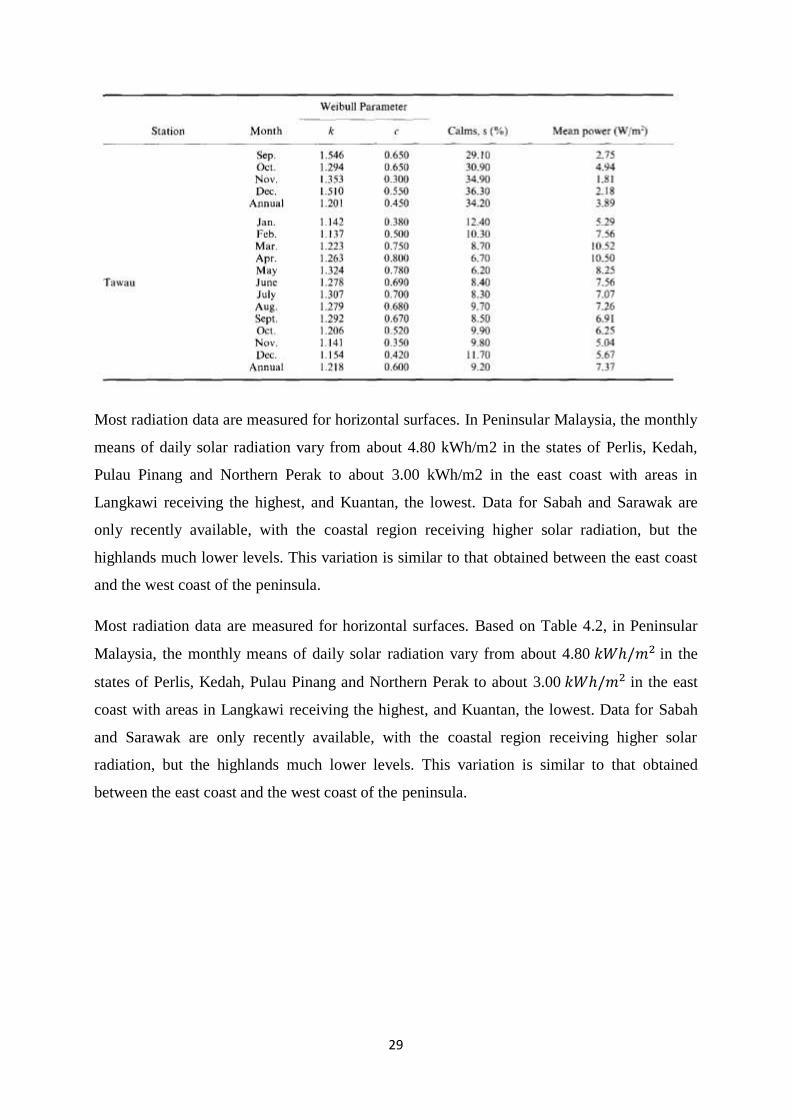
Most radiation data are measured for horizontal surfaces. In Peninsular Malaysia, the monthly
means of daily solar radiation vary from about 4.80 kWh/m2 in the states of Perlis, Kedah,
Pulau Pinang and Northern Perak to about 3.00 kWh/m2 in the east coast with areas in
Langkawi receiving the highest, and Kuantan, the lowest. Data for Sabah and Sarawak are
only recently available, with the coastal region receiving higher solar radiation, but the
highlands much lower levels. This variation is similar to that obtained between the east coast
and the west coast of the peninsula.
Most radiation data are measured for horizontal surfaces. Based on Table 4.2, in Peninsular
Malaysia, the monthly means of daily solar radiation vary from about 4.80 in the
states of Perlis, Kedah, Pulau Pinang and Northern Perak to about 3.00 in the east
coast with areas in Langkawi receiving the highest, and Kuantan, the lowest. Data for Sabah
and Sarawak are only recently available, with the coastal region receiving higher solar
radiation, but the highlands much lower levels. This variation is similar to that obtained
between the east coast and the west coast of the peninsula.
30
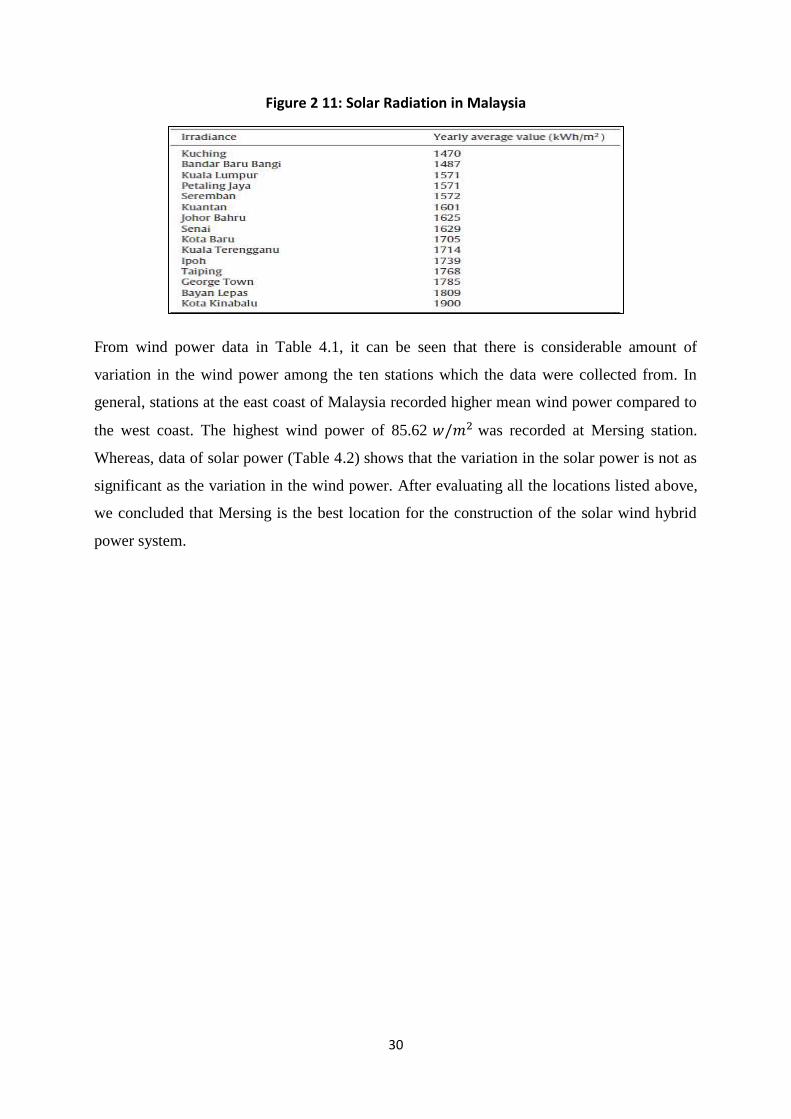
Figure 2 11: Solar Radiation in Malaysia
From wind power data in Table 4.1, it can be seen that there is considerable amount of
variation in the wind power among the ten stations which the data were collected from. In
general, stations at the east coast of Malaysia recorded higher mean wind power compared to
the west coast. The highest wind power of 85.62 was recorded at Mersing station.
Whereas, data of solar power (Table 4.2) shows that the variation in the solar power is not as
significant as the variation in the wind power. After evaluating all the locations listed above,
we concluded that Mersing is the best location for the construction of the solar wind hybrid
power system.

31

32
CHAPTER 5
CONCEPT GENERATION
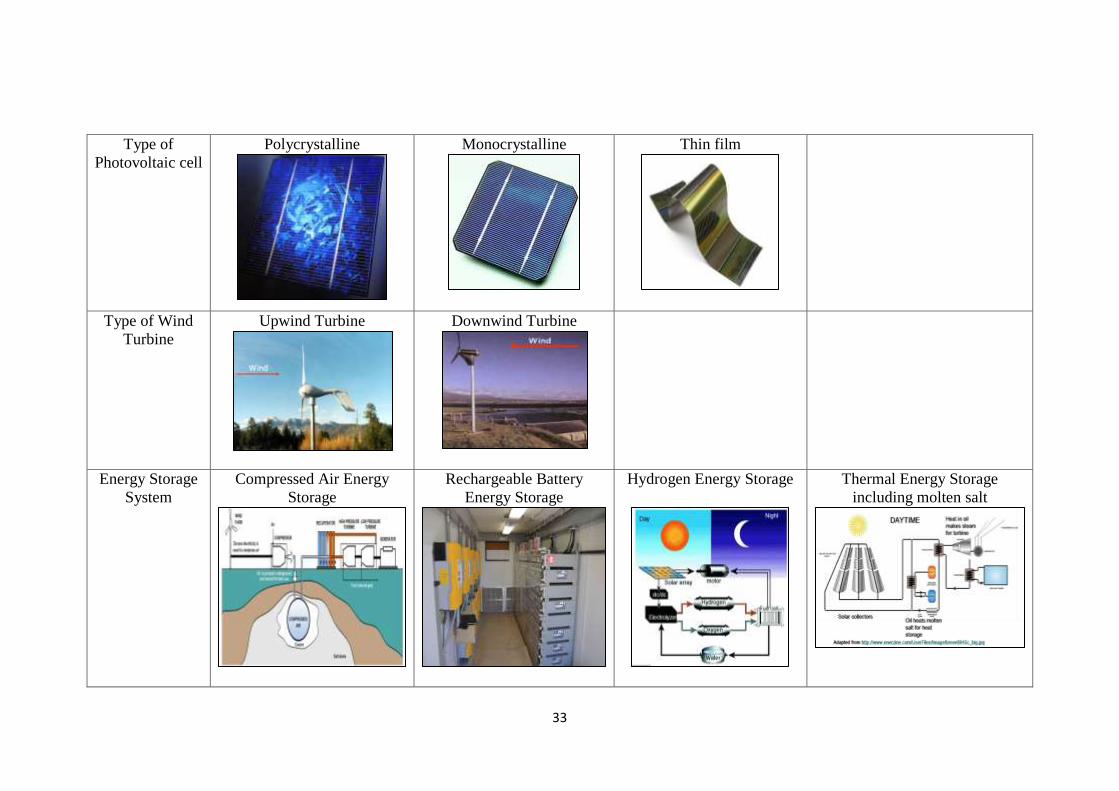
5.1 Morphology Chart
Table 1 4: Morphology Chart
Feature Option 1 Option 2 Option 3 Option 4
Axis of wind
turbine
Horizontal Axis Wind
Turbine
Vertical Axis Wind Turbine
Type of Wind
Farm
On-shore wind farm
Off-shore wind farm
33
Type of
Photovoltaic cell
Polycrystalline
Monocrystalline
Thin film
Type of Wind
Turbine
Upwind Turbine
Downwind Turbine
Energy Storage
System
Compressed Air Energy
Storage
Rechargeable Battery
Energy Storage
Hydrogen Energy Storage
Thermal Energy Storage
including molten salt

34
5.2 Schematic Diagram
Figure 5.2 shows the schematic diagram of the project.
Figure 2 12: The schematic diagram of project

35
5.3 Process Flow of Power Plant Design
Figure 5.3 summarize the process flow of the proposed hybrid solar and wind power plant.
Photovoltaic
Convert sunlight to D.C electricity
DC Combiner Box
Combines the output of multiple
strings of PV modules
DC Charge Controller
Regulates the voltage and current
coming from solar panels
DC.AC Inverter/Charge
Converting DC from array or
battery to single or three phase A.C
signals
AC Distribution Panel
Distribute the AC signal
AC Loads
Receiving and uses AC signal
Wind
Convert wind to D.C electricity
DC Disconnect
Protect inverter to battery wiring
from electrical fires and
disconnected inverter from
batteries for services
Energy Mix (Controller)
Distribute voltage and current to
battery bank and DC/AC
inverter/charger
Diversion Load Controller
Takes surplus energy from the
battery bank and sends it to a dump
load
DC Diversion Load
Activated by the charge controller
whenever the batteries or the grid
cannot accept the energy being
produced
Battery Bank
Store and supply power
Figure 2 13: Process flow chart

36
5.3.1 Components in Solar Generated Electricity Power Plant
Table 1 5: Components in Solar Generated Electricity Power Plant
Components Function
Photovoltaic (or PV) Solar cells that convert sunlight to D.C electricity
DC Combiner Box The combiner box is a device that combines the output
of multiple strings of PV modules for connection to the
inverter. It is typically used in the larger commercial and
utility scale PV power plants (greater than 500kW).
DC Charge Controller A charge controller, or solar controller, regulates the
voltage and current coming from solar panels to the
batteries. Prevent and Control Overcharging of the
batteries
Energy Mix
(Controller)
Act as a main receiver and distribute voltage and current
to battery bank and DC/AC inverter/charger
DC Control Box Control the voltage and current flow to the DC/AC
inverter/charger
DC/AC
Inverter/Charger
Converting DC from array or battery to single or three
phase A.C signals.
AC Distribution Panel Distribute the AC signal to the AC loads (consumers)
and primary system grounding
AC loads Receiving and uses AC signal
To Primary System
Ground
Grounding
Battery Bank Store power during wind and solar generator running.
Supply power when generator is not running and low
demand of energy
37
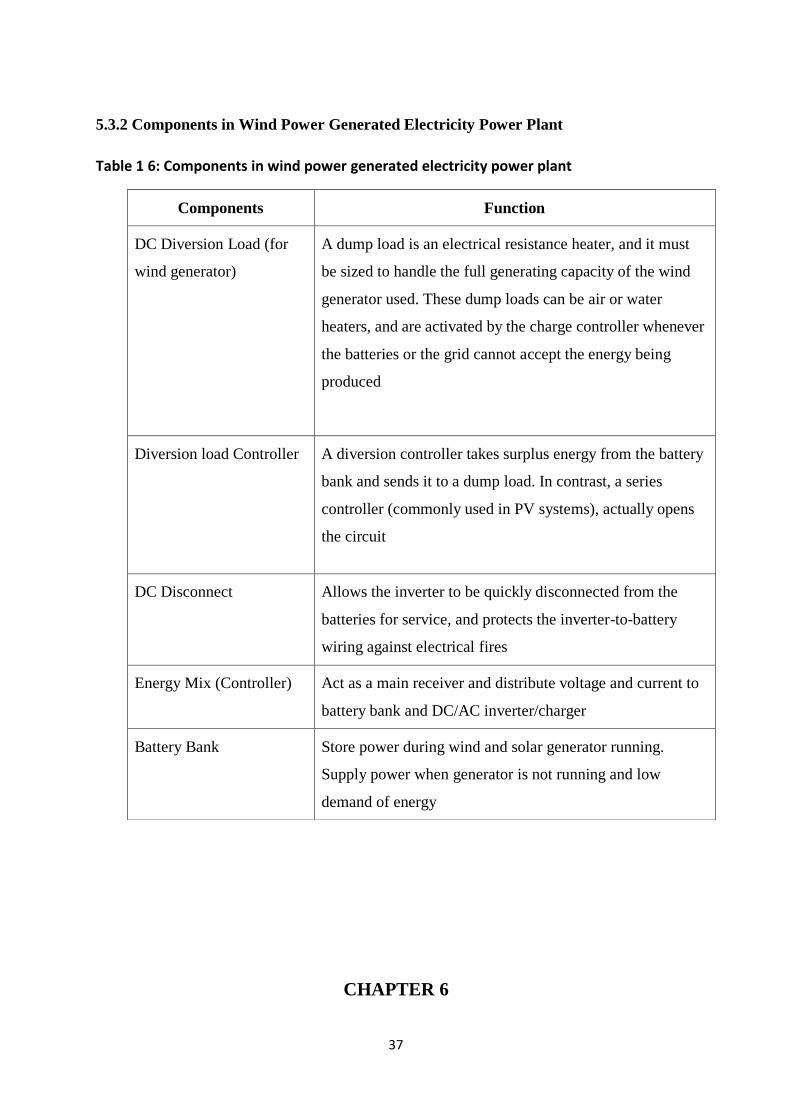
5.3.2 Components in Wind Power Generated Electricity Power Plant
Table 1 6: Components in wind power generated electricity power plant
CHAPTER 6
Components Function
DC Diversion Load (for
wind generator)
A dump load is an electrical resistance heater, and it must
be sized to handle the full generating capacity of the wind
generator used. These dump loads can be air or water
heaters, and are activated by the charge controller whenever
the batteries or the grid cannot accept the energy being
produced
Diversion load Controller A diversion controller takes surplus energy from the battery
bank and sends it to a dump load. In contrast, a series
controller (commonly used in PV systems), actually opens
the circuit
DC Disconnect Allows the inverter to be quickly disconnected from the
batteries for service, and protects the inverter-to-battery
wiring against electrical fires
Energy Mix (Controller) Act as a main receiver and distribute voltage and current to
battery bank and DC/AC inverter/charger
Battery Bank Store power during wind and solar generator running.
Supply power when generator is not running and low
demand of energy
38
ENGINEERING DESING DETAIL
6.1 Detail Specifications
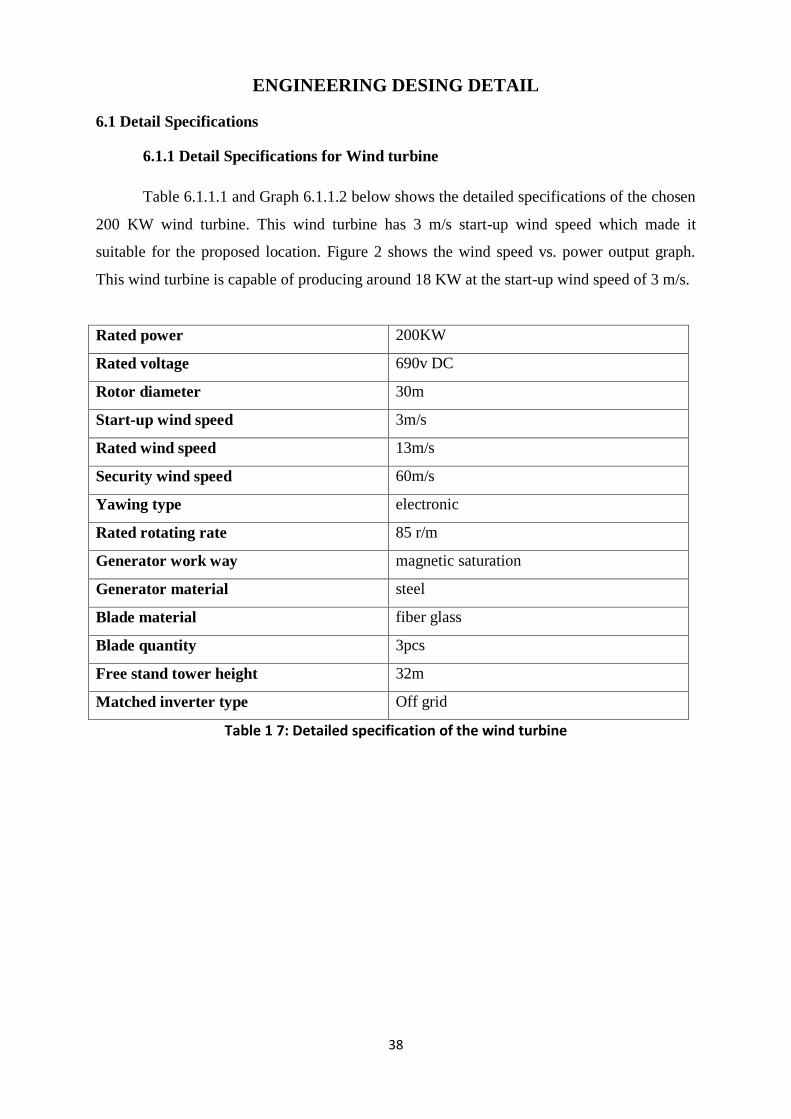
6.1.1 Detail Specifications for Wind turbine
Table 6.1.1.1 and Graph 6.1.1.2 below shows the detailed specifications of the chosen
200 KW wind turbine. This wind turbine has 3 m/s start-up wind speed which made it
suitable for the proposed location. Figure 2 shows the wind speed vs. power output graph.
This wind turbine is capable of producing around 18 KW at the start-up wind speed of 3 m/s.
Rated power 200KW
Rated voltage 690v DC
Rotor diameter 30m
Start-up wind speed 3m/s
Rated wind speed 13m/s
Security wind speed 60m/s
Yawing type electronic
Rated rotating rate 85 r/m
Generator work way magnetic saturation
Generator material steel
Blade material fiber glass
Blade quantity 3pcs
Free stand tower height 32m
Matched inverter type Off grid
Table 1 7: Detailed specification of the wind turbine

39
Figure 2 14: Wind speed vs. estimated power output
6.1.2 Detail Specifications for Solar Panel
Table 6.1.2.1 shows the electrical specifications and estimated price of the chosen
solar panels. The mechanical specifications are indicated in table 6.1.2.2.
Max System Voltage 1000V / 600V
Maximum Power 295 W (-2%, +2%)
CEC PTC Rating 264.8 W Voltage at Maximum Power Point 36.2 V
Current at Maximum Power Point 8.15 A
Open Circuit Voltage 45.0 V
Short Circuit Current 8.92 A Module Efficiency (%) 15.2%
Temperature Coefficient of 0.157 V/ºC (-0.35% /ºC)
Temperature Coefficient of 5.35x10⁻³ A/ºC (0.06% /ºC)
Temperature Coefficient of -1.33 W/ºC (-0.45% /ºC) Operating Temperature -40 ºC to +85 ºC
Cost per panel (USD) 150
No. of panels 1017 Total cost (USD) 152542
Table 1 8: Electrical specifications and estimated price
Characteristic 156mm x 156mm
40
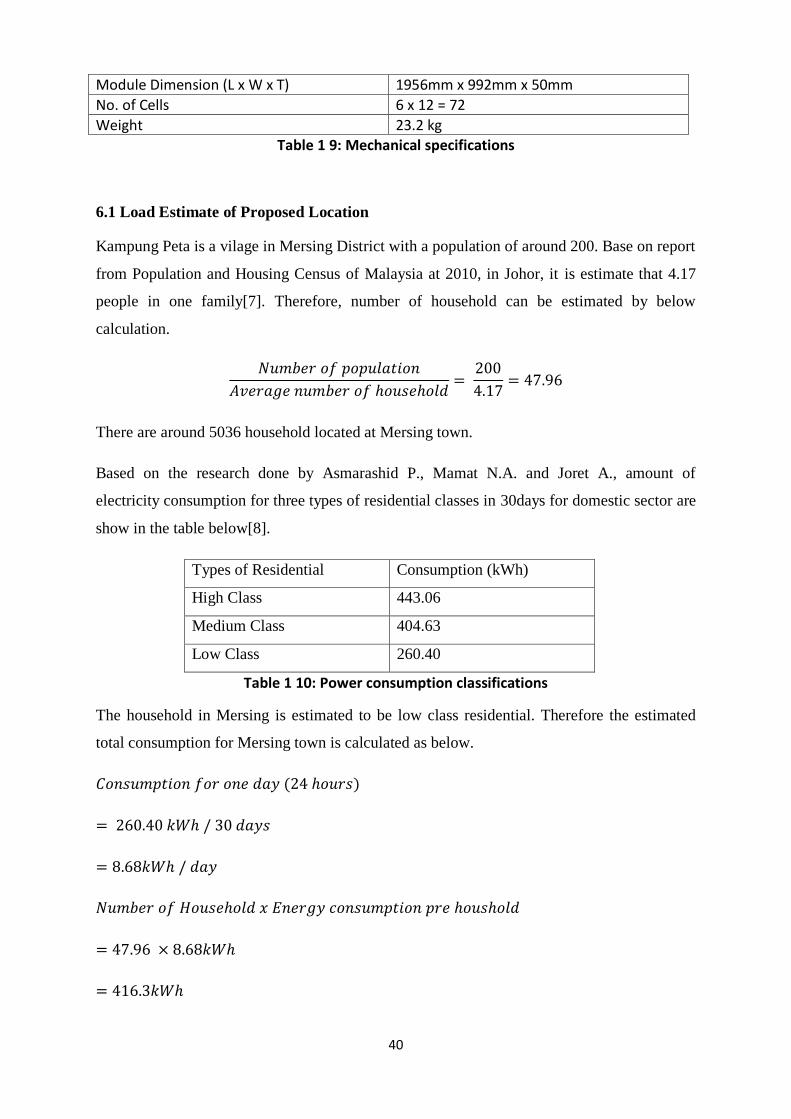
Module Dimension (L x W x T) 1956mm x 992mm x 50mm
No. of Cells 6 x 12 = 72
Weight 23.2 kg Table 1 9: Mechanical specifications
6.1 Load Estimate of Proposed Location
Kampung Peta is a vilage in Mersing District with a population of around 200. Base on report
from Population and Housing Census of Malaysia at 2010, in Johor, it is estimate that 4.17
people in one family[7]. Therefore, number of household can be estimated by below
calculation.
There are around 5036 household located at Mersing town.
Based on the research done by Asmarashid P., Mamat N.A. and Joret A., amount of
electricity consumption for three types of residential classes in 30days for domestic sector are
show in the table below[8].
Types of Residential Consumption (kWh)
High Class 443.06
Medium Class 404.63
Low Class 260.40
Table 1 10: Power consumption classifications
The household in Mersing is estimated to be low class residential. Therefore the estimated
total consumption for Mersing town is calculated as below.
41
6.2 General Concept of Solar Collector System
Polycrystalline Silicon Solar Cells will be chosen to implement to the solar collector system.
The reason choosing Polycrystalline Silicon Solar Cells is it has lower price when compare to
Monocrystalline Silicon Solar Cells. Although it has slightly low efficiency compare to
monocrystalline, it is still acceptable with the price available in market. Other than that,
polycrystalline has better performance in hot condition that can adapt in Malaysia’s Hot
Climate. It has also good life span which usually comes with 25 years warranty by
manufacturer.
6.3 Efficiency Improvement for Solar Collector System
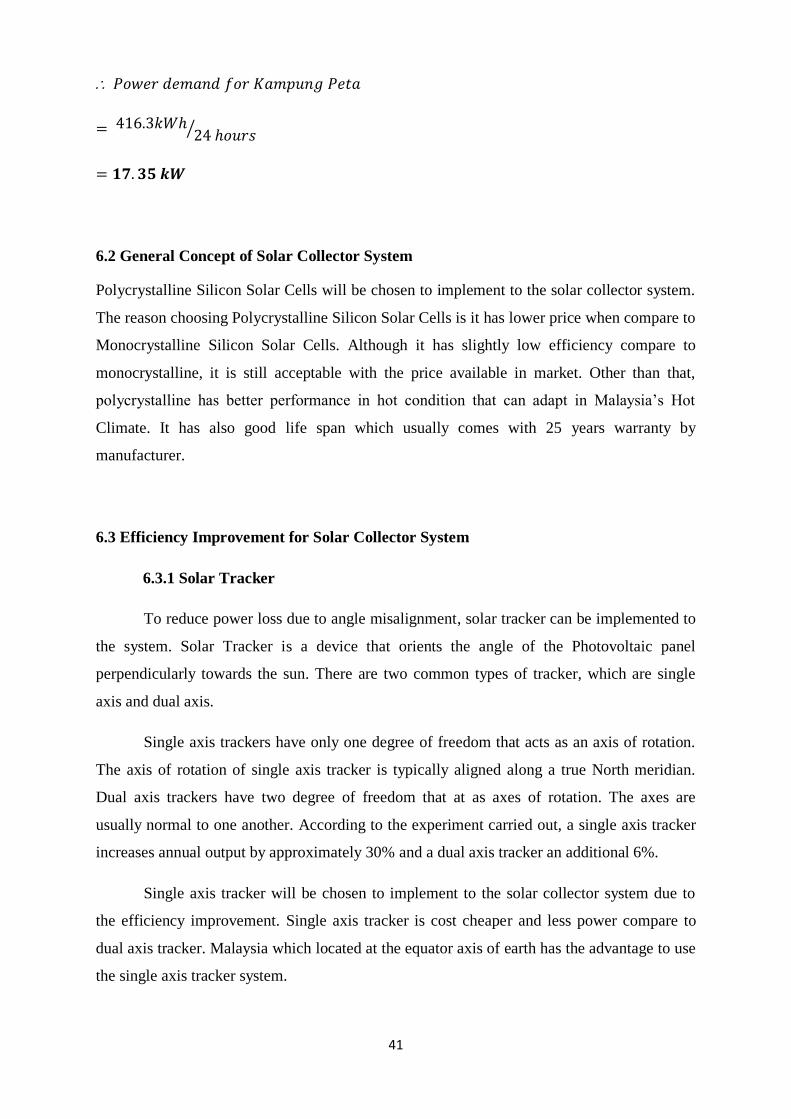
6.3.1 Solar Tracker
To reduce power loss due to angle misalignment, solar tracker can be implemented to
the system. Solar Tracker is a device that orients the angle of the Photovoltaic panel
perpendicularly towards the sun. There are two common types of tracker, which are single
axis and dual axis.
Single axis trackers have only one degree of freedom that acts as an axis of rotation.
The axis of rotation of single axis tracker is typically aligned along a true North meridian.
Dual axis trackers have two degree of freedom that at as axes of rotation. The axes are
usually normal to one another. According to the experiment carried out, a single axis tracker
increases annual output by approximately 30% and a dual axis tracker an additional 6%.
Single axis tracker will be chosen to implement to the solar collector system due to
the efficiency improvement. Single axis tracker is cost cheaper and less power compare to
dual axis tracker. Malaysia which located at the equator axis of earth has the advantage to use
the single axis tracker system.
42
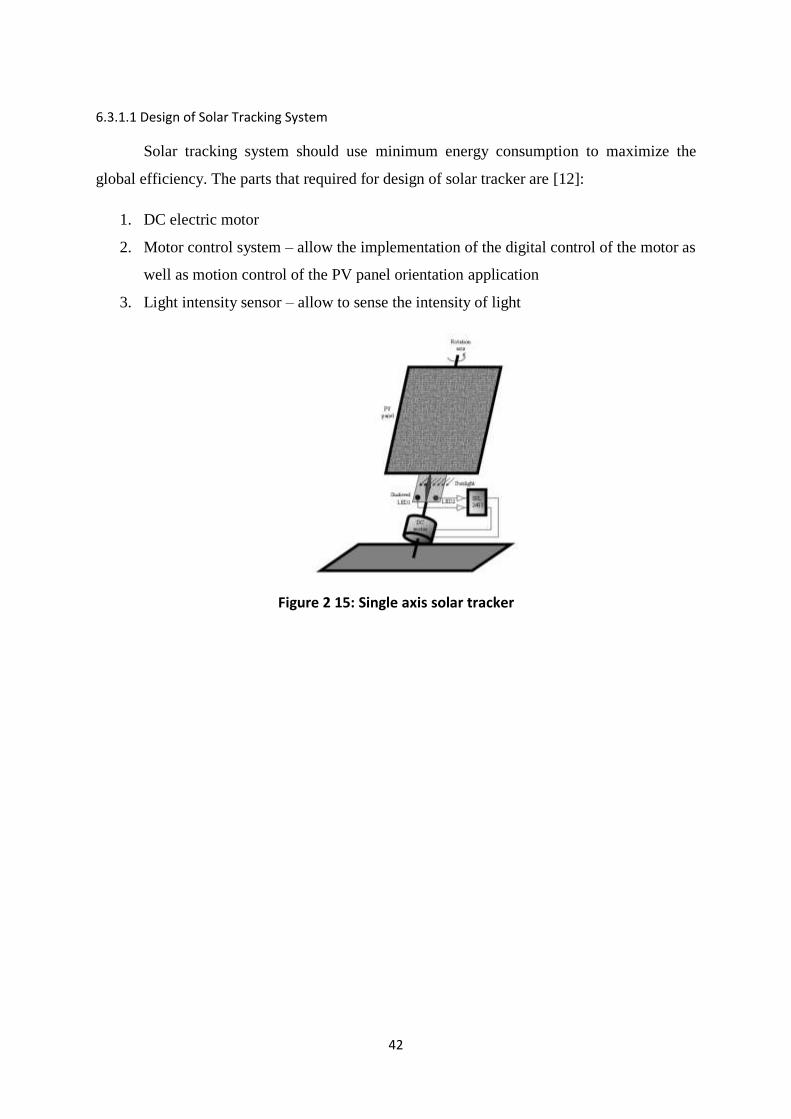
6.3.1.1 Design of Solar Tracking System
Solar tracking system should use minimum energy consumption to maximize the
global efficiency. The parts that required for design of solar tracker are [12]:
1. DC electric motor
2. Motor control system – allow the implementation of the digital control of the motor as
well as motion control of the PV panel orientation application
3. Light intensity sensor – allow to sense the intensity of light
Figure 2 15: Single axis solar tracker
43
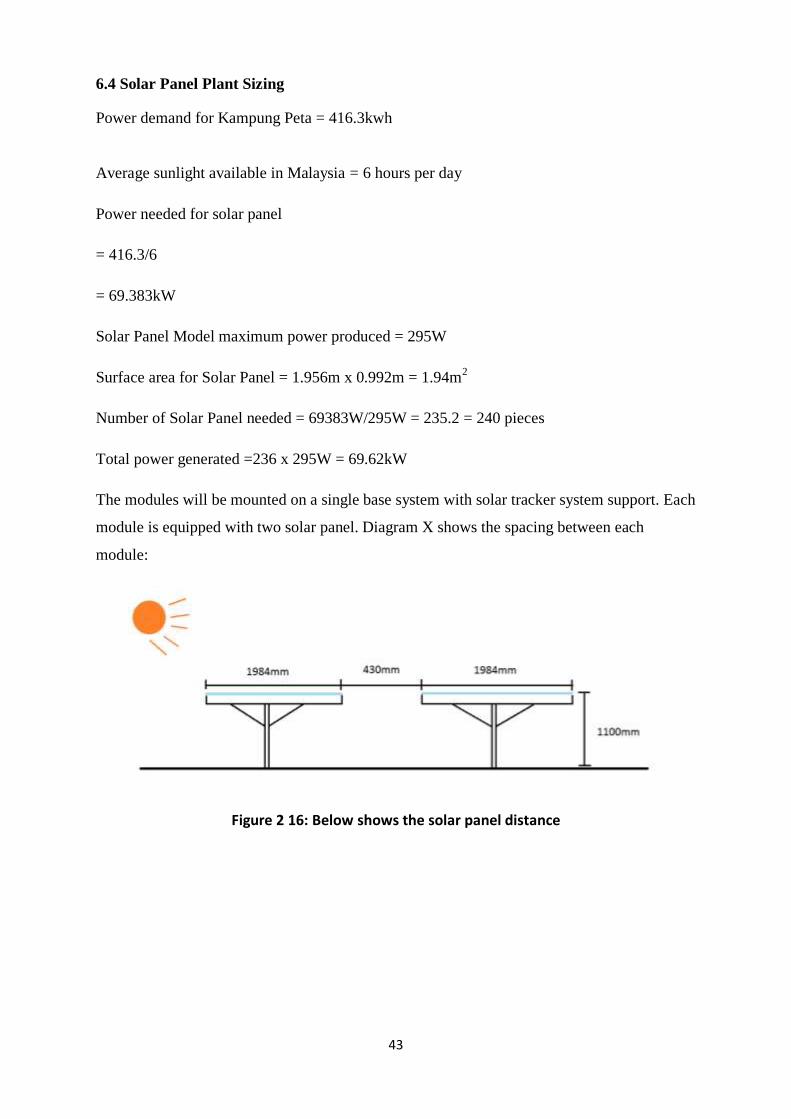
6.4 Solar Panel Plant Sizing
Power demand for Kampung Peta = 416.3kwh
Average sunlight available in Malaysia = 6 hours per day
Power needed for solar panel
= 416.3/6
= 69.383kW
Solar Panel Model maximum power produced = 295W
Surface area for Solar Panel = 1.956m x 0.992m = 1.94m2
Number of Solar Panel needed = 69383W/295W = 235.2 = 240 pieces
Total power generated =236 x 295W = 69.62kW
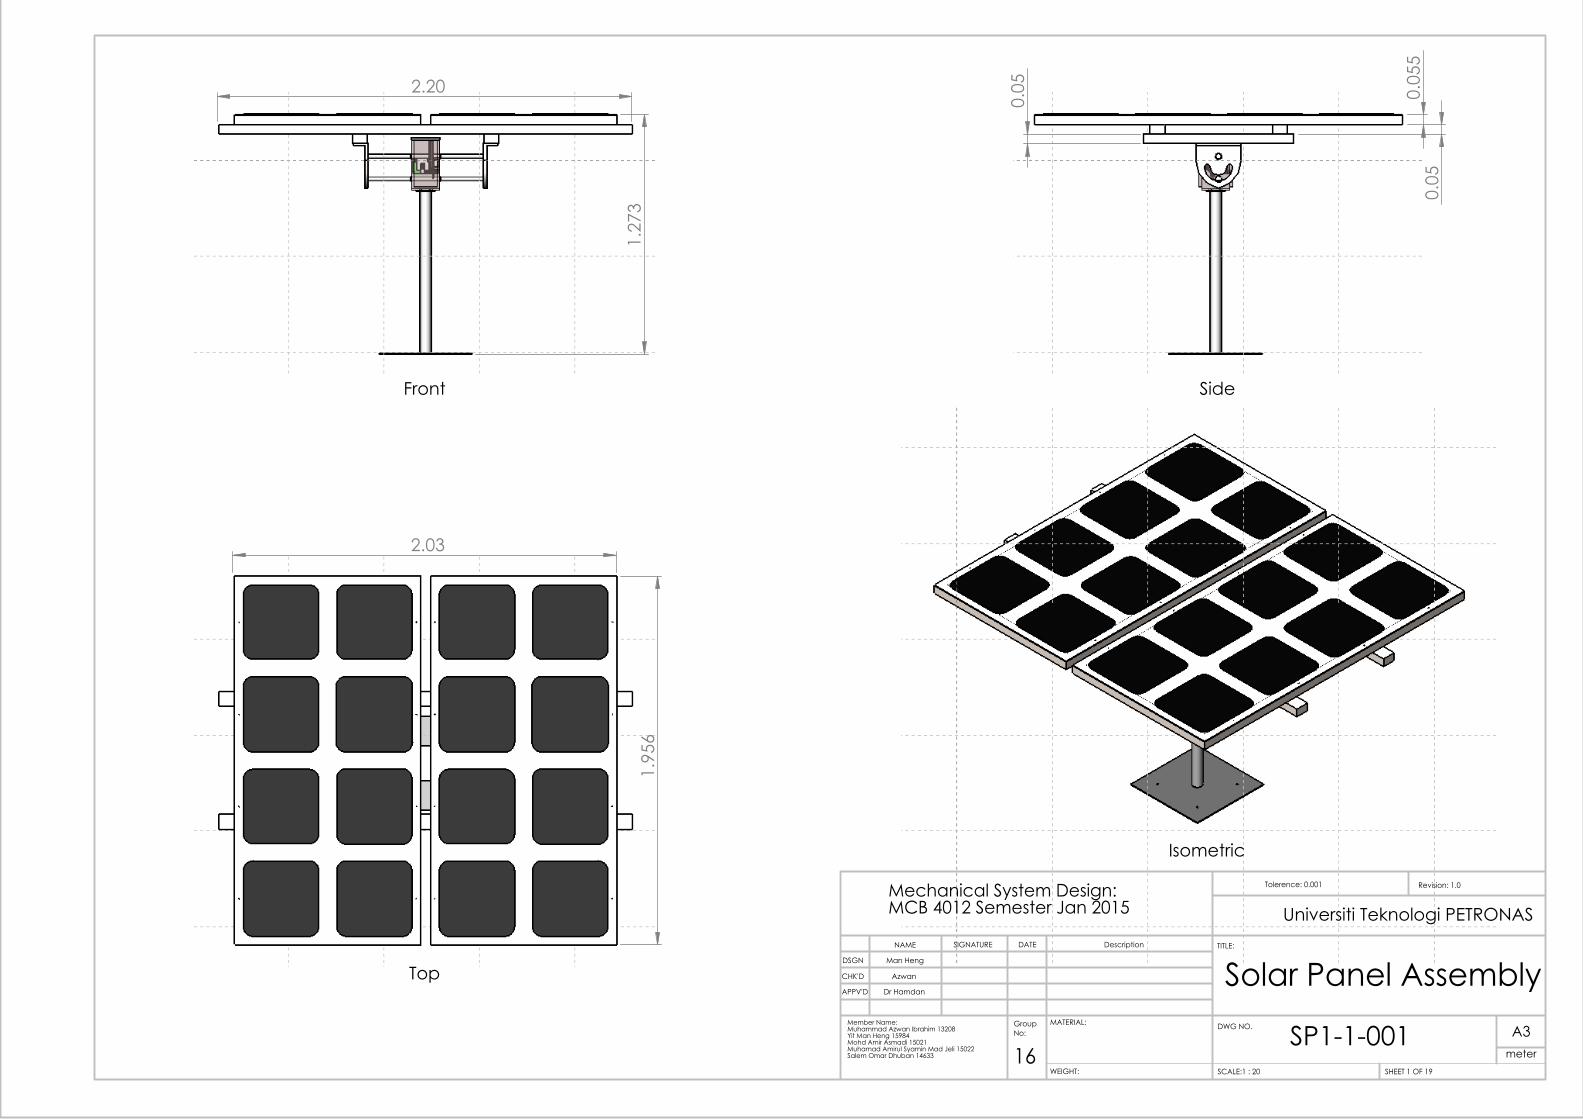
The modules will be mounted on a single base system with solar tracker system support. Each
module is equipped with two solar panel. Diagram X shows the spacing between each
module:
Figure 2 16: Below shows the solar panel distance

44
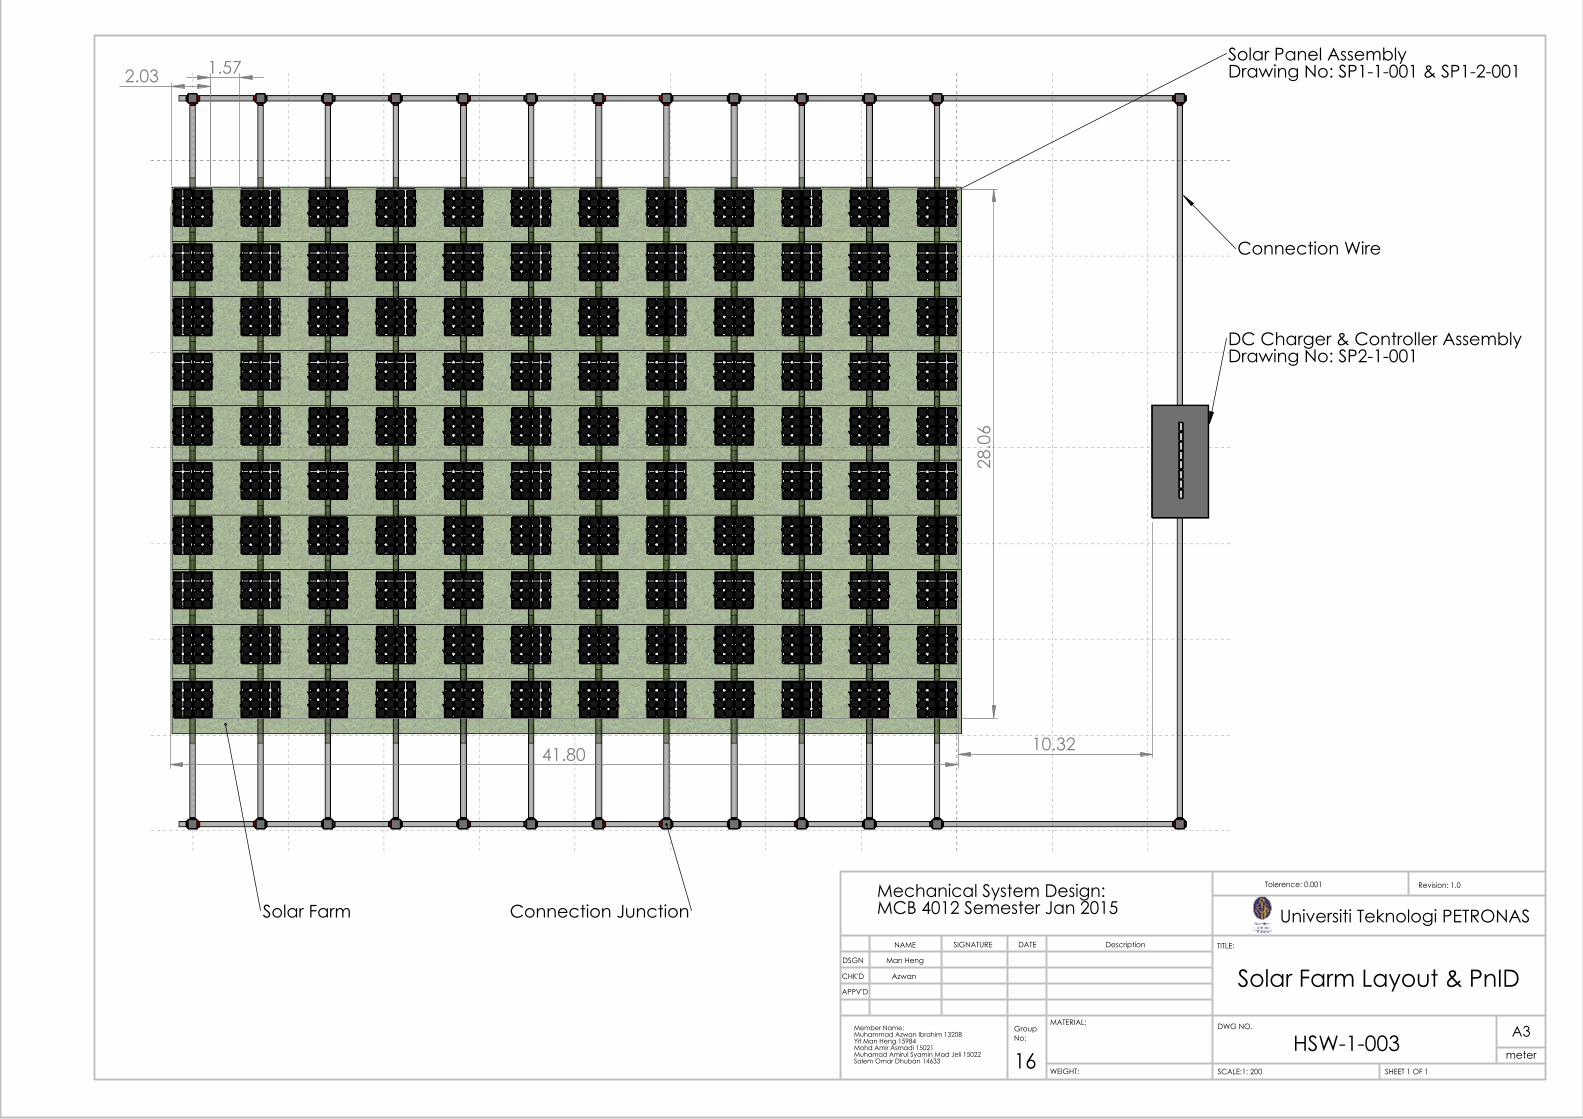
Figure 6.4.1 below shows the solar farm layout of the solar farm:
Figure 2 17: Solar Farm Layout
There are total 240 pieces of solar panel on the solar farm the estimated total area of the solar
panel farm is 695.12m2.
6.5 Solar PNID
Figure 2 18: Wiring of solar farm
Refering to Figrue 6.5.1 Each module equipped with two solar panels which are connected in
parallel. Ten modules are connected in series in one row. There are total twelve rows in the
system.

45
Voltage at Maximum Power Point = 36.2V
Ampere at Maximum Power Point = 8.15A
Condition in One Module (Two Solar Panel connected in Parallel)
Voltage = 36.2V
Ampere = 8.15x2 = 16.3A
Condition in One Row (Ten Module connected in Series)
Voltage = 36.2V x 10 = 362V
Ampere = 16.3A
Condition for Twelve Row (Each row connected in Series)
Voltage = 362V
Ampere = 16.3x12 = 195.6A
Therefore, controller receive condition of voltage = 362 V and ampere = 195.6 A.

46
6.4 Wind Turbine
6.4.1 Power Generation by Wind Turbine
The chart below plot the average daily wind speed roughly aspect during whole year. It also
shows the maximum record sustained wind speed for each month:
Chart 1 1: Maximum and average wind speed for whole year
From this data we can calculate the power supplied by 1 wind turbine, having data supplied
by wind turbine we can estimated the overall size of the wind turbine.
Power produced by single wind turbine =
Power generated by one wind turbine:
Assumptions:
Air Density, 1.2754
Area of blade (radius) 706.95 d = 30m
Power Coefficient, 0.40
Table 1 11: Assumption for wind turbine calculation
8 8 5 4 4 4 5 5 5 5 5 7
56 35
81
31 28 37 35 26 37
56 56 56
Months Jan Fab Mar Apr May Jun Jul Aug Sep Oct Nov
Wind Speed (Km/h)
Months
Wind Speed (Km/H)
Average Wind Speed Km/H Max Km/H

47
Chart 1 2: Minimum Power produced each month
6.4.2 Plant Sizing Calculation
Number of wind turbine needed:
Using the lowest power produced as our reference point we calculate the number of wind
turbine needed to fulfil the power demand.
Wind turbine
Jan Fab Mar Apr May Jun Jul Aug Sep Oct Nov Dec
Power Produced (W) 1443 1443 901.6 721.3 721.3 721.3 901.6 901.6 901.6 901.6 901.6 1262
0
200
400
600
800
1000
1200
1400
1600
Power (W)
Months
Power Produced (W)
Power Produced (W)
48
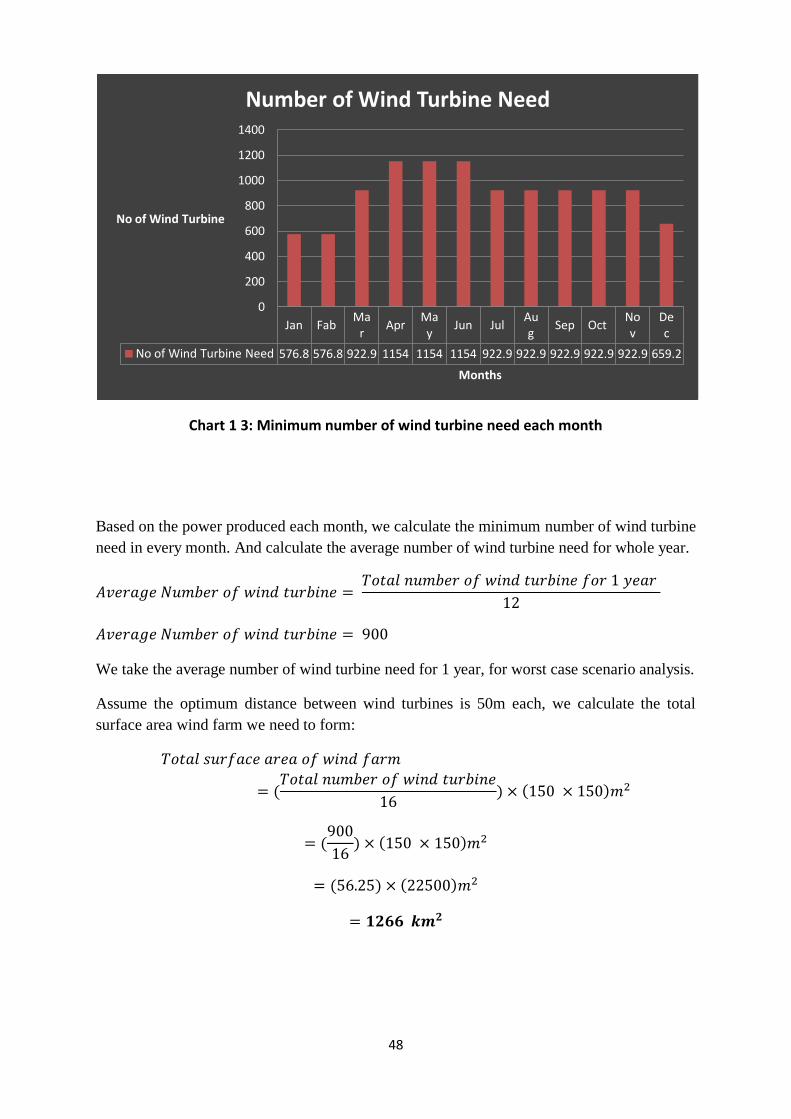
Chart 1 3: Minimum number of wind turbine need each month
Based on the power produced each month, we calculate the minimum number of wind turbine
need in every month. And calculate the average number of wind turbine need for whole year.
We take the average number of wind turbine need for 1 year, for worst case scenario analysis.
Assume the optimum distance between wind turbines is 50m each, we calculate the total
surface area wind farm we need to form:
Jan Fab Ma
r Apr
May
Jun Jul Aug
Sep Oct Nov
Dec
No of Wind Turbine Need 576.8 576.8 922.9 1154 1154 1154 922.9 922.9 922.9 922.9 922.9 659.2
0
200
400
600
800
1000
1200
1400
No of Wind Turbine
Months
Number of Wind Turbine Need
49
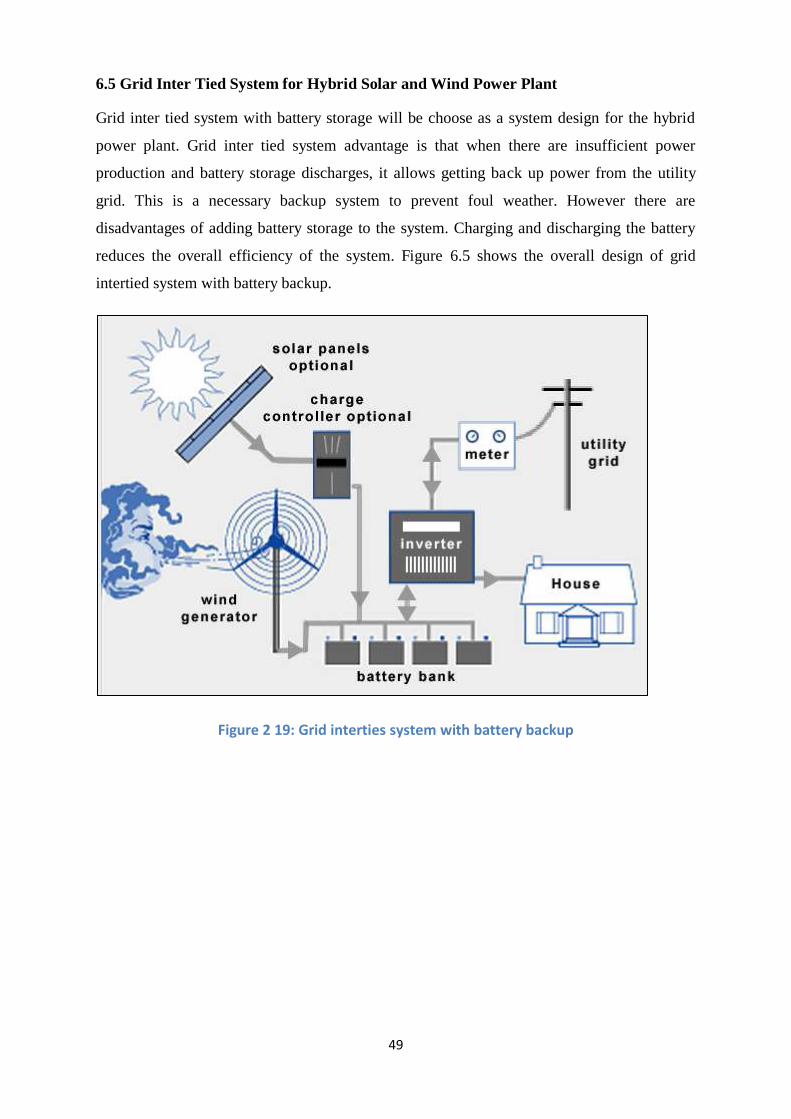
6.5 Grid Inter Tied System for Hybrid Solar and Wind Power Plant
Grid inter tied system with battery storage will be choose as a system design for the hybrid
power plant. Grid inter tied system advantage is that when there are insufficient power
production and battery storage discharges, it allows getting back up power from the utility
grid. This is a necessary backup system to prevent foul weather. However there are
disadvantages of adding battery storage to the system. Charging and discharging the battery
reduces the overall efficiency of the system. Figure 6.5 shows the overall design of grid
intertied system with battery backup.
Figure 2 19: Grid interties system with battery backup
50
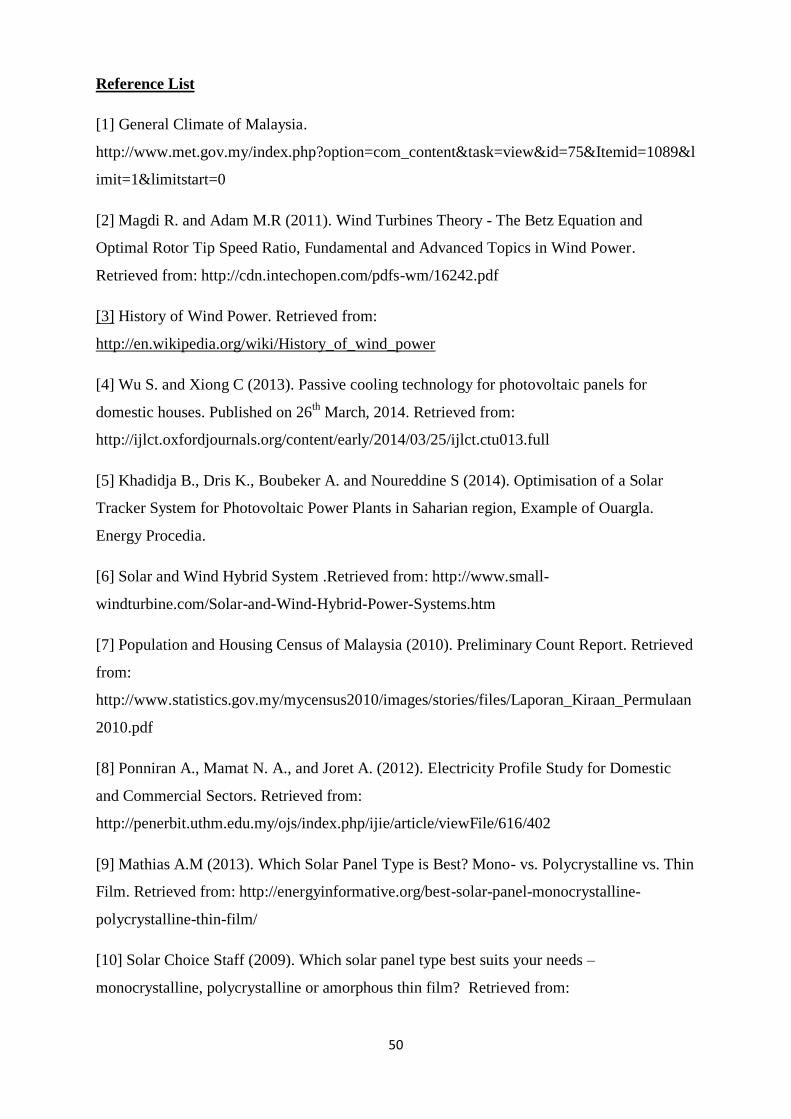
Reference List
[1] General Climate of Malaysia.
http://www.met.gov.my/index.php?option=com_content&task=view&id=75&Itemid=1089&l
imit=1&limitstart=0
[2] Magdi R. and Adam M.R (2011). Wind Turbines Theory - The Betz Equation and
Optimal Rotor Tip Speed Ratio, Fundamental and Advanced Topics in Wind Power.
Retrieved from: http://cdn.intechopen.com/pdfs-wm/16242.pdf
[3] History of Wind Power. Retrieved from:
http://en.wikipedia.org/wiki/History_of_wind_power
[4] Wu S. and Xiong C (2013). Passive cooling technology for photovoltaic panels for
domestic houses. Published on 26th
March, 2014. Retrieved from:
http://ijlct.oxfordjournals.org/content/early/2014/03/25/ijlct.ctu013.full
[5] Khadidja B., Dris K., Boubeker A. and Noureddine S (2014). Optimisation of a Solar
Tracker System for Photovoltaic Power Plants in Saharian region, Example of Ouargla.
Energy Procedia.
[6] Solar and Wind Hybrid System .Retrieved from: http://www.small-
windturbine.com/Solar-and-Wind-Hybrid-Power-Systems.htm
[7] Population and Housing Census of Malaysia (2010). Preliminary Count Report. Retrieved
from:
http://www.statistics.gov.my/mycensus2010/images/stories/files/Laporan_Kiraan_Permulaan
2010.pdf
[8] Ponniran A., Mamat N. A., and Joret A. (2012). Electricity Profile Study for Domestic
and Commercial Sectors. Retrieved from:
http://penerbit.uthm.edu.my/ojs/index.php/ijie/article/viewFile/616/402
[9] Mathias A.M (2013). Which Solar Panel Type is Best? Mono- vs. Polycrystalline vs. Thin
Film. Retrieved from: http://energyinformative.org/best-solar-panel-monocrystalline-
polycrystalline-thin-film/
[10] Solar Choice Staff (2009). Which solar panel type best suits your needs –
monocrystalline, polycrystalline or amorphous thin film? Retrieved from:
51
http://www.solarchoice.net.au/blog/which-solar-panel-type-best-suits-your-needs-
monocrystalline-polycrystalline-or-amorphous-thin-film/
[11] N. Clarke. The effective collection area of a flat-panel solar collector varies with the
cosine of the misalignment of the panel with the Sun. Retrieved from:
http://en.wikipedia.org/wiki/Solar_tracker#mediaviewer/File:SolarPanel_alignment.png
[12] Tudorache T. and Kreindler L (2010). Design of a Solar Tracker System for PV Power
Plants. Retrieved from: http://www.uni-obuda.hu/journal/Tudorache_Kreindler_22.pdf
[13] 3 Types of Residential Solar Electric Power Systems (2012). Retrieved from:
http://www.cleanenergyauthority.com/solar-energy-resources/3-types-of-residential-solar-
electric-power-systems
http://www.alibaba.com/product-detail/300kw-permanent-magnet-wind-
generator_560210266.html?s=p
http://img.weiku.com/waterpicture/2011/10/22/21/YGDL_500_Outer_Rotor_Wind_Pow
er_PM_Generator_634592034367381993_2.jpg
1.57 2.03
41.80
28.
06
10.32
DC Charger & Controller Assembly Drawing No: SP2-1-001
Solar Panel AssemblyDrawing No: SP1-1-001 & SP1-2-001
Connection Wire
Connection JunctionSolar Farm
HSW-1-003
Solar Farm Layout & PnIDAzwan
Man Heng
WEIGHT:
A3
SHEET 1 OF 1SCALE:1: 200
DWG NO.
TITLE:
Revision: 1.0Tolerence: 0.001
MATERIAL:
DATESIGNATURENAME Description
Group No:
16
Mechanical System Design: MCB 4012 Semester Jan 2015
Member Name: Muhammad Azwan Ibrahim 13208Yit Man Heng 15984Mohd Amir Asmadi 15021Muhamad Amirul Syamin Mad Jeli 15022Salem Omar Dhuban 14633
APPV'D
CHK'D
DSGN
Universiti Teknologi PETRONAS
meter
1.2
73
2.20
Front
2.03
1.9
56
Top
Isometric
0.0
55
0.0
5
0.0
5
Side
Solar Panel AssemblyDr Hamdan
Azwan
Man Heng
WEIGHT:
A3
SHEET 1 OF 19SCALE:1 : 20
DWG NO.
TITLE:
Revision: 1.0Tolerence: 0.001
MATERIAL:
DATESIGNATURENAME Description
Group No:
16
Mechanical System Design: MCB 4012 Semester Jan 2015
Member Name: Muhammad Azwan Ibrahim 13208Yit Man Heng 15984Mohd Amir Asmadi 15021Muhamad Amirul Syamin Mad Jeli 15022Salem Omar Dhuban 14633
APPV'D
CHK'D
DSGN
Universiti Teknologi PETRONAS
meterSP1-1-001
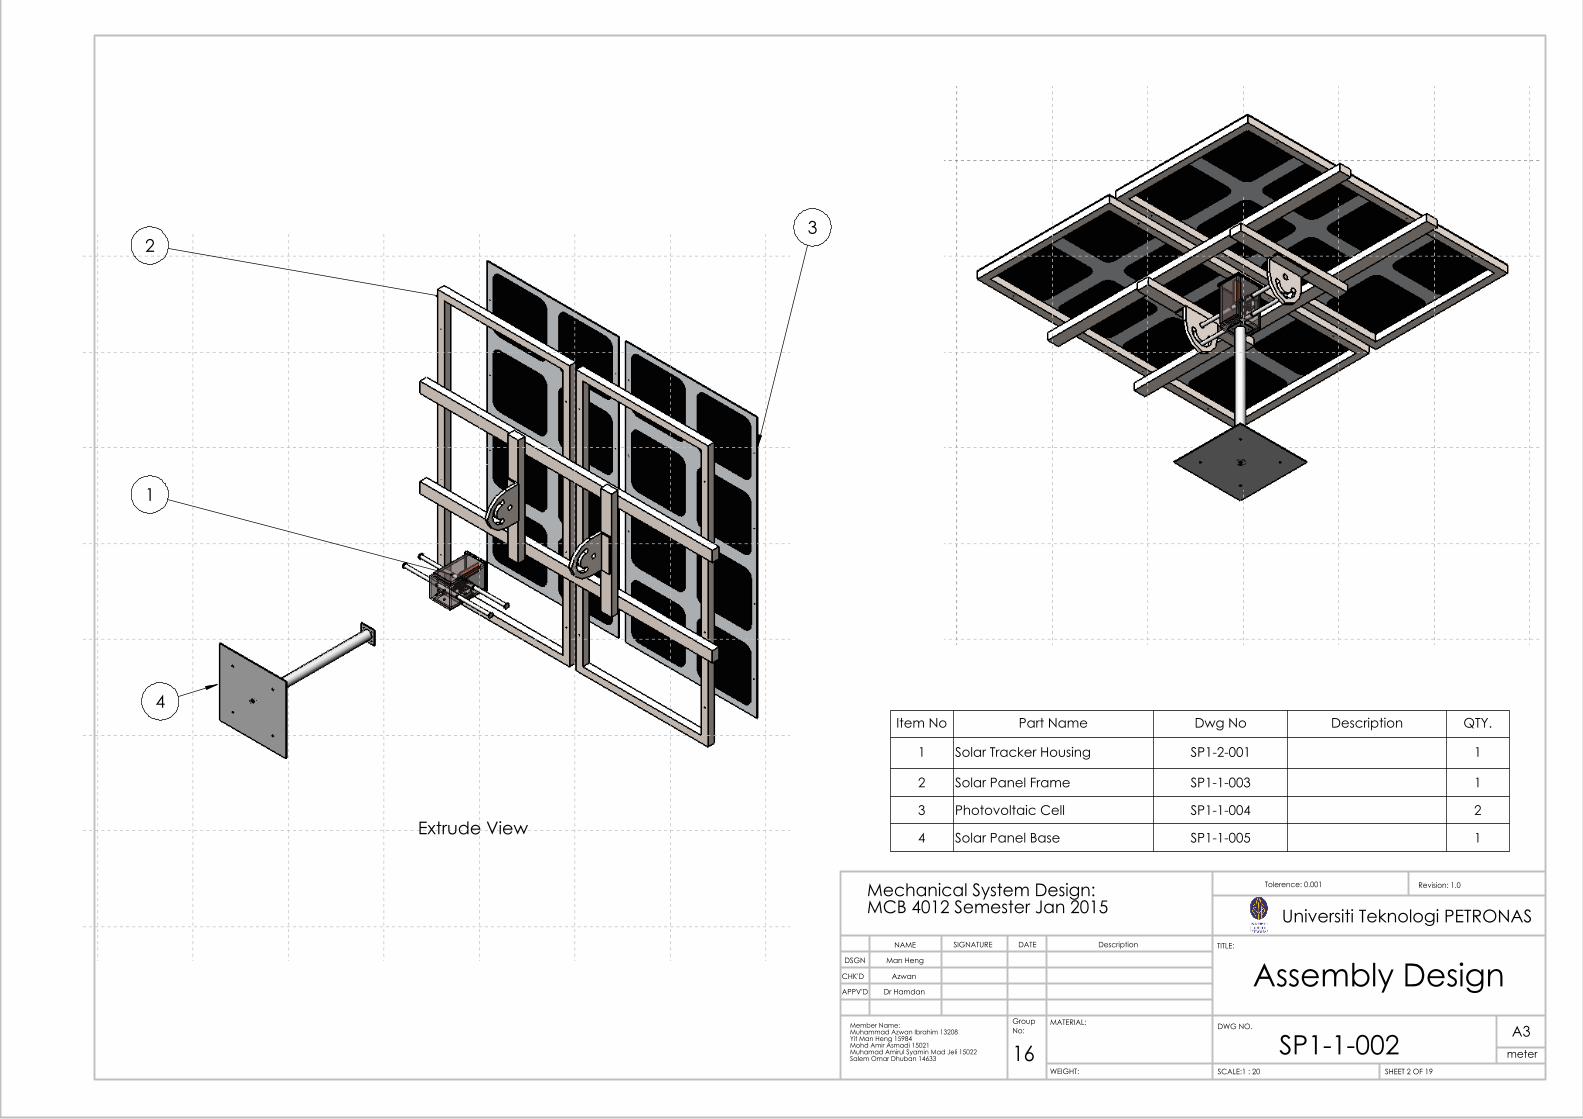
Extrude View
23
4
1
Item No Part Name Dwg No Description QTY.
1 Solar Tracker Housing SP1-2-001 1
2 Solar Panel Frame SP1-1-003 1
3 Photovoltaic Cell SP1-1-004 2
4 Solar Panel Base SP1-1-005 1
Assembly DesignDr Hamdan
Azwan
Man Heng
WEIGHT:
A3
SHEET 2 OF 19SCALE:1 : 20
DWG NO.
TITLE:
Revision: 1.0Tolerence: 0.001
MATERIAL:
DATESIGNATURENAME Description
Mechanical System Design: MCB 4012 Semester Jan 2015
Member Name: Muhammad Azwan Ibrahim 13208Yit Man Heng 15984Mohd Amir Asmadi 15021Muhamad Amirul Syamin Mad Jeli 15022Salem Omar Dhuban 14633
Group No:
16
APPV'D
CHK'D
DSGN
Universiti Teknologi PETRONAS
meterSP1-1-002

1.9
56
0.992
0.05
0.992
1.9
56
0.62 0.08
0.8
0
0.004
0.02
0.4
9 0
.24
0.4
9
0.4
9
Top
0.02
0.2
4
0.0
5
2.20
2.034
0.62 0.78
0.0
5 0.0
5
Front
0.05
1.9
56
0.05
0.0
8
0.05
0.8
0
0.01
0.2
4
0.03
R0.15
Side
Tolerence : 0.001
meterSP1-1-003
12/3/2015
11/3/2015
12/3/2015
Member Name: Muhammad Azwan Ibrahim 13208Yit Man Heng 15984Mohd Amir Asmadi 15021Muhamad Amirul Syamin Mad Jeli 15022Salem Omar Dhuban 14633
Group No:
16
Dr HamdanAPPV'D
Man Heng
Azwan
WEIGHT:
Mild Steels A3
SCALE:1:20
DWG NO.
TITLE:
MATERIAL:
DATESIGNATURENAME
CHK'D
DRAWN
Solar Panel Frame
SHEET 3 OF 19
Universiti Teknologi PETRONASMechanical System Design: MCB 4012 Semester Jan 2015
Revision: 1.0
Description

Top
Front
0.005
1.9
56
Side
SP1-1-004
Photovoltaic Cell
Universiti Teknologi PETRONAS
WEIGHT:
N-Type & P-Type Semiconductor
A3
SHEET 4 OF 19SCALE: 1: 10
DWG NO.
TITLE:
REVISION : 1.0Tolerence: 0 005
MATERIAL:
DATESIGNATURENAME Description
Member Name: Muhammad Azwan Ibrahim 13208Yit Man Heng 15984Mohd Amir Asmadi 15021Muhamad Amirul Syamin Mad Jeli 15022Salem Omar Dhuban 14633
Mechanical System Design: MCB 4012 Semester Jan 2015
Group No:
16
APPV'D
CHK'D
DRAWN
meter
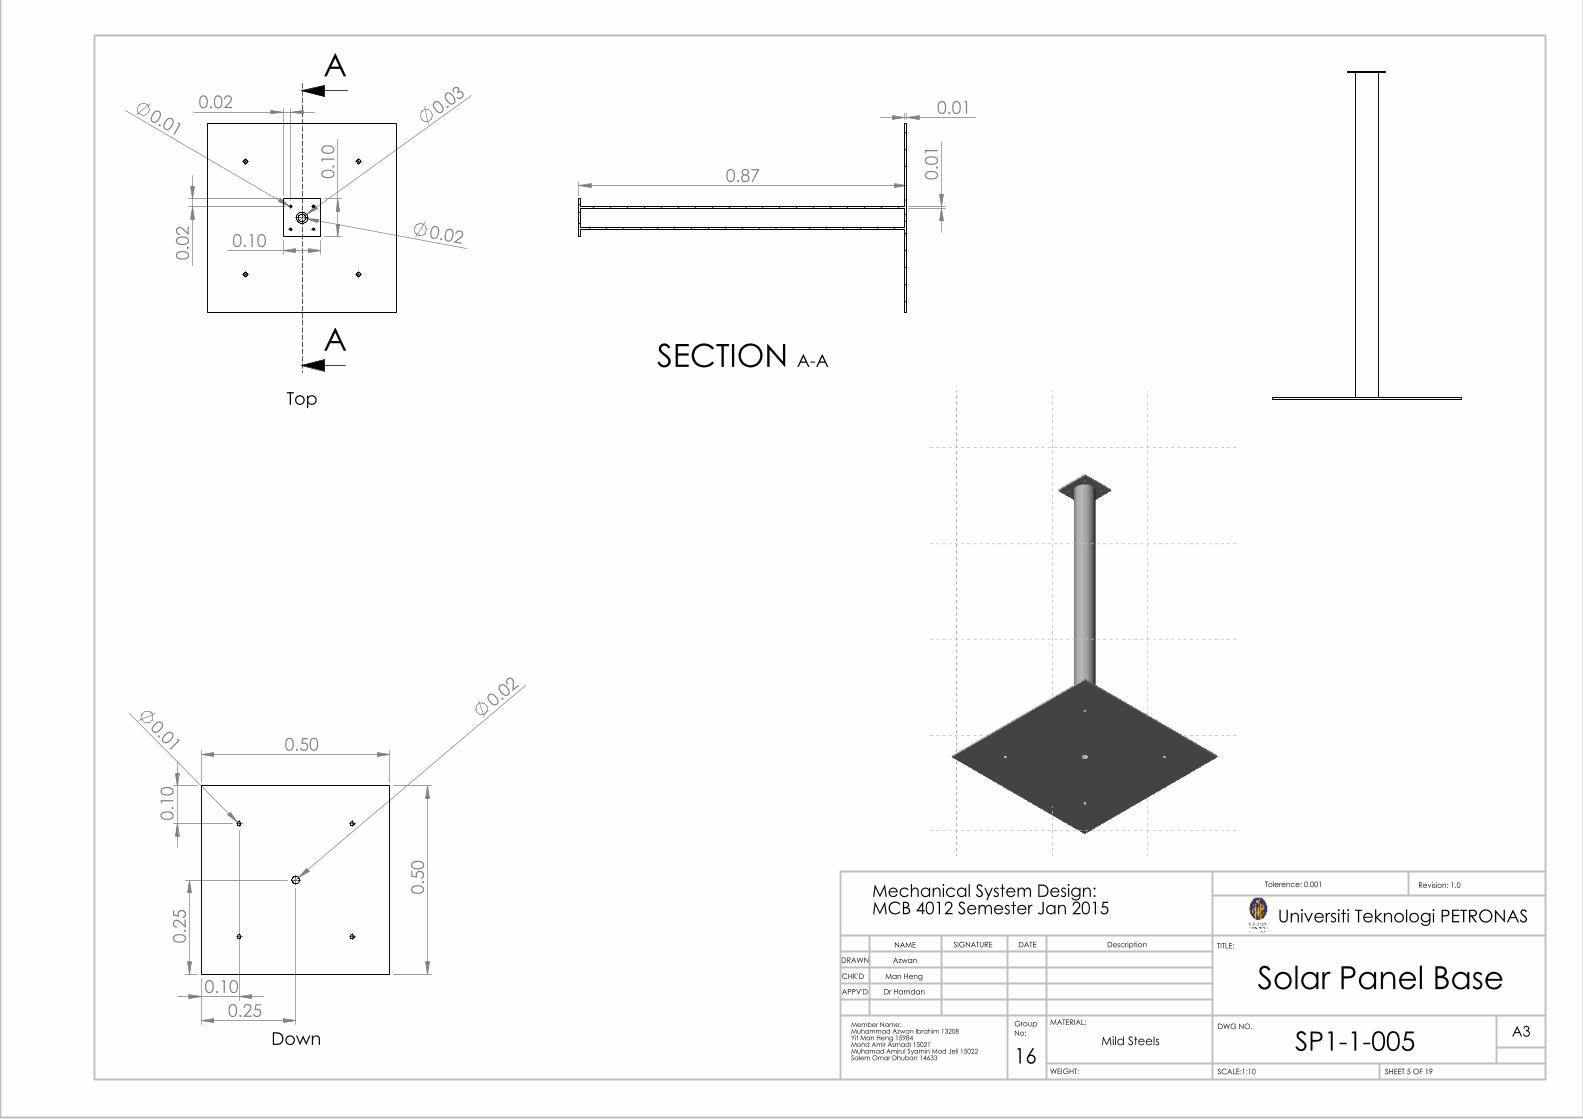
0.50
0.5
0
0.1
0
0.10
0.02
0.25
0.2
5
0.01
Down
0.1
0
0.10
0.03
0.02
0.01
0.0
2
0.02
A
ATop
0.87
0.01
0.0
1
SECTION A-A
SP1-1-005
Solar Panel BaseDr Hamdan
Man Heng
Azwan
WEIGHT:
Mild SteelsA3
SHEET 5 OF 19SCALE:1:10
DWG NO.
TITLE:
Revision: 1.0Tolerence: 0.001
MATERIAL:
DATESIGNATURENAME Description
Group No:
16
Mechanical System Design: MCB 4012 Semester Jan 2015
Member Name: Muhammad Azwan Ibrahim 13208Yit Man Heng 15984Mohd Amir Asmadi 15021Muhamad Amirul Syamin Mad Jeli 15022Salem Omar Dhuban 14633
APPV'D
CHK'D
DRAWN
Universiti Teknologi PETRONAS

0.154 0.65
0.1
865
Top
0.28
0.1
827
0.015 Side
0.25 0.25
0.
10
0.2
8
0.15
Front
SP1-2-001
Solar Tracker AssemblyDr Hamdan
Man Heng
Azwan
WEIGHT:
A3
SHEET 6 OF 19SCALE:1: 5
DWG NO.
TITLE:
Revision: 1.0Tolerence: 0.001
MATERIAL:
DATESIGNATURENAME Description
Group No:
16
Mechanical System Design: MCB 4012 Semester Jan 2015
Member Name: Muhammad Azwan Ibrahim 13208Yit Man Heng 15984Mohd Amir Asmadi 15021Muhamad Amirul Syamin Mad Jeli 15022Salem Omar Dhuban 14633
APPV'D
CHK'D
DSGN
Universiti Teknologi PETRONAS
meter
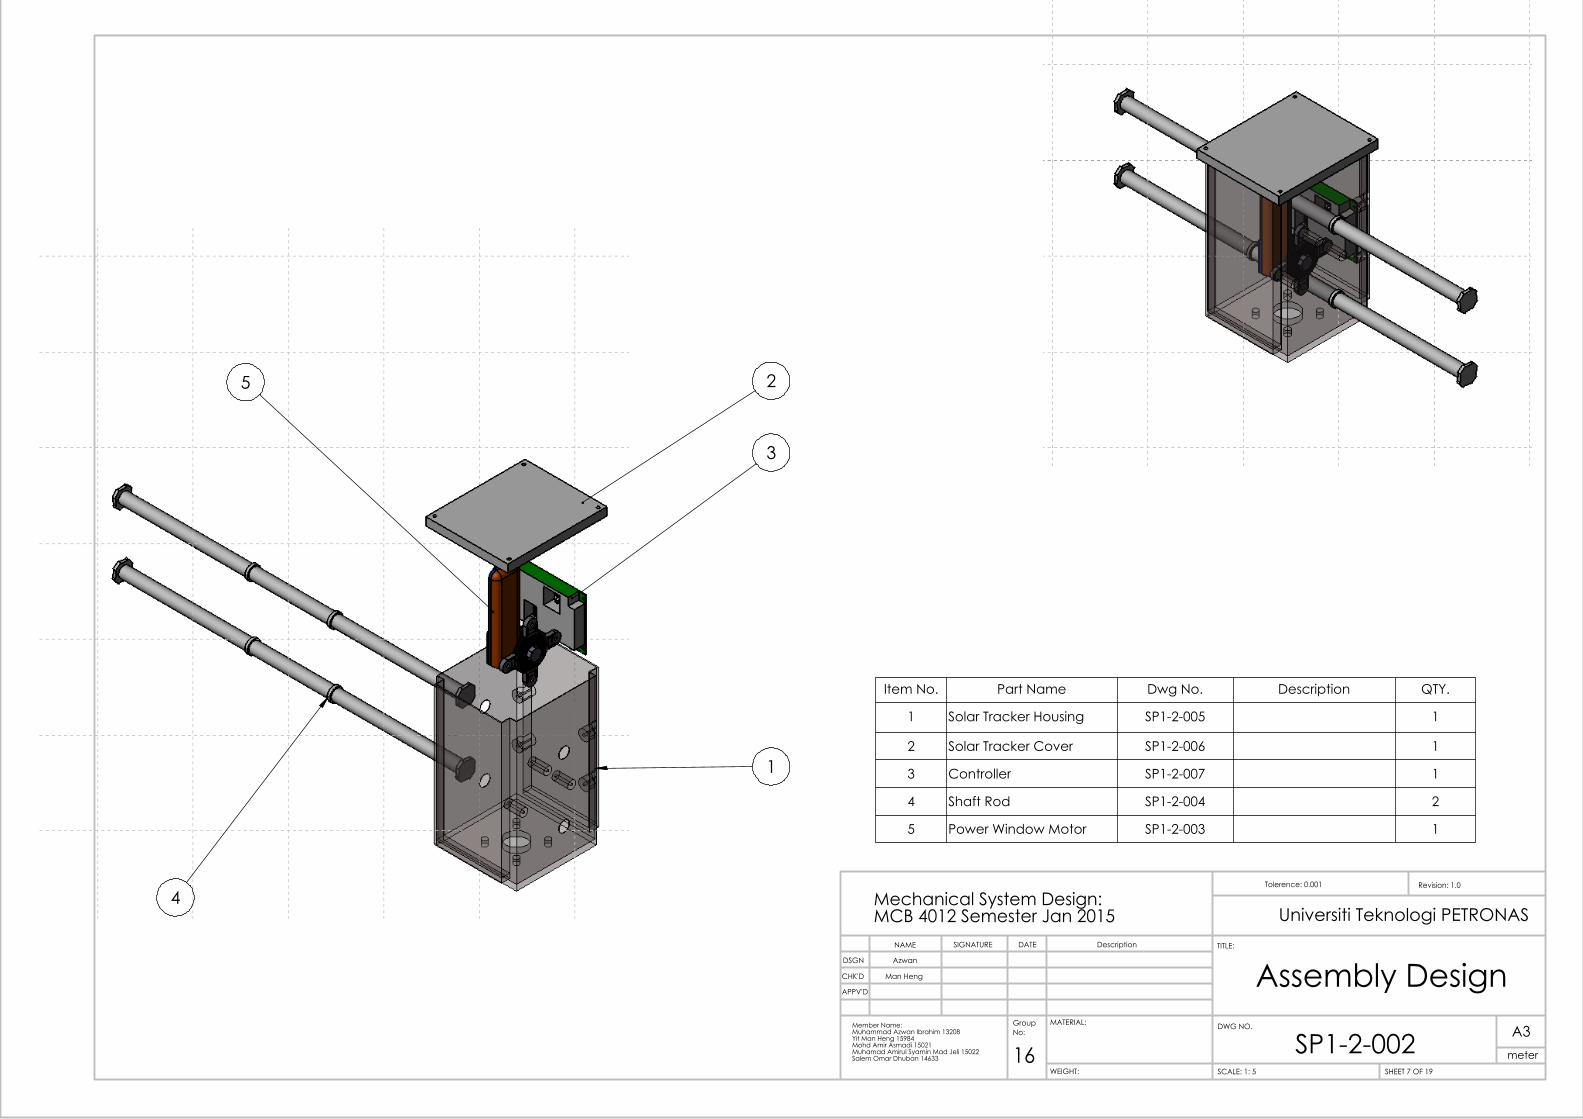
2
3
5
1
4
SP1-2-002
Item No. Part Name Dwg No. Description QTY.
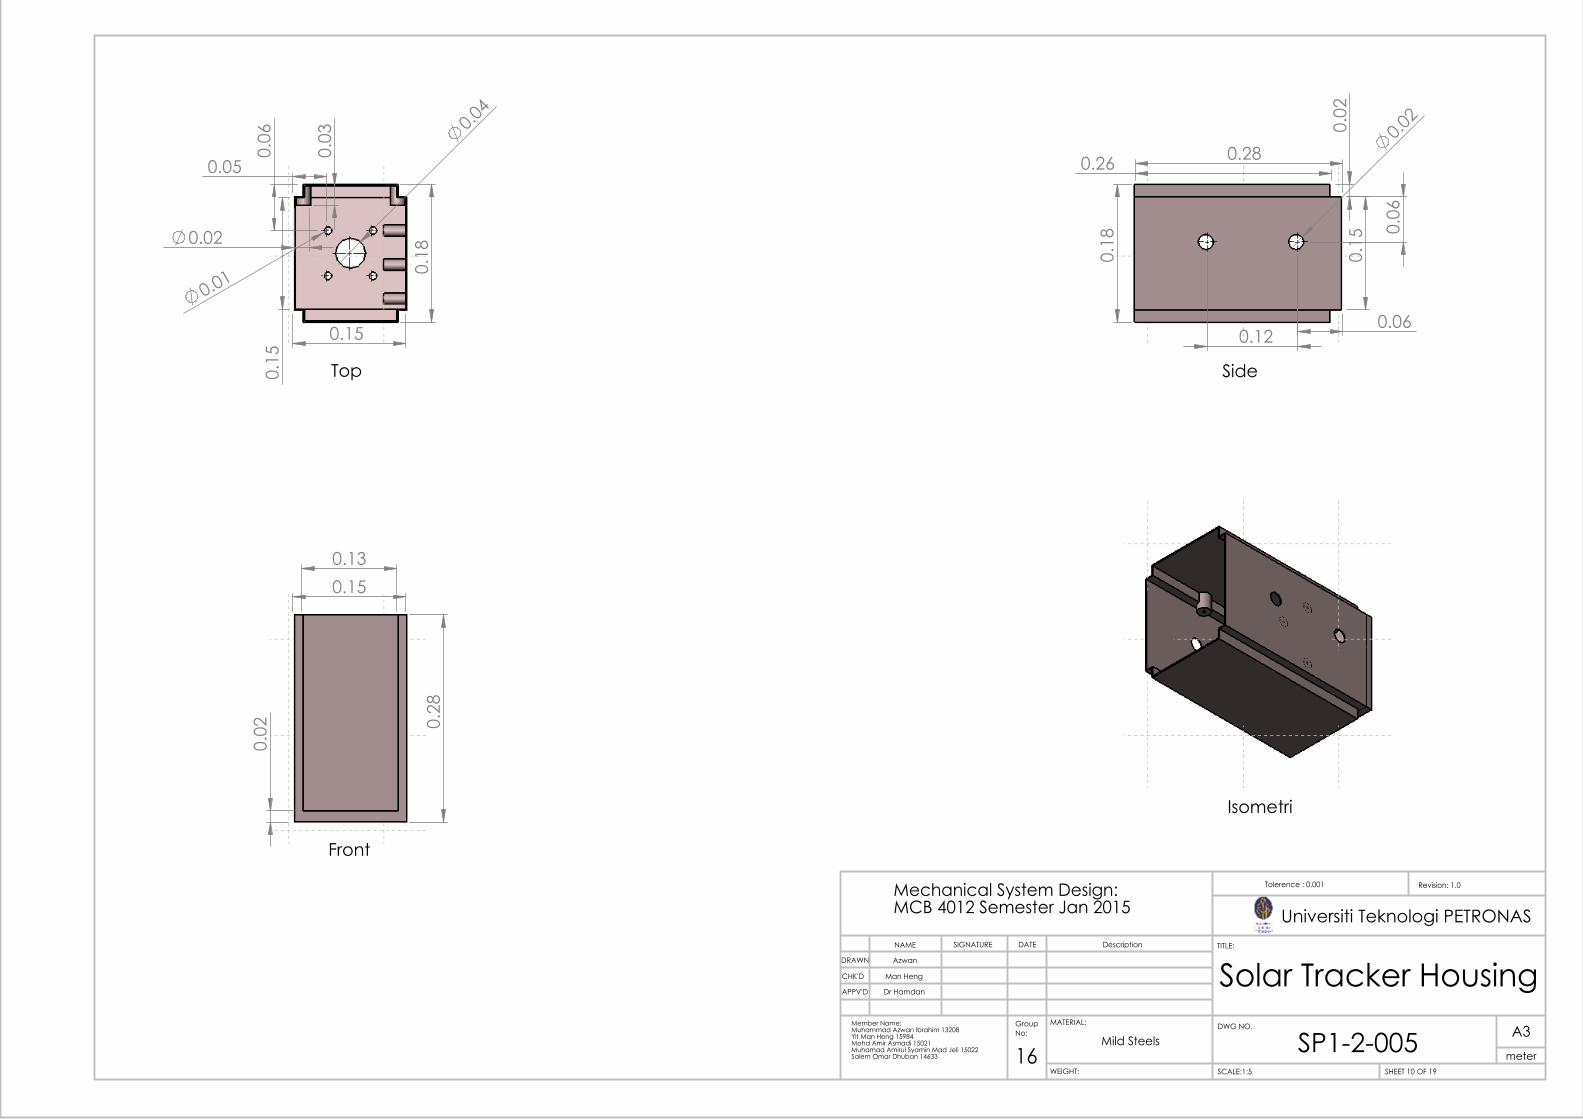
1 Solar Tracker Housing SP1-2-005 1
2 Solar Tracker Cover SP1-2-006 1
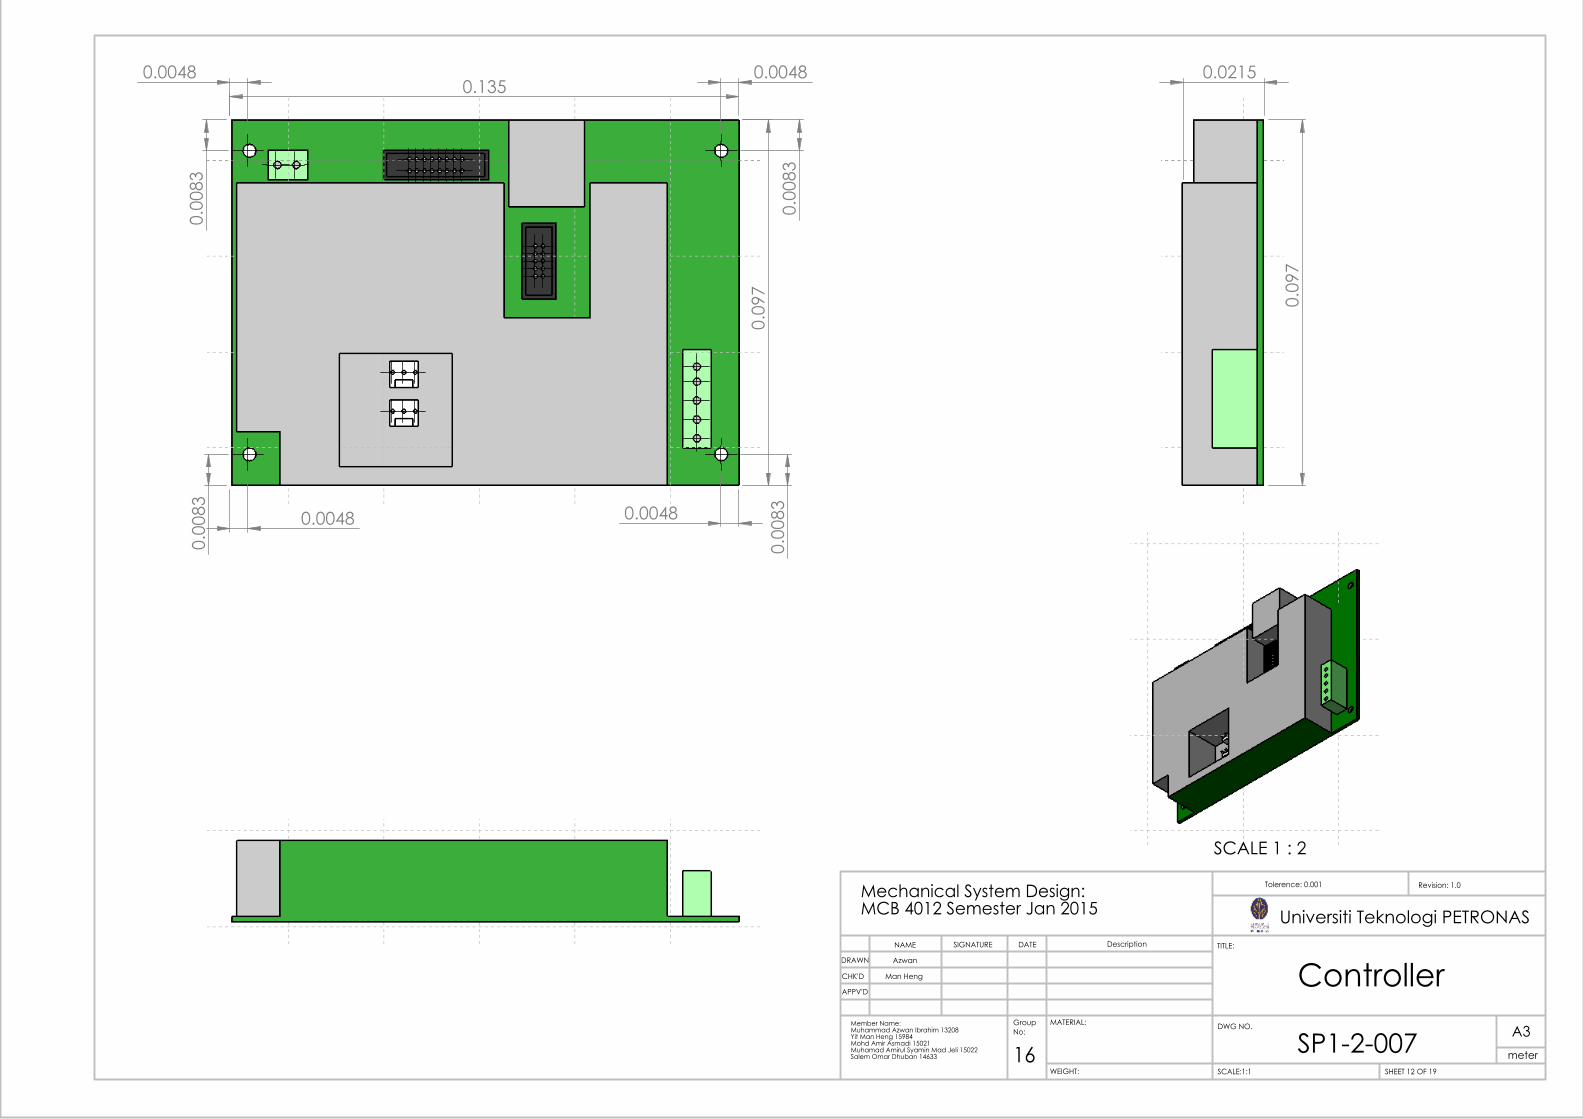
3 Controller SP1-2-007 1
4 Shaft Rod SP1-2-004 2
5 Power Window Motor SP1-2-003 1
Assembly DesignMan Heng
Azwan
WEIGHT:
A3
SHEET 7 OF 19SCALE: 1: 5
DWG NO.
TITLE:
Revision: 1.0Tolerence: 0.001
MATERIAL:
DATESIGNATURENAME Description
Group No:
16
Mechanical System Design: MCB 4012 Semester Jan 2015
Member Name: Muhammad Azwan Ibrahim 13208Yit Man Heng 15984Mohd Amir Asmadi 15021Muhamad Amirul Syamin Mad Jeli 15022Salem Omar Dhuban 14633
APPV'D
CHK'D
DSGN
Universiti Teknologi PETRONAS
meter
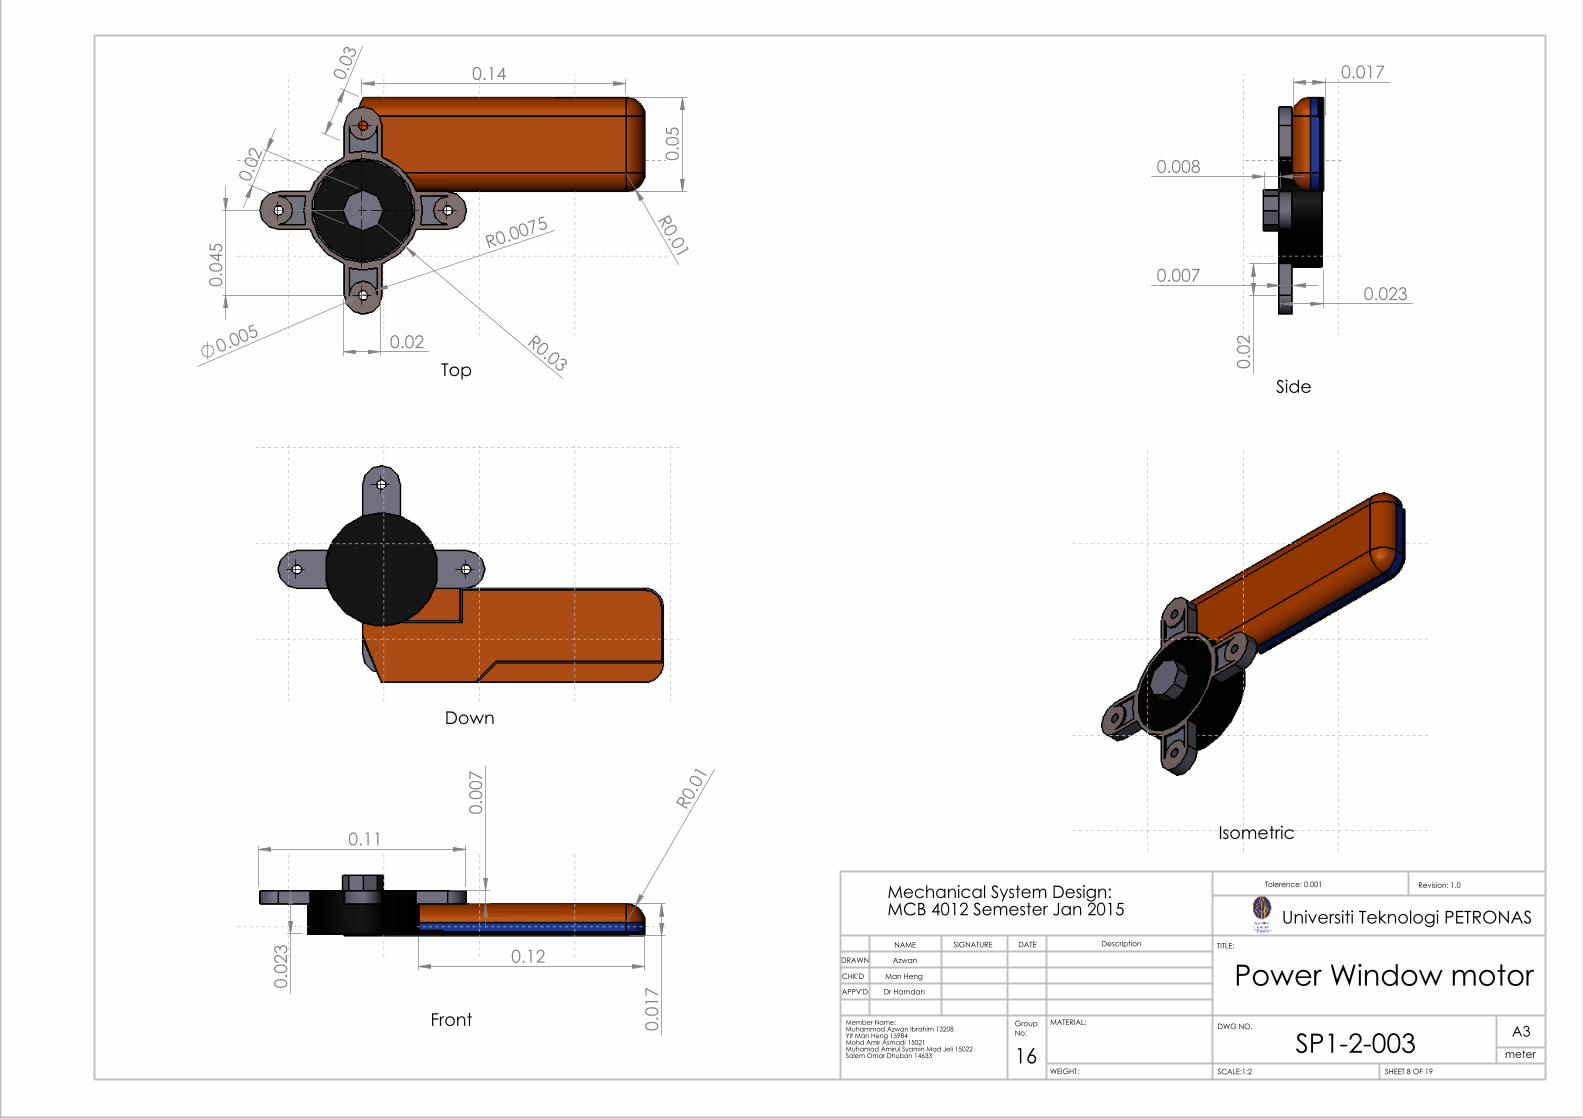
R0.03 0.02
0.005
0.14
0.0
5
R0.01
0.0
45 R0.0075
0.0
2
0.0
3 Top
0.12
0.0
17
R0.
01
0.0
07
0.11
0.0
23
Front
0.008
0.023 0.007
0.0
2
0.017
Side
Isometric
Down
SP1-2-003
Power Window motorDr Hamdan
Man Heng
Azwan
WEIGHT:
A3
SHEET 8 OF 19SCALE:1:2
DWG NO.
TITLE:
Revision: 1.0Tolerence: 0.001
MATERIAL:
DATESIGNATURENAME Description
Member Name: Muhammad Azwan Ibrahim 13208Yit Man Heng 15984Mohd Amir Asmadi 15021Muhamad Amirul Syamin Mad Jeli 15022Salem Omar Dhuban 14633
Mechanical System Design: MCB 4012 Semester Jan 2015
Group No:
16
APPV'D
CHK'D
DRAWN
Universiti Teknologi PETRONAS
meter
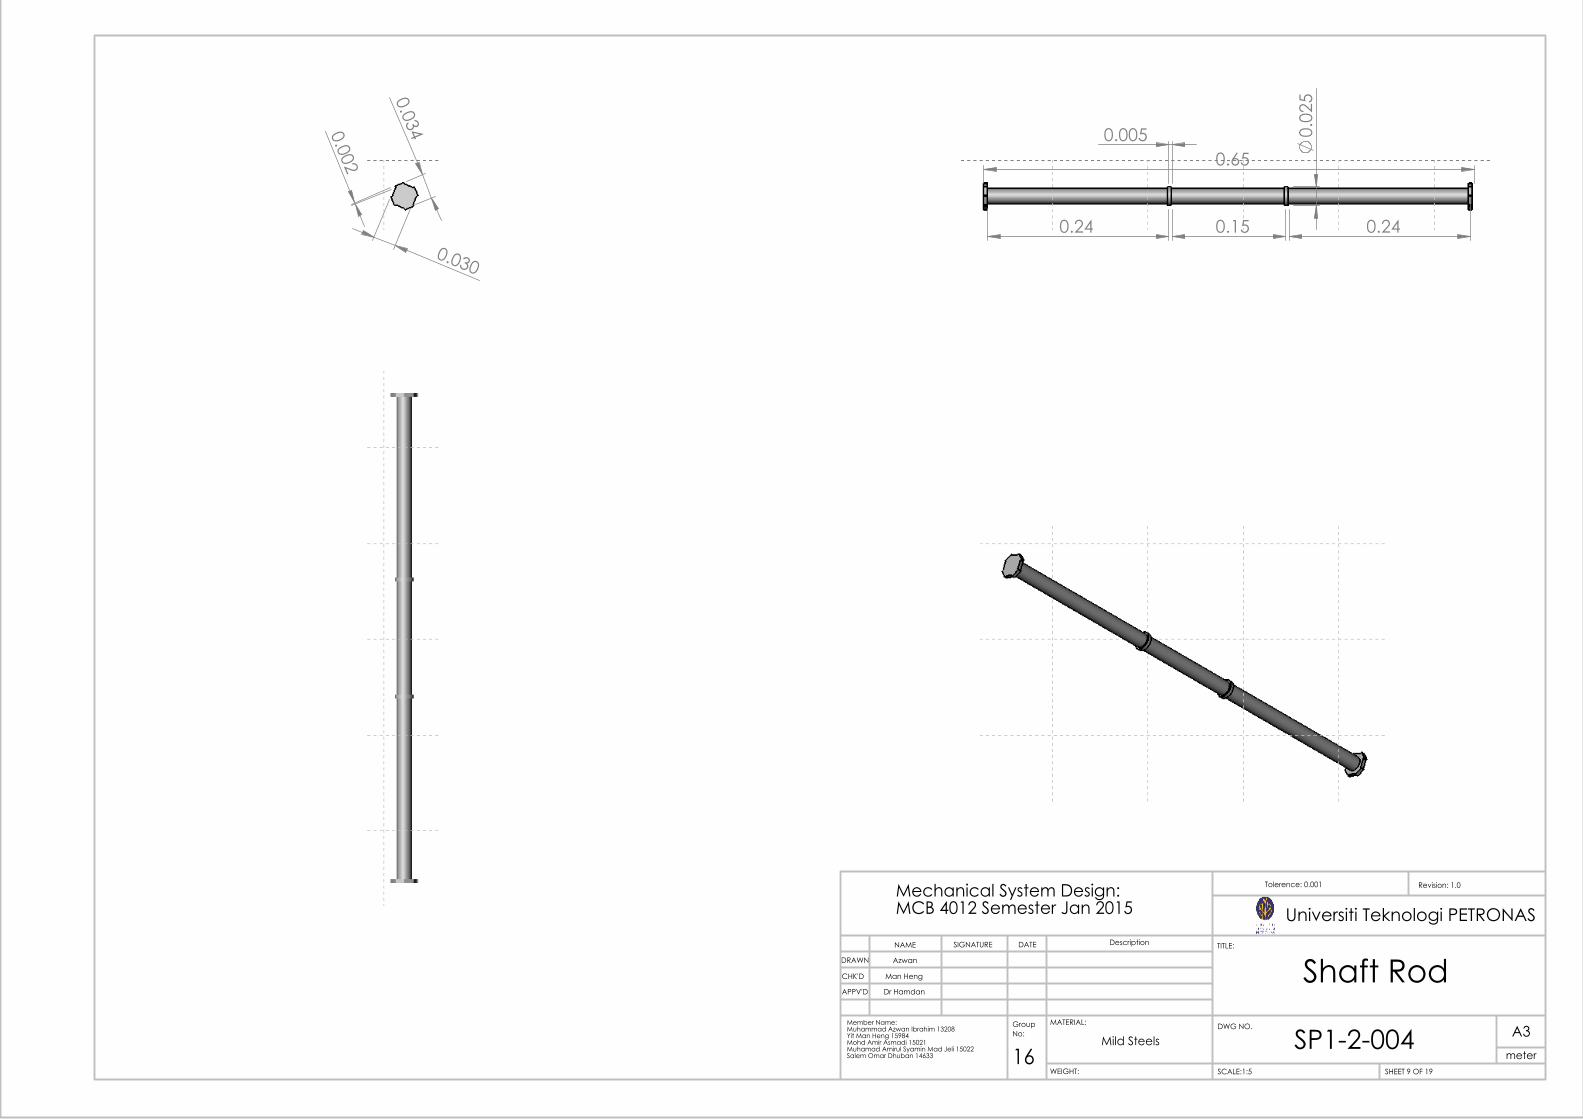
0.034 0.002
0.030
0.65 0.005
0.15 0.24 0.24
0.
025
SP1-2-004
Shaft RodDr Hamdan
Man Heng
Azwan
WEIGHT:
Mild SteelsA3
SHEET 9 OF 19SCALE:1:5
DWG NO.
TITLE:
Revision: 1.0Tolerence: 0.001
MATERIAL:
DATESIGNATURENAME Description
Group No:
16
Mechanical System Design: MCB 4012 Semester Jan 2015
Member Name: Muhammad Azwan Ibrahim 13208Yit Man Heng 15984Mohd Amir Asmadi 15021Muhamad Amirul Syamin Mad Jeli 15022Salem Omar Dhuban 14633
APPV'D
CHK'D
DRAWN
Universiti Teknologi PETRONAS
meter
0.0
4
0.01
0.05 0.0
6
0.1
8
0.15
0.1
5
0.0
3
0.02
Top
0.0
2
0.28 0.26
0.0
2 0
.15
0.06
0.1
8 0.0
6
0.12
Side
0.2
8
0.15 0.13
0.0
2
Front
Isometri
SP1-2-005
Solar Tracker HousingDr Hamdan
Man Heng
Azwan
WEIGHT:
Mild SteelsA3
SHEET 10 OF 19SCALE:1:5
DWG NO.
TITLE:
Revision: 1.0Tolerence : 0.001
MATERIAL:
DATESIGNATURENAME Description
Group No:
16
Mechanical System Design: MCB 4012 Semester Jan 2015
Member Name: Muhammad Azwan Ibrahim 13208Yit Man Heng 15984Mohd Amir Asmadi 15021Muhamad Amirul Syamin Mad Jeli 15022Salem Omar Dhuban 14633
APPV'D
CHK'D
DRAWN
Universiti Teknologi PETRONAS
meter

0.0
150
0.1865 0.154
0.0
15
0.0
02
0.005
0.0
07
0.0095
SP1-2-006
Solar Tracker CoverDr Hamdan
Man Heng
Azwan
WEIGHT:
Mild SteelsA3
SHEET 11 OF 19SCALE:1:2
DWG NO.
TITLE:
Revision: 1.0Tolerence: 0.001
MATERIAL:
DATESIGNATURENAME Description
Group No:
16
Mechanical System Design: MCB 4012 Semester Jan 2015
Member Name: Muhammad Azwan Ibrahim 13208Yit Man Heng 15984Mohd Amir Asmadi 15021Muhamad Amirul Syamin Mad Jeli 15022Salem Omar Dhuban 14633
APPV'D
CHK'D
DRAWN
Universiti Teknologi PETRONAS
meter
0.135
0.0
97
0.0048
0.0
083
0.0
083
0.0048
0.0
083 0.0048
0.0
083
0.0048
0.0215
0.0
97
SCALE 1 : 2
SP1-2-007
ControllerMan Heng
Azwan
WEIGHT:
A3
SHEET 12 OF 19SCALE:1:1
DWG NO.
TITLE:
Revision: 1.0Tolerence: 0.001
MATERIAL:
DATESIGNATURENAME Description
Group No:
16
Mechanical System Design: MCB 4012 Semester Jan 2015
Member Name: Muhammad Azwan Ibrahim 13208Yit Man Heng 15984Mohd Amir Asmadi 15021Muhamad Amirul Syamin Mad Jeli 15022Salem Omar Dhuban 14633 meter
APPV'D
CHK'D
DRAWN
Universiti Teknologi PETRONAS

0.46
0.1
8 R0.01
Top
0.76
0.1
8
Side
0.47
0.7
6
Front DC Charger andController Assembly
Man Heng
Azwan
WEIGHT:
A3
SHEET 13 OF 19SCALE:1: 5
DWG NO.
TITLE:
Revision: 1.0Tolerence: 0.001
MATERIAL:
DATESIGNATURENAME Description
Group No:
16
Mechanical System Design: MCB 4012 Semester Jan 2015
Member Name: Muhammad Azwan Ibrahim 13208Yit Man Heng 15984Mohd Amir Asmadi 15021Muhamad Amirul Syamin Mad Jeli 15022Salem Omar Dhuban 14633
APPV'D
CHK'D
DSGN
Universiti Teknologi PETRONAS
meterSP2-1-001
5
2
1
3
4
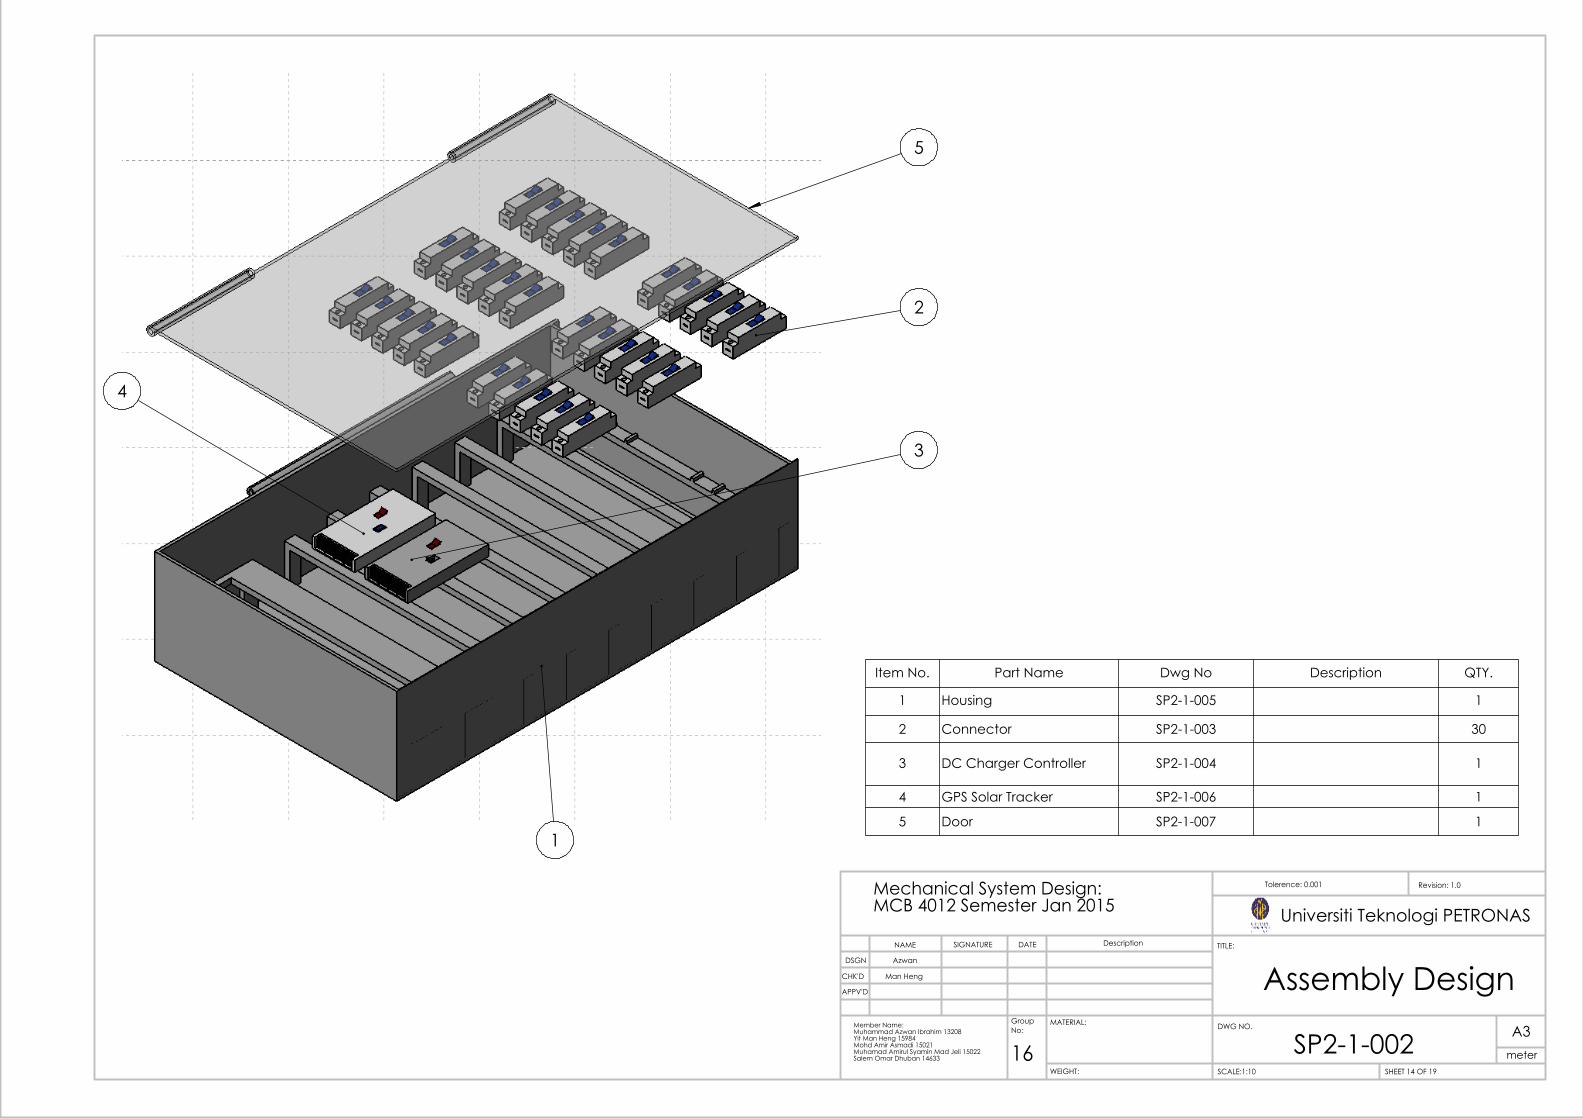
SP2-1-002
Item No. Part Name Dwg No Description QTY.
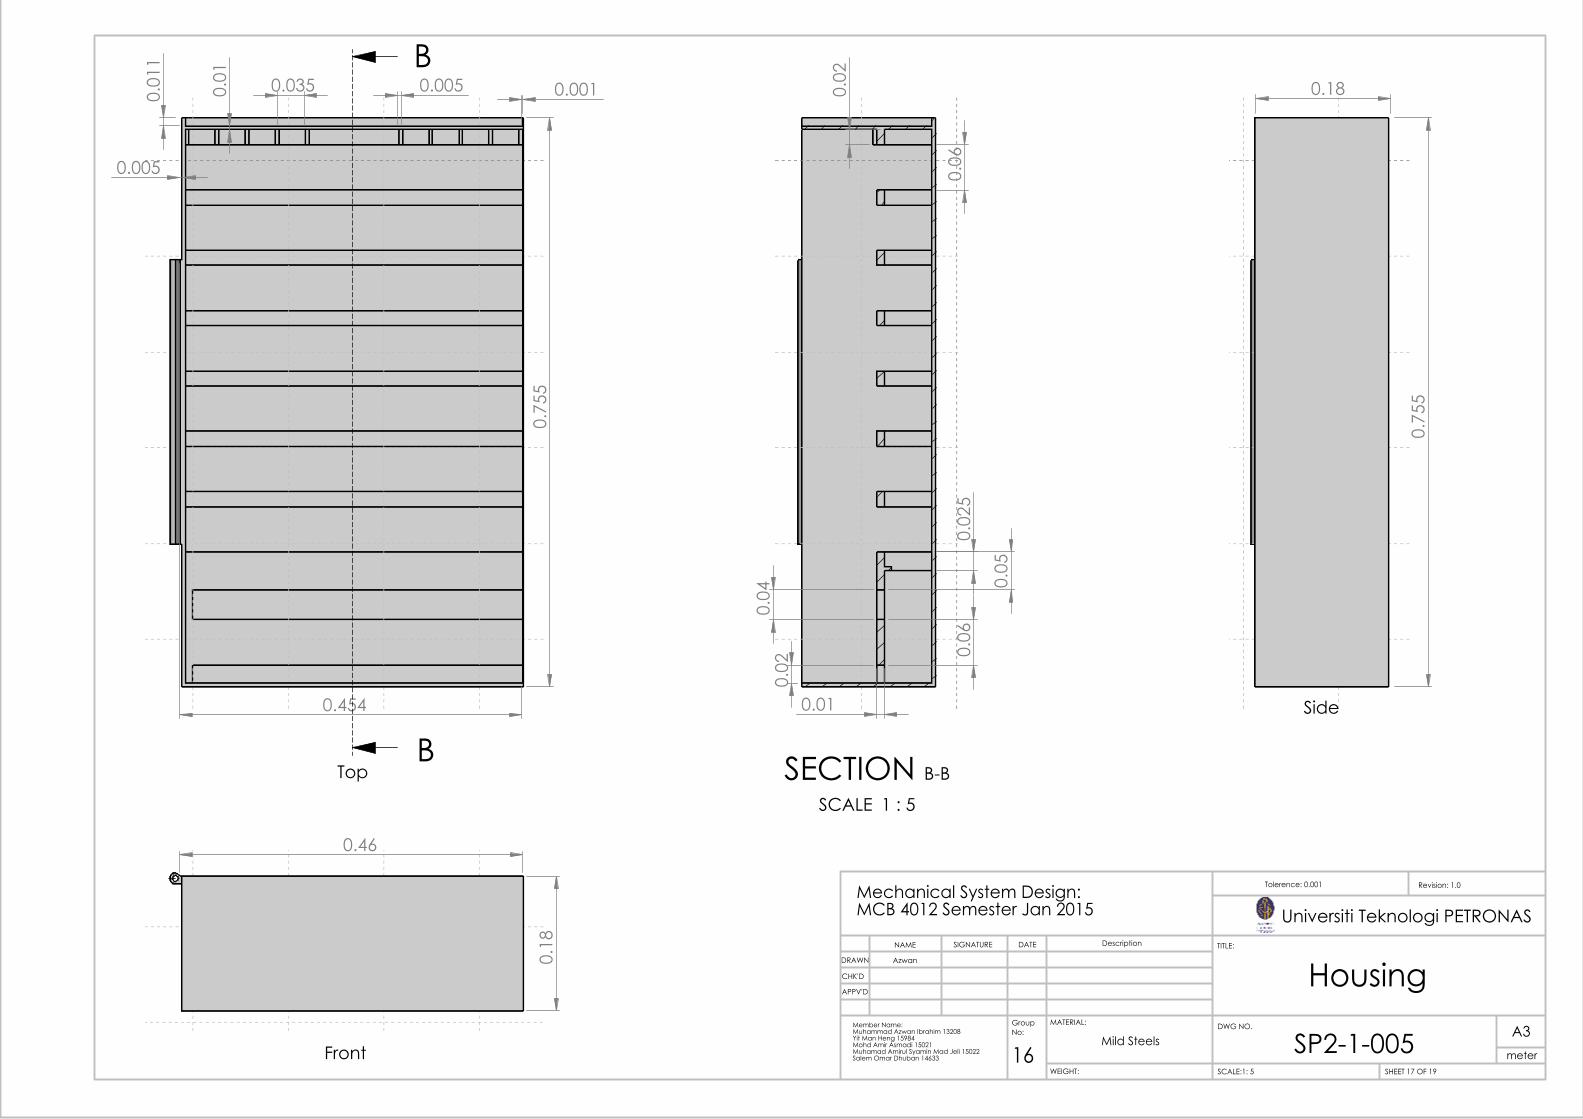
1 Housing SP2-1-005 1
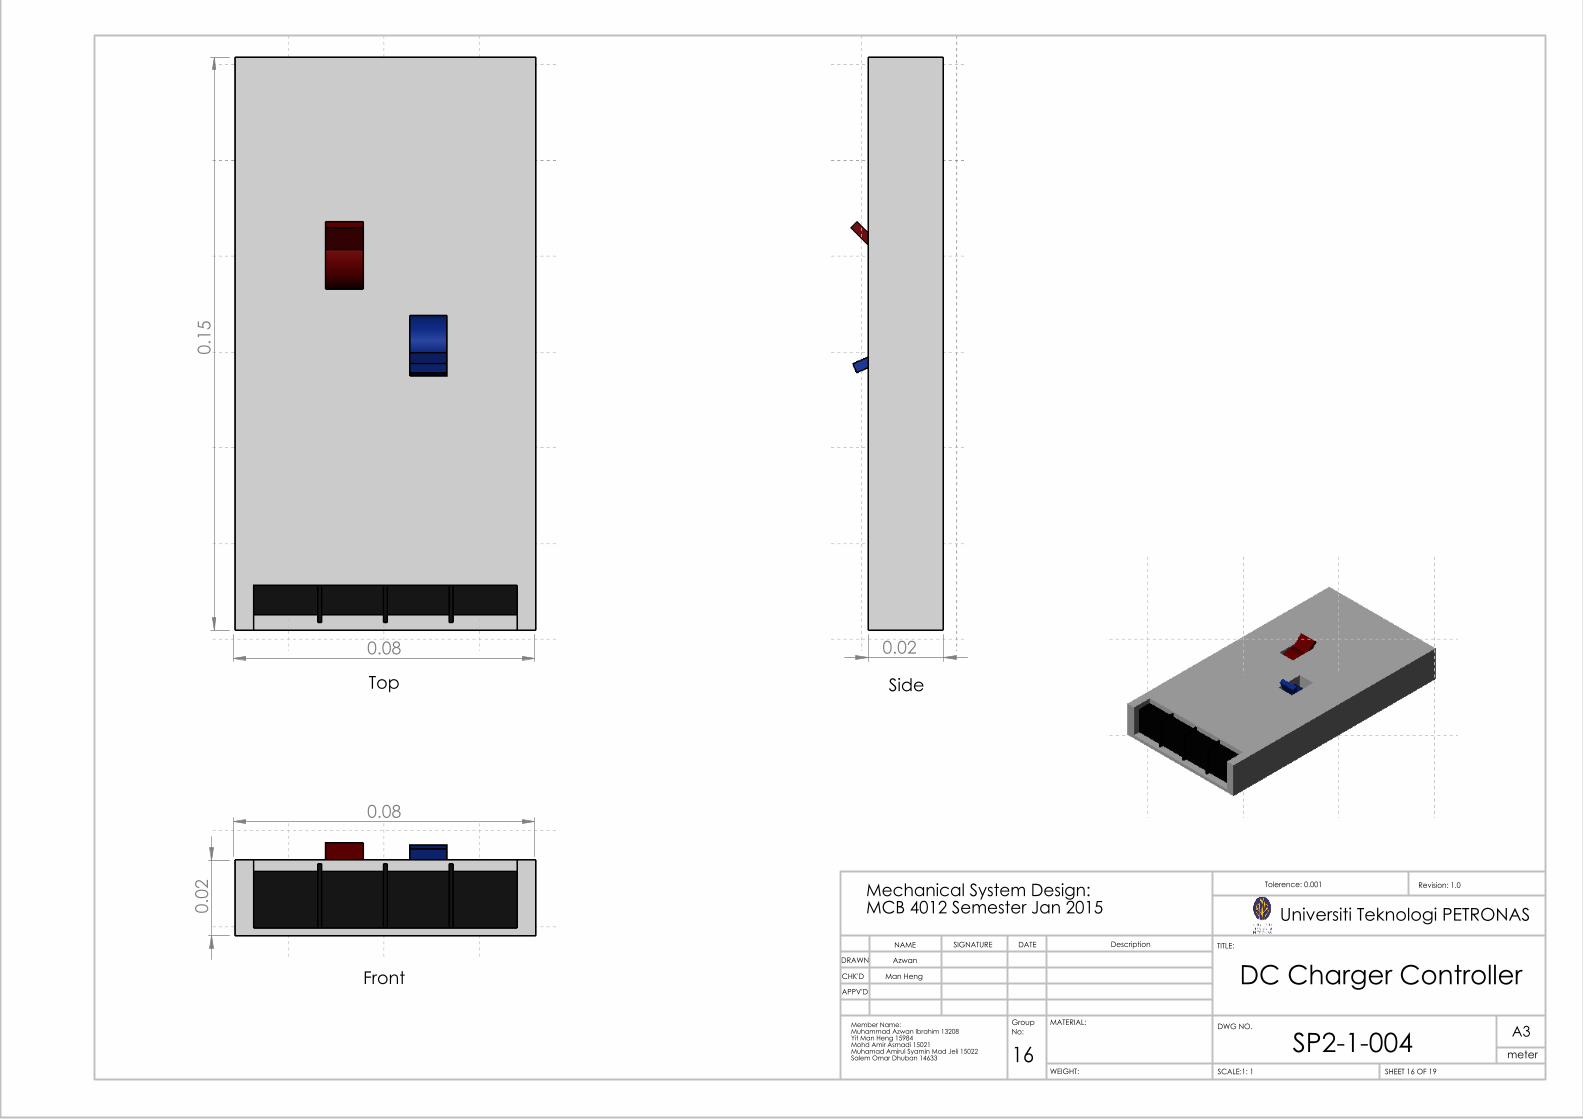
2 Connector SP2-1-003 30
3 DC Charger Controller SP2-1-004 1
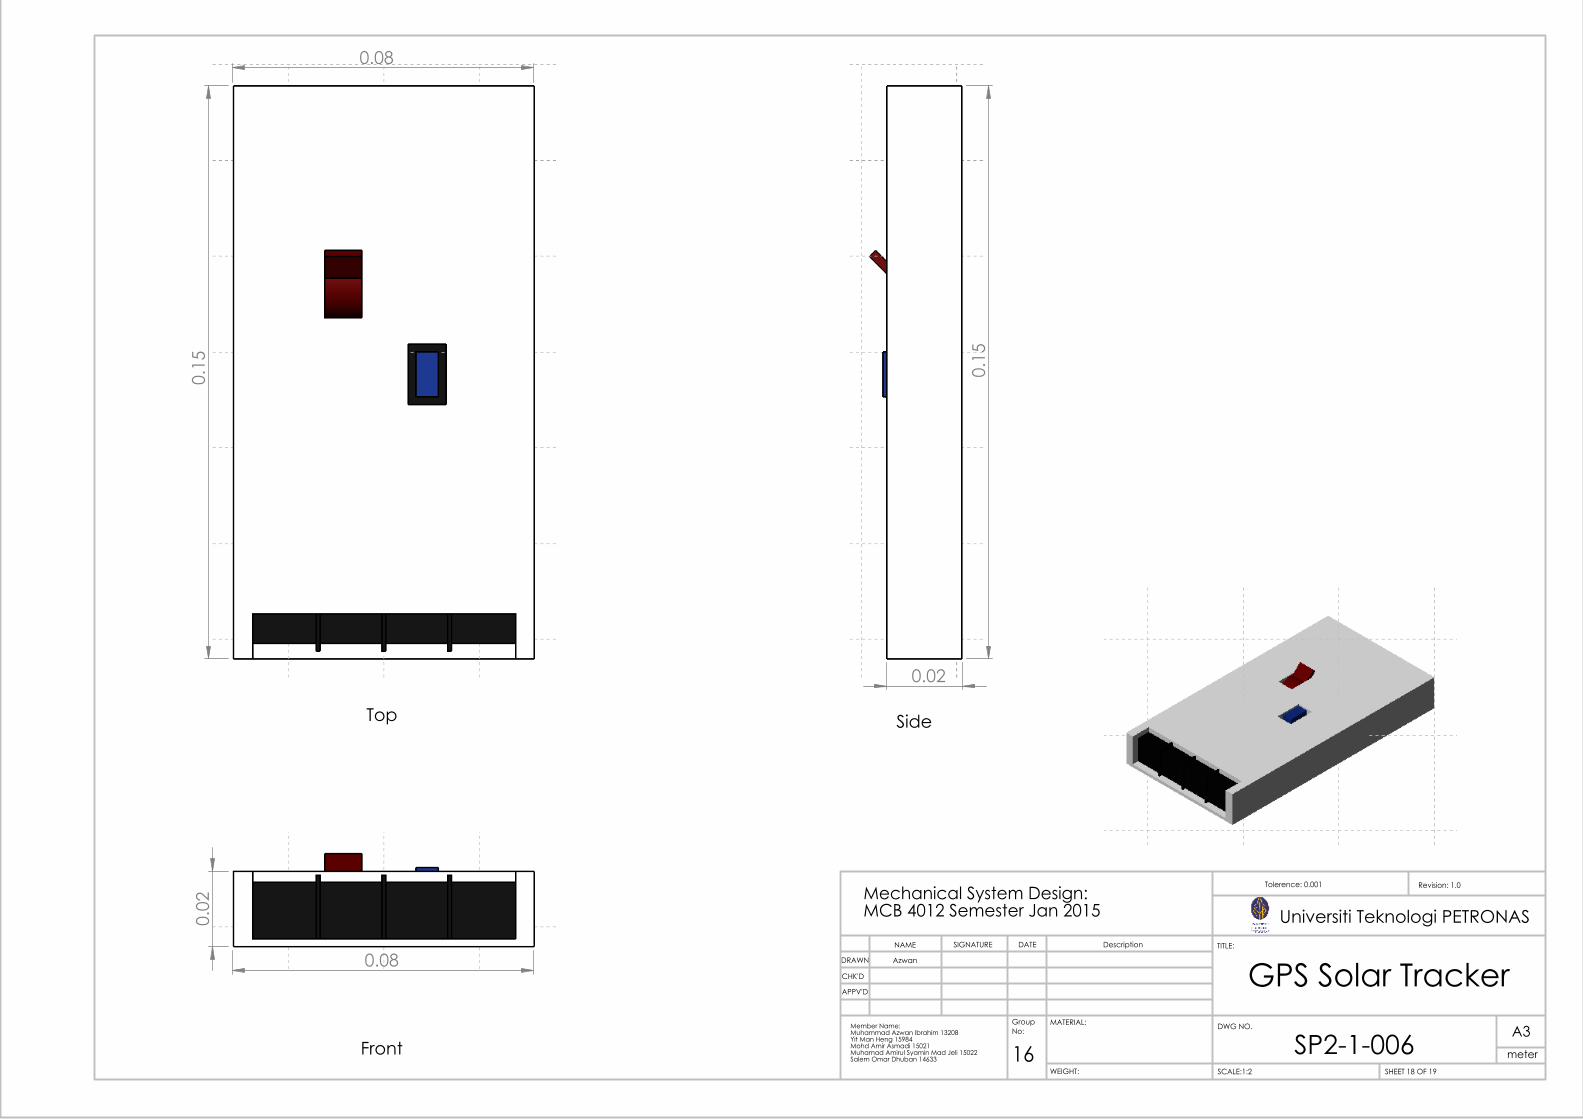
4 GPS Solar Tracker SP2-1-006 1
5 Door SP2-1-007 1
Assembly DesignMan Heng
Azwan
WEIGHT:
A3
SHEET 14 OF 19SCALE:1:10
DWG NO.
TITLE:
Revision: 1.0Tolerence: 0.001
MATERIAL:
DATESIGNATURENAME Description
Group No:
16
Mechanical System Design: MCB 4012 Semester Jan 2015
Member Name: Muhammad Azwan Ibrahim 13208Yit Man Heng 15984Mohd Amir Asmadi 15021Muhamad Amirul Syamin Mad Jeli 15022Salem Omar Dhuban 14633
APPV'D
CHK'D
DSGN
Universiti Teknologi PETRONAS
meter

0.10
0.0
2
0.0
1
0.
01
0.01 0
.01
0.08
0.02
Top
0.0
3
0.01
0.0
2
0.10 0.08
Front
0.02
0.0
3 0.0
1
0.008
0.0
02
Side
SP2-1-003
ConnectorMan Heng
Azwan
WEIGHT:
A3
SHEET 15 OF 19SCALE:1:1
DWG NO.
TITLE:
Revision: 1.0Tolerence: 0.001
MATERIAL:
DATESIGNATURENAME Description
Group No:
16
Mechanical System Design: MCB 4012 Semester Jan 2015
Member Name: Muhammad Azwan Ibrahim 13208Yit Man Heng 15984Mohd Amir Asmadi 15021Muhamad Amirul Syamin Mad Jeli 15022Salem Omar Dhuban 14633
APPV'D
CHK'D
DRAWN
Universiti Teknologi PETRONAS
meter
0.08
0.1
5
Top
0.0
2
0.08
Front
0.02
Side
SP2-1-004
DC Charger ControllerMan Heng
Azwan
WEIGHT:
A3
SHEET 16 OF 19SCALE:1: 1
DWG NO.
TITLE:
Revision: 1.0
MATERIAL:
DATESIGNATURENAME Description
Group No:
16
Mechanical System Design: MCB 4012 Semester Jan 2015
Member Name: Muhammad Azwan Ibrahim 13208Yit Man Heng 15984Mohd Amir Asmadi 15021Muhamad Amirul Syamin Mad Jeli 15022Salem Omar Dhuban 14633
APPV'D
CHK'D
DRAWN
Universiti Teknologi PETRONAS
meter
Tolerence: 0.001
0.454
0.7
55
0.0
11
0.005
0.001 0.0
1
0.035 0.005 B
BTop
0.46
0.1
8
Front
0.18
0.7
55
Side
0.0
6
0.0
2
0.0
25
0.0
4 0.0
5
0.01
0.0
6
0.0
2 SECTION B-B
SCALE 1 : 5
SP2-1-005
HousingAzwan
WEIGHT:
Mild SteelsA3
SHEET 17 OF 19SCALE:1: 5
DWG NO.
TITLE:
Revision: 1.0Tolerence: 0.001
MATERIAL:
DATESIGNATURENAME Description
Group No:
16
Mechanical System Design: MCB 4012 Semester Jan 2015
Member Name: Muhammad Azwan Ibrahim 13208Yit Man Heng 15984Mohd Amir Asmadi 15021Muhamad Amirul Syamin Mad Jeli 15022Salem Omar Dhuban 14633
APPV'D
CHK'D
DRAWN
Universiti Teknologi PETRONAS
meter
0.08
0.1
5
Top
0.0
2
0.08
Front
0.02
0.1
5
Side
SP2-1-006
GPS Solar TrackerAzwan
WEIGHT:
A3
SHEET 18 OF 19SCALE:1:2
DWG NO.
TITLE:
Revision: 1.0Tolerence: 0.001
MATERIAL:
DATESIGNATURENAME Description
Group No:
16
Mechanical System Design: MCB 4012 Semester Jan 2015
Member Name: Muhammad Azwan Ibrahim 13208Yit Man Heng 15984Mohd Amir Asmadi 15021Muhamad Amirul Syamin Mad Jeli 15022Salem Omar Dhuban 14633
APPV'D
CHK'D
DRAWN
Universiti Teknologi PETRONAS
meter

0.7
55
0.46
Top 0
.005
R0.007
5
0.008
Front
Side
SP2-1-007
DC Charger/Controller DoorAzwan
WEIGHT:
Mild SteelsA3
SHEET 19 OF 19SCALE:1: 5
DWG NO.
TITLE:
Revision: 1.0Tolerence: 0.001
MATERIAL:
DATESIGNATURENAME Description
Group No:
16Member Name: Muhammad Azwan Ibrahim 13208Yit Man Heng 15984Mohd Amir Asmadi 15021Muhamad Amirul Syamin Mad Jeli 15022Salem Omar Dhuban 14633
APPV'D
CHK'D
DRAWN
Mechanical System Design: MCB 4012 Semester Jan 2015
meter
Universiti Teknologi PETRONAS
1.7
0
5.10 8
8 5
10
TRUE R2.50
35.
06
TRUE R2.50
32
1
10
TRUE R2.55
4.1
2
Top View
Front View
Side View
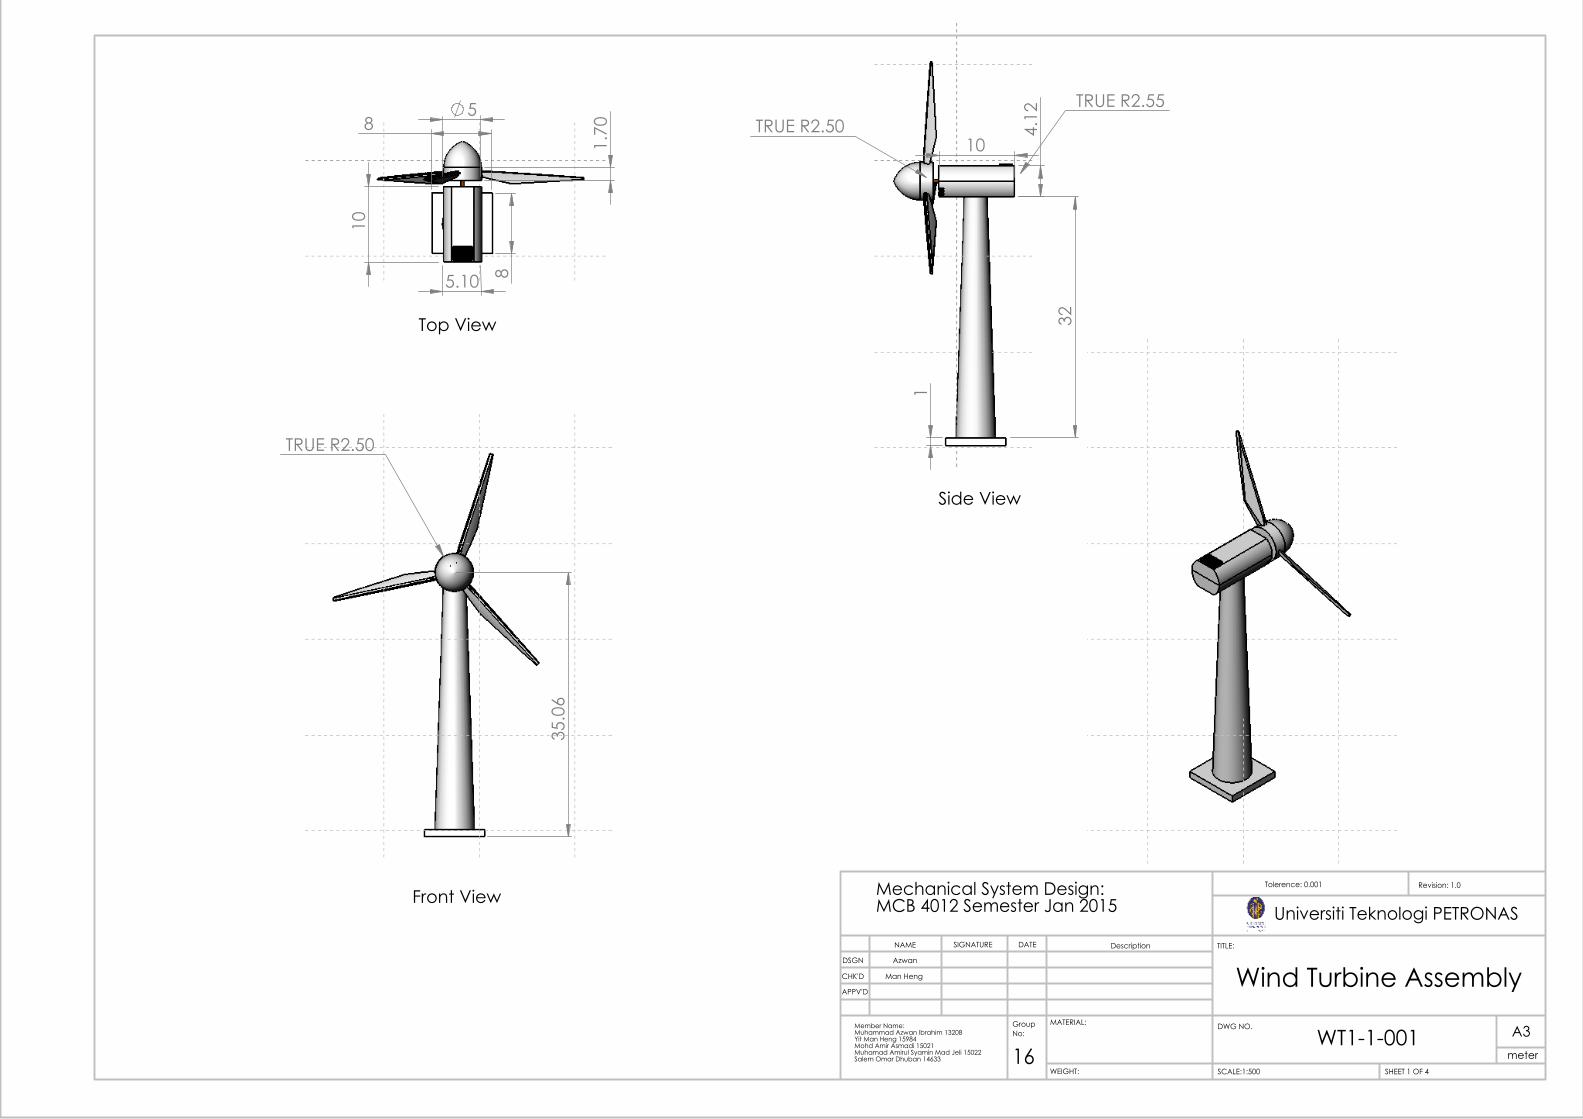
Wind Turbine Assembly
Universiti Teknologi PETRONAS
Man Heng
Azwan
WEIGHT:
A3
SHEET 1 OF 4SCALE:1:500
DWG NO.
TITLE:
Revision: 1.0Tolerence: 0.001
MATERIAL:
DATESIGNATURENAME Description
Group No:
16
Mechanical System Design: MCB 4012 Semester Jan 2015
Member Name: Muhammad Azwan Ibrahim 13208Yit Man Heng 15984Mohd Amir Asmadi 15021Muhamad Amirul Syamin Mad Jeli 15022Salem Omar Dhuban 14633
APPV'D
CHK'D
DSGN
meterWT1-1-001

Extrude View
7
5
6
4
2
1
3
Item No. Part Name Drw Number Description Qty.
1 Bottom Cover 1
2 Tower 1
3 Generator 2
4 Blade Holder 1
5 Blade 3
6 Front cover 1
7 Top Cover 1
Wind Turbine Assembly
Universiti Teknologi PETRONAS
Man Heng
Azwan
WEIGHT:
A3
SHEET 2 OF 4SCALE:1: 200
DWG NO.
TITLE:
Revision: 1.0Tolerence: 0.001
MATERIAL:
DATESIGNATURENAME Description
Group No:
16
Mechanical System Design: MCB 4012 Semester Jan 2015
Member Name: Muhammad Azwan Ibrahim 13208Yit Man Heng 15984Mohd Amir Asmadi 15021Muhamad Amirul Syamin Mad Jeli 15022Salem Omar Dhuban 14633
APPV'D
CHK'D
DSGN
WT1-1-002meter

3
2
1
Item No. Part Name Drw Number Description Qty.
1 Blade Holder 1
2 Blade 3
3 Front cover 1
Wind Blade Assembly
Universiti Teknologi PETRONAS
Man Heng
Azwan
WEIGHT:
A3
SHEET 3 OF 4SCALE:1: 200
DWG NO.
TITLE:
Revision: 1.0Tolerence: 0.001
MATERIAL:
DATESIGNATURENAME Description
Group No:
16
Mechanical System Design: MCB 4012 Semester Jan 2015
Member Name: Muhammad Azwan Ibrahim 13208Yit Man Heng 15984Mohd Amir Asmadi 15021Muhamad Amirul Syamin Mad Jeli 15022Salem Omar Dhuban 14633
APPV'D
CHK'D
DSGN
WT2-1-001meter
5
4
1
2
3
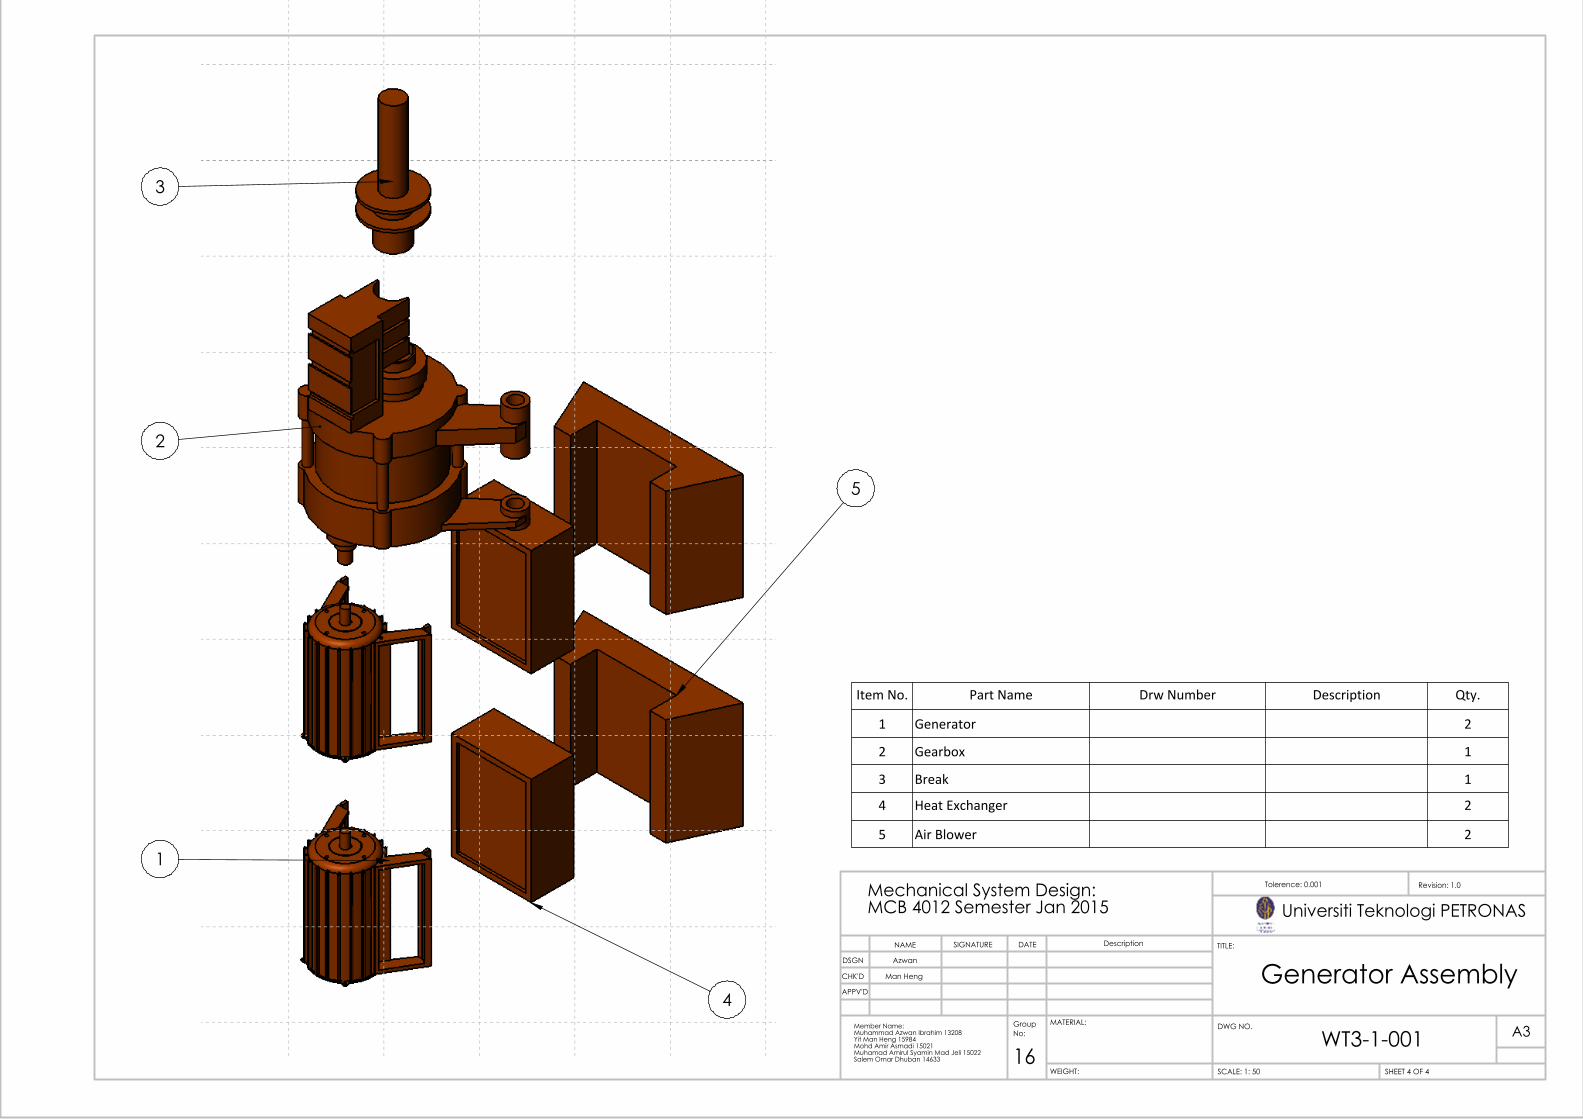
Item No. Part Name Drw Number Description Qty.
1 Generator 2
2 Gearbox 1
3 Break 1
4 Heat Exchanger 2
5 Air Blower 2
Generator Assembly
Universiti Teknologi PETRONAS
Man Heng
Azwan
WEIGHT:
A3
SHEET 4 OF 4SCALE: 1: 50
DWG NO.
TITLE:
Revision: 1.0Tolerence: 0.001
MATERIAL:
DATESIGNATURENAME Description
Group No:
16
Mechanical System Design: MCB 4012 Semester Jan 2015
Member Name: Muhammad Azwan Ibrahim 13208Yit Man Heng 15984Mohd Amir Asmadi 15021Muhamad Amirul Syamin Mad Jeli 15022Salem Omar Dhuban 14633
APPV'D
CHK'D
DSGN
WT3-1-001

1.6
0
1.24
0.40
13.
96
Top View
Side View
Front View
Isometric View
Blade
Universiti Teknologi PETRONAS
Azwan
Man Heng
WEIGHT:
Glass fibre + Honeycomb Kevlar Composite
A3
SHEET 1 OF 11SCALE:1:100
DWG NO.
TITLE:
Revision: 1.0Tolerence: 0.001
MATERIAL:
DATESIGNATURENAME Description
Group No:
16
Mechanical System Design: MCB 4012 Semester Jan 2015
Member Name: Muhammad Azwan Ibrahim 13208Yit Man Heng 15984Mohd Amir Asmadi 15021Muhamad Amirul Syamin Mad Jeli 15022Salem Omar Dhuban 14633
APPV'D
CHK'D
DRAWN
meterWT2-1-002
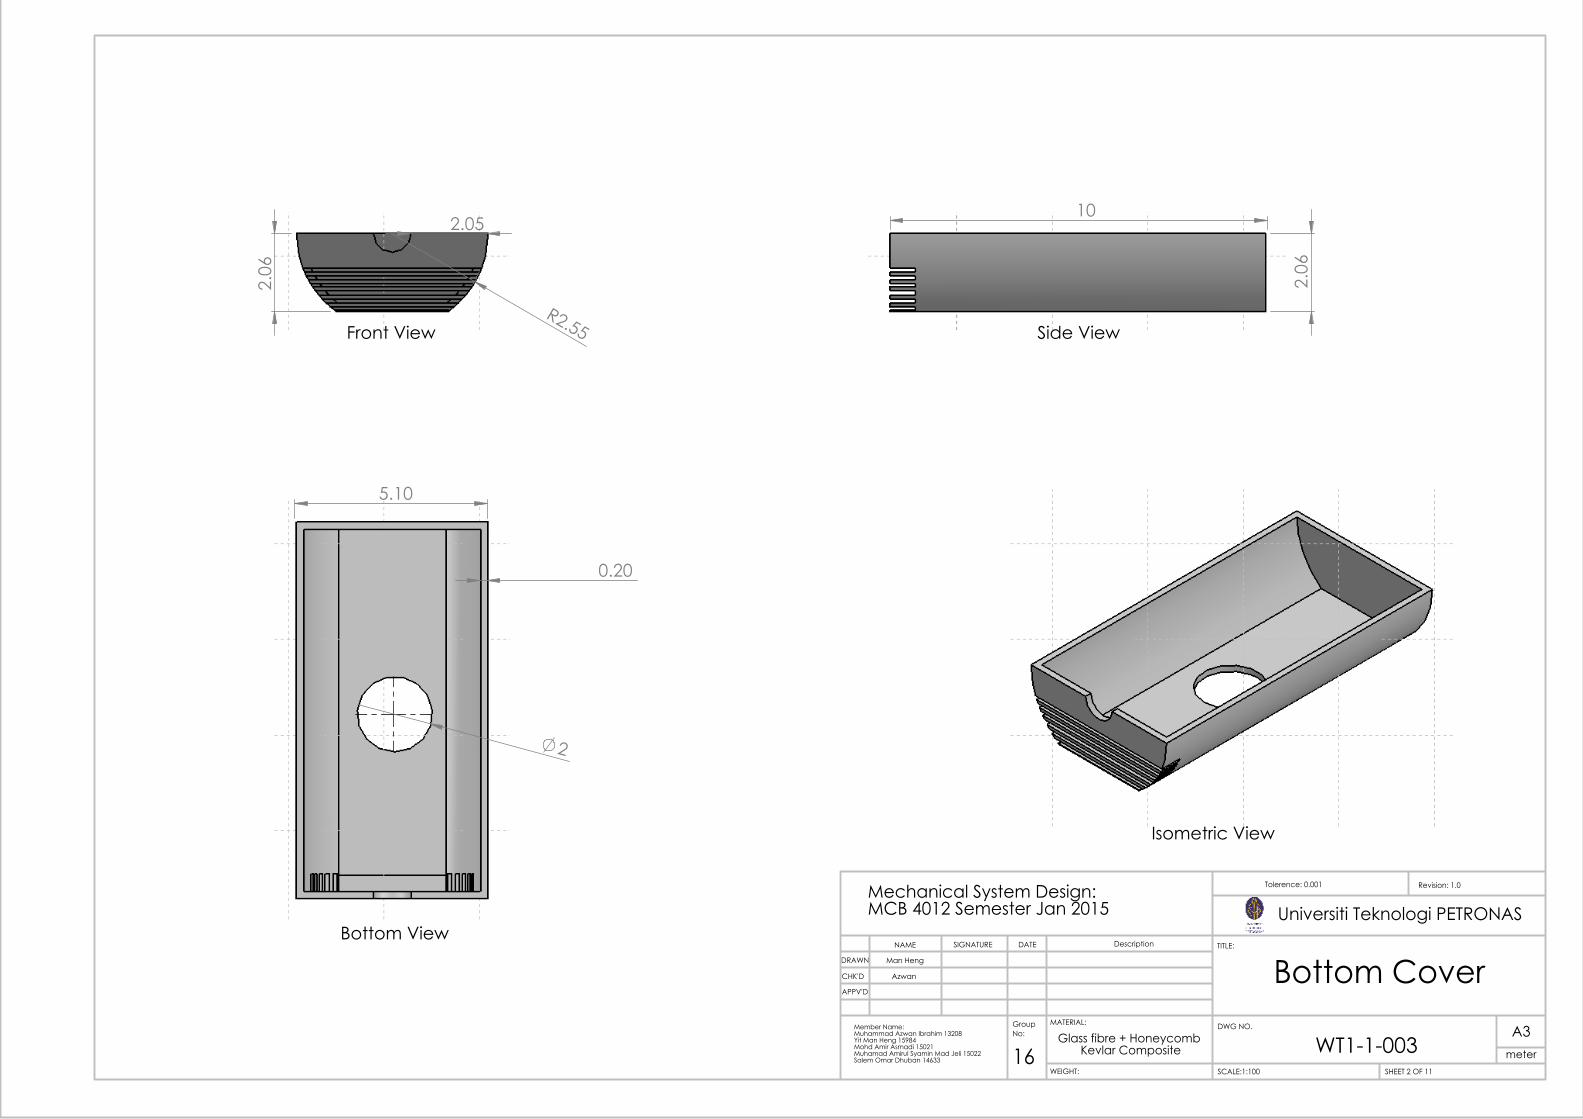
R2.55
2.0
6
2.05
Front View
0.20
2
5.10
Bottom View
2.0
6
10
Side View
Isometric View
Bottom Cover
Universiti Teknologi PETRONAS
Azwan
Man Heng
WEIGHT:
Glass fibre + Honeycomb Kevlar Composite
A3
SHEET 2 OF 11SCALE:1:100
DWG NO.
TITLE:
Revision: 1.0Tolerence: 0.001
MATERIAL:
DATESIGNATURENAME Description
Group No:
16
Mechanical System Design: MCB 4012 Semester Jan 2015
Member Name: Muhammad Azwan Ibrahim 13208Yit Man Heng 15984Mohd Amir Asmadi 15021Muhamad Amirul Syamin Mad Jeli 15022Salem Omar Dhuban 14633
APPV'D
CHK'D
DRAWN
WT1-1-003 meter
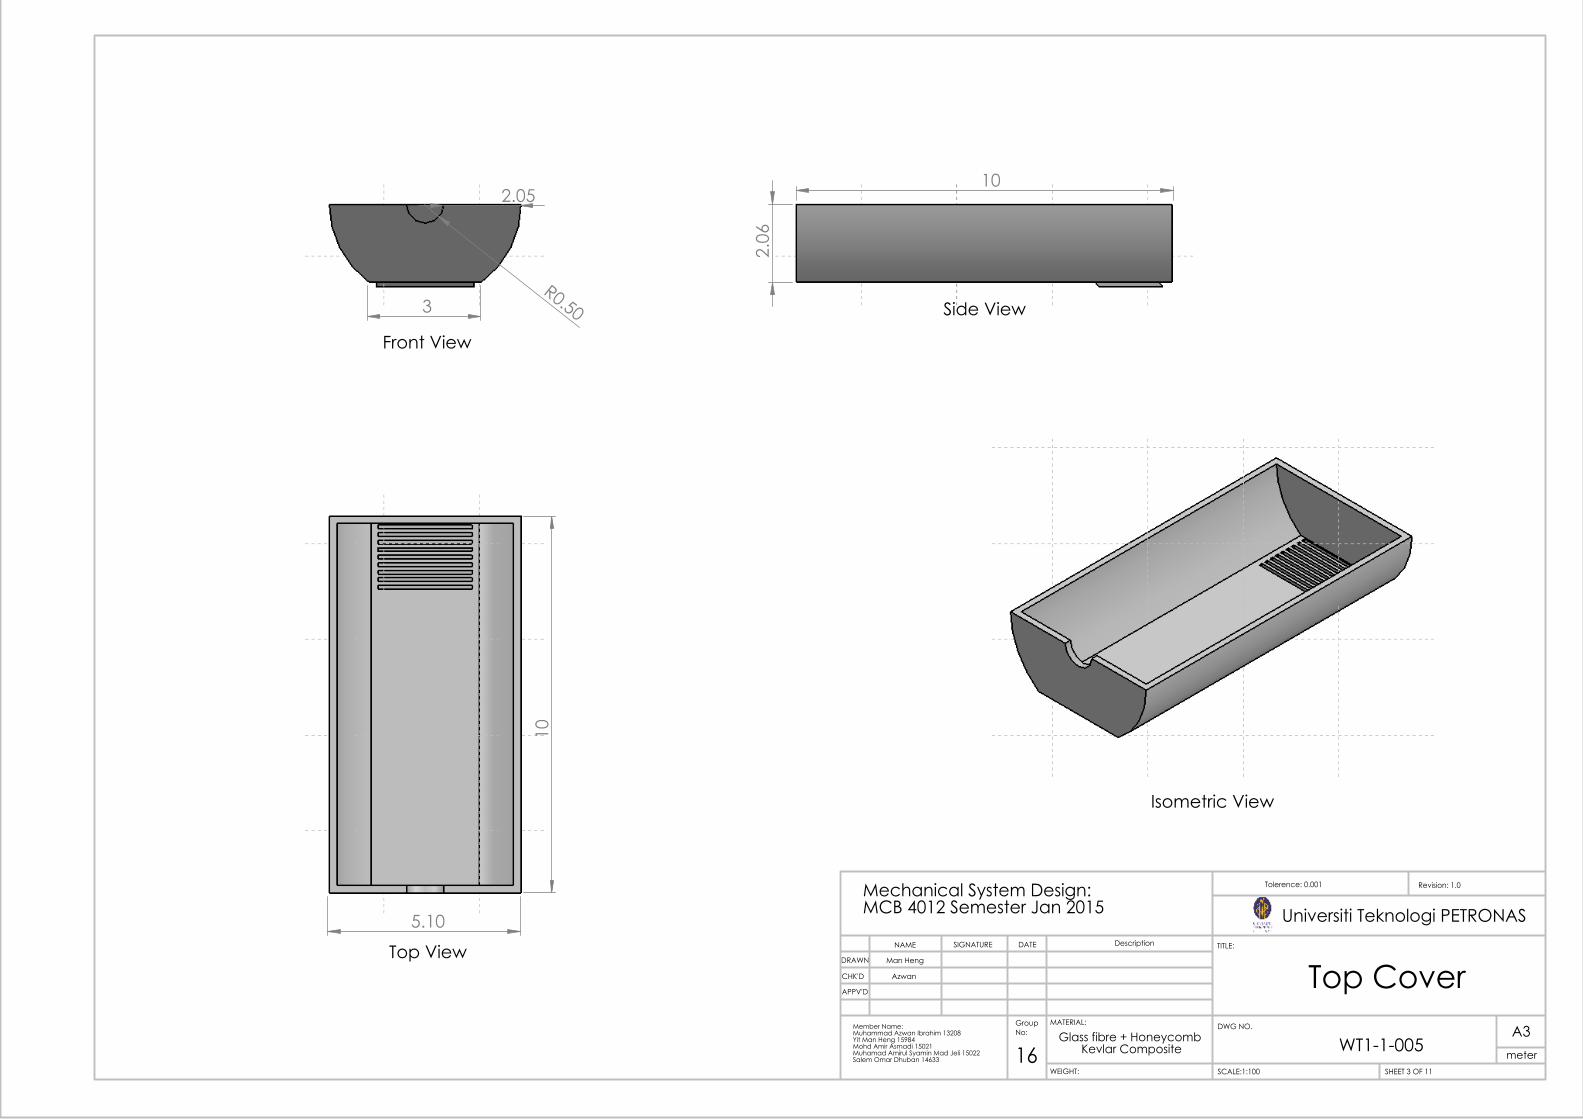
R0.50
2.05
3
Front View
5.10
10
Top View
2.0
6
10
Side View
Isometric View
Top Cover
Universiti Teknologi PETRONAS
Group No:
16
Azwan
Man Heng
WEIGHT:
Glass fibre + Honeycomb Kevlar Composite
A3
SHEET 3 OF 11SCALE:1:100
DWG NO.
TITLE:
Revision: 1.0Tolerence: 0.001
MATERIAL:
DATESIGNATURENAME Description
Mechanical System Design: MCB 4012 Semester Jan 2015
Member Name: Muhammad Azwan Ibrahim 13208Yit Man Heng 15984Mohd Amir Asmadi 15021Muhamad Amirul Syamin Mad Jeli 15022Salem Omar Dhuban 14633
APPV'D
CHK'D
DRAWN
WT1-1-005meter
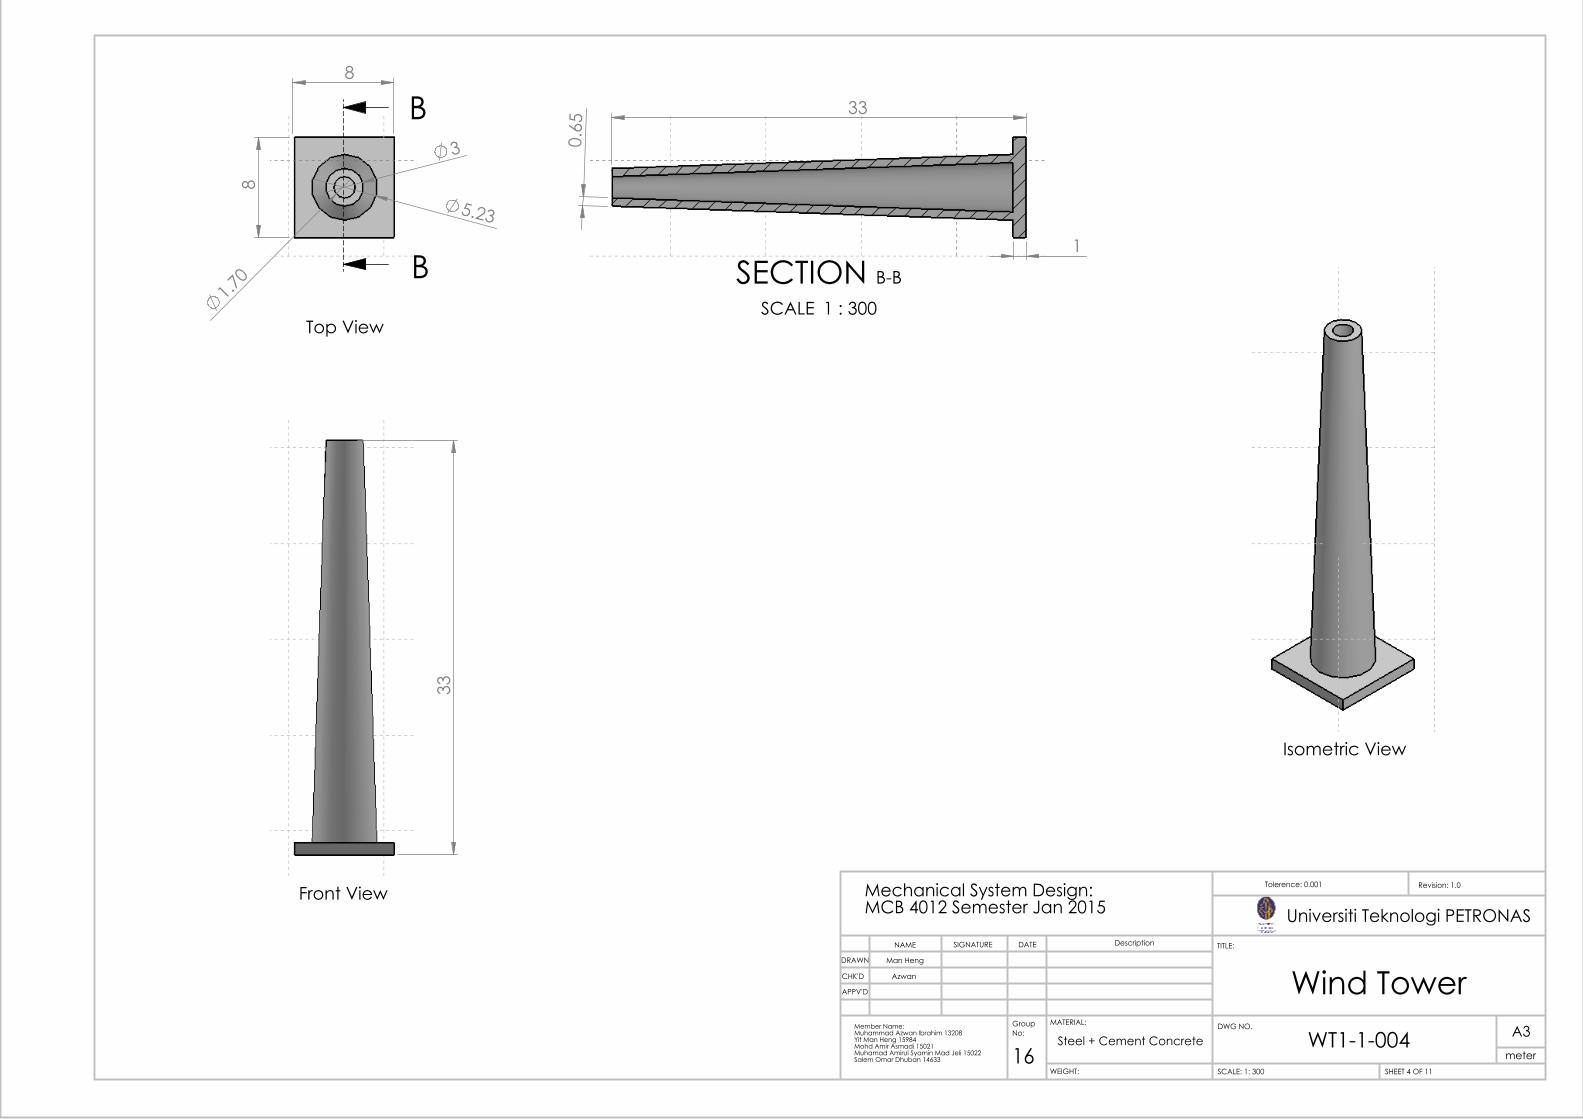
33
Front View
8
8
5.23
3
1.7
0
B
B
Top View
Isometric View
33
1
0.6
5
SECTION B-B
SCALE 1 : 300
Wind Tower
Universiti Teknologi PETRONAS
Group No:
16
Azwan
Man Heng
WEIGHT:
Steel + Cement ConcreteA3
SHEET 4 OF 11SCALE: 1: 300
DWG NO.
TITLE:
Revision: 1.0Tolerence: 0.001
MATERIAL:
DATESIGNATURENAME Description
Mechanical System Design: MCB 4012 Semester Jan 2015
Member Name: Muhammad Azwan Ibrahim 13208Yit Man Heng 15984Mohd Amir Asmadi 15021Muhamad Amirul Syamin Mad Jeli 15022Salem Omar Dhuban 14633
APPV'D
CHK'D
DRAWN
meterWT1-1-004
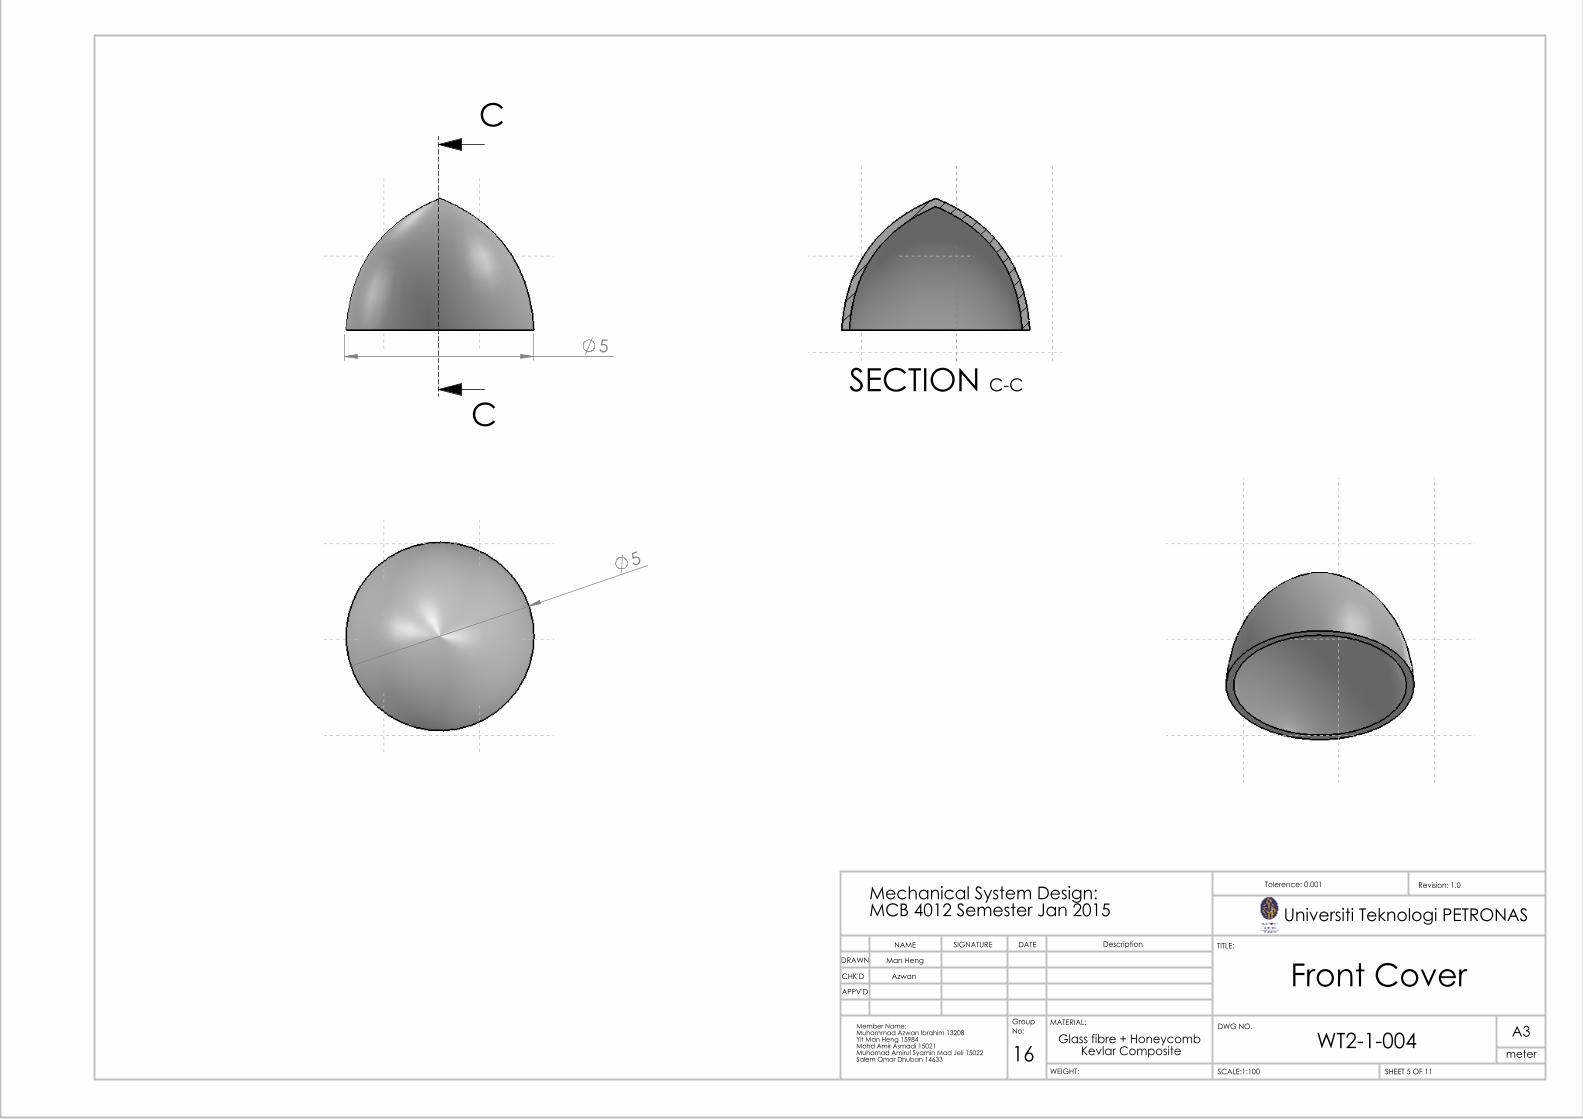
5
C
C
5
SECTION C-C
Front Cover
WT2-1-004
Universiti Teknologi PETRONAS
Azwan
Man Heng
WEIGHT:
Glass fibre + Honeycomb Kevlar Composite
A3
SHEET 5 OF 11SCALE:1:100
DWG NO.
TITLE:
Revision: 1.0Tolerence: 0.001
MATERIAL:
DATESIGNATURENAME Description
Group No:
16
Mechanical System Design: MCB 4012 Semester Jan 2015
Member Name: Muhammad Azwan Ibrahim 13208Yit Man Heng 15984Mohd Amir Asmadi 15021Muhamad Amirul Syamin Mad Jeli 15022Salem Omar Dhuban 14633
APPV'D
CHK'D
DRAWN
meter
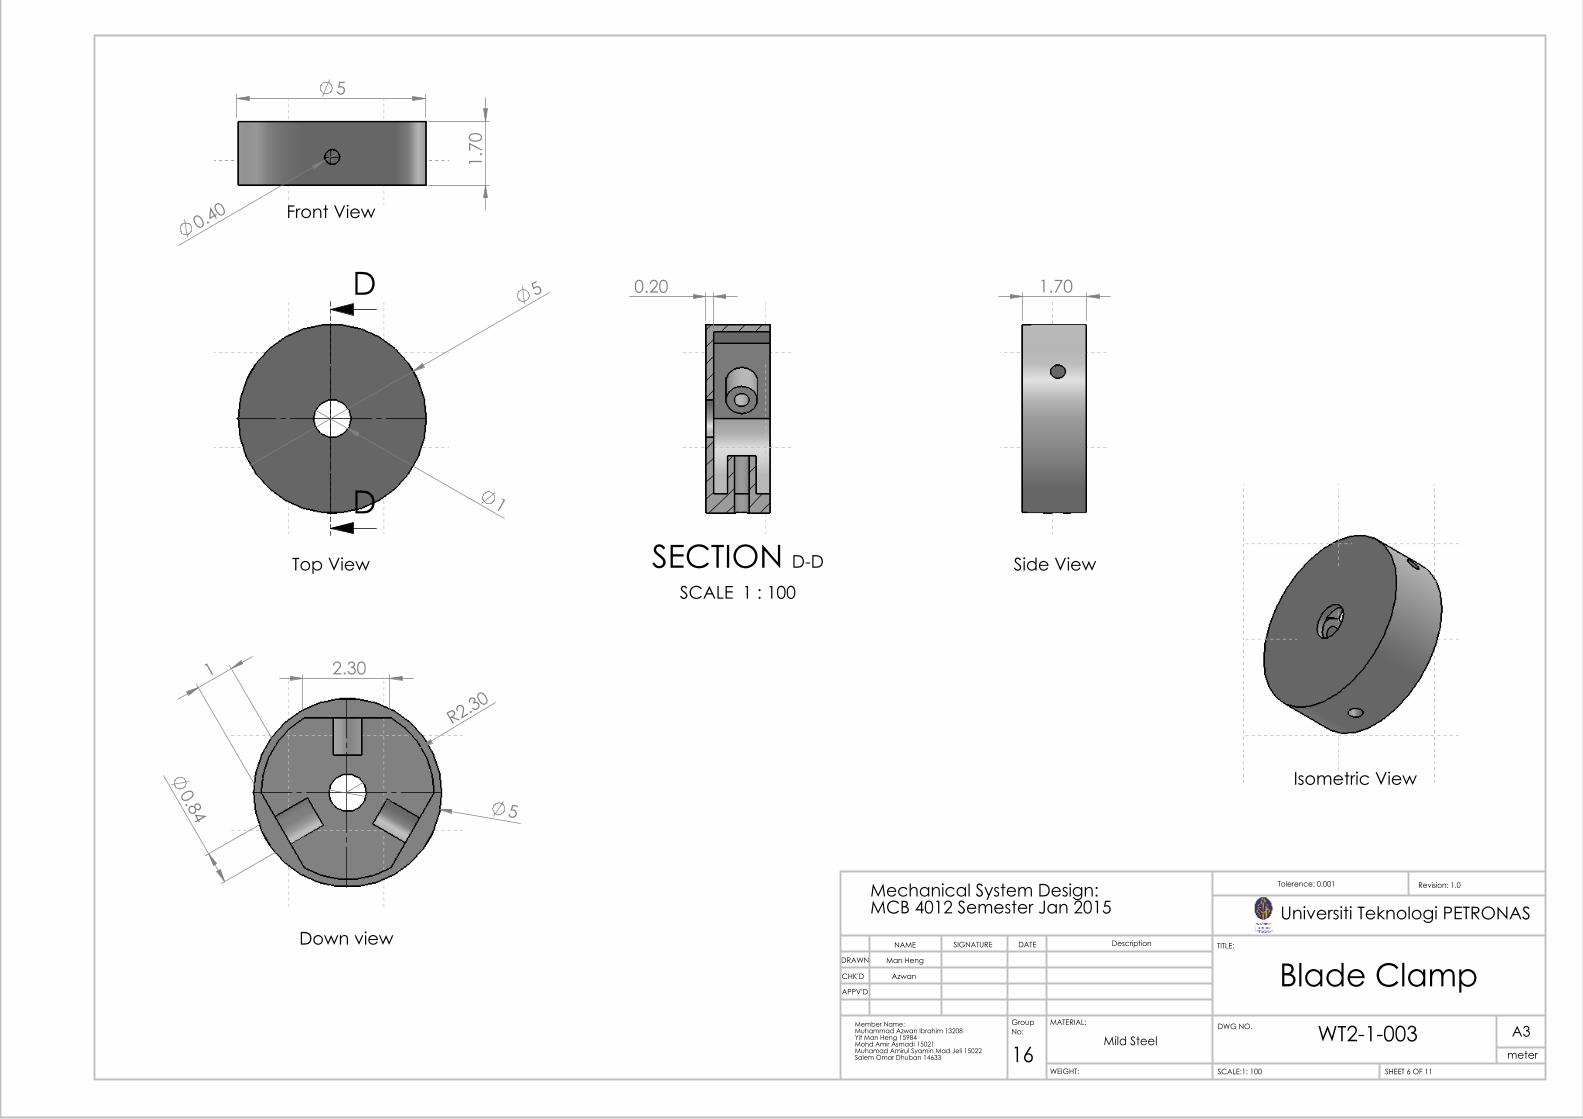
5
1
D
D
Top View
1.7
0
5
0.40 Front View
1.70
Side View
Isometric View
0.20
SECTION D-D
SCALE 1 : 100
2.30
R2.30
5
0.84
1
Down view
Blade Clamp
WT2-1-003
Azwan
Man Heng
WEIGHT:
Mild SteelA3
SHEET 6 OF 11SCALE:1: 100
DWG NO.
TITLE:
Revision: 1.0Tolerence: 0.001
MATERIAL:
DATESIGNATURENAME Description
Group No:
16
Mechanical System Design: MCB 4012 Semester Jan 2015
Member Name: Muhammad Azwan Ibrahim 13208Yit Man Heng 15984Mohd Amir Asmadi 15021Muhamad Amirul Syamin Mad Jeli 15022Salem Omar Dhuban 14633
APPV'D
CHK'D
DRAWN
meter
Universiti Teknologi PETRONAS
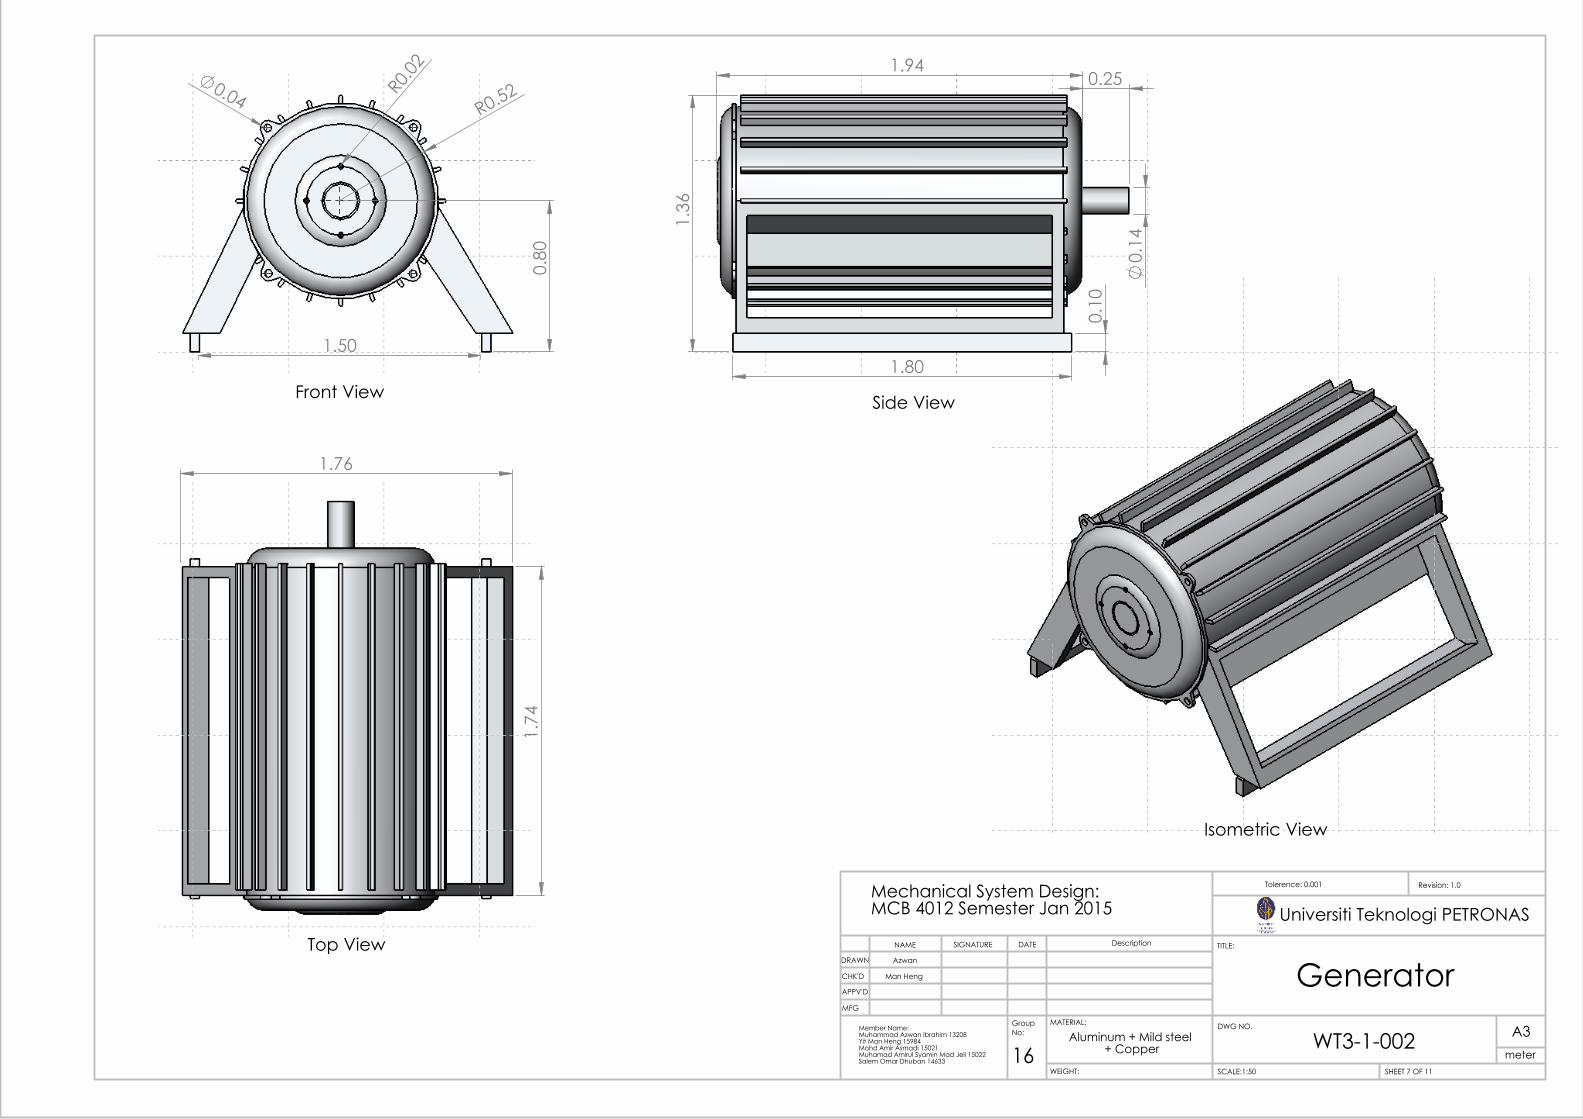
1.76
1.7
4
Top View
R0.52
1.50
0.8
0
0.04 R0
.02
Front View
Isometric View
1.3
6
1.94
0.
14
0.25
0.1
0
1.80
Side View
GeneratorMan Heng
Azwan
WEIGHT:
Aluminum + Mild steel + Copper
A3
SHEET 7 OF 11SCALE:1:50
DWG NO.
TITLE:
Revision: 1.0Tolerence: 0.001
MATERIAL:
DATESIGNATURENAME Description
Group No:
16
Mechanical System Design: MCB 4012 Semester Jan 2015
Member Name: Muhammad Azwan Ibrahim 13208Yit Man Heng 15984Mohd Amir Asmadi 15021Muhamad Amirul Syamin Mad Jeli 15022Salem Omar Dhuban 14633
MFG
APPV'D
CHK'D
DRAWN
Universiti Teknologi PETRONAS
meterWT3-1-002

R1.05
0.6
0
0.80
R0.28
0.90
0.
40
0.25 3
Front View
0.60 1.80
0.61
0.25 1.55
0.6
0 1.2
0
0.55
Side View
0.40
0.40
0.3
0 0
.82
2.10
2
0.6
1
Top View
Isometric View
Gear Box
WT3-1-004
Universiti Teknologi PETRONAS
Man Heng
Azwan
WEIGHT:
Mild SteelsA3
SHEET 8 OF 11SCALE:1:50
DWG NO.
TITLE:
Revision: 1.0Tolerence: 0.001
MATERIAL:
DATESIGNATURENAME Description
Group No:
16
Mechanical System Design: MCB 4012 Semester Jan 2015
Member Name: Muhammad Azwan Ibrahim 13208Yit Man Heng 15984Mohd Amir Asmadi 15021Muhamad Amirul Syamin Mad Jeli 15022Salem Omar Dhuban 14633
APPV'D
CHK'D
DRAWN
meter
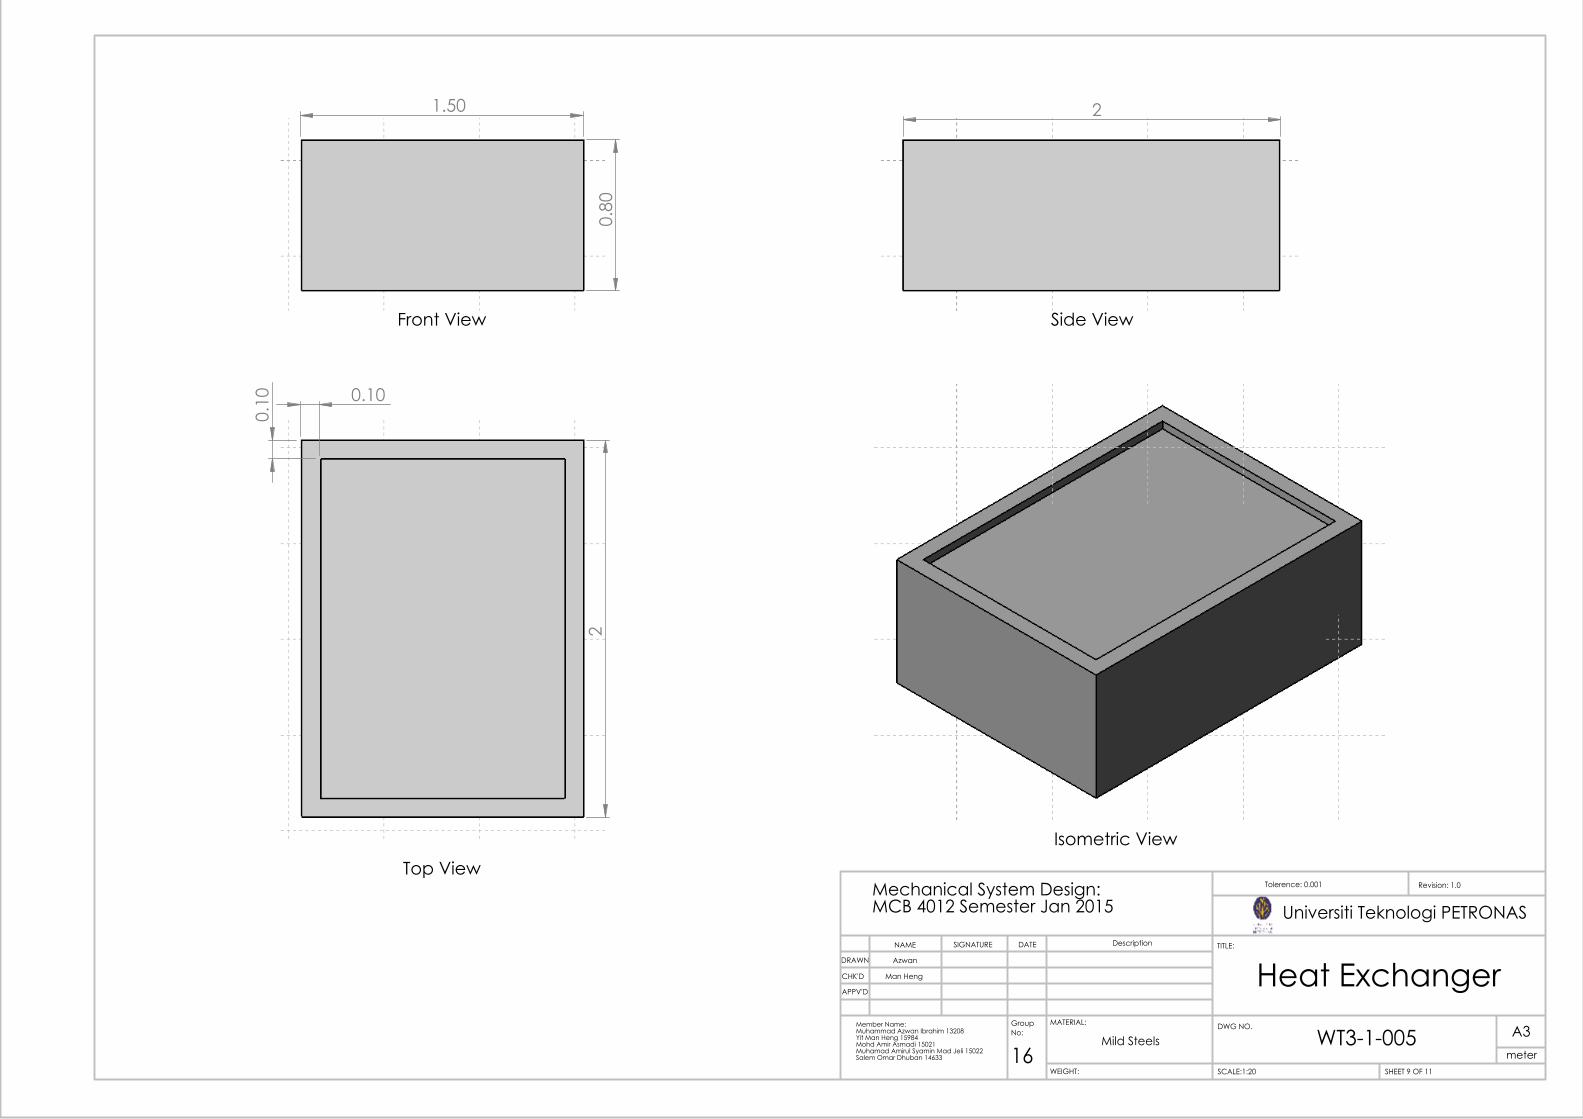
1.50
0.8
0
Front View
2
Side View
2
0.1
0 0.10
Top ViewIsometric View
Heat Exchanger
WT3-1-005
Universiti Teknologi PETRONAS
Man Heng
Azwan
WEIGHT:
Mild SteelsA3
SHEET 9 OF 11SCALE:1:20
DWG NO.
TITLE:
Revision: 1.0Tolerence: 0.001
MATERIAL:
DATESIGNATURENAME Description
Group No:
16
Mechanical System Design: MCB 4012 Semester Jan 2015
Member Name: Muhammad Azwan Ibrahim 13208Yit Man Heng 15984Mohd Amir Asmadi 15021Muhamad Amirul Syamin Mad Jeli 15022Salem Omar Dhuban 14633
APPV'D
CHK'D
DRAWN
meter
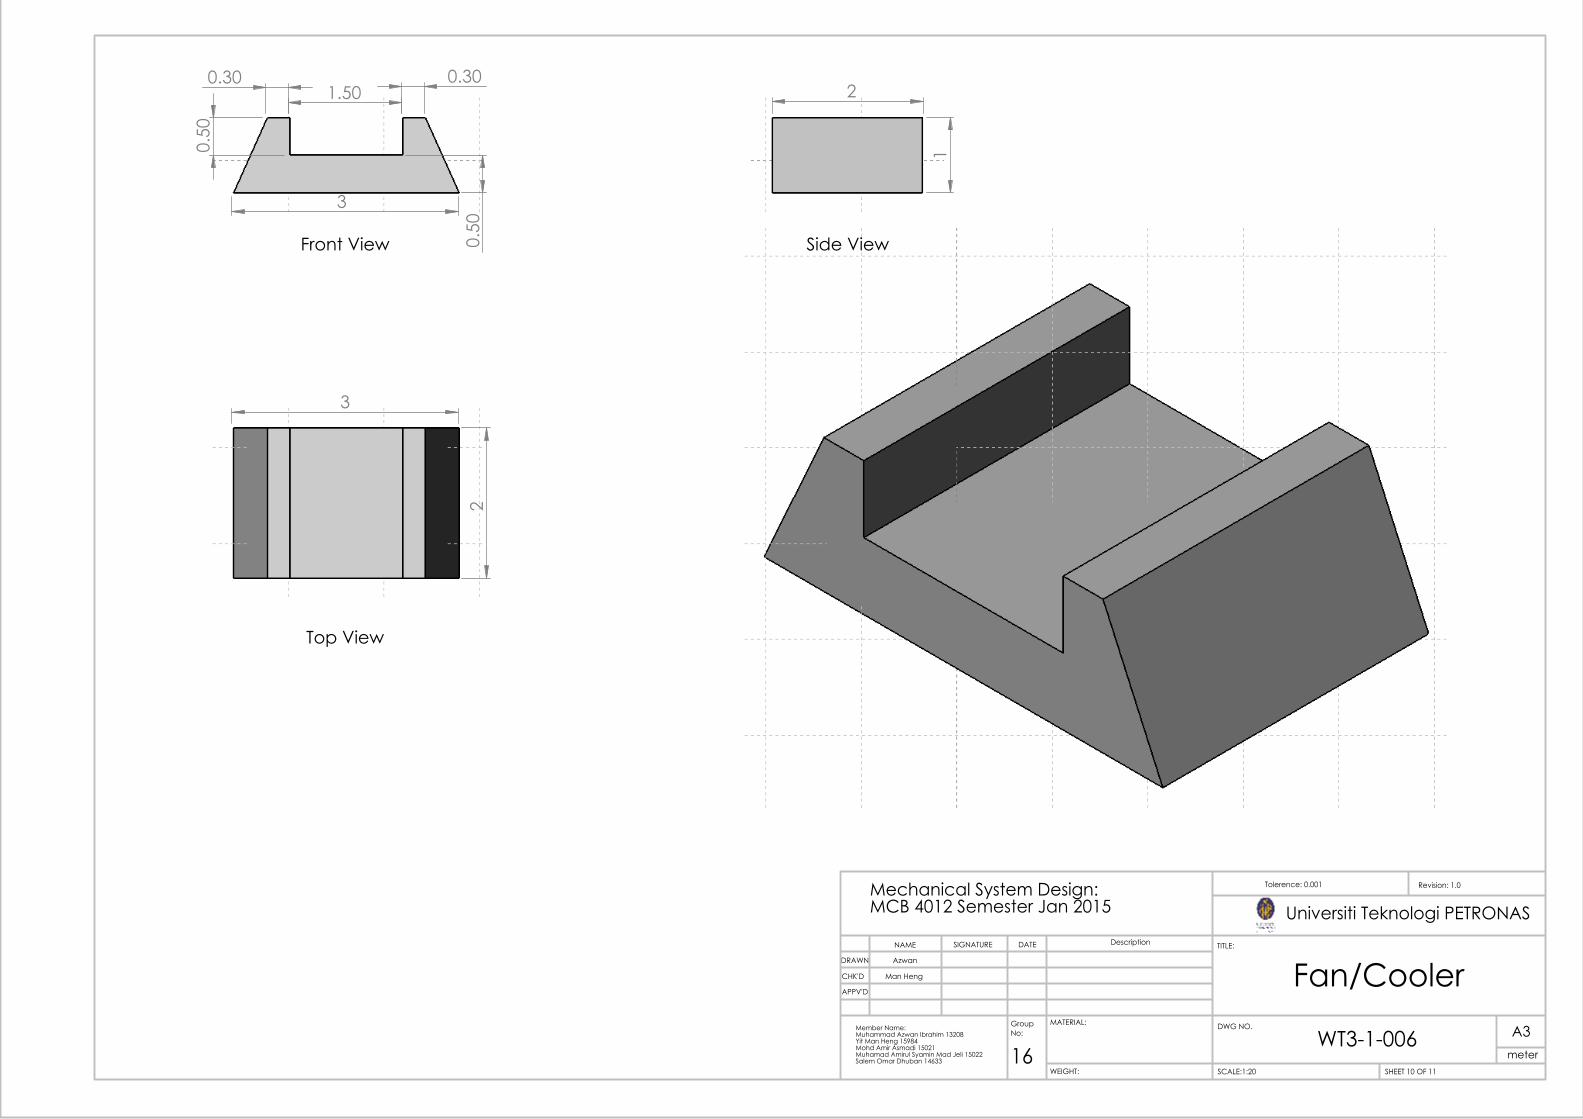
3
1.50
0.5
0
0.30 0.30
0.5
0
Front View
2
1
Side View
2
3
Top View
Fan/Cooler
WT3-1-006
Universiti Teknologi PETRONAS
Man Heng
Azwan
WEIGHT:
A3
SHEET 10 OF 11SCALE:1:20
DWG NO.
TITLE:
Revision: 1.0Tolerence: 0.001
MATERIAL:
DATESIGNATURENAME Description
Group No:
16
Mechanical System Design: MCB 4012 Semester Jan 2015
Member Name: Muhammad Azwan Ibrahim 13208Yit Man Heng 15984Mohd Amir Asmadi 15021Muhamad Amirul Syamin Mad Jeli 15022Salem Omar Dhuban 14633
APPV'D
CHK'D
DRAWN
meter
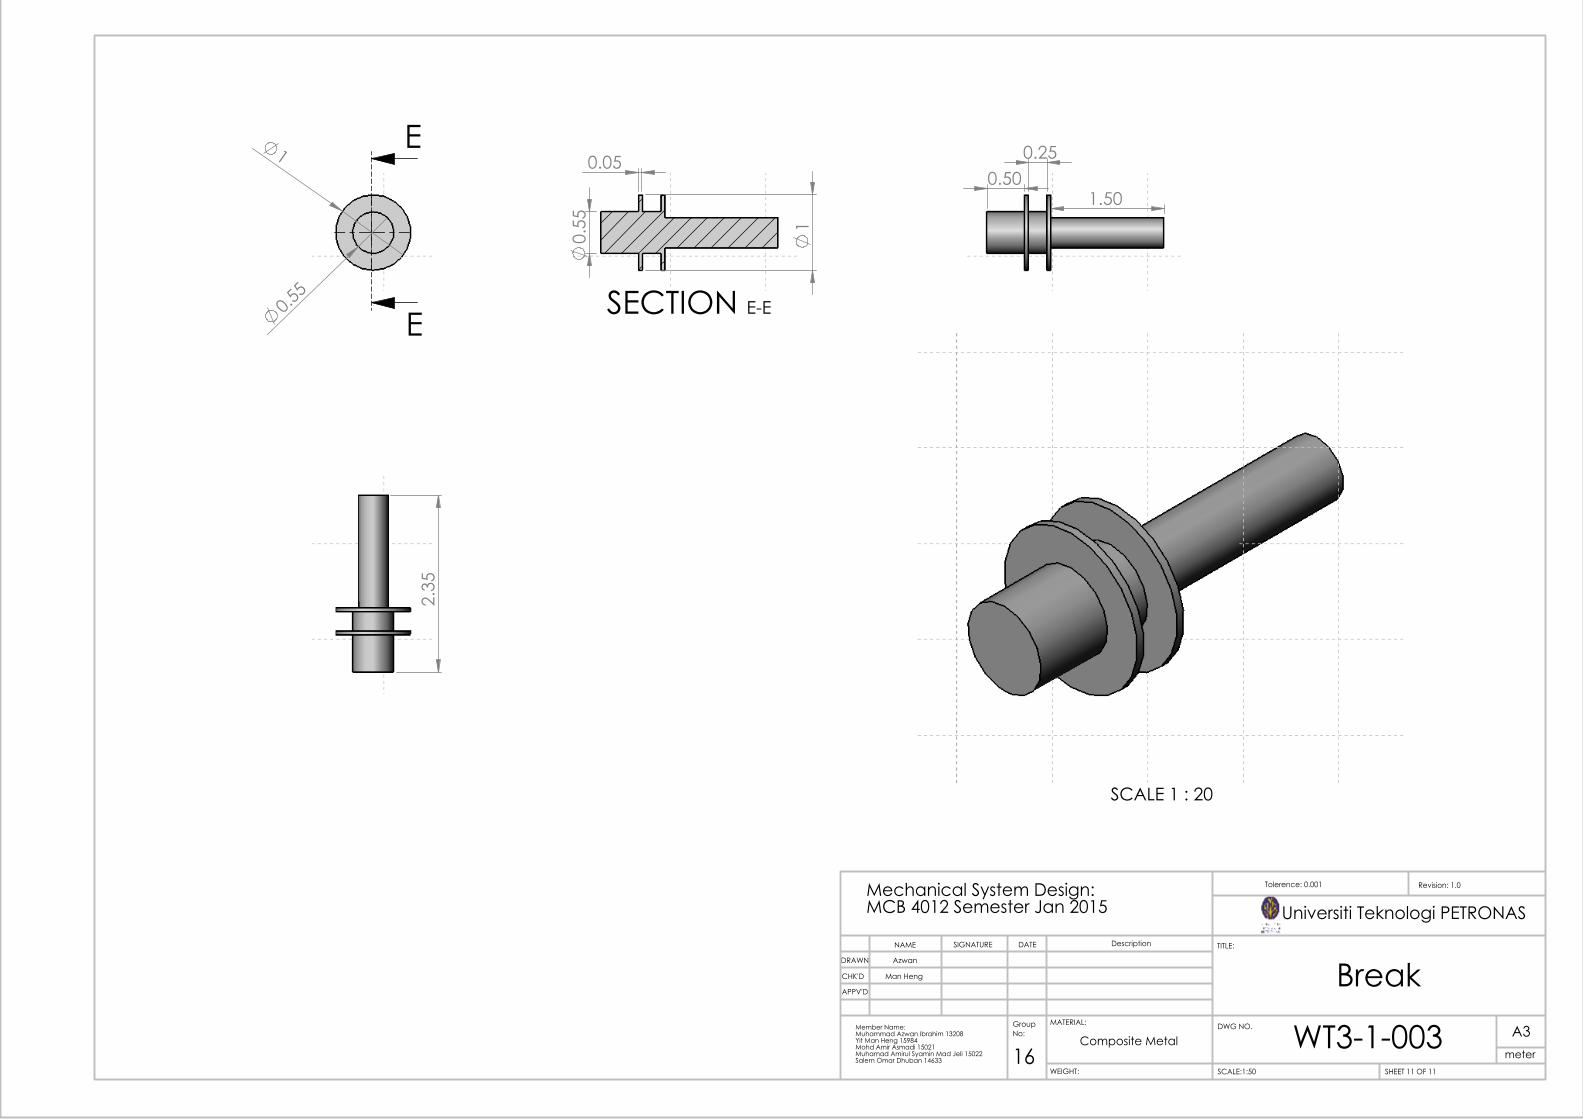
1
0.5
5
E
E
2.3
5
1.50 0.50
0.25
0.
55
0.05
1
SECTION E-E
SCALE 1 : 20
Break
WT3-1-003
Universiti Teknologi PETRONAS
Man Heng
Azwan
WEIGHT:
Composite Metal A3
SHEET 11 OF 11SCALE:1:50
DWG NO.
TITLE:
Revision: 1.0Tolerence: 0.001
MATERIAL:
DATESIGNATURENAME Description
Group No:
16
Mechanical System Design: MCB 4012 Semester Jan 2015
Member Name: Muhammad Azwan Ibrahim 13208Yit Man Heng 15984Mohd Amir Asmadi 15021Muhamad Amirul Syamin Mad Jeli 15022Salem Omar Dhuban 14633
APPV'D
CHK'D
DRAWN
meter