hv subtations grounding network design … subtations grounding network design ... 2. theory about...
TRANSCRIPT
POLITECNICO DI MILANO
School of Industrial and Information Engineering
Master of Science in Electrical Engineering
HV SUBTATIONS GROUNDING NETWORK DESIGN
Supervisor: Prof. Alberto Berizzi
CESI Supervisor: Christian Lorusso
Master thesis: Muhammad Ajmal Anwar
Matricola No: 816858
i
Contents Contents .............................................................................................................................................................. i
List of Figures ..................................................................................................................................................... iii
List of Tables ....................................................................................................................................................... v
Acknowledgement ............................................................................................................................................. vi
ABSTRACT ......................................................................................................................................................... vii
1. HV SUBSTATION GROUNDING NETWORK DESIGN .................................................................................... 1
Introduction ....................................................................................................................................... 1 1.1.
2. THEORY ABOUT HV SUBSTATION GROUNDING SYSTEM .......................................................................... 2
Grounding System Design ................................................................................................................. 2 2.1.
Soil Resistivity Model: ........................................................................................................................ 2 2.2.
Uniform Soil model: ................................................................................................................... 2 2.2.1.
Two-layer Soil model: ................................................................................................................ 3 2.2.2.
Measurements: ................................................................................................................................. 3 2.3.
Soil Resistivity Testing................................................................................................................ 3 2.3.1.
Data Collection .......................................................................................................................... 3 2.3.2.
Wenner Soil Resistivity Testing and Other 4-Point Tests: ................................................................. 3 2.4.
Wenner 4-Point Tests ................................................................................................................ 3 2.4.1.
Soil Resistance Meters: ...................................................................................................................... 4 2.5.
Shallow Depth Readings: ................................................................................................................... 5 2.6.
Grounding System Testing ................................................................................................................. 6 2.7.
3 point test or Fall of Potential Method: ................................................................................... 6 2.7.1.
Induced frequency testing or Clamp on testing: ....................................................................... 7 2.7.2.
Ground Potential Rise (GPR) or Earth Potential Rise ......................................................................... 7 2.8.
Step Potential: ................................................................................................................................... 7 2.9.
Touch Potential:............................................................................................................................. 8 2.10.
Behavior of touch and step voltages ......................................................................................... 9 2.10.1.
Analytical Derivations: ................................................................................................................. 11 2.11.
3. European Standard .................................................................................................................................. 15
IEC 50522; IEC 61936: ...................................................................................................................... 15 3.1.
Requirements: ......................................................................................................................... 15 3.1.1.
Design of earthing System: .............................................................................................................. 15 3.2.
Earthing Conductor .................................................................................................................. 15 3.2.1.
Earth Electrode: ....................................................................................................................... 15 3.2.2.
ii
Design Procedure: ........................................................................................................................... 16 3.3.
Touch Voltage limits: ....................................................................................................................... 16 3.4.
3.3.1. Measures of Permissible touch voltages: ................................................................................ 17
3.3.2. Method of calculating permissible touch voltages: ................................................................ 17
3.3.3. Calculations of Permissible touch voltages: ............................................................................ 18
Soil covering layer: ........................................................................................................................... 19 3.5.
Reduction factor .............................................................................................................................. 20 3.6.
Steel core Earth Wire Aluminum Coated: ....................................................................................... 20 3.7.
Driving Point Impedance: ........................................................................................................ 23 3.7.1.
Optical fiber Core situated inside steel wires: ................................................................................. 23 3.8.
Driving point impedance: ........................................................................................................ 25 3.8.1.
Steel core Earth Wire Zinc Coated: .................................................................................................. 25 3.9.
Driving point impedance: ........................................................................................................ 26 3.9.1.
American Standard: ..................................................................................................................... 27 3.10.
IEEE 80-2000: ........................................................................................................................... 27 3.10.1.
Basic problem for safety in Grounding: ................................................................................... 27 3.10.2.
Requirements: ......................................................................................................................... 27 3.10.3.
Tolerable Body Current Limits: .................................................................................................... 27 3.11.
Body Resistance: .......................................................................................................................... 28 3.12.
Touch Voltage and Step voltage Criteria: .................................................................................... 28 3.13.
4. GSLAB ...................................................................................................................................................... 30
Introduction ..................................................................................................................................... 30 4.1.
GSA .......................................................................................................................................... 30 4.1.1.
GSA_FD: ................................................................................................................................... 30 4.1.2.
XGSA_FD : ................................................................................................................................ 30 4.1.3.
How GSLAB Works: .......................................................................................................................... 31 4.2.
Soil Model: ....................................................................................................................................... 33 4.3.
Uniform Soil Model .................................................................................................................. 33 4.3.1.
Double Layer soil Model .......................................................................................................... 33 4.3.2.
Import data .............................................................................................................................. 34 4.3.3.
Step and Touch Voltage: .................................................................................................................. 34 4.4.
5. Simulation Results ................................................................................................................................... 36
Simulations on typical Substation Earthing Network: ..................................................................... 36 5.1.
European Standard (IEC 50522 IEC 61936) ..................................................................................... 38 5.2.
Case A) ..................................................................................................................................... 38 5.2.1.

iii
Case B) ..................................................................................................................................... 56 5.2.2.
Case C) ..................................................................................................................................... 79 5.2.3.
American Standard (IEEE 80 – 2000) ............................................................................................... 98 5.3.
6. Comparison between European and American Standard ..................................................................... 107
7. Conclusions: ........................................................................................................................................... 109
8. References: ............................................................................................................................................ 110
9. Appendix: ............................................................................................................................................... 111
List of Figures Figure 2-1 Wenner 4-point tests ....................................................................................................................... 4
Figure 2-2 Shallow Depth Readings ................................................................................................................... 5
Figure 2-3 3-pin test or fall of potential method ............................................................................................... 6
Figure 2-4 Step Potential ................................................................................................................................... 8
Figure 2-5 Touch Potential ................................................................................................................................ 9
Figure 2-6 Exposure to touch voltage ................................................................................................................ 9
Figure 2-7 Touch Voltage Circuit ..................................................................................................................... 10
Figure 2-8 Step Voltage Circuit ........................................................................................................................ 10
Figure 2-9 Step Voltage Circuit ........................................................................................................................ 11
Figure 2-10 Power system network under fault condition ............................................................................. 11
Figure 3-1 Permissible touch voltage .............................................................................................................. 16
Figure 3-2 power station 380/150 kV with Gravel and Asphalt ...................................................................... 19
Figure 3-3 Tower Arrangement ...................................................................................................................... 21
Figure 3-4 Driving point impedance ................................................................................................................ 23
Figure 4-1 Start page window ......................................................................................................................... 31
Figure 4-2 New Project Window ...................................................................................................................... 32
Figure 4-3 Project information window .......................................................................................................... 32
Figure 4-4 Uniform Soil model direct input ..................................................................................................... 33
Figure 4-5 Double layers Soil model direct input ............................................................................................ 33
Figure 4-6 Step and touch permissible voltage window ................................................................................ 34
Figure 5-1 Electrical Station 380/150 kV of Melfi - General Electromechanical Plan .................................... 36
Figure 5-2 Substation ....................................................................................................................................... 38
Figure 5-3 Line calculation .............................................................................................................................. 39
Figure 5-4 Touch Voltage ................................................................................................................................ 40
Figure 5-5 Step Voltage ................................................................................................................................... 41
Figure 5-6 Safe area ......................................................................................................................................... 42
Figure 5-7 Line Calculation .............................................................................................................................. 43
Figure 5-8 Touch Voltage ................................................................................................................................. 44
Figure 5-9 Step Voltage ................................................................................................................................... 45
Figure 5-10 Safe area with gravel .................................................................................................................... 46

iv
Figure 5-11 Safe area with gravel and Asphalt ................................................................................................ 47
Figure 5-12 Substation ..................................................................................................................................... 49
Figure 5-13 Line Calculation ............................................................................................................................ 50
Figure 5-14 Safe Area ...................................................................................................................................... 51
Figure 5-15 Line Calculation ............................................................................................................................ 52
Figure 5-16 Touch Voltage ............................................................................................................................... 53
Figure 5-17 Step Voltage ................................................................................................................................. 54
Figure 5-18 Safe Area with Gravel ................................................................................................................... 55
Figure 5-19 Substation ..................................................................................................................................... 56
Figure 5-20 Line Calculation ............................................................................................................................ 57
Figure 5-21 Touch Voltage ............................................................................................................................... 58
Figure 5-22 Steo Voltage ................................................................................................................................. 59
Figure 5-23 safe Area ....................................................................................................................................... 60
Figure 5-24 Line Calculation ............................................................................................................................ 61
Figure 5-25 Safe Area with Gravel ................................................................................................................... 62
Figure 5-26 Safe Area with Asphalt ................................................................................................................. 63
Figure 5-27 Substation ..................................................................................................................................... 64
Figure 5-28 Touch Voltage ............................................................................................................................... 65
Figure 5-29 Step Voltage ................................................................................................................................. 66
Figure 5-30 Safe Area with Gravel ................................................................................................................... 67
Figure 5-31 Safe Area with Gravel and Asphalt ............................................................................................... 68
Figure 5-32 Substation ..................................................................................................................................... 70
Figure 5-33 Line Calculation ............................................................................................................................ 71
Figure 5-34 Safe Area with Gravel ................................................................................................................... 72
Figure 5-35 Safe Area with Gravel and Asphalt ............................................................................................... 73
Figure 5-36 Substation ..................................................................................................................................... 74
Figure 5-37 Touch Voltage ............................................................................................................................... 75
Figure 5-38 Step Voltage ................................................................................................................................. 76
Figure 5-39 Safe Area with Gravel ................................................................................................................... 77
Figure 5-40 Safe Area Gravel and Asphalt ....................................................................................................... 78
Figure 5-41 Substation ..................................................................................................................................... 79
Figure 5-42 Line Calculation ............................................................................................................................ 80
Figure 5-43 Safe Area with Gravel ................................................................................................................... 81
Figure 5-44 Touch Voltage ............................................................................................................................... 82
Figure 5-45 Step Voltage ................................................................................................................................. 83
Figure 5-46 Safe Area with Gravel and Asphalt ............................................................................................... 84
Figure 5-47 Substation ..................................................................................................................................... 85
Figure 5-48 Line Calculation ............................................................................................................................ 86
Figure 5-49 Touch Voltage ............................................................................................................................... 87
Figure 5-50 Step Voltage ................................................................................................................................. 88
Figure 5-51 Safe Area ...................................................................................................................................... 89
Figure 5-52 Substation ..................................................................................................................................... 90
Figure 5-53 Line Calculation ............................................................................................................................ 91
Figure 5-54 safe area ....................................................................................................................................... 92
Figure 5-55 Substation ..................................................................................................................................... 93
Figure 5-56 Line Calculation ............................................................................................................................ 94
v
Figure 5-57 Touch Voltage ............................................................................................................................... 95
Figure 5-58 Step Voltage ................................................................................................................................. 96
Figure 5-59 Safe Area ...................................................................................................................................... 97
Figure 5-60 Substation ..................................................................................................................................... 98
Figure 5-61 Line Calculation ............................................................................................................................ 99
Figure 5-62 Touch Voltage ............................................................................................................................. 100
Figure 5-63 Step Voltage ............................................................................................................................... 101
Figure 5-64 Safe Area .................................................................................................................................... 102
Figure 5-65 Touch Voltage ............................................................................................................................. 103
Figure 5-66 Step Voltage ............................................................................................................................... 104
Figure 5-67 Safe Area with Gravel Material .................................................................................................. 105
Figure 5-68 Safe Area With Gravel And Asphalt Material ............................................................................. 106
List of Tables Table 2-1 Average value of Resistivity across the soil types ............................................................................. 2
Table 3-1 Fault duration and earth potential rise ........................................................................................... 17
Table 3-2 Permissible body current depending on fault duration .................................................................. 18
Table 3-3 Human body impedance related to the touch voltage for a current path hand to hand ............... 19

vi
Acknowledgement
First and foremost I would like to thank the Almighty God for reasons too numerous to mention
and beyond words to describe.
I am very thankful to my supervisors, Professor Alberto Berizzi and Christian Lorusso (CESI SPA) for
their kind and tireless help every time when I needed it. Overall I feel so privileged to work in the
CESI SPA which is a wonderful research team with a great ambition of implementing new ideas.
I would like to thank my family, friends and especially my parents who prayed a lot for me.
vii
ABSTRACT Abstract in English:
The goal of this research is the design of earthing systems of HV substations that are able to satisfy
all the requirements for using a value of current 50kA and for a range of soil resistivity from 100
Ωm to 1000 Ωm. Starting from the design parameters, different cases were considered for the
safety of substation that calculate the earthing potential rise, safe area, touch and step voltage
level. These cases use both European (CEI EN 50522: CEI EN 61936) and American (IEEE 80-2000)
Standard references for the earthing of Electrical Installations which specify the requirements for
the design of HV grounding system for voltages exceeding AC 1 kV.
Simulations were carried out with different cases for both Uniform and double soil layers using
GSLAB software as defined below:
Case 1:- A simulation is performed for a 100 Ωm resistivity value and fault current of 50kA with soil
covering layer, the HV substation is tested for safety and is found to be safe.
In the next step, soil covering layer with reduction factor is used with a resistivity value of 100 Ωm
and the simulations give the same HV substation which is also good for safety.
Case 2:- Another simulation is done with resistivity 1000 Ωm, same fault current of 50kA and soil
covering layer, and the results show that the HV substation is unsafe due to the high resistivity.
To increase the safety of substation the mesh grid is increased where necessary, but the
substation is still not good for safety. On the other hand, using reduction factor for the substation
with same resistivity value and soil covering layer, HV substation is good for safety.
Case 3:- For the Double soil layer, increasing the resistivity of first layer to 1000 Ωm and second
layer to 100 Ωm with same fault current of 50KA for both, it is concluded that the use of rods
(length 10 m) is necessary for the safety of substation.
Abstract in Italiano:
L’obiettivo di questa tesi è studiare i progetti delle reti di terra nelle sottostazioni di alta tensione,
in modo che soddisfino le norme previste per le installazioni con correnti di guasto pari a 50 kA e
con un valore di resistività del terreno compresa nell’intervallo tra 100 Ωm e 1000 Ωm. A partire
da alcuni parametri progettuali, è stata studiata la sicurezza della sottostazione in diverse
condizioni, mediante il calcolo dell’andamento del potenziale di terra, il calcolo dell’area di
sicurezza e delle tensioni di passo e di contatto. Queste diverse configurazioni fanno riferimento
sia alle norme europee (CEI EN 50522: CEI EN 61936) che a quelle americane (IEEE 80-2000) per la
messa a terra di installazioni elettriche. Tali norme fissano i vincoli per i progetti delle reti di terra
in impianti con tensione nominale superiore a 1kV CA.
Sono state eseguite delle simulazioni mediante il software GSLAB sia ipotizzando il suolo con uno
strato omogeneo, sia diviso in due strati omogenei.Le simulazioni sono state così organizzate:

viii
Caso 1:-E’ stata ipotizzata una resistività del terreno pari a 100 Ωm, suolo ad un singolo strato e
una corrente di guasto pari a 50kA; la sottostazione risulta essere sicura.
Successivamente, è stato ridotto lo spessore della pavimentazione, manenendo la resistività pari a
100 Ωm. La simulazione ha confermato la sicurezza della sottostazione.
Caso 2:- E’stata eseguita un’altra simulazione considerando una resistività di terra pari a 1000 Ωm,
una corrente di guasto pari a 50 kA e una pavimentazione a singolo strato. In questo caso, la
sottostazione non risulta essere sicura a causa dell’elevata resistività di terra.
Al fine di aumentare la sicurezza della sottostazione, è stata incrementata la magliatura della rete
di terra in alcuni punti. Nonostante ciò, la sottostazione non è ancora sicura. Invece, si ottiene la
sicurezza dell’installazione ripetendo la simulazione utilizzando il fattore di riduzione dello
spessore dello strato del caso 1, il valore di resistività e lo strato del caso 2.
Caso 3:- E’ stato considerato il suolo suddiviso in due strati; la resistività del primo strato è di 1000
Ωm, mentre quella del secondo è di 100 Ωm. Si è ipotizzato che la corrente di gusto fosse di nuovo
pari a 50KA. Il risultato è che, per garantire la sicurezza della sottostazione, è necessario installare
dei picchetti di lunghezza pari a 10 m.

1
1. HV SUBSTATION GROUNDING NETWORK DESIGN
Introduction 1.1.
With the development of modern power system to move towards advanced technology
applications and large capacity, the requirements of safety, stability, and economic operation of
power system become much higher, a good grounding system is the best way to keep the safe
operation of power system. The grounding system should confirm that the ground potential rise
due to grounding fault does not lead power apparatus to be destroyed, and at the same time it
also ensures that the touch voltage and the step voltage are not harmful for the operators.
Grounding system is that which connects parts of electric circuit with the ground and it can affect
the Safety and Electromagnetic compatibility of the power supply. If a fault within an electrical
device connects a live supply conductor to an exposed conductive surface, anyone touching it
while electrically connected to the earth will complete a circuit back to the earthed supply
conductor and will receive an electric shock.
When design a grounding system, the fundamental method to check the safety of human beings
and power apparatus is to control the touch and step voltages in their respective safe regions.
Earthing System plays main role in satisfactory operation of a substation. It provides place for
connecting system neutral points, equipment body and support structures to the earth.
It discharges the lightning strokes to the earth and it also keeps touch and step voltages within the
specific limits. However, properly design grounding system guarantees its reliable performance of
substations, improving integrity of overall power system. A good designed grounding system
ensures following.
1 It provides means of dissipating electrical current into earth without exceeding operating limits
of equipment.
2 It provides the safe environment to protect personnel in the vicinity of the grounded facilities
from the dangers of electric shock under fault conditions.
It consist of all of the interconnected grounding facilities in the substation area including,
overhead ground wires, ground grid, etc. It consists of horizontal interconnected conductors that
often supplemented by vertical ground rods.
The safety of a grounding system in homogeneous soil can be analyzed by the provided methods
in European IEC Standard or American IEEE standard. The numerical analysis method should be
used to calculate the earth resistance of the grounding system, the potential distribution, touch
and step voltages on the ground surface.
2
2. THEORY ABOUT HV SUBSTATION GROUNDING SYSTEM
Grounding System Design 2.1.
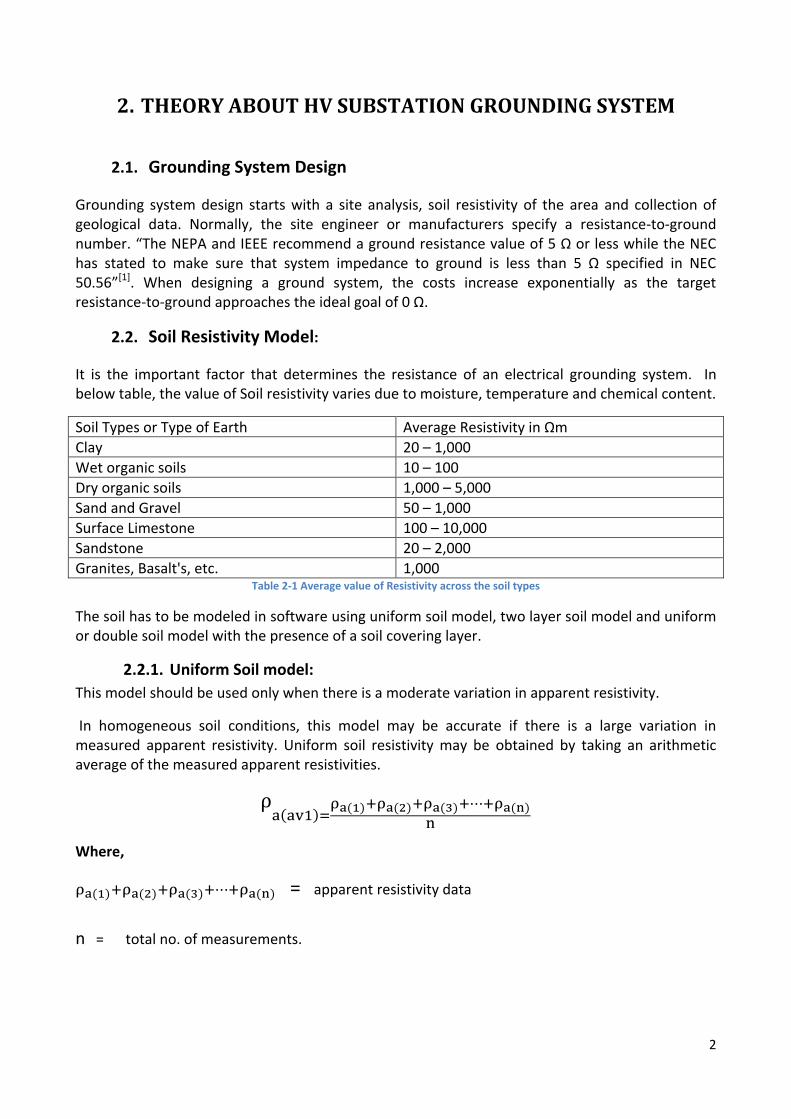
Grounding system design starts with a site analysis, soil resistivity of the area and collection of geological data. Normally, the site engineer or manufacturers specify a resistance-to-ground number. “The NEPA and IEEE recommend a ground resistance value of 5 Ω or less while the NEC has stated to make sure that system impedance to ground is less than 5 Ω specified in NEC 50.56”[1]. When designing a ground system, the costs increase exponentially as the target resistance-to-ground approaches the ideal goal of 0 Ω.
Soil Resistivity Model: 2.2.
It is the important factor that determines the resistance of an electrical grounding system. In below table, the value of Soil resistivity varies due to moisture, temperature and chemical content.
Soil Types or Type of Earth Average Resistivity in Ωm
Clay 20 – 1,000
Wet organic soils 10 – 100
Dry organic soils 1,000 – 5,000
Sand and Gravel 50 – 1,000
Surface Limestone 100 – 10,000
Sandstone 20 – 2,000
Granites, Basalt's, etc. 1,000 Table 2-1 Average value of Resistivity across the soil types
The soil has to be modeled in software using uniform soil model, two layer soil model and uniform or double soil model with the presence of a soil covering layer.
Uniform Soil model: 2.2.1.
This model should be used only when there is a moderate variation in apparent resistivity.
In homogeneous soil conditions, this model may be accurate if there is a large variation in measured apparent resistivity. Uniform soil resistivity may be obtained by taking an arithmetic average of the measured apparent resistivities.
( )
( ) ( ) ( ) ( )
Where,
( ) ( ) ( ) ( ) = apparent resistivity data n = total no. of measurements.

3
Two-layer Soil model: 2.2.2.
“This model can be represented by an upper layer soil of a finite depth above a lower layer of infinite depth .The change in resistivity at the boundaries of each soil layer can be represented by means of a reflection factor”[2].
Measurements: 2.3.
Soil Resistivity Testing: 2.3.1.
Soil resistivity testing is process of measuring a volume of soil to determine the conductivity of the
soil. The resulting soil resistivity is expressed in Ωm or Ωcm.
Soil resistivity testing is the single most major factor in electrical grounding design. This is true
when discussing a simple electrical design to dedicated low-resistance grounding systems, or to
the far more complex issues involved in Ground Potential Rise Studies (GPR).
Good soil models are the basis of all grounding designs and they are developed from accurate soil
resistivity testing.
Data Collection: 2.3.2.
When collection of data begins then Soil resistivity testing provides the basis for all grounding design. Proper Soil resistivity testing using the Wenner 4-point method is recommended because of its accuracy.
Wenner Soil Resistivity Testing and Other 4-Point Tests: 2.4.
The Wenner 4-point Method is the most used test method to measure the resistivity of soil, while
the other methods such as the General and Schlumberger methods, however they are infrequently
used for grounding design applications and they vary only slightly in how the probes are spaced
when compared to the Wenner Method.
Wenner 4-Point Tests: 2.4.1.
The test consists of 4 pins that must be inserted into the earth. The outer two pins are called the
Current probes, C1 and C2. These are the probes that inject current into the earth. The inner two
probes are the Potential probes, P1 and P2. These are the probes that take the actual soil
resistance measurement.
4
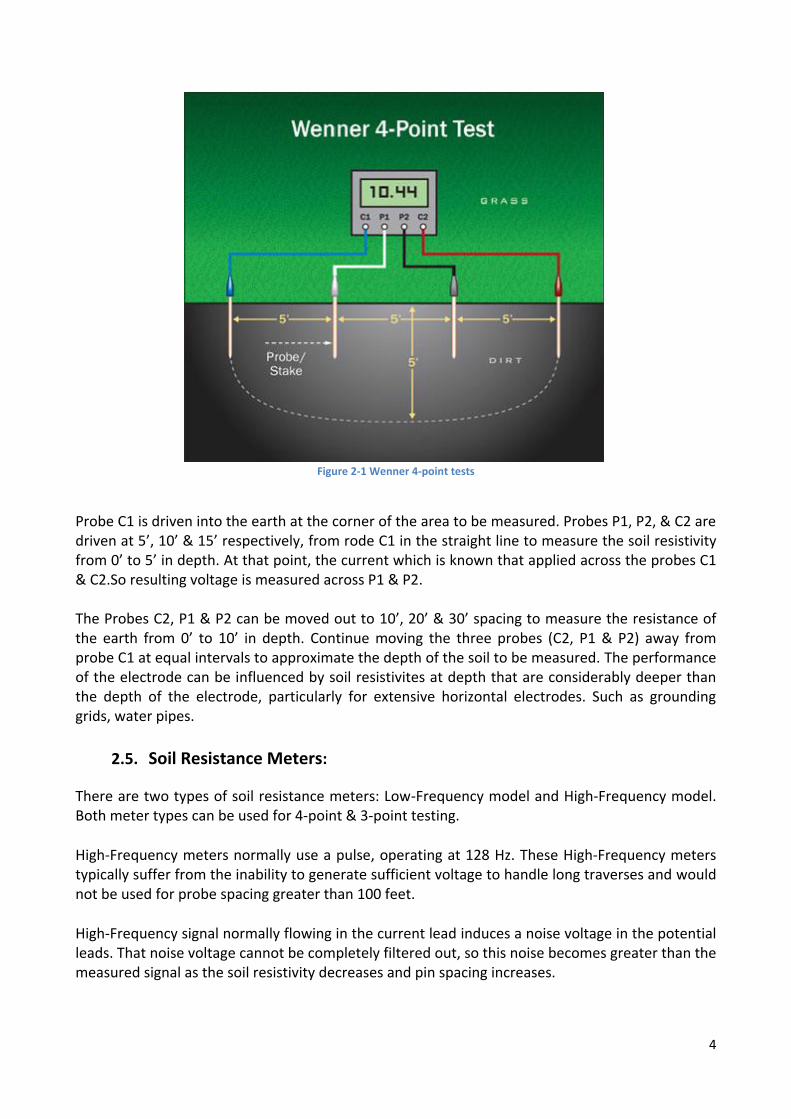
Figure 2-1 Wenner 4-point tests
Probe C1 is driven into the earth at the corner of the area to be measured. Probes P1, P2, & C2 are driven at 5’, 10’ & 15’ respectively, from rode C1 in the straight line to measure the soil resistivity from 0’ to 5’ in depth. At that point, the current which is known that applied across the probes C1 & C2.So resulting voltage is measured across P1 & P2. The Probes C2, P1 & P2 can be moved out to 10’, 20’ & 30’ spacing to measure the resistance of the earth from 0’ to 10’ in depth. Continue moving the three probes (C2, P1 & P2) away from probe C1 at equal intervals to approximate the depth of the soil to be measured. The performance of the electrode can be influenced by soil resistivites at depth that are considerably deeper than the depth of the electrode, particularly for extensive horizontal electrodes. Such as grounding grids, water pipes.
Soil Resistance Meters: 2.5.
There are two types of soil resistance meters: Low-Frequency model and High-Frequency model. Both meter types can be used for 4-point & 3-point testing.
High-Frequency meters normally use a pulse, operating at 128 Hz. These High-Frequency meters typically suffer from the inability to generate sufficient voltage to handle long traverses and would not be used for probe spacing greater than 100 feet.
High-Frequency signal normally flowing in the current lead induces a noise voltage in the potential leads. That noise voltage cannot be completely filtered out, so this noise becomes greater than the measured signal as the soil resistivity decreases and pin spacing increases.

5
High-Frequency meters are very less expensive than Low-Frequency meters, and mostly used in soil resistivity testing. Low-Frequency meters, which generate low frequency pulses (order of 0.5 to 2.0 seconds per pulse), are preferred equipment for soil resistivity testing, as they do away with the induction problem from which the High-Frequency meters suffer.
They can be very expensive. Normally cost depends upon the equipment’s maximum voltage. Low-Frequency meters can take readings with extremely large probe spacing and often thousands of feet in distance. Typically, the electronics filtering packages offered in Low-Frequency meters are superior then in High-Frequency meters.
Shallow Depth Readings: 2.6.
Figure 2-2 Shallow Depth Readings
In Figure 2-2 Shallow Depth Readings the shallowest readings are used again in determining the actual resistivity at depth.
“Shallow depth readings of 6-inches, 1-foot, 1.5-feet, 2-feet and 2.5-feet are important for grounding design, because grounding conductors are typically buried at 1.5 to 2.5-feet below the surface of the earth. To accurately calculate how those conductors will perform at these depths shallow soil readings must be taken. These shallow readings become even more important when engineers calculate Ground Potential Rise, Touch Voltages and Step Voltages [1]”.
It is critical that the measurement probes and current probes be inserted into the earth to the proper depth for shallow soil resistivity readings. If the probes are driven too deep, then it can be difficult to resolve the resistivity of the shallow soil. A thumb rule is that the penetration depth of the potential probes should be no more than 10% of the pin spacing, whereas the current probes must not be driven more than 30% of the pin spacing.
6
Grounding System Testing: 2.7.
Ground resistance measurement for an earth electrode system is very important. It would be done
in this way when the first electrode is installed, and then at periodic intervals thereafter. This
confirms that the resistance-to-ground does not increase over time.
There are two methods for testing an existing earth-electrode system. The first is the 3-point test
or Fall- of- Potential method and the second is the Induced Frequency test or clamp-on method.
The 3-point test requires the complete isolation from the power utility. Not just power isolation,
but also removal of any neutral or other such ground connections extending outside the grounding
system. This test is the best test for large grounding systems and is also suitable for small
electrodes.
The induced frequency test can be performed while the power is on and actually requires the
utility to be connected to the grounding system under test. This test is accurate only for small
electrodes; it uses frequencies in the kHz range.
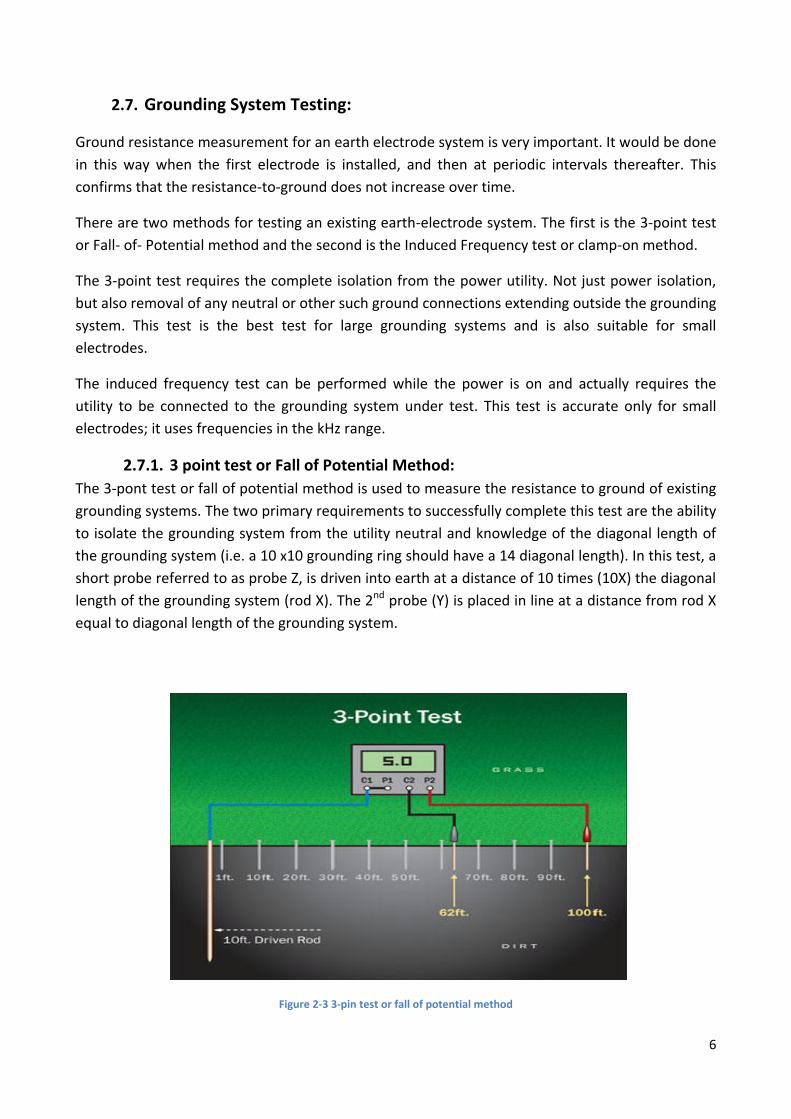
3 point test or Fall of Potential Method: 2.7.1.
The 3-pont test or fall of potential method is used to measure the resistance to ground of existing
grounding systems. The two primary requirements to successfully complete this test are the ability
to isolate the grounding system from the utility neutral and knowledge of the diagonal length of
the grounding system (i.e. a 10 x10 grounding ring should have a 14 diagonal length). In this test, a
short probe referred to as probe Z, is driven into earth at a distance of 10 times (10X) the diagonal
length of the grounding system (rod X). The 2nd probe (Y) is placed in line at a distance from rod X
equal to diagonal length of the grounding system.
Figure 2-3 3-pin test or fall of potential method

7
At that point, a known current is applied across X & Z, while the resulting voltage is measured
across X & Y. Ohm’s law can be applied to calculate the measured resistance.
Probe Y is then moved out to a distance of 2X the diagonal length of the grounding system, in line
with X & Z, to repeat the resistance measurement at a new interval. This will continue moving
probe Y out of 3 X,4X,5X……………..9X the diagonal length to complete the 3-pin test with a total of
9 resistance measurements.
Induced frequency testing or Clamp on testing: 2.7.2.
The Induced frequency testing or clamp on testing is one of the newest test methods for measuring the resistance to ground of a grounding system. This test uses a special transformer to induce an oscillating voltage (often 1.7 kHz) into the grounding system. Unlike the 3 point test which requires the grounding system to be completely disconnected and isolated before testing, this method requires that grounding system under test be connected to the electric utilities (or other large grounding system such as from telephone company) grounding system (typically via the neutral return wire) to provide the return path for the signal. Induced frequency test is the only test that can be used on live or hot system.
Ground Potential Rise (GPR) or Earth Potential Rise 2.8.
Ground Potential Rise (GPR) or Earth Potential Rise is a phenomenon that occurs when large
amounts of electricity enter the earth, in most cases when a fault occurs at substations or high-
voltage towers, or when lightning strikes occur. When currents with large magnitude enter the
earth through grounding system, not only will the grounding system rise in electrical potential, but
so will the surrounding soil as well.
The voltages produced by a Ground Potential Rise or Earth Potential Rise can be hazardous to both
personnel and equipment. The resulting potential differences will cause currents to flow into any
and all nearby grounded conductive bodies, including concrete, pipes, copper wires and people.
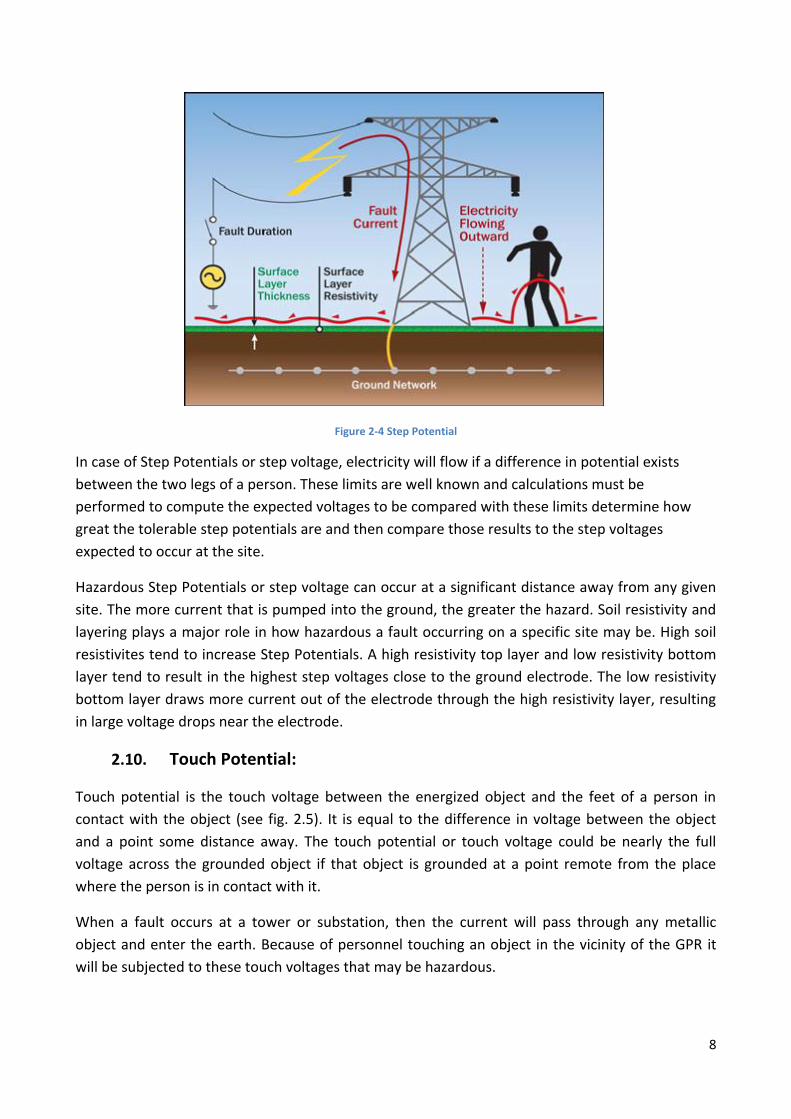
Step Potential: 2.9.
Step potential is the step voltage between the feet of a person standing near an energized
grounded object (See Figure 2-4 Step Potential). It is equal to the difference in voltage, given by the
voltage distribution curve, between two points at different distances from the electrode. A person
could be at risk of injury during a fault simply by standing near the grounding point.
When a fault occurs at a tower or substation, the current will enter the earth (See Figure 2-4 Step
Potential. That is based on the distribution of varying resistivity in the soil then, a corresponding
voltage distribution will occur.
8
Figure 2-4 Step Potential
In case of Step Potentials or step voltage, electricity will flow if a difference in potential exists
between the two legs of a person. These limits are well known and calculations must be
performed to compute the expected voltages to be compared with these limits determine how
great the tolerable step potentials are and then compare those results to the step voltages
expected to occur at the site.
Hazardous Step Potentials or step voltage can occur at a significant distance away from any given
site. The more current that is pumped into the ground, the greater the hazard. Soil resistivity and
layering plays a major role in how hazardous a fault occurring on a specific site may be. High soil
resistivites tend to increase Step Potentials. A high resistivity top layer and low resistivity bottom
layer tend to result in the highest step voltages close to the ground electrode. The low resistivity
bottom layer draws more current out of the electrode through the high resistivity layer, resulting
in large voltage drops near the electrode.
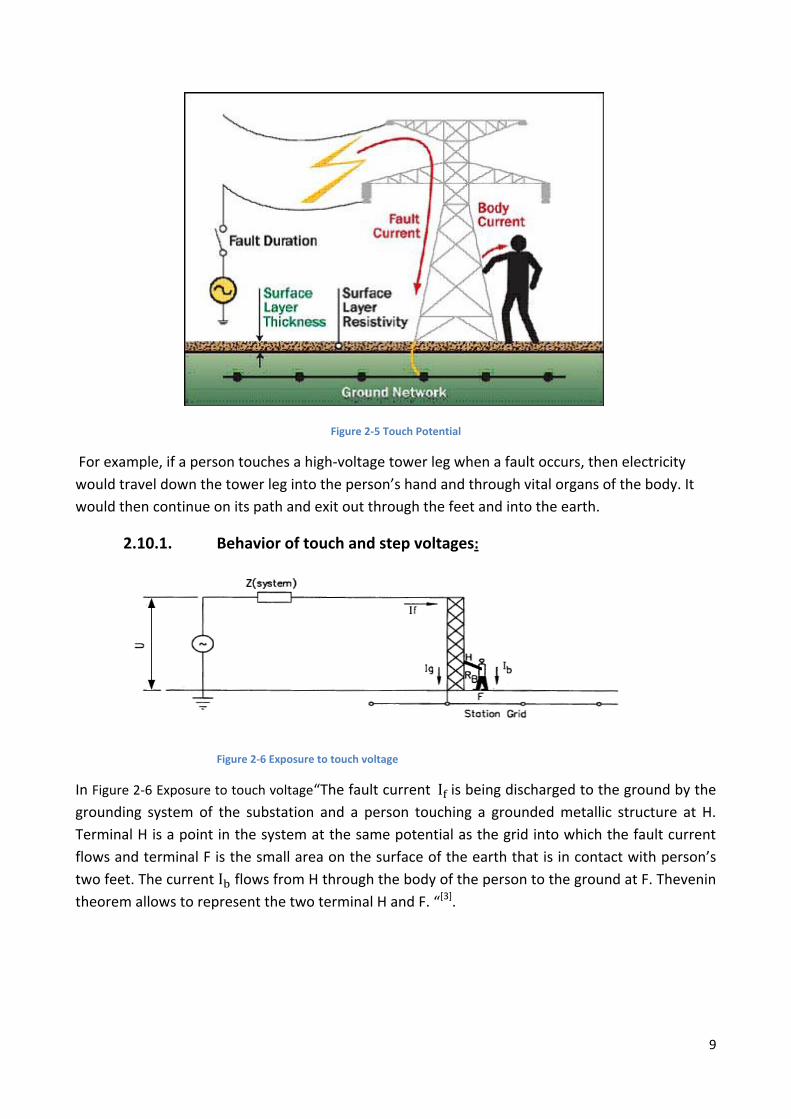
Touch Potential: 2.10.
Touch potential is the touch voltage between the energized object and the feet of a person in
contact with the object (see fig. 2.5). It is equal to the difference in voltage between the object
and a point some distance away. The touch potential or touch voltage could be nearly the full
voltage across the grounded object if that object is grounded at a point remote from the place
where the person is in contact with it.
When a fault occurs at a tower or substation, then the current will pass through any metallic
object and enter the earth. Because of personnel touching an object in the vicinity of the GPR it
will be subjected to these touch voltages that may be hazardous.
9
Figure 2-5 Touch Potential
For example, if a person touches a high-voltage tower leg when a fault occurs, then electricity
would travel down the tower leg into the person’s hand and through vital organs of the body. It
would then continue on its path and exit out through the feet and into the earth.
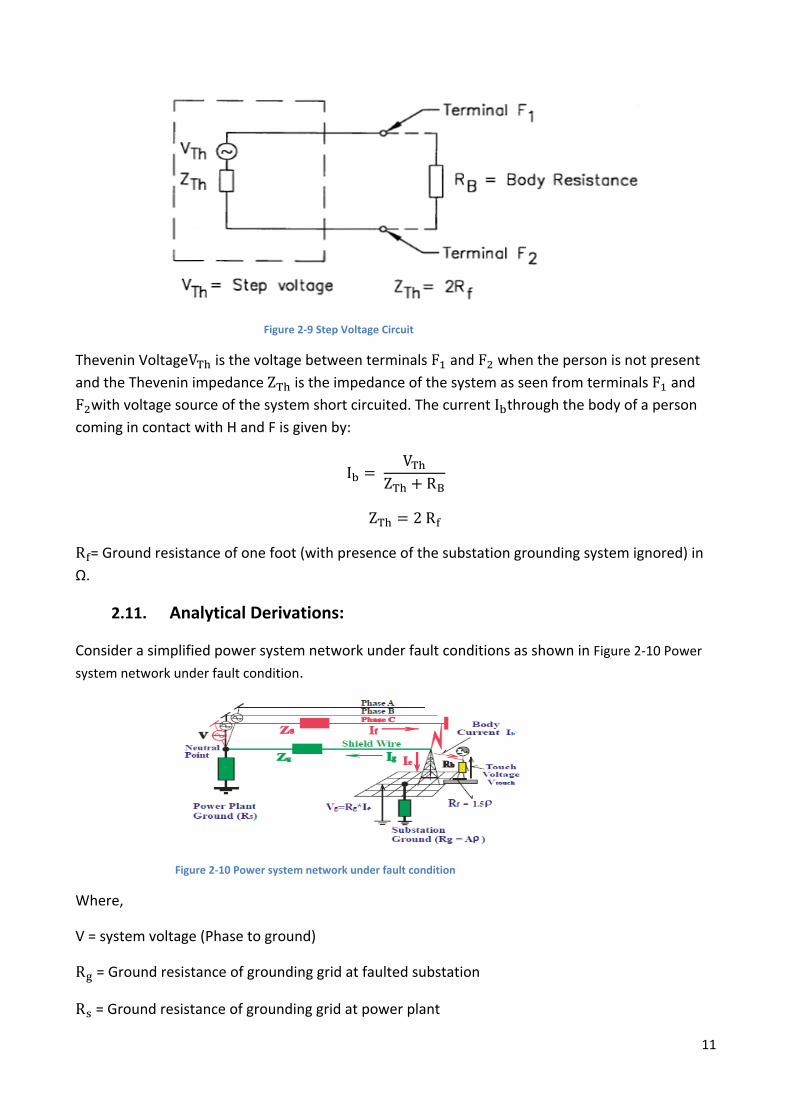
Behavior of touch and step voltages: 2.10.1.
Figure 2-6 Exposure to touch voltage
In Figure 2-6 Exposure to touch voltage“The fault current is being discharged to the ground by the
grounding system of the substation and a person touching a grounded metallic structure at H.
Terminal H is a point in the system at the same potential as the grid into which the fault current
flows and terminal F is the small area on the surface of the earth that is in contact with person’s
two feet. The current flows from H through the body of the person to the ground at F. Thevenin
theorem allows to represent the two terminal H and F. “[3].

10
Figure 2-7 Touch Voltage Circuit
Thevenin Voltage is the voltage between terminals H and F when the person is not present and
the Thevenin impedance is the impedance of the system as seen from point H and F with
voltage source of the system short circuited. The current through the body of a person coming in
contact with H and F is given by:
= Resistance of the human body (Ω)
From Figure 2-7 Touch Voltage Circuit,
In case of step voltage:
Figure 2-8 Step Voltage Circuit
From Figure 2-8 Step Voltage Circuit, the fault current is being discharged to the ground by
grounding system of substation. The current flows from one foot through the body of a
person to the other foot . Terminals and are the areas on the surface of the earth that are
in contact with two feet respectively.
Thevenin theorem is allows to represent the two terminal and network in Figure 2-9 Step
Voltage Circuit
11
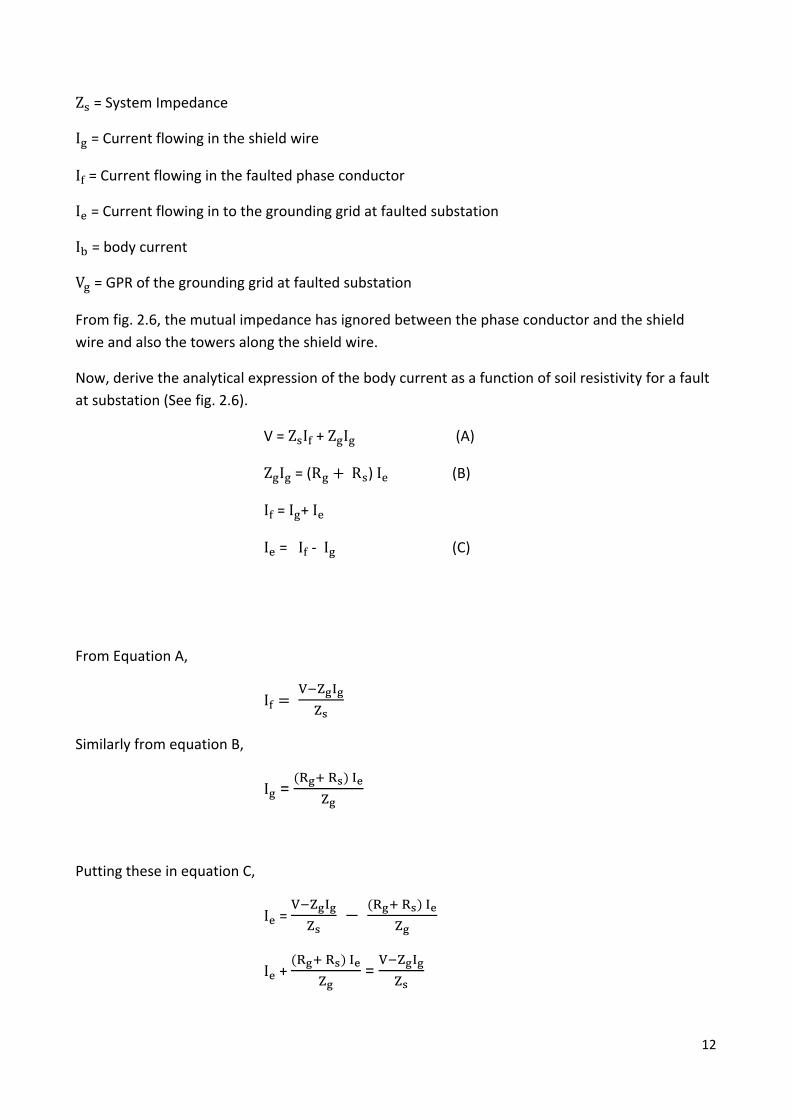
Figure 2-9 Step Voltage Circuit
Thevenin Voltage is the voltage between terminals and when the person is not present
and the Thevenin impedance is the impedance of the system as seen from terminals and
with voltage source of the system short circuited. The current through the body of a person
coming in contact with H and F is given by:
= Ground resistance of one foot (with presence of the substation grounding system ignored) in
Ω.
Analytical Derivations: 2.11.
Consider a simplified power system network under fault conditions as shown in Figure 2-10 Power
system network under fault condition.
Figure 2-10 Power system network under fault condition
Where,
V = system voltage (Phase to ground)
= Ground resistance of grounding grid at faulted substation
= Ground resistance of grounding grid at power plant
12
= System Impedance
= Current flowing in the shield wire
= Current flowing in the faulted phase conductor
= Current flowing in to the grounding grid at faulted substation
= body current
= GPR of the grounding grid at faulted substation
From fig. 2.6, the mutual impedance has ignored between the phase conductor and the shield
wire and also the towers along the shield wire.
Now, derive the analytical expression of the body current as a function of soil resistivity for a fault
at substation (See fig. 2.6).
V = + (A)
= ( ) (B)
= +
= - (C)
From Equation A,
Similarly from equation B,
= ( )
Putting these in equation C,
=
( )
+ ( )
=
13
( )
=
( )
=
( )
( )
= ( )
( )
+ ( )
=
=
( ) ( )
For GPR of the ground grid at faulted substation
=
( ) ( )
And now the touch voltage will be:
= a
=
( ) ( ) (D)
Where,
‘a’ is the touch voltage as a percentage of the GPR of the underground grid.
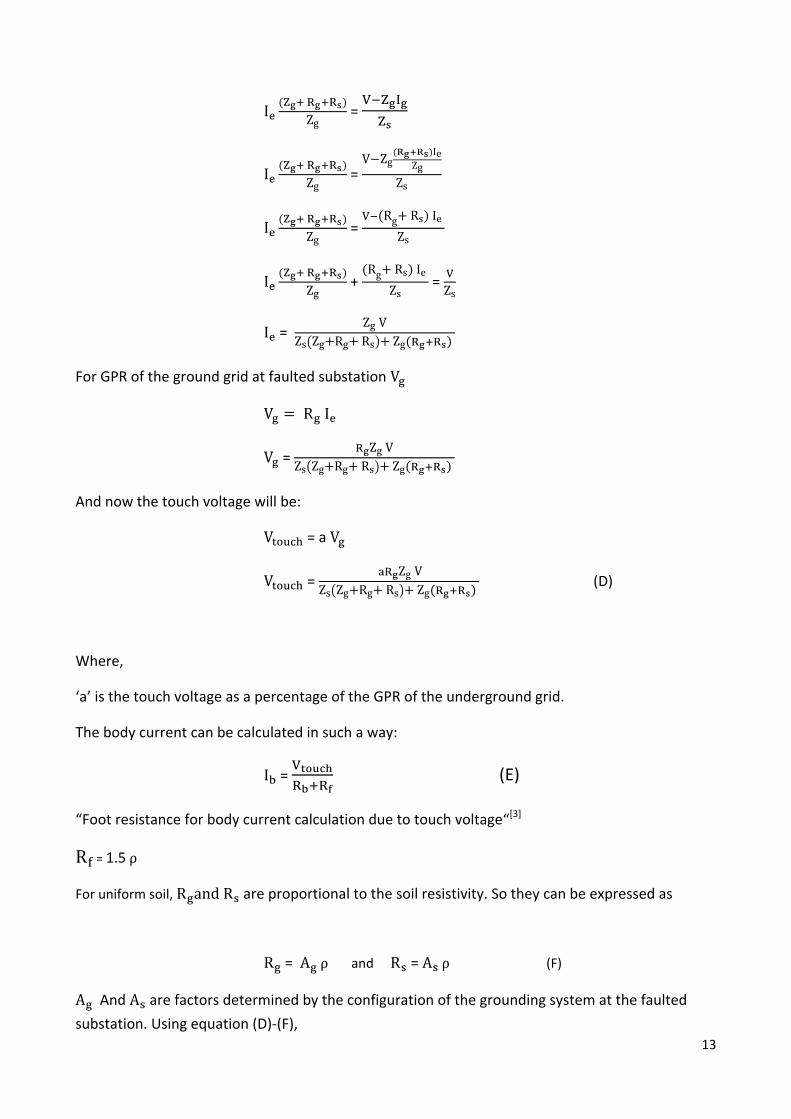
The body current can be calculated in such a way:
=
(E)
“Foot resistance for body current calculation due to touch voltage“[3]
= 1.5
For uniform soil, are proportional to the soil resistivity. So they can be expressed as
= and = (F)
And are factors determined by the configuration of the grounding system at the faulted
substation. Using equation (D)-(F),
14
=
( )
[
( )
]
(G)
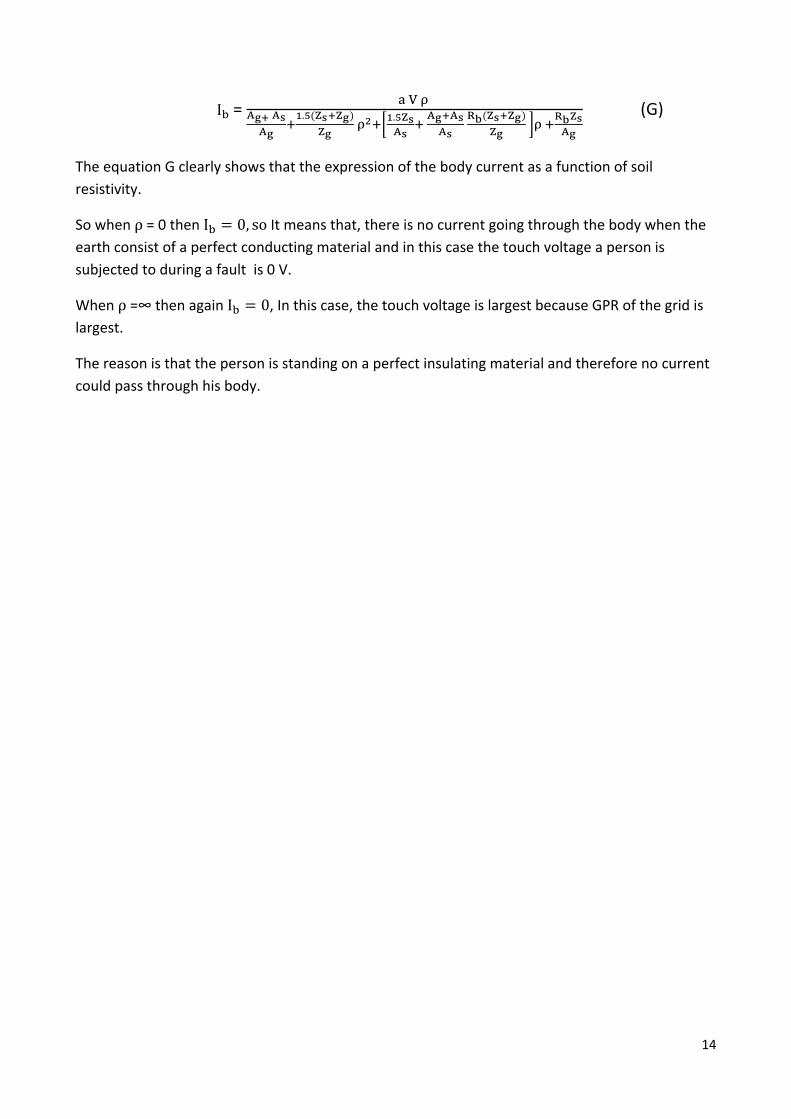
The equation G clearly shows that the expression of the body current as a function of soil
resistivity.
So when = 0 then It means that, there is no current going through the body when the
earth consist of a perfect conducting material and in this case the touch voltage a person is
subjected to during a fault is 0 V.
When =∞ then again , In this case, the touch voltage is largest because GPR of the grid is
largest.
The reason is that the person is standing on a perfect insulating material and therefore no current
could pass through his body.
15
3. European Standard
IEC 50522; IEC 61936: 3.1.
IEC stands for International Electro technical Commission. Both these standards are same and
used for the design and erection of earthing system of Electrical Installation. These can be operate
under all conditions and ensure the safety of human life at any place. “Both these standard do not
apply in test sites as well as overhead and underground lines between separate installations [4] “.
Requirements: 3.1.1.
For Electrical requirements, the neutral earthing method is important in case of design the
earthing system. Resonant earthing as well as low impedance earthing are examples of neutral
earthing method. The choice of type of neutral earthing method is normally based on the
following criteria.
Continuity of supply required for the network
Limitation of damage to equipment caused by earth faults
Detection of fault location
touch and Step voltages
In case of short circuit, the standard value of rated duration of the short circuit is 1s.
The earthing system shall maintain its integrity for the expected installation lifetime with due
allowance for corrosion and mechanical constraints.
Design of earthing System: 3.2.
The parameters of earthing system are as follows.
Value of fault current
Fault duration
Soil characteristics
Earthing Conductor: 3.2.1.
Due to mechanical strength and stability against corrosion, the minimum cross section is 16
for steel; the minimum cross section is 50 . Similarly for aluminum the minimum cross section
is 35 .
Earth Electrode: 3.2.2.
The electrode which is directly in contact with the soil shall be material capable of withstanding
corrosion (Chemical or biological attack, oxidation etc.). They have to resist the mechanical
influences during their installation as well as those occurring during normal service. It is acceptable
to use steel embedded in concrete foundation and steel piles.
16
Design Procedure: 3.3.
Using both standards (IEC 50522; IEC 61936), the grounding system can be designed according to
the following steps.
Collection of data (Include fault current, fault duration and layout)
Design the earthing system, which is based on functional requirements and then check that,
this is a part of global earthing system or not. If this is a part of global earthing system then it is
ok; otherwise determine the soil characteristics e.g. Soil resistivity of layers.
“Global earthing system is that, no dangerous touch and step voltages can occur“[5].
The existence of global earthing system can be detected by pattern measurements or
calculations for typical arrangements. Typical for global earthing systems are city centers or
industrial areas with distributed low and high voltage grounding
Determine based on earth fault current the current discharged into soil from earthing system.
Determine based on layout, soil characteristics and parallel earthing systems the overall
impedance to earth.
When design procedure is complete, the earth potential rise and permissible touch and step
voltage can be calculated.
Touch Voltage limits: 3.4.
The hazard to human beings is that a current will flow through the region of the heart which is
sufficient to cause ventricular fibrillation. This body current is translated into voltage limits for
comparison with the calculated touch and step voltages taking into account the following factors.
Proportion of current through the region of heart.
Resistance between the body contact points e.g. metal structure to hand including glove.
Body impedance along the current path
Fault duration
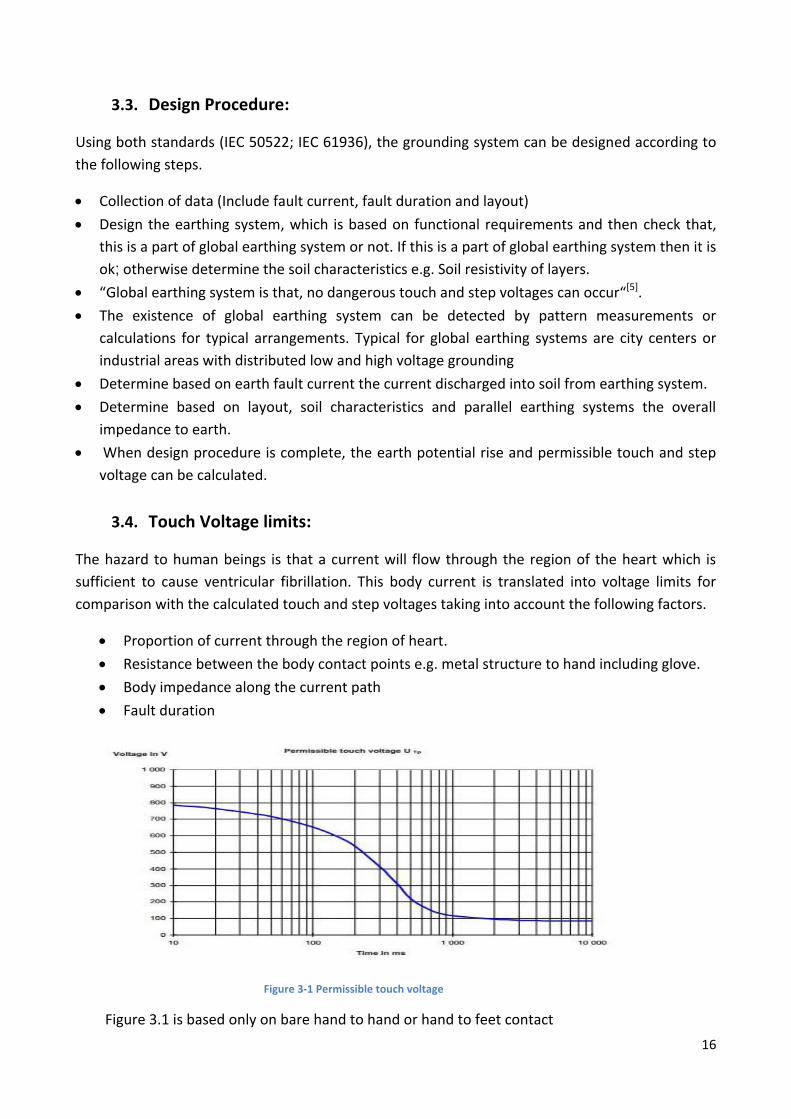
Figure 3-1 Permissible touch voltage
Figure 3.1 is based only on bare hand to hand or hand to feet contact

17
3.3.1. Measures of Permissible touch voltages:
The application of fundamental requirements will give the basic design of earthing system. This
design has to be checked with respect to the touch voltages and could then be considered as a
type design for similar situations. Figure 3.1 is used for the value of permissible touch voltages.
These permissible values are considered to be satisfied if either one of the condition is satisfied.
The relevant installation becomes a part of a global earthing system.
The earth potential rise, determine by measurement or calculation does not exceed double
the value of the permissible touch voltage in accordance with Figure 3-1 Permissible touch
voltage or the relevant recognized specified measures M are carried out in accordance with
the magnitude of earth potential rise and the fault duration and these measures can be
described in such a way.
Fault duration ( ) Earth potential rise ( )
> 5s or
≤5s or
Table 3-1 Fault duration and earth potential rise
When the fault duration is greater than or less than 5 s and earthing potential rise is less than and
equal to 4 then following points may be applied as protection against external touch voltage.
Use of non-conductive material for the outer walls (e.g. masonry) and avoidance of
earthed metal parts which can be touched from outside.
Potential grading by a horizontal earth electrode which is connected to the earthing
system, at a distance of approximately 1 m outside the outer wall and at a maximum depth
of 0.5 m.
Installation of the operation location: The layers of insulating material shall be of sufficient
size, so it means that it is impossible to touch the earthed conductive parts with the hand
from a location outside the insulating layer. If touching is possible only in lateral direction,
an insulating layer width of 1.25m is sufficient.
The insulation of the operating location is considered to be sufficient in the following cases.
A layer of asphalt with adequate base (e.g. gravel)
A layer of crushed stones with thickness of at least 100mm.
3.3.2. Method of calculating permissible touch voltages:
Figure 3.1 is allowable to use the calculation given below that takes into account of additional
resistances. e.g. footwear, superficial high resistivity materials.
Permissible touch voltage can be calculated in such a way.
( )
( )

18
Where,
= Permissible touch voltage
= Touch Voltage
= Fault duration
( ) = Body current limit (probability of ventricular fibrillation is less than 5%)
HF = Heart current factor
( ) = Body impedance
BF = Body factor
The body current is depends on the fault current and Body impedance not exceeded by 50 % of
the population. It depends on the touch voltage. Therefore calculation has to start with assumed
level For Heart current factor 1.0 is considered for left hand to feet. 0.4 is for hand to hand and 0.8
is for right hand to feet. In case of body factor 0.75 is considered for hand to both feet and 0.5 is
for both hands to feet. In case of additional resistance the formula that determines the
prospective permissible touch voltage will be:
( )
( ( ) )
= Prospective permissible touch voltage
= Additional foot resistance
= Additional hand resistance
3.3.3. Calculations of Permissible touch voltages:
In order to calculate the permissible touch voltage for high voltage installation without additional
resistance, the following hypotheses were made:
Current path hand to both feet
5 % probability of ventricular fibrillation
50 % probability of body impedance
No additional resistances
Fault duration (s) Body current (mA)
0,05 900
0,10 750
0,50 200
1,00 80 Table 3-2 Permissible body current depending on fault duration
19
In order to get the relevant permissible touch voltage, it is necessary to determine the total
human body impedance and this impedance value depends on the touch voltages and the current
path (Hand to hand or hand to foot).
Touch Voltage (V) Total human body Impedance(Ω)
25 3250
75 2000
125 1550
200 1275
500 850
1000 775 Table 3-3 Human body impedance related to the touch voltage for a current path hand to hand
To take in to account a hand to feet current path a correction factor of (consider 0.75) for body
impedance has to be applied. By combining these two tables and considering this correction
factor, it is possible to calculate the touch voltage limit for each value of the fault duration. The
results are shown in figure 3.1.
There are many possible solutions for the design of earthing system (referring to annex J of this
standard) but Soil covering layer and reduction factor are the most common.
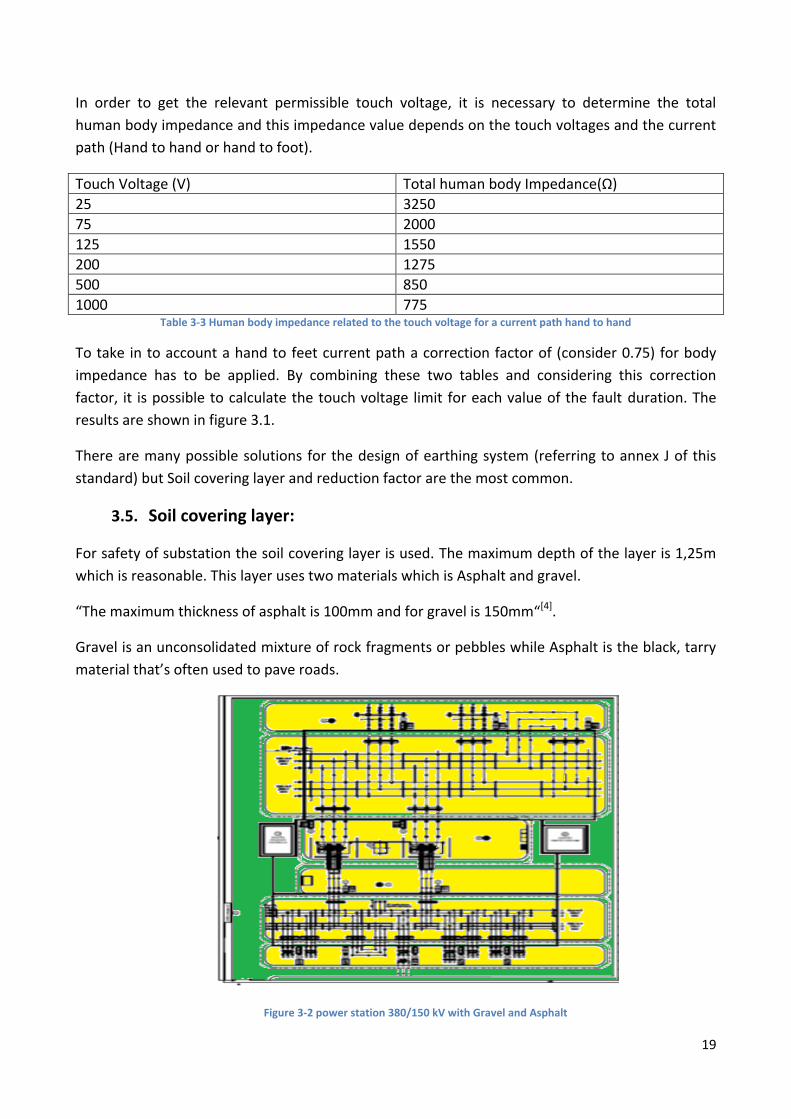
Soil covering layer: 3.5.
For safety of substation the soil covering layer is used. The maximum depth of the layer is 1,25m
which is reasonable. This layer uses two materials which is Asphalt and gravel.
“The maximum thickness of asphalt is 100mm and for gravel is 150mm“[4].
Gravel is an unconsolidated mixture of rock fragments or pebbles while Asphalt is the black, tarry
material that’s often used to pave roads.
Figure 3-2 power station 380/150 kV with Gravel and Asphalt

20
In the above Figure 3-2 power station 380/150 kV with Gravel and Asphalt, the green color shows the
gravel material while the yellow color shows the asphalt material. Both gravel and asphalt
materials are used where the safety of the substation is required.
Reduction factor 3.6.
When fault occurs in line, the current flow in that line will go back to the earth wire of
transmission line and earth wire of substation. So, the current that goes back to the earth wire of
transmission line can be calculated by reduction factor.
“The reduction factor of overhead lines with earth wires can be calculated as follows“ (1).
r =
= 1 -
( )
Where:
= Earth Return current
= Zero sequence current
= Mutual impedance per unit length between earth wire and line conductors with earth return
( )
= Earth wire impedance per unit length with earth return
(
) ( )
There are some examples to find the reduction factor and equivalent impedance described in the following subsections.
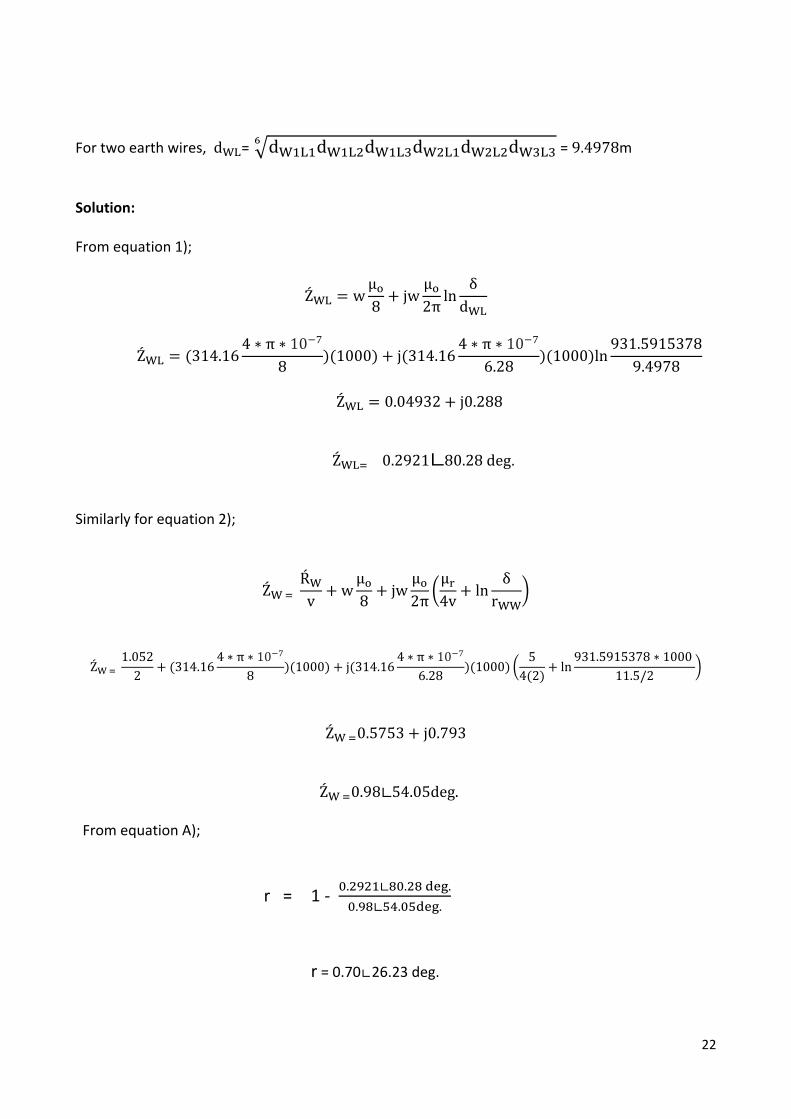
Steel core Earth Wire Aluminum Coated: 3.7.
Both wires are steel core earth wire. Hypothesis: Equivalent earth penetration depth
𝜹 =
√
=
√
= 931.5915378
Conductor
Earth Wire
Ig Rs
If

21
Figure 3-3 Tower Arrangement
In Figure 3-3 Tower Arrangement, the green color represents the conductors and yellow color represents the earth wire. W = angular frequency (W = 2𝛑f; f = 50 Hz)
= Earth wire resistance per unit length = 1.052
= distance between two earth wires
= Resistivity of ground = 100 m = earth wire radius = equivalent earth wire radius = 11.5mm = number of earth wires = 2 = Magnetic permeability =
= Relative permeability of the earth wire material =5
= geometric distance between earth wires and the line conductors
22
For two earth wires, = √
= m
Solution: From equation 1);
(
)( ) (
)( )
. Similarly for equation 2);
(
)
(
)( ) (
)( ) (
( )
)
From equation A);
r = 1 -
r = 0.70∟26.23 deg.

23
Driving Point Impedance: 3.7.1.
Driving point impedance composed of earth wire impedance between two towers with earth return
and the footing resistance of the overhead line towers
Figure 3-4 Driving point impedance
The driving point impedance for earth wire line will be equal to:
√
( )
= earth wire impedance per span length = = transmission tower footing earth resistance (10 ) From equation B);
√( ) ( )
( )
√
∟81.2 deg.
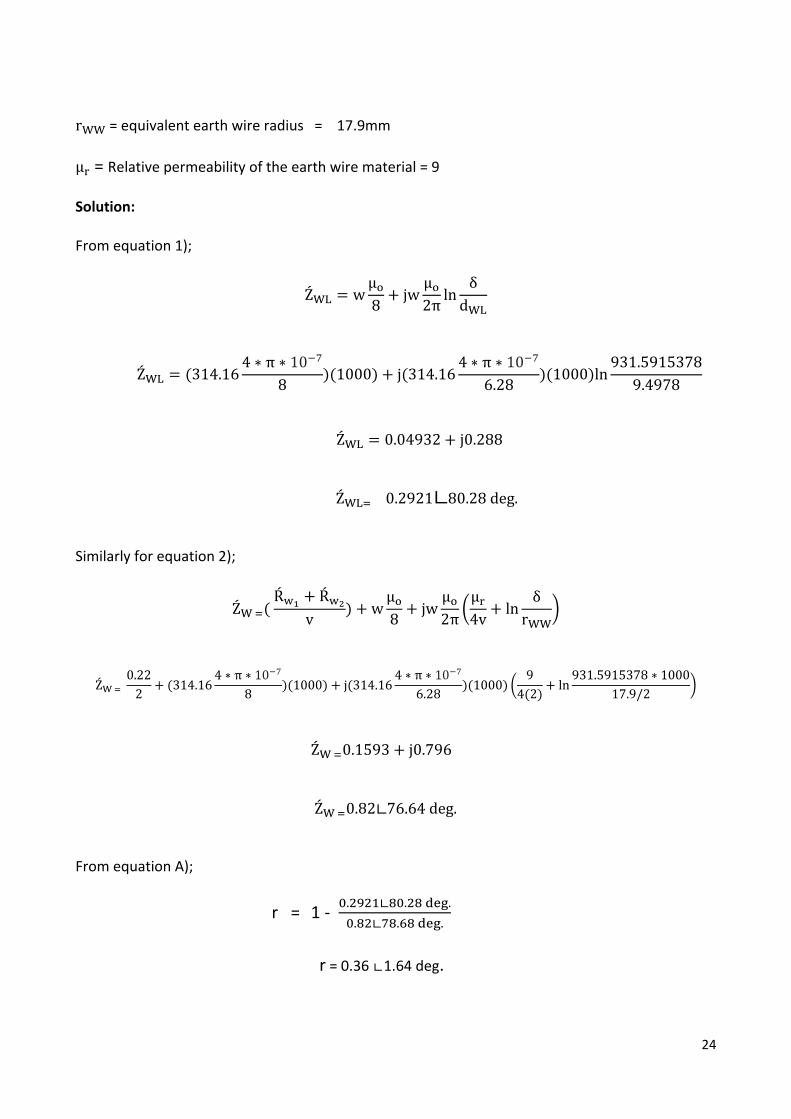
Optical fiber Core situated inside steel wires: 3.8.
Hypothesis: The first wire is optical fiber core and 2nd wire is steel core earth wire. The equivalent earth wire radius will be 17.9mm
= Earth wire resistance per unit length =
24
= equivalent earth wire radius = 17.9mm
= Relative permeability of the earth wire material = 9
Solution: From equation 1);
(
)( ) (
)( )
Similarly for equation 2);
(
)
(
)
(
)( ) (
)( ) (
( )
)
From equation A);
r = 1 -
r = 0.36 ∟1.64 deg.

25
Driving point impedance: 3.8.1.
The equivalent impedance for earth wire line will be equal to:
√
( )
From Equation B), = earth wire impedance per span length = = transmission tower footing earth resistance (10 ) From equation B);
√( ) ( )
( )
√
∟61.6 deg.
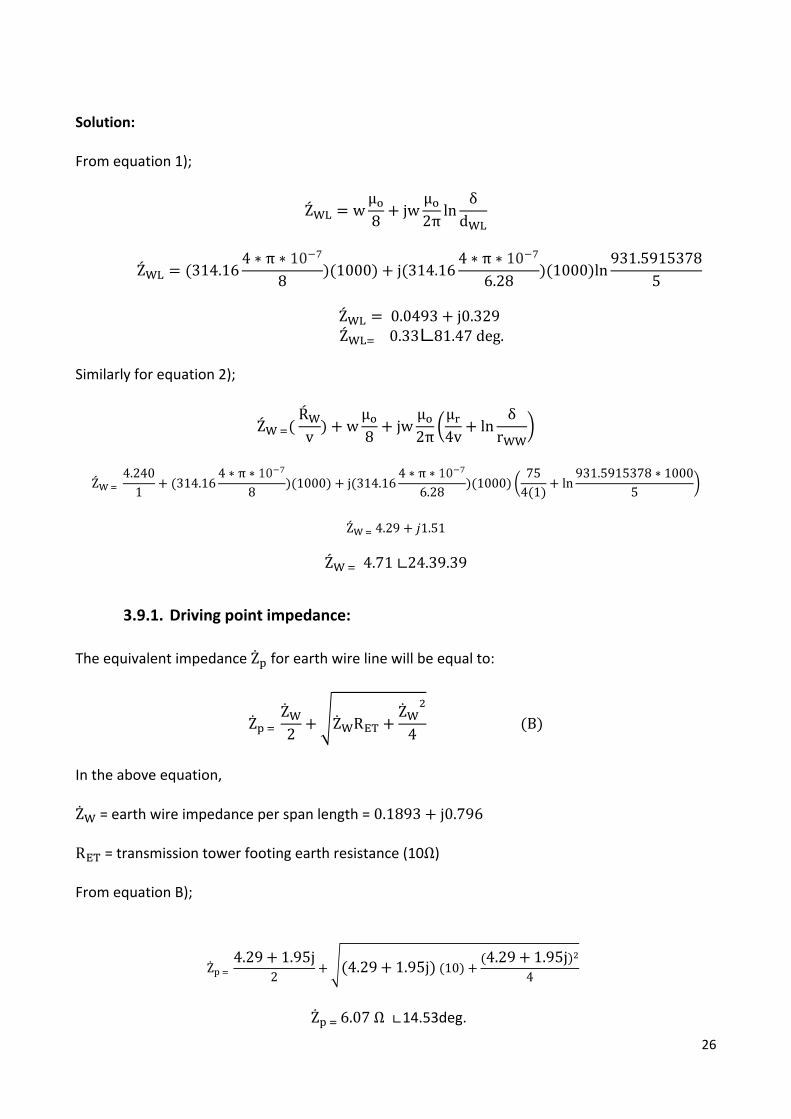
Steel core Earth Wire Zinc Coated: 3.9.
Hypothesis:
= Earth wire resistance per unit length = 4.240
= equivalent earth wire radius = 4.5mm
= Relative permeability of the earth wire material = 75
= geometric distance between earth wires and the line conductors = 5.0 m
= number of earth wires = 1
= Resistivity of ground = 100 m
26
Solution: From equation 1);
(
)( ) (
)( )
Similarly for equation 2);
( )
(
)
(
)( ) (
)( ) (
( )
)
Driving point impedance: 3.9.1.
The equivalent impedance for earth wire line will be equal to:
√
( )
In the above equation, = earth wire impedance per span length = = transmission tower footing earth resistance (10 ) From equation B);
√( ) ( )
( )
∟14.53deg.

27
American Standard: 3.10.
IEEE 80-2000: 3.10.1.
This standard is applicable for outdoor ac substations, either conventional, distribution, or gas
insulated, and it is also applicable to indoor portions of such substations or to substations that are
wholly indoors. It is concerned with safe grounding practices with power frequencies in the range
up to 60 Hz.
The main purpose is:
Establish, as a basis for design, the safe limits of potential difference that can exist in a substation
under fault conditions between points that can be touched by human body.
To review the substation grounding practices with special reference to safety and develop the
criteria for the safe design.
Provide a procedure for the design of practical grounding systems, based on these criteria.
Basic problem for safety in Grounding: 3.10.2.
The safe grounding design has the following two objectives:
To provide means to carry electric currents into the earth under normal and fault conditions
without exceeding any operating and equipment limits.
To assure that a person in the vicinity of grounding facilities is not exposed to critical electric
shock.
Requirements: 3.10.3.
The requirements for the grounding system in case of American standard are almost same which is
discussed in European standard. But there is some difference in case of touch and step voltage.
Tolerable Body Current Limits: 3.11.
“Fibrillation Current is assumed to be function of a person’s body weight. This idea comes from
studies undertaken by Dalziel (Dalziel 1946) “ (2).
Thus the formulas for allowable body current which can be survived by 99.5 % of persons are given
for two weights (50kg & 70kg).
=
√ for 50kg body weight
=
√ for 70kg body weight

28
Body Resistance: 3.12.
A constant value equal to 1000Ω is used for body resistance and this body resistance represents
from hand to feet and from hand to hand and from foot to foot.
Hand and foot contact resistances are neglected as well as glove and shoe resistances assumed
equal to zero.
Touch Voltage and Step voltage Criteria: 3.13.
The safety of a person depends on preventing the critical amount of shock energy from being
absorbed before the fault is cleared and the system de-energized. So the maximum driving voltage
of any accidental circuit should not exceed the limits defined as follows.
For touch voltage the limits will be:
( )
When body weight is considered 50kg then the following formula will be:
( )
√
But, when the body weight is 70kg
( )
√
In case of step voltage, the limits will be:
( )
When body weight is considered 50kg then the following formula will be:
( )
√
But, when the body weight is 70kg
( )
√
Where:
= correction factor
= resistivity of surface material

29
= duration of shock current in seconds
= touch voltage in V
= step voltage in V
If no protective surface layer is used, then and
By using above equations, the metal to metal touch voltage limits are derived from the touch
voltage equations.
Metal to metal contact, both hand to hand and hand to feet, will result in is zero. Therefore, the
total resistance of the accidental circuit is equal to body resistance .
With the substation of in the foot resistance, the metal to metal touch voltage limit will be
( )
√ =
√ when body weight is 50 kg.
( )
√ =
√ when body weight is 70 kg.
= Metal to metal touch voltage in V.
After calculate the touch as well as step voltage with American Standard then compare with touch
and step voltage (with European Standard). They have different value of voltage.

30
4. GSLAB Introduction 4.1.
GSLAB is powerful software that is used for grounding system, electromagnetic fields, interference
and lightning analysis and it takes into consideration both IEEE and IEC Standards.
It is composed by three modules which are as follows:
GSA
GSA_FD
XGSA_FD
GSA 4.1.1.
GSA is module for design and ground grid calculation. It can be used at low frequency (i.e. 50
Hz).This module can analyze the grounding networks composed by several electrodes and uses a
uniform and double layer soil model. Grid data can be imported from dxf files that give numerical
and graphical output which is useful for investigation of safe area, GPR, leakage current, Step and
Touch Voltage.
dxf (Drawing Interchange Format, or Drawing Exchange Format) is a CAD data file format
developed by Autodesk for enabling data interoperability between AutoCAD and other programs.
GSA Consider European Standard (EN 61936-1:2010 & EN 50522:2010) as well as American Standard (IEEE Std. 80-2000).
GSA_FD: 4.1.2.
GSA_FD is used for electromagnetic fields and interference evaluations for overhead and
underground systems and for fault current distribution calculations. “It can be used in a frequency
range between 0 and 1 MHz Even GSA FD consider both European standard and American
standard“[7]. It considers both resistive and inductive coupling between the conductors.
GSA_FD includes a module to calculate uniform or double layer soil equivalent models starting
from measured soil resistivity data.
XGSA_FD : 4.1.3.
XGSA_FD is a new module that extends the GSA_FD application field to the overhead systems
It can calculate electromagnetic fields and interference that take into account the overhead and
underground systems and fault current. XGSA_FD calculation model is directly derived from
GSA_FD.
31
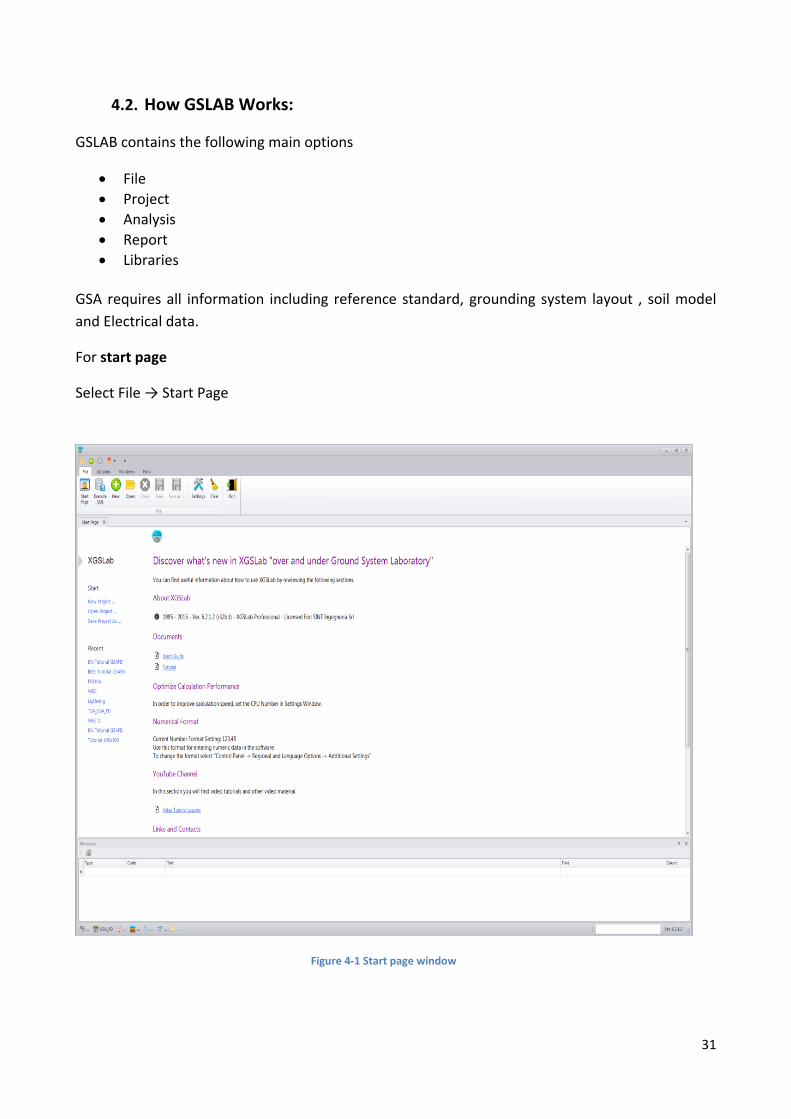
How GSLAB Works: 4.2.
GSLAB contains the following main options
File
Project
Analysis
Report
Libraries
GSA requires all information including reference standard, grounding system layout , soil model
and Electrical data.
For start page
Select File → Start Page
Figure 4-1 Start page window

32
When create a new Project, just select “File→ New
Figure 4-2 New Project Window
To create a new project, just enter the project name in the box and click “create” then the project
name will appear in program title bar.
In case of GSA Module, select project →module →GSA
For required project information, select the project → properties → project information
Figure 4-3 Project information window

33
Soil Model: 4.3.
GSLAB support the soil model and this model includes the resistivity, permittivity and
permeability.
Uniform Soil Model 4.3.1.
Project → soil data →uniform soil model
Figure 4-4 Uniform Soil model direct input
Double Layer soil Model 4.3.2.
Project →Soil data → double layer soil Model
Figure 4-5 Double layers Soil model direct input
Consider the resistivity of layer 1 and layer 2.The next step is to import the data from dxf file,

34
Import data 4.3.3.
Project →layout and Electrical data → data import
Data Import is an indispensable tool that allows loading a “dxf” file containing a system of
conductors and converted data in a numerical form.
When data is imported then will get a data list file and debug that file. This file is very useful to
verify the loaded data. Loaded data include spans and electrode.
Spans may represent a conductor (straight or catenary). If necessary, modify data in the extended
input data area by using edit span window.
Select the tab electrodes, inject the total current and then using edit window.
When debug is completed then apply and compute this data list file and find the GPR and Earthing
Impedance.
Step and Touch Voltage: 4.4.
Project →step and touch permissible voltage
Touch and Step Permissible Voltages depend on permissible body currents and body impedance.
Figure 4-6 Step and touch permissible voltage window

35
From Figure 4-6 in case of American standard (IEEE80-2000), insert the value of (clearing time)
and body weight (50 kg or 70 kg) and calculate the permissible touch voltage Ustp and permissible
step voltage Ussp.
When using European standard (IEC 50522; IEC 61936), insert the value of (clearing time) and
calculate the touch voltage Utp and step voltage Usp without human body weight and then analyze
the safe area, line calculation and area calculation.
36
5. Simulation Results Simulations on typical Substation Earthing Network: 5.1.
By using GSLAB software, the simulations of typical grounding network were carried out with
different values of soil resistivity and fault current that find the GPR and Earthing impedance, step
and touch voltage, line and Area Calculations.
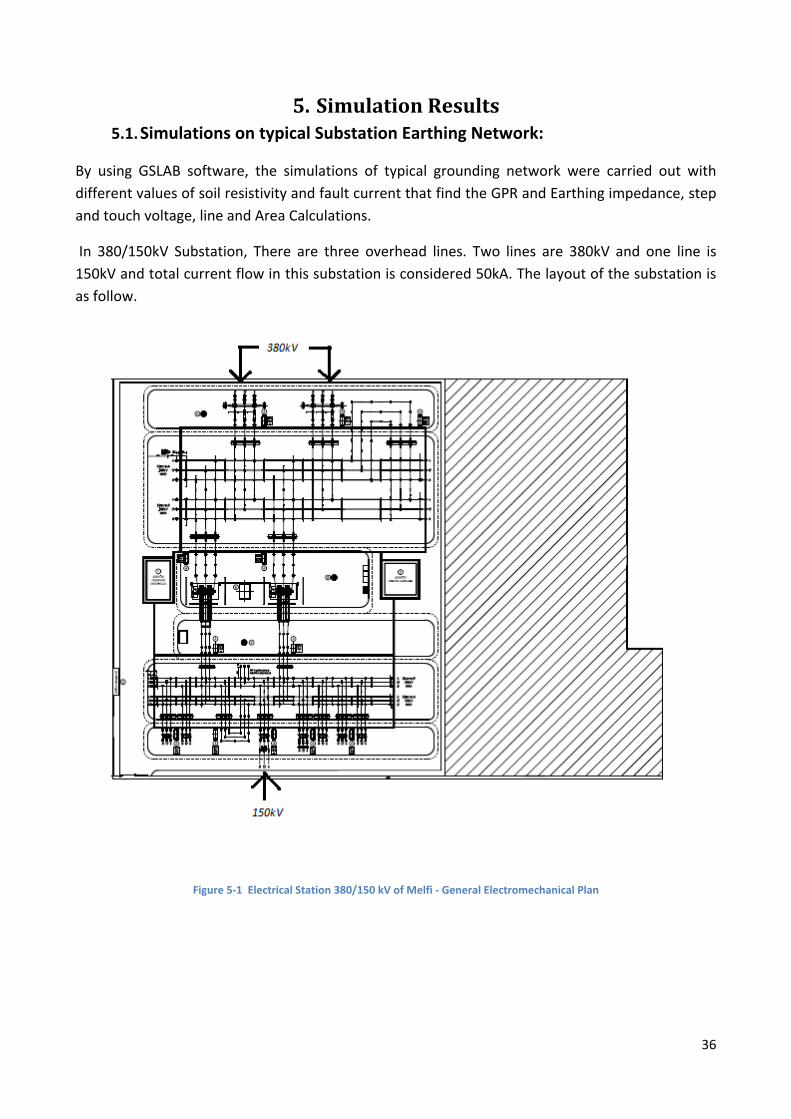
In 380/150kV Substation, There are three overhead lines. Two lines are 380kV and one line is
150kV and total current flow in this substation is considered 50kA. The layout of the substation is
as follow.
Figure 5-1 Electrical Station 380/150 kV of Melfi - General Electromechanical Plan

37
There are three cases, which considered for discuss the safety of substation.
Case A):
Nos. Uniform soil layer with Soil resistivity (Ωm)
Fault Current (kA)
1 100 50 2 100 50 Soil covering Layer
3 100 50 reduction Factor
4 100 50 reduction factor + soil covering layer
Using Uniform soil layer With 100 Ωm resistivity, the substation is good for safety. Then increase
the resistivity value (1000 Ωm) and check that the substation is good for safety or not.
Case B):
Nos. Uniform soil layer with Soil resistivity (Ωm)
Fault Current (kA)
1 1000 50
2 1000 50 Soil covering Layer
3 1000 50 Increasing mesh grid + soil covering layer
4 1000 50 reduction factor
5 1000 50 reduction factor + soil covering layer
First two cases are ok for safety of substation. In the next step,
Using double soil layer, the resistivity of first layer is considered 1000 Ωm and the 2nd layer is 100
Ωm.
Case C):
Nos. Double soil layer with Soil resistivity (Ωm)
Fault Current (kA)
1 Layer 1 = 1000 Layer 2 = 100
50 Soil covering Layer
2 Layer 1 = 1000 Layer 2 = 100
50 Rods (Length 5m)
3 Layer 1 = 1000 Layer 2 = 100
50 Increase rods length (10m)
4 Layer 1 = 1000 Layer 2 = 100
50 Increase rods with same length (10m)

38
European Standard (IEC 50522 IEC 61936) 5.2.
The simulations are done according to the European standard for the three cases discussed above.
The results are discussed below:
Case A) 5.2.1.
A-1) Uniform Soil Layer with resistivity 100Ωm and Fault Current 50kA:
GPR and Earthing Impedance;
The main goal is to the find the GPR and earthing Impedance. So with 50kA current, the GPR will
be 11274.97 V and the earthing resistance is 0.23 Ω.
Electrode Je[A] φ Je *deg.] Ue [V] φ Ue *deg.] Ue/Ʃ Je *Ω+ φ(Ue/ƩJe)*deg.]
1 50000 0.00 11274.97 000 0.23 0.00
Substation:
Figure 5-2 Substation

39
From Figure 5-2, inside the substation there are two small grids that are auxiliary service and
common control buildings. The mesh grid is thinner cross ponding to the buildings and places.
The colors represent the range of linear current density. At the center part of the grid, current
density is less because there are a lot of conductors but when go far from the center, current
density will be higher than center and at the edges / corner, Maximum current density will be
occur.
The current density range starts from 0 to 24 A/m. but the actual range starting from 0.3 to 22.89
A/m (See Figure 5-2 ).
Line Calculation:
Figure 5-3 Line calculation

40
From Figure 5-3 Line calculation the purple line that represents the reference touch voltage. The
green line represents the earthing potential. The light yellow line represents the touch voltage (Ut)
and the light blue line represents the step voltage (Us).
The dotted line represents the permissible step and touch voltages. The Step voltages are
everywhere below the permissible value but the touch voltages can be seen at some point but not
everywhere.
Touch Voltage:
After the Line calculation result then calculate the touch voltage, represented in Figure 5-4 Touch
Voltage
Figure 5-4 Touch Voltage

41
From Figure 5-4 Touch Voltage in every part of grid, touch voltage is almost same .It depends on
many factors (e.g. earthing resistivity, extension of grid). If there is large mesh grid network then
significant difference can be seen from point to point. The colors represent the distribution of
voltages.
Step Voltage:
Finally calculate the step voltage.
Figure 5-5 Step Voltage

42
Step voltage (Us) should be lower at the center part of grid and when goes far from the center
point the touch voltage would be higher.
Safe Area:
Figure 5-6 Safe area
When European standard is selected, both option Ut/Us and Uts / Uss can be used. But normally,
Ut/Us are used.
The green color represents the safe mode and yellow color represents the unsafe mode. The red
color which is not present in the above substation but it represents the hazardous mode.

43
At the center part of the grid, it is in safe mode (area) and when goes far from center part, the safe
area becomes less and at the edges/corner, there is no safe area. So it means that this substation
is not good for safety.
A-2) Uniform Soil Layer with resistivity 100Ωm, Fault Current 50kA and Soil covering layer :
GPR and Earthing Impedance;
GPR and Earthing impedance has the same value as already discussed in above case.
Line Calculation:
Figure 5-7 Line Calculation
With soil covering layer, the earthing potential has the same voltage Level, while the touch voltage has lower than the previous case and step voltage cannot be seen everywhere below the permissible value.
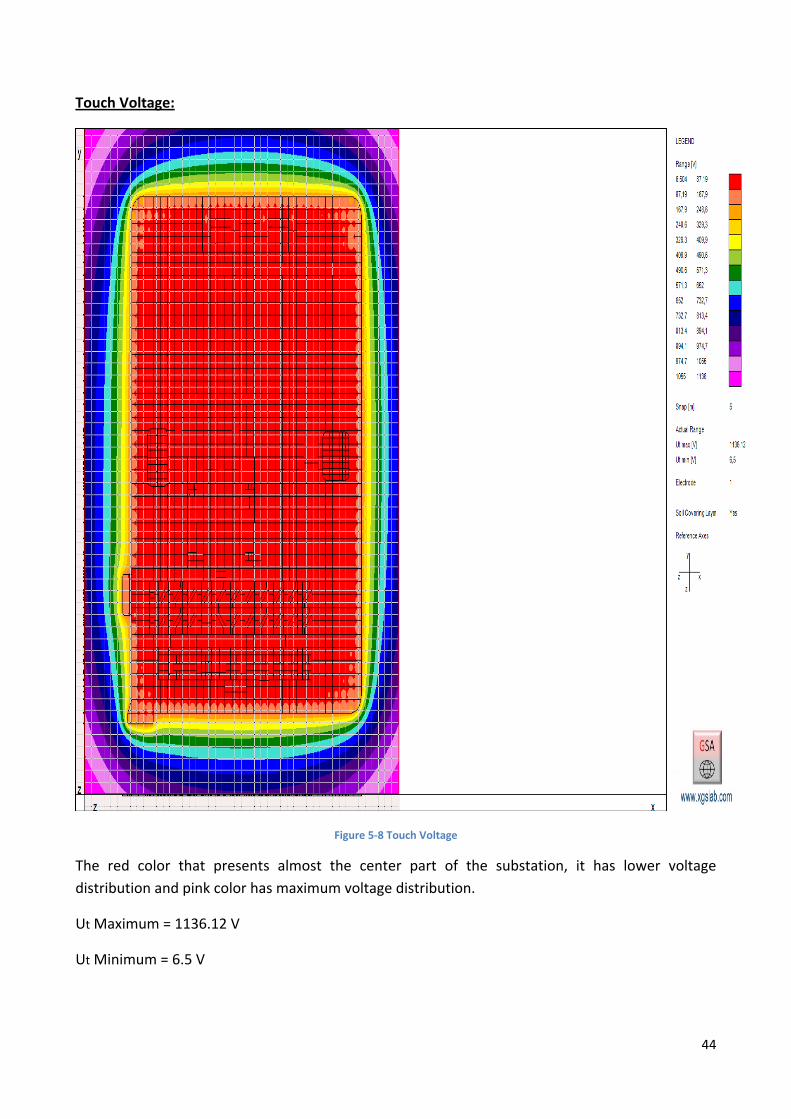
44
Touch Voltage:
Figure 5-8 Touch Voltage
The red color that presents almost the center part of the substation, it has lower voltage
distribution and pink color has maximum voltage distribution.
Ut Maximum = 1136.12 V
Ut Minimum = 6.5 V

45
Step Voltage:
Figure 5-9 Step Voltage
Similarly, for Step Voltage
Us Maximum = 32.85 V
Us minimum = 0 V

46
Safe Area with gravel:
To provide the safety of the substation, the first step is used the soil covering layer. The material
used for soil covering layer is gravel and Asphalt. In this case the resistivity value for gravel
material is considered 2000Ωm.
Figure 5-10 Safe area with gravel
With gravel material, this substation has all green area in center part, but still it is not good for
safety. Because the yellow color that represents the unsafe mode is still present.

47
Safe Area with gravel and Asphalt:
For Asphalt, the resistivity value is considered 10000 Ωm.
Figure 5-11 Safe area with gravel and Asphalt
In next step, using both asphalt and gravel material, the above substation has all green area and
there is no unsafe as well as hazardous mode. So it means that this substation is good for safety.

48
A-3) Uniform Soil Layer (100Ωm) With Reduction Factor: The total current in substation is considered 50kA. Due to fault, the current that flow in one line is considering 30kA and for 2nd line is 20kA (both two lines are 380kV) and for 3rd Line (which is 150kV) is considered zero. Even this 150kV line does not contribute to the fault current (for example, the circuit breaker of that line can be in open status), its earth wire is still connected to the earth grids at both ends. The line1 is considered the steel core material which is covered by aluminum and the 2nd line is considered the optical fiber core situated inside steel wires and the third line is considered steel core material which is covered by zinc coated. Using the above hypothesis and find the value of earthing current
Re[Ω] 0.23
Index IF[A] φ IF *deg.+ [r] φ r [deg.] Zp [Ω] φ Zp *deg.+
1 30.000 0.00 0.7 26.23 3.652 81.2
2 20.000 0.00 0.36 1.64 2.97 61.6
3 0.00 0.00 0.00 0.00 6.07 14.53
Ze[Ω] φ Ze*deg.+ Re[Ω] Ie[A] φ Ie *deg.+
0.22 7.10 0.23 25367.98 27.37
The Earthing Current (Ie) value will be equal to 25.4 kA. Now using this value of earthing current and repeat the simulation and calculate the all data again. GPR and Earthing Impedance:
Using the value of resistivity is 100 Ωm and earthing Current value is 25.4 KA.
Electrode Je[A] φ Je *deg.+ Ue [V] φ Ue *deg.+ Ue/Ʃ Je *Ω+ φ(Ue/ƩJe)*deg.+
1 26348.14 27.62 5941.49 27.62 0.23 0.00
In the above table, with Earthing Current the earthing resistance has the same value which is calculated in the previous case but GPR has different value.

49
Substation:
Figure 5-12 Substation
From Figure 5-12, the above earthing current value is used. The maximum linear current density in the substation is 12.06 A/m and minimum is 0.16 A/m.

50
Line Calculation:
Figure 5-13 Line Calculation
The Step voltages are everywhere below the permissible value and at the middle, the touch
voltages are also below the permissible value.

51
Safe Area:
Figure 5-14 Safe Area
Earthing Current value is used in this case which is almost half of the fault current value that supposed in the previous case but the above substation is still not good for safety because unsafe mode is still present at the edges.

52
A-4 ) Uniform Soil Layer (100Ωm) With Reduction Factor And Soil Covering Layer: GPR and Earthing Impedance:
With Soil Covering layer, the GPR and earthing Impedance has the same value. Line Calculation:
Figure 5-15 Line Calculation

53
With soil covering layer, earthing potential has same voltage level as already discussed in previous case but the voltage level of touch voltage is changed.(From Figure 5-15), the step voltage cannot be seen everywhere below the permissible value. Touch Voltage:
Figure 5-16 Touch Voltage
In this case with soil covering layer, Maximum touch voltage Ut = 1151.33 V Minimum touch voltage Us = 6.59 V

54
Step Voltage:
Figure 5-17 Step Voltage
For Step voltage with soil covering layer, Maximum Step voltage Us = 38.68 V Minimum Step voltage Us = 0 V

55
Safe Area with Gravel:
Figure 5-18 Safe Area with Gravel
When soil covering layer is used with gravel material, the above substation is in safe mode. There is no unsafe and hazardous mode, so now the above substation is good for safety.

56
Case B) 5.2.2.
B-1) Uniform Soil Layer with resistivity 1000 Ωm and Fault Current 50kA:
GPR and Earthing Impedance:
By using the above data, the goal is to find the GPR and earthing resistance.
Electrode Je[A] φ Je *deg.] Ue [V] φ Ue *deg.] Ue/Ʃ Je *Ω+ φ(Ue/ƩJe)*deg.]
1 50000.00 0.00 111655.80 0.00 2.23 0.00
Substation:
Figure 5-19 Substation
By changing the value of resistivity, the current density range is same as already discussed in case
A.

57
Line Calculation:
Figure 5-20 Line Calculation
When the soil resistivity value is changed, the earthing Potential has higher voltage level while the touch voltage has lower voltage level and step voltage can be seen somewhere below the permissible value.

58
Touch Voltage:
Figure 5-21 Touch Voltage
For Touch Voltage, The Maximum Ut = 25990.86 V The Minimum Ut = 148.8 V
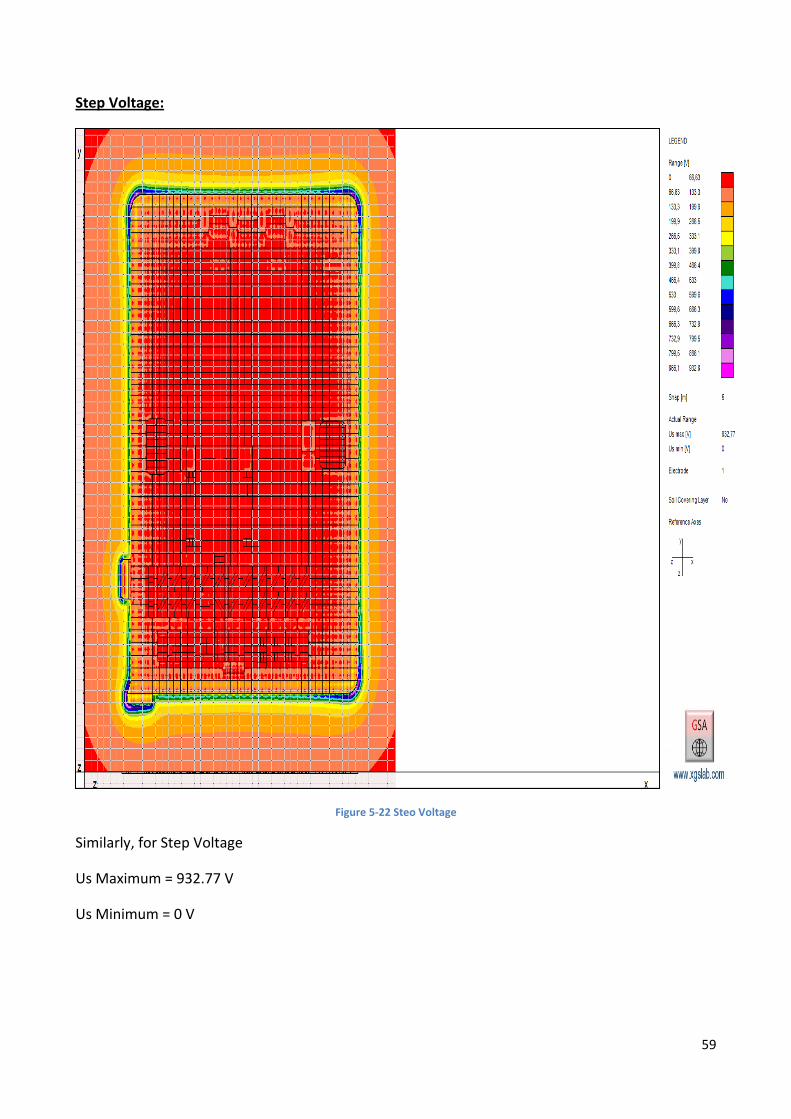
59
Step Voltage:
Figure 5-22 Steo Voltage
Similarly, for Step Voltage
Us Maximum = 932.77 V
Us Minimum = 0 V

60
Safe Area:
Figure 5-23 safe Area
When soil resistivity is consider very high, then there is no safe area. All the substations are in
unsafe mode and the edges/Corner of the substation are in hazardous mode. So this substation is
not good for safety.

61
B-2) Uniform Soil Layer with resistivity 1000 Ωm, Fault Current 50kA and Soil covering layer :
GPR and Earthing Impedance:
With Soil Covering layer, the GPR and earthing Impedance has the same value.
Line Calculation:
Figure 5-24 Line Calculation
With Soil Covering layer, earthing potential has same voltage level while the touch voltage has
different voltage level (as discussed in previous case) and step voltage cannot be seen everywhere
below the permissible value.

62
Safe Area with Gravel:
Figure 5-25 Safe Area with Gravel
When soil covering layer is used with gravel material, the substation that includes the center part
of the grid are in unsafe mode while the edges/ corner part are in hazardous mode. So this
substation is still not good for safety.

63
Safe Area with Gravel and Asphalt:
Figure 5-26 Safe Area with Asphalt
Using Soil covering layer with both asphalt and gravel material, some green part shown in center
part of the grid but the other part of the substation are still yellow.
It means that with both materials, this substation is still not good for safety, so the next step for
safety is to increase the mesh grid of the substation.

64
B-3) Uniform Soil Layer with resistivity 1000 Ωm, Fault Current 50kA ,Increasing Mesh Grid and
Soil covering layer :
GPR and Earthing Impedance:
With Soil Covering layer, the GPR and earthing Impedance has the same value. Substation:
Figure 5-27 Substation
When mesh grid is increased, the maximum current density is at the corner and it is equal to 21.94
A/m while the minimum current density is at center part of the grid and it is equal to 0.02 A/m.
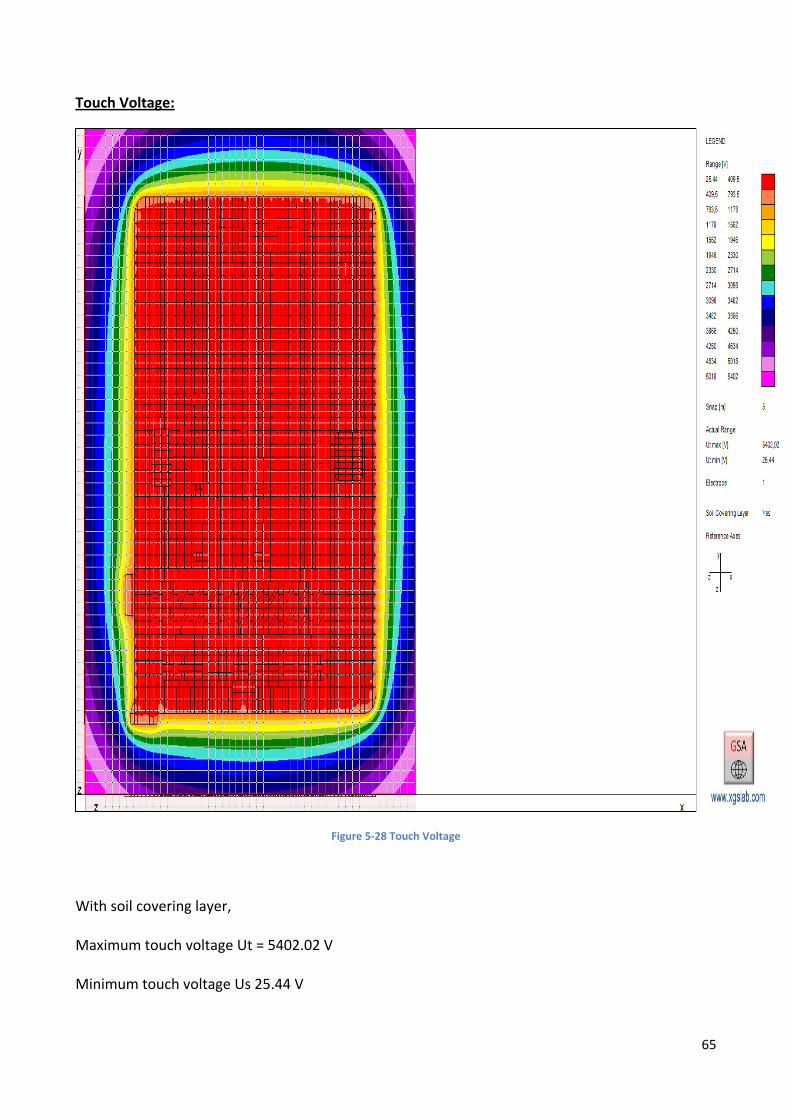
65
Touch Voltage:
Figure 5-28 Touch Voltage
With soil covering layer, Maximum touch voltage Ut = 5402.02 V Minimum touch voltage Us 25.44 V

66
Step Voltage:
Figure 5-29 Step Voltage
For Step voltage with soil covering layer, Maximum Step voltage Us 151.71 V Minimum Step voltage Us= 0 V

67
Safe Area with Gravel
When increasing the mesh grid, it means that more conductors are added and the voltage
between the feet is less and more chances for safety.
Figure 5-30 Safe Area with Gravel
Using soil layer with gravel material, some part of the grid are in safe mode while all the other part
of the substation are in unsafe mode and this substation is still not good for safety

68
Safe Area with Gravel and Asphalt:
Figure 5-31 Safe Area with Gravel and Asphalt
When using both asphalt and gravel material, the center part of the grid are in safe mode while
the corner and other part of the substation are still in unsafe mode.so still this substation is not
good for safety.

69
B-4) Uniform Soil Layer (1000 Ωm) With Reduction Factor And Soil Covering Layer:
The total current in substation is considered 50kA. Due to fault, the current that flow in one line is considering 30kA and for 2nd line is 20kA (both two lines are 380kV) and for 3rd Line (which is 150kV) is considered zero. Even this 150kV line does not contribute to the fault current (for example, the circuit breaker of that line can be in open status), its earth wire is still connected to the earth grids at both ends. The line1 is considered the steel core material which is covered by aluminum and the 2nd line is considered the optical fiber core situated inside steel wires and the third line is considered steel core material which is covered by zinc coated. Using the above hypothesis and find the value of earthing current
Re[Ω] 2.23
Index IF[A] φ IF *deg.+ [r] φ r *deg.+ Zp [Ω] φ Zp *deg.+
1 30.000 0.00 0.7 26.23 3.652 81.2
2 20.000 0.00 0.36 1.64 2.97 61.6
3 0.00 0.00 0.00 0.00 6.07 14.53
Ze[Ω] φ Ze*deg.+ Re[Ω] Ie[A] φ Ie *deg.+
1,16 41.07 2.23 12268.52 56.92
The Earthing Current (Ie) value will be equal to 12.3kA. Now using this value of earthing current and repeat the simulation and find all data again. GPR and Earthing Impedance:
Using the value of resistivity is 1000 Ωm and earthing Current value is 12.3 kA.
Electrode Je[A] φ Je *deg.+ Ue [V] φ Ue *deg.+ Ue/Ʃ Je *Ω+ φ(Ue/ƩJe)*deg.+
1 14442.06 61.58 32566.75 61.58 2.23 0.00
In the above table, the earthing resistance has the same value when the fault current is considered 50kA but GPR has different value.

70
Substation:
Figure 5-32 Substation
Using earthing current value, the maximum current density value in substation is 6.81 A/m and minimum current density value is 0.09 A/m.

71
Line calculation:
Figure 5-33 Line Calculation
With soil covering layer the earthing potential has higher voltage Level while the touch voltage has
very lower and step voltage cannot be seen below the permissible value.
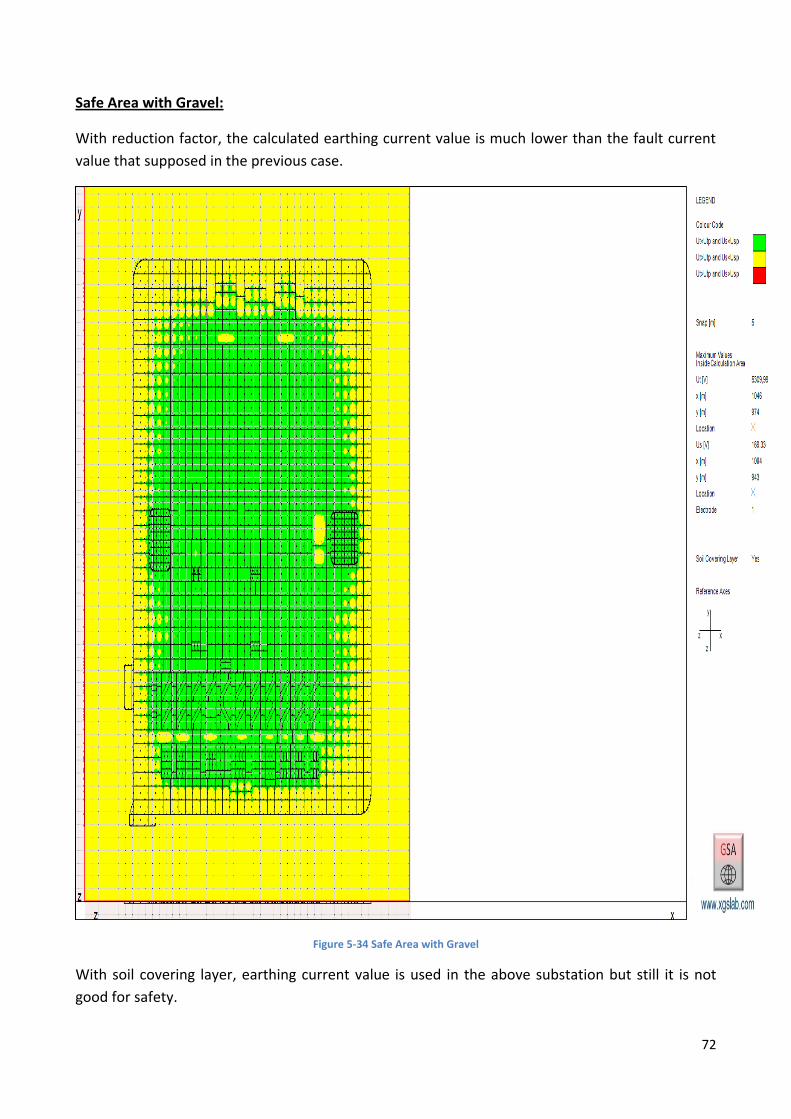
72
Safe Area with Gravel:
With reduction factor, the calculated earthing current value is much lower than the fault current
value that supposed in the previous case.
Figure 5-34 Safe Area with Gravel
With soil covering layer, earthing current value is used in the above substation but still it is not
good for safety.

73
Safe Area with Gravel Asphalt:
Figure 5-35 Safe Area with Gravel and Asphalt
Using Soil layer with both asphalt and gravel material. The center and the other part of the
substation are in safe mode while only corner/ edges of the substation are in still unsafe mode. So
this substation is still not good for safety. So the next step for the safety of substation is to
increase the mesh grid where the substation is unsafe.

74
B-5) Uniform Soil Layer (1000 Ωm) With Reduction Factor, Soil Covering Layer and Increasing
mesh Grid:
When mesh grid is increased, the GPR and earthing impedance has the same value as well as the
line calculation is almost same.
Substation:
Figure 5-36 Substation
In this case, increasing the mesh grid in those areas where the substation is not good for safety.
The maximum current density is 6.25A/m and Minimum current density is 0.4 A/m.
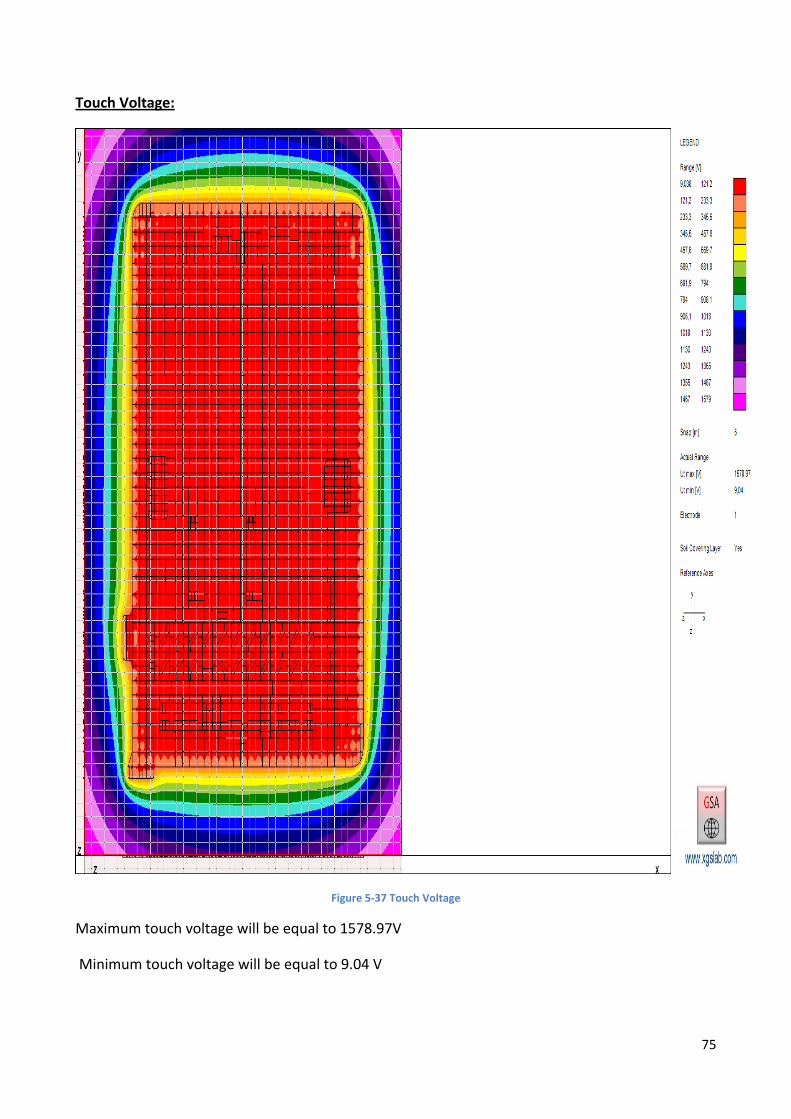
75
Touch Voltage:
Figure 5-37 Touch Voltage
Maximum touch voltage will be equal to 1578.97V
Minimum touch voltage will be equal to 9.04 V
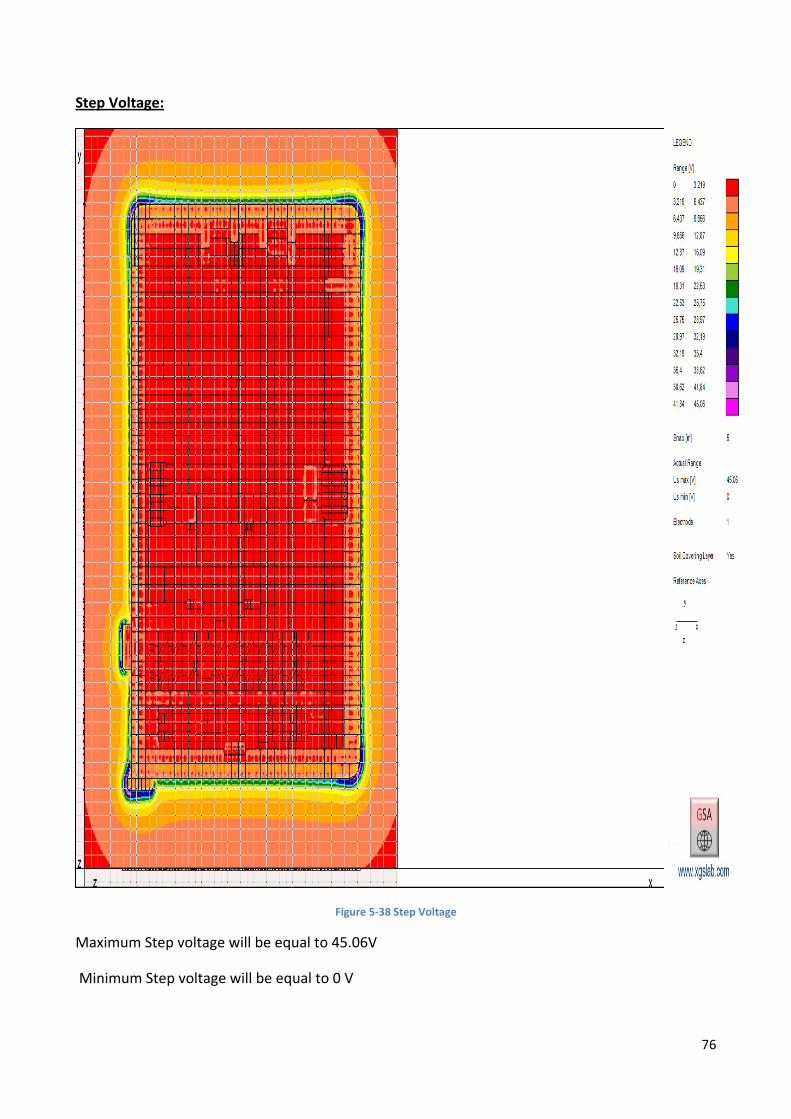
76
Step Voltage:
Figure 5-38 Step Voltage
Maximum Step voltage will be equal to 45.06V
Minimum Step voltage will be equal to 0 V

77
Safe Area with gravel:
Figure 5-39 Safe Area with Gravel
The above safe area with gravel is in good condition, if it is compare with the previous case. But
still it is not good for safety because unsafe mode is still there in the substation.

78
Safe Area with Gravel and Asphalt:
Figure 5-40 Safe Area Gravel and Asphalt
Finally, the substation has all green area, so there is no unsafe as well as hazardous mode and in
this case this substation is good for safety.
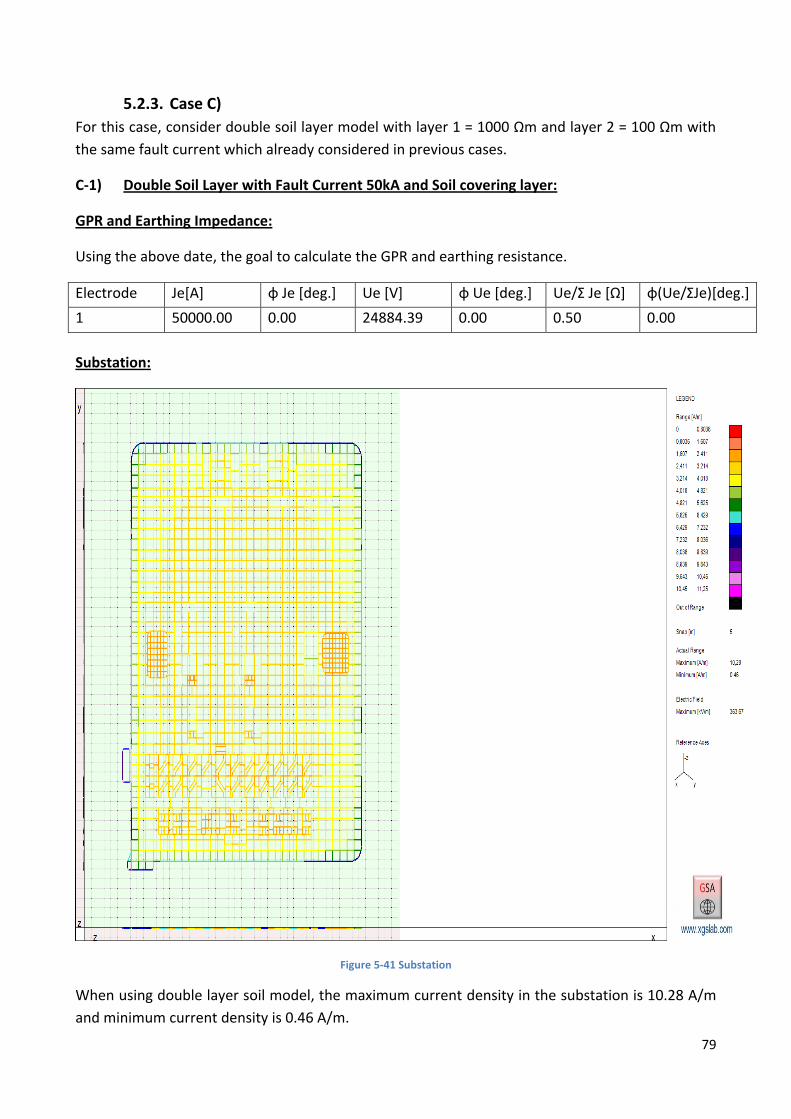
79
Case C) 5.2.3.
For this case, consider double soil layer model with layer 1 = 1000 Ωm and layer 2 = 100 Ωm with
the same fault current which already considered in previous cases.
C-1) Double Soil Layer with Fault Current 50kA and Soil covering layer:
GPR and Earthing Impedance:
Using the above date, the goal to calculate the GPR and earthing resistance.
Electrode Je[A] φ Je *deg.] Ue [V] φ Ue *deg.] Ue/Ʃ Je *Ω+ φ(Ue/ƩJe)*deg.]
1 50000.00 0.00 24884.39 0.00 0.50 0.00
Substation:
Figure 5-41 Substation
When using double layer soil model, the maximum current density in the substation is 10.28 A/m
and minimum current density is 0.46 A/m.

80
Line calculation:
Figure 5-42 Line Calculation
This line calculation figure is quite different because of double soil layer. The step voltage can be
seen everywhere below the permissible value and in some point touch voltage can also be seen
below the permissible value. In the middle part of touch voltage curve, there are a lot of variations
because the mesh grid is less thin.

81
Safe Area with Gravel:
Figure 5-43 Safe Area with Gravel
Using soil layer with gravel material, the yellow color represents the unsafe mode so the
substation is in unsafe mode and it is not good for safety.

82
Touch Voltage:
Figure 5-44 Touch Voltage
Maximum touch voltage will be equal to 1710.95V
Minimum touch voltage will be equal to 50.41 V
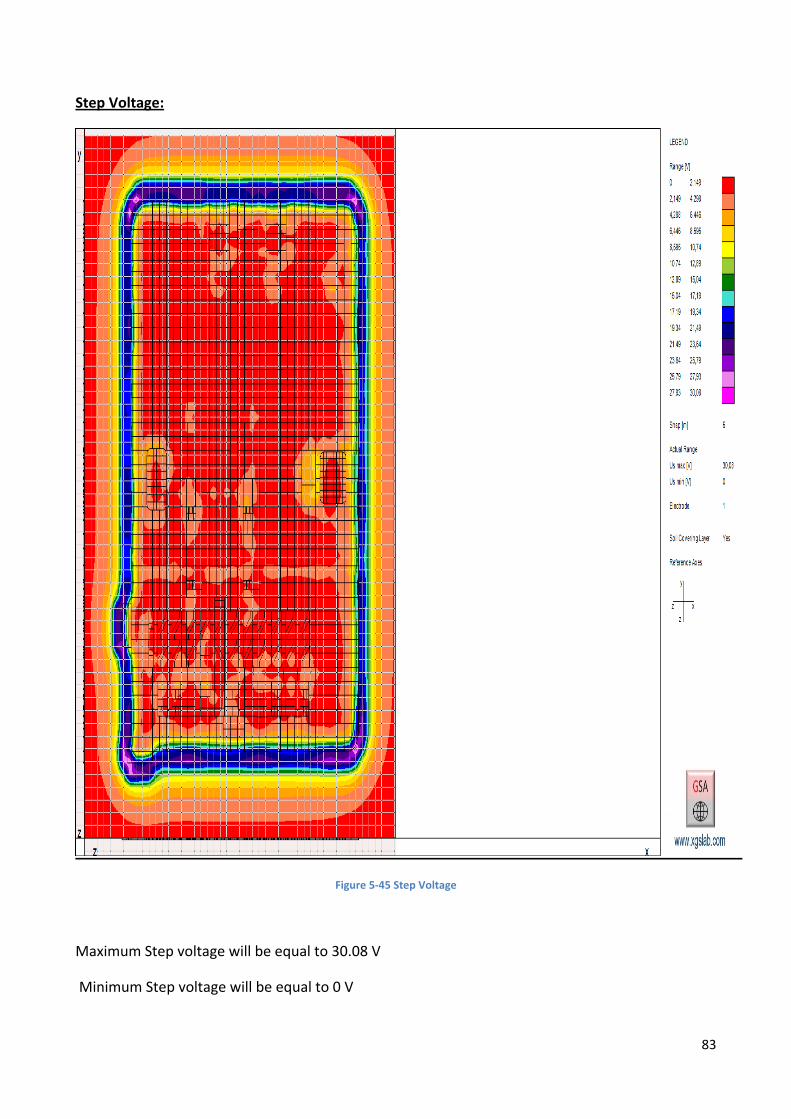
83
Step Voltage:
Figure 5-45 Step Voltage
Maximum Step voltage will be equal to 30.08 V
Minimum Step voltage will be equal to 0 V
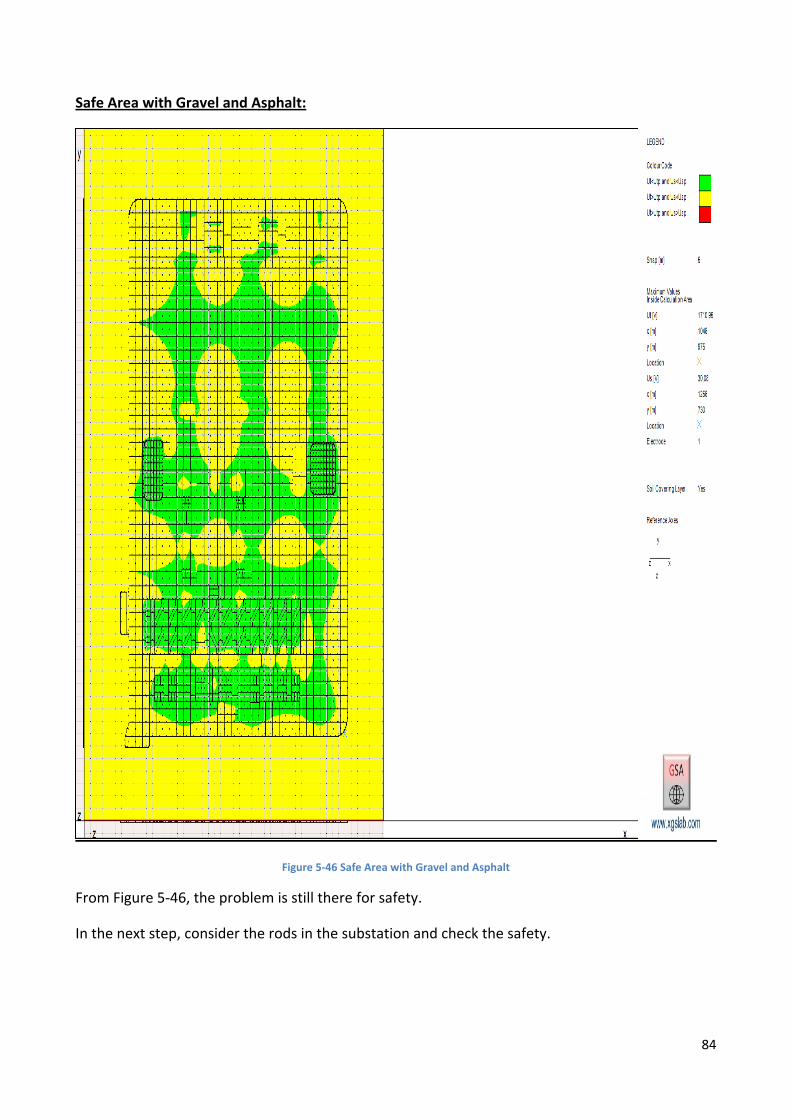
84
Safe Area with Gravel and Asphalt:
Figure 5-46 Safe Area with Gravel and Asphalt
From Figure 5-46, the problem is still there for safety.
In the next step, consider the rods in the substation and check the safety.

85
C-2) Double Soil Layer with Fault Current 50kA , Soil covering layer and Rods (length 5m):
In double soil Layer model, the resistivity of upper layer is very high and the lower layer is low.
Rods are used to reach the lower layer. These rods can reduce the grounding resistance. The
length of rods is considered 5m.
GPR and Earthing Impedance:
Using the above data, the goal to calculate the GPR and earthing resistance.
Electrode Je[A] φ Je *deg.] Ue [V] φ Ue *deg.] Ue/Ʃ Je *Ω+ φ(Ue/ƩJe)*deg.]
1 50000.00 0.00 24524.22 0.00 0.49 0,00
Because of rods, the earthing impedance and GPR has lower value than the previous case.
Substation:
Figure 5-47 Substation

86
When rods are used in substation then the maximum current density will be 15.07 A/m and
minimum current density will be 0.21 A/m.
Line Calculation:
Figure 5-48 Line Calculation
It is quite different than the previous case. The touch voltage has very lower voltage level while
the earthing potential has higher level of voltage. But at the middle part touch and step voltage
can be seen everywhere below the permissible value.
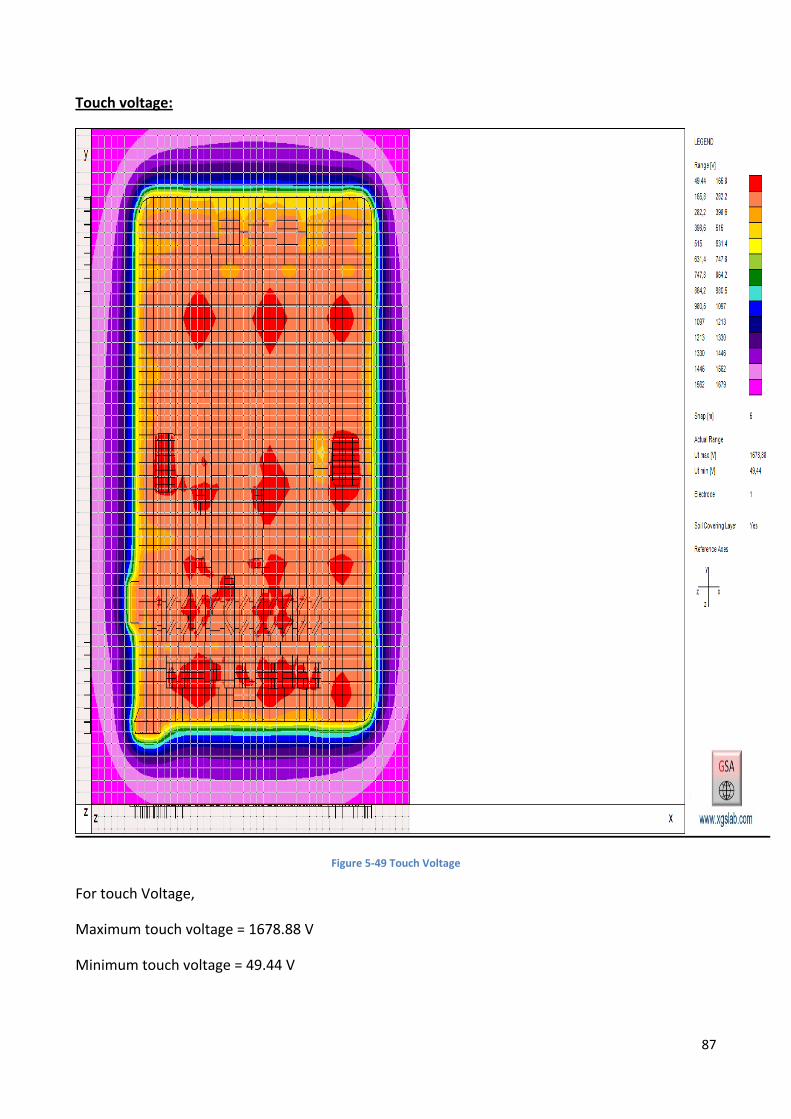
87
Touch voltage:
Figure 5-49 Touch Voltage
For touch Voltage,
Maximum touch voltage = 1678.88 V
Minimum touch voltage = 49.44 V

88
Step Voltage:
Figure 5-50 Step Voltage
Similarly For Step Voltage
Maximum Step voltage = 29.91 V
Minimum Step voltage = 0 V

89
Safe Area:
Figure 5-51 Safe Area
Using more rods in substation, but the problem is still there. Because the substation is still unsafe
mode so it is not good for safety.
The next step is to increase the rods length which is 10 m.
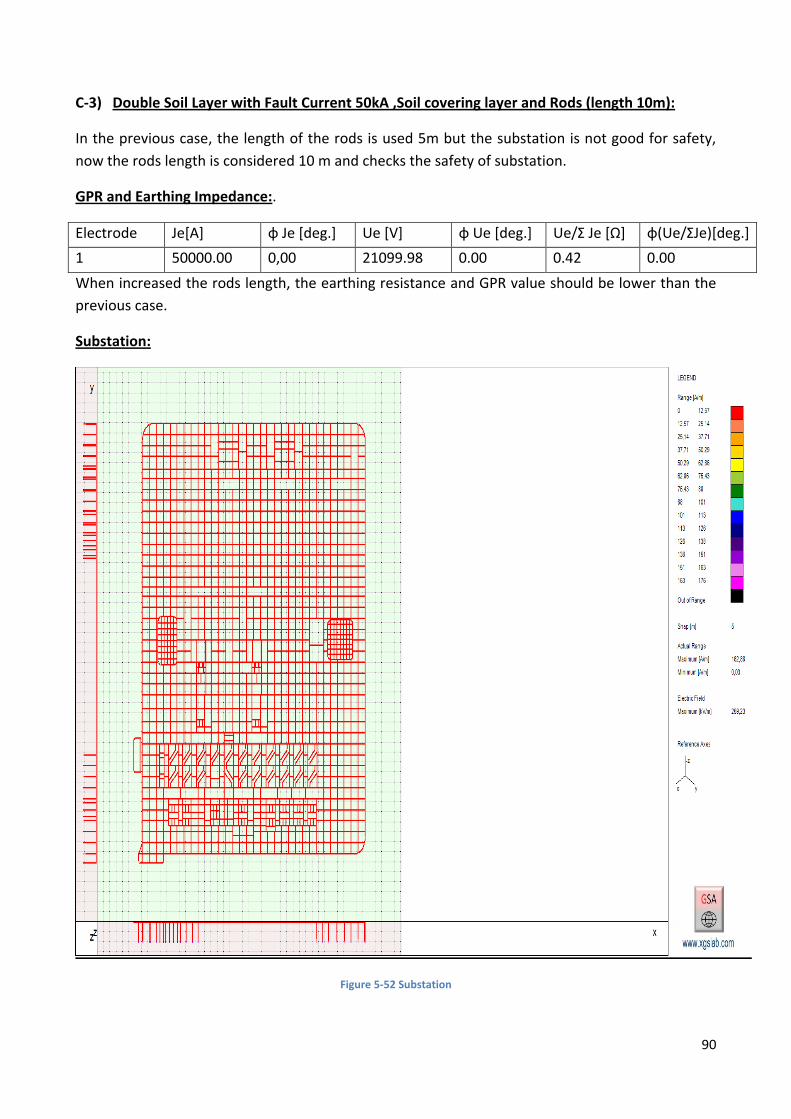
90
C-3) Double Soil Layer with Fault Current 50kA ,Soil covering layer and Rods (length 10m):
In the previous case, the length of the rods is used 5m but the substation is not good for safety,
now the rods length is considered 10 m and checks the safety of substation.
GPR and Earthing Impedance:.
Electrode Je[A] φ Je *deg.] Ue [V] φ Ue *deg.] Ue/Ʃ Je *Ω+ φ(Ue/ƩJe)*deg.]
1 50000.00 0,00 21099.98 0.00 0.42 0.00
When increased the rods length, the earthing resistance and GPR value should be lower than the
previous case.
Substation:
Figure 5-52 Substation
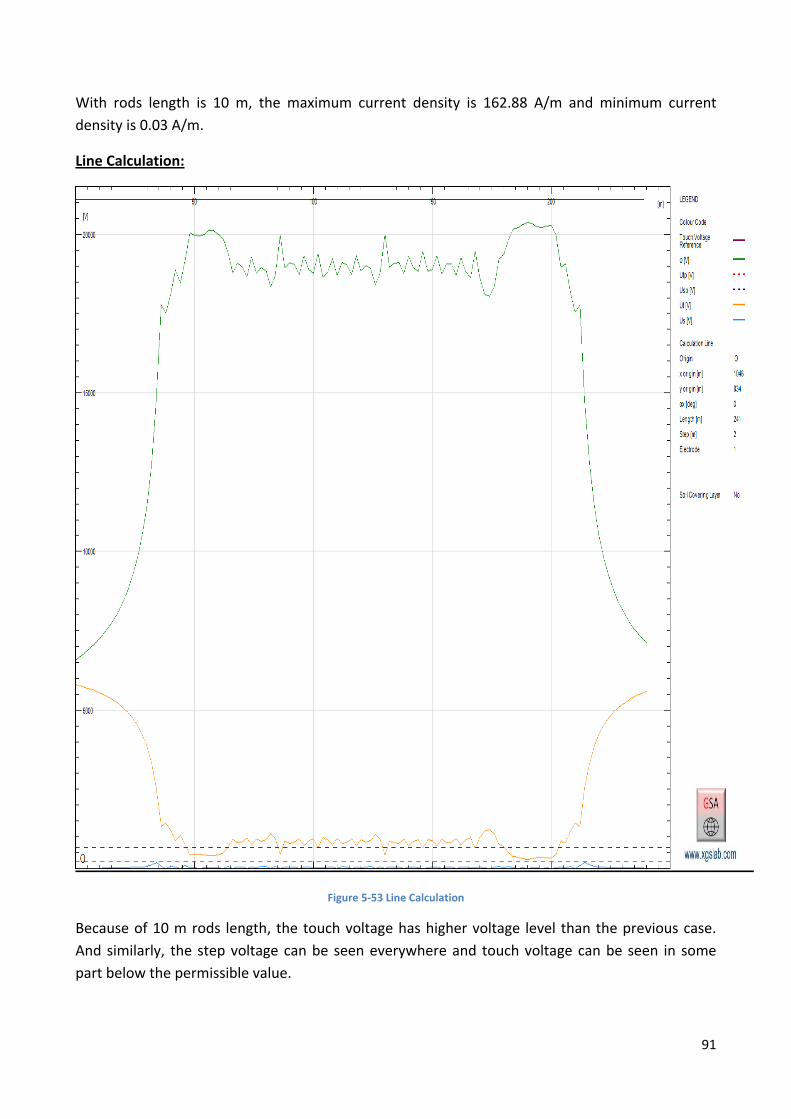
91
With rods length is 10 m, the maximum current density is 162.88 A/m and minimum current
density is 0.03 A/m.
Line Calculation:
Figure 5-53 Line Calculation
Because of 10 m rods length, the touch voltage has higher voltage level than the previous case.
And similarly, the step voltage can be seen everywhere and touch voltage can be seen in some
part below the permissible value.
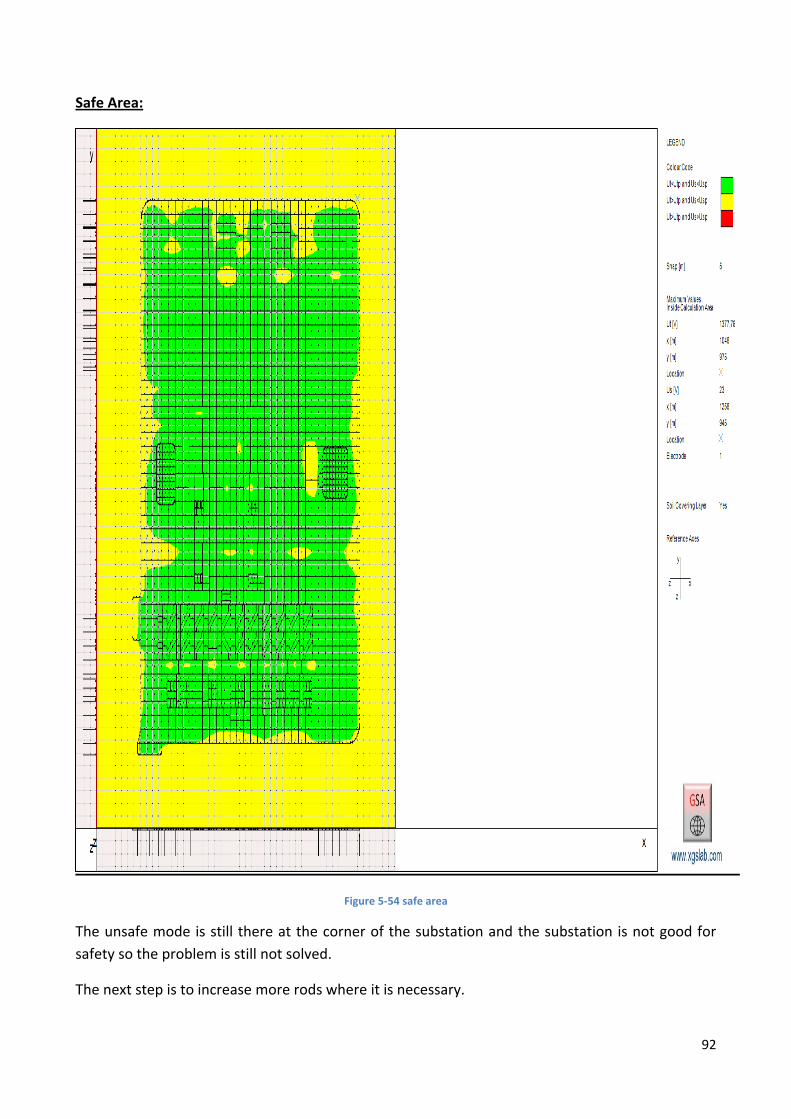
92
Safe Area:
Figure 5-54 safe area
The unsafe mode is still there at the corner of the substation and the substation is not good for
safety so the problem is still not solved.
The next step is to increase more rods where it is necessary.
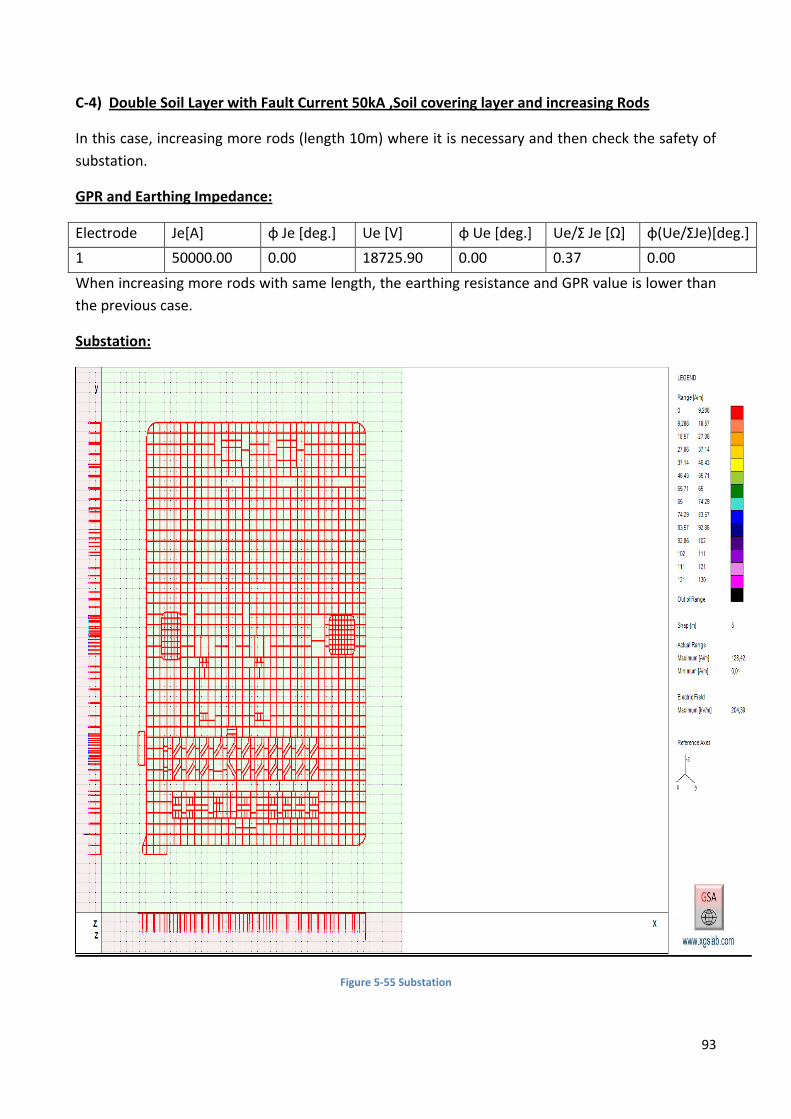
93
C-4) Double Soil Layer with Fault Current 50kA ,Soil covering layer and increasing Rods
In this case, increasing more rods (length 10m) where it is necessary and then check the safety of
substation.
GPR and Earthing Impedance:
Electrode Je[A] φ Je *deg.] Ue [V] φ Ue *deg.] Ue/Ʃ Je *Ω+ φ(Ue/ƩJe)*deg.]
1 50000.00 0.00 18725.90 0.00 0.37 0.00
When increasing more rods with same length, the earthing resistance and GPR value is lower than
the previous case.
Substation:
Figure 5-55 Substation
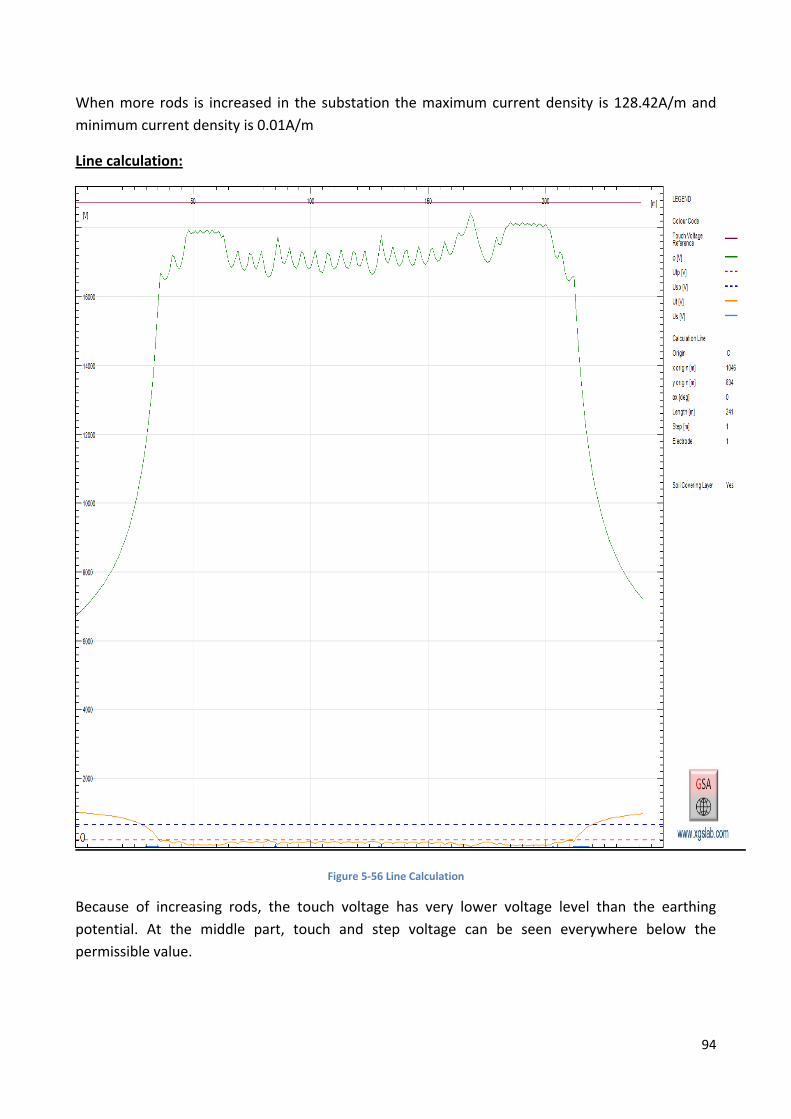
94
When more rods is increased in the substation the maximum current density is 128.42A/m and
minimum current density is 0.01A/m
Line calculation:
Figure 5-56 Line Calculation
Because of increasing rods, the touch voltage has very lower voltage level than the earthing
potential. At the middle part, touch and step voltage can be seen everywhere below the
permissible value.

95
Touch Voltage:
Figure 5-57 Touch Voltage
Its maximum touch voltage is 1178.06 V
And Minimum touch voltage is 18.48 V

96
Step Voltage:
Figure 5-58 Step Voltage
Similarly for step voltage
Its maximum step voltage is 28.91 V
And minimum step voltage is 0 V

97
Safe Area:
Figure 5-59 Safe Area
Finally, the whole substations are in safe mode, there is no unsafe as well as hazardous mode. So
now this substation is good for safety. It means that, if a person who touch this substation he will
be safe.

98
American Standard (IEEE 80 – 2000) 5.3.
In this case, considered only one case and compare this case with European standard.
Nos. Soil resistivity (Ωm) Fault Current (kA)
1 100 50
2 100 50 Soil covering Layer
01) Uniform Soil Layer with resistivity 100Ωm and Fault Current 50kA:
GPR and Earthing Impedance;
The main goal is to the find the GPR and earthing resistance. So with 50kA current, the GPR will be
11274.97 V and the earthing impedance is 0.23 Ω.
Electrode Je[A] φ Je *deg.] Ue [V] φ Ue *deg.] Ue/Ʃ Je *Ω+ φ(Ue/ƩJe)*deg.]
1 50000.00 0.00 11274.97 0.00 0.23 0.00
Substation:
Figure 5-60 Substation

99
From Figure 5-60 Substation it can be seen that at the center part of the grid, there is less current
density, but at the edges / corner, maximum current distribution will be occur.
In this figure, the Current density range starting from 0 to 24 A/m. But the actual range starts from
0.3A/m to 22.89 A/m.
Line Calculation:
Figure 5-61 Line Calculation
The purple line that represents the “reference touch voltage”. The green line represents the
earthing potential. The red line represents the touch voltage (Ut) and the light blue line represents
the step voltage (Us).
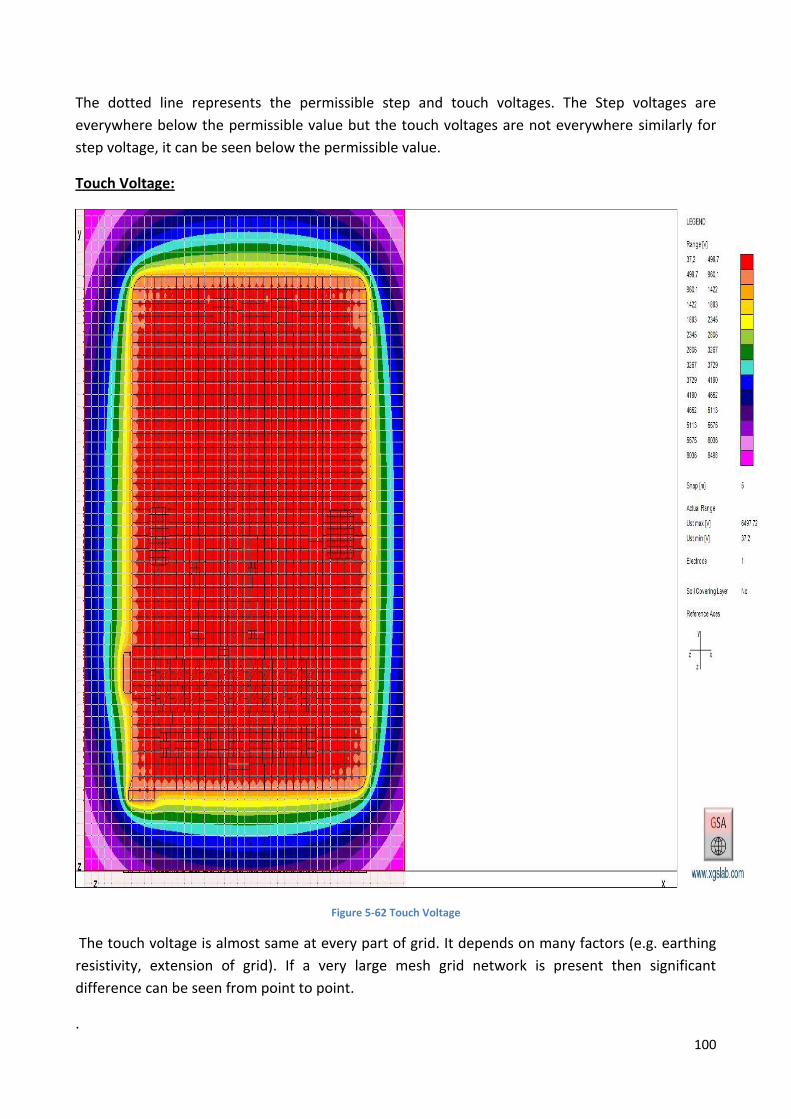
100
The dotted line represents the permissible step and touch voltages. The Step voltages are
everywhere below the permissible value but the touch voltages are not everywhere similarly for
step voltage, it can be seen below the permissible value.
Touch Voltage:
Figure 5-62 Touch Voltage
The touch voltage is almost same at every part of grid. It depends on many factors (e.g. earthing
resistivity, extension of grid). If a very large mesh grid network is present then significant
difference can be seen from point to point.
.

101
Step Voltage:
Figure 5-63 Step Voltage
From figure 5-63,Step voltage should be lower at the center part of grid and when goes far from the
center point the touch voltage would be higher.

102
Safe Area:
Figure 5-64 Safe Area
When American Standard is selected, only Ust / Uss option can be used. The green color which is
present on the center part of grid that represent the safe area but there is some part of yellow
color show in near the center part and also on the boundary that represent the unsafe area and
the red color which represent the on the edges that represent that hazardous area.

103
02) Uniform Soil Layer with resistivity 100Ωm , Fault Current 50kA and soil covering Layer:
GPR and Earthing Impedance;
With soil covering layer, GPR and earthing Impedance has the same value as well as line
calculation has same result which I discussed in the previous case.
Touch voltage:
Figure 5-65 Touch Voltage
With soil covering layer the touch voltage will be Maximum touch voltage Ust = 6497.72 V Minimum touch voltage Ust = 37.2 V

104
Step Voltage:
Figure 5-66 Step Voltage
For Step voltage with soil covering layer, Maximum Step voltage Uss = 652.94 V Minimum Step voltage Uss = 0 V

105
Safe Area with Gravel Material:
Figure 5-67 Safe Area with Gravel Material
Using soil covering layer with gravel material the above substation is much better than the previous case. But it is still not good for safety.
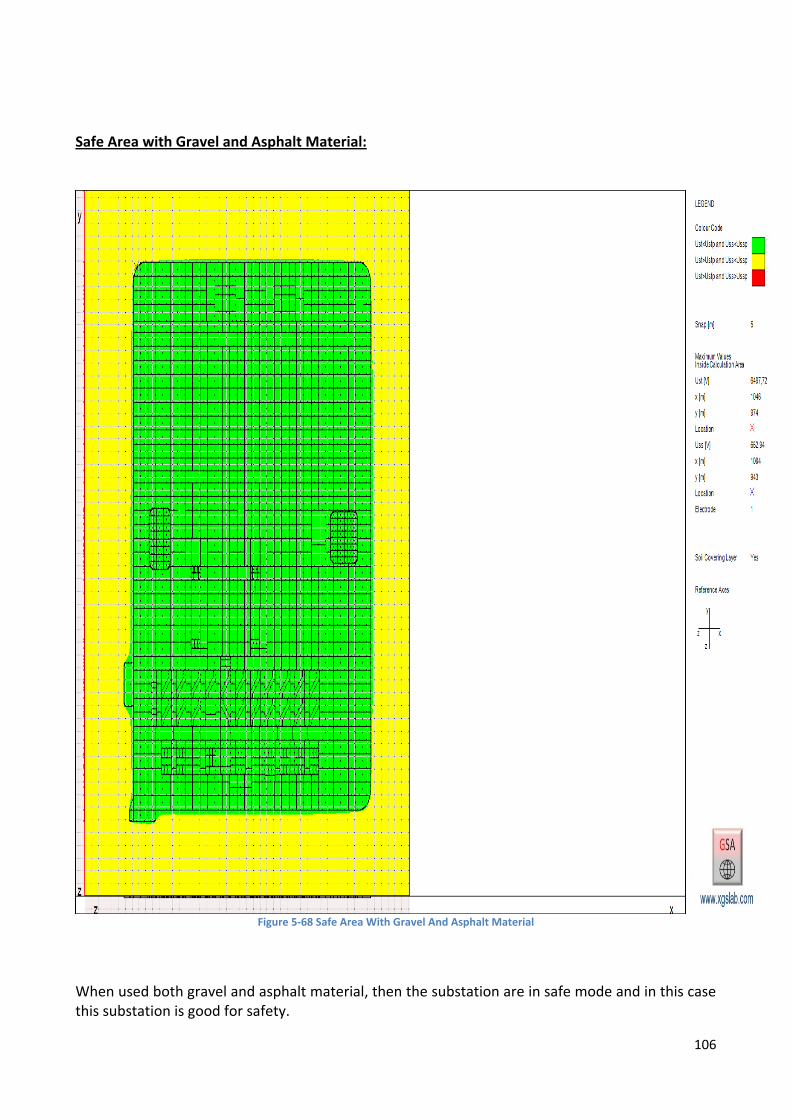
106
Safe Area with Gravel and Asphalt Material:
Figure 5-68 Safe Area With Gravel And Asphalt Material
When used both gravel and asphalt material, then the substation are in safe mode and in this case this substation is good for safety.

107
6. Comparison between European and American Standard When compare the results, there is no much difference between (IEC 50522; IEC 61936)
And (IEEE 80 – 2000)
The difference between American and European standard is the calculation of safe current, body
impedance and hence the safety level of touch and step voltage.
1. Body Impedance
The value of body resistance is fixed in case of IEEE while on the other hand; the value of
body resistance is variable in case of IEC.
2. Prospective permissible touch and step voltages:
The main difference for prospective permissible touch and step voltages in both standards is the
calculations.
In IEC/EN; Prospective permissible touch voltage is calculated (with and without soil covering
layer) through the following procedure:
When soil covering layer is not used
( )
( )
When soil covering is used then it will be:
( )
( )
But In IEEE, Prospective permissible touch voltage is calculated (with and without soil covering
layer) through the following procedure:
When soil covering layer is not used
( )
( )
Where
k is 0.116 or 0.157 for a 50 or 70kg body weight

108
When soil covering is used then it will be:
( )
( )

109
7. Conclusions: To study the HV substation grounding network design at Melfi, three different cases were created for simulations and then checked for the safety of grounding system. In 1st Case, simulation is performed for a 100 Ωm resistivity value and fault current of 50kA with soil covering layer, the HV substation is tested for safety and is found to be safe.
In 2nd Case, simulation is done with resistivity 1000 Ωm, same fault current of 50kA and soil
covering layer, and the results show that the HV substation is unsafe due to the high resistivity.
To increase the safety of substation the mesh grid is increased where necessary, but the
substation is still not good for safety. On the other hand, using reduction factor for the substation
with same resistivity value and soil covering layer, HV substation is good for safety.
In 3rd case, For the Double soil layer, increasing the resistivity of first layer to 1000 Ωm and second
layer to 100 Ωm with same fault current of 50KA for both, it is concluded that the use of rods
(length 10 m) is necessary for the safety of substation.
I observed that increasing mesh grid does not give very good results and as well as it is very expensive. While on the other hand, inserting rods give very good results and it is much cheaper than increasing mesh grid. It is also more reliable, efficient and safer method.
110
8. References:
[1]. Short-circuit calculations in networks with distributed generation. Boutsika, Thekla N and
Papathanassiou, Stavro A. 7, 2008, Vol. 78.
[2]. IEEE Guide for Safety in AC Substation Grounding. Sverak, Jiri G and Laird, Donald N. s.l. : IEEE Std,
2000.
[3]. Optimal Design of Grounding System for HV/EHV Substations in Two Layered Soil. Vyas, Kaustubh A and
Jamnani, JG. 5, 2012, Vol. 2.
[4]. Karim, Azad Faraj. Grounding System Design and Planning. s.l. : Kurdistan Engineering Union.
[5]. Seasonal influences on safety of substation grounding system. He, Jinliang, et al., et al. 3, s.l. : IEEE,
2003, Vol. 18.
[6]. SINT Ingegneria. [Online] ttp://www.sintingegneria.com/index.php/en/gsa .
[7]. Earthing of power installations exceeding 1 kV ac. Tommasini , Riccardo. s.l. : Italian Electrotechnical
Committee (IEC), 2011.
[8]. Probabilistic comparison and application of international electrical safety criteria. Carman, WD. s.l. :
IEEE, 2000, Vol. 3.
[9]. Verification of global earthing systems. Fickert, Lothar and Schmautzer, Ernst. 2013.
[10]. http://www.esgroundingsolutions.com/. [Online] http://www.esgroundingsolutions.com/ground-
potential-rise-studies/.

111
9. Appendix: A: Uniform Soil Layer (100Ωm) With Reduction Factor
Appendix A1:
Touch Voltage:
For Touch Voltage, The Maximum Ut = 2977.44 V The Minimum Ut = 17.06 V

112
Appendix A2:
Step Voltage:
Similarly, for Step Voltage
Us Maximum = 215.06 V
Us Minimum = 0 V
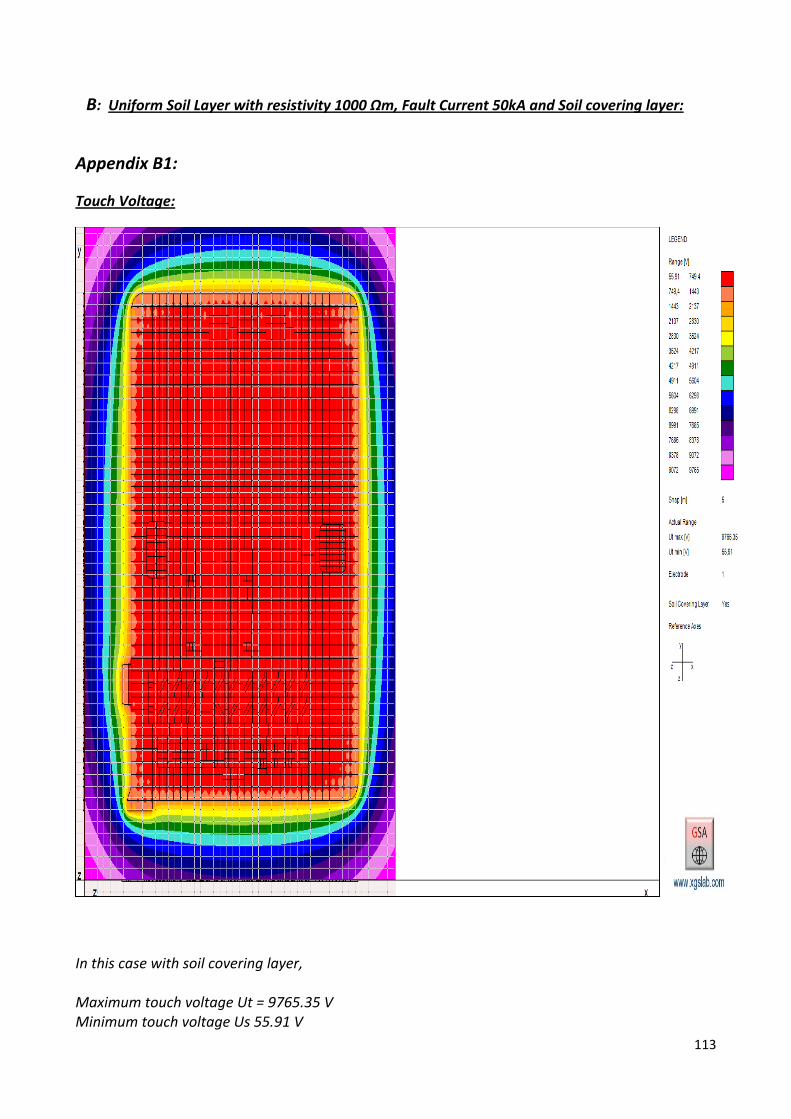
113
B: Uniform Soil Layer with resistivity 1000 Ωm, Fault Current 50kA and Soil covering layer:
Appendix B1:
Touch Voltage:
In this case with soil covering layer, Maximum touch voltage Ut = 9765.35 V Minimum touch voltage Us 55.91 V
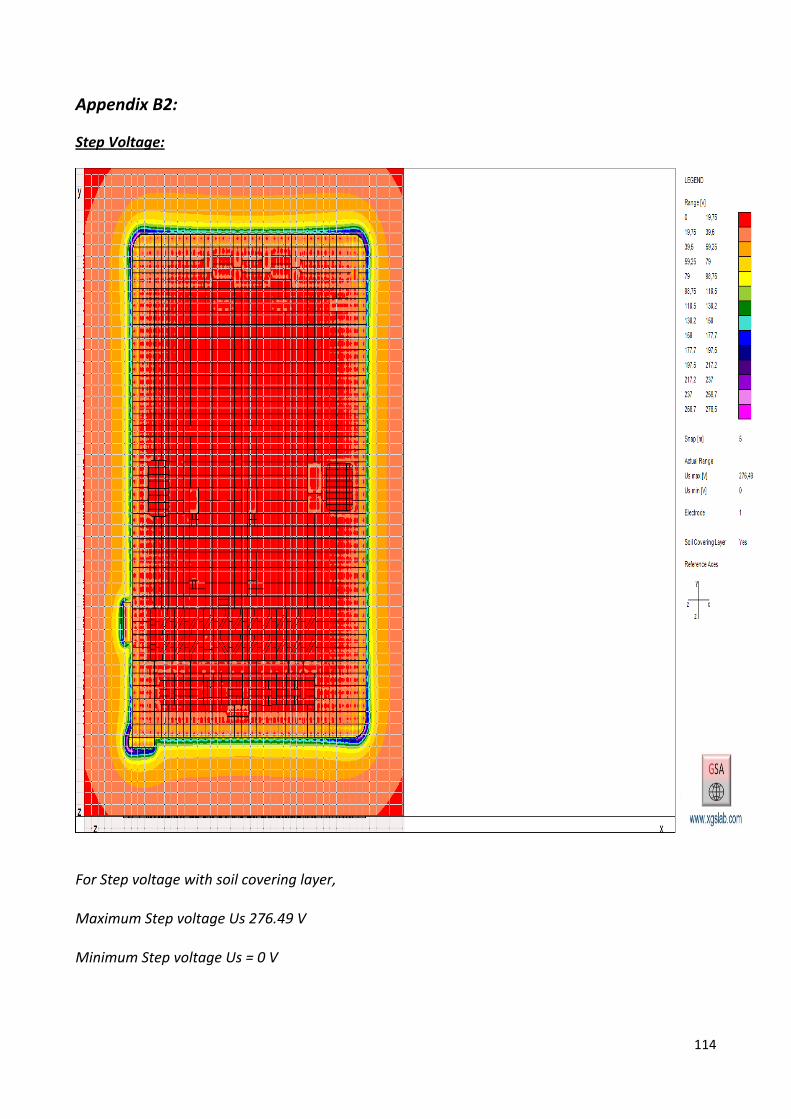
114
Appendix B2:
Step Voltage:
For Step voltage with soil covering layer, Maximum Step voltage Us 276.49 V Minimum Step voltage Us = 0 V

115
C: Uniform Soil Layer (1000 Ωm) With Reduction Factor and Soil Covering Layer:
Appendix C1:
Touch Voltage:
With soil covering layer, Maximum touch voltage Ut = 1589.12 V Minimum touch voltage Us 9.1 V
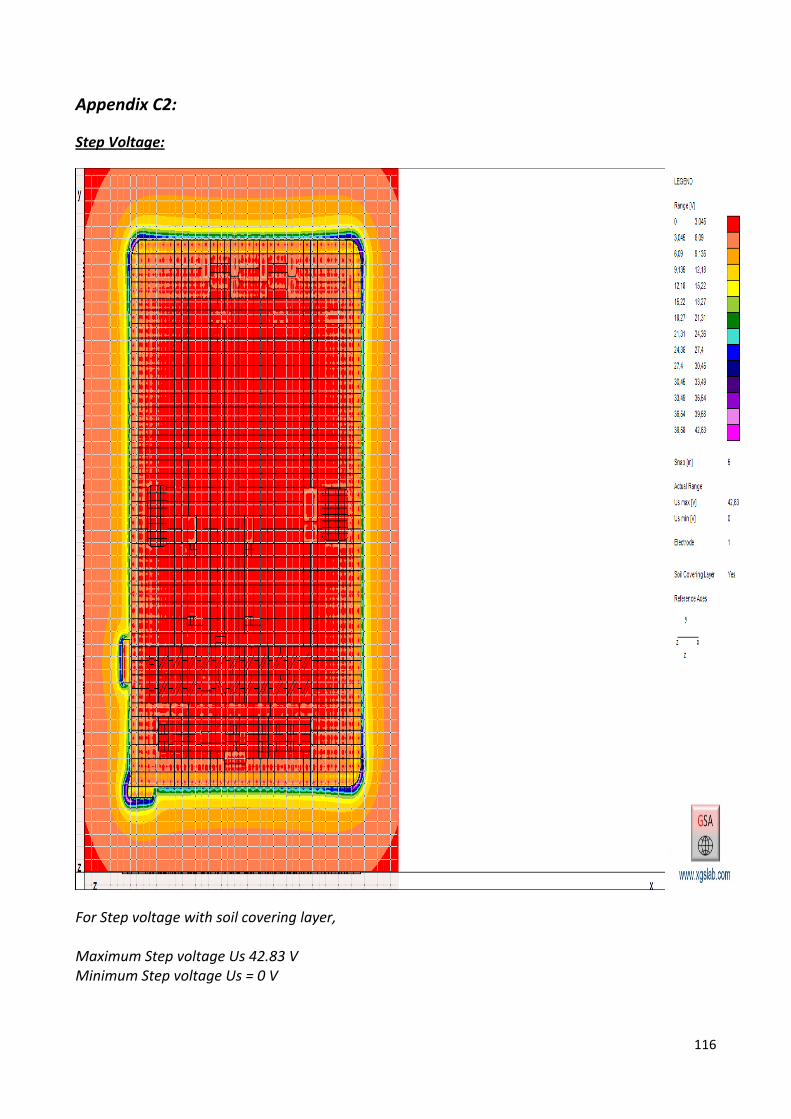
116
Appendix C2:
Step Voltage:
For Step voltage with soil covering layer, Maximum Step voltage Us 42.83 V Minimum Step voltage Us = 0 V

117
D: Double Soil Layer with Fault Current 50KA, Soil covering layer and Rods (length 10m):
Appendix D1:
Touch Voltage:
For touch Voltage,
Maximum touch voltage = 1377.76 V
Minimum touch voltage = 40.04 V
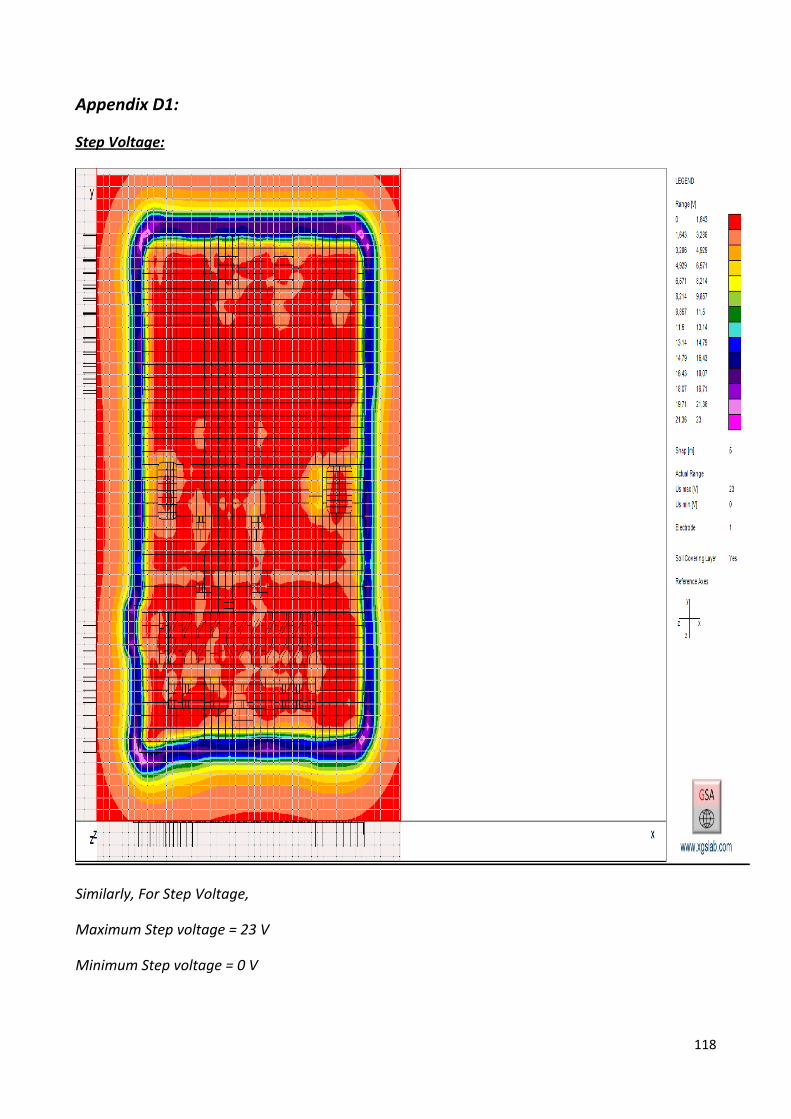
118
Appendix D1:
Step Voltage:
Similarly, For Step Voltage,
Maximum Step voltage = 23 V
Minimum Step voltage = 0 V