hurricane modeling in gis: an investigation of threshold
TRANSCRIPT

Louisiana State UniversityLSU Digital Commons
LSU Master's Theses Graduate School
2007
Hurricane modeling in GIS: an investigation ofthreshold storm events affecting special medicalneeds populations in coastal LouisianaKathryn Emily StrevaLouisiana State University and Agricultural and Mechanical College
Follow this and additional works at: https://digitalcommons.lsu.edu/gradschool_theses
Part of the Physical Sciences and Mathematics Commons
This Thesis is brought to you for free and open access by the Graduate School at LSU Digital Commons. It has been accepted for inclusion in LSUMaster's Theses by an authorized graduate school editor of LSU Digital Commons. For more information, please contact [email protected].
Recommended CitationStreva, Kathryn Emily, "Hurricane modeling in GIS: an investigation of threshold storm events affecting special medical needspopulations in coastal Louisiana" (2007). LSU Master's Theses. 4021.https://digitalcommons.lsu.edu/gradschool_theses/4021

HURRICANE MODELING IN GIS: AN INVESTIGATION OF THRESHOLD STORM EVENTS AFFECTING SPECIAL
MEDICAL NEEDS POPULATIONS IN COASTAL LOUISIANA
A Thesis
Submitted to the Graduate Faculty of the Louisiana State University and
Agricultural and Mechanical College in partial fulfillment of the
requirements for the degree of Master of Natural Sciences
in
The Interdepartmental Program in Basic Sciences
by Kathryn Emily Streva
B.S., Saint Francis University, 1995 December, 2007

ii
ACKNOWLEDGEMENTS
I would like to thank my committee members and graduate advisors at Louisiana State
University (LSU), Drs. Andrew Curtis and Michael Leitner, Department of Geography &
Anthropology; Dr. Martin Hugh-Jones, DVM, MPH, Department of Pathobiological Sciences
and Department of Environmental Studies; Dr. Ivor van Heerden, Department of Civil and
Environmental Engineering; and Dr. Hassan Mashriqui, PE, of the LSU Ag Center.
Additionally, thank you to Dr. Zaki Bassiouni, Dean of Engineering for support of my
graduate studies through the College of Engineering Employee Education Award.
A number of researchers and agencies supported this work. Research was funded
through the Louisiana Board of Regents Millennium Trust Health Excellence Fund, Contract
HEF(2001-06)-01, with additional support from the McKnight Foundation. Supporting
agencies include the Louisiana Department of Health and Hospitals, Offices of the State
Medical Examiner and State Epidemiologist. Thank you to my colleagues, fellow hurricane and
health researchers at LSU: Sait Ahmet Binselam for LIDAR and GIS data and guidance; Ezra
Boyd for sharing Hurricane Katrina data and articles for this study; Carol Friedland for your
explanations of hurricane wind effects and proficiency in HAZUS; Drs. Marc Levitan and
Elizabeth English for your expertise in hurricane engineering; Hampton Peele, DeWitt Braud,
Rob Cunningham, and Young S. Yang for your GIS shapefiles and mapping expertise.
Additionally, thank you to David Gisclair, Josh Kent, Craig Johnson, Dr. Jim Mitchell, and
Farrell Jones for your pioneering efforts in LIDAR and GIS for the state of Louisiana, enabling
coastal and environmental research for many projects statewide.
Finally, John Streva, thanks for taking el diáblo all those weekends; bringing us dinners -
especially from Kamado’s - and giving up so much of your own time.

iii
TABLE OF CONTENTS
ACKNOWLEDGEMENTS.............................................................................................................ii
ACRONYMNS AND DEFINITIONS............................................................................................v
ABSTRACT..................................................................................................................................vii
CHAPTER 1 INTRODUCTION AND BACKGROUND.............................................................1 1.1 Medical Patient Vulnerability in Hurricane and Flood Disasters ……..................…......1 1.2 Defining Medical Special Needs………………………..………………...……...……..4 1.3 Evacuate or Shelter in Place? Patients Face Life-or-Death Decisions………......…......9 1.4 Current Hurricane Risks to Coastal Louisiana MSN Facilities and Residences……....11 1.5 Lost in Translation: Bridging Science and Technology to MSN Decision-Makers in an
Emergency………………………………………………………………….…..…..….14 1.5.1 MSN Decision-Makers ....………………………..……………………………...14 1.5.2 Accessing Hurricane Research and Models……………………………………..15
CHAPTER 2 OBJECTIVES…………...…..................................................................................19 2.1 Identify Risks: MSN Evacuation vs. Sheltering……………………………………….19 2.2 Determine Threshold Storm Events: Can Anyone Shelter Safely in Coastal Louisiana
for Hurricanes?................................................................................................................20 2.3 Incorporate Hurricane Research and Models into a GIS………………………………20 2.4 Explore Ways to Clearly Communicate and Visualize the Science to MSN Decision-
Makers………………………………………………………………………………….21 CHAPTER 3 LITERATURE REVIEW…………………………….…………………..........…22
3.1 Health Aspects of Hurricanes………………………………….…...………..……….. 23 3.1.1 MSN Evacuation vs. Sheltering Risks…………….……...……………………...24 3.1.2 Why Don’t MSN Patients Leave the Risk Area?….……...……………………...28 3.1.3 Factors Dominating MSN Decision-making….……...………………..………...33
3.2 Physical Aspects of Hurricanes………………………………………………………..49 3.2.1 2005 Hurricanes Katrina and Rita: Wind and Surge……………………...……..49 3.2.2 Louisiana Historical Hurricanes 1905-2005……………………….……...……..51 3.2.3 Hurricane Forward Track Speeds, Shifts in Track and Intensity in the Gulf
of Mexico……………………………………………………………………..….64 3.2.4 Forecast of Louisiana Hurricanes: Likely Storms vs. Worst Case…….......…….70
3.3 State of the Technology: Hurricane Modeling and GIS……………………………….72 3.3.1 A Review of Available Models and Data ……….….….……………………..…72 3.3.2 GIS Mapping for Hurricane and Public Health…………………………….....…84
CHAPTER 4 RESEARCH METHODS……………...................................................................89 4.1 Determining Threshold Hurricane Events Affecting MSN Evacuation and Sheltering.89 4.2 Data Collection and Incorporation into a GIS …………………………………...........92
4.2.1 MSN Location Data ………………………………….……………..…...………94 4.2.2 Critical MSN Evacuation and Transportation Data…...……...………...……......95

iv
4.2.3 Critical MSN Shelter Data ………………………………..………......................99 4.2.4 Special Considerations: Levee Breach and Status, Hurricane Katrina Maximum
Flood Depths………………………………...…………………..…..…….........100 4.3 Integration of Storm Surge Flood Layers into GIS…….……………...…...……...….103 4.4 Calculation of Wind Fields………..……..………………………...……..……...…...106 4.5 Sharing Hurricane Research and Modeling Tools in GIS…………….………….......111
CHAPTER 5 RESULTS…………………….............................................................................113
5.1 Result Tables……………………………………………………………...………..…113 5.2 Threshold Storm Events Impacting MSN Evacuation……………………………..…114
5.2.1 Summarizing MSN Point Data for Storm Surge Risk……………………….....114 5.2.2 Storm Surge Events Affecting Critical Medical Evacuation, Transportation and Sheltering Sites……………...…………………..…..………..……....….....123 5.2.3 Re-analysis Results with LIDAR-Extrapolated SLOSH Data………….............125 5.2.4 New Orleans Levee Breach and Flood Inundation Scenarios…….…...……….127 5.2.5 Clear Communication and Visualization of the Data……………..…...……….130
5.3 GIS Data and Analysis: Limitations:…………..………………………………….….131
CHAPTER 6 CONCLUSIONS..................................................................................................133 6.1 Hurricane Modeling in GIS: Threshold Events for MSN Facilities - Can Anyone
Shelter Safely in Coastal Louisiana for Hurricanes?....................................................133 6.2 Future Directions…………………………………….……………………………….134
6.2.1 Storm Surge Modeling in GIS….……………………………….……........…...134 6.2.2 Hurricane Wind Modeling……………………………………………………...137 6.2.3 Incorporating MSN Data into 3D Image Viewers……………………………...139 6.2.4 Models and Scripts for Data Tabulation and Reporting………………………..139 6.2.5 Enterprise GIS for Medical Planning and Response……………………….…...140
6.3 Refining the Science to Reduce MSN Evacuation in Coastal Louisiana…….……….141
REFERENCES…………………………………………………………………..…………..…144 APPENDIX A: THE SAFFIR-SIMPSON SCALE FOR HURRICANES…………………..…158 APPENDIX B: STUDY SET: 26 COASTAL LOUISIANA PARISHES……………..........…159 APPENDIX C: MAPS OF ELDERLY EXPOSURES DURING HURRICANE KATRINA ...160 APPENDIX D: LOUISIANA HURRICANE INTENSITIES AT LANDFALL, 1905-2005.…164 APPENDIX E: LOUISIANA NAMED STORMS, 1905-2005……………………………..…166 VITA………………………………………………………………………………..…………..167

v
ACRONYMNS AND DEFINITIONS
ADCIRC – Advanced Circulation Model for Ocean Hydrodynamics. A high resolution storm
surge prediction model for coastal Louisiana
AMO - Atlantic Multidecadal Oscillation. A climate cycle that may increase the average
number of US hurricane landfalls over the next few decades
ABFE – Advisory Base Flood Elevation. Re-evaluated flood elevation values along the coast
following a 2006 FEMA initiative to incorporate storm surge risks into FIRMs - Flood Insurance
Rate Maps, previously using BFE – Base Flood Elevation values
CDC – US Centers for Disease Control and Prevention, Atlanta, GA
CTN – Critical Transportation Needs, CTNS - Critical Transportation Needs Shelter
DHHS – US Department of Health and Human Services, the Federal health agency
DHS – Department of Homeland Security, FEMA – Federal Emergency Management Agency
ENSO – El Niño Southern Oscillation (and La Niña). A seasonal fluctuation over the Pacific
Coast of Mesoamerica that may affect hurricane formation
FMS – Federal Medical Station, such as a PHS - US Public Health Service Rapid Deployment
Force, DMAT - Disaster Medical Assistance Team, EMED - Emergency Medical Team, CSH -
Combat Support Hospital or US Navy Hospital Ship
GPS – General Population Shelter <OR> Global Positioning System, a handheld device for
determining coordinates
HFW – Hurricane Force Winds, indicating windspeeds over 75 miles per hour
HPS – New Orleans Hurricane Protection System. The levees and canals surrounding New
Orleans south of Lake Pontchartrain, along the Mississippi River and Gulf of Mexico
LA DHH - Louisiana State Department of Health and Hospitals, BEMS - Bureau of Emergency
vi
Medical Services within the OPH - Office of Public Health
LIDAR - Light Detection and Ranging. An emerging technology in land elevation measurement
MMP – Medical Marshalling Point. For this study, further denoted as an MMP-A - airfield/
airport or MMP-T - train station
MRGO – Mississippi River Gulf Outlet, a navigation canal east of New Orleans
MSN - Medical Special Needs, MSNS – Medical Special Needs Shelter
NAVD88 – North American Vertical Datum of 1988. Louisiana LIDAR, the latest elevation
survey methods for Louisiana, and FEMA ABFEs will reference this datum
NGVD29 – National Geodetic Vertical Datum of 1929. The NOAA SLOSH storm surge model
and many Louisiana FEMA FIRMs will reference this datum
NOAA - The National Oceanic and Atmospheric Administration, CSC - Coastal Services Center
also, AOML - Atlantic Oceanographic and Meteorological Laboratory, NHC – National
Hurricane Center, HRD – Hurricane Research Division, and NWS – National Weather Service
PPP – Parish Pick up Point, or CPPP - Coastal Parish Pick up Point. Planned locations along
the coast where hurricane evacuees without cars can go to get transportation to a CTNS
SLOSH – Sea Lake and Overland Surge from Hurricanes, MEOW – Maximum Envelope of
Water, MOM – Maximum of Maximums. All denote NOAA models for storm surge analysis
SpNS – Special Needs Shelter. State-operated shelter generally reserved for special needs
hurricane evacuees
TMOSAs – Temporary Medical Operations Staging Area. Decontamination, triage, treatment
and transport point for patients brought in from hurricane affected areas by search and rescue
TSFW – Tropical Storm Force Winds, indicating windspeeds over 39 miles per hour
USACE – US Army Corps of Engineers

vii
ABSTRACT
Recent hurricane events in coastal Louisiana have emphasized the severe vulnerability of
medical special needs (MSN) patients during flood disasters. MSN populations may be
comprised of hospital, nursing home or hospice patients; the physically or mentally disabled;
medically-dependent individuals requiring life-sustaining equipment or medicines; and frail
elderly.
Over 150 hospital and nursing home fatalities resulted from Hurricane Katrina in New
Orleans. More than four hundred elderly over the age of seventy perished. Chronic diseases and
mental health illness were among the top conditions reported in field hospitals, emergency rooms
and shelters immediately following the storm.
Louisiana MSN facilities and residences in the southern-most parishes continue to face
daunting risks from even minor storms. Principal risks include storm surge and high winds made
worse by coastal land loss. Few structures have been designed to withstand hurricane forces and
many depend on coastal hurricane protection systems. Many are located in close proximity to
industrial facilities or hazardous material sites.
Meanwhile, MSN patients and decision-makers lack access to the latest hurricane
science. This prevents them from conceptualizing their true hurricane vulnerability. Indications
were that high numbers of MSN patients remained in the risk area even while Category 5
Hurricane Katrina loomed towards Louisiana. Many still plan to shelter in place for hurricanes.
This manuscript reviews the health and hurricane risks of MSN patients in evacuation vs.
sheltering in place in coastal Louisiana. The latest hurricane models are incorporated with
critical MSN location data in a Geographic Information System (GIS) to determine threshold

viii
events. Solutions are explored to communicate risk, visualize data, and share hurricane research
and GIS tools with MSN decision-makers at the local level.
Based on scientifically accredited modeling and associated research, this study has
determined the threshold storm event for coastal Louisiana MSN patient evacuation to be a
tropical storm. Particularly, rapid hurricane intensification has historically supported that even
lower order storms may intensify enough within 48 hours of landfall to create unsafe flood and
wind levels. Thus, full MSN patient evacuation south of the Louisiana interstates is
recommended upon a tropical storm entering the Gulf of Mexico.

1
CHAPTER 1 INTRODUCTION AND BACKGROUND
1.1 Medical Patient Vulnerability in Hurricane and Flood Disasters
Recent hurricane events in Louisiana have emphasized the severe vulnerability of
Medical Special Needs (MSN) patients during flood disasters. Some of the strongest recent
evidence comes from Hurricane Katrina, which made landfall in Louisiana on 29 August 2005 as
a Category 3 hurricane, resulting in levee breaches and flooding throughout much of the city of
New Orleans. Of 1464 fatalities in Louisiana, over 150 occurred at medical facilities, including
approximately 85 deaths at hospitals and 65 at nursing homes (LA DHH 2006c, Boyd 2006).
Approximately 37 hospitals and 34 nursing homes had to evacuate southeast Louisiana following
Hurricane Katrina, with 19 nursing homes evacuating prior (LA DHH 2007b). Hurricane Rita
months later prompted the early evacuation of 24 nursing homes, but later required the
evacuation of 21 hospitals across southwest Louisiana (ibid).
Hurricane Katrina further demonstrated the severe risk of hurricanes and floods to elderly
residents.
Number of Hurricane Katrina Fatalities by Age
Figure 1. Preliminary deceased victims data for Hurricane Katrina in Louisiana indicate a positive association between age and mortality (LA DHH 2006b).
2
Elderly often have existing medical conditions or extreme physical difficulties which
may qualify them as MSN patients. Preliminary data from Hurricane Katrina indicate a positive
association between age and mortality, with older Louisiana residents disproportionately affected
by the storm (see also, Appendix C). Over 400 fatalities at age seventy or above were recorded
(Figure 1) (LA DHH 2006b). Supported by just over half of the total data (853 of 1464 records),
it is unclear whether future data when completely tabulated will support the same association.
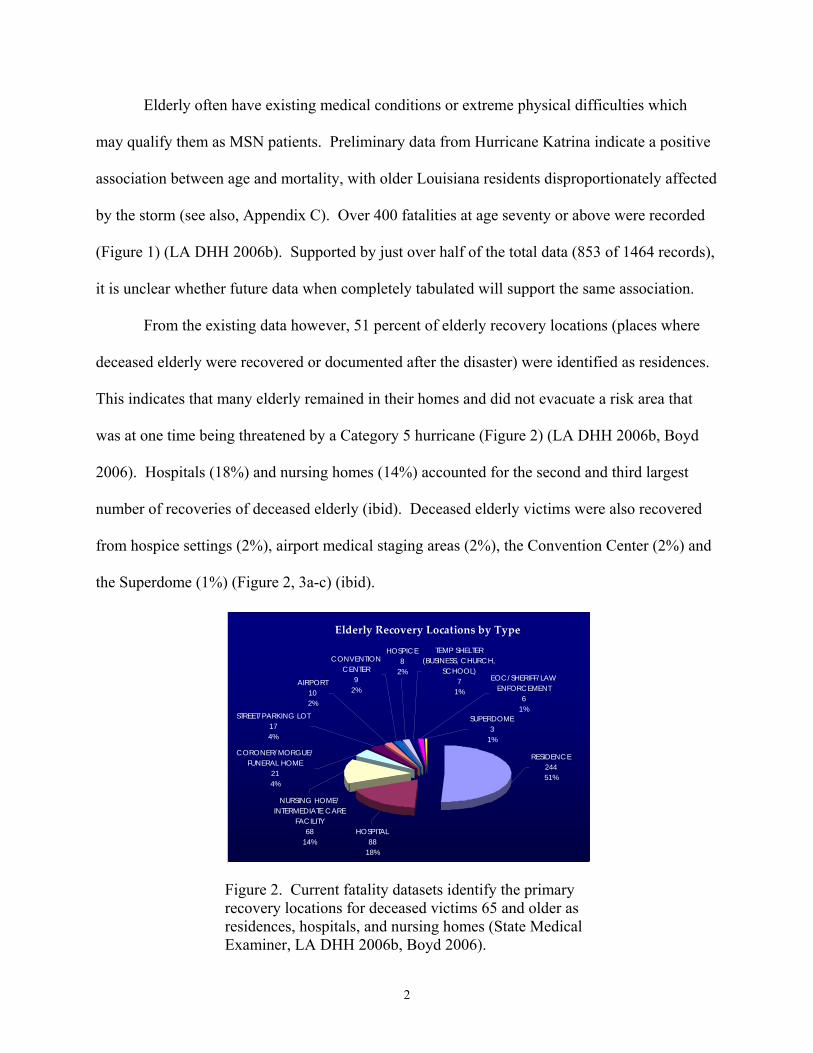
From the existing data however, 51 percent of elderly recovery locations (places where
deceased elderly were recovered or documented after the disaster) were identified as residences.
This indicates that many elderly remained in their homes and did not evacuate a risk area that
was at one time being threatened by a Category 5 hurricane (Figure 2) (LA DHH 2006b, Boyd
2006). Hospitals (18%) and nursing homes (14%) accounted for the second and third largest
number of recoveries of deceased elderly (ibid). Deceased elderly victims were also recovered
from hospice settings (2%), airport medical staging areas (2%), the Convention Center (2%) and
the Superdome (1%) (Figure 2, 3a-c) (ibid).
Elderly Recovery Locations by Type
HOSPICE8
2%
STREET/PARKING LOT174%
AIRPORT102%
CONVENTION CENTER
92%
CORONER/MORGUE/ FUNERAL HOME
214%
TEMP SHELTER (BUSINESS, CHURCH,
SCHOOL)7
1%
SUPERDOME3
1%
EOC/SHERIFF/LAW ENFORCEMENT
61%
NURSING HOME/INTERMEDIATE CARE
FACILITY68
14%HOSPITAL
8818%
RESIDENCE24451%
Figure 2. Current fatality datasets identify the primary recovery locations for deceased victims 65 and older as residences, hospitals, and nursing homes (State Medical Examiner, LA DHH 2006b, Boyd 2006).

3
Although not always reflected in the data, there are other indications that high numbers of
MSN patients remained in the risk area as Hurricane Katrina approached Louisiana. In some
instances, MSN patients are well documented in accounts provided by officials with the
Louisiana Department of Health and Hospitals (LA DHH), nurses, doctors, emergency medical
technicians, search and rescue teams, emergency responders, journalists, and other individuals
that experienced the medical emergency as it unfolded following the levee breaches.
For example, approximately 500 MSN patients had been evacuated from the Superdome
to Baton Rouge before Hurricane Katrina made landfall (Cataldie and Kosak pers comm 2006).
Many additional patients were evacuated the day of landfall at pick up locations near the Bonnet
Carre Spillway at LaPlace, before winds had technically even died down (ibid). Yet, by that
evening and the subsequent levee breaches, over 500 additional MSN patients are recorded to
have entered the Superdome, resulting in numbers which escalated to over a thousand (ibid).
These individuals were separated from the general population and where possible, evacuated by
Military Deuces until buses could finally arrive (ibid).
Additional accounts and images provided by the media, internet and other outlets support
that substantial numbers of MSN patients, including elderly and disabled, were present and had
Figures 3a-c. The situation became critical for elderly medical special needs patients following Hurricane Katrina. Above, an overwhelming number of elderly and MSN patients were brought to airport medical staging areas and the New Orleans Convention Center (LA DHH, Katrinahelp.com).

4
not evacuated the risk area. These also served to document the critical situation faced by MSN
patients following the disaster (Figures 3a-c, 4a-c).
Figures 4a-c. There are indications that high numbers of MSN patients remained in the risk area for Hurricane Katrina. Photos above show numerous individuals requiring mobility aids, as well as frail elderly. Left: Residents waiting to enter the Superdome, a shelter of last resort, before the storm (wikinews). Middle: MSN patients are evacuated long distances to shelter (Florida DMAT). Far right: MSN patients await transport to shelter facilities (Katrinahelp.com).
Further evidence of MSN patient vulnerability in disasters is indicated by the cases of
exacerbated chronic disease reported after the storm. Similar chronic conditions were reported at
medical staging areas and triage sites, field hospitals, emergency rooms and shelters. Heart
problems, diabetes, and mental illness were among the major conditions reported (CDC MMWR
2006a-b, LA DHH 2005a-c, 2007b, Ford et al 2006, Mokhad et al 2005). Of Hurricane Katrina
evacuees sheltering in Texas, “41 percent of Houston shelter residents reported chronic health
conditions such as heart disease, hypertension, diabetes, or asthma” (Brodie et al 2006, p 1403).
Medical special needs are therefore a serious concern in hurricane and flood disasters, as
strongly evidenced by recent hurricane events such as Hurricane Katrina in coastal Louisiana.
1.2 Defining Medical Special Needs
Medical Special Needs (MSN) patients, for the purpose of this research, are generally
considered those individuals who, for health reasons, should be very near medical professionals
during a disaster. It is accepted that many MSN patients may not have appropriate levels or

5
access to health care even prior to a disaster. However, MSN patients for this study are
conceptualized as those individuals who should be accounted for, and for whom we should be
immediately prepared to receive in any disaster situation, to fulfill their basic medical needs.
MSN populations for this study are considered a subset of overarching “special needs”
and “vulnerable” populations. MSN populations may be differentiated from these larger groups
in that MSN individuals will have an existing medical problem that requires prompt,
professional medical care; otherwise serious harm may result. MSN individuals can also be
described as “…medically dependent individuals who have physical or mental conditions that
limit their ability to function on their own… (Bridges and Garcie 2006, p. 4).” These individuals
can be found in hospitals, nursing homes, their own residence, in adult day service programs,
assisted living facilities, foster and group homes, and long term care facilities (ibid, USFA EMI
2003, GOHSEP 2005, DOJ CRD/DRS 2004, Lapolla 2003, Prats 2003). The discerning factor
for MSN individuals is that if medical assistance is not received immediately, or within the short
term of a few days of an emergency or disaster situation, injury or death can result.
Definitions of the special needs population are more inclusive, and comprise larger
numbers of “…individuals in the community with physical, mental or medical care needs who
may require assistance before, during and/or after a disaster or emergency after exhausting their
usual resources and support network (ibid, p.1.3).” This group differs from the MSN subset in
that, if prepared and supported at the onset of an emergency, special needs individuals will
usually not encounter problems navigating an evacuation or sheltering in place. With basic
support, they have the capacity to proceed as normal, often times on their own, without any
resulting medical emergency (ibid). Special needs definitions will typically incorporate the
disabled and mentally ill. However, the important distinction for MSN disabled and mentally ill
6
which separates them out from general special needs populations, is that again, these individuals
will have an immediate medical need and will not be able to care for themselves. They might
require medication they cannot dispense without medical assistance, need help in the operation
of medical equipment, or demand some level of professional medical care or supervision.
Specific categories of MSN disabled and mentally ill are discussed in more detail in Section
3.1.1, but as an example, may include traumatic brain injury patients, bariatric1 patients, or the
seriously mentally ill, such as schizophrenic patients.
Along the same lines, vulnerable populations are a larger and more inclusive designation
than MSN. These individuals are somewhat more at risk in an emergency, but are generally not
likely to be emergency medical patients. In the broadest definition, those included in within
vulnerable populations may range from young children entirely dependent on adults for their
care; to pregnant women; to the immuno-compromised; to individuals facing socio-economic
problems such as poverty; to individuals located near hazardous materials sites. One important
subset within vulnerable populations in the case of a hurricane disaster are those with Critical
Transportation Needs (CTN) (LA DHH App 9). CTN individuals may not be able to “provide
for or arrange their own transportation or sheltering outside a risk area (ibid).” This leaves them
potentially stranded in a hazard area, and subject to harm. Where MSN patients might separate
from vulnerable populations are in instances such as medically dependent children, pregnant
women who are high risk or late term, or low-income residents with untreated medical
conditions living in high risk areas (e.g., low elevations, near levees or hazardous sites).
In either case, it is important to note that the larger group definitions of “special needs”
and “vulnerable” individuals are inevitably going to be the next series of MSN patients if a
disaster situation becomes dire (USFA EMI 2003). That is, individuals from these groups are 1 treatment for obesity, such as gastric bypass

7
most likely to deteriorate into emergency medical patients and amplify the MSN population
shortly after a disaster such as a hurricane, if their primary needs are not met and if they are
overwhelmed by an extensive or severe storm.
Although just a subset of vulnerable or special needs populations, MSN categories are
nonetheless quite inclusive and often overlapping. The MSN designation may incorporate many
more individuals with medical conditions and needs in a disaster, particularly the elderly and as
previously discussed, the disabled. These individuals may live at home or in assisted living,
community care or retirement settings (ibid, Bridges and Garcie 2006, GOHSEP 2005, DOJ
CRD/DRS 2004, Lapolla 2003, Prats 2003).
Many elderly or senior citizens (considered in most cases to be age 65 and older) may be
self-supporting and completely healthy. However, the elderly that comprise MSN populations
will require varying levels of assistance and medical care and will have other special, medical or
transportation needs (USFA EMI 2003, p.1.9). “Medically fragile” may be considered a
classification of patients within MSN populations that often include the very elderly and
bedridden who are totally dependent (Lapolla et al 2003). Medically fragile patients are
becoming much more common in nursing homes (Prats 2003) and are present in hospice settings.
At the same time, medically fragile patients simultaneously include those who have difficulty
swallowing; those requiring electrical equipment to sustain life; insulin-dependent diabetics who
are unable to monitor their own blood sugar or self-inject; those requiring continuous IV therapy;
and individuals with critical medications and labs requiring daily monitoring (Lapolla et al
2003).
Individuals with disabilities also comprise much of the MSN population. In general,
disability types include (1) Sensory, including the blind, deaf, or individuals with varying levels

8
of loss of sight or hearing; (2) Mobility: those with limited stamina, or who use mobility aids
such as a cane, wheelchair, walker, scooter, or crutches; e.g., individuals with Cerebral Palsy,
Multiple Sclerosis or Muscular Dystrophy (3) Mental: including the mentally ill,
developmentally disabled (e.g., Autism), those with traumatic brain injury, and learning or
cognitive disability; and (4) Medical: renal dialysis patients, diabetics, oxygen or respirator-
dependent (USFA EMI 2003, US DOJ 2004). As with the elderly, not all disabled individuals
have immediate medical needs, but may simply have special needs. Many disabled can function
well on their own or with basic support (ibid). However, anyone with a disabling condition
listed above that requires immediate medical attention or supervision at the onset of a disaster
could be considered an MSN patient.
Of note, according to 2000 Census data, over twenty percent of residents in Louisiana
aged 5 years and older had some type of disability, including physical, employment (preventing
them from working), mobility, mental, sensory and self care disabilities, respectively (St.
Bernard Parish Health Profile 2004). Disability rates for elderly Louisiana residents far
exceeded those of younger residents, while over twenty percent of Louisiana households had at
least one child with a special health care need (ibid). Such statistics underscore the importance
of special needs and MSN patient disaster planning in Louisiana.
Providing even more overlap, disabled residents have higher rates of chronic medical
conditions, emergency room visits and “hospitalization for a primary disabling condition (ibid).”
As discussed, chronic conditions were some of the most commonly reported emergency medical
problems reported in field hospitals and hurricane shelters immediately following Hurricane
Katrina (CDC MMWR 2006 and others).

9
Similar to CTN individuals, which were discussed under “vulnerable” populations,
transportation for individuals with disabilities can be likewise disrupted. This may be due to
overcrowding, blocked streets or sidewalks, or systems that are closed on account of the
impending storm, rather than a lack of resources (USDOJ 2004). Many people with disabilities
cannot use usual modes of transportation, but instead require lift-equipped school or transit buses
(ibid).
In summary, MSN patients may include a wide range of individuals who will need access
to medical professionals immediately during and following a disaster, or they risk injury or
death. MSN populations require immediate medical attention or supervision, medicines, access
to equipment, or other resources in a disaster and may be comprised of many overlapping
categories of individuals. These include hospital, nursing home or hospice patients; the
physically or mentally disabled; medically-dependent individuals requiring life-sustaining
equipment, medicines or varying levels of care; frail elderly; and those with chronic medical
conditions. Special needs and vulnerable populations are often the first to add to the MSN
population in the case of a large-scale event when their usual support network has been disrupted
(USFA EMI 2003).
1.3 Evacuate or Shelter in Place? Patients Face Life-or-Death Decisions
Both evacuation and sheltering in place carry inherent risks for patients with special
medical needs during hurricanes (ibid, Dosa et al 2007, Bridges and Garcie 2006, GOHSEP
2005, DOJ CRD/DRS 2004, Lapolla 2003, Prats 2003).
Successful hurricane evacuations require careful planning and sufficient time before the
onset of tropical storm force winds, rain and congested roadways. Evacuation is costly and
highly dependant on well-trained staff, available transportation and supplies (Dosa et al 2007,
10
DHHS/OIG 2006, Bascetta/GAO 2006). Each of these pieces is crucial for a successful
evacuation; none can be missing or the entire operation may fail. Yet, there are nearly
insurmountable challenges facing facility mangers in each of these aspects of an evacuation
(DHHS/OIG 2006, Cutter 2006). Evacuation risks include long commutes, heat exposure,
temporary dehydration, injury, lack of immediate access to medical care or medicines, lack of
appropriate levels of care in transit or at receiving facilities, and stress, among many others (ibid,
Dosa et al 2007, Gray and Hebert 2007, Klein and Nagel 2007, Mutter and R’id 2007, Kuba et al
2004).
Sheltering in place presents another set of risks, as hurricanes can rapidly intensify, shift
in track, or cause a host of other unanticipated problems (Keim/SRCC 2007, NOAA 2007b-c).
Tornadoes and extreme rainfall often accompany hurricanes (ibid), followed by downed trees
and power lines which may block access routes and disrupt electrical utilities, water supply and
communication. In coastal Louisiana, levee breaches or hazardous chemical releases may also
result (van Heerden et al 2006, Pardue et al 2005). Low elevations and other coastal factors
expose facilities to serious flooding, and few have been designed to withstand high winds (LSU
HC 2007, Levitan pers comm 2007).
As an example, most nursing homes in coastal Louisiana are one-story buildings built
decades ago (ibid). Similar to coastal Louisiana residences, even if constructed to the most
conservative building codes of the time, these structures would not likely be safe or able to
withstand hurricane force winds, because such stringent standards were not required at that time
(ibid). Safe shelter spaces are generally limited to halls without windows (unless hurricane
rated) and between secure fire-protected doors or within secondary barriers (unless doors are
hurricane rated). Safety is dependant on factors such as a continuous loadpath (a building

11
designed or mitigated to withstand wind forces as a complete unit, from the roof to the floor) and
other factors which are sometimes not easily confirmed or reasonably expected (ibid). In short,
most nursing homes and other one-story residential structures in coastal Louisiana will provide
little if any protection from high wind events such as tornadoes, and are not likely to fare much
better during hurricanes.
MSN patients sheltering in place may suffer injury, heat exposure, dehydration, lack of
caregivers or appropriate medical care, isolation, non-functioning medical equipment, and stress
(Dosa et al 2007, Gray and Hebert, 2007, Mutter and R’id 2007, Fernandez et al 2002). In
extreme cases, storm injuries or death may result from drowning, lack of basic needs (e.g., water
or food) or untreated medical conditions when emergency responders can not reach them (ibid).
1.4 Current Hurricane Risks to Coastal Louisiana MSN Facilities and Residences
Hurricanes cause a wide range of public health impacts that most seriously affect MSN
populations within the community. Louisiana facilities and residences, particularly in the
southern-most parishes, are now faced with daunting hurricane risks from even minor hurricanes.
There are over 560 hospitals and nursing homes in the state of Louisiana (LA DHH
2007a, Louisiana GIS Digital Map 2007). Approximately 305 - over half - are located in the
twenty-six coastal Louisiana parishes that have some portion of land south of interstates I-10 and
I-12 (ibid, listed in Appendix B). These estimates exclude hundreds more facilities and
residences dotting the coastal communities that may house MSN individuals who are physically
or mentally disabled, medically dependent or elderly (ibid, HRSA 2007, US Census Bureau
2000). As previously discussed, health risks to MSN patients are high during hurricane disasters;
additional factors increase the overall hurricane risks to coastal Louisiana facilities and
residences.

12
Examples of coastal hurricane risk factors are prevalent in recent history, even prior to
2005 Hurricanes Katrina and Rita. New Orleans had already been enduring rainfall events and
minor storms that were resulting in major floods, including the floods of 1995, 2001 Tropical
Storm Allison (that flooded Houston and New Orleans, to a lesser extent), and tropical storm
Isidore in 2002 (Robbins/SRCC 2004). Post-Katrina storm surge models now predict serious
coastal flooding in some areas of New Orleans and the Louisiana coast beginning at Category 1
and 2 storm levels (NOAA SLOSH Display Program, version 1.4.3, May 9, 2007). Storm surge
is defined as a “large dome of water, 50 to 100 miles wide, that sweeps across the coastline near
where a hurricane makes landfall. ...The level of surge in a particular area is primarily related to
the intensity of the hurricane and slope of the continental shelf (NOAA 1999, p. 13).”
Land loss and other coastal changes in Louisiana have substantially increased the
hurricane and flood risk to coastal communities over time (van Heerden/CCEER 2004).
Estimates range from approximately forty (Barras/USGS 2006) to one hundred acres of wetland
loss per day (van Heerden/CCEER 2004)2. Outer defenses to hurricane wind and surge are also
damaged by extreme storm events, as demonstrated most recently by once-Category five
hurricanes Katrina and Rita in 2005, resulting in significant erosion to the protective barrier
islands and already fragmented Louisiana marsh (Barras/USGS 2006). USGS estimates
indicated over two hundred square miles of marsh were converted to open water in coastal
Louisiana on account of both storms (ibid). Both storms retained their Cat 5 storm surge effects
even though making landfall in Louisiana as lower order storms (Levitan pers comm 2007).
Meanwhile, the coastal parishes of Louisiana are located over a subsiding basin with a
series of natural geologic faults (Figure 5) (van Heerden pers comm 2007) resulting in a drastic
drop in elevation south of interstates I-10 and I-12. 2 Earlier estimates rely more on interpretations of aerial photography than remotely-sensed imagery.
13
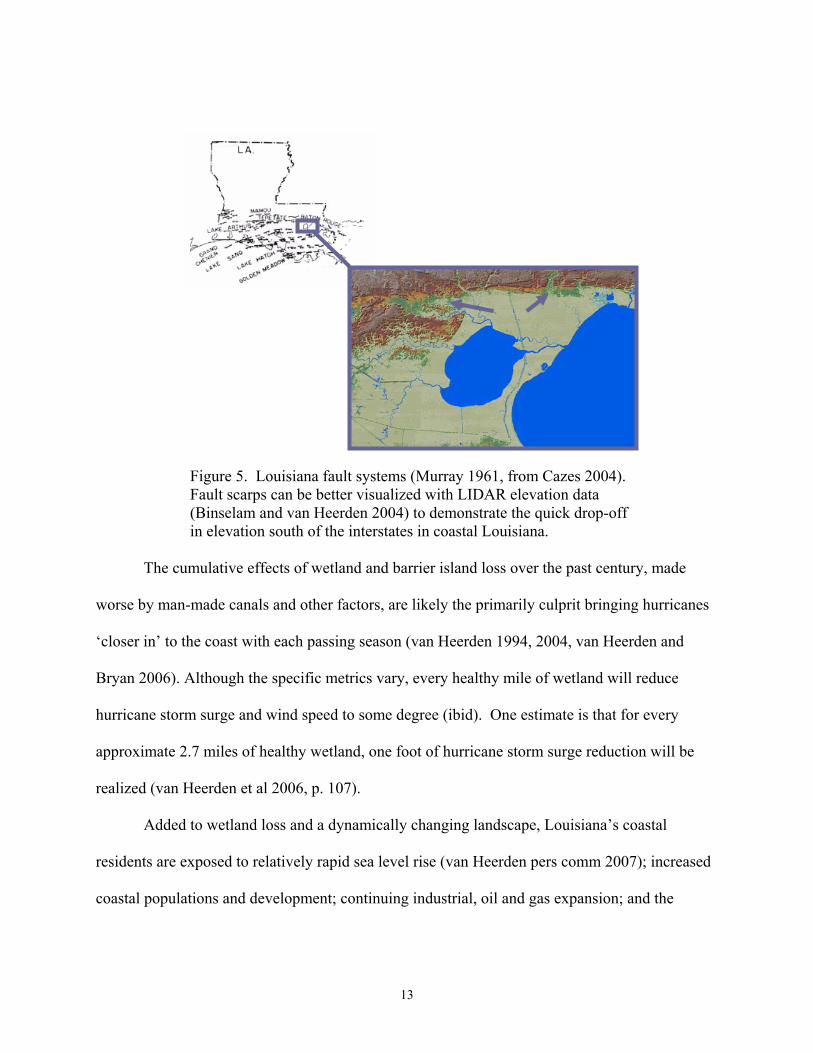
Figure 5. Louisiana fault systems (Murray 1961, from Cazes 2004). Fault scarps can be better visualized with LIDAR elevation data (Binselam and van Heerden 2004) to demonstrate the quick drop-off in elevation south of the interstates in coastal Louisiana.
The cumulative effects of wetland and barrier island loss over the past century, made
worse by man-made canals and other factors, are likely the primarily culprit bringing hurricanes
‘closer in’ to the coast with each passing season (van Heerden 1994, 2004, van Heerden and
Bryan 2006). Although the specific metrics vary, every healthy mile of wetland will reduce
hurricane storm surge and wind speed to some degree (ibid). One estimate is that for every
approximate 2.7 miles of healthy wetland, one foot of hurricane storm surge reduction will be
realized (van Heerden et al 2006, p. 107).
Added to wetland loss and a dynamically changing landscape, Louisiana’s coastal
residents are exposed to relatively rapid sea level rise (van Heerden pers comm 2007); increased
coastal populations and development; continuing industrial, oil and gas expansion; and the

14
uncertain future of levee repairs and rebuilding which have become requisite to protecting their
communities.
1.5 Lost in Translation: Bridging Science and Technology to MSN Decision-Makers in an Emergency
Given the health considerations and heightened hurricane risk in coastal Louisiana, an
important facet of evacuation and sheltering planning for MSN patients emerges: identifying
who makes the decisions to go or stay in a hurricane emergency. Once identified, further
questions become: Are coastal Louisiana MSN decision-makers aware of the extent of hurricane
risks to their facilities? Furthermore, are they able to access the latest science and technology,
including developments in hurricane models or GIS mapping?
1.5.1 MSN Decision-Makers
Some aspects of hurricane evacuation and sheltering decisions are coordinated, and to an
extent decided, between local, state and possibly Federal emergency management agencies and
officials. For example, decisions made on the local or state emergency management level include
whether or not to recommend or call for evacuation of a risk area, and how an evacuation will be
timed and executed (LA DHH 2007c).
Yet, notwithstanding communication problems (e.g., the inability of a nursing home to
contact local emergency management or the state health agency), miscommunication/
misunderstandings, or lack of resources (e.g. transportation assets), the ability to enforce an
evacuation order remains elusive and subject to debate. In short, hospitals, nursing homes and
other MSN facility managers and residents cannot be physically forced to leave an area. While
some entities may be sanctioned or censured for not complying with an evacuation order;
technically, all have the prerogative to shelter in place if they decide this to be in their patient(s)
best interests (ibid, Gray and Hebert 2007, Nursing Home Administrators pers comm 2007).
15
Therefore, local MSN facilities and residents play a significant role in determining their own
risk, and also in deciding whether or not they will evacuate a risk area for a given storm.
In reality, beyond individual MSN residents, those entrusted to make decisions regarding
the care of medically vulnerable patients in a hurricane situation will include hospital directors
and officials/CEOs, local nursing home administrators, facility owners, home health agency
officials, family members, and on-site medical support personnel such as nurses and other
caregivers (Dosa et al 2007, Gray and Hebert 2007, Kirkpatrick and Bryan 2007, DHHS/OIG
2006). These men and women rely heavily on information assets such as the damage history of
their facility; combined experience; their local, regional and state emergency managers; sister or
parent facilities; facility owners; the media; and particularly the individualized needs and
potential for risk to their patients when they decide to evacuate or shelter in place (ibid). There
is anecdotal evidence that family members of MSN patients weigh their decisions heavily on the
media and on potential medical risks to moving or relocating their family members (Mutter and
R’id 2007, Callimachi 2006). Assisting with the immediate implementation of hurricane
emergency plans may be other staff, maintenance personnel, patient and staff family members,
members from the community who show up at the facility, and other volunteers (Nursing Home
Administrators pers comm, Butcher pers comm 2006).
In summary, in the majority of cases, MSN decision-makers may actually be comprised
of MSN patients themselves, as well as nursing home administrators, family members, and the
many other non-governmental, non-emergency management local residents listed above.
1.5.2 Accessing Hurricane Research and Models
Perhaps surprisingly, even after the 2005 hurricanes, some administrators of hospitals
and nursing homes have still indicated that they “generally see evacuation as a last resort”
16
(Bascetta/GAO 2006, p. 5). During recent hurricanes along the US Gulf Coast, local MSN
decision-makers have chosen to shelter in place rather than evacuate for a number of reasons.
These are discussed in further detail in section 3.1.1; however, in one example, a nursing home
administrator explained:
“…the facility structure was sound enough to withstand expected winds, location limited the degree of expected flooding, staff were proficient in emergency response and willing to shelter in place with residents, the community was likely to augment facility resources, and the poor condition of residents made travel dangerous… (US DHHS/OIG 2006, p. 9)” Added to this were negative past experiences with evacuation (ibid). Numerous other
factors appear to weigh in to decisions to evacuate or shelter in place as previously described; but
the latest hurricane models and up-to-date, facility-specific information on physical hurricane or
flood risks do not appear to be a deciding factor.
In the case of St. Rita’s nursing home in St. Bernard, a well-known example in Louisiana,
thirty-five nursing home patients lost their lives and administrators were subject to a criminal
investigation. They were adamant that the facility ‘had not flooded in twenty years’
(Parker/USA Today 2006). This indicates some reliance on past experience but points to no
other reference such as the latest hurricane data, research or models. St. Rita’s was but one of a
number of area nursing homes in the area that did not evacuate. The fact that they sheltered in
place there with extended family, including grandchildren (CNN 2006), may support the
conclusion that based on experience and all other information at their disposal, they did not
perceive Hurricane Katrina to pose a serious threat.
Similarly, high numbers of hospital deaths under separate investigation in New Orleans
appear to have resulted from complicating factors post-storm, such as flooding, loss of utilities,
extreme temperatures, and general medical conditions that staff were not able to treat in the
17
deteriorating conditions (e.g., Gray and Hebert 2007). However, while reports are conflicting,
there is no evidence that any of the hospitals in the greater metropolitan New Orleans area fully
evacuated for Hurricane Katrina (ibid, LA DHH 2007b). Catastrophic hurricane plans for
Louisiana (drafted during the Hurricane Pam exercise of 2004) indicated that hospitals had
planned to shelter in place at reduced capacity for even the most severe hurricanes, but would
have enough resources on hand, including generator power, to shelter patients in place for up to
seven days. This was based on the estimated time search and rescue planners felt they could get
to hospitals in flooded conditions to replenish their supplies (IEM 2004).
In both cases, as well as in cases where MSN residents decided to ride out the storm in
their homes, levee breach or perhaps a delay in emergency response on some levels, may be
argued as the primary reason plans for sheltering in place failed for this specific event. However,
the increasing hurricane vulnerability to coastal Louisiana and New Orleans - including surge
and wave stress on the levees during hurricanes with the potential for overtopping - had been
discussed in academic research for years. Why didn’t the science appear to weigh into
evacuation decisions?
Scientific data had been presented years earlier on topics ranging from storm surge risk
(e.g., Suhayda, van Heerden and others, various academic presentations 2003-2005) to the
hurricane “funnel” created by the Mississippi River Gulf Outlet (Mashriqui 2004) to the potential
filling of the New Orleans “bowl” from the “Big One” (e.g., “Drowning New Orleans,”
Scientific American 2001). However, except for a few articles or special features, most notably,
in the Times Picayune (e.g. the ‘Washing Away’ series by Schleifstein/McQuaid) and
documentaries (e.g. NOVA in 2004), the hurricane risk which researchers were discussing does
not appear to have been adequately conveyed, or received by the MSN community.
18
Regardless of the eventual levee breaches, or other substantial problems faced by facility
administrators or residents preventing them from evacuating (e.g., lack of transportation assets, a
serious issue (DOT/DHS 2007, Dosa et al 2007, DHHS/OIG 2006, Bascetta/GAO 2006 and
others), the scientific data and hurricane research does not appear to have influenced local MSN
decision-makers, or their perceived level of threat from a hurricane, enough to counter the risks
they had calculated or associated with evacuation.
In summary, there is evidence that local MSN decision-makers rely heavily on various
information assets when contemplating hurricane evacuation vs. sheltering in place (Dosa et al
2007, Gray and Hebert 2007, Kirkpatrick and Bryan 2007, DHHS/OIG 2006, Nursing Home
Administrators pers comm, Butcher pers comm 2006, LA DHH 2007c). However, there is little
evidence to suggest that the latest hurricane research, science, or technologies, including storm
surge models or GIS modeling, weigh in to MSN decision-making on the local or individual
level.
Of note, numerous decision-makers have indicated that they receive “very little assistance
in making decisions related to evacuation…” from emergency response agencies, and feel that in
some respects, they are left “entirely on their own (Dosa et al 2007, Nursing Home
Administrators pers comm 2007).”

19
CHAPTER 2 OBJECTIVES
The objectives of the study included four major research components. These were to:
1. Identify the risks associated with MSN evacuation vs. sheltering in place;
2. Determine current hurricane risks to coastal Louisiana MSN facilities and residences,
and the threshold storm events which would prompt their evacuation. For this preliminary study,
hurricane risks included mainly storm surge and wind;
3. Incorporate the latest hurricane research and models into a GIS environment; and
4. Explore ways to clearly communicate and visualize the current science to MSN
decision-makers.
The key research question was: Can any MSN patient shelter safely in coastal
Louisiana for any level of hurricane? Or, phrased differently: Are there any areas of relative
safety in coastal Louisiana, south of interstates I-10 and I-12, where MSN sheltering in place
would be a “low-risk” or conservative option for lower order storms?
Such a determination could be very useful towards MSN planning in coastal Louisiana
given the health risks and costs to evacuate and operate alternate sheltering facilities. This would
apply not only to the hundreds of patients from each hospital or nursing home, but to the many
others in private residences and other MSN facilities. Research outcomes could potentially
reduce health risks and human suffering of patients by identifying any sites that could safely
shelter in coastal Louisiana and forego the risks and disruptions of hurricane evacuation.
2.1 Identify Risks: MSN Evacuation vs. Sheltering The first objective of the study was to assess and compare the health risks of MSN patient
evacuation vs. sheltering in place for hurricanes in coastal Louisiana. This was necessary to
provide a greater understanding of the complexity of issues involved in both decisions, in

20
whether to go or stay. This prompted a secondary question as well, in why MSN patients did not
evacuate the risk area as Hurricane Katrina approached New Orleans. A literature review
commenced to identify the health risks faced by MSN patients and their caretakers during
hurricane emergencies, as well as to understand their decision processes. Both were integral to
answering the research question.
2.2 Determine Threshold Storm Events: Can Anyone Shelter Safely in Coastal Louisiana for Hurricanes?
A threshold storm event for this study was conceptualized as: flood and wind levels
unsafe for MSN patient sheltering in place, without substantial mitigation measures taking
place, such that MSN patients would be recommended to evacuate. Threshold events as
determined by this study accounted only for hurricane storm surge and wind risks; they did not
take into consideration other important information that MSN decision-makers would need to
know, such as available personnel resources, transportation assets, supply issues, and patient
vulnerability.
The second study objective was to determine threshold hurricane events that would
trigger MSN evacuation in coastal Louisiana. This could allow for priority levels to be assigned
to the evacuation of facilities, and indicate to decision-makers which structures would be most
vulnerable during certain events. With added MSN GIS data, meeting this second objective
could also provide tabulated census counts of facilities and patients for MSN planning and
response.
2.3 Incorporate Hurricane Research and Models into a GIS
The third research objective was to review the state of hurricane research and technology,
including current models in use and available data, and to integrate the best and most relevant
into a GIS environment. Similar to the multidisciplinary research objectives of the New Orleans
21
Project GIS (discussed in more detail in the overview to chapter 3), by viewing all research, data
and modeling layers in a GIS environment (e.g., the integration of storm surge models and wind
hazard data with critical MSN location data), the larger expanse of hurricane risks might be
discerned.
2.4 Explore Ways to Clearly Communicate and Visualize the Science to MSN Decision-Makers
Before making difficult medical/health decisions in any emergency, or implementing
volumed, multi-tiered plans, the physical threat of an incoming hurricane must first be assessed.
Thus, MSN facility administrators and the public require access to site-specific, updated
hurricane risk information. However, they may not have (1) adequate computer resources or
capabilities; (2) technical expertise; or (3) the latest information on where to find current
technology and/or tools. Time or resource constraints may also prevent their access of physical
hurricane risk models or research.
Once threshold storm events were determined and supported in a GIS, methods were
sought to clearly communicate and share project outcomes with MSN decision-makers. Access
to similar planning tools ahead of time can better prepare decision makers to view facility or
residence-specific information; to be informed of what they can reasonably expect from
hurricane surge and wind; and to use this information to review time schedules and hurricane
emergency plans.
Solutions for providing GIS research tools to facility decision-makers at the local and
individual level, as well as to regional, state and Federal partners, were the final objective
explored. Particular focus was placed on decision tools that are accessible, understandable,
practical, and do not require significant computer enhancements, technical expertise, or
excessive investments in resources or time.
22
CHAPTER 3 LITERATURE REVIEW
A literature review was conducted to assess and compare the health risks of MSN patient
evacuation vs. sheltering in place for hurricanes in coastal Louisiana.
MSN patient definitions and needs outlined in this research were introduced in Chapter 1,
contributed mainly from internet presentations such as Bridges and Garcie 2006, “Providing
Care to Special Needs Residents During Times of Disaster,” and Lapolla 2003, “Finding
Vulnerable and Medically Fragile Populations.” Training and class materials related to
disabilities and special needs in shelters, as presented at annual National Hurricane Conferences,
likewise added to overviews of MSN population issues in earlier chapters. This specifically
includes training hosted by the US Fire Administration (USFA) Emergency Management
Institute (EMI) and Federal Emergency Management Agency (FEMA) 2003, entitled
“Emergency Planning and Special Needs Populations,” referenced throughout this manuscript.
Following the catastrophe of the 2005 hurricanes, an upsurge of studies and initiatives
have focused on critical medical facilities and hurricane risk. Among these numerous sources,
researchers at LSU and the LSU Health Sciences Center have been accumulating data on
hurricane health impacts as part of a New Orleans pilot study which began in 2002. As
determined from a review of historical Hurricanes Andrew (1992), Tropical Storm Allison
(2001), and recent events, these findings are discussed in section 3.1 from the viewpoints of
MSN evacuation and sheltering.
One of the most relevant questions in this research involves why MSN patients did not
evacuate the risk area as Hurricane Katrina approached New Orleans. The current literature and
survey data are consulted to gain further insight to this question, as well as to consider the
decision processes faced by MSN decision-makers. Policy initiatives that might affect MSN

23
evacuation and sheltering decisions in Louisiana, as well as in other hurricane-prone states, are
briefly discussed.
The many physical aspects of hurricanes in coastal Louisiana are outlined in section 3.2.
Important hurricane facts that will affect MSN planning and decision-making are given added
emphasis. An overview of Hurricanes Katrina, Rita, and historical hurricanes over the past
century are presented as a backdrop to discover what likely and worst case hurricane scenarios
can be reasonably expected to affect Louisiana in the coming decades.
Finally, an overview of current hurricane and health research, models, GIS technology
and mapping is provided, highlighting the tools which were selected for the study and their
limitations. Medical data privacy and online mapping considerations for MSN patients are also
addressed.
3.1 Health Aspects of Hurricanes
Public health impacts of tropical storms and hurricanes are diverse; yet specific risks are
encountered in the evacuation and sheltering in place of MSN patients.
Briefly, various hurricane public health impacts that fall outside of the risk categories of
evacuation or sheltering may include clean up injuries such as falls, sprains, chainsaw lacerations
and cuts; increased risk of exposure to tetanus from debris; animal and insect bites and stings
(including from snakes, spiders, fire ants and bee stings, wild animals and domestic pets,
introducing also an associated increased risk of rabies); and sunburn (Diaz and Hugh Jones 2003-
07, van Heerden 2006a, CDC MMWRs 2006a-c).
Weeks after a flood, environmental health risks from hurricanes may additionally expose
the public to toxic mold, polluted water or contaminated sediment (ibid, Pardue et al 2005).
Anyone who has suffered a hurricane, whether sheltering in place or evacuating to an alternate

24
sheltering site, will have increased medical risk. Conditions may include exacerbated medical
conditions such as heart attack; diabetic conditions; kidney problems and stroke, often caused by
lack of medications or access to medical care; gastrointestinal disease; food poisoning from
eating raw or spoiled foods; upper respiratory diseases such as viruses which are highly
contagious in shelters; and risk of serious communicable disease (e.g. Tuberculosis) (ibid).
Mental health conditions are common following hurricane experiences and may include
psychological conditions such as depression, shock, substance abuse, stress-induced conditions,
and feelings of loss or separation from family or pets, among many others (ibid).
Hurricane Katrina victims presented with some surprising conditions including wound
infections (e.g. Vibrio), skin diseases and staph infections including MRSA; lice and scabies; and
numerous cases of rash (ibid). Increased risk of violence or harm was also a health concern at
some shelter locations, within and outside of the affected area, due to lack of security (ibid).
3.1.1 Risks of MSN Evacuation v. Sheltering in Place
One of the primary study objectives was to identify and compare the health risks
associated with the hurricane evacuation of MSN patients vs. the risks of sheltering in place in a
hazard area. Numerous sources are cited which support health aspects encountered after major
hurricanes such as Katrina.
3.1.1.1 Hurricane Evacuation Risks
As learned from the New Orleans hurricane public health pilot study introduced at the
beginning of this chapter, MSN patients and evacuees risk motor vehicle accidents and
drownings from attempting to drive through flooded roadways of unknown depth (Diaz and
Hugh Jones 2003-07) during evacuations. For example, motor vehicle accidents accounted for
over half of all deaths from Hurricane Isabel in 2003, while two drownings occurred at an

25
underpass in New Orleans due to the 1995 floods (ibid). Causes of evacuation deaths during
Hurricane Rita in Texas included heat exposure or heat-related deaths, medical distress (e.g.,
lack of immediate access to medical care or medicines), and a bus fire which killed twenty-three
nursing home patients (O’Hare 2005) when an unsecured oxygen tank was believed to have
punctured and exploded. While specific details are difficult to ascertain, a certain number of
elderly deaths can be expected to occur in transit during most hurricane evacuations (Kalis pers
comm 2003).
Additionally, as introduced in section 1.3, evacuation risks may include dehydration,
injury in transit, skin tears and pressure sores for the elderly; lack of appropriate levels of care
in transit or at receiving facilities, and stress (Dosa et al 2007, Gray and Hebert 2007, Klein and
Nagel 2007, Mutter and R’id 2007, DHHS/OIG 2006, Cutter 2006, Kuba et al 2004).
For example, some evacuating nursing homes experienced “host facilities [that] were
unavailable or inadequately prepared” (US DHHS/OIG 2006, p. ii), had “substantial difficulty in
transporting frail residents (Dosa et al 2007),” and found that “…placing residents in alternative
shelters not designed for the care of elderly and disabled posed particular challenges” including
“problems with supplies;” not having enough beds or appropriate beds; and not having rooms
that locked to protect Alzheimer’s patients from wandering (US DHHS/OIG 2006, p. 13), as well
as inadequate staffing (Dosa et al 2007).
3.1.1.2 Risks in Sheltering in Place During Hurricanes
As introduced earlier in section 1.3, sheltering in place presents a separate set of risks in
coastal Louisiana. These can be quite severe as hurricanes can rapidly intensify, shift in track, or
cause a host of other unanticipated problems (Keim/SRCC 2007, NOAA 2007b-c). Tornadoes
and extreme rainfall often accompany hurricanes (ibid), followed by downed trees and power

26
lines which may block access routes and disrupt electrical utilities, water supply and
communication. In coastal Louisiana, levee breaches or hazardous chemical releases may also
result (van Heerden et al 2006, Pardue et al 2005). Low elevations and other coastal factors
expose facilities to serious flooding, and few have been designed to withstand high winds (LSU
HC 2007, Levitan pers comm 2007).
Storm surge risks are the primary risk to MSN patients sheltering in place, resulting in
drowning; near drowning; hypothermia; and submersion from storm surge and freshwater
flooding (Diaz and Hugh Jones 2003-07, van Heerden 2006a, CDC MMWRs 2006a-c).
Meanwhile, wind hazards may cause injuries from fallen trees, unsafe structures and airborne
debris; while additional storm exposures may include heat-related illness and death, as well as a
laundry list of other health outcomes such as dehydration and lack of basic needs (e.g., food,
water and shelter); burns, often from fires set by candles, punctured gas lines, gas grills or
similar fire hazards; electrocution from downed power lines; carbon monoxide poisonings from
generators which are not properly ventilated; toxic exposures including exposures to chemicals
which may cause skin conditions, chemical burns and rash; and bacterial skin or wound
infections from wading in floodwaters (ibid).
Mutter and R'id of the Earth Institute, Columbia University, New York (2007) have
compiled information in a Hurricane Katrina Deceased-Victims List3 which relays personal
accounts of both pre-existing medical or mental health conditions and the surrounding
circumstances of those closely associated with Katrina victims. Many are vivid accounts
provided by witnesses and family members who also suffered days without basic needs awaiting
rescue.
3 http://www.katrinalist.columbia.edu/index.php

27
Of the many health exposures discussed, similar themes reappeared, particularly among
elderly MSN residents: dehydration, medical complications, lack of medical access,
complications of long-term illness, heat exposure, heart failure, oxygen-dependent individuals
needing supplies, and many others (ibid). Some sheltering in place were cancer sufferers or had
liver disease, respiratory infection or had experienced falls. Some died on rooftops awaiting
rescue or were stranded on the interstate (ibid).
Perhaps related to mental health aspects of disaster, some family members say their
families had died “of broken hearts;” “stress;” “sadness;” or “worry;” from losing their homes
and belongings, and seeing their neighborhoods destroyed (ibid).
Hospitals with patients sheltering in place, such as in New Orleans during Hurricane
Katrina, encountered flooding; generator failures; loss of water pressure, communications and
power; and thus endured conditions of extreme heat; lack of critical supplies; and need for
security (Gray and Hebert 2007. Kuba et al 2004). Flooding in a nearby VA hospitals and
Tulane University Hospital were disrupted by shorted out elevators, requiring medical and
support staff to carry bedridden, oxygen and IV medicated patients up and down stairwells or
into boats, at times needing to be moved with “500-pound heart-pumps” as well as “bariatric4
surgery patients weighing over 600 lbs (ibid, 290-292).” Notwithstanding patient and caretaker
stress, the potential for injury and lack of adequate medical care become apparent.
While actual MSN injuries and storm conditions are difficult to summarize from the
available data, certainly as indicated by the high number of hospital, nursing home and other
likely MSN patients’ deaths during Katrina (section 1.1), risks are understood to be much more
severe for MSN patients sheltering in place in coastal Louisiana.
4 treatment for obesity, such as gastric bypass

28
3.1.2 Why Don’t MSN Patients Leave the Risk Area?
Given recent extreme hurricane events, it is unclear why so many MSN patients remained
in a risk area even as a Category 5 hurricane approached. The literature was again consulted to
help shed light on this question.
Some of the best information supplied as to why MSN patients do not evacuate was
obtained from hurricane shelter surveys conducted in Louisiana (LA DHH 2005a-b); and
Houston, Texas by Brodie et al 2006 and Eisenman et al 2007, both from the American Journal
of Public Health; as well as within CDC Morbidity and Mortality Weekly Reports (MMWRs).
For example, Houston shelter residents who had been evacuated from New Orleans after
Hurricane Katrina were asked in the Brodie et al study (2006) the reasons they did not evacuate.
Their answers primarily included, “lack of transportation” and “underestimation of the storm
(ibid).” In addition, 12% listed “being physically unable to leave” or “having to care for
someone who was physically unable to leave as the main reason they stayed behind (ibid),”
indicating medical issues may have been a substantial determining factor.
Additional evidence supports that difficulty acquiring transportation, lack of resources,
underestimation of the storm and medical issues were major reasons MSN patients did not
evacuate for Hurricane Katrina. Numerous other factors also contributed to the high numbers of
MSN elderly sheltering in place.
3.1.2.1 Lack of Resources or Transportation
Many MSN patients may not evacuate hurricane risk areas due to a lack of resources or
transportation. Certainly, nursing homes and hospitals reported serious difficulty in acquiring
the appropriate type and number of transportation resources (e.g., ambulances) to evacuate
Hurricane Katrina (US DHHS/OIG 2006). This is discussed further in section 3.1.3.2.
29
Economic hardship or lack of resources has also often been cited as a factor hindering
evacuation (Beggs et al 2004, Cutter 2006). In one example, residents surveyed following
Katrina indicated that they had not left the risk area because they did not have enough room in
the car for everyone (Eisenman et al 2007). In another example, the loss of caregivers - who
must evacuate with their own families - may make it difficult for MSN patients to evacuate on
their own (Kirkpatrick and Bryan 2007).
Meanwhile, emergency medical personnel and managers have documented cases of MSN
patients that were dropped off, or who came in on their own to hospitals, nursing home facilities,
or special needs shelters shortly before hurricane landfall (Kosak pers comm. 2007,
McConnaughey/AP 2007, Gray and Hebert 2007, Nursing Home Administrators pers comm
2007, Prats 2003). Many of these facilities are considered hurricane “refuges” by the general
public (Gray and Hebert 2007, p. 285), such that individuals from the community are “admitted
secondary to the storm for weather” e.g., “…Because hospitals are some of the strongest
buildings in the city, doctors often have had fragile patients admitted when a hurricane
approaches, rather than trying to have them evacuated (McConnaughey/AP 2007).”
Federal reports such as Bascetta/GAO 2006, which focused mainly on transportation
issues associated with vulnerable populations, and the US Departments of Transportation (DOT)
and Homeland Security (DHS) 2007 “Catastrophic Hurricane Evacuation Plan Evaluation,” both
concede that evacuation travel can take much longer than expected, particularly in procuring
transportation and loading medical patients. That evacuees may face daunting traffic and
associated health risks is well supported by these sources and disaster researchers such as Susan
Cutter (2006) who has worked extensively with vulnerable populations, transportation and
evacuation issues.
30
“Shadow evacuation” is a term used to describe an evacuation plan or strategy that has
been overwhelmed by evacuations from less-vulnerable areas, congesting the roadways to a near
stand still (ibid). This has happened in recent storms such as Hugo in South Carolina and
Hurricane Rita in Texas. In the latter, an estimated 2.7 million people evacuated the
Houston/Galveston Region; yet the evacuation needs of the population were almost double that
of the planning and accommodations that had been planned for (an estimated 1.2 million,
according to Wells/M2MEDIA360 2006). The situation was described as follows:
“The result was a massive jam of slow-moving traffic with routes choked by voluntary evacuees who impeded the progress of those attempting to leave the storm-surge zone under mandatory evacuation orders… Texas had recently received 470,000 evacuees from Louisiana… In some instances, the trips were painfully long, as shelters filled, and evacuation busses were diverted further inland only to be redirected again at their next destination (ibid, p.1)” After communication issues, sheltering and transportation were the main areas
recommended for improvement in the DHS and State of Louisiana Governor’s Office of
Homeland Security (LA GOHSEP) “Hurricanes Katrina and Rita After-Action Report and
Improvement Plan (2006a).” Action items slated for future follow-up were numerous, but as
related to transportation problems included: the development of transportation databases;
updated plans to ensure adequate transportation assets; transportation to move patients between
shelters; and a better tracking system for evacuees - particularly if evacuated out-of-state (ibid).
According to the state report, operations during the 2005 hurricanes were also hindered
by an inability to effectively credential support staff and supply vendors in Louisiana (ibid),
which likely constrained rescue and effective medical response to a certain degree. The
procurement of emergency generators to power shelters and to serve special needs populations
was an additional recommendation of the report (ibid).
31
3.1.2.2 Fragile Health and Medical Issues
Not surprisingly, complications from medical issues are another major factor that prevent
residents from evacuating during hurricanes. From the Eisenman survey (2007) of Hurricane
Katrina evacuees in Houston, some residents indicated not being healthy enough to drive very
far; that they were on medication that hindered their ability to drive; or expressed inability to
make the trip.
Additional questions may be raised with the discharge of patients by hospitals before
hurricane landfall (Gray and Hebert 2007, Kuba et al 2004); that this does not provide much time
for planning and executing an evacuation on already congested roads, especially for those
recovering from a medical stay or those who are elderly.
Mutter and R’id 2007 provide evidence of medical reasons prompting elderly MSN
residents to shelter in place. One resident was “just out of the hospital and couldn’t go to a
shelter.” Others had complications from surgery, poor eyesight, Dementia and Alzheimer’s.
3.1.2.3 Underestimation of the Storm Threat
There is evidence that some MSN residents are not convinced of hurricane risks when
they decide to shelter in place during hurricanes. As previously discussed, “underestimation of
the storm” was one of the main reasons residents did not evacuate based on the Brodie et al
survey (2006). Meanwhile, of over a hundred nursing home administrators in the coastal
Louisiana parishes south of the interstates, only 19 facilities appear to have evacuated prior to
Hurricane Katrina for an incoming Category 5 hurricane (LA DHH 2007b).
3.1.2.3 Confusion and Fear
Eisenman et al (2007) again add insights from the Hurricane Katrina evacuation
perspective, such as residents who did not receive information from emergency management on
32
where they should go; getting mixed messages on whether they should go or stay; expressing
fear of leaving their homes because of robbery or looting; or decided to shelter in place after
hearing media reports of people getting injured in highway accidents and running out of gas.
In other anecdotal evidence from Mutter and R’id (2007), some residents had just remodeled and
were “afraid of looters” so they decided to ride out the hurricane.
Communication issues were a major problem cited in state after action reports (US DHS
& LA GOHSEP 2006). Work by Edson et al (2007) includes, “A Systems Analysis of Special-
Needs Population Evacuation during Catastrophic Events” demonstrating in many cases how
much differently execution in the Hurricane events of 2005 differed from plans as designed.
3.1.2.4 Resignation, Stubbornness or Unexplainable Factors
In yet other cases, reasons that potential MSN patients such as the elderly refused to
evacuate, as described by friends and family members, were difficult to comprehend. Their
explanations varied from impressions of stubbornness, apathy, denial, an unwillingness to step
outside of comfort levels, shock, or resignation (Mutter and R’id 2007, Gibson and Hayunga
2006, and other anecdotal evidence and accounts).
It has been suggested by the initial data that elderly populations were disproportionately
affected by the Hurricane Katrina event, and that elderly have age-associated medical special
needs as well as disabilities. In addition, a research report prepared by the American Association
of Retired Persons (AARP) Public Policy Institute (PPI) by Gibson and Hayunga 2006, “We Can
Do Better: Lessons Learned for Protecting Older Persons in Disasters” discovered that older
residents who live independently or in larger households may generally find evacuation to be a
hassle, a long trip and not suited to their needs (e.g., maneuvering an information point or rest
33
area). They also fear being an undue burden on their families (Gibson and Hayunga 2006), and
for these and many other reason may decide to shelter in place (Mutter and R’id 2007).
Michael Weston, Director of Emergency Field Operations for the U.S. Administration on
Aging perceives that the overwhelming inconvenience of the ordeal may cause elderly to
rationalize staying through storms. In ensuring actionable plans for the evacuation of seniors, he
advises:
“Many older adults feel they are ready ‘if it’s their time to go.’ One strategy is to remind them that if it is not “quite” their time; they could be in for several weeks of misery while waiting for help (Gibson and Hayunga 2006, p 65).” Additionally, some elderly indicated they had “lived through Betsy in 1965 (Mutter and
R’id 2007).” Others did not want to leave the homes their families had built “with their own
hands (ibid);” Some simply said “I’m too old for this;” “It’s in God’s hands;” “You go on,
we’ve lived our lives;” and “Whatever happens, we’ll go together (ibid).” Many did not want to
leave their husbands or families (ibid).
3.1.3 Factors Dominating MSN Decision-making
It has been determined that there are health risks to both evacuation and sheltering in
place for MSN patients, and that MSN patients may remain in a risk area for reasons ranging
from transportation availability to inconvenience. Questions necessary follow as to what
decision processes MSN decision-makers apply when they weigh their hurricane health risks,
and which are the over-riding factors that dominate their decisions to evacuate or shelter in place.
To answer this question, it is important to review briefly that, as discussed in section
1.5.1, MSN decision makers may include hospital CEOs, nursing home administrators, parent or
sister facilities, facility owners, nurses, staff, maintenance personnel, and others (Dosa et al
2007, Gray and Hebert 2007, Kirkpatrick and Bryan 2007, DHHS/OIG 2006). The public living

34
in households or group residences and requiring varying levels of medical support and care are
also decision-makers, as they must weigh the risks of evacuation and sheltering in place during
hurricanes as well (Kirkpatrick and Bryan 2007, Fernandez et al 2002).
Additionally, it should be re-iterated that MSN facilities and residents may not have the
capabilities to be in close communication with emergency management at all times. MSN
decision-makers may evaluate their hurricane risk by other available sources (e.g., from past
experience or the media, and other factors besides physical hurricane risks); will consider heavily
the health risk to move a patient or loved one and available resources; and will determine which
immediate actions they will take (Dosa et al 2007, Gray and Hebert 2007, Kirkpatrick and Bryan
2007, DHHS/OIG 2006). Thus, the decisions they make may be in direct conflict with the
hurricane information and evacuation strategies of local emergency management and police.
Finally, it should again be noted that in most Gulf States including Louisiana, local
emergency managers, officials and the Governor can issue voluntary and mandatory evacuations.
However, there is currently no mechanism to enforce an evacuation of a nursing home, hospital,
private facility or residence other than, in some cases, to impose sanctions or penalties for
violations such as deficiencies or fines on a facility (LA DHH 2007c, Gray and Hebert 2007,
Nursing Home Administrators pers comm 2007).
3.1.3.1 Hospitals Vulnerabilities in a Hurricane Emergency
Decision strategies of hospital administrators related to evacuation are based on factors
which are unique to their facilities and patients. Hospital vulnerabilities in an emergency
however are numerous and appear to weigh heavily into evacuation and sheltering decisions.
The most frequently cited recent articles related to hospitals and field hospitals for this
study include Gray and Hebert 2007 “Hospitals in Hurricane Katrina: Challenges Facing

35
Custodial Institutions in a Disaster,” from the Journal of Health Care for the Poor and
Underserved; Klein and Nagel 2007 “Mass Medical Evacuation: Hurricane Katrina and Nursing
Experiences at the New Orleans Airport;” and Deal et al, “Challenges and Opportunities of
Nursing Care in Special-Needs Shelters,” both from the Journal of Disaster Management and
Response. Inside accounts are provided in these sources by medical professionals who
experienced working with MSN individuals in a hurricane emergency, whether in formal or field
hospital settings or in special needs shelters.
Of import to this study, there are indications that the hospitals that experienced high
mortality during Katrina differed from most other hospitals in one major aspect: they had non-
traditional medical units on site including hospice and “long-term-acute care” patients who may
have been seriously ill (Gray and Hebert 2007. Kuba et al 2004). Therefore, the types of patients
and their critical medical status may introduce the single largest vulnerability.
Custodial institutions such as hospitals will often discharge ambulatory and stable
patients ahead of a storm in anticipation of a surge of new patients, including nursing home
patients and people who will come in from the community (Gray and Hebert 2007). As already
mentioned, from the community perspective, both nursing homes and hospitals may still be
viewed as “refuges” and the place to take or drop of MSN patients and family before hurricane
landfall (ibid, p. 285, Nursing Home Administrators pers comm 2007). This is particularly true
if the facility has held up well through past storms (ibid). Hospitals in a risk area therefore run
the risk of exceeding patient capacity even before hurricane landfall (see also, Appendix C).
However, the remaining hospital patients are generally not stable enough or able to be
easily moved (ibid). Many hospital patients cannot be discharged prior to a storm and evacuated
without significant planning and time, such as those “recovering from surgery or debilitated by
36
disease;” those “dependant on medical assistance to breathe… demented patients, newborn
babies” and others, including hospital patients “requiring dialysis and those transferred from
nursing homes (Gray and Hebert 2007, p. 285).”
Some detailed analyses of hurricane performance have been conducted on major
Louisiana hospitals (e.g., Gregg 2006 on West Jefferson Hospital in “Development and
Application of Methods for Evaluation of Hurricane Shelters”). However, most hospitals are not
designed for emergency power (ibid), and in the case of Hurricane events like Katrina, were not
otherwise prepared to accommodate the onslaught of patients that would soon be under their
care, particularly as the emergency escalated, reinforcements and supplies were delayed, and
conditions worsened. Thus, hospitals are inevitably ‘set up’ for serious hurricane health
outcomes.
Dr. Ben deBoisblanc, a critical care expert at Charity Hospital described his experience
during Hurricane Katrina,
“At Charity Hospital…I and nearly 60 other staff doctors, nurses, and residents were stuck in a hospital without electricity, without water, without food, for five days with about 340 patients, 50 of them critically ill. We had no ability to use ventilators, so we had to squeeze ambu bags by hand to get air into their lungs. We had no monitoring equipment, no X-ray, no laboratory, no dialysis. Compounding all this, we were unable to have families at the bedside — or even available by phone — to participate in treatment decisions for the sickest patients. It was very, very difficult (Haber/AP 2006).”
3.1.3.2 Nursing Home Vulnerabilities in a Hurricane Emergency
An important Federal study of “Nursing Home Emergency Preparedness and Response
during Recent Hurricanes” was conducted by the United States Department of Health and
Human Services (US DHHS), Office of the Inspector General (OIG), August 2006. This study
directly interviewed MSN facility administrators across the Gulf States related to numerous

37
hurricane events to better understand the vulnerabilities and decision strategies of evacuation and
sheltering in place for coastal nursing homes.
Additional work on nursing home vulnerabilities in disaster cited frequently throughout
this study are by Dosa et al (2007) “To Evacuate or Not to Evacuate: Lessons Learned from
Louisiana Nursing Home Administrators Following Hurricanes Katrina and Rita,” Journal of the
American Medical Director’s Association. The authors have emphasized numerous problems
encountered in nursing home evacuation and sheltering (see also, section 1.3)
US DHHS/OIG (2006) results indicated that, of the Gulf State nursing homes surveyed,
“All nursing home administrators reported that an evacuation can cause physical and mental stress on nursing home residents, and consequently is not necessarily the best course of action for residents during hurricanes. Administrators also reported that sometimes sheltering on place is the safer (and also less expensive) alternative, particularly in the case of hurricanes during which storms can quickly shift and reduce risk to residents and staff (US DHHS/OIG 2006, p. 8).” Gulf State nursing home administrators and decision-makers expressed problems
encountered during recent hurricanes, either having evacuated or sheltered in place. Major
problems included being unable to secure adequate “space in other nursing homes to
accommodate all residents (DHHS/OIG 2006, p. 10).” Many had prior contracts with
transportation that fell through “days or hours” before evacuation when vehicles were needed by
other facilities more likely to be directly affected by the hurricane (ibid). In some cases,
“…multiple nursing homes contracted with the same companies, typically the company used for
routine ambulance services (ibid, p. 10).”
Travelers were be exposed to high temperatures in traffic and depletion of supplies such
as adequate water, while medical or “medication needs” complicated travel such as not being
“readily available during transit” or “improperly packed and supervised (ibid, p. 10-11).” During
some nursing home evacuations there was an identified need to “prevent residents from

38
inappropriately exchanging medications (ibid, p. 11)”. Dosa et al (2007) identified even more
problems ranging from difficulty in transporting frail residents to inadequate staffing.
Findings released on a Federal-state survey of nursing homes in coastal Louisiana in
2006 for issues such as staffing, emergency power and supplies were summarized in the press as
“most…homes had neither an adequate way to move patients out of harm’s way nor a suitable
place to put them once they got there” (Shuler/Baton Rouge Advocate, Nov 2006). Later
hurricane shelter suitability surveys and briefings however reported substantial progress in these
areas (US DHHS/LSU HC 2007, LA DHH 2007b).
Nursing home vulnerabilities specific to Louisiana in hurricane emergencies were
discussed in detail by Prats 2003, “Multiple Criteria Decision Making (MCDM) Application in
Evaluating Nursing Home Emergency Preparedness Plans in Louisiana,” as referenced
throughout this study. As previously discussed, she identified major problems with topics
ranging from moving critical care patients in an evacuation to accommodating nursing home
patients in state shelters. Her study focused specifically on Louisiana nursing homes and their
preparedness plans, outlining methods to resolve the multiple criteria that must be arranged and
prioritized within a meaningful framework to make better decisions on all levels regarding
nursing homes. Prats identified the need to resolve the many agency and organizational disputes,
both laterally, horizontally ands inter-agency, which seemed to put nursing home evacuation
plans at odds when agencies viewed their directives or goals as mutually exclusive.
3.1.3.3 Elderly Vulnerabilities in a Hurricane Emergency
Kuba et al (2004) “Elderly Populations in Disasters: Recounting Evacuation Processes
from Two Skilled-Care Facilities in Central Florida, August 2004” and Fernandez et al (2002)

39
“Frail Elderly as Disaster Victims: Emergency Management Strategies” were some of the major
sources for identifying evacuation risks to elderly throughout the current study.
In addition to the factors that may have hindered MSN elderly evacuations as discussed
in section 3.1.2, elderly may have sensory impairments, mobility disabilities, and potential
language or cultural barriers (USFA EMI 2003, p.1.9). The elderly are often “more susceptible
to heat and cold, creating potential crisis situations when air conditioning and heat are not
available;” often have “memory disorders, such as Alzheimer’s or senility;” and may be at risk of
“transfer trauma if they are forced to leave their homes (ibid).” Many studies have shown that
dislocation without care can cause illness and even death in senior citizens (ibid).”
The elderly may experience dementia, delayed response syndrome (slow response in a
crisis and poor understanding of impending danger), and fear of institutionalization (being
transferred to a nursing home) when emergency responders attempt to assist them in a rescue
situation (Missouri SEMA 2007).
According to a 2005 US Census Bureau survey, nearly half (46.6 percent) of the
household population 65 years and over in Louisiana had some form of disability.5
Recent studies at LSU have shown that the longer an individual has lived in New
Orleans, the less likely they are to leave (Beggs et al 2004). Although no clear relationship was
supported, preliminary data suggests that the likelihood of evacuation declines with age (ibid).
Brodie et al (2006) also present evidence that low-income, minority households with elderly or
disabled residents are less likely to evacuate than other households.
Specific to the elderly, surveys also indicated older residents that had made it through
Betsy and Camille weren’t evacuating, or had mobility or medical disabilities such that their
5 This includes household population only, excluding the population living in institutions and other group quarters such as nursing homes or hospice
40
families would not leave them behind (Beggs et al 2004, Mutter and R’id 2007, Callimachi/AP
2006 and others).
As previously discussed, reasons that the elderly refused to evacuate as described by
friends and family members ranged from impressions of stubbornness, apathy, denial, an
unwillingness to step outside of comfort levels, shock, and resignation (Mutter and R’id 2007).
As emphasized by Mayhorn 2005, Natural Hazards Review “Cognitive Aging and the
Processing of Hazard Information and Disaster Warnings” and others, more study is needed to
determine how MSN and elderly individuals process information and respond to hurricane
threats.
Taken in combination with section 3.1.2.4, these various explanations finally begin to
make sense of why so many MSN elderly appear to have remained in the risk area during
Hurricane Katrina, and why so many did not evacuate.
3.1.3.4 Disabled and Other MSN Patient Vulnerabilities in a Hurricane Emergency
MSN disabled become most vulnerable in hurricane emergencies when evacuation and
sheltering systems cannot accommodate the diversity of their needs. Deal et al 2006, in
“Challenges and Opportunities of Nursing Care in Special-Needs Shelters,” outline the care
given to a wide spectrum of individuals including nursing home patients, people with mental
retardation and long term physical disabilities, and those who had lost their homes (ibid). Major
problems encountered included “unavailability of medications, treatment and ancillary supplies,”
and identifying patients, as well as privacy, confidentiality, and other management concerns
(ibid, 102).
Medically fragile residents who depend on family members for care are subject to the
resource and medical information limitations of that household in a hurricane emergency.

41
Critical medical decisions also appear often times to be made on an emotional level (e.g., family
members will shelter in place to care for medically fragile loved ones). Among the examples of
Hurricane Katrina and medically fragile patients who did not or could not evacuate, one story
details a son who had decided to remain in New Orleans to care for his elderly mother. She had
“broken her hip in 2000, was bedridden and had a feeding tube attached to her stomach. Because
of her fragile health, her son thought it would be imprudent to move her when the city called for
a mandatory evacuation, one day before the storm made landfall…(Callimachi, 2006)” This
MSN patient was ultimately exposed to heat and dehydration and later died before rescuers or
medical support could retrieve her from the Convention Center.
MSN patients, particularly the immuno-compromised, are almost certainly exposed to
increased health risks in shelter environments (Diaz 2003-07). Hurricane sheltering in Louisiana
includes extensive plans for state run Special Medical Needs Shelters (SMNS); shelters for state
transported evacuees with critical transportation needs (CTNS); and parish run shelters, some of
which are staffed by the American Red Cross (ARC); and faith-based shelters (LA GOHSEP,
May 18, 2006). However, unlike nursing home or hospital care settings, shelter conditions are
not always well-suited to the MSN patients they are designed to serve, and specialized medical
care may not be available.
During Hurricane Katrina in New Orleans, State Epidemiologist Raoult Ratard, MD
warned specifically of his concern for shelters due to their risk levels for infectious disease. He
indicated, “The problem is not going to be from New Orleans, it’s going to be from the shelters”
where “contagious disease” risks are “considerable (Barclay 2005).” One of the other major
problems he indicated were that shelter residents experienced a loss of their individual health

42
support systems (ibid). Many sheltering in place are thus destined to become additional MSN
patients.
As previously discussed, MSN patients with chronic health conditions are highly
vulnerable in hurricane emergencies when their access to medical care, equipment or medicines
is disrupted. Some of the most common reasons for hospital admission immediately following
Hurricane Katrina according to the CDC were “heart disease (26.6%), nondiarrheal
gastrointestinal illness (12.3%), mental health conditions (6.7%) and heat-related illness (6.1%)
(CDC MMWR 2006a).” Chronic diseases are being addressed more in the literature (Ford et al
2006, Mokdad et al 2005) as one of the main problems identified in follow-up care after
hurricanes. Chronic conditions are common among MSN patients and the elderly as discussed
throughout the current study.
In review, Houston shelter surveys conducted by Brodie et al 2006 identify that “…41%
of all Houston shelter residents reported chronic health conditions such as heart disease,
hypertension, diabetes, or asthma.” CDC reports also indicate “…during Sept 1-22, chronic
illness (e.g., diabetes, asthma, emphysema, and cardiovascular disease) was the most commonly
reported category in evacuation centers (ECs)…(CDC MMWR 2006b).”
3.1.3.5 Louisiana Policy Initiatives Affecting Medical Special Needs
In Louisiana, hurricane emergencies are locally managed by parish emergency managers
and their partners, including police, fire and EMS. Hurricanes are also centrally managed from
the GOHSEP in the Emergency Operations Center (EOC), which houses many state, federal and
military agency representatives (such as the Louisiana National Guard) during an actual
emergency.
43
Of note, GOHSEP operates under the National Response Plan (NRP), with an Incident
Command System (ICS) Structure (Blanco 2006) or National Incident Management System
(NIMS)/ Incident Command System (ICS) Unified Command (US DHS & LA GOHSEP 2006a).
The NRP will directly affect the management of MSN evacuation and sheltering whenever it is
activated. Technically the NRP is always considered “in effect” but the level of coordination is
“flexible and scalable” depending on the situation (US DHS 2006b, p. 1). The NRP and NIMS
are considered “companion documents,” in that NIMS provides a “template for incident
management” at any level, while the ICS can accommodate multiple agency coordination when
more than one have jurisdiction in an emergency event (ibid, p. 5).
All hurricane emergencies begin by being managed at the local level. When resources or
capabilities become overwhelmed, local emergency managers and decision-makers have
established protocols in the NRP which they will use to call upon the state and then Federal
government as needed for reinforcements.
As evidenced during Hurricane Katrina, communication, coordination and timing are all
crucial if the NRP is going to work effectively. Further, command and control issues (i.e., who
is in charge, who has authority, who is responsible for making decisions, and any necessary legal
information that would stall these actions), play a large role in an effective unified response to a
disaster.
Arranged under the NRP, Louisiana state and other partner agencies are grouped as
Emergency Support Functions (ESFs) at the state EOC. ESFs are defined as:
“…the primary means through which the Federal government provides assistance to State, local, and tribal governments or to Federal departments and agencies conducting missions of primary Federal responsibility… ESFs were established …as an effective mechanism to group capabilities and resources into the functions that are most likely needed during actual or potential incidents where coordinated
44
Federal response is required (e.g., Transportation, Firefighting, Public Health, etc.) (ibid, p.14).” ESF 1 (Transportation) is responsible for transportation and evacuation. ESF 1 is
supported by ESF 8 (Public Health and Medical Services). ESF 6 (Mass Care, Housing and
Human Services) and ESF 8 work together to provide MSN sheltering in a hurricane.
The Louisiana Department of Health and Hospitals (LA DHH) is tasked, among many
other responsibilities, to “establish criteria for evacuating healthcare facilities by identifying
threats, developing plans and evaluating and validating plans (US DHS & LA GOHSEP 2006a,
p. 2-26).” The LA DHH Bureau of Emergency Medical Services (BEMS) within the Office of
Public Health (OPH) Center for Community Preparedness, Emergency Preparedness and
Response is responsible for planning and coordinating “state-level pre-hospital medical response
to disasters;” supporting “local response efforts by providing supplemental pre-hospital medical
sources (e.g., contracted and mutual aid private and public EMS resources);” arranging “for
evacuation of the special needs population, hospitals and nursing homes” and for the “movement
of injured disaster victims to hospitals, SpNS and TMOSAs in areas/regions not impacted by the
disaster (Blanco 2006, LA DHH Appendix 9, p. A-9).” As recently described by BEMS:
“The primary concerns for BEMS during weather-related emergencies include the evacuation of acute and long-term care facilities threatened with flooding, emergency support to home health care patients and medical support to the medically fragile who are evacuated. In addition to these responsibilities, BEMS has been tasked with the deployment and maintenance of medical response equipment and supplies (ibid, A-9).” Louisiana nursing homes are subject to the State of Louisiana Model Nursing Home
Emergency Plan and quality measures reported to the Centers for Medicare & Medicaid (CMS)
(Sadden et al 2005). Act 540 (2006) is a new initiative in Louisiana providing for promulgation

45
of rules and protocol for the evacuation or sheltering in place of nursing homes in the event of an
oncoming hurricane.
For local governments in Louisiana working to evacuate MSN patients in a hurricane
emergency, the Americans with Disabilities Act (ADA 1990) would be most relevant in
implementing strategies to be put in place for individuals with disabilities. These would relate to
notification and access to information; evacuation and emergency transportation; sheltering; and
access to medical care, medications, mobility devices, and service animals while in transit or at
shelters (DOJ CRD/DRS 2004). Title II of the ADA mainly concerns government entities, and
prohibits discrimination against persons with disabilities; Title III affects more non-
governmental entities providing public service (e.g., ensuring ADA accessible entrances, toilets
and shelter areas); and Title IV deals with communications (ibid) such as telecommunication
requirements (e.g., teletypewriters or TTY - devices used to communicate with the hearing
impaired via telephone), FCC regulations on open and closed captioning, and the Emergency
Alert System on TV and radio (USFA EMI 2003).
Presidential Executive Order 13347 (July 26, 2004) “Individuals with Disabilities in
Emergency Preparedness” mandates that those with disabilities must be considered in emergency
preparedness plans.
Looking more locally at Louisiana policy initiatives affecting MSN evacuation planning
and decision-making, in New Orleans following Hurricane Katrina, the city is reviewing and
implementing new strategies for city-wide evacuation. For example, Mayor Ray Nagin
announced in May 2006 that neither the Superdome nor the Convention Center would be used as
a ‘refuge of last resort’ in future storms. However, the Convention Center is planned be used as
a staging area for buses to take critical transportation needs (CTN) residents from designated

46
pick up sites around the city to shelters outside the metro area (Schleifstein/Times-Picayune
2006).
Other changes and initiatives that may impact MSN patients include that “Elderly
residents and those with medical problems will be taken to Union Station [Union Passenger
Terminal] and put on Amtrak trains out of the city (ibid).” Additionally, “people living in
FEMA trailers will be ordered to evacuate whenever a tropical storm with winds above 40 mph
approaches the city” and “bused evacuees will be able to take their pets if in cages or containers
(ibid).” Of note, special needs registration is being attempted with eligibility based on “having
reliable transportation” and “… [if individuals] cannot afford fuel or hotel costs, or have medical,
physical or psychological conditions that could prevent them from evacuating (ibid).”
3.1.3.6 MSN Initiatives in Other Hurricane-Prone States
Reviewing briefly MSN initiatives in other hurricane-prone states such as Florida, Texas
and North Carolina, it is interesting to note that special needs evacuation lists have been required
of many Florida counties for years, with officials updating the lists through networking and
relationships with “aging and health care facilities (Olsen 2005).” Florida Statutes actually
include:
Registry of persons with special needs; whereby local emergency management agencies must: “…maintain a registry of persons with special needs, identify needs and plan for resource allocation to meet those needs… [and] …to assist the local emergency management agency in identifying such persons, home health agencies, hospices, nurse registries, home medical equipment providers, the Department of Children and Family Services, Department of Health, Agency for Health Care Administration, Department of Education, Agency for Persons with Disabilities, and Department of Elderly Affairs shall provide registration information to all of their special needs clients and to all persons with special needs who receive services. The registry will be updated annually (252.355).”
47
Florida residents are given the option for pre-authorized entry of search and rescue
personnel following disasters. Additionally, emergency and disaster planning provisions provide
assistance to persons with disabilities and include the:
“…designation of an emergency coordinating officer, a procedure to contact special needs citizens, registry and dispatch, and essential support services to organizations before, during and after disasters (252.356).” Florida is also forward-thinking in its adoption of strict building codes. Following
Hurricane Andrew in 1992, Florida instituted some of the strongest building codes in the nation
for its coastal parishes (Levitan pres comm 2007). Louisiana’s statewide adoption of the
International Building Codes is only now scheduled to take effect in 2007 (ibid).
In other policies, following Hurricane Rita, Governor Rick Perry issued Executive Order
RP57 (March 2006) to improve mass evacuation in Texas including provisions for people with
special needs. Some coastal cities such as Galveston have had voluntary special needs registries
prior to Hurricane Rita. These listed residents requiring ambulance transport and in some cases
prescription and medical equipment needs (Olsen 2005). Houston designated the city 3-1-1 help-
line prior to Hurricane Rita to register anyone needing evacuation assistance (ibid). Currently,
Texas is developing a statewide special-needs database entitled the “Transportation Assistance
Registry” to be shared with local emergency management. Local Emergency Mangers will
contact the individual, arrange for transportation to a pick up point, and the state will arrange for
their further evacuation location (Wells/M2MEDIA360 2006). 2-1-1 call centers are also being
established with individual categories of special medical needs ranging from 1 “minor and
ambulatory” to 5 – “severe and requiring life support (ibid).” Some locals are also taking the
initiative to develop their own databases for their areas (Olsen 2005). Louisiana is pursuing
similar initiatives with coastal parish pick-up points.

48
Both Texas and Louisiana are developing tracking evacuation systems that may
incorporate GIS. In Texas,
“At the departure points, evacuees including their pets, will receive an RFID wristband with a barcode that links them with a record entered into a template by typing the information into a laptop computer or using magnetic card readers and bar code scanners to enter Texas ID cards, drivers’ licenses and other forms of state identification (ibid).” The intent is for real-time data upload and tracking of evacuees. GPS units are a future
option being explored to track buses and expected supplies, as well as to geo-code evacuation
routes to provide an overall “operational picture (ibid).”
Following Hurricane Floyd (1999), North Carolina has developed an innovative and
alternative way to support MSN planning. Special Operations Response Teams (SORTs)6 have
been created to support what they term the “alternate medical care population.” Their mission
includes:
“to meet the Special Medical Needs of those individuals who are either homebound or in assisted living facilities in times of disaster. This division will provide pre-disaster planning assistance, an emergency response team to coordinate disaster response, and the equipment, supplies, and personnel to establish a Special Medical Needs Shelter. This division works closely with the Medical and Logistics Divisions to provide the care required in an Alternate Medical Care Facility… The Division's goal is to provide support for the Alternate Medical Care population in order that they may remain in their current residence and when that is no longer feasible, to mobilize and maintain an Alternate Medical Care Facility (SORT 2007).” NC SORT teams have established MOUs with area shelters including colleges and
churches; have an emergency number which local residents may call; consist of multi-agency
representatives on teams; have an available stockpile of supplies; and have even planned to
provide childcare to SORT volunteers (ibid).
6 http://www.sortteam.org/spneeds.html

49
3.2 Physical Aspects of Hurricanes
In determining actual hurricane risk to medical facilities such as hospitals, nursing homes
and other MSN facilities or residences in coastal Louisiana, this study necessarily reviews the
reality of 2005. Recent Hurricanes Katrina and Rita provide an example of how quickly storms
can reach catastrophic strength in the Gulf of Mexico, and their potential for destruction.
Physical aspects of hurricane storm surge and wind and their impact on critical infrastructure
along the coast are detailed in the following section. The impacts of these storms can serve as a
conservative, yet reasonable estimate of risks that an MSN facility could endure; but should also
be kept in perspective and viewed against an historical back-drop.
3.2.1 2005 Hurricanes Katrina and Rita: Wind and Surge
Louisiana was hit with a ‘one-two punch’ to the coastal southeast and southwest,
respectively, in a single year. Beginning on 29 August 2005 with Hurricane Katrina, which
impacted much of the greater metropolitan area surrounding New Orleans, Hurricane Rita made
Louisiana landfall approximately a month later on 24 September. Both storms had achieved
maximum storm strengths of Category 5 on the Saffir-Simpson scale for Hurricanes (see
Appendix A) while in the Gulf of Mexico. Storm winds and surge diminished slightly over some
of Louisiana’s last remaining coastal defenses, now comprised mainly of slivered barrier islands
and fragmented marsh (van Heerden 2007, Barras/USGS 2006, Guidroz et al 2006 and others).
However, for those who sheltered in place to ride out the storm in coastal Louisiana, the
maximum sustained winds realized were likely well over the recorded 87 mph clocked in before
measurement instruments snapped for Katrina; and 120 mph for Hurricane Rita, with
substantially higher wind gusts for both (Knabb et al 2006, Guidroz, et al 2006).

50
Meanwhile, both storms retained much of their Category–five storm surge potential (due
to inertia, Levitan pers comm 2007) even though making landfall closer to Category 3 storm
levels. Walls of storm surge pushed ashore by Hurricane Katrina were over 19 feet in some
areas of east New Orleans, St. Bernard and Plaquemines Parishes in southeast Louisiana
(although measurements were again sparse as equipment was damaged by the surge), and as
much as 14-15 feet in areas of Cameron Parish for Rita (ibid).
Those who lived through these life-changing storms in Louisiana will recall that initial
Katrina reports were encouraging. The Superdome, with separate areas having been used as a
general population and special needs shelter for the storm, had only incurred minor damage to
the roof. Most of the New Orleans Protection System7 was reported to have initially held. But
reports of the worst flooding had not yet come in. The true extent of flooding in the ninth ward
and St. Bernard parish - which had literally been devastated – was realized soon after, followed
by reports of unexplained rising water in residences and hospitals, where people had been
sheltering in place in the city.
Katrina generated up to 20 feet of storm surge and waves (van Heerden et al 2006b),
propagated by storm winds through Lake Borgne and funneled into New Orleans through a reach
of the Mississippi River Gulf Outlet (MRGO), battering and disintegrating eastern levees and
eventually sections of the Industrial Canal. The resultant breaches sent high velocity flows (ibid,
Mashriqui 2006a) into neighborhoods in the early morning. Over 200 residents are estimated to
have drowned in their homes (Boyd pers comm 2007). As the storm tracked north towards
Mississippi, Katrina surge then poured into Lake Pontchartrain and into city canals such as 17th
Street and London Avenue (van Heerden et al 2006b), snapping and bending the canal walls in
7 A system of ringed Federal, state and local levees and canals that provide storm surge protection for the city and surrounding areas.

51
what numerous witnesses described as ‘sounding like explosions.’ Reports of rising water
intensified as flood levels equalized. Nurses called in to radio stations reporting rising
floodwaters at hospitals in the Central Business District; Levee breaches were suspected and then
confirmed. Over 1,464 in Louisiana died, not counting the other as-yet unrecorded losses, such
as the over 130 remaining Katrina missing, many who likely drowned but whose bodies were
never recovered. From the available data, many were elderly residents who died in their homes
(LA DHH 2006a; Boyd 2006).
Hurricane Rita soon after delivered a swath of hurricane surge as far inland as Lake
Charles and New Iberia in Louisiana, and reflooded parts of New Orleans through as-yet
unrepaired hurricane protection structures, with both far-reaching surge and rainfall. Although
details are unclear, as many as a hundred deaths may be attributed to Hurricane Rita (ibid), many
occurring as a result of the evacuation out of Houston prior to the storm, and many possibly
elderly.
3.2.2 Louisiana Historical Hurricanes 1905-2005
Following Hurricanes Katrina and Rita, whose intensities and impacts were
unprecedented in Louisiana, it is important to place this destruction in the context of previous
hurricane events. Particularly when planning for future storms, the natural questions become,
“What hurricanes can we expect next?” “What is likely, and what is worst case?” and, as some
scientists have warned due to climate change and sea level rise, “Will hurricanes be more
frequent and more intense?” or even, “Is this the age of ‘megastorms?’
Helping to shed light on some of these questions, the National Oceanic and Atmospheric
Administration (NOAA) Coastal Services Center (CSC) has made historical hurricane tracks
available for US hurricanes dating as far back as the mid nineteenth century. The dataset

52
includes storm name, year, dates, track, central pressures, and wind speeds, and is now available
in GIS shapefile format.8 This introduces new options for querying and mapping selected storm
data in a GIS. Storms striking Louisiana can be selected for time period, storm intensity and
dates, with historical tracks that can be mapped.
However, it is important to note the main limitations that will affect analysis of the data.
LSU climatologists note,
“Major changes in the observation methods of tropical storms begin with land and ship observations from the beginning of [the] record in 1851. In the 1940s, military aircraft reconnaissance was first used to monitor hurricanes. Then in the late 1960’s, satellite surveillance became a dominant observation method… (Keim and Robbins 2006, L21706).” Chris Landsea of NOAA’s Hurricane Research Division (2001) shares this opinion that it
would be an “erroneous conclusion that major hurricanes became much more numerous in 1943
(p. 2871)” since that was the year planes actually started flying into hurricanes to obtain
measurements. Prior to that, the quality of data obtained by US naval ships or buoys noting
storm tracks and pressures by land and sea would have been closely proportional to the distance
at which measurements could be taken (Romolo pers comm 2007), with actual intensities “likely
to be drastically underestimated (Landsea 2001, p. 2871).”
For example, no Category 4 or 5 storms are recorded to have made landfall in Louisiana
according to the dataset for the first half of the century, which is in stark contrast to the second
half, where there are seven total. Therefore, any analysis of these data should take into account
that methods of data collection have vastly improved since the first records, and that these data
may have serious limitations prior to the past few decades. Landsea also hypothesizes a
“consistent overestimation of… intensity during the mid-1940’s through the late 1960’s (ibid),”
8 Atlantic basin storm tracks: http://maps.csc.noaa.gov/hurricanes/download.html

53
and that populations in some areas of coastal Louisiana may not have been sufficient for accurate
record-keeping in the earlier part of the record (2005).
3.2.2.1 Increased Hurricane Activity Expected For Decades
On the other hand, it is valuable to capture climate cycles currently being debated in the
literature when selecting a time scale over which to view the data. Of the many hypothesized
climate factors or cycles which may have the potential to affect the frequency, intensity or path
of a hurricane,9 the Atlantic Multidecadal Oscillation (AMO) is particularly relevant to the next
few decades.
Hugh Willoughby, hurricane researchers at Florida International University, and climate
scientists such as Gray, Landsea, and others, support the theory that hurricane activity is cyclical,
and that the recent hurricane activity (e.g., in 2004 - Florida was hit by four hurricanes in a single
season - and 2005) is part of a “natural cycle of hurricane activity” (Coats/St. Petersburg Times
2005). Specifically, “there are multidecadal shifts of Atlantic major hurricanes…and a return of
the active regime in recent years …the years since 1995 have marked a substantial shift to a
higher frequency of major hurricanes (Landsea 2001, p. 2871).” Some climate scientists
therefore predict another 10 to 20 years (Coats 2005) or more of increased hurricane activity.
3.2.2.2 Climate Change and Sea Level Rise May Worsen Hurricane Impacts
Alternately, there are numerous climate scientists (e.g., Webster, Knutson and
Emmanuel, who study climate change impacts on hurricane frequency and intensity) who
support the theory of more frequent or more intense hurricanes, on account of global warming
and increasing sea surface temperatures. While to date, these scientists indicate only a gradual
increase (on the order of 5%) over the next 100 years (Knutson 2004, Emmanuel 2004), not
9 including the Bermuda High (Azores High) and El Niño Southern Oscillation (El Niño/La Niña); however these change seasonally or last only a few years. They are important climate factors however in determining hurricane track (the Bermuda High often acts as a steering current) and formation (El Niño tends to impede hurricanes).

54
impacting the cyclical likelihood of storm frequency or intensity by much; certainly, sea level
rise could add to storm surge risk over the coming decades. Other potential impacts of climate
change include increased precipitation (IPCC Climate Change 200110), which could increase
rainfall and flooding risks.
Despite the fact that data measurements may be less accurate during the early part of the
century, it is relevant to try to look at as many historical Louisiana hurricanes as possible and to
include at least a few AMO cycles. This helps to conceptualize if there are any similarities
between past and current warming and cooling trends and if these could be projected to get an
outlook of what to expect for upcoming Louisiana storm frequencies and intensities. Viewing a
century or so of data (1905-2005, to include the recent season) provides a good baseline from
which to view approximately four AMO cycles, as well as to see where Hurricanes Katrina and
Rita rank in terms of intensities, from a historical perspective.
Working with NOAA CSC historical hurricane data, Appendix D provides a ‘snapshot,’
or visual understanding of the storms, reviewing over a century of recorded Louisiana
hurricanes. Hurricane intensities were estimated at landfall in Louisiana and were generated
from the GIS track data. Therefore, the tables (Appendix D) will not be directly comparable to
formal records of NOAA historical hurricane data. The tables were designed to provide a larger
overview only, of landfalling hurricanes as they impacted the Louisiana coast.
Storms 1, 2 and 3 represent as many as three subsequent storms which may have made
landfall in Louisiana in a given year. The maximum windspeed as storms approach landfall is
represented in knots. The windspeeds applied in this analysis resulted from selecting shapefiles
of historical tracks on the NOAA viewing tool11 for storms within the Gulf of Mexico, and
10 http://www.grida.no/climate/ipcc_tar/ 11 http://maps.csc.noaa.gov/hurricanes/viewer.html

55
capturing approximately 58-72 hours of associated data in shapefiles as storms approached the
coast. These few days and hours before a storm makes landfall on the Louisiana coast are most
relevant to MSN planning for evacuation.
Data were exported to Microsoft Excel, and windspeeds were converted from knots to
miles per hour (mph). Each storm event was then coded as tropical storm or Category hurricane
level 1-5 (see also Appendix A: Saffir-Simpson Scale for Hurricanes, and the table legend).
The approximate AMO cycle (C1=cold 1, 1905-1925; W1=warm 1, 1926-1969; C2=cold 2,
1970-1994; and W2=warm 2, 1995 to present) is also indicated (Goldenberg et al 2001)
(Appendix D).
As discussed, data quality should be assumed to decrease dramatically the earlier the
measurement. As will be shown, the earlier part of the Louisiana record (1905-1955) is
noticeably absent of any storms over Category 3 strength in fifty years, in stark contrast to later
records (1956-2005); which may indicate some of the major storms and intensities were not
recorded, or able to be measured, prior to the late 1950’s and the first-recorded Category 4 storm,
Hurricane Audrey, 1957. Nonetheless, southeast regional climatologists such as Keim and
Romolo (pers comm 2007) indicate that this is still an accurate representation of likely hurricane
strikes in Louisiana and nationwide, in that lower order storms are much more frequent than
higher order storms.
3.2.2.3 Tropical Storms and Hurricanes Strike Louisiana Every Few Years
Viewing the historical NOAA data in Appendix D, a few of the more obvious indications
are that storms frequently make landfall in Louisiana, with the longest reprieve lasting only four
years. It can generally be expected then that tropical storms and hurricanes will threaten the
coast every few years.
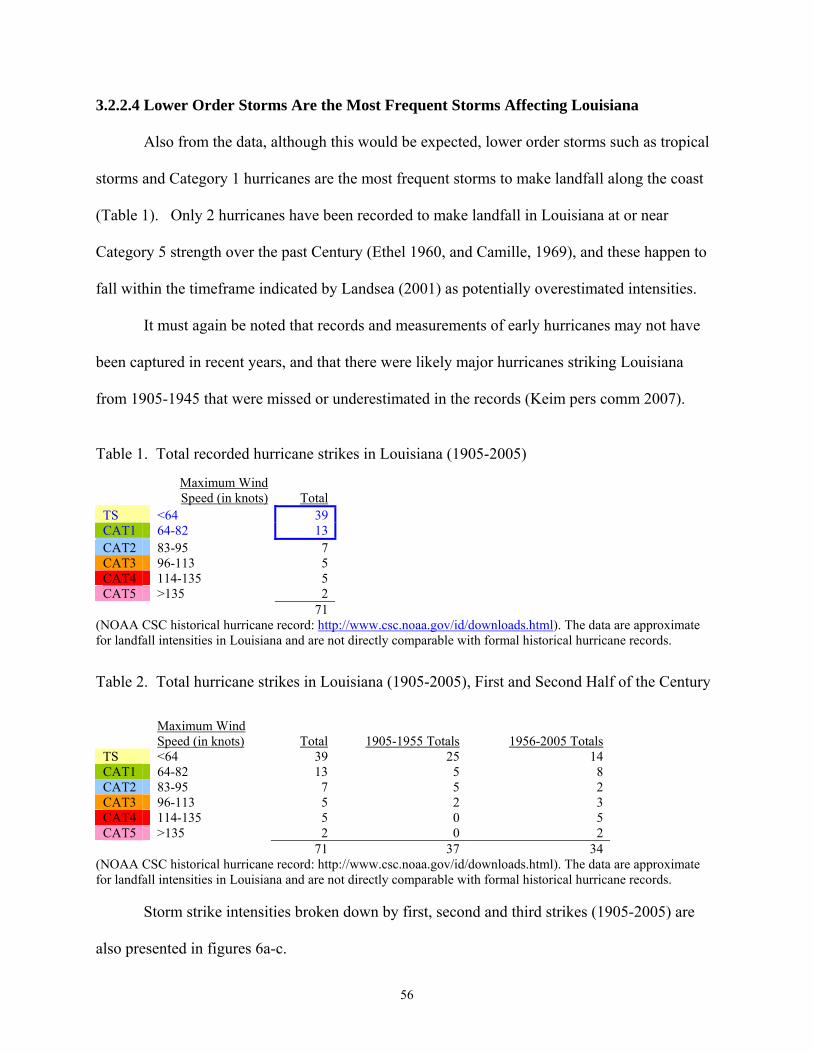
56
3.2.2.4 Lower Order Storms Are the Most Frequent Storms Affecting Louisiana
Also from the data, although this would be expected, lower order storms such as tropical
storms and Category 1 hurricanes are the most frequent storms to make landfall along the coast
(Table 1). Only 2 hurricanes have been recorded to make landfall in Louisiana at or near
Category 5 strength over the past Century (Ethel 1960, and Camille, 1969), and these happen to
fall within the timeframe indicated by Landsea (2001) as potentially overestimated intensities.
It must again be noted that records and measurements of early hurricanes may not have
been captured in recent years, and that there were likely major hurricanes striking Louisiana
from 1905-1945 that were missed or underestimated in the records (Keim pers comm 2007).
Table 1. Total recorded hurricane strikes in Louisiana (1905-2005)
Maximum Wind Speed (in knots) Total
TS <64 39CAT1 64-82 13CAT2 83-95 7 CAT3 96-113 5 CAT4 114-135 5 CAT5 >135 2 71
(NOAA CSC historical hurricane record: http://www.csc.noaa.gov/id/downloads.html). The data are approximate for landfall intensities in Louisiana and are not directly comparable with formal historical hurricane records.
Table 2. Total hurricane strikes in Louisiana (1905-2005), First and Second Half of the Century
Maximum Wind Speed (in knots) Total 1905-1955 Totals 1956-2005 Totals
TS <64 39 25 14 CAT1 64-82 13 5 8 CAT2 83-95 7 5 2 CAT3 96-113 5 2 3 CAT4 114-135 5 0 5 CAT5 >135 2 0 2 71 37 34
(NOAA CSC historical hurricane record: http://www.csc.noaa.gov/id/downloads.html). The data are approximate for landfall intensities in Louisiana and are not directly comparable with formal historical hurricane records.
Storm strike intensities broken down by first, second and third strikes (1905-2005) are
also presented in figures 6a-c.
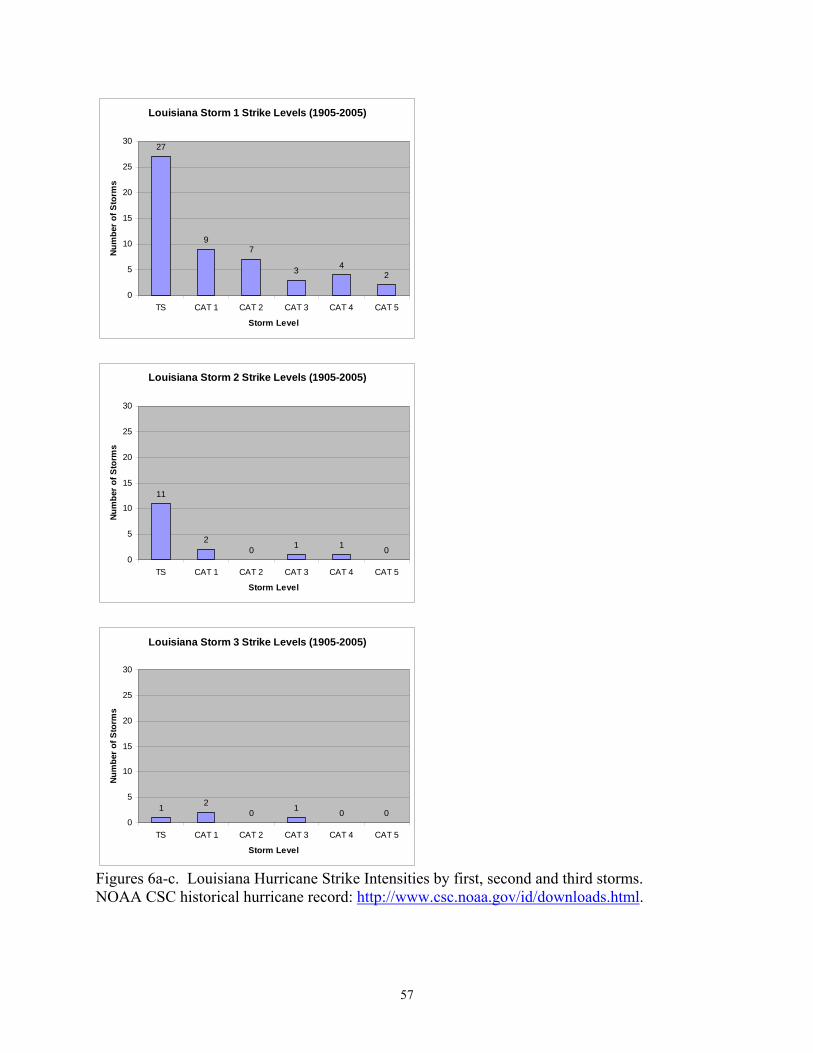
57
Louisiana Storm 1 Strike Levels (1905-2005)
27
97
3 42
0
5
10
15
20
25
30
TS CAT 1 CAT 2 CAT 3 CAT 4 CAT 5
Storm Level
Num
ber o
f Sto
rms
Louisiana Storm 2 Strike Levels (1905-2005)
11
20 1 1 0
0
5
10
15
20
25
30
TS CAT 1 CAT 2 CAT 3 CAT 4 CAT 5
Storm Level
Num
ber o
f Sto
rms
Louisiana Storm 3 Strike Levels (1905-2005)
1 20 1 0 0
0
5
10
15
20
25
30
TS CAT 1 CAT 2 CAT 3 CAT 4 CAT 5
Storm Level
Num
ber o
f Sto
rms
Figures 6a-c. Louisiana Hurricane Strike Intensities by first, second and third storms. NOAA CSC historical hurricane record: http://www.csc.noaa.gov/id/downloads.html.
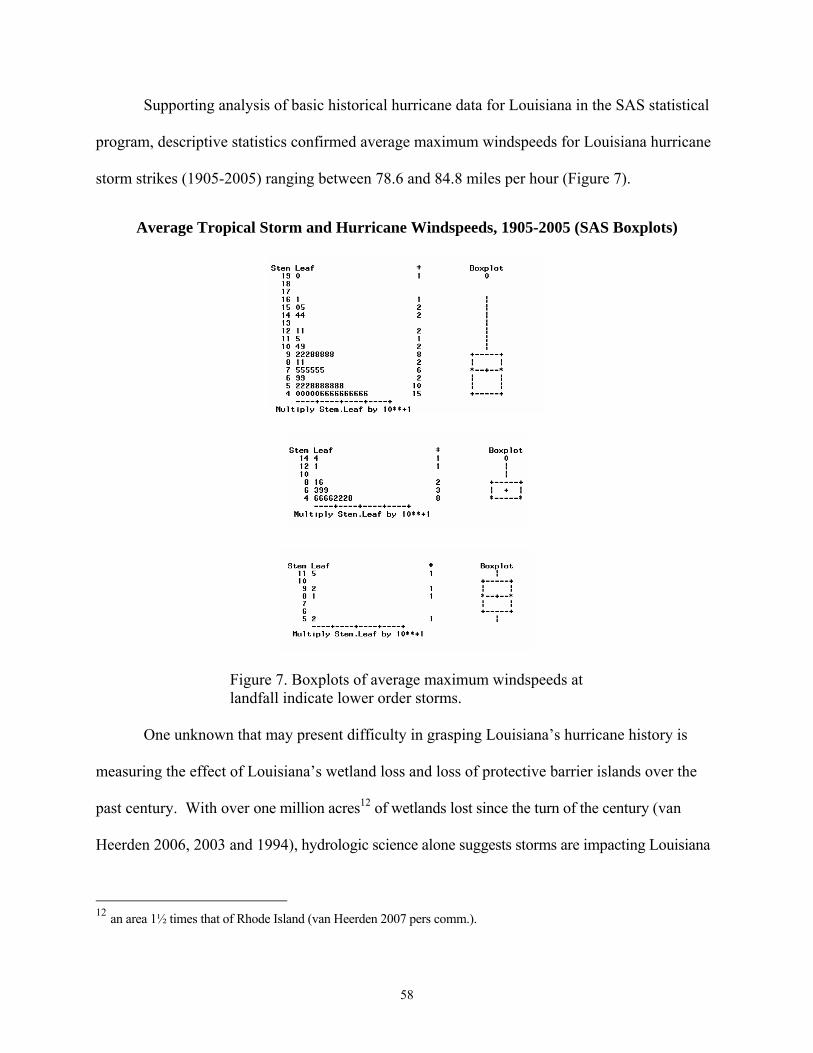
58
Supporting analysis of basic historical hurricane data for Louisiana in the SAS statistical
program, descriptive statistics confirmed average maximum windspeeds for Louisiana hurricane
storm strikes (1905-2005) ranging between 78.6 and 84.8 miles per hour (Figure 7).
Average Tropical Storm and Hurricane Windspeeds, 1905-2005 (SAS Boxplots)
Figure 7. Boxplots of average maximum windspeeds at landfall indicate lower order storms.
One unknown that may present difficulty in grasping Louisiana’s hurricane history is
measuring the effect of Louisiana’s wetland loss and loss of protective barrier islands over the
past century. With over one million acres12 of wetlands lost since the turn of the century (van
Heerden 2006, 2003 and 1994), hydrologic science alone suggests storms are impacting Louisiana
12 an area 1½ times that of Rhode Island (van Heerden 2007 pers comm.).
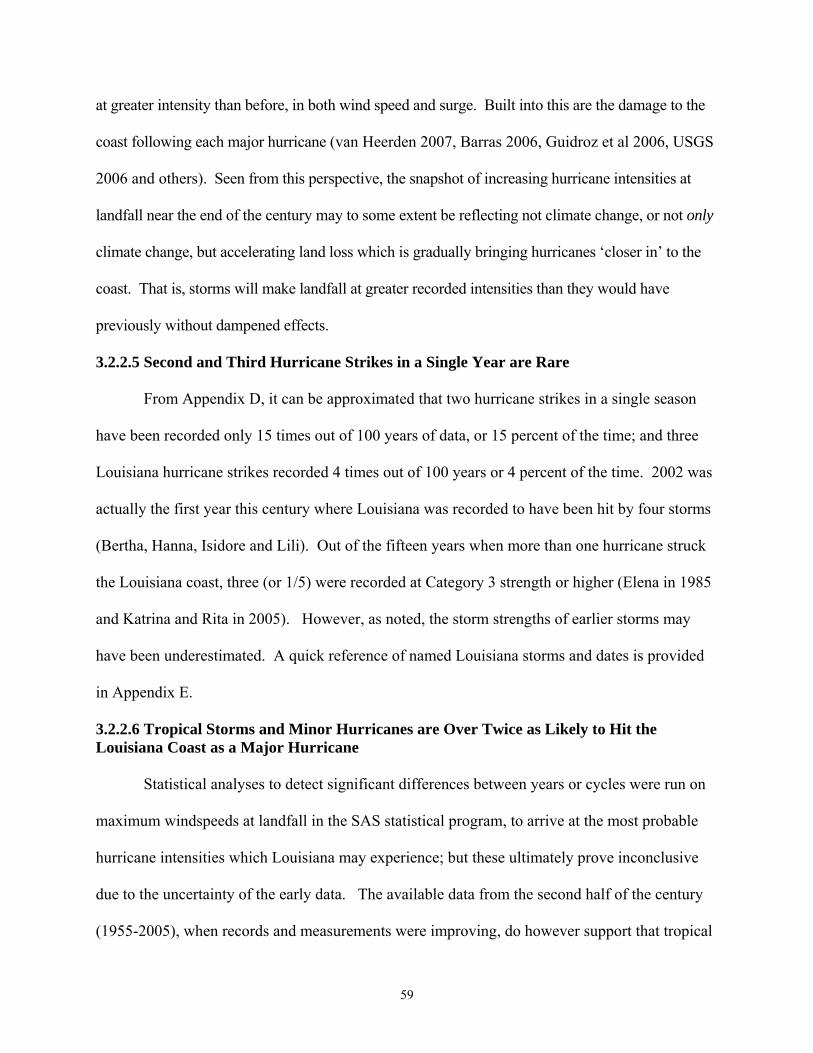
59
at greater intensity than before, in both wind speed and surge. Built into this are the damage to the
coast following each major hurricane (van Heerden 2007, Barras 2006, Guidroz et al 2006, USGS
2006 and others). Seen from this perspective, the snapshot of increasing hurricane intensities at
landfall near the end of the century may to some extent be reflecting not climate change, or not only
climate change, but accelerating land loss which is gradually bringing hurricanes ‘closer in’ to the
coast. That is, storms will make landfall at greater recorded intensities than they would have
previously without dampened effects.
3.2.2.5 Second and Third Hurricane Strikes in a Single Year are Rare
From Appendix D, it can be approximated that two hurricane strikes in a single season
have been recorded only 15 times out of 100 years of data, or 15 percent of the time; and three
Louisiana hurricane strikes recorded 4 times out of 100 years or 4 percent of the time. 2002 was
actually the first year this century where Louisiana was recorded to have been hit by four storms
(Bertha, Hanna, Isidore and Lili). Out of the fifteen years when more than one hurricane struck
the Louisiana coast, three (or 1/5) were recorded at Category 3 strength or higher (Elena in 1985
and Katrina and Rita in 2005). However, as noted, the storm strengths of earlier storms may
have been underestimated. A quick reference of named Louisiana storms and dates is provided
in Appendix E.
3.2.2.6 Tropical Storms and Minor Hurricanes are Over Twice as Likely to Hit the Louisiana Coast as a Major Hurricane
Statistical analyses to detect significant differences between years or cycles were run on
maximum windspeeds at landfall in the SAS statistical program, to arrive at the most probable
hurricane intensities which Louisiana may experience; but these ultimately prove inconclusive
due to the uncertainty of the early data. The available data from the second half of the century
(1955-2005), when records and measurements were improving, do however support that tropical

60
storms and minor hurricanes (Cat 1-2) were over twice as likely (24/34 at 71% strike rate) to hit
the coast as a major hurricane (Cat 3-5, 10/34 at 29% strike rate) (Table 2).
Two additional historical analyses that may yield some value in MSN evacuation and
shelter planning can be estimated from the NOAA data are (1) historical track directions and (2)
coastal strike locations. Specifically, questions that can be posed include “Do most hurricanes
hit Louisiana tracking northwest from the Gulf of Mexico, making this storm surge analysis the
most preferred?” and “Are southeastern Louisiana and New Orleans any more likely to be hit by
future hurricanes than the rest of Louisiana?”
Storm strike locations and track directions were generalized from the NOAA CSC
historical hurricane track data for Louisiana (1905 – 2005) and categorized as storm strikes in
(W)-Western Louisiana, (C)-Central Louisiana, and (E)-Eastern Louisiana. Storm track
directions were categorized as approaching Louisiana from the Gulf of Mexico tracking East (E),
Northeast (NE), North (N), Northwest (NW) and West (W) (figure 8). Results were calculated in
Tables 3 and 4, and graphed in Figures 9a-c and 10a-c, broken down by first, second and third
storm strikes (1905-2005).
Figure 8. Storm strike locations and track directions analyzed.

61
Louisiana Storm 1 Strike Location (1905-2005)
13
1821
0
5
10
15
20
25
W C E
Louisiana (Western, Central or Eastern)
Num
ber o
f Sto
rms
Louisiana Storm 2 Strike Location (1905-2005)
53
7
0
5
10
15
20
25
W C E
Louisiana (Western, Central or Eastern)
Num
ber o
f Sto
rms
Louisiana Storm 3 Strike Location (1905-2005)
13
00
5
10
15
20
25
W C E
Louisiana (Western, Central or Eastern)
Num
ber o
f Sto
rms
Figures 9a-c. Louisiana Hurricane Strike Locations (first, second and third storms to hit the Louisiana coast, making landfall in either western, central or eastern Louisiana) NOAA CSC historical hurricane record: http://www.csc.noaa.gov/id/downloads.html.
Table 3. Hurricane strike locations in Louisiana (1905-2005)
STORM 1 STORM 2 STORM 3 TOTALS W 13 W 5 W 1 19 C 18 C 3 C 3 24 E 21 E 7 E 0 28 52 15 4 71
(NOAA CSC historical hurricane record: http://www.csc.noaa.gov/id/downloads.html) The data are approximate for landfall intensities in Louisiana and are not directly comparable with formal historical hurricane records.
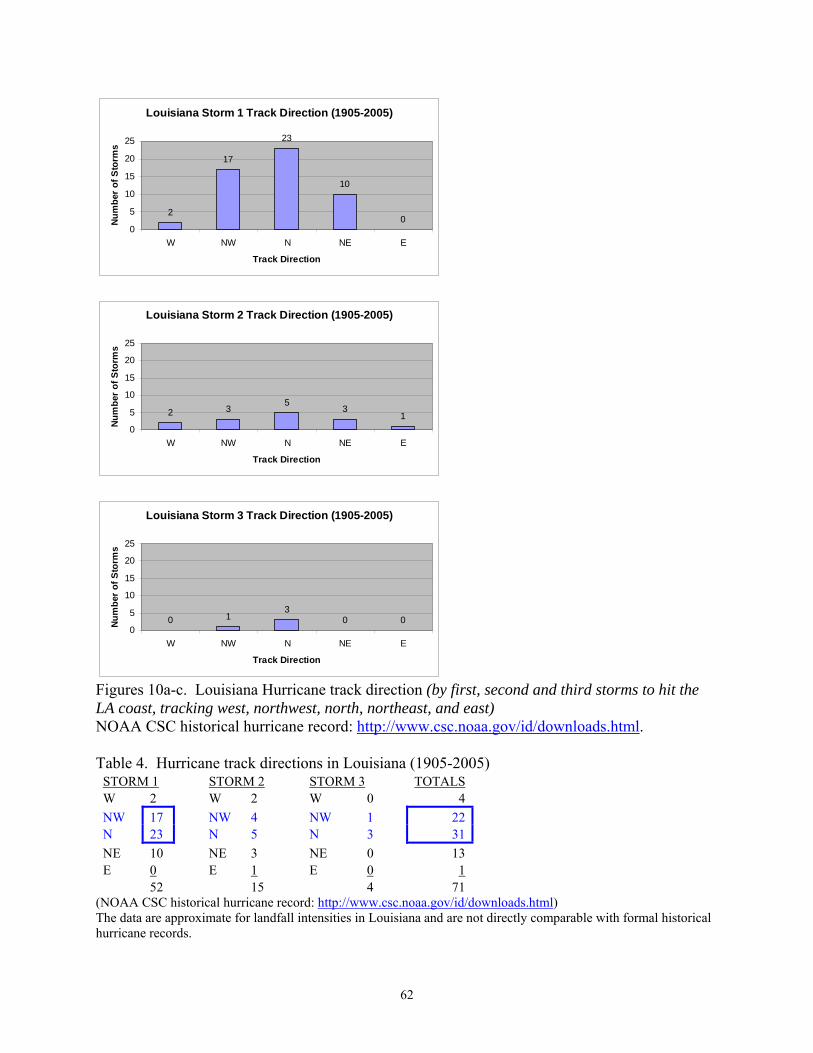
62
Louisiana Storm 1 Track Direction (1905-2005)
2
17
23
10
00
5
10
15
20
25
W NW N NE E
Track Direction
Num
ber
of S
torm
s
Louisiana Storm 2 Track Direction (1905-2005)
2 35
31
0
5
10
15
20
25
W NW N NE E
Track Direction
Num
ber
of S
torm
s
Louisiana Storm 3 Track Direction (1905-2005)
0 13
0 00
5
10
15
20
25
W NW N NE E
Track Direction
Num
ber
of S
torm
s
Figures 10a-c. Louisiana Hurricane track direction (by first, second and third storms to hit the LA coast, tracking west, northwest, north, northeast, and east) NOAA CSC historical hurricane record: http://www.csc.noaa.gov/id/downloads.html. Table 4. Hurricane track directions in Louisiana (1905-2005)
STORM 1 STORM 2 STORM 3 TOTALS W 2 W 2 W 0 4 NW 17 NW 4 NW 1 22N 23 N 5 N 3 31NE 10 NE 3 NE 0 13 E 0 E 1 E 0 1 52 15 4 71
(NOAA CSC historical hurricane record: http://www.csc.noaa.gov/id/downloads.html) The data are approximate for landfall intensities in Louisiana and are not directly comparable with formal historical hurricane records.

63
3.2.2.7 Hurricanes Most Often Track North and Northwest Towards the Louisiana Coast
In summary, over the century of data analyzed (1905 - 2005), the data seem to support
the hypothesis that southeastern Louisiana and New Orleans may be slightly more prone to
tropical storm and hurricane strikes than central or western Louisiana. The data support even
more the indication that hurricanes tend to track north or northwest from the Gulf of Mexico
towards Louisiana, followed by northeast; but rarely due west or east; supporting that hurricane
surge models, if limited by time or effort, should be run for these tracks initially.
Although wind speeds were not measured with consistently high accuracy throughout the
dataset, the most likely storm to strike Louisiana in any given year based on the best estimates of
data, even if there are three or more storms in a given year, is still a tropical storm or weak
Category 1. Historically, Hurricanes Katrina and Rita together striking the Louisiana coast as
major hurricanes in a single year are a rare exception (Romolo pers comm 2007). MSN facilities
should also then focus on lower order storm events which hit the Louisiana coast more
frequently, as well as on the major storm events.
In regards to AMO cycles and hurricanes over the past century (Appendix D), Keim (pers
comm 2007) explains that viewing only Louisiana strikes will not reveal much of a pattern on
which to base future hurricane strike or intensity probabilities. However, mapping landfalls
along the entire US coast, from the Gulf Coast through the Atlantic East Coast (Keim, journal
article in press), does reveal “pockets” of increased hurricane landfalls and intensities over
approximate 5-10 year intervals in specific localities of Florida, North Carolina, Texas,
Louisiana and elsewhere. For the purpose of this study, it is important to note that the theory of
cyclical hurricane activity is supported by indications in the overall data, and that Louisiana, as
well as the rest of the US, could experience decades more of increased hurricane activity.

64
3.2.3 Hurricane Forward Track Speeds, Shifts in Track and Intensity in the Gulf of Mexico
According to scientists at NOAA’s AOML Hurricane Research Division (HRD), the
forward speed of a hurricane is “very latitude dependent” (Landsea 2007, online reference).
Hurricanes also pick up speed traveling along steering currents (Keim, Romolo pers comm
2007). Approaching Louisiana from the Gulf of Mexico, the forward speed of hurricanes as
taken from the HURDAT database, and averaged in 5 degree latitude bins (note: Latitudes in the
Gulf of Mexico range between 20º to 30ºN) resulted in the following estimates (Landsea 2007,
abridged):
Table 5: Average Hurricane Forward track speed in the Gulf of Mexico Approaching Louisiana
(Landsea 2007, http://www.aoml.noaa.gov/hrd/tcfaq/G17.html)
From the table, on average, hurricanes approaching Louisiana from the Gulf of
Mexico have been determined to track forward at speeds between 11-12.5 mph. While
extreme ranges of hurricane forward speeds have been recorded in the Gulf, they are rare,
ranging on the slow end from practically stalled or “quasi-stationary” hurricanes, to hurricanes
traveling faster than 15 mph, such as Hurricane Betsy which tracked forward at 22 mph (NOAA
AOML 2007c).
Forward speed of Atlantic hurricanes averaged by 5 degree latitude bins
Speed Latitude bin km/hr knt mph
No. Cases
20°-25°N 17.7 9.5 11.0 6817
25°-30°N 20.1 10.9 12.5 5321

65
Hurricane forward track speeds can be estimated in a GIS by mapping the NOAA CSC
historical track shapefiles and using the distance tool to investigate how far a hurricane traveled
in a certain time frame. For example, Hurricane Audrey can be calculated on the approach to
Louisiana to have traveled approximately 566 miles from 0600Z on 6/25 to 1200Z on 6/27, or in
54 hours. This would estimate Audrey’s average forward track speed at 10.48 mph. Hurricane
Camille’s track (with associated date and time measurements included within the shape file) can
be similarly measured. Camille was measured to have traveled approximately 852 miles in 72
hours at an average forward track speed of 11.83 mph.
Hurricane track speeds of 11-12 mph appear a reasonable estimate for storms
approaching Louisiana in the Gulf of Mexico for planning purposes dealing with MSN, and may
be used to calculate “H-Hour,” (when Tropical Storm Force Winds (TSFWs) will hit the
Louisiana coast), or “L-Hour” (landfall) keeping in mind that in rare cases, storms can track
forward faster.
In coastal Louisiana, hurricane forward speeds as they relate to MSN evacuation and
sheltering are important for two main reasons: (1) To estimate how much time there is before
TSFWs and rain bands are anticipated to hit Louisiana; and (2) To estimate the severity of
expected storm surge and stress on levee systems. Hurricanes with significant forward speeds
and size have a lot of momentum; they can produce substantial storm surge and maintain
hurricane strength further inland (Romolo pers comm 2007). New Orleans is a unique case
where a slower storm could be just as dangerous, since shifting winds and extended periods of
wave action could deteriorate or cause overtopping of existing levee systems. Slower storms
could also produce extreme rainfall conditions within the city (Hurricane Pam 2004).

66
Hurricanes may speed up if they travel with the tradewinds, catch a ride on steering
currents or as they begin their northwest turn on the westerly currents towards the more northern
latitudes (Romolo pers comm 2007) Hurricanes generally slow down over more shallow waters
along the coast (ibid). However hurricane speeds can also be affected by “complex ocean and
atmospheric interactions, including the presence or absence of other weather patterns… this
complexity …makes it very difficult to predict the speed [and direction] of a hurricane (NOAA
1999, p. 2).”
3.2.3.1 Hurricane Size
NOAA experts provide the following dimensions for a typical hurricane: “about 300
miles wide although they can vary considerably in size;” with a “calm, clear area” in the eye
“approximately 20-40 miles across;” and “an eyewall composed of dense clouds that contain the
highest winds in the storm (ibid).” They also indicate that hurricane-force winds (HFW) “can
extend outward to about 25 miles in a small hurricane and to more than 150 miles for a large one
(ibid).” Meanwhile “tropical storm-force winds [TSFW] can stretch out as far as 300 miles from
the eye of a large hurricane (ibid).” Hurricane Katrina was considered “exceptionally large”
with TSFWs extending 200 nautical miles from the center, and HFWs 90 nautical miles from the
center (Knabb et al 2006, p. 3).
Hurricane size and range of winds are important to keep in mind when modeling
hurricane risk. Powell, NOAA HRD (2007b) indicates that overall storm size and the wind reach
together affect a hurricane’s destructive potential, making size and reach of winds additional
important factors to consider along with the Saffir-Simpson scale when estimating potential
hurricane damage.

67
3.2.3.2 Hurricane Intensification
A variety of factors can intensify or degrade a hurricane, including sea surface
temperatures (SSTs), upper level conditions, and low and high pressure systems (Keim pers
comm 2007, Romolo pers comm 2007, Walker et al 2006, NOAA 1999). An historical analysis
of hurricanes and their intensification before landfall in Louisiana will therefore only reveal part
of the story. However, in regard to the intensification of Louisiana hurricanes, the Loop
Current in the Gulf of Mexico may play a significant role (Keim pers comm 2007, Walker et
al 2006). It has been observed that hurricanes are prone to rapid intensification over warm Gulf
of Mexico waters, particularly in late summer (Robbins/SRCC 2004). ‘Monster’ hurricanes
Katrina, Rita and Wilma in 2005 intensified rapidly to Category 5 hurricanes as they traveled
over the warmest sections of the Loop Current in the Gulf of Mexico (Keim pers comm 2007,
Walker et al 2006). As Dr. Nan Walker of the LSU Earth Scan Laboratory explains,
“Hurricanes Katrina and Rita provided two vivid examples of how oceanic heat content can fuel rapid hurricane intensification. Both Katrina and Rita were relatively weak hurricanes (Category 2) until they moved over Loop Current waters in the Gulf of Mexico, where they rapidly became Category 5 monsters… The Loop Current is the Gulf of Mexico portion of an enormous moving mass of warm water, which enters the Gulf from the Caribbean Sea…(Walker et al 2006, p. 33).” Warm waters of the Loop current can extend to several hundred meters (ibid), and with
the appropriate upper level atmospheric conditions and the opportunity to ‘vent,’ hurricanes can
rapidly intensify within hours (Keim pers comm 2007). For example, Hurricane Wilma went
from a Category 1 to a Category 5 storm in approximately 24 hours off of Florida’s coast;
Katrina from a Category 3 to a 5 within 12 hours (ibid). The location of the Loop Current is not
fixed; circulation patterns change within the Gulf, and small eddys can break apart from the
Current and form separate but smaller pockets of warm water (ibid).
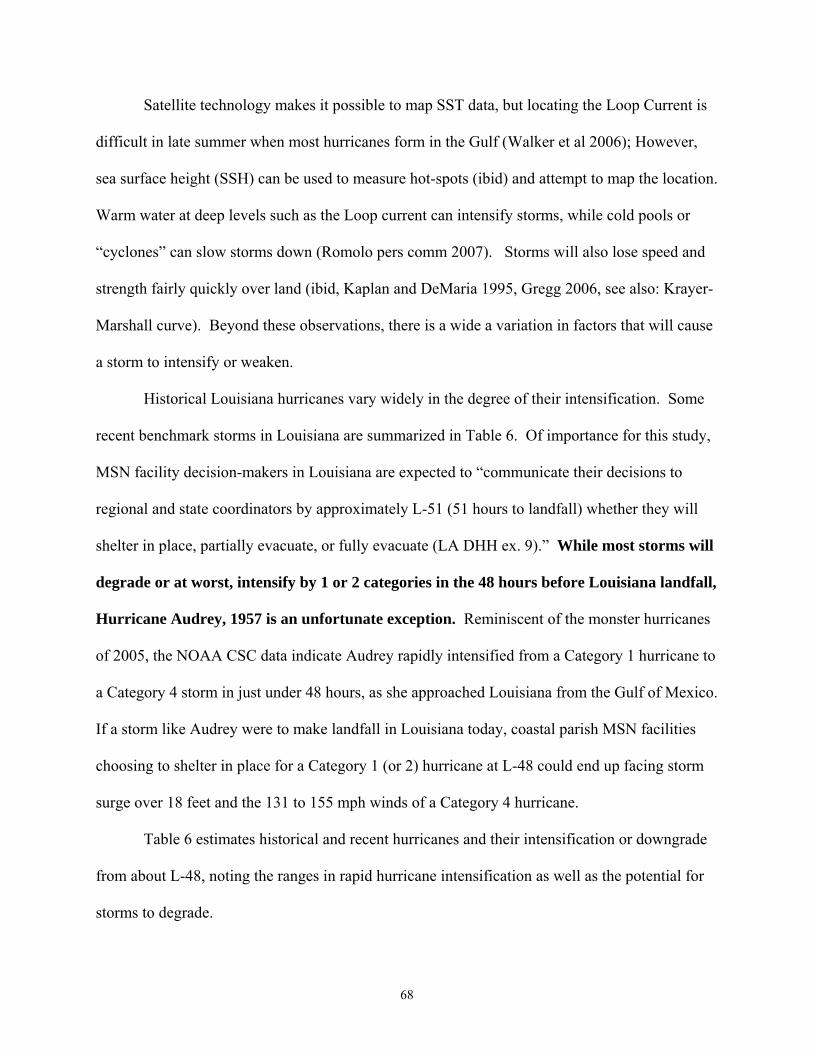
68
Satellite technology makes it possible to map SST data, but locating the Loop Current is
difficult in late summer when most hurricanes form in the Gulf (Walker et al 2006); However,
sea surface height (SSH) can be used to measure hot-spots (ibid) and attempt to map the location.
Warm water at deep levels such as the Loop current can intensify storms, while cold pools or
“cyclones” can slow storms down (Romolo pers comm 2007). Storms will also lose speed and
strength fairly quickly over land (ibid, Kaplan and DeMaria 1995, Gregg 2006, see also: Krayer-
Marshall curve). Beyond these observations, there is a wide a variation in factors that will cause
a storm to intensify or weaken.
Historical Louisiana hurricanes vary widely in the degree of their intensification. Some
recent benchmark storms in Louisiana are summarized in Table 6. Of importance for this study,
MSN facility decision-makers in Louisiana are expected to “communicate their decisions to
regional and state coordinators by approximately L-51 (51 hours to landfall) whether they will
shelter in place, partially evacuate, or fully evacuate (LA DHH ex. 9).” While most storms will
degrade or at worst, intensify by 1 or 2 categories in the 48 hours before Louisiana landfall,
Hurricane Audrey, 1957 is an unfortunate exception. Reminiscent of the monster hurricanes
of 2005, the NOAA CSC data indicate Audrey rapidly intensified from a Category 1 hurricane to
a Category 4 storm in just under 48 hours, as she approached Louisiana from the Gulf of Mexico.
If a storm like Audrey were to make landfall in Louisiana today, coastal parish MSN facilities
choosing to shelter in place for a Category 1 (or 2) hurricane at L-48 could end up facing storm
surge over 18 feet and the 131 to 155 mph winds of a Category 4 hurricane.
Table 6 estimates historical and recent hurricanes and their intensification or downgrade
from about L-48, noting the ranges in rapid hurricane intensification as well as the potential for
storms to degrade.

69
Table 6. Intensification or Downgrade to Landfall (Louisiana benchmark storms) STORM L-48 TRANS1 TRANS2 TRANS-3 L-HR TREND DATE RANGE YEAR *AUDREY 1 2 4 *INT-3 6/25-6/27 1957 HILDA 2 3 4 3 INT-1 10/1-10/3 1964 BETSY 3 4 INT-1 9/8-9/10 1965 EDITH 1 2 INT-1 9/14-9/16 1971 *CARMEN 1 2 3 4 3 *INT-2 9/5-9/7 1974 BOB TD 1 INT-1 7/9-7/11 1979 DANNY TD 1 INT-1 8/13-8/15 1985 *ELENA 1 (looped) 3 *INT-2 8/31-9/2 1985 ANDREW 4 4 SAME 8/24-8/26 1992 LILI 2 4 2 SAME 10/1-10/3 2002 IVAN 5 4 3 DEG-2 9/14-9/16 2004 *KATRINA 2 3 4 5 4 *INT-2 8/27-8/29 2005 RITA 5 4 3 DEG-2 9/22-9/24 2005
* Four storms have intensified by more than one category from 48 hours to landfall over the past few decades. TRANS=transition, L-HR=landfall, INT=intensification, DEG=degraded.
The potential for rapid hurricane intensification is therefore a risk that must be built into
any hurricane model; yet introduces a tremendous problem to MSN evacuation and sheltering
strategies.
3.2.3.3 Rainfall Risk and Tornadoes Associated with Hurricanes
It is important to note that regardless of where a storm makes landfall along the Gulf
Coast, there will be some risk of extreme rainfall and the possibility of tornadoes.
Hammond, Louisiana experienced almost 12 inches of rain from Hurricane Andrew in 1992,
while the hurricane caused two tornado deaths and numerous injuries across Louisiana (NOAA
AOML 2007b). Similarly, New Orleans was seriously flooded by rainfall from a tropical storm
(Allison) that made landfall in Houston in 2001 (ibid).
NOAA experts have often indicated that the “front right quadrant” of a hurricane is the
most dangerous part of the path for storm surge and winds; but this is also where tornadoes are
most likely to occur (NOAA 1999); Tornadoes also form within the storm rainbands (ibid). The
more intense a hurricane, the greater the tornado risk, and tornadoes can still occur for days after
landfall (ibid). Most tornadoes “occur within 150 miles of the coast (ibid, p 14).”

70
3.2.4 Forecast of Louisiana Hurricanes: Likely Storms vs. Worst Case
Although inherent problems exist with some of the historical hurricane data, there is
value in becoming acquainted with the historical records and recent hurricane research for MSN
planning.
In summary, Louisiana is likely to experience tropical storms and hurricanes every few
years. Particularly it can be said that, while planning for unlikely or worst case events from
Category 4 or 5 levels hurricanes is certainly necessary, planning for the more common, lower
order storms (tropical storms and Category 1 hurricanes) that may threaten coastal Louisiana is
highly relevant, based on likelihood and risk. Current study analyses support that tropical storms
and Category 1 and 2 hurricanes will make landfall in Louisiana over twice as often as major
hurricanes.
The worst case event for Louisiana MSN planning would be a tropical storm or minor
hurricane that rapidly intensified within 48 hours over warm Gulf of Mexico waters. This
scenario is not far-fetched and has happened historically with Hurricane Audrey (1957), and to a
lesser extent with Hurricanes Carmen (1974), Elena (1985) and Katrina (2005). Today,
Louisiana scientists may be able to map the Loop Current with satellite technology and be able to
better predict the rapid intensification of approaching storms (Walker et al 2006), along with
other meteorological factors.
Some climate scientists predict at least ten to twenty more years of increased hurricane
activity in the US (Goldenberg et al 2001). Louisiana could see more hurricanes, and more
intense hurricanes, in the coming years as part of a natural cycle (Landsea 2005). Hurricanes
may also become more intense or frequent in the coming years due to global warming, but so far
data support this will happen to only a small degree (Knutson 2004, Emmanuel 2004).

71
‘Megastorms,’ if understood to be Category 5 hurricanes, can and do form in the Gulf of Mexico,
and may be explained by increased SSTs as well as other climate conditions; however, the
presence of the Loop Current and increase in Gulf temperatures in summer are at the same time
common phenomena. Therefore, megastorm formation is difficult to support solely with studies
of global warming.
Hurricane forward tracking speeds in the Gulf of Mexico approaching Louisiana average
approximately 10-12 miles per hour (Landsea 2007), but hurricane forward speed, size, wind
reach, and the potential for extreme rainfall will all vary.
Storm surge and other models, if limited by time or cost constraints, might first be run for
eastern Louisiana and model storms tracking north, northwest and then northeast. Hurricane
intensification, extreme rainfall and threat of tornadoes should all be considered when evaluating
a MSN facility or residence for hurricane risk.
In post-Katrina Louisiana, evacuation is not likely to even be a question (or should not
be) for MSN facilities when a Category 4 or 5 hurricane threatens the coast. But what about
other storms? Is a Category 2 storm at landfall potentially severe enough to prompt an
evacuation of the hospitals in New Orleans, or the nursing homes in the 12 Louisiana coastal
parishes?
Mayor Nagin of New Orleans stated in 2006 that he planned to order a mandatory
evacuation for most hurricanes with Category 2 strength, at 30 to 36 hours out. (Schleifstein/The
New Orleans Times-Picayune May 3, 2006). Nursing homes and hospitals are also strongly
considering evacuation for lower level storms, but the criteria on what ultimately determines
whether they should evacuate or shelter in place remain in question (US DHS and LA GOHSEP
2006). Based on the historical hurricane data and current research reviewed, such questions

72
support the need for analyses of minor storms, a more in-depth investigation into threshold
events for coastal Louisiana MSN facilities, and the development of tools such as GIS maps that
can provide better analysis tools to decision-makers.
3.3 State of the Technology: Hurricane Modeling and GIS Hurricane models are becoming increasingly available for integration with Geographic
Information Systems (GIS). Geographic databases and mapping tools allow multiple levels of
information, including critical facility locations, models, and data crucial to an emergency
medical response to be viewed together as layers and analyzed in a digital format. Data is
presented via electronic maps, which provide a more visual, geographic presentation to decision-
makers. Highly sophisticated models/scripts, spatial analyses and queries can be run on the
various levels of data in a GIS, which can be output into detailed reports or new maps.
This section highlights the hurricane models selected for incorporation into a GIS in the
current study, and discusses a few other commonly used and available models with their program
limitations. Medical data privacy and online mapping considerations for MSN patients are also
addressed.
3.3.1 A Review of Available Models and Data
A number of Federal operational models and online tools are being developed for the
evaluation of hurricane risk from storm surge and wind. NOAA SLOSH and FEMA HAZUS
were two of the major models employed in the current study that can be integrated into a GIS.
3.3.1.1 NOAA SLOSH
As discussed previously, storm surge is a major threat to coastal Louisiana during
hurricanes, and thus one of the most important hurricane risks to accurately model. The NOAA
Sea Lake and Overland Surges from Hurricanes (SLOSH) model is a storm surge prediction
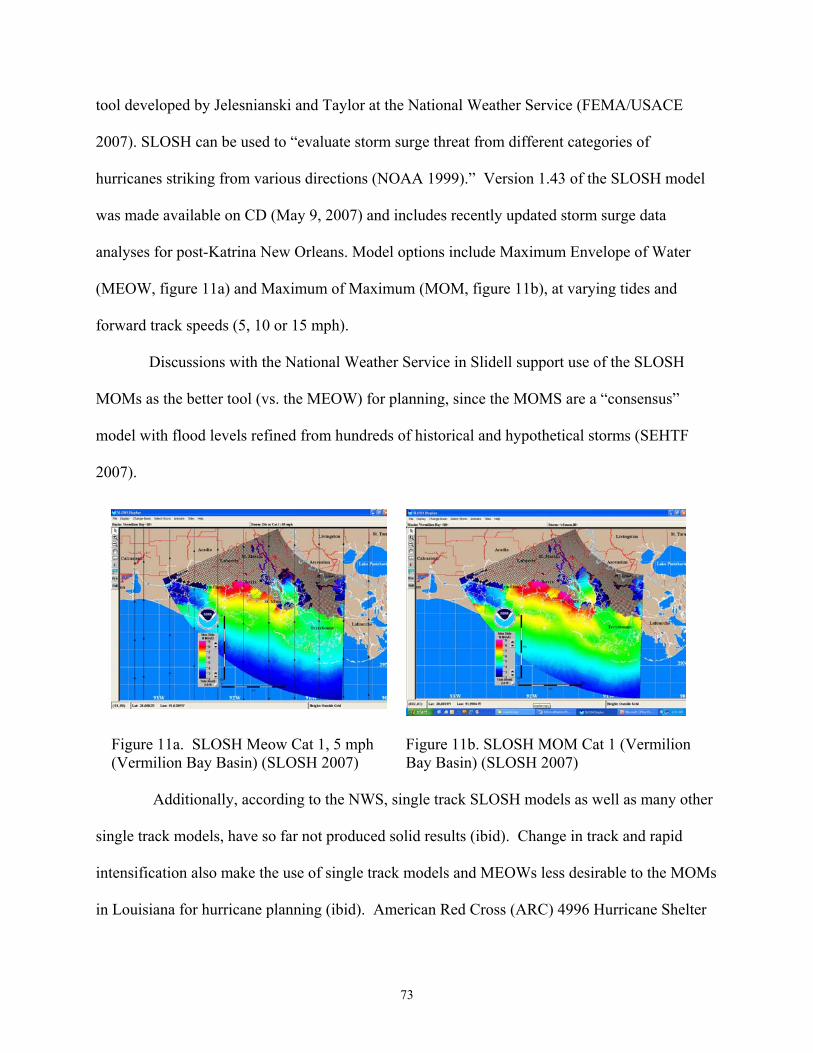
73
tool developed by Jelesnianski and Taylor at the National Weather Service (FEMA/USACE
2007). SLOSH can be used to “evaluate storm surge threat from different categories of
hurricanes striking from various directions (NOAA 1999).” Version 1.43 of the SLOSH model
was made available on CD (May 9, 2007) and includes recently updated storm surge data
analyses for post-Katrina New Orleans. Model options include Maximum Envelope of Water
(MEOW, figure 11a) and Maximum of Maximum (MOM, figure 11b), at varying tides and
forward track speeds (5, 10 or 15 mph).
Discussions with the National Weather Service in Slidell support use of the SLOSH
MOMs as the better tool (vs. the MEOW) for planning, since the MOMS are a “consensus”
model with flood levels refined from hundreds of historical and hypothetical storms (SEHTF
2007).
Additionally, according to the NWS, single track SLOSH models as well as many other
single track models, have so far not produced solid results (ibid). Change in track and rapid
intensification also make the use of single track models and MEOWs less desirable to the MOMs
in Louisiana for hurricane planning (ibid). American Red Cross (ARC) 4996 Hurricane Shelter
Figure 11a. SLOSH Meow Cat 1, 5 mph (Vermilion Bay Basin) (SLOSH 2007)
Figure 11b. SLOSH MOM Cat 1 (Vermilion Bay Basin) (SLOSH 2007)
74
Standards (revised Jan 2002) for example encourage SLOSH as a Storm Tide Atlas and the use
of MOMs.
“MOM” values will generally indicate the worst-case possible flooding for the category
storm selected, taken from all directions, selected for mean or high tide. Conservatively however,
this analysis may build in some needed caution, since as discussed in section 3.2.3.2, hurricanes
have been known to undergo rapid intensification in a matter of hours.
There are a number of SLOSH limitations which are briefly listed here. First, limitations
to SLOSH model outputs include that they are generated in the National Geodetic Vertical
Datum of 1929 (NGVD29) feet (ft) which require a conversion factor to compare with the latest
Light Detection and Ranging (LIDAR) values13 or recent Louisiana elevation surveys in North
American Vertical Datum of 1988 (NAVD88) ft. A rough conversion that accounts for uneven
subsidence rates across Louisiana can be applied through the National Geodetic Survey
CORPSCON/VERTCON online orthometric height conversion tool,14 if comparisons are
needed. Most conversions in Louisiana result in a difference of less than 0.5 feet.
A second limitation is SLOSH accuracy, within +/- 20% of peak storm surge. For
example, a model output result of 10 feet would likely be observed in actual conditions within
the range of 8-12 feet (SLOSH 2007).
Third, SLOSH predicted surge levels do not account for additional rainfall, river flow or
wind driven waves, or levee failures. Only flooding due to overtopping of levee systems is
considered (ibid). It is important to note that storm track/direction is an important factor in
surge generation, and may mean the difference between serious vs. minor flooding (ibid).
SLOSH assumes all barriers hold; and is not yet capable of modeling breach (SEHTF 2007).
13 LIDAR (2003) values, while a valuable dataset in Louisiana for research applications, have been shown to be as much as 1-3 feet off in some locations when compared to corrected elevation survey methods. 14 http://www.ngs.noaa.gov/cgi-bin/VERTCON/vert_con.prl

75
NOAA requires and has requested updated levee heights and status from the US Army
Corps of Engineers (USACE) to update surge models for the New Orleans Hurricane Protection
System (HPS) for post-Katrina (ibid). While the best available data is understood to have been
incorporated into the SLOSH model, actual levee heights and status both before and after the
2005 hurricanes in SLOSH may still retain slight inaccuracies, unless based on current field
measurements employing updated elevation survey methods (van Heerden pers comm. 2007).
This has been acknowledged by the model developers but the possibility of error should be kept
in mind also by emergency planners.
Fourth, SLOSH developers note:
“The accuracy of the SLOSH model depends heavily on the ability to accurately model the topographic and bathymetric features of the basin... Inaccuracies in modeling these features will contribute directly to errors in the modeling of storm surge. …The major barriers to storm surge… include natural ridges along many of the rivers and bayous and man-made features such as, levees, floodwalls, highways, and railroad embankments. The bathymetry of the coastline and the areas bays, lakes, rivers, canals, and bayous are also of importance in accurately modeling hurricane surge. Data was collected to establish the heights of both Federal and non-Federal levees and floodwalls, and to establish the existence of any gaps or other information that might affect the integrity of a barrier to hurricane surge. Other barrier heights were obtained from existing profiles or actual surveys of features critical to the limits of inundation. The bathymetry of the coastline and other bodies of water within the study area was obtained using hydrographic surveys, bathymetric maps, and U.S.G.S. quadrangle maps. Input to the model also included average ground elevations for each grid square within the basin (FEMA and USACE Comprehensive Hurricane Data Preparedness Study, online reference15)” Additionally, SLOSH:
“operates on a grid having a relatively large size. Cell size varies over the grid, but a typical size might be about 1 mile by 1 mile. The model uses an average elevation for each cell, so some locations may be at 10 feet, but across the road, there might be another facility with an elevation of 6 feet. That one would flood, while [other] stays dry (Shaffer 2007, personal e-mail communication).”
15 http://chps.sam.usace.army.mil/USHESdata/SLOSH/Sloshmainframe.htm)
76
The large grid may cause confusion in areas surrounding the Mississippi River or Lake
Pontchartrain, where represented river or lake levels may spill over to areas that are actually
leveed/may actually remain dry (ibid). This must be kept in mind when visually determining if
facilities fall within a storm surge risk area.
Of great import to this study, there is some disagreement among surge modeling
researchers whether SLOSH MOM's accurately calculate or portray overland storm surge
flooding that extends beyond the shoreline. However, SLOSH applications can be mapped more
precisely “using a fine-resolution elevation database, such as the USGS's 30 m by 30 m (or 10 m
by 10 m) Digital Elevation Model (DEM) (ibid)” alleviating some of this concern. The current
study therefore applies a LSU Hurricane Center project dataset created by S. Ahmet Binselam
(2007 refinements) to tally and verify project results, discussed more in sections 4.3 and 5.2.3.
Final limitations of the current SLOSH model include that no corrections have been
incorporated for western Louisiana on account of Hurricane Rita. It is possible that storm surge
risks have increased to some extent due to damage to the wetlands and other land features caused
by the storm along the western coast (see also, sections 1.4 and 3.2.2.4). Also, mapping SLOSH
shapefiles in a GIS is a relatively new feature which has some expected ‘bugs,’ such as problems
applying or viewing symbology or layer files (.lyr) when mapping storm surge risks in New
Orleans (e.g., shapefiles may not denote flooding in the city when levees are actually
overtopped).
Of note, Pedro (2006), in her thesis “Delineating Hurricane-Vulnerable Populations in
Orleans Parish, Louisiana” reviewed SLOSH storm surge modeling in a GIS when she mapped
hurricane risk factors at the census block level. Pedro raises concerns about imprecise flood
values predicted in SLOSH surge estimates for use in mitigation planning (p. 23). Higher

77
resolution Advanced Circulation Model for Ocean Hydrodynamics (ADCIRC) storm surge
models developed specifically for southeast Louisiana were successfully used in Pedro’s
methodology.
ADCIRC outputs were highly preferred in the current analysis as well, but present
limitations for the current study. ADCIRC has been applied as an experimental model in
Louisiana with successful results, used most notably in pre-Katrina evacuation planning and
evaluations such as the Team Louisiana forensic levee study (van Heerden et al 2006b).
However, ADCIRC is a single track model and comparatively new. Results as discussed
are not yet widely proven in the literature or widely accepted. Additionally, unless a labor and
time-intensive suite of hurricane tracks are run, ADCIRC lacks the capacity to produce worst
case, consensus model approximations using many historical and hypothetical storms to
determine surge risk comparable to SLOSH. Although overland surge flooding extent may be
better approximated by ADCIRC (van Heerden and Mashriqui pers comm 2007), outputs are
nonetheless track-specific, and in such cases will not be as useful as SLOSH MOMs when
attempting to incorporate risk factors for worst case scenarios such as hurricane shift in track and
intensification. As an added note, SLOSH is considered an operational (vs. experimental) model
which makes it more desirable for use in decision-making. ADCIRC is nonetheless a desirable
supplemental model for use in additional MSN risk analysis, and is discussed in section 6.2.1 in
more detail as a future direction of storm surge modeling.
Additionally with SLOSH, Meduri’s thesis (May 2004) looked specifically at developing
a methodology for delineating hurricane evacuation zones modeling different storm surge
scenarios. He explored methods to incorporate storm surge data with census level data,
population land use data and zip code information for ease of identification by evacuees.

78
3.3.1.2 FEMA HAZUS
FEMA HAZUS16 (HAZUS MH ER2 (2007) and earlier versions) is software designed to
help decision makers and planners assess their risk and estimate potential losses from disasters
such as floods and hurricanes. Newer releases with added functionality are making it possible to
perform detailed risk analyses either separately or within a GIS environment. Current
capabilities include physical damage modeling to critical facilities, economic losses, and social
impacts, including “estimates of shelter requirements, displaced households, and exposed
population … (FEMA HAZUS website16).”
The wind field model and damage estimate capability (e.g., moderate, severe) are a
strong feature of HAZUS which can be exported as shapefiles into a GIS and be used for more
detailed emergency planning analyses (Figure 12).
Figure 12. Hazus peak gusts for Hurricane Rita generated by Carol Friedland using FEMA Hazus MH (LSU Hurricane Center 2005).
16 http://www.fema.gov/plan/prevent/hazus/

79
The wind field model can calculate surface level wind fields for both historical and user-
defined storms (Hill/Friedland 2004). Methods of incorporating HAZUS wind field data into a
GIS to support the calculation of wind fields for this study are detailed in section 4.4.
Limitations to HAZUS first include that wind shapefiles must be generated as single runs
and may require additional input information (Friedland pers comm 2007). For the same reasons
discussed for NOAA SLOSH, ‘consensus model’ runs would be the preferred wind modeling
application for hurricane planning, to account for such factors as variations in hurricane size (and
thus variations in wind fields and reach), as well as to build in tolerance for unforeseen changes
in hurricane intensity and track. However again, unless a labor and time-intensive suite of
hurricane tracks are run, HAZUS lacks the capacity to produce worst case, consensus model
approximations for wind using many historical and hypothetical storms, etc. Such a feature for
wind is as yet unavailable within the SLOSH program and cannot be mapped.
Second, HAZUS riverine flooding programs are complex and require technical expertise
yet may be used to effectively model flood hazards for local areas of interest; Coastal flood
models are much more complex and require additional input parameters (ibid). Some additional
limitations to HAZUS in Louisiana at present include the inability to model flooding - whether
storm surge, rainfall or levee breach flooding - in New Orleans17 including difficulty
incorporating new releases of the latest surge modeling updates (e.g., post-Katrina SLOSH).
Third, overall, there are computer and technical issues which must be overcome in the
near future for installing, using the software, and obtaining technical support. While access to
the software is not difficult (the CD is made available upon request), technical expertise and time
requirements may be the most prohibitive aspects to MSN planners and decision-makers.
17 a feature currently being addressed by modelers such as John Pine at LSU, with a flood grid in GIS

80
For the purpose of this study, HAZUS wind fields mapped from Hurricanes Katrina and
Rita (Friedland 2007) are mapped in GIS shapefile format to explore wind field calculation
methods (section 4.4). HAZUS is further explored as a future direction to estimate maximum
hurricane winds for lower order storms; and potentially to determine decreased risk zones for
MSN facilities to shelter in place for storms with predicted landfall strike probabilities east or
west of Louisiana at L-48 (forty-eight hours to landfall) (section 6.2.2).
Additional hurricane modeling tools are currently available and continually being
improved upon for hurricane planning and risk determination. While they were not utilized in the
current study, they are briefly discussed here for reference.
3.3.1.3 NOAA Coastal Risk Atlas
The NOAA Coastal Risk Atlas18 is an online tool which provides access to highly
detailed vulnerability assessment maps and tools (VATs). For coastal Louisiana, viewers have
access to flood zone information, surge and wind envelopes, and many other data layers such as
critical facilities, storm tracks, evacuation routes, and environmental and demographic
vulnerabilities (Coastal Risk Atlas website,18 Figure 13).
Image loading and map generation are fast, with coordinates displayed in both decimal
degrees and Degrees Minutes Seconds (ddmmss).
However, the mapping is in some ways unclear; for example, the flood and wind risk
color codes and what these actually mean to planners. Although there is a tutorial and links to
surge information, the site is in still in development and missing some information and links for
Louisiana parishes. It is hoped the site may incorporate more GIS functionality as it is further
developed, including the ability to download files for individual GIS use.
18 http://www.ncddc.noaa.gov/website/CRA_Louisiana/viewer.htm

81
The Coastal Risk Atlas is nonetheless a landmark in the type of tool that may be most
useful in emergency planning for MSN at the local level. Only minor enhancements would be
needed to integrate it with GIS and modeling projects. Expanding the atlas to include more
information and legend detail would make it more useful to local MSN decision-makers.
3.3.1.4 HURREVAC
HURREVAC is a program used by emergency managers to plan and manage evacuation
operations and anticipate hurricane effects of surge and wind (Figure 14). HURREVAC can
incorporate data from local hurricane evacuation studies with National Hurricane Center (NHC)
advisory and landfall probability data (i.e., error cones) for approaching hurricanes allowing
emergency managers to manage the more detailed aspects of an evacuation (FEMA and USACE
Comprehensive Hurricane Data Preparedness Study Web Site19).
19 http://chps.sam.usace.army.mil/USHESdata/SLOSH/Sloshmainframe.htm
Figure 13. The NOAA Coastal Risk Atlas Vulnerability Mapping tool for Louisiana (NOAA CSC 2007)
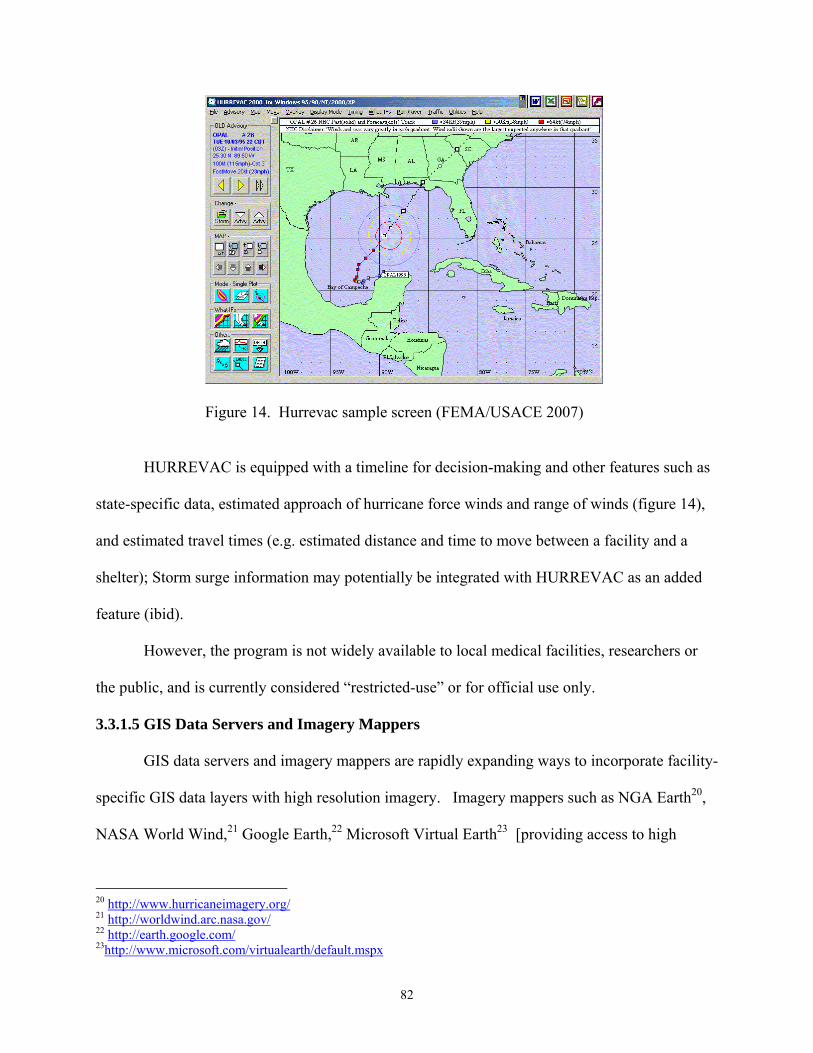
82
Figure 14. Hurrevac sample screen (FEMA/USACE 2007)
HURREVAC is equipped with a timeline for decision-making and other features such as
state-specific data, estimated approach of hurricane force winds and range of winds (figure 14),
and estimated travel times (e.g. estimated distance and time to move between a facility and a
shelter); Storm surge information may potentially be integrated with HURREVAC as an added
feature (ibid).
However, the program is not widely available to local medical facilities, researchers or
the public, and is currently considered “restricted-use” or for official use only.
3.3.1.5 GIS Data Servers and Imagery Mappers
GIS data servers and imagery mappers are rapidly expanding ways to incorporate facility-
specific GIS data layers with high resolution imagery. Imagery mappers such as NGA Earth20,
NASA World Wind,21 Google Earth,22 Microsoft Virtual Earth23 [providing access to high
20 http://www.hurricaneimagery.org/ 21 http://worldwind.arc.nasa.gov/ 22 http://earth.google.com/ 23http://www.microsoft.com/virtualearth/default.mspx
83
quality local imagery and aerial photography through extensions such as Live Local24] and others
are developing at a rapid pace. Most recently, the Louisiana GOHSEP has developed Virtual
Louisiana, with access currently available to government officials upon request.
Google Earth Pro (the commercial version) was used in aspects of the Hurricane Katrina
emergency mapping response to provide emergency managers with access to images of the flood
extent in the city of New Orleans. The New Orleans GIS database (LSU HPHC 2007) was
utilized extensively following Katrina, effectively transformed from an Arc-IMS for hurricane
research into a GIS data server for emergency response mapping. GIS software from ESRI
(discussed more in detail in section 4.2), GeoMedia, Intergraph and others are increasingly able
to incorporate hurricane modeling outputs with facility and region-specific data via online
servers. Meanwhile, imagery mappers such as NASA World Wind can incorporate various
“add-ons,” most often developed by individuals (e.g., via scripts and code); but sometimes
require fixes, have limitations in GIS data processing abilities, or do not operate as intended.
NOAA’s Coastal Risk Atlas (Section 3.3.1.3), as well as other mapping websites with
hurricane information (e.g., made available by ESRI ArcServer, the LSU HPHC, or Louisiana
State Agencies such as GOHSEP, the Department of Transportation and Development (LA
DOTD)25 and Louisiana Geographic Information Center (LAGIC)26) may be some of the most
applicable tools for local level facility managers and planners to assess hurricane risks to their
facilities, particularly where hurricane data is incorporated, detailed and up to date.
A feature that is mainly still in development includes download capability and ways to
incorporate or modify site-specific information from these servers and imagery mappers. At the
same time, the sites may be difficult to use or understand when planning for a specific storm,
24 http://maps.live.com/ 25 http://dotdgis.dotd.louisiana.gov/website/ 26 http://lagic.lsu.edu/hurricanes/

84
may not incorporate all necessary or updated data, or explain the data layers and their
symbology. Similar sites that have been developed to provide online mapping, but without
efficient storage or knowledge of how to transfer the information quickly, often frustrate and
limit the public. Unless maps can be generated within a few seconds, online maps will cause
frustration and are not likely to be used.
3.3.2 GIS Mapping for Hurricane and Public Health
Diverse state initiatives are currently underway to incorporate public health with
emergency response and planning for hurricanes in a GIS. A number of newsletters including
CDC Public Health and GIS News and Information27 and ESRI Healthy GIS28 detail the wide-
ranging advances being made in public health geoinformatics, GIS for epidemiological studies,
and hurricane studies which vary by state and state emergency agency.
For example, The Division of Environmental Health (within Florida’s Department of
Health) recently placed online downloadable GIS data and a dynamic mapping tool to access
vulnerability data such as Mobile Home Parks, Group Homes, etc. (Healthy GIS, Summer 2006).
The Center for Pre-hospital Care Education and Research at Loma Linda University
Medical Center is using GIS to bridge Emergency Medical Services (EMS) and other emergency
resources including hospitals, medical helicopters, ambulances and rescue vehicles among
regional response agencies (Healthy GIS Winter 2007).
Meanwhile, on the Federal level, the US DHS is exploring enterprise GIS for its disaster
planning (ArcNews, Winter 2006/2007); Updates to public health data are newly available
through the Health Resources and Services Administration (HRSA) (Public Health GIS News
27 http://www.cdc.gov/nchs/about/otheract/gis/gis_publichealthinfo.htm 28 http://www.esri.com/industries/health/news-community/healthy_gis.html

85
and Information, March 2006, No. 69); and mobile GIS is being explored outside of the US for
disaster planning in El Salvador for use in relief efforts (ArcUser Jan-Mar 2007).
As discussed, at LSU, a project has been underway since 2002 to integrate physical
hurricane research and modeling outputs (e.g., data layers for transportation, evacuation,
meteorology, wind and surge, etc.) into a GIS to determine public health impacts of a hurricane
strike in New Orleans (LSU HPHC 2007).
A number of articles from the perspectives of GIS and health are briefly mentioned as
applicable to the current study. These are introduced from the International Journal of Health
Geographics. For example, GIS has been used by Bell and Dallas (2007) to simulate and model
vulnerability of urban health care systems to nuclear attack. They attempt to identify inoperable
hospitals and trauma centers relevant to weapons of mass destruction and mass casualty events at
varying scales. Moss et al 2006 have applied GIS to map functional disability among older
American Indians and Alaska natives from 2000 census data. Of particular relevance, they
indicate that the GIS mapping techniques used helped “visualize those who might otherwise be
‘lost’ from the data” and help to plan for the better placement of services (ibid). Mobley et al
2006 perform spatial analysis in GIS to study elderly access to primary care, to support the
ongoing debate related to physician shortages.
3.3.2.1 Protecting Medical Data Privacy in Maps
One important aspect to consider when mapping public health data at detailed levels is
that “…most health and social service data at the client or case level is strictly confidential (ESRI
1999, p. 6).” However, “GIS can help aggregate and display this data accurately to the census
tract, county or region level (ibid, p. 6).”
86
Privacy concerns must be considered when retrieving and mapping data that could
potentially reveal the identity of a person or their medical information. To prevent data from
being extracted on individuals, personal identities can be further aggregated beyond the county
level (Laymon 1999) such as by census tract block group, neighborhood or zip code. For zip
codes with populations less than 20,000, first three zip code numbers should be used only (Tsui
and Curtis 2007). Other ways to de-identify data include destroying identifiers and all elements
of dates except year (ibid).
Privacy issues related to GIS mapping of medical and public health data are becoming a
major issue. Generally, GIS and public health mapping are governed by the Federal Health
Insurance Portability and Accountability Act (HIPPA, 1996), Freedom of Information Acts
(FOIA, 1983) and may also vary by individual state (public records acts) and agencies as
governed by state law (ibid). Requirements to protect critical infrastructure data may also apply
in some circumstances (ibid). Additional information on protecting privacy in GIS maps is
available from the National Cancer Institute website,29 Curtis et al 2006, and Onsrud et al 2004.
3.3.2.2 Mapping Considerations for MSN Decision-Makers and the Public
There is an additional mapping note which hurricane researchers, academics and
modelers should consider when they attempt to transfer the latest technology and research
products to emergency management, facility managers, decision-makers and the public. Unless
addressed, resultant maps may be unclear and will unavoidably reflect a difference in expertise,
priorities, urgency, responsibilities, jargon (especially acronyms), management styles, and ways
of doing business, among others.
29 http://gis.cancer.gov/resources/regulations.html

87
For example, in 2002, experimental storm surge models in development at the time30
were used to brief to Governor Mike Foster as Hurricane Lili approached Louisiana. The
Governor, similar to most emergency managers and decision-makers, had little patience for a
time-series model of estimated surge flooding that presented flood levels in meters (versus feet)31
and times in Universal Coordinated Time (UCT) or Zulu32. He immediately asked for depths in
feet, and times to be represented in Central Standard Time (CST) for Louisiana; a reasonable
request, but which had escaped the focus of the modelers as they attempted a very high
resolution flood animation (Westerink et al 2004). Similarly, emergency managers (particularly
the military, on critical missions) understandably prefer one to two sentence explanations of what
model outputs or GIS maps actually mean in an emergency.
Thus, hurricane researchers and modelers should consider abridged notes or explanations
on map legends to clearly explain model outputs and maps. Maps should also spell out
acronyms and be designed to suit the perspective of the user. In the case of MSN patients or
planning, further study is needed to explore methods of effectively communicating and
visualizing risk (see also, section 5.2.5). Optimally, emergency managers and researchers should
meet long before hurricane season to discuss research products in development, their
assumptions and limitations. In the example of the New Orleans pilot study (HPHC 2007),
annual advisory board meetings of Federal, state and local partners with academia worked well
to provide a common forum.
There are many new tools in development which MSN planners and decision-makers can
choose from to incorporate hurricane risk modeling with some level of local and regional
mapping information. However, the challenge remains to choose the best tools and build the
30 through the LSU Hurricane Public Health Center New Orleans Pilot Study 31 1 meter = approximately 3.28 feet 32 Central Standard Time (CST) = UCT or Zulu (or Greenwich Mean Time, GMT) minus 6 hours
88
most useful system for individual information needs. Current geographic approaches have
varying strengths and weaknesses, and are constantly improving. However, the latest updated
and site-specific hurricane data should be available, understandable, and not allow the
information to be “lost in translation (see also, section 1.5).” This study has a particular focus
on ensuring that the technology and science are accessible to MSN decision-makers in an
emergency and presented in an understandable, practical way.
3.3.2.3 Section 508 Online Mapping Considerations
One final mapping consideration for hurricane and health GIS includes Section 508
online mapping requirements. Since 1998, Congress has required Federal agencies to ensure that
their electronic information is accessible to people with disabilities. Section 508 promotes
accessible information technologies across the internet for online applications for the disabled
such as the visually impaired (1194.22). Features such as “Alt Text” web text on web pages and
similar features specific to GIS mapping can be added or built into online map resources. Later
release versions of ESRI ArcReader are Section 508 compliant with minor issues (ESRI 2007).
Section 508 considerations will need to be addressed for any GIS planning tool designed for use
by MSN facilities and the public.

89
CHAPTER 4 RESEARCH METHODS
As outlined in Chapter 2 (Objectives), a literature review (Chapter 3) was conducted to
identify health risks associated with evacuation vs. sheltering in place for coastal Louisiana MSN
patients. Additionally, insights were sought on the decision processes of MSN patients and why,
as evidenced from Hurricane Katrina, many decided not to evacuate a hurricane risk area
(section 1.3). A summary of these findings was provided in sections 3.1.1 through 3.1.3.
Building upon this data, further objectives were to determine threshold storm events
affecting MSN populations in coastal Louisiana to answer the research question: Can any MSN
patient shelter safely in coastal Louisiana for any level of hurricane? Current hurricane risks
(section 1.4) and physical aspects of hurricanes (section 3.2) to coastal Louisiana MSN facilities
and residences revealed some crucial factors to consider when researching this question.
Referencing the latest hurricane research and project findings, selected hurricane models
(section 3.3.1) were incorporated into a GIS. Critical MSN locations such as hospitals and
nursing homes were mapped with recent patient census counts, as well as other MSN data related
to emergency medical response. This chapter describes study research methods in more detail.
4.1 Determining Threshold Hurricane Events Affecting MSN Evacuation and Sheltering
For this study, a threshold hurricane event was generally defined as the storm level and/or
storm condition that would place coastal Louisiana MSN facilities or critical transportation,
evacuation or sheltering sites in jeopardy of flooding or wind damage above what the facilities
would likely be able to sustain. From section 2.2, threshold storms were conceptualized as flood
and wind levels unsafe for MSN patient sheltering in place, without substantial mitigation
measures taking place, such that MSN patients would be recommended to evacuate.

90
Twenty-six coastal Louisiana parishes (listed in Appendix B) were selected for the study
based on the elevation vulnerability of those parishes that had some portion of land south of
interstates I-10 and I-12 in Louisiana. As discussed in section 1.4 (see also, Figure 5) these
parishes may have elevations which drop off drastically south of the interstates, exposing them to
higher storm surge vulnerabilities. The selection of these coastal parishes is also supported by
the hurricane research which substantiates higher wind risk directly off the Louisiana coast
(Robbins 2004, Kaplan and DeMaria 1995).
Based again on project findings (sections 1.4 and 3.2), Category 1-3 level storms (see
also, Appendix A) were chosen for analysis in this study in an attempt to determine threshold
events that will impact coastal Louisiana MSN facilities. First, it has been determined that it is
highly relevant to model lower order storms which commonly make landfall in Louisiana.
Second, since tropical storms are less likely to cause severe storm surge flooding (or substantial
wind damage), and Category 4 hurricanes are likely to trigger a substantial medical evacuation,
the storms that fall within this range were selected for a more in-depth review. Third, there is
greater uncertainty as to how these storm levels would impact specific MSN facilities and plans
to evacuate or shelter-in-place. The selection of Cat 1-3 storms for modeling was determined the
most effective approach to begin differentiating coastal MSN facilities south of the interstates
according to storm surge, wind and other hurricane risks.
A review of historical Louisiana hurricane data and related research (section 3.2) has
indicated three major directions in which to proceed with SLOSH storm surge modeling for the
Louisiana coast. First, due to the planning objective of the study, and to consider the risk of
rapid hurricane intensification, other coastal factors, and the serious implications for MSN
patients, SLOSH MOMs were selected to be modeled to provide the most conservative analysis
91
(see also, section 3.3.1.1). Conservative modeling approaches are favored by Dr. S. Hassan
Mashriqui, PE of LSU (2007) based on his experience with storm surge modeling uncertainties.
Particularly, while he indicates that both SLOSH and ADCIRC storm surge models currently
tend to overpredict surge values, he advises that error should always be on the side of caution for
hurricane evacuation strategies due to the unpredictable nature of hurricanes and potential for
rapid intensification and shift in track; potential error in the models (potentially in modeling
waves and accurate barrier heights); the critical nature of MSN patients and risks to human life;
and considering dramatic recent changes to the coast (ibid).
In a second direction for storm surge modeling as supported by project findings in section
3.2.2.7, hurricane flood risks were reviewed for north (N) tracks (where applicable) as they
approached the Louisiana coast.
Finally, as discussed in SLOSH limitations (again, section 3.3.1.1) data layers which
extended surge flood risks further inland from the shoreline based on LIDAR data (herein
referred to as “LIDAR-extrapolated” SLOSH MOM datasets or GIS layers - Binselam 2007/LSU
Hurricane Center) were also incorporated into the study in an attempt to tally and verify project
results from SLOSH version 1.43 shapefiles.
As will be discussed, Critical MSN data layers were collected and imported into a GIS
and viewed with SLOSH MOM storm surge outputs for Cat 1-3 hurricanes. HAZUS shapefiles
were originally explored in a GIS for the determination of winds that could impact MSN
facilities under Cat 1-3 storm conditions; but overriding wind calculation factors (section 4.4)
were utilized to generate final wind effects results. Given all project findings and methods,
threshold events impacting MSN facilities in coastal Louisiana were determined for MSN
facilities with results presented in Chapter 5.

92
4.2 Data Collection and Incorporation into a GIS
MSN facilities for this study included Louisiana:
1. Hospitals (with hurricane season 2007 census estimates)
2. Nursing homes (with hurricane season 2007 census estimates)
3. Additional MSN facilities such as:
a) hospice – places where end of life care is provided to the terminally ill. This
can be an inpatient setting or a patient’s residence
b) adult day care (ADC) – facilities where there are 10 or more functionally-
impaired adults throughout the day
c) adult hospital day care (AHDC) – facilities that provides direct professional
medical supervision and/or personal care supervision to the physically and/or
mentally impaired
d) adult residential settings - 24 hour residences that provide personal assistance,
lodging and meals for compensation to at least 2 adults
e) early infant intervention (EINF) – facilities that provide care, supervision,
treatment, and therapy to children who are developmentally delayed and may
have a serious disabling condition
f) intermediate care facilities for persons with mental retardation (ICF/MR); also
Intermediate Care facilities for persons with Developmental Disabilities,
(ICF/DD) – facilities which provide health or rehabilitation services to
individuals with mental retardation or related conditions
g) respite care – facilities that provide temporary care and supervision of a person
with a disability or infirm elderly

93
h) traumatic brain injury facilities – facilities that provide rehabilitative treatment,
personal assistance and supervision to adults who suffer from brain injury in an
inpatient, outpatient, or apartment living setting
4. Critical MSN transportation, evacuation or sheltering locations such as:
a) Temporary Medical Operations Staging Areas (T-MOSAs)
b) Medical Special Needs Shelters (MSNS)
c) Medical Special Needs Medical Marshalling Points (MMPs) – train stations
(MMP-Ts) and airfields (MMP-As) where MSN patients are planned to be
triaged for further care and transported on trains to MSNS, other MMPs or
TMOSAs
d) Coastal Parish Pick-up Points (CPPP) - pick-up points in the coastal parishes for
individuals needing assistance with further transportation to a shelter
e) Critical Transportation Needs Shelters (CTNS) – new shelters designated for
those who don’t have transportation or a place to stay during the storm
f) Information points - stations along the hurricane evacuation route where
evacuees can obtain important information on evacuation and sheltering
Data sources for each of the critical MSN locations are listed separately in section 4.2.1.
Additional MSN facilities and residences which were not mapped included facilities
which house the blind, deaf, or mentally ill. These datasets were not available for Louisiana at
the time of the study. Other large MSN population groups that could not be mapped included
parish or zip code level counts of elderly, disabled and those with chronic conditions living in
households. While data (US Census Bureau 2000) is available on elderly and disabled in
Louisiana, these populations are expected to have changed significantly in 2005 following

94
Hurricanes Katrina and Rita. 2005 population estimates (US Census Bureau 2006a) and Health
& Population Surveys (US Census Bureau 2006b) are available for some coastal Louisiana
parishes with information on elderly in households and health indicators such as diabetes, high
blood pressure, heart disease and mental illness. However the current mapping study excluded
these maps since a complete dataset for all 26 coastal parishes is not available, but would be
necessary to compare statistics, determine areas of higher vulnerability and distinguish priority
areas. The data will be an important addition for future study when census totals are complete.
Critical MSN data sets were collected and geo-coded for incorporation into ESRI ArcGIS
9.2. Data sources and the geocoding method used are next outlined.
4.2.1 MSN Location Data
Louisiana hospital and nursing home locations were compiled from various sources,
including from the FEMA Geospatial Intelligence Unit CD, provided by the US DHHS;
Louisiana state databases, and other online sources. Lists were converted into Microsoft Excel
spreadsheets, where coordinate information was converted into decimal degrees (longitude and
latitude); or a search was conducted using NASA World Wind 1.4 (Figure 15) to locate
coordinate data. In some cases, addresses were geo-coded using merged tiger road files (2004).
DHH Regions were created and color-coded from Louisiana parish shapefiles. Cities,
places, roads (including interstates I-10 and I-12) and the Mississippi River were added to the
GIS. Data on licensed beds, operational beds, current census counts, status (open or closed), and
previous facility names were added to the excel lists from the DHH Health Standards website.
The excel files were converted to database (dbf IV) files and added to the map as x,y data.

95
Similar methods were used to map identified Temporary Medical Operations Staging
Areas (T-MOSAs), and Medical Marshalling Points (MMPs) which include airfields, Amtrak
Union Passenger Terminal and the New Orleans Convention Center.
Data sources included appendices provided by state agencies to the US DHS in 2006
(Blanco/DHH Ex. 9). Data sources for additional MSN sites including hospice, adult day care,
adult hospital day care, adult residential settings, early infant intervention, intermediate care
facilities for persons with developmental disabilities, respite care, and traumatic brain injury
were selected from LA DHH and LA DSS datatsets, Louisiana GIS Digital Map (May 2007).
4.2.2 Critical MSN Evacuation and Transportation Data
Not surprisingly, many nursing home administrators view transportation as the most
pressing need for community collaboration during disasters (US DHHS/OIG 2006, p. 19).
Current city and state plans now outline strategies to pick up MSN patients, residents and those
with limited mobility in their homes, and to bring them to collection points where they will be
transferred via coach to designated shelters (Gordon/Times Picayune 2007). Some of the critical
points that were therefore mapped included DOTD Coastal Parish Pick-up Points (CPPPs),
Figure 15. NASA World Wind 1.4 with Yahoo! search feature.
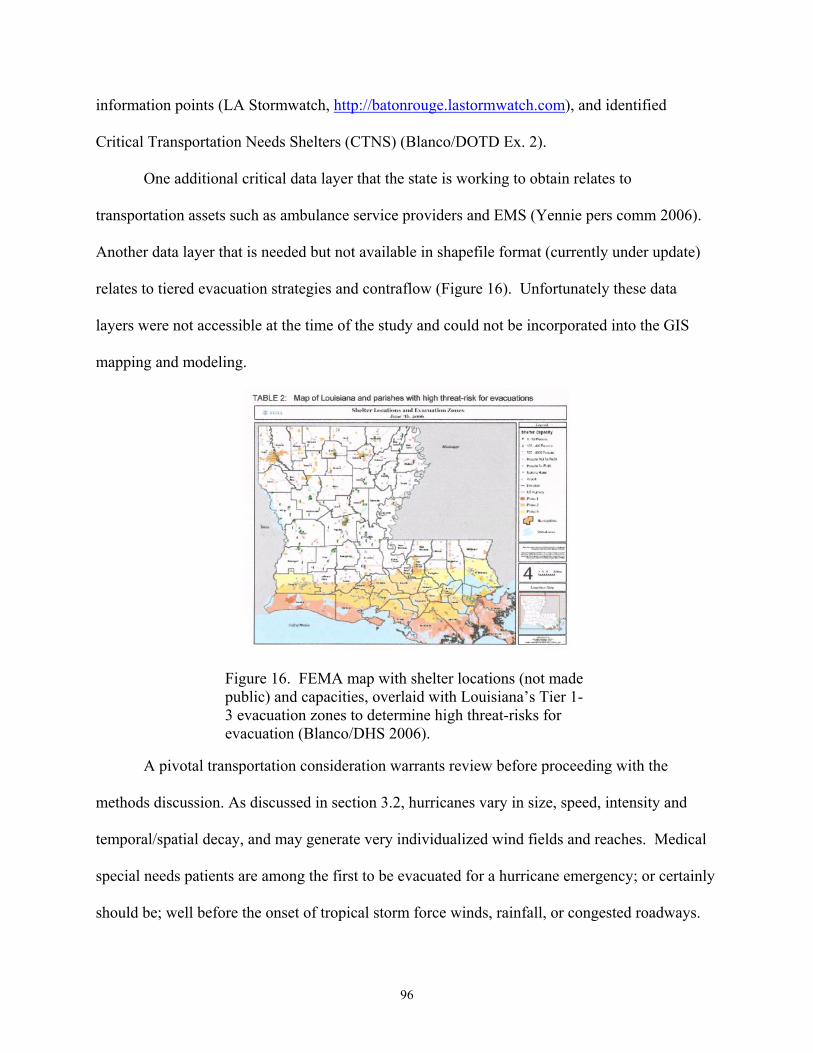
96
information points (LA Stormwatch, http://batonrouge.lastormwatch.com), and identified
Critical Transportation Needs Shelters (CTNS) (Blanco/DOTD Ex. 2).
One additional critical data layer that the state is working to obtain relates to
transportation assets such as ambulance service providers and EMS (Yennie pers comm 2006).
Another data layer that is needed but not available in shapefile format (currently under update)
relates to tiered evacuation strategies and contraflow (Figure 16). Unfortunately these data
layers were not accessible at the time of the study and could not be incorporated into the GIS
mapping and modeling.
A pivotal transportation consideration warrants review before proceeding with the
methods discussion. As discussed in section 3.2, hurricanes vary in size, speed, intensity and
temporal/spatial decay, and may generate very individualized wind fields and reaches. Medical
special needs patients are among the first to be evacuated for a hurricane emergency; or certainly
should be; well before the onset of tropical storm force winds, rainfall, or congested roadways.
Figure 16. FEMA map with shelter locations (not made public) and capacities, overlaid with Louisiana’s Tier 1-3 evacuation zones to determine high threat-risks for evacuation (Blanco/DHS 2006).

97
Ideally, decisions to evacuate will occur no later than 48 hours to hurricane landfall (L-48).
National Hurricane Center storm prediction technologies and capabilities are constantly
improving and becoming increasingly accurate; most recently a five-day forecast track model has
been released, although it is much less certain than the 3-day (NOAA 2007). So, what level of
information and warning do local facility decision-makers have in advisories at L-48?
(17a) Katrina strike probabilities, approximately 48-hours to landfall
(17b) Katrina approximate landfall
(17c) Katrina warning/watch projection cone, approximately 48-hours to landfall (Cat 2-3)
(17d) Katrina approximate landfall (Cat 3)
Figures 17a-d. Hurricane Katrina strike probabilities and 3-day warning/watch at approximately 48 hours and landfall (NOAA National Hurricane Center, National Weather Service) Even considering storms that are initially set to strike the Florida panhandle or
Mississippi, with a lower possibility of striking Louisiana (Katrina in 2005, figures 17a-d); OR
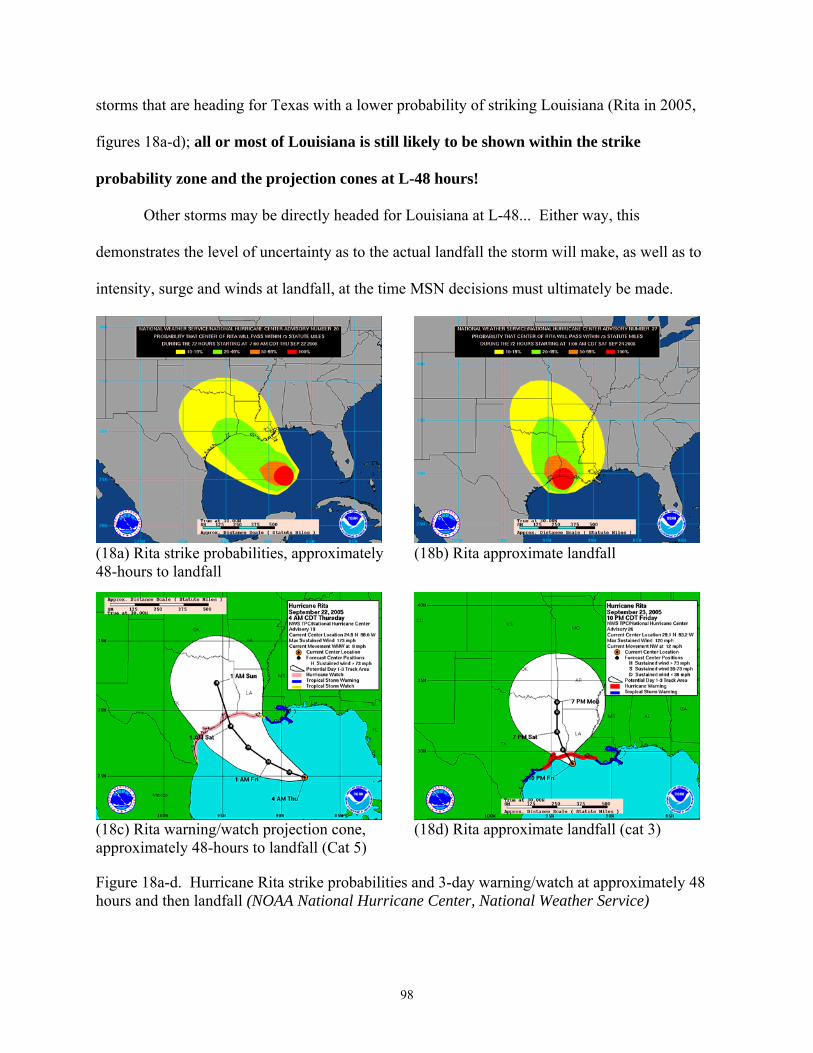
98
storms that are heading for Texas with a lower probability of striking Louisiana (Rita in 2005,
figures 18a-d); all or most of Louisiana is still likely to be shown within the strike
probability zone and the projection cones at L-48 hours!
Other storms may be directly headed for Louisiana at L-48... Either way, this
demonstrates the level of uncertainty as to the actual landfall the storm will make, as well as to
intensity, surge and winds at landfall, at the time MSN decisions must ultimately be made.
(18a) Rita strike probabilities, approximately 48-hours to landfall
(18b) Rita approximate landfall
(18c) Rita warning/watch projection cone, approximately 48-hours to landfall (Cat 5)
(18d) Rita approximate landfall (cat 3)
Figure 18a-d. Hurricane Rita strike probabilities and 3-day warning/watch at approximately 48 hours and then landfall (NOAA National Hurricane Center, National Weather Service)

99
4.2.3 Critical MSN Shelter Data
Medical Special Needs Shelters (MSNS) were mapped with capacity information.
General population shelter data was not incorporated or mapped in this study since the data is not
made public. While there are hundreds of shelter sites across the state, community resources in
place for other citizens may not be available to nursing home residents (Prats 2003) or to other
MSN patients. Louisiana is among the Gulf States that “discourage or restrict nursing homes
from using State special needs shelters as evacuation sites… (ibid, US DHHS/OIG 2006, p. 19).”
General population shelter locations are not released to the public until the site is deemed safe
and able to be used; there is a “delicate balance” that must be achieved when deciding which
shelters to open, when and where, because often soon after an announcement, the public will
arrive (Downey pers comm 2007). However, there will be a benefit to analyzing shelters with
hurricane risk data in future work since “…surge models could be used to help coastal parishes
decide whether or not to open, and better weigh the risk vs. the benefit (ibid).”
Figure 19. Critical medical sites and MSN locations for the project study (ESRI ArcGIS 9.2, Data sources are listed in section 4.2.1).

100
The final project map for this study as mapped in ESRI ArcGIS 9.2 by LA DHH Region
is shown in Figure 19. It can also be viewed with LIDAR elevation data and imagery.
4.2.4 Special Considerations: Levee Breach and Status, Katrina Maximum Flood Depths
Two years after Hurricane Katrina and the levee breaches, independent critics and Corps
officials agree that in New Orleans, regarding the Hurricane Protection System (HPS) there is
“…an incomplete levee system that could fail on its eastern and southern borders – even during
smaller hurricanes” (Schleifstein/The New Orleans Times-Picayune May 9, 2007, Figure 20a).
Figures 20a-b: Levee breach locations and current problem spots viewed with LIDAR elevation contours and nursing home status (non-operational and closed facilities), based on overview data from the New Orleans Times Picayune (Schleifstein 2007). (ESRI ArcGIS 9.2, with GIS data from Yang, Peele, and Binselam).
As of hurricane season 2007 “…even a strong Category 2 hurricane entering the
Intracoastal Waterway from Lake Borgne could overtop levees…(ibid).” Levee problem spots
circle the city of New Orleans on both the East and West Bank, with sections that remain to be

101
rebuilt or are incomplete; remain unarmored; are too low; have gates that are lower than
adjoining levee walls; have sheet piling that is insufficient, or gaps at utility and other crossings
(ibid). To account for this added hurricane risk, a Light Detection and Ranging (LIDAR) mosaic
providing elevation depth in ft NAVD88 (Binselam 2006) was incorporated with data layers
such as the New Orleans HPS (USACE, Yang 2004) and Katrina levee breach shapefiles
(Peele/LGS, Cunningham and Braud) to be viewed in a GIS environment (Figure 20b).
The LIDAR data was classified and a symbology was developed to represent elevation
values in New Orleans (feet NAVD88). Levee breaches were represented as red on a new HPS
shapefile that incorporated the full HPS including the Arpent levee (ibid) and West Bank levees
(USACE). A separate data layer was developed to point out levee problem spots to be viewed
with MSN locations (Figure 21).
Figure 21. Levee problem notes and LIDAR for adjacent MSN facilities (zoomed data) and info tool. ESRI ArcGIS 9.2.
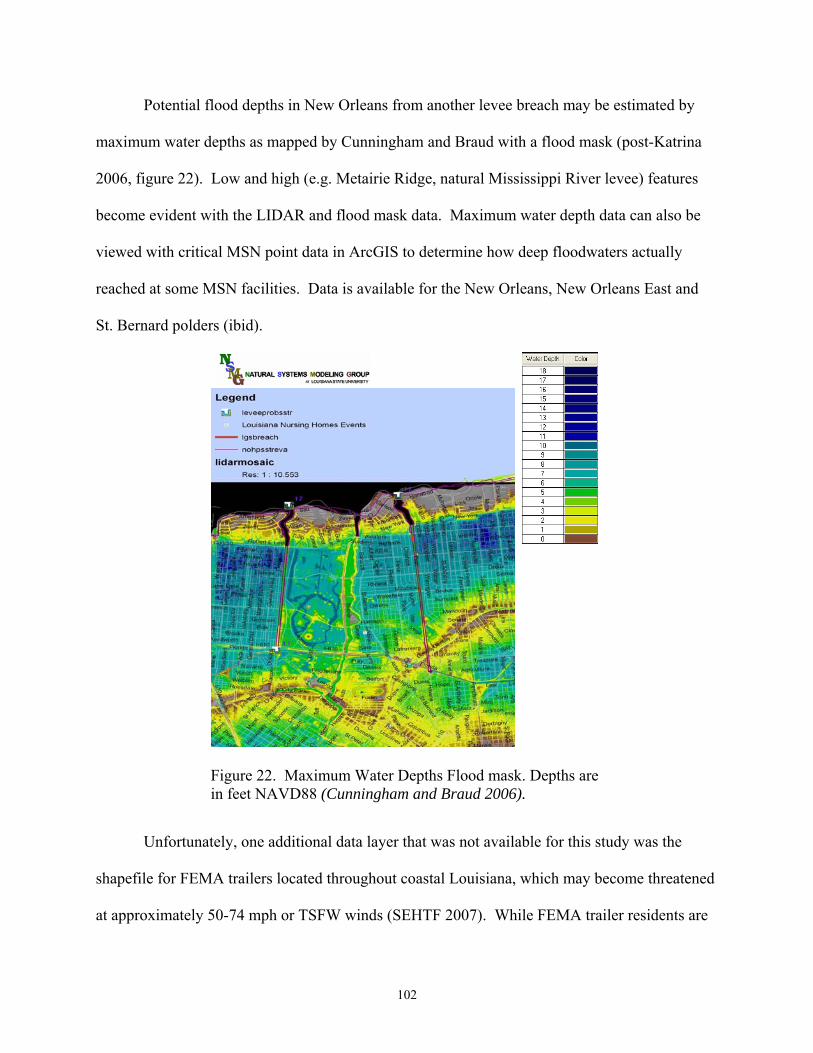
102
Potential flood depths in New Orleans from another levee breach may be estimated by
maximum water depths as mapped by Cunningham and Braud with a flood mask (post-Katrina
2006, figure 22). Low and high (e.g. Metairie Ridge, natural Mississippi River levee) features
become evident with the LIDAR and flood mask data. Maximum water depth data can also be
viewed with critical MSN point data in ArcGIS to determine how deep floodwaters actually
reached at some MSN facilities. Data is available for the New Orleans, New Orleans East and
St. Bernard polders (ibid).
Figure 22. Maximum Water Depths Flood mask. Depths are in feet NAVD88 (Cunningham and Braud 2006).
Unfortunately, one additional data layer that was not available for this study was the
shapefile for FEMA trailers located throughout coastal Louisiana, which may become threatened
at approximately 50-74 mph or TSFW winds (SEHTF 2007). While FEMA trailer residents are
103
expected to evacuate very early, they could unwarily become MSN patients in unsuccessful
evacuation or other unforeseen circumstances or hazards.
Hurricane tracks from the NOAA CSC shapefiles were also added to the final GIS with
time fields estimating ‘hours until landfall’ (L-HR) added for added ‘time-series’ analysis.
4.3 Integration of Storm Surge Flood Layers into GIS
As explained earlier by Will Shaffer of NOAA, a generated SLOSH surge value of 10
feet would be estimated to flood a facility at 8 ft but not at 12 ft within a grid cell. Therefore, an
important consideration when evaluating storm surge risk for any facility with SLOSH modeling
is the facility first floor elevation. However, these data were not generally available for the
current study. To support surge risk determination in this study where elevation is unclear,
LIDAR data (LOSCO, LSU and LOSRADP 2007, LGS/Binselam 2006) was applied to provide
a rough estimation of facility elevation. Based on 2007 elevation surveys employing recent
techniques for accurate elevation measurement, LIDAR is generally only accurate to within 1-3
feet (Cunningham et al 2003). However, it can still be used to provide an estimate of elevation
in the current analysis.
As discussed in section 3.3.1.1, NOAA developers have recently added a shapefile
feature to SLOSH outputs, so that they can be viewed in a GIS. Entire basin files can be
imported into ArcGIS as shapefiles and classified at corresponding storm levels for the MOM
(Cat 1- 5). Shapefiles were imported and color coded to match SLOSH outputs as they appear
on the CD program then clipped along the Louisiana coast. SLOSH outputs were then viewed at
selected storm levels in a GIS with other critical data layers. Hospital and nursing home census
estimates were labeled and viewed with labeled surge flooding estimates in SLOSH (figure 23).

104
Additional MSN facilities and critical locations were also evaluated, with results summarized in
Chapter 5.
SLOSH MOM values were calculated from input shapefiles (SLOSH version 1.43) across
the Louisiana coast for all storms. As discussed in section 3.3.1.1, conservative surge MOMs
will show flooding as if the storm makes landfall at every point, from every direction, worst
case. MSN facilities were manually counted, with additional verification applying clipped
SLOSH shapefiles (see also section 5.3), to tally facilities receiving at least 1 foot of storm surge.
Figure 23. MSN facilities at serious storm surge risk from a CAT 3 hurricane are evaluated and summarized (Chapter 5, Results). (SLOSH 2007, shown with LIDAR 2006, and MSN data layers). Note facilities falling just outside of SLOSH grid cells.
Mapping worst case storm surge flooding via SLOSH MOMs may be desirable in one
respect, since MSN facilities are the first to evacuate and begin transport of patients as far as 48-
72 hours out prior to hurricane landfall (L-HR). As discussed, although there are increasingly
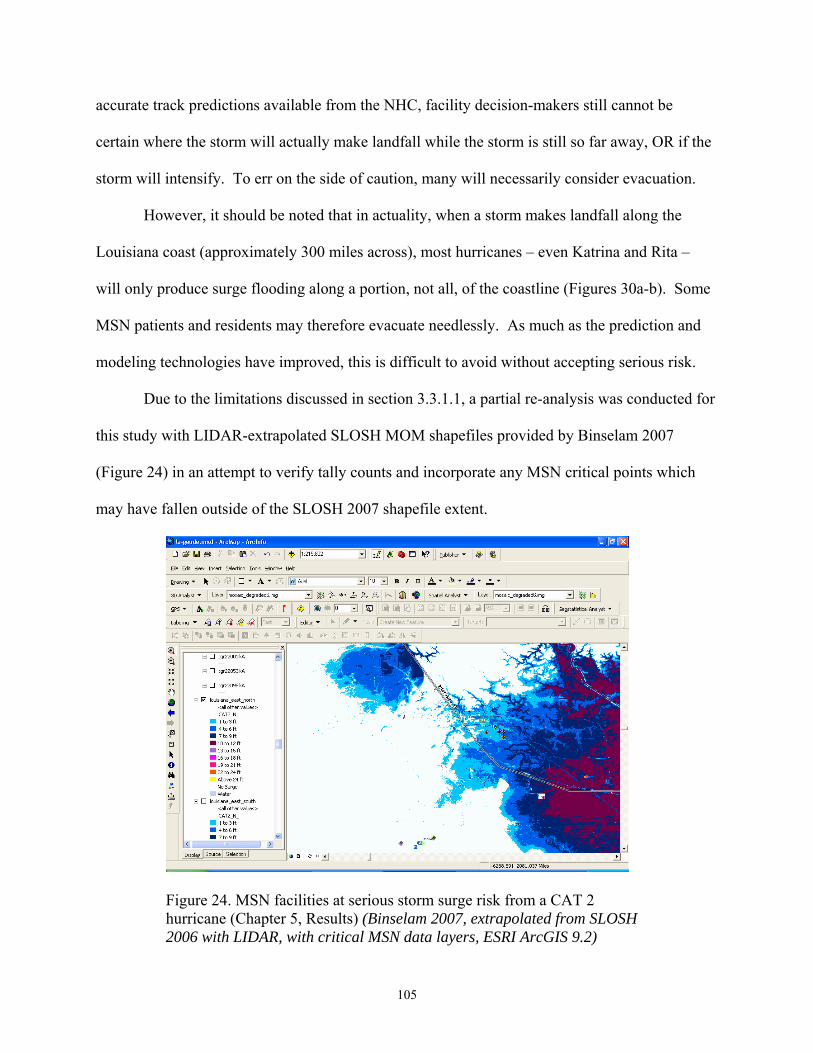
105
accurate track predictions available from the NHC, facility decision-makers still cannot be
certain where the storm will actually make landfall while the storm is still so far away, OR if the
storm will intensify. To err on the side of caution, many will necessarily consider evacuation.
However, it should be noted that in actuality, when a storm makes landfall along the
Louisiana coast (approximately 300 miles across), most hurricanes – even Katrina and Rita –
will only produce surge flooding along a portion, not all, of the coastline (Figures 30a-b). Some
MSN patients and residents may therefore evacuate needlessly. As much as the prediction and
modeling technologies have improved, this is difficult to avoid without accepting serious risk.
Due to the limitations discussed in section 3.3.1.1, a partial re-analysis was conducted for
this study with LIDAR-extrapolated SLOSH MOM shapefiles provided by Binselam 2007
(Figure 24) in an attempt to verify tally counts and incorporate any MSN critical points which
may have fallen outside of the SLOSH 2007 shapefile extent.
Figure 24. MSN facilities at serious storm surge risk from a CAT 2 hurricane (Chapter 5, Results) (Binselam 2007, extrapolated from SLOSH 2006 with LIDAR, with critical MSN data layers, ESRI ArcGIS 9.2)

106
There were two major limitations with the dataset. First, analysis was only possible for
Cat 2 and 3 storms, based on the original purpose of the dataset. Therefore, Cat 1 results could
not be re-analyzed with the LIDAR-extrapolated SLOSH data. Second, other than the
extrapolation of LIDAR, the re-analysis differed from the original SLOSH analysis in two
respects: (1) north tracks only were analyzed, rather than all directions; and (2) pre-Katrina
SLOSH data (2006) was used as the baseline (converted to the LIDAR NAVD88). The
supplementary tally with LIDAR-extrapolated SLOSH contours was a highly valued dataset for
its value in gleaning MSN facilities that may have been missed in the original SLOSH analysis.
Overall results and observations are discussed in Chapter 5.
4.4 Calculation of Wind Fields A number of aspects of hurricane wind must first be understood to make adequate use of
wind models for the calculation of wind fields. First, wind fields over land cannot be represented
using simply Saffir-Simpson hurricane categories (Appendix A), which are wind speeds over
water; but require a conversion method to represent wind speeds over land (Friedland pers comm
2007, Gregg 2006, Easley 2003, Vickery et al 2000). Further, wind speeds are averaged over
one minute in the Saffir-Simpson scale, while a 3-second gust is used in the design and
evaluation of building performance (Friedland pers comm 2007). Therefore, a series of
conversions are necessary to translate estimated Saffir-Simpson windspeeds at landfall into peak
gusts, which structural engineers will use to determine the level of damage a facility such that an
MSN nursing home will likely sustain (ibid).
Second, wind speeds will dissipate shortly after landfall, and at varying rates, based on
the storm size, forward tracking speed and other factors (Kaplan and DeMaria 1995, Robbins
2004). Therefore, wind impacts will not be as severe the further a storm moves inland.
107
Lastly, a very important facet of wind that is not largely known to the public in general is
that the pressure exerted by winds on a structure in a hurricane does not increase proportionally
to velocity, or windspeed. Aerodynamic equations reveal that wind force is proportional to the
square of the velocity,
Fw = ½ ρCfAV2
where Fw = the force of the wind on a surface
ρ = the density of the air
Cf = force coefficients (drag, lift, etc.)
V = wind velocity (3-second gust at 33’)
A = projected area normal to wind
such that, as windspeeds increase, the wind force increases four-fold! (ASCE 2005,
Friedland pers comm 2007, English pers comm 2007). Therefore, a jump by one hurricane
category (Appendix A) translates to much more damage structurally than generally perceived.
The FEMA HAZUS wind data from 2005 turned out to be a fitting dataset for review in a
GIS to gain a greater understanding of the wind levels and associated damage that may be
realized along the coast from a major hurricane (Figure 25).
Particularly, since both Hurricanes Katrina and Rita made landfall as approximate
Category 3 storms, HAZUS analysis and shapefiles (Friedland 2007) demonstrate the impacts of
estimated peak gusts over land and estimated percent of damage at the upper level intensity
desired for this study (as Cat 1- 3 storms were analyzed). Additionally, the hurricanes struck
alternate end of the state, demonstrating both the limiting extent of wind effects and surge (see
also section 6.2.1).

108
Figure 25. Peak gusts over land, Hurricanes Katrina and Rita (2005). HAZUS shapefiles provided by Friedland 2007. Katrina Data provided by ARA/FEMA directly after the storm. Rita data from NHC Advisory #28.
As determined from the mapped 2005 data for HAZUS peak gusts (Figure 25), associated
damage estimates for Hurricanes Katrina and Rita were also calculated and mapped (Figure 26).
Figure 26. Damage estimates (at least moderate damage) from Hurricanes Katrina and Rita, 2005. (HAZUS shapefiles provided by Friedland 2007. Both figures mapped in ESRI ArcGIS 9.2).
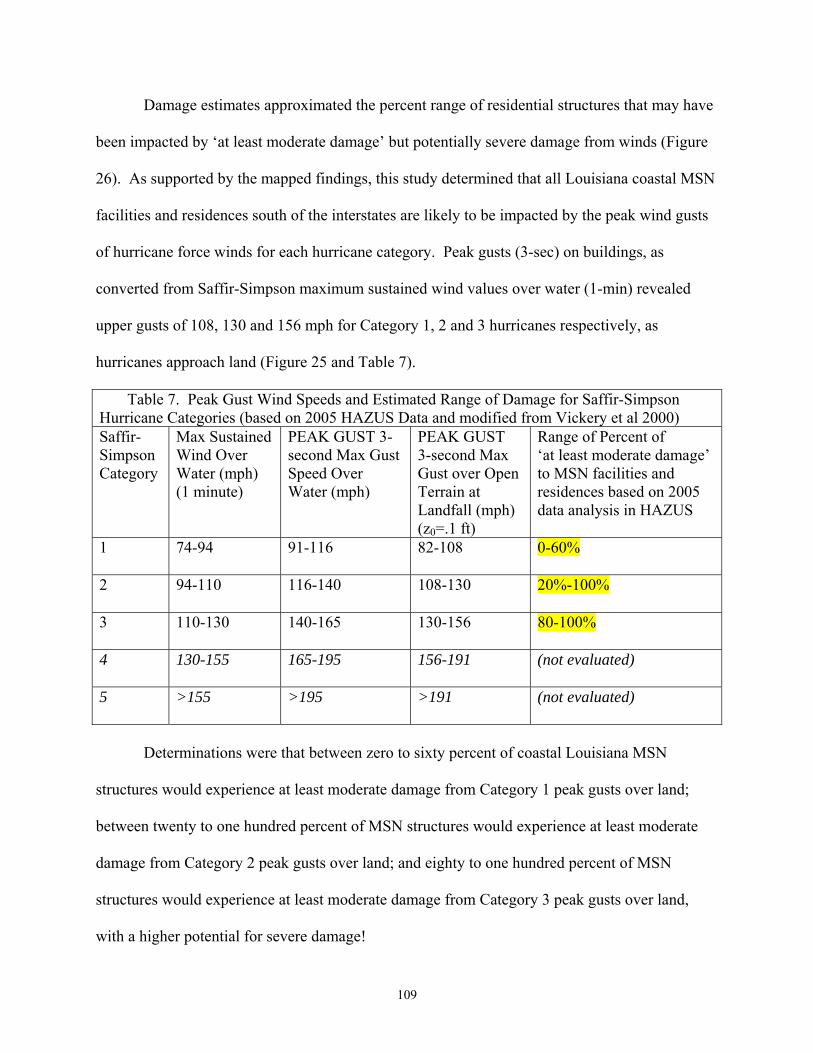
109
Damage estimates approximated the percent range of residential structures that may have
been impacted by ‘at least moderate damage’ but potentially severe damage from winds (Figure
26). As supported by the mapped findings, this study determined that all Louisiana coastal MSN
facilities and residences south of the interstates are likely to be impacted by the peak wind gusts
of hurricane force winds for each hurricane category. Peak gusts (3-sec) on buildings, as
converted from Saffir-Simpson maximum sustained wind values over water (1-min) revealed
upper gusts of 108, 130 and 156 mph for Category 1, 2 and 3 hurricanes respectively, as
hurricanes approach land (Figure 25 and Table 7).
Table 7. Peak Gust Wind Speeds and Estimated Range of Damage for Saffir-Simpson Hurricane Categories (based on 2005 HAZUS Data and modified from Vickery et al 2000) Saffir-Simpson Category
Max Sustained Wind Over Water (mph) (1 minute)
PEAK GUST 3-second Max Gust Speed Over Water (mph)
PEAK GUST 3-second Max Gust over Open Terrain at Landfall (mph) (z0=.1 ft)
Range of Percent of ‘at least moderate damage’ to MSN facilities and residences based on 2005 data analysis in HAZUS
1 74-94 91-116 82-108 0-60%
2 94-110 116-140 108-130 20%-100%
3 110-130 140-165 130-156 80-100%
4 130-155 165-195 156-191 (not evaluated)
5 >155 >195 >191 (not evaluated)
Determinations were that between zero to sixty percent of coastal Louisiana MSN
structures would experience at least moderate damage from Category 1 peak gusts over land;
between twenty to one hundred percent of MSN structures would experience at least moderate
damage from Category 2 peak gusts over land; and eighty to one hundred percent of MSN
structures would experience at least moderate damage from Category 3 peak gusts over land,
with a higher potential for severe damage!
110
“At least moderate damage” in HAZUS is defined as “major roof cover damage,
moderate window breakage, minor roof sheathing failure, and some resulting damage to interior
of building from water.” Severe damage extends to “major window damage, or roof sheathing
loss, major roof cover loss, extensive damage to interior from water (HAZUS technical manual,
Damage States for Residential Construction Classes).” Thus, even at Category 1 storm levels, up
to sixty percent of coastal Louisiana structures (including MSN) in the study would be expected
to sustain damage that could harm MSN patients by ‘at least moderate’ damage levels, unless
sheltering in a recently designed or mitigated facility such as a multi-story hospital.
Following a review of the 2005 wind data, it was determined that hurricane
characteristics and the baseline wind equations that go into the HAZUS determinations, as well
as NOAA NHC HRD surface wind products (Figures 33a-c, section 6.2.2), could be applied in
the current study. These provide a conservative methodology in GIS to determine added wind
risk from hurricanes at the Category 1-3 level. The methodology was further developed along the
following basis: The distance from the Louisiana coast to interstates I-10 and I-12 was estimated
in a GIS to range between 25 and 100 miles. As discussed in section 3.1.3.1, hurricane-force
winds (HFWs) “can extend outward [from the eye] to about 25 miles in a small hurricane and to
more than 150 miles for a large one (NOAA 1999, p.2) (Figure 27).”
Regardless of hurricane size, it is assumed for this study that the HFWs that extend
outward from the hurricane eyewall (1) will make landfall well before the eyewall and (2) will
not likely dissipate until the hurricane hits, i.e., approaches the shallow waters of the coast and
then traverses land (Friedland pers comm 2007). Thus, in this case, the current study assumes
that the maximum or peak wind gust over terrain will be realized on MSN residences and
facilities for each Category hurricane at least as far inland as the interstates.

111
4.5 Sharing Hurricane Research and Modeling Tools in GIS
Methods were also explored to present hurricane research and models with facility-
specific data, MSN locations and other critical data for local facility managers and other planners
to access and use. Further study and one-on-one discussions are needed on this topic to identify
effective methods of communicating and visualizing risk data to MSN populations, perhaps with
GIS. However, some preliminary identified strategies could include preparing data layers on CD
and supplying these; or providing the data layers online for download, with options for
downloadable GIS readers. The intention would be to make as much of the data available, able
to be managed locally by users, and freely available and read by GIS readers; yet still preserve
the ability of local users to view and manipulate input tables of data as well as add their own
data. The following formats were tested for this application with methods briefly reviewed here.
Figure 27. 20 mile wind buffers simulate hurricane force winds extending as far inland as the interstates as various hurricanes approach landfall (NOAA 1999) ESRI ArcGIS 9.2
112
Arc Explorer (Arc Explorer map files -.axl)
Versions of Arc Explorer are freely available for download. Selected project shapefiles
were imported into ArcExplorer 9.2 and maps were saved as .axl files. Basic shapefiles were
loaded and saved as maps for viewing, but with little ability to edit or manage the files, view
multiple layers, or add symbology. Limitations included low quality of data viewing and
difficulty in modifying or adding files. The software can also be slow and tedious when it first
opens and present problems with graphics or computer requirements.
GIS Data Servers and Imagery Mappers
GIS data server and mappers were also explored as a means of sharing project outcomes
with the MSN public. In some cases, individual shapefiles can be added as layers over many
types of imagery, and can be viewed in detail from many perspectives. There are also some
powerful search tools for address searching and obtaining coordinates through features such as
Yahoo! search and integrated Microsoft Virtual Earth. However, while the imagery and search
tools are often impressive, the ability to view, manage, edit or add multiple files is still being
developed and is not currently suited to the current task.
Arc Reader (Arc Publisher Map Files -.pmf)
Map files (.pmf) were another option explored. These can be created within ArcGIS
through an extension of ArcPublisher. All of the project data layers were able to be loaded into a
user-friendy interface for viewing, with options for adding data and allowing some data
management. The ArcGIS symbologies are maintained in map files making this a good way to
share data, view multiple files, and integrate site-specific data. More however is needed for local
users to be able to view and edit tables, arrange layers, edit symbologies to some extent once
they have been created, and integrate and manage the data into their own files.

113
CHAPTER 5 RESULTS
5.1 Result Tables
The following tables present the results of the hurricane storm surge modeling in a GIS.
Result summaries follow the tables (in sections 5.2.1 and 5.2.2) indicating final determinations
of threshold storm events that would impact MSN evacuation and sheltering planning.
SLOSH 2007 storm surge modeling results for MSN facilities impacted by Category 1, 2
and 3 storms are presented in tables 8-10, respectively. Any facility impacted by at least one
foot of floodwater was tallied in the table. Hospitals and nursing homes, which had census
counts available for hurricane season 2007, also include patient tallies. Although “available
beds” and “capacity” information was also available for some of the other MSN sites within the
data, these were not included in total patient counts since they were not actual census counts.
***One important note for final result table 10 is that even though SLOSH models predict
levee overtopping and severe flooding within New Orleans at Category 3 MOM levels, table
10 has been tabulated excluding the MSN facilities within Orleans and Jefferson parishes and the
HPS. This helps to demonstrate the initial tallies, should the HPS hold for some Category 3
storms. Additional facilities impacted by levee overtopping or failure or during a New Orleans
city-wide evacuation are then discussed in section 5.2.4 under “New Orleans Levee Breach and
Flood Inundation Scenarios.”
MSN facility cities are listed in place of names or other unique facility identifiers to
explore the results without directly identifying MSN sites by name.33 Estimated storm surge risks
to MSN critical medical evacuation, transportation and sheltering sites follow in table 11. Again,
the Category 3 analysis in Table 11 has been tabulated excluding the Orleans and Jefferson
33 For planning or emergency purposes, or for further analysis, the GIS shapefiles contain identifying markers and additional information.

114
Parish MSN sites within the HPS, to demonstrate the added numbers in a New Orleans
evacuation. Section 5.2.4 discusses a levee overtopping or city-wide breach scenario, and
additional medical evacuation, transportation and sheltering sites that would be affected.
Re-analysis results with LIDAR-Extrapolated SLOSH data (Binselam 2007) follow in
section 5.2.3, followed by a discussion of New Orleans levee and flood inundation scenarios in
section 5.2.4. The selected methods for clear communication and visualization of project MSN
data is briefly presented in section 5.2.5, followed by a discussion of GIS limitations.
5.2 Threshold Storm Events Impacting MSN Evacuation
Assuming (1) The New Orleans HPS (East and West Bank) remains intact and all pumps
are operational; (2) Excluding potential increased surge risk from Hurricane Rita (2005) that has
not been incorporated into the current SLOSH version; and (3) without considering sheltering
above the first floor of any multi-level structures or mitigation (these may be subtracted from the
totals if facilities are adequately designed and prepared to shelter in place), the result tables were
summarized as follows.
5.2.1 Summarizing MSN Point Data for Storm Surge Risk
Preliminary SLOSH (2007) analyses of the available data indicate that:
Category 1 hurricane surge impacts would impact an estimated 22 coastal Louisiana
MSN facilities seriously enough to warrant an evacuation of those facilities, including:
7 hospitals with 179 patients, and;
3 nursing homes with 305 patients, respectively;
484 total patients in the 26 coastal parishes would therefore be estimated to require
transport and evacuation to alternate facilities or shelters (Table 8).

115
Table 8. Estimated number of evacuating facilities and/or patients as a result of updated SLOSH storm surge modeling for Category 1 hurricanes34. Threshold storm event: TROPICAL STORM IN THE GULF OF MEXICO AT L-48
34 Assumes New Orleans HPS (East and West Bank) intact and all pumps operational; does not account for increased surge risk from Hurricane Rita (2005); does not consider sheltering above the first floor of the facility in multi-level structures or further mitigation.
TOTAL EVAC FACILTIES - STORM SURGE RISK 22 TOTAL EVAC PATIENTS* - STORM SURGE RISK 484 *This number is likely an underestimate since census counts are not available for all MSN facilities
CITY HOSPITALS HOSP_PATIENTS NURS HOMES NH_PATIENTS HOSPICE ADC AHDC ADULTRES EINF ICF/MR/DD RESPITE TBIJ BERWICK 1 BOUTTE 1 1 CAMERON 1 10 CUT-OFF 1 35 DELCAMBRE 1 ERATH 1 FRANKLIN 1 8 1 123 1 GARYVILLE 1 LAPLACE 1 51 1 LULING 1 35 MORGAN CITY 1 40 1 70 1 PATTERSON 1 RACELAND 1 0 RIVERBEND 1 112 SLIDELL 1 1
TOTALS 7 179 3 305 0 4 1 1 0 6 0 0

116
Table 9. Estimated number of evacuating facilities and/or patients as a result of updated SLOSH storm surge modeling for Category 2 hurricanes35. Threshold storm event: TROPICAL STORM IN THE GULF OF MEXICO AT L-48
CITY HOSPITALS HOSP_PATIENTS NURS HOMES NH_PATIENTS HOSPICE ADC AHDC ADULTRES EINF ICF/MR/DD RESPITE TBIJ ABBEVILLE 2 52 2 154 2 1 BELLE CHASE 1 112 3 BERWICK 1 BOUTTE 1 1 CAMERON 1 10 CHACKBAY 1 CUT-OFF 1 25 1 106 1 1 DELCAMBRE 1 DESTREHAN 1 132 1 ERATH 1 105 1 FRANKLIN 1 8 1 123 1 GALLIANO 1 GARYVILLE 1 GONZALES 2 60 1 174 1 1 3 GRAY 1 GRETNA 1 22 1 65 6 1 5 GUEYDAN 1 66 HARVEY 2 185 6 HOUMA 3 261 5 381 3 4 5 1 JEANERETTE 1 99 KAPLAN 1 109 LAKE CHARLES 1 LAPLACE 2 51 1 99 1 2 LOCKPORT 1 LOCKPORT 1 LULING 1 33 2 91 LUTCHER 2 11 1 92 1 MANDEVILLE 1 MARRERO 2 288 3 285 1
35 Assumes New Orleans HPS (East and West Bank) intact and all pumps operational; does not account for increased surge risk from Hurricane Rita (2005); does not consider sheltering above the first floor of the facility in multi-level structures or further mitigation.
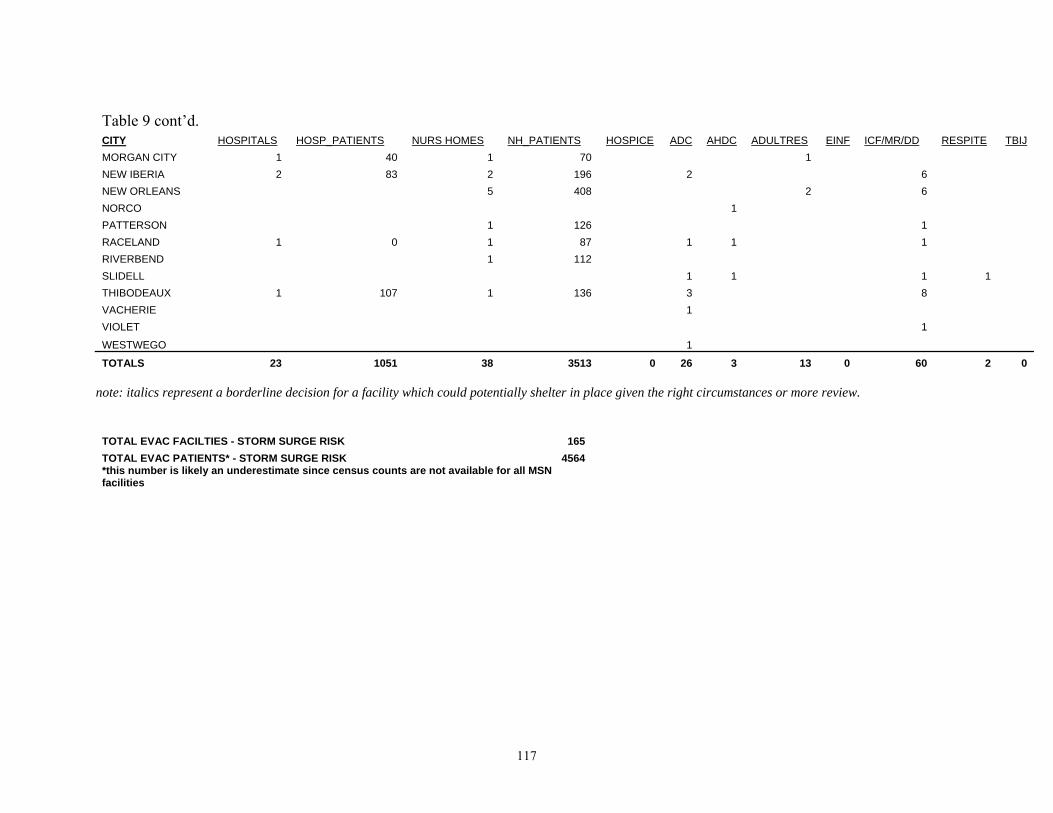
117
Table 9 cont’d. CITY HOSPITALS HOSP_PATIENTS NURS HOMES NH_PATIENTS HOSPICE ADC AHDC ADULTRES EINF ICF/MR/DD RESPITE TBIJ MORGAN CITY 1 40 1 70 1 NEW IBERIA 2 83 2 196 2 6 NEW ORLEANS 5 408 2 6 NORCO 1 PATTERSON 1 126 1 RACELAND 1 0 1 87 1 1 1 RIVERBEND 1 112 SLIDELL 1 1 1 1 THIBODEAUX 1 107 1 136 3 8 VACHERIE 1 VIOLET 1
WESTWEGO 1
TOTALS 23 1051 38 3513 0 26 3 13 0 60 2 0 note: italics represent a borderline decision for a facility which could potentially shelter in place given the right circumstances or more review.
TOTAL EVAC FACILTIES - STORM SURGE RISK 165 TOTAL EVAC PATIENTS* - STORM SURGE RISK 4564 *this number is likely an underestimate since census counts are not available for all MSN facilities

118
Table 10. Estimated number of evacuating facilities and/or patients as a result of updated SLOSH storm surge modeling, Category 3 hurricanes ***see also IMPORTANT NOTE.36 Threshold storm event: TROPICAL STORM IN THE GULF OF MEXICO AT L-48
CITY HOSPITALS HOSP_PATIENTS NURS HOMES NH_PATIENTS HOSPICE ADC AHDC ADULTRES EINF ICF/MR/DD RESPITE TBIJ ABBEVILLE 2 52 2 154 2 1 ARABI 1 BELLE CHASE 1 112 3 BERWICK 1 BOUTTE 1 1 CAMERON 1 10 CHACKBAY 1 CHALMETTE 1 CUT-OFF 1 25 1 106 1 1 DELCAMBRE 1 DESTREHAN 1 132 1 ERATH 1 105 1 FRANKLIN 1 8 1 123 1 GALLIANO 1 GARYVILLE 1 GONZALES 2 60 1 174 1 1 3 GRAY 1 GRETNA 1 22 1 65 6 1 5 GUEYDAN 1 66 HARVEY 2 185 6 HOUMA 3 261 5 381 3 4 5 1 JEANERETTE 1 99 KAPLAN 1 19 2 217 KENNER 1 109 2 256 2 20 LACOMBE 1 87 LAKE CHARLES 1 LAPLACE 2 51 1 99 1 1 2
36 Assumes New Orleans HPS (East and West Bank) intact and all pumps operational; does not account for increased surge risk from Hurricane Rita (2005); does not consider sheltering above the first floor of the facility in multi-level structures or further mitigation. NOTE: DOES NOT INCLUDE NEW ORLEANS MSN EVACUATION NUMBERS; TALLYS PATIENTS AS IF THE NEW ORLEANS HPS HOLDS FOR A CAT 3 HURRICANE
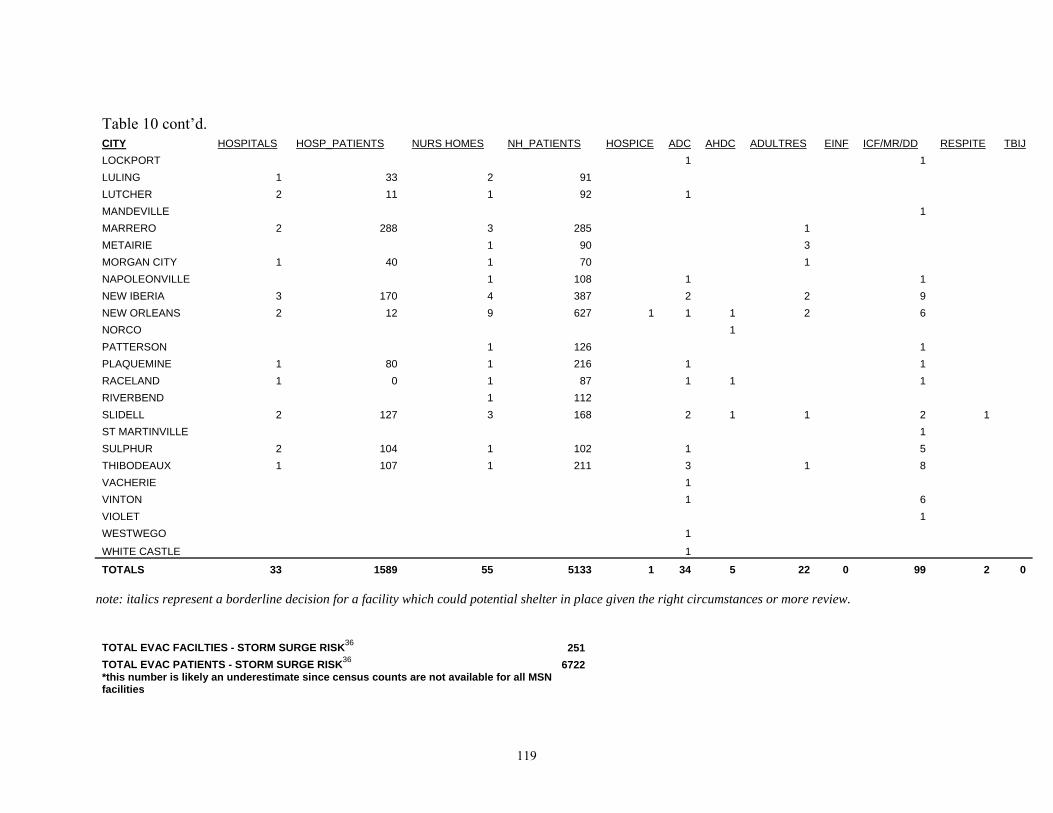
119
Table 10 cont’d. CITY HOSPITALS HOSP_PATIENTS NURS HOMES NH_PATIENTS HOSPICE ADC AHDC ADULTRES EINF ICF/MR/DD RESPITE TBIJ LOCKPORT 1 1 LULING 1 33 2 91 LUTCHER 2 11 1 92 1 MANDEVILLE 1 MARRERO 2 288 3 285 1 METAIRIE 1 90 3 MORGAN CITY 1 40 1 70 1 NAPOLEONVILLE 1 108 1 1 NEW IBERIA 3 170 4 387 2 2 9 NEW ORLEANS 2 12 9 627 1 1 1 2 6 NORCO 1 PATTERSON 1 126 1 PLAQUEMINE 1 80 1 216 1 1 RACELAND 1 0 1 87 1 1 1 RIVERBEND 1 112 SLIDELL 2 127 3 168 2 1 1 2 1 ST MARTINVILLE 1 SULPHUR 2 104 1 102 1 5 THIBODEAUX 1 107 1 211 3 1 8 VACHERIE 1 VINTON 1 6 VIOLET 1 WESTWEGO 1
WHITE CASTLE 1
TOTALS 33 1589 55 5133 1 34 5 22 0 99 2 0 note: italics represent a borderline decision for a facility which could potential shelter in place given the right circumstances or more review.
TOTAL EVAC FACILTIES - STORM SURGE RISK36 251 TOTAL EVAC PATIENTS - STORM SURGE RISK36 6722 *this number is likely an underestimate since census counts are not available for all MSN facilities

120
Table 11. Critical Medical Sites Surge Risk from Category 1, 2 and 3 hurricanes based on 2007 SLOSH, ***see also IMPORTANT NOTE.37 1=flood MSN TES CAT1 (Threshold event: T. Storm at L-48) MSN TES CAT2 (Threshold event: T. Storm at L-48) MSN TES CAT3 (Threshold event:T. Storm at L-48)
0=dry T-MOSAs MSNS MMPs CPPP CTNS T-MOSAs MSNS MMPs CPPP CTNS T-MOSAs MSNS MMPs CPPP CTNS Abbeville 0 1 1 Alexandria_CT 0 0 0 Alexandria_EAP 0 0 0 Alexandria_LSU 0 0 0 Baton Rouge_FH 0 0 0 Baton Rouge_PMAC 0 0 0 Belle Chase_AUD 0 0 1 Belle Chase_NAS 0 0 1 Bossier City 0 0 0 Chalmette 0 1 1 Franklin 1 1 1 Grand Lake 1 1 1 Hackberry 1 1 1 Hammond 0 0 0 Houma 0 1 1 Jefferson 0 0 1 Kenner 0 0 1 Lafayette 0 0 0 0 0 0 Lake Charles 0 0 0 0 0 0 0 0 1 LaRose 0 0 1 Maurice 0 0 0 Monroe_SF 0 0 0 Monroe_UL 0 0 0 Morgan City 0 0 0 Napoleonville 0 0 1 New Iberia 0 0 0 0 0 0 New Orleans_EMCC 0 0 0
37 Assumes New Orleans HPS (East and West Bank) intact and all pumps operational; does not account for increased surge risk from Hurricane Rita (2005); does not consider sheltering above the first floor of the facility in multi-level structures or further mitigation. MSN TES = medical special needs critical transportation evacuation and sheltering sites. NOTE: CAT 3 ANALYSIS DOES NOT INCLUDE NEW ORLEANS MSN EVACUATION NUMBERS; TALLYS PATIENTS AS IF THE NEW ORLEANS HPS COULD WITHSTAND A CAT 3 HURRICANE
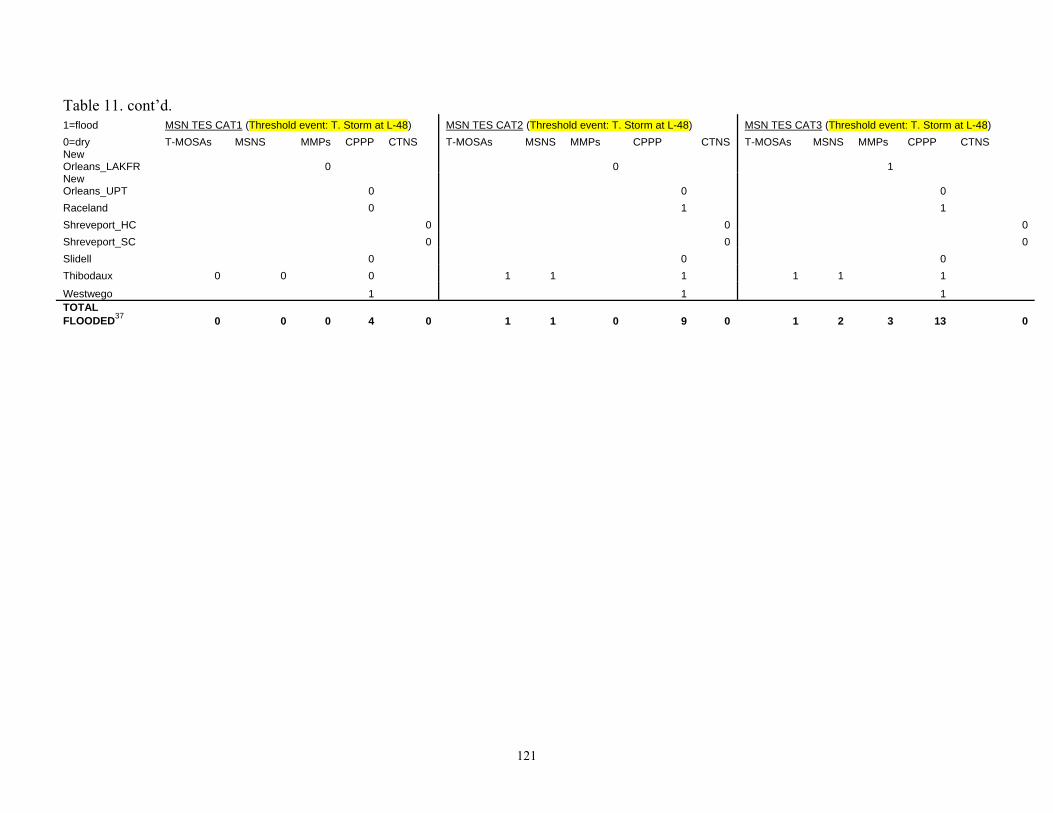
121
Table 11. cont’d. 1=flood MSN TES CAT1 (Threshold event: T. Storm at L-48) MSN TES CAT2 (Threshold event: T. Storm at L-48) MSN TES CAT3 (Threshold event: T. Storm at L-48) 0=dry T-MOSAs MSNS MMPs CPPP CTNS T-MOSAs MSNS MMPs CPPP CTNS T-MOSAs MSNS MMPs CPPP CTNS New Orleans_LAKFR 0 0 1 New Orleans_UPT 0 0 0 Raceland 0 1 1 Shreveport_HC 0 0 0 Shreveport_SC 0 0 0 Slidell 0 0 0 Thibodaux 0 0 0 1 1 1 1 1 1
Westwego 1 1 1 TOTAL FLOODED37 0 0 0 4 0 1 1 0 9 0 1 2 3 13 0

122
Category 2 hurricane surge impacts would impact an estimated 165 coastal Louisiana
MSN facilities seriously enough to warrant an evacuation of those facilities, including:
23 hospitals with 1,051 patients, and;
38 nursing homes with 3,513 patients, respectively;
4,564 total patients in the 26 coastal parishes would be estimated to require transport and
evacuation to alternate facilities or shelters (Table 9).
Category 3 hurricane surge impacts, not including the MSN facilities within the New
Orleans HPS, would impact an estimated 251 coastal Louisiana MSN facilities seriously enough
to warrant an evacuation of those facilities, including:
33 hospitals with 1,589 patients, and;
55 nursing homes with 5,133 patients, respectively;
6,722 total patients in the 26 coastal parishes would be estimated to require transport and
evacuation to alternate facilities or shelters (Table 10).
It should be noted that patient counts will be more seriously underestimated with each
subsequent event, since census numbers were not available for all MSN facilities. Additional
rainfall risks, not calculated in the current study, should also be considered. Additional facilities
at risk due to wind, levee breach, and additional considerations are presented in sections 5.2.2 –
5.2.4).
Regardless of the initial storm surge risks and tallies as presented in the result tables, the
current study has determined the threshold storm event for all MSN facilities to be a
tropical storm approaching the Louisiana coast at L-48. This is based on factors including
the potential for rapid hurricane intensification (section 3.2.3) and shift in track; additional wind
impacts to the coast (section 4.4); and the time constraints on MSN evacuation decisions.

123
5.2.2 Storm Surge Events Affecting Critical Medical Evacuation, Transportation and Sheltering Sites
According to MSN evacuation plans, by L-53 (or 53 hours to hurricane landfall) National
Guard and other pre-contracted assets will begin assembling at airfields, with other medical
teams ready to receive patients at designated Medical Marshalling Points (MMPs). By L-51,
hospital decision makers are supposed to communicate their decisions to either: shelter in place,
partially evacuate, or completely evacuate. From preliminary plans, the first load of MSN
patients are set to depart from airfields at L-48 (LA DHH ex 9). Medical response will need to
be very coordinated and stay within schedule to avoid hurricane risks to patients from early surge
and wind effects. Table 11 summarizes surge risk evaluation of critical medical and related sites
for Cat 1-3 storms. As discussed, the Category 3 analysis in Table 11 has been tabulated
excluding the Orleans and Jefferson Parish MSN sites within the HPS, to demonstrate the added
numbers in a New Orleans evacuation.
Observations from the final results include:
▫ Coastal Parish Pick-up Points (CPPPs) should be evacuated promptly. Four, nine and
thirteen CPPPs would need to be fully evacuated at Cat 1, 2 and 3 levels, respectively,
to avoid storm surge risks.
▫ At Category 3 hurricane levels, 3 MMPs are at risk of surge flooding. These sites
would need to be evacuated before storm landfall, and may not be useable under
some storm conditions.
▫ 2 Medical Special Needs Shelters (MSNS) are in surge risk areas, one at Cat 2 levels
and one at Cat 3. These shelter sites require further investigation for storm safety.
▫ 1 T-MOSA may experience surge flooding by Cat 2 levels. This site will not be
useable for some storms.
124
▫ CTNS shelters are located in northern Louisiana and indicated no surge risks.
As discussed in section 4.4, considering the balance of MSN facilities in twenty-six
coastal parishes with some portion south of the interstates, all three Categories of HFW (1-3)
have the potential to exceed over half of MSN structures sustaining at least moderate
damage. This will most directly impact the facilities in the hurricane path; but the hurricane
path cannot be predicted at L-48 to MSN decision makers. So, the remaining facilities south of
the interstate should therefore be considered for additional evacuation based on wind damage
risks, with increasing urgency for Category 2 and 3 hurricanes, unless mitigation or previous
storm history have demonstrated the structure can withstand HFWs. The possibility of tornadoes
should also be considered.
Total facilities impacted for each Category storm of wind can include up to the full
balance of facilities in the 26 coastal parishes with some portion south of the interstate.
Specifically, the balance of:
135 additional coastal Louisiana hospitals with 2007 census estimates of 6,694;
153 additional coastal Louisiana nursing homes with 2007 census estimates of 13,831;
and an estimated 523 MSN facilities, including the coastal cities of New Orleans, East
Baton Rouge, Lafayette and Lake Charles.
Although MSN facilities located in high storm surge risk areas along the coast would
generally be a higher evacuation priority, the 2005 data suggests that even Category 1 winds can
cause moderate damage to MSN facilities, potentially injuring patients who are sheltering in
place. The results of this study thus indicate that MSN facilities sheltering in place anywhere in
coastal Louisiana may face storm surge and/or wind risks. Since hurricane track and intensity
cannot be certain at 48 hours to landfall, the safety of sheltering in place will remain uncertain.
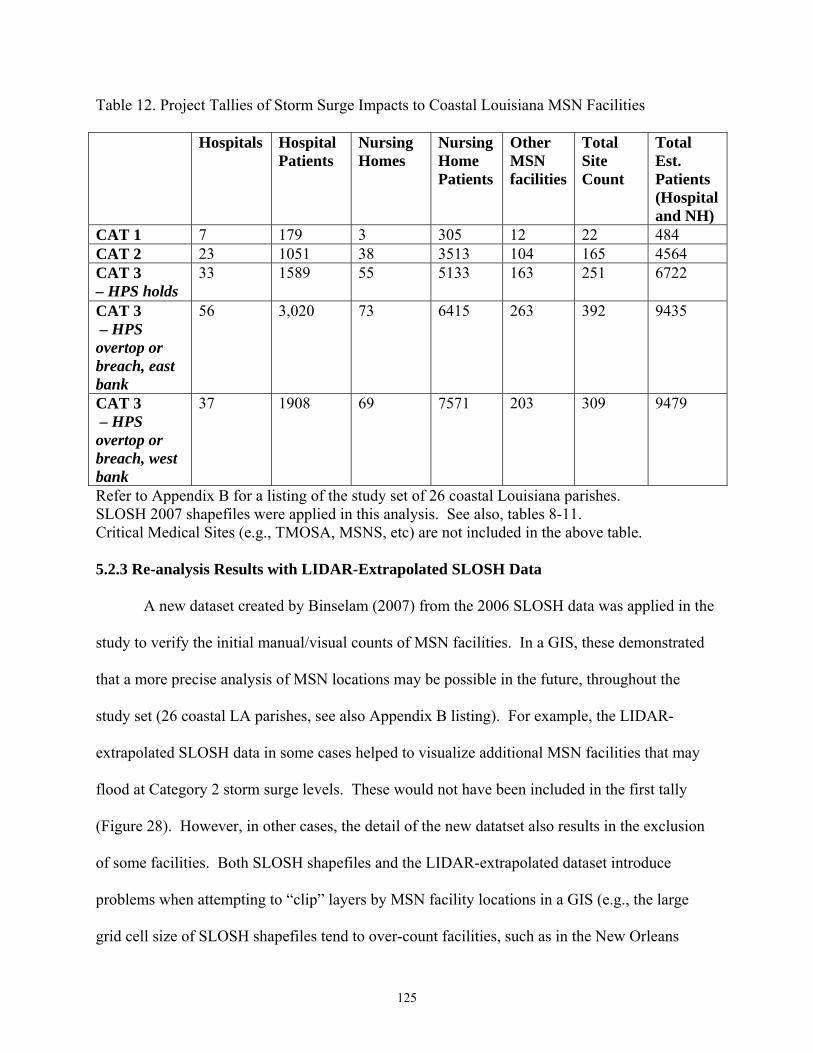
125
Table 12. Project Tallies of Storm Surge Impacts to Coastal Louisiana MSN Facilities
Hospitals Hospital Patients
Nursing Homes
Nursing Home Patients
Other MSN facilities
Total Site Count
Total Est. Patients (Hospital and NH)
CAT 1 7 179 3 305 12 22 484 CAT 2 23 1051 38 3513 104 165 4564 CAT 3 – HPS holds
33 1589 55 5133 163 251 6722
CAT 3 – HPS overtop or breach, east bank
56 3,020 73 6415 263 392 9435
CAT 3 – HPS overtop or breach, west bank
37 1908 69 7571 203 309 9479
Refer to Appendix B for a listing of the study set of 26 coastal Louisiana parishes. SLOSH 2007 shapefiles were applied in this analysis. See also, tables 8-11. Critical Medical Sites (e.g., TMOSA, MSNS, etc) are not included in the above table. 5.2.3 Re-analysis Results with LIDAR-Extrapolated SLOSH Data
A new dataset created by Binselam (2007) from the 2006 SLOSH data was applied in the
study to verify the initial manual/visual counts of MSN facilities. In a GIS, these demonstrated
that a more precise analysis of MSN locations may be possible in the future, throughout the
study set (26 coastal LA parishes, see also Appendix B listing). For example, the LIDAR-
extrapolated SLOSH data in some cases helped to visualize additional MSN facilities that may
flood at Category 2 storm surge levels. These would not have been included in the first tally
(Figure 28). However, in other cases, the detail of the new datatset also results in the exclusion
of some facilities. Both SLOSH shapefiles and the LIDAR-extrapolated dataset introduce
problems when attempting to “clip” layers by MSN facility locations in a GIS (e.g., the large
grid cell size of SLOSH shapefiles tend to over-count facilities, such as in the New Orleans

126
“bowl;” while clips of the high-resolution LIDAR-extrapolated SLOSH dataset so far have a
tendency to undercount, even though previously unidentified facilities may be added in).
Figure 28. New LIDAR-extrapolated SLOSH data (shown in light blue above, Binselam 2007) help to visualize the surge flooding risk to additional MSN facilities (yellow points). SLOSH 2007 grid cells are color-coded above.
Further work is needed on both datasets to refine their use, particularly to tally with GIS
clip features or Model Builder, rather than to have to count manually/visually. While the second
method of analysis (with LIDAR-extrapolated SLOSH data) was demonstrated, final study
results are not significantly altered, in that the threshold event for all MSN facility evacuations
remains a tropical storm in the Gulf. Initial tallies still demonstrate conservative counts of
facilities at risk for storm surge at Cat 1-3 hurricane levels along the coast. It is unclear to what
degree additional analysis with the final version of the datasets (Binselam 2007) will affect
future counts; although the concept can be applied in further detailed study.
Storm surge re-analysis alone is not likely to change future outcomes. Combined surge
and wind effects; the uncertainties of hurricane track and intensification; and the timeline for
decision-making, taken together, place all coastal Louisiana MSN facilities at risk.

127
Determination of the extent of risk zones, and differentiating or prioritizing individual
facility risk falls outside of the scope of the current project, but remains an important future
objective. It is hoped the current methods and findings will help to support future studies.
5.2.4 New Orleans Levee Breach and Flood Inundation Scenarios
As discussed, although SLOSH 2007 MOMs and other storm surge models currently
indicate levee overtopping from a Category 3 hurricane, Tables 10 and 11 first tabulate results
assuming that the Orleans and Jefferson Parish HPS levees have been fortified to Category 3
levels and will hold. These results allow for the comparison of the estimated MSN evacuation
numbers without evacuating the area within the HPS.
As discussed in section 3.3.1.1, for Cat 1 and 2 hurricanes, SLOSH assumes all barriers
hold, and all levees are completed and built at specified heights. Although repairs and
reinforcements are ongoing, unfortunately, as presented in section 4.2.4, levee problems have
been identified at over seventeen locations along the current HPS as of hurricane season 2007.
Prior to Hurricanes Katrina and Rita in 2005, ADCIRC storm surge simulations had also
demonstrated that a Category 3 hurricane striking west of New Orleans could fully inundate the
New Orleans East and West Bank (Figure 29, Hurricane Pam catastrophic hurricane scenario).
Post-Katrina ADCIRC hindcasts demonstrate levee overtopping in New Orleans for a similar
storm even if the levees had held, although depths are limited to about 4 ft (van Heerden 2007).
ADCIRC experimental storm surge runs based on NHC Advisories 18, 22 and 25 for Hurricane
Katrina all predicted overtopping of the New Orleans HPS from the west and east;
(http://hurricane.lsu.edu/floodprediction/) particularly from the Mississippi River Gulf Outlet
(MRGO) “funnel;” and scientists still consider the MRGO the number one threat to New Orleans
from hurricane storm surge (ibid, Mashriqui 2006).
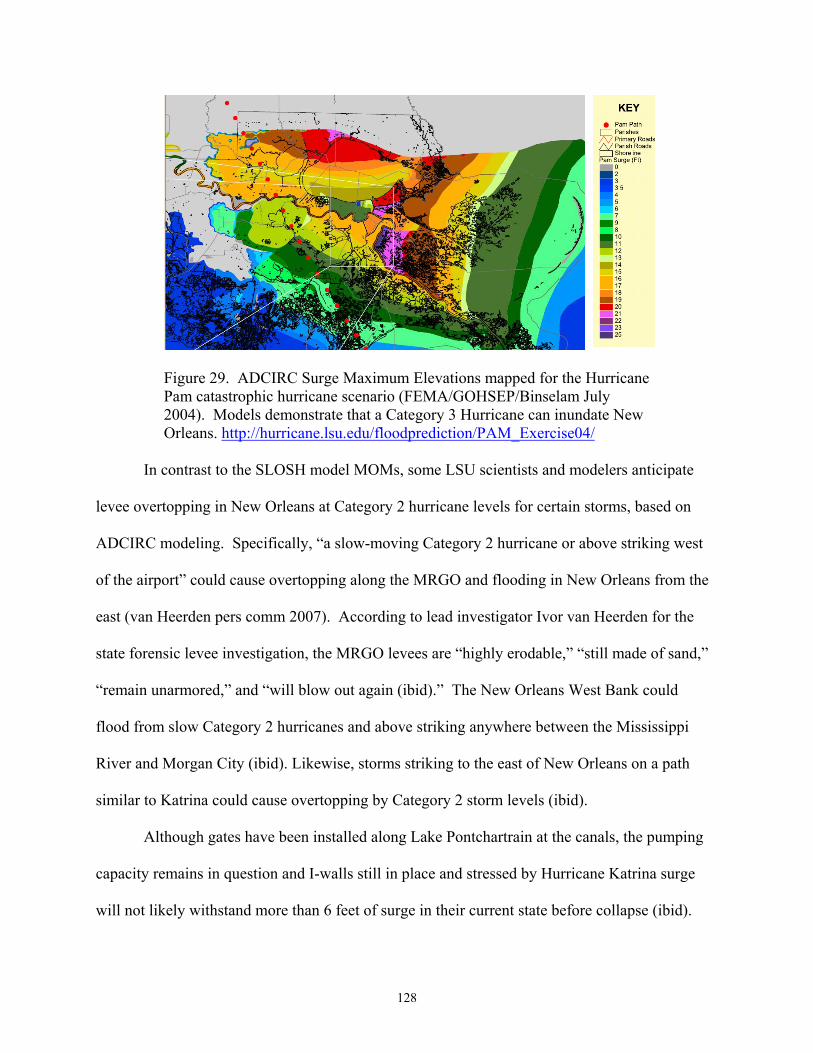
128
Figure 29. ADCIRC Surge Maximum Elevations mapped for the Hurricane Pam catastrophic hurricane scenario (FEMA/GOHSEP/Binselam July 2004). Models demonstrate that a Category 3 Hurricane can inundate New Orleans. http://hurricane.lsu.edu/floodprediction/PAM_Exercise04/
In contrast to the SLOSH model MOMs, some LSU scientists and modelers anticipate
levee overtopping in New Orleans at Category 2 hurricane levels for certain storms, based on
ADCIRC modeling. Specifically, “a slow-moving Category 2 hurricane or above striking west
of the airport” could cause overtopping along the MRGO and flooding in New Orleans from the
east (van Heerden pers comm 2007). According to lead investigator Ivor van Heerden for the
state forensic levee investigation, the MRGO levees are “highly erodable,” “still made of sand,”
“remain unarmored,” and “will blow out again (ibid).” The New Orleans West Bank could
flood from slow Category 2 hurricanes and above striking anywhere between the Mississippi
River and Morgan City (ibid). Likewise, storms striking to the east of New Orleans on a path
similar to Katrina could cause overtopping by Category 2 storm levels (ibid).
Although gates have been installed along Lake Pontchartrain at the canals, the pumping
capacity remains in question and I-walls still in place and stressed by Hurricane Katrina surge
will not likely withstand more than 6 feet of surge in their current state before collapse (ibid).

129
In summary, as demonstrated by SLOSH MOMs, the Hurricane Pam scenario (2004),
and based on other research data, strong Category 3 hurricanes and potentially lesser storms
could still inundate most of New Orleans, east and west banks, at present levee heights.
Specific counts for MSN facilities which could be additionally impacted by a New
Orleans levee breach or flood inundation scenarios, based on the GIS mapping tool, include
an estimated twenty-three more hospitals in New Orleans, although nine may be closed. The
remaining twelve house as many as 1,431 additional patients according to the 2007 census data.
Two hospitals have over 100 patients each, one with over 200 and two others have over 300
patients each. An estimated eighteen more nursing homes with 1,282 patients could also be
affected in New Orleans, although four are closed.
Expected flood depths at the hospitals and nursing homes can be modeled for various
scenarios with more detail from the Katrina flood mask data (Cunningham and Braud 2006).
Levee problems have also been viewed in a GIS for proximity to their location. Over one
hundred other MSN facilities are located within New Orleans (east bank) which could be
additionally impacted by levee breach or flood inundation, as well as six critical MSN locations:
two MMP-As (airfields), three CPPPs and the MMP-T (Amtrak Union Passenger Terminal).
MSN individuals in residences are not included in this count, but elderly counts may be
estimated with the census data; e.g., as of 2006 there were an estimated 21,032 elderly (over 65)
in Orleans Parish (US Census 2006b). SLOSH 2007 and other storm surge models support that
potentially all of these additional MSN patients would be exposed to serious flooding from levee
overtopping from a Category 3 Hurricane.
Flooding of the New Orleans west bank could impact four additional hospitals (although
one may be closed) with an estimated 319 patients; including one hospital that has over 200

130
patients. An estimated fourteen additional nursing homes (although 2 are closed) could be
impacted by levee breach, surge or flood inundation, with approximately 1,156 patients. Of
these, nine nursing homes have approximately one hundred patients each. Over forty other MSN
locations could be impacted, and three critical MSN locations: two CPPPs and an MMP-A.
Jefferson Parish also has three times the estimated elderly population as New Orleans, at 66,265
individuals (US Census Bureau 2006b). Table 12 summarizes all of these scenarios and counts.
5.2.5 Clear Communication and Visualization of the Data
It has been discussed that MSN decision-makers are not always emergency managers or
state officials, but can range from the nursing home administrator, to the elderly or disabled
MSN patient sheltering in their residence. What has become apparent is that while these MSN
facility decision-makers often look to emergency management for guidance, they essentially
make their own determinations of risk, and whether they will evacuate or shelter in place.
Given that MSN facility mangers and residents remain very independent in their desire to
assess and determine their own risks, it is important to: (1) acknowledge that they are indeed
local decision-makers, whether or not this works within the framework of local emergency plans
that are in place, (2) ensure that they have access to crucial information and decision tools
capable of conveying hurricane risk, and (3) ensure that the information provided to them is clear
- particularly emergency instructions or contact numbers – as well as expectations or
requirements. It is also crucial that indications of the seriousness of the threat and instructions be
clearly conveyed (Eisenman et al 2007).
Publisher map files were determined to be the best initial method of sharing critical
hurricane risk data with MSN communities (Figure 30). Most relevant would be that LIDAR-
extrapolated SLOSH data, as it becomes more refined, could be shared via Arc Reader, a freely

131
available and easily accessible GIS reader. However, further study is still needed, as well as
more interaction with MSN communities, to determine additional methods of risk
communication and visualization.
Figure 30. Critical MSN sites can be viewed with Category 2 storm surge risk layers (Binselam 2007) in ArcReader as an ArcPublisher (.pmf) map file. Hurricane risk layers may be shared in this type of free GIS format.
While not currently suited to the task, online methods such as GIS data and imagery
servers (see also section 3.3.1.5) are also being quickly developed to provide detailed data and
risk analysis tools to local, state and Federal emergency planners and officials.
5.3 GIS Data and Analysis: Limitations
The current study was limited to manual and visual interpretation of flood and wind risks
in a GIS environment, with counts of affected facilities and patients calculated in result tables.
Counts were thus subject to human error, where facilities may have been missed in original
counts, counted twice, etc. Although a model was successfully built for this project to clip
SLOSH for MSN facilities and verify counts, the counts were far overestimated, since SLOSH
132
resolution 1 mi by 1 mi grid cells often ‘spill over’ from rivers or other water features (see also
section 3.3.1.1) and include many more MSN sites than are actually at risk. Thus, urban areas,
levees and canals had to be scrutinized for flood interpretation. As discussed in section 6.2.4,
models and scripts will be further explored as a future direction to eliminate tedious tallying and
provide immediate counts for MSN GIS applications, including applying the LIDAR-
extrapolated datasets when completed (Binselam 2007).
Additionally, as mentioned, multi-level structures such as hospitals were still included in
surge risk determinations as recommended to evacuate. Some hospitals and other multi-level
structures may be adequately equipped to shelter in place on upper floors, based on hurricane
assessments. The location of the generator would also be an important consideration for future
work, but could not be included in the scope of the current study.
Finally, mitigation measures are important. Mitigation projects have been explored and
implemented at many facilities, but these could not be considered in the current study. This does
however add support to the value of supplying facility-specific hurricane risk data to MSN
decision-makers on the local and individual level. This would allow them to evaluate their
facilities for potential mitigation measures, as well as to revisit their physical hurricane risks
against implemented measures, and update hurricane emergency plans.

133
CHAPTER 6 CONCLUSIONS 6.1 Hurricane Modeling in GIS: Threshold Events for MSN Facilities - Can Anyone
Shelter Safely in Coastal Louisiana for Hurricanes?
Coastal Louisiana MSN facilities and residences vary on some level regarding
individual risk from storm surge, wind and other hurricane threats. They also vary
widely by decision-strategies; both by decision criteria, and dominating factors that will
ultimately prompt evacuation or support sheltering in place.
However, what coastal Louisiana MSN facilities, residences and their patients
share in common, based on the research evidence and outcomes of this study, is that ALL
are exposed to serious flood and/or wind risks from hurricanes, and ALL will be exposed
to less risk if they successfully evacuate a risk area well ahead of an approaching storm.
The literature has supported that MSN patients everywhere are likely to share
common risks to their health, regardless of setting, when hurricanes threaten, as both
evacuation and sheltering in place carry risks. However, coastal Louisiana MSN sites
are set apart in that they face severe threats from hurricanes when they shelter in
place; they are perhaps among the most at-risk sites nationwide, given all compounding
factors reviewed in this manuscript. The devastating impacts of Hurricane Katrina in
Louisiana support the urgency of conveying such findings to MSN decision-makers well
before each hurricane season.
While Category 3 hurricanes appear at first glance to be a threshold event for MSN
facilities along the Louisiana coast as a whole (based solely on storm surge risk), this study has
determined that a tropical storm in the Gulf of Mexico at 48-hours to landfall is the actual
threshold storm event which should trigger MSN patient evacuation.

134
Most concerning is that at 48 hours to hurricane landfall, the location where storms will
make landfall across the Louisiana coast, and whether storms will undergo rapid intensification
is unclear. Yet MSN decision-makers will need to decide whether they will evacuate or shelter
in place by this time, or prior to this 48-hour window. The severity of storm surge risks; wind
risks; the time needed to successfully evacuate; and additional added risks specific to coastal
Louisiana as reviewed in this study together warrant the evacuation of MSN patients, regardless
of cost, accepting (albeit, with the goal of greatly reducing) evacuation risks, for most storms.
6.2 Future Directions
The following examples briefly highlight some additional future directions which could
help to further and improve upon this research.
6.2.1 Storm Surge Modeling in GIS Modeling specific hurricane tracks and intensities for planning will be increasingly
valuable as prediction technology, satellite technology and ocean monitoring evolve and
improve. For example, the ADCIRC model38 previously discussed is a very high resolution
storm surge prediction tool (Figure 31) with versions that were developed specifically for
southeast Louisiana flooding, http://www.hurricane.lsu.edu/floodprediction/.
As discussed, state and local emergency officials usually count down to hurricane
landfall or “L-hour” (e.g., LA DHH), or to “H-hour” - the onset of tropical storm force winds
(TSFW) on the coast (SEHTF 2007). The LSU experimental ADCIRC model has been run on
subsequent updated advisories released by the NHC to support operational response, just as with
SLOSH actual track model runs by NOAA, as hurricanes approach. It can also be run on
38 developed by Luettich, Westerink, Kolar and Dawson in partnership with numerous federal and academic partners (ADCIRC Development Group webpage, http://www.nd.edu/~adcirc/index.htm).

135
hypothetical tracks and intensities for planning, to support training exercises, and to explore and
identify threshold events that would overtop levees or flood certain areas.
Figure 31. High resolution ADCIRC hindcast of Hurricane Katrina (surge elevations in ft). LSU HPHC 2005.
Briefly, ADCIRC has proven to be a reliable surge estimation model in recent storm
events, such as Isidore, Lili, and Ivan, but most notably prior to Hurricane Katrina, as well as in
current studies (van Heerden et al 2006). However, the process to submit the model is complex
and time intensive, even with direct access to supercomputing resources.39 Improvements are
continuously being made to the model, which has recently quadrupled in nodes (increasing
resolution even more and enhancing other aspects of the model physics). However, refinements
introduce new complexities and time constraints to running the model operationally.
ADCIRC outputs, which provide latitude, longitude and predicted elevation values, can
now be imported into a GIS for analysis. Model outputs (at 340,000 nodes) were provided by
39 ADCIRC has been run at LSU on the “Supermike” supercomputer for past storms in collaboration with the LSU CCT.
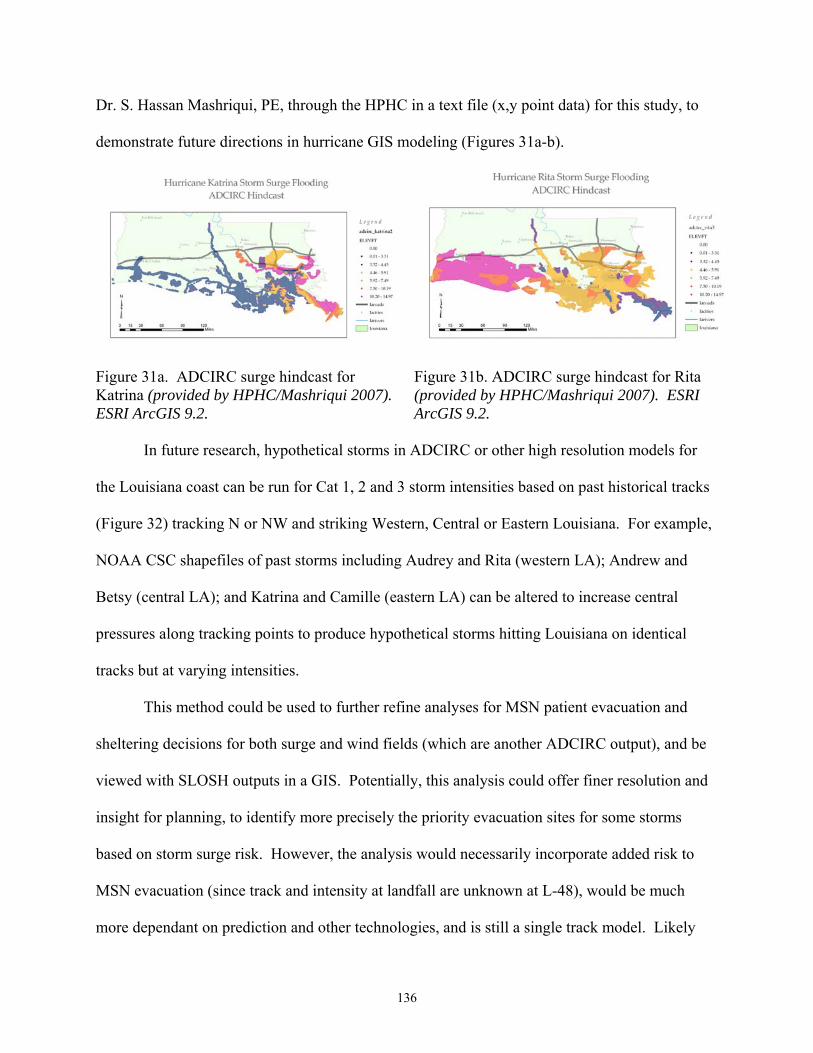
136
Dr. S. Hassan Mashriqui, PE, through the HPHC in a text file (x,y point data) for this study, to
demonstrate future directions in hurricane GIS modeling (Figures 31a-b).
Figure 31a. ADCIRC surge hindcast for Katrina (provided by HPHC/Mashriqui 2007). ESRI ArcGIS 9.2.
Figure 31b. ADCIRC surge hindcast for Rita (provided by HPHC/Mashriqui 2007). ESRI ArcGIS 9.2.
In future research, hypothetical storms in ADCIRC or other high resolution models for
the Louisiana coast can be run for Cat 1, 2 and 3 storm intensities based on past historical tracks
(Figure 32) tracking N or NW and striking Western, Central or Eastern Louisiana. For example,
NOAA CSC shapefiles of past storms including Audrey and Rita (western LA); Andrew and
Betsy (central LA); and Katrina and Camille (eastern LA) can be altered to increase central
pressures along tracking points to produce hypothetical storms hitting Louisiana on identical
tracks but at varying intensities.
This method could be used to further refine analyses for MSN patient evacuation and
sheltering decisions for both surge and wind fields (which are another ADCIRC output), and be
viewed with SLOSH outputs in a GIS. Potentially, this analysis could offer finer resolution and
insight for planning, to identify more precisely the priority evacuation sites for some storms
based on storm surge risk. However, the analysis would necessarily incorporate added risk to
MSN evacuation (since track and intensity at landfall are unknown at L-48), would be much
more dependant on prediction and other technologies, and is still a single track model. Likely

137
there would be few storm events before the analysis would begin to incorporate increasing levels
of risk.
Figure 32. Historical hurricane tracks which can be edited for central pressure, to modify storm strength and run as hypothetical storms in ADCIRC (NOAA CSC historical hurricane tracks in ERSI ArcGIS).
6.2.2 Hurricane Wind Modeling
Similar to future directions in ADCIRC, specifically defined tracks (as in Figure 32) with
input wind fields for Category 1, 2 and 3 hurricanes could be generated and run within the
HAZUS model (Figures 12, 25-26), to estimate wind and damage levels to structures in
Louisiana for reference or future study. Coastal Louisiana MSN facilities that may opt to shelter
in place perhaps outside of risk zones for storm surge could be more specifically evaluated with
this data for planning purposes. Such analysis could also be valuable for future planning of
storms where there is (1) high confidence of a landfall probability and (2) low potential for rapid
intensification or other risks (such as rainfall and tornadic activity). Likewise, such an analysis
could demonstrate a methodology for determining priority and risk zones if medical evacuation
resources become limited, or if unforeseen problems arise in evacuating patients.

138
As prediction technologies improve, and as difficult decisions are made regarding the
balance of risk and cost between MSN evacuation and sheltering, such analyses will become
more important. They could also hold value operationally.
In addition to applying FEMA HAZUS as a potential future direction in wind field
estimation, the NOAA NHC Hurricane Research Division (HRD) has started to release
experimental surface wind field products in shapefiles, beginning with Hurricane Ivan in 2004
(Figures 33a-c). The products are currently for research use only.
These can be edited for hurricane symbology and imported into a GIS to be viewed with
hurricane tracks, SLOSH models, MSN facilities, and other data layers. Similar to HAZUS, the
surface wind fields are generated as part of the H*Wind experimental product in near-real time,
combining surface weather observations from “ships, buoys, coastal platforms, surface aviation
reports, [and] reconnaissance aircraft data adjusted to the surface” (NOAA AOML 2007d).
Future directions may include a way to more accurately model hypothetical Cat 1 – 3
hurricane tracks and wind intensities with HRD surface wind analysis layers to potentially
demonstrate ‘windows of opportunity’ that would exist for MSN residents to shelter in place;
although as discussed, this would be hard to apply at L-48, unless under special considerations or
circumstances (e.g., a determined very low risk event). The same limitations would apply to
Figure 33a. Ivan (2004) Surface Wind field and track (NHC HRD) ESRI ArcGIS 9.2
Figure 33b. Katina (2005) Surface Wind field and track (NHC HRD)ESRI ArcGIS 9.2
Figure 33c. Rita (2005) Surface Wind field and track (NHC HRD) ESRI ArcGIS 9.2

139
using such a wind representation in a GIS for local planning; both in maintaining focus on surge
and hurricane risk factors even before wind; and accurately explaining and representing data.
6.2.3 Incorporating MSN Data into 3D Image Viewers
3-dimensional imagery interfaces are hoped to be explored in future directions as well.
Figure 34a. NASA World Wind ver. 1.4 imported shapefiles for Louisiana parishes, Tiger Roads (2004) and nursing homes over impressive New Orleans imagery.
Figure 34b. 3D LIDAR data overlay with imagery in ESRI ArcGlobe (Louisiana GIS Digital Map 2007, geo-referenced Ikonos Imagery/Braud 2005)
It is hoped that detailed MSN project data can soon be incorporated with imagery
mappers such as NASA World Wind version 1.4 (Figure 34a) or Virtual Louisiana, or 3D Image
viewers such as ESRI ArcGlobe (Figure 34b).
6.2.4 Models and Scripts for Data Tabulation and Reporting Future directions of this research additionally include building more elaborate models or
writing scripts that will quickly tabulate MSN facility or census counts. As discussed in results
section 5.3, both SLOSH shapefiles and LIDAR-extrapolated datasets (Binselam 2007) are
currently too imprecise to make accurate and quick counts clipped by MSN site. Another feature
of model builder and scripting includes the output of results into not only tables, but reports, as
well as creating new feature datasets for facilities impacted at each storm level.

140
6.2.5 Enterprise GIS for Medical Planning and Response
The future of GIS mapping of medical data for response is likely to develop out of a
greater framework of databases in Enterprise GIS. In one of the paramount examples, GIS
experts at the Louisiana State Department of Social Services (DSS) have been implementing
“TINA-GIS” since Hurricane Katrina struck in 2005 (McKeefry 2006, Lemoine pers comm
2006). TINA-GIS was developed as an anti-fraud system, using WebFOCUS - business
intelligence (BI) software from Information Builders - along with GIS technology. However, it
has since been developed to provide ‘Disaster Business Intelligence and GIS’ to numerous
Federal and state agencies, including interdepartmentally (ibid).
Through this award-winning system, Louisiana DSS can extract, transform and load or
‘ETL’ mainframe data, query and create graphs and reports, run spatial analysis, and “interpret
complex relationships that might otherwise be difficult to detect (ibid).” Similar systems could
provide invaluable information to state and local health officials and decision-makers and be
applied towards MSN planning. Data can be queried and mapped, gathering information from
databases across the state in seconds. Data can also be further analyzed, added to reports, or
mapped. A similar application would be pivotal in medical response and mapping.
There is an increasing level of GIS coordination and collaboration among Louisiana State
agencies. Examples include the Louisiana GIS Council and expanding GIS capabilities
centralized at the Louisiana GOHSEP. Critical response capabilities of GIS were tested during
Hurricane Katrina in everything from search and rescue emergency GIS mapping to GIS maps
for future recovery. However, medical GIS data can be used for many of the same emergencies,
including hurricanes/flood; technological disasters; pandemic flu planning; and bioterror
events/terrorism.

141
Each has critical datasets, and some that could apply to all. For example, hospital surge
capacity is a critical dataset which can be used in many levels of planning and response.
Data integration in an enterprise GIS system will allow for increased interaction and
access to critical data among agencies. Data management, querying, reporting and mapping
database information, creating and sharing data layers, epidemiologic study support, and patient
or evacuee tracking are just a few examples of the “multimedia functionality” (ESRI 1999).
6.3 Refining the Science to Reduce MSN Evacuation in Coastal Louisiana
As hurricane prediction technologies improve, including methods for tracking not only
the predicted landfall of a storm, but intensity, rainfall and other risks, there may be increased
opportunity for hurricane research and models to be implemented towards more precise MSN
planning for evacuation and sheltering. While the current study has concluded a tropical storm
in the Gulf of Mexico to be the trigger for coastal Louisiana MSN facility evacuation, many may
find this outcome excessively conservative or unrealistic. However, until the science further
improves, refinements to planning that would allow facilities to shelter safely in place for
hurricanes are difficult to support without accepting serious risk.
van Heerden and Bryan (2006a), in discussing the National Hurricane Center
hurricane “projection cone” indicate “…the best our science can ever achieve will be an
error of 30 miles at one day (p. 48).” This will likely always result then in at least a sixty
mile error possibility at 48 hours to landfall, the difference between a hurricane strike in
Lafayette versus Baton Rouge versus New Orleans, Louisiana.
Meanwhile, Hurricane Audrey in 1957, which intensified from a Category 1 to a
Category 4 Hurricane before making landfall on the Louisiana coast, may be an exception
historically, representing only a small percent of storms that intensified this dramatically

142
before landfall. Yet, hurricane intensification is not only based on warm Gulf waters or
the presence of the Loop current, but also on climate conditions such as upper level
winds. Climate will vary every season. Therefore, any hurricane, given the right
conditions, could intensify as Audrey, and cause devastating impacts on MSN facilities.
Nonetheless, in the future, with combined improvements in coastal restoration, the
implementation of mitigation measures, and advancements in technology, hurricane research,
modeling and methods, more MSN individuals in coastal Louisiana may be able to shelter safely
in place. It is hoped the current project conclusions will prompt further investigation and action,
exploring future possibilities of MSN sheltering in place.
As an example, with increasingly better science, risk and evacuation priorities might be
assigned to longitudinal zones based on increasing proximity to, and surge and wind impacts
from, actual storm landfall; while assigning less risk and decreasing the evacuation priority of
longitudinal zones further from actual landfall. In the interim, assessment of risk by applying
hurricane modeling and GIS methods may help to prioritize MSN and medical evacuation for
individuals and local decision-makers. Planning is also supported by overall risk zones or
regions (either state health regions, or western, central and eastern coastal regions, etc) which
can help to effectively manage increasingly complex public health threats.
In another example, according to Lapolla (2003), evacuation and shelter strategies are not
so limited, but may include different phases or levels such as “sheltering in place without moving
from a facility; sheltering in place vertically (moving up); evacuating just outside of the facility;
evacuating to a nearby, like facility; evacuating to a distant facility; or evacuating to a shelter
facility.” These may become another area for study in reducing MSN evacuation.

143
Other options open to MSN individuals and facilities include hurricane mitigation
strategies, further assessment of their facilities, designing and building for hurricanes, and
holding training for MSN decision-makers.
Due to transportation agency and university research collaborations, hurricane
evacuations are becoming increasingly efficient and successful. Estimates are that the Hurricane
Katrina evacuation time of New Orleans was “cut nearly in half, exceeding even the most
optimistic prior projections by at least 40%; that is, an anticipated 72 hour evacuation was able to
be executed in 28-36 hours (Wolshon/HPHC Report, January 2006).”
Meanwhile, across the board, MSN decision-makers note that early evacuation works.
For example, home health patients and agencies that left 72 hours before projected hurricane
landfall for Katrina “avoided long waits,” “experienced less stress,” and “easily found… shelter
space for their patients (Kirkpatrick and Bryan, 2007, p. 309).” Nursing homes that left early
reported having plenty of water and supplies, and even being able to open the windows on the
school buses they were using on account of the pleasant weather (Nursing Home Administrators
pers comm 2007). Patients experienced minimal stress, even approaching the trip as a welcome
break or ‘field trip (ibid).’ Evacuating every time, and evacuating early, one coastal Louisiana
nursing home demonstrates a culture of preparedness and practice which makes it possible to
envision MSN evacuation without traffic, without serious accidents or injuries, and the
safeguarding of patients against daunting hurricane risks.

144
REFERENCES
American Society of Civil Engineers (ASCE). 2005. “Minimum Design Loads for Buildings and Other Structures.” Reston, VA.
Barclay, Laurie, MD. 2005. “Epidemiologic Consequences of Hurricane Katrina: A
Newsmaker Interview with Raoult Ratard, MD, Medscape Medical News online (Http://www.medscape.com/viewarticle/513376, (Accessed online January 28, 2007)
Barras, J.A. US Geological Survey (USGS). 2006. “Land Area Changes in Coastal Louisiana after the 2005 Hurricanes: A Series of Three Maps” and “Louisiana Coastal Facts” Louisiana Department of Natural Resources, http://dnr.louisiana.gov/crm/coastalfacts.asp, (Accessed online October 17, 2007)
Bascetta, Cynthia. Government Accountability Office (GAO). 2006. “Disaster
Preparedness: Preliminary Observations of the Evacuation of Vulnerable Populations due to Hurricanes and Other Disasters” Testimony Before the Special Committee on Aging, U.S. Senate. May 18, 2006.
Beggs, J.J., Hurlbert, J.S., Robicheaux, S. and Haines, V. A. 2004. “Who Would
Leave?” A presentation to the CDC, meeting hosted by the LSU Hurricane Public Health Center. Bell, W.C. and Dallas, C. E. 2007. “Vulnerability of populations and the urban health
care systems to nuclear weapon attack – examples from Four American cities. International Journal of Health Geographics. 6(5): doi:10.1186/1476-072X-6-5.
Bennett, P.L., FBCI. 2006. “Evacuation Planning: Four mistakes Managers Make” Disaster-Resource.com. http://www.disaster-resource.com/articles/06fac_p24.shtml (Accessed online January 31, 2007)
Binselam, S.A. van Heerden, I., Streva, K., Lorenzo, J.M. Cazes, C. and C. Westbrook.
2003. “Natural Geologic Hazard Mapping in Louisiana Utilizing LIDAR.” 28th Annual Workshop on Hazards Research and Applications. July 13th – July 16, Boulder, Colorado.
Blanco, Governor Kathleen Babineaux. July 26, 2006 correspondence to Department of Homeland Security Secretary Michael Chertoff (with appendices: LA DSS (App 2), LA DHH (App 9) and LA DOTD (exhibit 2)). State of Louisiana.
Boruff, B.J., Emrich, C., and S.L. Cutter. 2005. “Erosion Hazard Vulnerability of US
Coastal Counties.” Journal of Coastal Research, 21(5): 932-942. West Palm Beach (Florida), ISSN 0749-0208
Boyd, E. 2006. “Preliminary Summary Report of Hurricane Katrina Deceased Victim
Recovery Locations in Louisiana” ESRI GIS Public Health conference proceedings. Denver, Colorado, Oct 23-26.

145
Bridges, S. and Garcie, A. 2006. “Providing Care to Special Needs Residents During Times of Disaster” Online Presentation from the Rural Health Clinic Conference, Missouri. National Rural Health Association. September 25, 2006. www.nrharural.org/CAHhandouts/RHC/BridgesGarcie.pdf (Accessed online May 26, 2007)
Brodie, M., Weltzien, E. Altman, D., Blendon, RJ and JM. Benson. 2006. “Experiences
of Hurricane Katrina Evacuees in Houston Shelters: Implications for Future Planning” Am J Public Health. 2006;96: doi:10.2105/AJPH.2005.084475. http://www.ajph.org/cgi/content/short/96/8/1402
Callimachi, R. Associated Press. Aug 17, 2006. “Son sues over Katrina Wheelchair
death” http://news.yahoo.com/s/ap/20060817/ap_on_re_us/katrina_victim_lawsuit&printer=1 (Accessed online August 17, 2006)
Centers for Disease Control and Prevention (CDC) Morbidity and Mortality Weekly
Reports (MMWRs) --- 2006a. “Injury and Illness Surveillance in Hospitals and Acute-Care Facilities After
Hurricanes Katrina and Rita --- New Orleans Area, Louisiana, September 25--October 15, 2005” January 20, 2006 / 55(02);35-38 http://www.cdc.gov/mmwr/preview/mmwrhtml/mm5502a4.htm (Accessed online April 21, 2007)
--- 2006b. “Surveillance in Hurricane Evacuation Centers --- Louisiana, September--
October 2005” January 20, 2006 / 55(02); 32-35 (Accessed online April 21, 2007) --- 2006c. “Morbidity Surveillance After Hurricane Katrina --- Arkansas, Louisiana,
Mississippi, and Texas, September 2005” July 7, 2006/ 55(26); 727-731 http://www.cdc.gov/mmwr/preview/mmwrhtml/mm5526a3.htm (Accessed online April 21, 2007)
CNN. 2005. “Nursing home owners face charges: Couple charged with 34 counts of
negligent homicide” Sept 13, 2005 (Accessed June 16, 2007, http://www.cnn.com/2005/US/09/13/katrina.impact/
Coats. Bill. “Storm frenzy is not an anomaly, but a phase; Atlantic current may be
creating a hurricane hatchery. And the cycle may last 20 years.” St. Petersburg Times online. September 13, 2005. (Accessed June 17, 2007, http://www.sptimes.com/2005/09/13/Weather/Storm_frenzy_is_not_a.shtml)
Croner, C. M. 2003. “Public Health GIS and the Internet.” Ann Review Public Health
Vol. 24: 57-82. (http://origin.cdc.gov/nchs/data/gis/GIS_AND_THE_INTERNET.pdf) Curtis, A. and Leitner, M. 2006a. Geographic Information Systems and Public Health:
Eliminating Perinatal Disparity. USA and UK: Idea Group Inc.
146
--- 2006b. with Mills, J., and Leitner M. “Keeping an eye on privacy issues with geospatial data.” Nature 441, 150.
Cunningham, R., Gisclair, D. and J. Craig. “The Louisiana Statewide LIDAR Project.”
(Accessed June 24, 2007, at atlas.lsu.edu/central/la_lidar_project.pdf) Cutter, S.L. 2006. “Social Science Research Perspectives on Hurricane Science and
Engineering” National Science Board Workshop, Task Force on Hurricane Science and Engineering, Pensacola FL. (online presentation accessed June 16, 2007, www.nsf.gov/nsb/committees/hurricane/3/cutter.pdf )
Deal, B.J., Fountain, R.A., Russell-Broaddus, C.A., Stanley-Hermanns, M. 2006.
“Challenges and Opportunities of Nursing Care in Special-Needs Shelters.” Disaster Management and Response. 4(4): 100-105.
Diaz, Jim, MD, MHA, MPH &TM, Dr. PH. 2003-2007. LSU Health Sciences Center
and LSU Hurricane Public Health Center. Project Presentations and Annual Reports. Dosa, D.M., Grossman, N., Wetle, T. and V. Mor. 2007. “To Evacuate or Not to
Evacuate: Lessons Learned from Louisiana Nursing Home Administrators Following Hurricanes Katrina and Rita.” Journal of the American Medical Directors Association. 8(3): 142-49.
Easley, Joffrey E. “Development of a Performance-based Design Approach and Related
Loads for Facilities Designated as Essential During a Hurricane Event” Thesis, Louisiana State University, 2003.
Edson, R., John, L., and P. Webb. 2007. “A Systems Analysis of Special-Needs
Population Evacuation during Catastrophic Events.” Stevens Institute of Technology and ANSER.
Eisenman, D.P., Cordasco, K.M., Asch, S., Golden, J.F., and D. Glik. 2007. “Disaster
Planning and Risk Communication With Vulnerable Communities: Lessons Learned from Hurricane Katrina.” American Journal of Public Health, 97(S1); S109-S115.
Emmanuel, K. 2004. “Response of Tropical Cyclone Activity to Climate Change:
Theoretical Basis” in Hurricane and Typhoons: Past, Present and Future. R.J. Murnane, Kambiu-Liu, Eds. Columbia Univ. Press, New York, Chapter 14, 395-407.
ESRI. 1999. “Enterprise GIS in Health and Social Service Agencies.” An ESRI White
Paper. Federal Emergency Management Agency (FEMA). Storm Alert! Hurricane
Preparedness for Nursing Homes. CD Rom Distributed by the NOAA Coastal Services Center, Charleston, SC.

147
FEMA and the US Army Corps of Engineers (USACE). 2007. “Comprehensive Hurricane Data Preparedness Study Web Site. National hurricane study program home page. (Accessed June 7 2007, http://chps.sam.usace.army.mil/USHESdata/HESHOME.htm)
Fernandez, L.S., Byard, D., Lin, Chien-Chih, Benson, S., and J.A. Barbera, 2002. “Frail
Elderly as Disaster Victims: Emergency Management Strategies.” Prehospital and Disaster Medicine. 17(2): 68-74.
Ford, E.S., Mokhad, A.H., Link, M.W., Garvin, W.S., McGuire, L.C., Jiles, R.B., and
L.S. Balluz. 2006. “Chronic Disease in Health Emergencies: In the Eye of the Hurricane,” Prev Chronic Dis [serial online] 2006 Apr Accessed June 17. 2007, http://www.cdc.gov/pcd/issues/2006/apr/05_0235.htm
Gibson, M.J. and Hayunga, M. 2006. “We Can Do Better: Lessons Learned for
Protecting Older Persons in Disasters.” Research Report by the AARP Public Policy Institute. 88 pages.
Goldenberg, S.B., Landsea, C.W., Mestas-Nunez, A.M., and Gray, W.M. 2001. “The
Recent Increase in Atlantic Hurricane Activity: Causes and Implications” Science. 293(5529): 474-479. DOI: 10.1126/science.1060040.
Gordon, M. West Bank Bureau, New Orleans Times Picayune. 2007. “Buses to
evacuate any who can’t drive away – but leave on your own if you can” (Accessed June 7, 2007, http://www.nola.com/hurricane/index.ssf?/hurricane/improvingtheodds/evacuate.html)
Gray, B.H. and K. Hebert. “Hospitals in Hurricane Katrina: Challenges Facing Custodial
Institutions in a Disaster.” 2007. Journal of Health Care for the Poor and Underserved. 18:283-98
Greene, R.W. 2002. Confronting Catastrophe: A GIS Handbook. ESRI Press, Redlands,
California. Gregg, James P. “Development and Application of Methods for Evaluation of Hurricane
Shelters” Thesis, Louisiana State University, 2006. Guidroz, W.S., Stone, G.W. and Dartez, D. 2006. “Hurricane Rita, 2005:
Assessment of a Storm-Induced Geological Event along the Southwestern Louisiana Coast and Adjacent Interior Marsh” (Accessed June 5, 2007, http://wavcis.csi.lsu.edu/pubs/GuidEtAl.pdf)
Haber, B. “It was Heroism, Not Homicide, During Katrina” July 25, 2006. Associated
Press (Time/CNN). (Accessed June 7, 2007 http://www.time.com/time/nation/article/0,8599,1218776,00.html)
Hill, Carol. 2004. “Wind Hazard Modeling and the HAZUS Wind Model.” LSU Natural
Hazards Engineering.

148
Hugh-Jones, Martin, MPH, DVM. 2003-2007. LSU Hurricane Public Health Center. Project Presentations and Annual Reports.
Hurlbert, J.S., Beggs, J.J., Robicheaux, S. and Haines, V.A. 2004. “Who Would Leave”
Presentation of preliminary population survey data to the CDC. LSU Hurricane Public Health Center.
Hurricane Pam exercise. 2004. FEMA and GOHSEP catastrophic hurricane exercise,
Baton Rouge EOC, Louisiana (see also below, IEM) Innovative Emergency Management (IEM). 2004. “Draft Functional Catastrophic
Hurricane Plan.” From the FEMA-funded exercise “Hurricane Pam” July 2004, hosted at the Louisiana Office of Homeland Security and Emergency Preparedness.
Jerve, Steve. “Bermuda High and Other Storm Questions.” Tampa Bay Online. May
15, 2005. (Accessed June 3, 2007, http://hurricane.weathercenter.com/bermudahigh.htm) Kaplan, J., and M. DeMaria, 1995: A simple empirical model for predicting the decay of
tropical cyclone winds after landfall. J. Appl. Meteor., 34, 2499-2512. Keim, B. and Robbins, K. 2006. “Occurrence dates of North Atlantic tropical storms
and hurricanes: 2005 in perspective” Geophysical Research Letters. Vol 33, L21706 King, Ronette. “Flood-ravaged hospitals are diagnosing their needs for this hurricane
season” The Times-Picayune. May 27, 2006. Kirkpatrick, D.V. and M. Bryan, 2007. “Hurricane Emergency Planning by Home Health
Providers Serving the Poor.” Journal of Health Care for the Poor and Underserved. 18: 299-314.
Klein, K.R. and N.E. Nagel. 2007. “Mass Medical Evacuation: Hurricane Katrina and
Nursing Experiences at the New Orleans Airport.” Disaster Management & Response. 5 (2): 56-61.
Knabb, R.A., Rhome, J.R., Brown, D.P., National Hurricane Center. 2006. “Tropical
Cyclone Report Hurricane Katrina 23-30 August 2005” Knutson, Tom. “Global Warming and Hurricanes” Geophysical Fluid Dynamics
Laboratory. http://www.gfdl.noaa.gov/~tk/glob_warm_hurr.html updated May 21, 2007. (Accessed May 27, 2007).
--- 2004. with R.E. Tuleya. “Impact of CO2-induced warming on simulated hurricane
intensity and precipitation: Sensitivity to the choice of climate model and convective parameterization.” Journal of Climate, 17(18), 3477-3495.

149
Koch, Tom. 2005. Cartographies of Disease: Maps, Mapping and Medicine. ESRI Press, Redlands, California.
Kuba, M., Dorian, A., Kuljian, S. and K. Shoaf. 2004. “Elderly Populations in Disasters:
Recounting Evacuation Processes from Two Skilled-Care Facilities in Central Florida, August 2004” UCLA Center for Public Health and Disasters. Quick Response Research Report 172. Colorado Natural Hazards Center.
Kurland, K.S. and Gorr, W. L. 2006. GIS Tutorial for Health. ESRI Press, Redlands,
California. Landsea, C. W. 2001. “Comment on ‘Changes in the Rates of North Atlantic Major
Hurricane Activity During the 20th Century.” Geophysical Research Letters. 28(14): 2871-2872. --- 2005. "Hurricanes and global warming." Nature, 438, E11-13, doi:10.1038/nature
04477. (Accessed June 4, 2007: http://www.aoml.noaa.gov/hrd/Landsea/landseanaturepublished.pdf
--- 2007. NOAA AOML Hurricane Research Division (HRD). “FAQ: Hurricanes,
Typhoons and Tropical Cyclones,” updated June 1, 2007. http://www.aoml.noaa.gov/hrd/tcfaq/A8.html
Lapolla, Nancy, MPH. Director, EMS Agency Santa Barbara County. 2003. “Finding
Vulnerable and Medically Fragile Populations.” Presentation.
Laymon, Paul. 1999. “Spatially Enabling Vital Health Data.” ESRI ArcUser Magazine. Accessed online January 10, 2007 at http://www.esri.com/news/arcuser/0499/vital.html.
Louisiana Department of Health and Hospitals (LA DHH), Office of Public Health. --- 2005a. State Epidemiologist Preliminary Shelter Draft (9-12 September 2005) with
powerpoint summary (15 September 2005) --- 2005b. State Epidemiologist. “Daily Shelter Surveillance Report 9/14/2005” --- 2005c. State Epidemiologist Emergency Room Surveillance Dataset (October 2005) --- 2006a. DHH Exhibit 4 (Medical Institution Evacuation Plan) from Governor Blanco's
Statement Letter to Secretary Chertoff, dated July 26, 2006. http://www.gov.state.la.us/index.cfm?md=newsroom&tmp=detail&catID=1&articleID=2071&navID=3
--- 2006b. State Medical Examiner. “Deceased Reports: Reports of Missing and Deceased August 6, 2006.” Louisiana Department of Health and Hospitals: Hurricane Katrina. http://www.dhh.louisiana.gov/offices/page.asp?ID=192&Detail=5248 (Accessed online March 19, 2007)

150
--- 2006c. State Medical Examiner. Deceased Victims Dataset (2 August 2006)
--- 2007a. Health Standards. Nursing Home Census and Hospital Operational Beds. (Accessed May 2007) ---2007b. “State of the State – Emergency Preparedness” HHS Senior Health Officials
Briefing. Drs. J. Guidry and R. Prats. August 28-29. ---2007c. Nursing Home Emergency Preparedness Review Committee meetings
(various). Louisiana State Governor’s Office of Homeland Security and Emergency Preparedness
(GOHSEP). 2005. “Special Needs Shelter Guidance Memorandum” (Accessed June 15, 2007, http://www.ohsep.louisiana.gov/memorandum_to.htm)
--- May 18, 2006 News Release. Mark Smith. LSU Hurricane Center (LSU HC). 2007. Shelter Suitability Surveys of Coastal Louisiana
Nursing Homes (general outcomes). Project funded by the US Department of Health and Human Services.
Mashriqui, Hassan et al. 2006a. Coastal Hydrology and Water Quality: Proceedings of
the AIH 25th Anniversary Meeting and International Conference, Y. J. Xu, V. J. Singh, Eds. (American Institute of Hydrology, Baton Rouge, LA, 2006), pp. 481–489.
--- 2006b, with Kemp, P.K.; van Heerden, I. Ropers-Huilman, B.; Hyfield, E., Yang,
Y.; Streva, K; and Binselam, A. 2006b. “Experimental Storm Surge Simulations for Hurricane Katrina,” featured in Coastal Hydrology and Processes (Book 1) by Singh, V.P. and Xu, Y. J., eds.
Mayhorn, M. 2005. “Cognitive Aging and the Processing of Hazard Information and
Disaster Warnings.” Natural Hazards Review. 6(4): 165-170. McCulloh, R.P., Heinrich, P.V., and B. Good. Louisiana Geological Survey (LGS).
2006. “Geology and Hurricane Protection Strategies in the Greater New Orleans Area.” Public Information Series No. 11.
McConnaughey, Janet. “Is lack of evacuation plan negligence or malpractice?”
Associated Press. April 12, 2007. (Accessed online April 12, 2007) McKeefry, H.L. June 8, 2006. “Louisiana Stamps Out Food-Stamp Fraud.”
E-Week.com. Accessed online January 17, 2007 at http://www.eweek.com/article2/0%2C1895%2C1972079%2C00.asp
Mediri, N. “Development of a Methodology to Delineate Hurricane Evacuation Zones,” Thesis, Louisiana State University, 2004.
151
Missouri State Emergency Management Agency, 2007. “Evacuation Considerations for
the Elderly” Online reference, accessed June 17, 2007, http://sema.dps.mo.gov/semapage.htm Mobley, L.R., Root, E., Anselin, L., Lozano-Gracia, N., and J. Koschinsky. 2006.
“Spatial analysis of elderly access to primary care services. International Journal of Health Geographics. 5(19): doi:10.1186/1476-072X-5-19.
Mokhad, A.H., Mensah, G.A., Posner, S.F., Reed, E., Simoes, E.J., Engelgau, M.M. with
the Chronic Diseases and Vulnerable Populations in Natural Disasters Working Group. 2005. “When Chronic Conditions Become Acute: Prevention and Control of Chronic Diseases and Adverse Health Outcomes During Natural Disasters,” Prev Chronic Dis [serial online] 2005 Nov Accessed June 17. 2007, http://www.cdc.gov/pcd/issues/2005/nov/05_0201.htm
Moss, M.P., Schell, M.C. and R.T. Goins. 2006. Using GIS in a first national mapping
of functional disability among older American Indians and Alaska natives form the 2000 census. International Journal of Health Geographics. 5(37): doi:10.1186/1476-072X-5-37.
Murray, G.E., 1961. Geology of the Atlantic and Gulf coastal province of North America.
New York, Harper Brothers, 692 p.
Mutter, J. and A. R'id, Earth Institute 2007. Hurricane Katrina Deceased-Victims List. Columbia University, New York. http://www.katrinalist.columbia.edu/index.php (Accessed online April 27, 2007)
National Council on Disability. 2005. “Saving Lives: Including People with Disabilities
in Emergency Planning.” (Accessed June 16, 2007, http://www.ncd.gov/newsroom/publications/2005/saving_lives.htm#executive)
National Hurricane Conference (NHC) 2007. Session on disabilities and special needs
in shelters. New Orleans, March 2007. National Oceanic and Atmospheric Administration (NOAA) --- 1999. “Hurricane Basics.” (Accessed June 7, 2007,
http://hurricanes.noaa.gov/pdf/hurricanebook.pdf ) --- 2007a. Aircraft Operations Center. “FAQ.” (Accessed June 3, 2007.
http://www.aoc.noaa.gov/faq.htm) --- 2007b. NOAA Magazine. “Storm Size, Intensity, Key to Evaluating Potential
Hurricane Damage. (Accessed June 7, 2007, http://www.noaanews.noaa.gov/stories2007/s2859.htm)
--- 2007c. Atlantic Oceanographic and Meteorological Laboratory (AOML) “Memorable
Gulf Coast Hurricanes Of The 20th Century” (Accessed June 7, 2007. http://www.aoml.noaa.gov/general/lib/mgch.html)
152
--- 2007d. Background on the HRD Surface Wind Analysis System (Accessed June 14,
2007, http://www.aoml.noaa.gov/hrd/Storm_pages/surf_background.html) O’Hare, Peggy. “Heat forces closure of FEMA office for the day.” Houston Chronicle
online. September 28, 2005. (Accessed June 3, 2007. http://www.chron.com/disp/story.mpl/topstory/3372849.html)
Olsen, L. 2005. “Registry advocate a witness to tumult: A nursing professor in East
Texas pushed for evacuation plan” The Houston Chronicle at chron.com. October 9, 2005. Onsrud, HJ, Johnson, JP and Lopez X. 1994. “Protecting Personal Privacy in Using
Geographic Information Systems” Photogrammetric Engineering and Remote Sensing, Vol. 60, No. 9, September 1994. Bethesda: PE&RS: 1083-1095.
Pardue, J. H.; Moe, W. M.; McInnis, D.; Thibodeaux, L. J.; Valsaraj, K. T.; Maciasz,
E.; van Heerden, I.; Korevec, N.; Yuan, Q. Z. 2005. “Chemical and Microbiological Parameters in New Orleans Floodwater Following Hurricane Katrina” Environ. Sci. Technol. 2005, ASAP Article. DOI: 10.1021/es0518631.
Parker, Laura. USA Today. 2006. “Grand jury looks at Katrina deaths” (Accessed
online June 16, 2007, http://www.usatoday.com/news/nation/2006-09-05-katrina-deaths-grand-jury_x.htm)
Pine, John C., H. Mashriqui, S. Pedro, and J. Meyer (2005). “Hazard Mitigation Planning
Utilizing HAZUS-MH Flood and Wind Hazards.” Journal of Emergency Management Vol. 2. March/April 2005; pages 11-16
Pedro, Stephanie. “Delineating Hurricane-Vulnerable Populations in Orleans Parish,
Louisiana.” Thesis, Louisiana State University, 2006. Prats, Rosanne B. “Multiple Criteria Decision Making (MCDM) Application in
Evaluating Nursing Home Emergency Preparedness Plans in Louisiana” Thesis, Tulane Medical School, 2003.
Reed, Carl. 2002. “Public Health, Interoperability and the Future.” Public Health GIS
News and Information January 2002 (No. 44) 15-20. Accessed online January 10, 2007 at http://www.cdc.gov/nchs/data/gis/cdcgis44.pdf.
Robbins, K. 2004. “Hurricane Winds and Rainfall.” A presentation to the CDC.
Southern Regional Climate Center.
Sadden, L., Deaton, L. and Gonzales, M. 2005. “Concept Paper: Bringing Culture Change to Louisiana Nursing Homes” http://www.dhh.louisiana.gov/offices/publications/pubs-112/concept%20paper%20revised%20per%20adv%20council.doc. (Accessed online April 27, 2007)

153
Schleifstein, Mark. “Nagin lays out evacuation plan: Category 2 means everybody out, he says.” The Times-Picayune. May 3, 2006.
--- 2007. “Weak spots leave area vulnerable; Levees could fail even during moderate
hurricanes.” The Times-Picayune. May 9, 2007. Shuler, Marsha. “Feds stop release of hospital survey: Study examines storm
preparedness.” The Baton Rouge Advocate. October 4, 2006.
Special Operation Response Team (SORT), Alternate Medical Care Facility and Special Medical Needs. Webpage updated 5 February 2007 by Mark Nichol, SORT Training Officer, http://www.sortteam.org/spneeds.html.
Southeast Louisiana Hurricane Task Force (SEHTF), May 25, 2007 meeting. La Freniere Park, Metairie, Louisiana.
St. Bernard Parish Health Profile. 2004. “People with Disabilities” (Accessed June 2007,
www.dhh.louisiana.gov/OPH/PHP%202005/PDF/St.%20Bernard/Disability%20St%20Bernard.pdf)
Tsui, M. and Curtis, A. 2007. “Public Access, Privacy and Security: US Law and
Policy” Presentation at the URISA GIS in Public Health Conference, New Orleans. May 21. United States Census Bureau,
-- 2000. Decennial Programs, Census 2000 United States. “Census 2000 Summary File 1 (SF 1) 100-Percent Data” http://factfinder.census.gov/servlet/MetadataBrowserServlet?type=dataset&id=DEC_2000_SF1_U&_lang=en (Accessed online April 21, 2007)
--- 2005. American Community Survey. “United States and States: Percent of People 65 Years and Over with a Disability: 2005 Civilian noninstitutionalized population 65 years and over. R1803. http://factfinder.census.gov/servlet/GRTTable?_bm=y&-geo_id=01000US&-_box_head_nbr=R1803&-ds_name=ACS_2005_EST_G00_&-format=US-30 (Accessed online April 21, 2007)
--- 2006a. “U.S. Census Bureau Special Population Estimates for Impacted Counties in the Gulf Coast Area” January 1, 2006. Hurricane Data and Emergency Preparedness. http://www.census.gov/Press-Release/www/emergencies/impacted_gulf_estimates.html (March 19, 2007) http://www.census.gov/population/projections/state/9525rank/laprsrel.txt
---2006b. 2006 Louisiana Health & Population Survey. Conducted by the Louisiana Public Health Institute, on behalf of the Louisiana Department of Health and Hospitals and the Louisiana Recovery Authority, with technical assistance from the Centers for Disease Control and Prevention. Accessed online March 19, 2007, at http://popest.org/popestla2006/

154
United States Department of Health and Human Services (US DHHS), Office of the Inspector General (OIG). August 2006. “Nursing Home Emergency Preparedness and Response During Recent Hurricanes.” OEI-06-06-00020.
United States Department of Homeland Security (US DHS). 2006a. (with the State of
Louisiana Governor’s Office of Homeland Security (LA GOHSEP). “Hurricanes Katrina and Rita After-Action Report and Improvement Plan.”
--- 2006b. “Quick Response Guide for the National Response Plan.” May 22, 2006.
version 4. (Accessed June 2007, www.dhs.gov/xlibrary/assets/NRP_Quick_Reference_Guide_5-22-06.pdf)
United States Department of Justice (USDOJ), Civil Rights Division (CRD), Disability
Rights Section (DRS). 2004. An ADA Guide for Local Governments: Making Community Emergency Preparedness and Response Programs Accessible to People with Disabilities.
United States Department of Transportation (USDOT) and US DHS. 2007. Catastrophic
Hurricane Evacuation Plan Evaluation United States Fire Administration (USFA) Emergency Management Institute (EMI) and
Federal Emergency Management Agency (FEMA). 2003. Emergency Planning and Special Needs Populations. National Hurricane Conference 2-day course. G197 Student Manual.
United States Geological Survey. 2006. “Hurricane Katrina Photographs August 30,
2005” Accessed June 16, 2007, http://www.nwrc.usgs.gov/hurricane/post-hurricane-katrina-photos.htm)
van Heerden, I. Center for Coastal Energy and Environmental Resources (CCEER).
1994. “A Long Term Plan for Coastal Louisiana to Ensure Sustainable Biological Productivity, Economic Growth and the Continued Existence of its Unique Culture and heritage”
--- 2003. “Coastal Land Loss and New Orleans” LSU Hurricane Public Health
Center. Accessed June 16, 2007, http://www.publichealth.hurricane.lsu.edu/CenterReports.htm)
--- 2005. with J. Diaz and K. Streva. “New Orleans and Hurricanes: A City in Peril.”
Prehospital Disaster Medicine, Vol. 20, Supp. 1, No. 2, s64-s65. --- 2006a. with M. Bryan. "The Storm - What Went Wrong and Why During
Hurricane Katrina - the Inside Story from One Louisiana Scientist." Penguin/Viking. 294 pp. --- 2006b. with Kemp, G.P., Mashriqui, H., Sharma, R., Prochaska, B., Capozzoli, L.,
Theis, A., Binselam, S.A., Streva, K. and E. Boyd. "The Failure of the New Orleans Levee System during Hurricane Katrina." Team Louisiana Final Report to the LA DOTD, Project 704-92-0022.

155
--- 2007. with Team Louisiana. “The Katrina Experience: What Happened? Can We
Rebuild? What’s the Way Forward?” Presentation, Bimidji, MN. Walker, N., Haag, A., Balasubramanian, S., Leben, R., van Heerden, I. Kemp, P. and
Mashriqui, H. 2006. “Hurricane Prediction: A Century of Advances.” Oceanography. 19 (2): 24-36.
Wells, G. through M2MEDIA360. 2006. “Tracking a Mass Evacuation – Lessons
Learned from Hurricane Rita.” GeoWorld. http://www.geoplace.com (Accessed January 2007).
Whoriskey, Peter “Nursing Homes' Hard Choice: Stay or Leave? Managers in Florida Weigh Risks as they Monitor Wilma Forecasts” Washington Post. Sunday, October 23, 2005; Page A03 (Accessed June 6, 2007, http://www.washingtonpost.com/wp-dyn/content/article/2005/10/22/AR2005102201154.html)
GIS Data Sources Atlas: The Louisiana Statewide GIS. http://atlas.lsu.edu/ (2000 Census data) HRSA Geospatial Data Warehouse. http://datawarehouse.hrsa.gov/ 2007. (Hospice and other medical special needs facilities in Southern Louisiana) Jelesnianski, C., Chen, J. Shaffer, W. and Taylor. A. D. NOAA Sea Lake and Overland Surge from Hurricane (SLOSH) Storm Surge CD. May 9, 2007. (SLOSH MOM shapefiles) Louisiana Department of Health and Hospitals, Health Standards Section. Hospital Operational Beds Listing and Nursing Home Census Data. http://www.dhh.louisiana.gov/offices/publications.asp?ID=112&Detail=817 Louisiana Geological Survey (levee breach shapefile, LIDAR mosaic) Louisiana State University (LSU) Hurricane Center. 2005. “'Storm Surge Modeling, Gulf of Mexico counties” Project with the USGS. Dataset created by S. Ahmet Binselam. Refinements in progress as a component of his dissertation research, 2007. LSU Hurricane Public Health Center (HPHC) 2007. New Orleans GIS database. Project for the Louisiana Board of Regents. Arc-IMS and GIS datasets provided by project PIs and managed by S. Ahmet Binselam and R. Hampton Peele. LSU and the Louisiana Oil Spill Coordinator's Office (LOSCO), Office of the Governor. 2005. “Louisiana Supplemental GIS CD 2005.” May 2005. (Louisiana parishes, cities and places, railroads, and Tiger Roads Data 2004) http://lagic.lsu.edu/giscd/about.asp.

156
LOSCO, LSU and LOSRADP, Louisiana GIS Digital Map May 2007 Compilation DVD Set, Volume 1 (Assisted Living Centers and other potential MSN facility databases provided by the LA DHH and LA DSS). National Oceanic and Atmospheric Administration (NOAA) Coastal Services Center (CSC). (Historical hurricane track shapefiles) http://www.csc.noaa.gov/id/downloads.html NOAA National Hurricane Center (NHC) Atlantic Oceanographic and Meteorlogical Laboratory (AOML) Hurricane Research Division (HRD). Surface Wind Analysis. (Hurricane wind field shapefiles) http://www.aoml.noaa.gov/hrd/data_sub/wind.html US Department of Health and Human Services (US DHHS) Hospital and Nursing Home Database, provided by FEMA’s Geospatial Intelligence Unit (GIU) GIS Software ESRI ArcView 3.3 ESRI ArcGIS 9.2 ESRI ArcExplorer 9.2 ESRI ArcPublisher (extension) ESRI ArcReader Hurricane Models Jelesnianski, C., Chen, J. Shaffer, W. and Taylor. A. D. NOAA Sea Lake and Overland Surge from Hurricane (SLOSH) Storm Surge CD. May 9, 2007. Westerink, J. J. and Luettich, R. Advanced Circulation Model for Coastal Ocean Hydrodynamics (ADCIRC) Experimental Storm Surge Prediction Tool. Through the LSU Hurricane Public Health Center New Orleans Pilot Study.
Personal Interviews Boyd, Ezra. Flood Fatality Research, LSU Hurricane Public Health Center. Butcher, Tim. Emergency Director of Charity Hospital. 2006 pers comm. and presentations. Cataldie, Louis, MD, Louisiana State Medical Examiner and Medical Incident Commander for the recovery of deceased victims of Hurricane Katrina. March 2007. Personal communication.

157
Curtis, Andrew, Ph.D., 2007. Director, LSU World Health Organization Collaborating Center for Remote Sensing and GIS for Public Health (WHOCC), LSU Department of Geography and Anthropology. Diaz, Jim, MD, MHA, MPH &TM, Dr PH, 2004. Professor of Public Health, Program Director of Community Preventative Medicine, Program Director, Environmental and Occupational Health Sciences, LSU Health Sciences Center, School of Public Health. Personal communication.
Downey, Erin. Director of Emergency Preparedness for the Louisiana Hospital Association. January 2007. Personal communication. English, Elizabeth, PE, Ph.D. 2007, LSU Hurricane Center. Architect and Structural Engineer. Friedland, Carol. 2007, LSU Hurricane Center. Use of FEMA Hazus in Hurricane Wind Estimation. Kalis, Martin. 2003. Public Health Advisor, Public Health Emergency Preparedness Branch, Division of Emergency and Environmental Health Services, National Center for Environmental Health, Centers for Disease Control and Prevention, Atlanta Keim, Barry. Louisiana State Climatologist. LSU Southern Regional Climate Center. 2007.
Kosak, Francis. Assistant to the Louisiana State Medical Examiner and Medical Incident Commander for the recovery of deceased victims of Hurricane Katrina. March 2007. Personal communication. Lemoine, Sherwood. Internal Management Consultant, Louisiana Department of Social Services. November 2006. Personal communication. Levitan, Marc, Ph.D. Wind Engineer and Director of the LSU Hurricane Center. 2007. Nursing Home Administrators (various, anonymous), 2007 personal communications.
Romolo, Luigi. Regional Climatologist, Southern Regional Climate Center, Louisiana State University, June 7, 2007 personal communication.
van Heerden, Ivor. Deputy Director, LSU Hurricane Center and Director, LSU Hurricane Public Health Center. personal communication.
Yennie, Henry. Louisiana Department of Health and Hospitals, supporting medical special needs planning. October 2006 and May 2007. Personal communication.

158
APPENDIX A: THE SAFFIR-SIMPSON SCALE FOR HURRICANES
Saffir-Simpson Scale
for Hurricanes
Category Wind speeds (mph)
Approximate wind speeds
in knots
Storm Surge
Damage level Anticipated effects
1 74-95 64-82 4-5 ft minimal Damage to unanchored mobile homes, shrubbery, & trees; some coastal road flooding; minor pier damage
2 96-110 83-95 6-8 ft moderate Some roofing material, door, and window damage to buildings; considerable damage to vegetation, mobile homes, and piers; Coastal and low-lying escape routes flood 2-4 hours before arrival of center; Small craft in unprotected anchorages break moorings.
3 111-130 96-113 9-12 ft extensive Some structural damage to small residences and utility buildings; minor amount of curtainwall failures; Mobile homes destroyed; Coastal flooding destroys smaller structures; larger structures damaged by floating debris; Terrain <5 feet ASL may be flooded inland 8 miles or more.
4 131-155 114-135 13-18 ft extreme More extensive curtainwall failures with some complete roof structure failure on small residences; Major beach erosion; Major damage to lower floors of structures near the shore; Terrain <10 feet ASL may be flooded requiring massive evacuation of residential areas inland as far as 6 miles.
5 >155 >135 > 18 ft catastrophic Complete roof failure on many residences and industrial buildings; Some complete building failures with small utility buildings blown over or away; Major damage to lower floors of all structures located <15 feet ASL and within 500 yards of the shoreline; Massive evacuation of residential areas on low ground within 5 to 10 miles of the shoreline may be required.
From the LSU Hurricane Center website: www.hurricane.lsu.edu

159
APPENDIX B: STUDY SET: 26 COASTAL LOUISIANA PARISHES Louisiana Parishes included in the results of this study, with some or all portions of the parish south of interstates I-10 and I-12.
Louisiana Parish Acadia Ascension Assumption Calcasieu Cameron East Baton Rouge Iberia Iberville Jefferson Jefferson Davis Lafayette LaFourche Livingston Orleans Plaquemines St. Bernard St. Charles St. James St. John the Baptist St. Martin St. Mary St. Tammany Tangipahoa Terrebonne Vermilion West Baton Rouge

160
APPENDIX C: MAPS OF ELDERLY EXPOSURES DURING HURRICANE KATRINA
Elderly deceased recovery locations mapped by zip code across Louisiana, from available data (State Medical Examiner, LA DHH 2006c). ESRI ArcGIS 9.2, Tiger Zip Codes 2004.
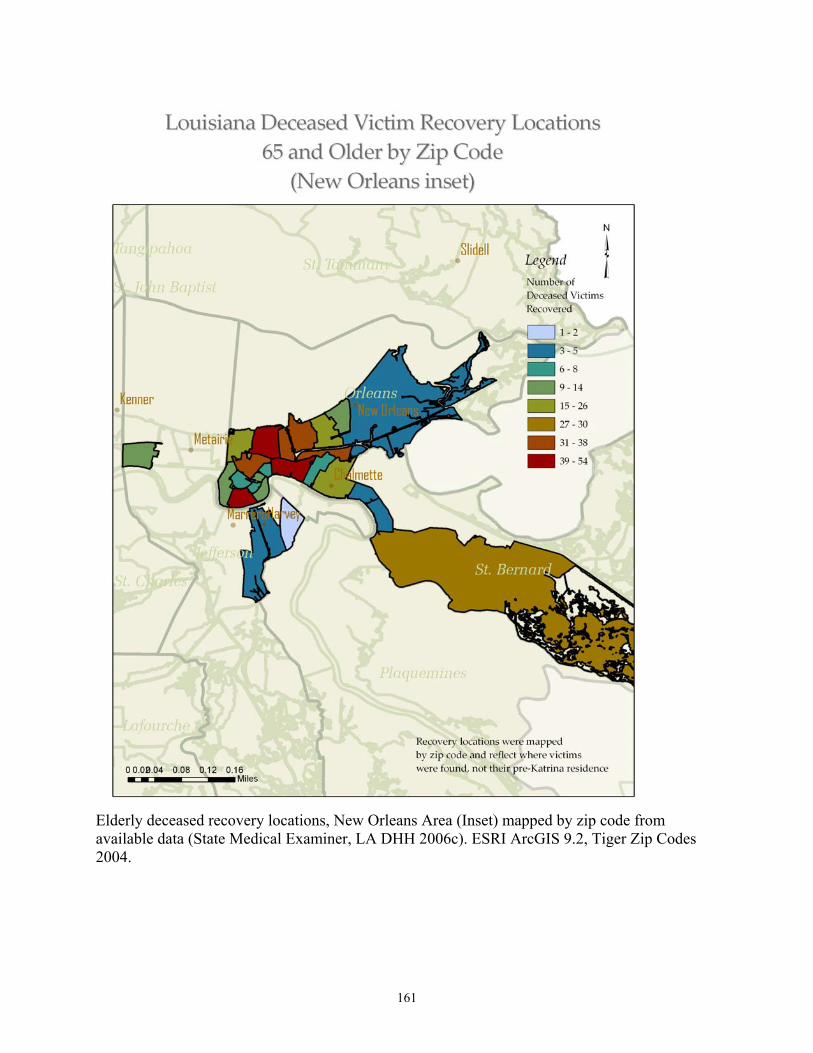
161
Elderly deceased recovery locations, New Orleans Area (Inset) mapped by zip code from available data (State Medical Examiner, LA DHH 2006c). ESRI ArcGIS 9.2, Tiger Zip Codes 2004.

162
Elderly deceased recovery locations, New Orleans Area (Inset) mapped by zip code from available data (State Medical Examiner, LA DHH 2006c) and normalized by 2000 census data for the 65 and older population. ESRI ArcGIS 9.2, Tiger Zip Codes 2004.

163
ER Surveillance mapping of visits by elderly surrounding Hurricane Katrina landfall demonstrate areas where hospitals remained open in Jefferson and St. Charles Parishes, as well as how hospitals were likely at or over capacity receiving patients from the surrounding areas. Very few elderly patients were seen from the severely impacted parishes of Orleans and St. Bernard for example, indicating they were likely transported further distance for emergency medical care (State Epidemiologist, LA DHH 2006c). ESRI ArcGIS 9.2, Tiger Zip Codes 2004.

164
APPENDIX D: LOUISIANA HURRICANE INTENSITIES AT LANDFALL, 1905-2005
Louisiana Hurricane Strikes over the Last Century (1905-1955) by Maximum Windspeed at Landfall40
Hurricane strikes in Louisiana in the first part of the past century (1905-1955). Data was mainly from ship and buoy measurements prior to 1943 when planes began flying in to hurricanes to take measurements (Landsea 2001). Note the absence of intense hurricanes (Category 3 or above).
40 Table Legend: YEAR=year of hurricane landfall. AMO=Atlantic Multidecadal Oscillation, first or second warm or cool phase. ST1Wmx=first storm strike, maximum windspeed in knots, STW1mn=first storm strike, minimum windspeed in knots, S1dir=direction of first storm strike, tracking north, northwest, northeast, east or west. S1loc=first storm strike, west, central or east Louisiana, ST2Wmx, STW2mn, S2dir, S2loc, ST3Wmx, STW3mn, S3dir, S3loc = similar data for second and third storm strikes in Louisiana. stormT=total number of storms to strike Louisiana that year. All data were taken from the NOAA CSC historical track data in a GIS and are approximate. Data are provided for a general overview of storm strikes in Louisiana and their approximate intensity AT LANDFALL.
STORM 1 STORM 2 STORM 3 YEAR AMO ST1Wmx STW1mn S1dir S1loc ST2Wmx STW2mn S2dir S2loc ST3Wmx STW3mn S3dir S3loc stormT 1905 C1 45 35 N W 45 35 NE C 2 Wmknots 1906 C1 0 TS <64 1907 C1 40 40 NW E 1 CAT1 64-82 1908 C1 50 35 NW C 1 CAT2 83-95 1909 C1 105 75 N C 1 CAT3 96-113 1910 C1 0 CAT4 114-135 1911 C1 40 35 W E 1 CAT5 >135 1912 C1 60 50 NE C 1 1913 C1 0 1914 C1 35 35 W E 1 1915 C1 85 60 N E 1 1916 C1 105 105 NW E 1 1917 C1 0 1918 C1 85 40 NW W 1 1919 C1 0 1920 C1 90 45 NW C 1 1921 C1 0 1922 C1 0 1923 C1 85 40 N C 1 1924 C1 0 1925 C1 0 1926 W1 85 35 N C 60 35 W E 2 1927 W1 0 1928 W1 0 1929 W1 0 1930 W1 0 1931 W1 50 35 N C 1 1932 W1 35 35 NE C 40 40 NE C 2 1933 W1 0 1934 W1 65 55 N C 1 1935 W1 0 1936 W1 40 40 NE E 1 1937 W1 35 35 N C 1 1938 W1 65 35 NW W 1 1939 W1 40 35 NE E 1 1940 W1 70 65 NW W 40 35 E W 2 1941 W1 40 35 NE W 45 45 NW W 2 1942 W1 0 1943 W1 35 35 NE W 1 1944 W1 40 35 NE E 1 1945 W1 0 1946 W1 35 35 NW W 0 1947 W1 80 35 NW E 1 1948 W1 65 50 NE E 1 1949 W1 40 40 N E 50 40 N W 2 1950 W1 0 1951 W1 0 1952 W1 0 1953 W1 0 1954 W1 40 35 NW W 1 1955 W1 60 35 NW E 40 40 NW E 2

165
Louisiana Hurricane Strikes over the Last Century (1956-2005) by Maximum Windspeed at Landfall41
Hurricane strikes in Louisiana in the second part of the past century (1956-2005). Satellite measurements added increased accuracy to the record in the late 1960’s (Landsea 2001, Keim and Robbins, 2006). However, between approximately 1945-1970, intensities may have been overestimated (Landsea 2001).
41 Table Legend: YEAR=year of hurricane landfall. AMO=Atlantic Multidecadal Oscillation, first or second warm or cool phase. ST1Wmx=first storm strike, maximum windspeed in knots, STW1mn=first storm strike, minimum windspeed in knots, S1dir=direction of first storm strike, tracking north, northwest, northeast, east or west. S1loc=first storm strike, west, central or east Louisiana, ST2Wmx, STW2mn, S2dir, S2loc, ST3Wmx, STW3mn, S3dir, S3loc = similar data for second and third storm strikes in Louisiana. stormT=total number of storms to strike Louisiana that year. All data were taken from the NOAA CSC historical track data in a GIS and are approximate. Data are provided for a general overview of storm strikes in Louisiana and their approximate intensity AT LANDFALL.
STORM 1 STORM 2 STORM 3 YEAR AMO ST1Wmx STW1mn S1dir S1loc ST2Wmx STW2mn S2dir S2loc ST3Wmx STW3mn S3dir S3loc stormT 1956 W1 50 35 N C 75 75 NE E 2 1957 W1 125 45 N W 60 60 NW W 45 45 N C 3 Wmknots 1958 W1 0 TS <64 1959 W1 40 40 N C 1 CAT1 64-82 1960 W1 140 60 N E 1 CAT2 83-95 1961 W1 0 CAT3 96-113 1962 W1 0 CAT4 114-135 1963 W1 0 CAT5 >135 1964 W1 100 60 N C 1 1965 W1 135 35 NW E 1 1966 W1 0 1967 W1 0 1968 W1 0 1969 W1 165 100 N E 1 1970 C2 0 1971 C2 85 60 NW W 1 1972 C2 0 1973 C2 0 1974 C2 130 45 NW C 1 1975 C2 0 1976 C2 0 1977 C2 65 50 N C 1 1978 C2 50 40 N W 1 1979 C2 65 40 NE E 45 40 N W 2 1980 C2 0 1981 C2 0 1982 C2 50 40 N W 1 1983 C2 0 1984 C2 0 1985 C2 80 40 N W 105 45 W E 70 55 N C 3 1986 C2 0 1987 C2 0 1988 C2 45 35 NW E 70 60 NW E 2 1989 C2 0 1990 C2 0 1991 C2 0 1992 C2 125 50 NW C 1 1993 C2 0 1994 C2 0 1995 W2 0 1996 W2 0 1997 W2 70 55 NE E 1 1998 W2 95 90 NW E 40 35 N C 2 1999 W2 0 2000 W2 0 2001 W2 0 2002 W2 50 50 N E 55 55 N E 80 40 N C 4 2003 W2 50 45 N C 1 2004 W2 40 40 N C 1 2005 W2 65 50 N E 125 80 N E 99 35 NW W 3

166
APPENDIX E: LOUISIANA NAMED STORMS, 1905-2005 (Quick Reference: Names and Dates, NOAA CSC) YEAR MONTH DAY NAME
1954 7 29 BARBARA 1955 8 2 BRENDA 1957 6 28 AUDREY 1957 9 18 ESTHER 1959 5 31 ARLENE 1964 10 4 HILDA 1965 9 11 BETSY 1971 9 16 EDITH 1971 9 6 FERN 1974 9 8 CARMEN 1977 9 6 BABE 1978 8 29 DEBRA 1979 7 11 BOB 1982 9 12 CHRIS 1985 8 16 DANNY 1985 9 3 ELENA 1985 10 30 JUAN 1988 8 10 BERYL 1988 9 11 FLORENCE 1992 8 26 ANDREW 1998 9 20 HERMINE 2001 6 11 ALLISON 2002 8 7 BERTHA 2002 9 26 ISIDORE 2002 10 4 LILI 2003 7 1 BILL 2004 10 10 MATTHEW 2005 7 6 CINDY 2005 8 29 KATRINA 2005 9 25 RITA
167
VITA
Kathryn Emily (Friedman) Streva is a native of upstate New York. She studied
environmental science at the State University of New York (SUNY) at Binghamton, from 1990-
1992, and received her Bachelor of Science degree in environmental biology from Saint Francis
University, Loretto, Pennsylvania, in 1995.
Following some preliminary coursework in water resources engineering at Johns Hopkins
Whiting School of Engineering (Baltimore, Maryland, 1997 and 2001), Kate changed her major
and was accepted into the Master of Natural Sciences Program at LSU in 2003. She is majoring
in physical geography/GIS with a minor in pathobiological sciences. Her current research
interests include the application of geographic methods in support of public health and
epidemiologic studies.
Kate has worked as an LSU Research Associate since 2002 with the LSU Hurricane
Center and Hurricane Public Health Center, focusing on a New Orleans pilot study related to
hurricane public health vulnerability.
She was married in 2001 to John Streva of Morgan City, Louisiana, and they have a son,
Edan Joseph. Her hobbies and interests in Baton Rouge include horseback riding, aikido,
philosophy, anthropology, and religious studies. Kate has been involved with Capital Area
CASA since 2003.