hunter’s point south waterfront park, phase 1 methods · 2019-12-16 · aastha singh msla...
TRANSCRIPT

Hunter’s Point South Waterfront Park, Phase 1
Methods
Research Fellow:
Lisa DuRussel
Visiting Assistant Professor
Pennsylvania State University
Research Assistant:
Aastha Singh
MSLA Candidate
Pennsylvania State University
Firm Liaison:
Anya Domlesky, SWA Group
This investigation was conducted as part of the Landscape Architecture Foundation’s 2018
Case Study Investigation (CSI) program. CSI matches faculty-student research teams with
design practitioners to document the benefits of exemplary high-performing landscape projects.
Teams develop methods to quantify environmental, economic and social benefits and produce
Case Study Briefs for LAF’s Landscape Performance Series.
To cite:
DuRussel, Lisa, and Aastha Singh. “Hunter’s Point South Waterfront Park, Phase 1 Methods.” The Landscape Performance Series. Landscape Architecture Foundation, 2018. https://doi.org/10.31353/cs1371
The full case study can be found at: https://landscapeperformance.org/case-study-
briefs/hunters-point-south

Environmental Benefits
● Water | Stormwater Management: Intercepts, infiltrates, and evaporates 73% of
average annual rainfall in permeable pavers and a biofiltration swale.
Methods:
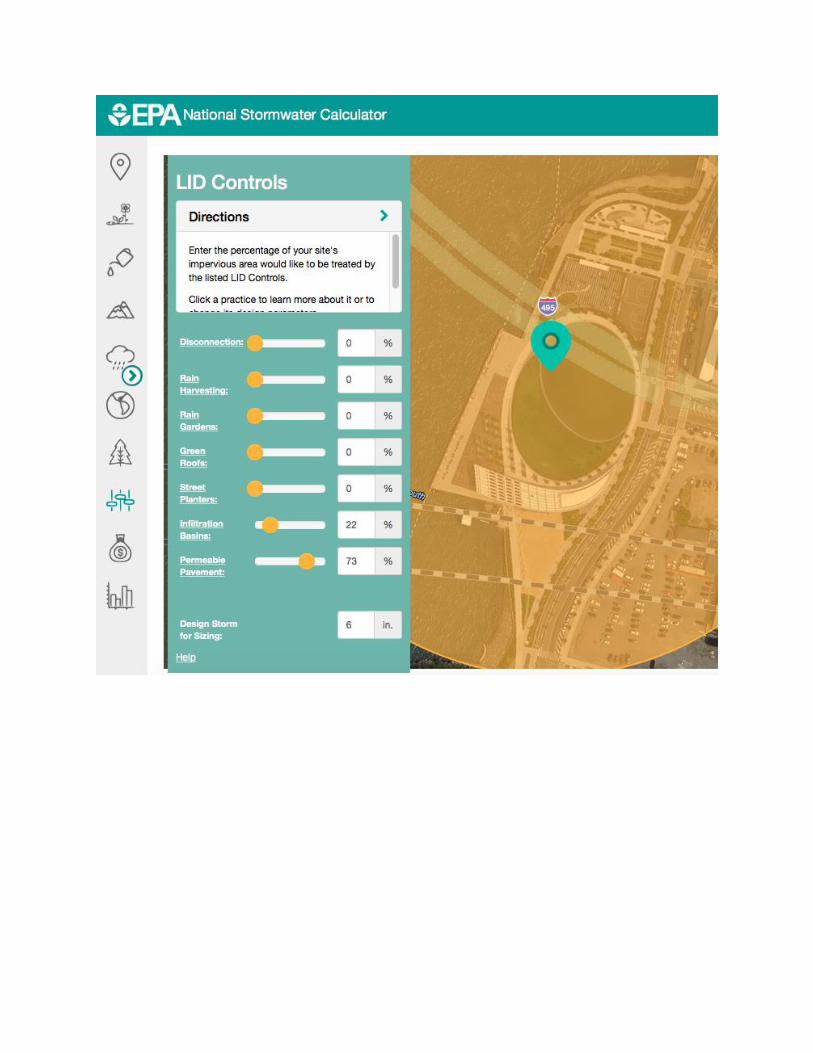
The site uses has a 760-ft biofiltration swale and gabion wall along the length of the park and
permeable paving throughout the site, which helps detain and infiltrate stormwater runoff on the
site. It also slows the entry of stormwater runoff into the city’s combined sewer system.1
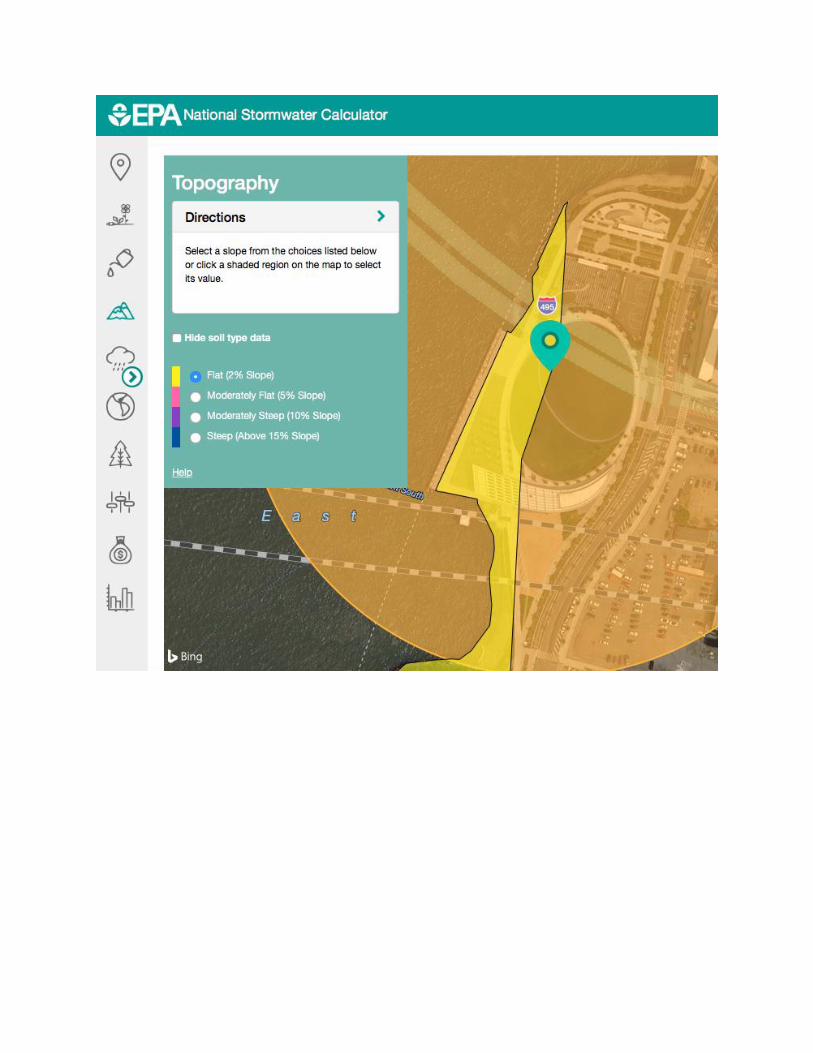
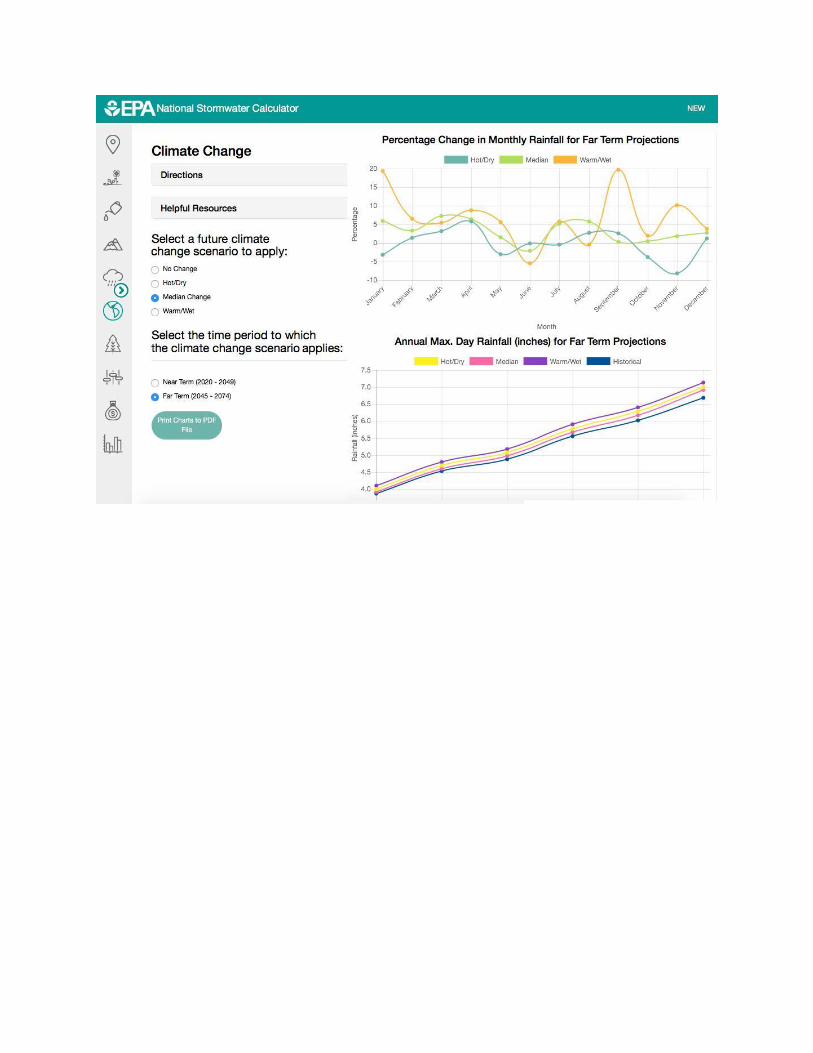
By consulting the construction documents provided by SWA, a hydrological model for the site
was created using the National Stormwater Calculator (the US EPA’s Stormwater Management
Tool) and the results from the report were used to report this benefit. From the final SWC
results, it was estimated that the site infiltrates 58.61% and evaporates 14.16% of annual
rainfall. This results in a total of 72.77% of annual rainfall that is intercepted, infiltrated and
evaporated. Following is a screenshot from the final report (Refer to Appendix I for detailed
report) that shows the criteria entered for the site to calculate the final results:2

Figure 1: Screenshot of the Site Description that was entered into the SWC model for the National
Stormwater Calculator.2
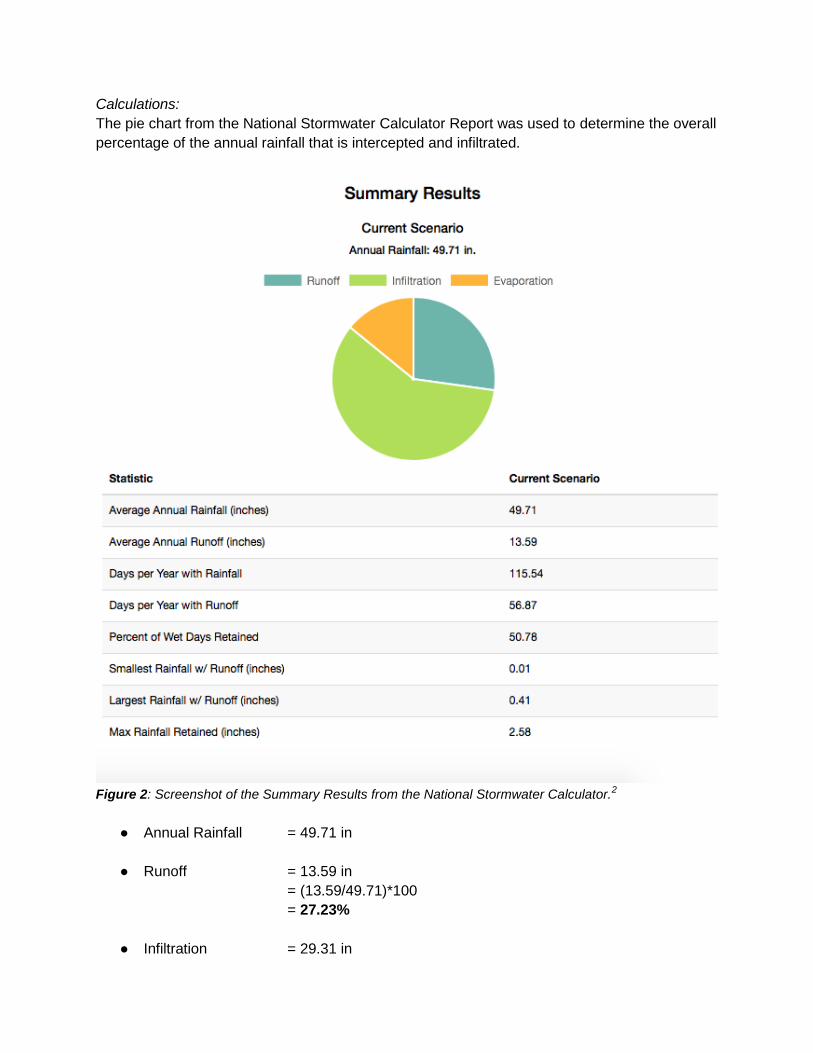
Calculations:
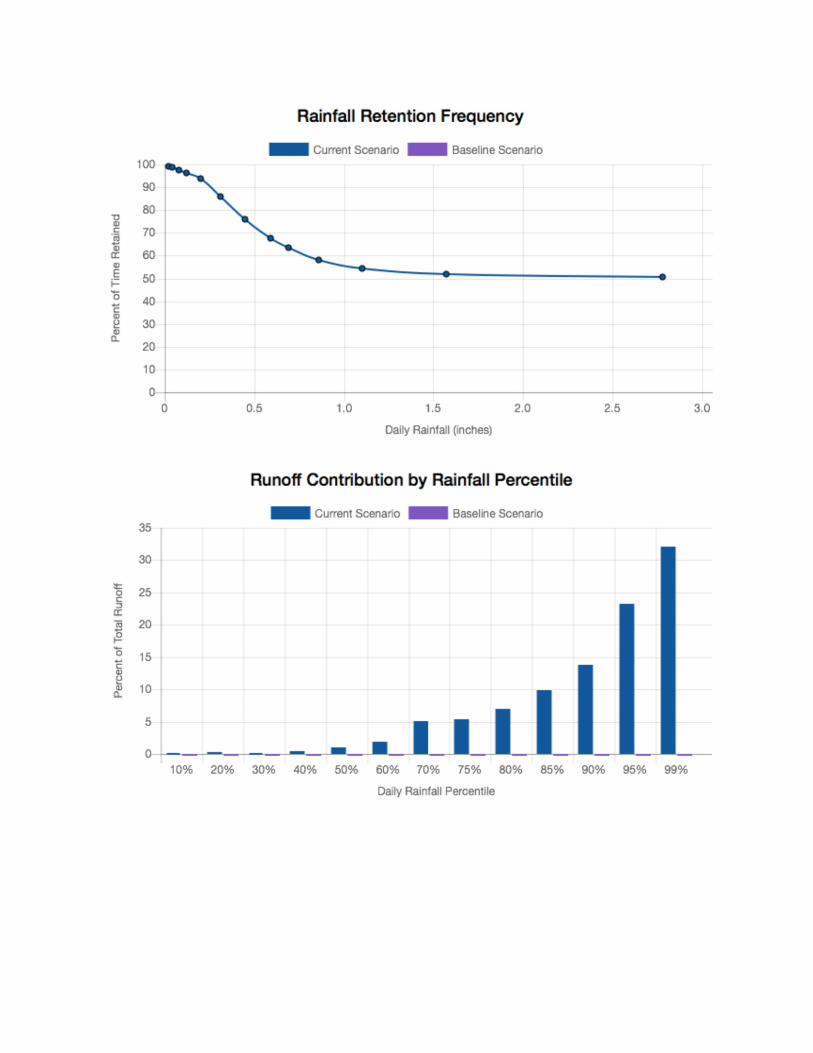
The pie chart from the National Stormwater Calculator Report was used to determine the overall
percentage of the annual rainfall that is intercepted and infiltrated.
Figure 2: Screenshot of the Summary Results from the National Stormwater Calculator.2
● Annual Rainfall = 49.71 in
● Runoff = 13.59 in
= (13.59/49.71)*100
= 27.23%
● Infiltration = 29.31 in
= (29.31/49.71)*100
= 58.61%
● Evaporation = 7.04 in
= (7.04/49.71)*100
= 14.16%
58.61% + 14.16% = 72.77%
Sources: 1 Construction documents and secondary data provided by the consulting firm, SWA group. 2 "National Stormwater Calculator." EPA. May 24, 2018. Accessed May 27, 2018.
https://www.epa.gov/water-research/national-stormwater-calculator.
Limitations:
● The National Stormwater Calculator does not take into account tree canopy interception
of rainfall for the site.
● The SWC tool uses rainfall data (available through the National Weather Service) from
the year 2006, which is not the most recent data available for the site. It would be ideal if
the most recent data from 2007-18 could be entered into the SWC to more accurately
calculate stormwater benefits.
● Water | Flood Protection: Increases flood storage capacity by approximately 557,800
gallons, accommodating up to a 6-ft storm-surge flood event.
Methods:
Since it is a waterfront site, one of the primary goals of the project was flood resiliency. The
29,825-sf central oval lawn was designed to provide temporary water storage in the case of
storm-surge or large tidally influenced flood events.1 It is surrounded by a sloping retaining wall,
reaching 30 inches in height on its highest side. It can detain up to 74,562.50 cf (557,766
gallons) of stormwater during a flood event and because it is graded to slope down to the East
River, it allows the collected water to recede back into the river.3

Figure 3: Site Plan showing the overflow retention strategy for the Oval Lawn.1
The NOAA Sea Level Rise Viewer4 was used to simulate a major 6-ft flood event for New York
City (Fig.4). It was observed that for the Hunter’s Point South Waterfront Park, the oval lawn
contains and prevents the stormwater from this flood event from entering the rest of the site.

Figure 4: Screenshot from NOAA’s Sea Level Rise Viewer for the site for a 6-ft flood event.4
Calculations:
Oval Lawn Area = 29,825 sf1
Height of retaining wall = 30 in1
= 2.5 ft
Volume of the oval lawn = 29,825 x 2.5 cf
= 74,562.50 cf
= 557,766 gallons
Sources: 3 "Hunter's Point South Waterfront Park." MCA Chicago. Accessed May 27, 2018.
http://www.swagroup.com/projects/hunters-point-south-waterfront-park/. 4 "NOAA Logo Sea Level Rise Viewer." NOAA Office for Coastal Management | States and
Territories Working on Ocean and Coastal Management. Accessed June 04, 2018.
https://coast.noaa.gov/slr/#/layer/slr/6/-
8231077.80833016/4975642.320305377/15/dark/none/1/2050/interHigh/midAccretion.

Limitations:
● Based on the shape of the oval lawn, which is not perfectly level and is not surrounded
entirely by the 30-in wall since the wall is sloping towards the East River, the volume for
the Oval Lawn is likely overestimated.
● Carbon, Energy and Air Quality | Energy Use: Generates 37,000 kWh of energy
annually using photovoltaic solar cells, saving a total of $29,600 from 2014 to 2017.
Methods:
The documentation provided by the landscape architect was used to establish energy produced
by the solar panels and the resulting energy savings. The research team referred to the US
Bureau of Labor Statistics5 to obtain energy prices for Queens, NY. Since the park opened in
2013, energy savings for each year since 2014 were determined and added to quantify the
savings for 4 years (2014-2017).
Figure 5: Graph showing the electricity prices for New York- Newark- Jersey City, 2014-2018.5
Calculations:
Energy produced by the solar panels = 37,000 kwh1
Unit price for electricity in 2014 = $0.21/kwh 5
Energy savings for 2014 = unit price x energy produced
= $0.21/kwh x 37000 kwh
= $7,770
Unit price for electricity in 2015 = $0.22/kwh 5
Energy savings for 2015 = unit price x energy produced
= $0.22/kwh x 37000 kwh
= $8,140
Unit price for electricity in 2016 = $0.18/kwh 5
Energy savings for 2016 = unit price x energy produced
= $0.18/kwh x 37000 kwh
= $6,660
Unit price for electricity in 2017 = $0.19/kwh 5
Energy savings for 2017 = unit price x energy produced
= $0.19/kwh x 37000 kwh
= $7,030
Total savings from 2014- 2017 = $(7770 + 8140 + 6660 +
7030)
= $29,600
Sources: 5 "Average Energy Prices, New York-Newark-Jersey City–February 2018 : New York–New
Jersey Information Office." U.S. Bureau of Labor Statistics. March 14, 2018. Accessed June 01,
2018. https://www.bls.gov/regions/new-york-new-jersey/news-
release/averageenergyprices_newyorkarea.htm.
Limitations:
● The data used for the energy produced by the solar panels is secondary data, as
provided by the landscape architects.
● This benefit assumes that all energy generated on-site is used and would otherwise
need to be purchased.
Social Benefits
● Recreational and Social Value: Attracts an estimated 1,170 daily visitors on a typical
June weekday.
● Health and Well-Being: Promotes physical activity for 465 users who engage in
active recreation activities on a typical June weekday.
Methods:
The number of visitors to the site and their activities were observed for one day, Tuesday June
5, 2018, using the People Moving Count 6 Public Life Tool and Stationary Activity Mapping 7
Public Life Tool as developed by the Gehl Institute. One observer from the research team was
stationed at the site at the location marked in the figure below (Fig.6), while the other observer
walked through the park to make their observations. They performed four 30-minute counts at 3-
hour intervals (9am, 12pm, 3pm, 6pm). The observers also took videos during the 30-minute
periods and reviewed them later to minimize human error. The number of people observed from

both counts were combined to estimate the overall number of visitors to the site. The number of
visitors was also cross-checked via drone imagery on the same day. An aerial still was taken by
the drone at the same location showing one section of the park at half-hour intervals from 6am-
10am and 5pm-9pm, resulting in 18 stills. The team also took a drone video fly-through of the
park from end to end, along with three 5-minute drone “hover” video shots at a 30-ft height (one
top-down and two oblique).
The Stationary Activity Mapping’7 Public Life Tool was used to assess the number and extent of
facilities that directly support active and passive recreation. The facilities included the play
areas, basketball courts, the oval lawn, the jogging track, and the urban beach area. The
observed numbers were combined with the observations from ‘People Moving Count’6, which
determined the number of visitors engaging in passive and active recreation activities such as
running/ jogging, walking, dog walking, biking, skating, pushing strollers, etc. (Fig.7).
Figure 6: Site Plan showing the stationary survey location for ‘People Moving Count’ survey.1

Calculations:
Figure 7: Screenshot of overall count for the number of site visitors and types of activity by intensity.
Sources: 6 Gehl Institute. People Moving Count. Accessed May 29, 2018.
https://gehlinstitute.org/tool/people-moving-count/. 7 Gehl Institute. Stationary Activity Mapping. Accessed May 29, 2018.
https://gehlinstitute.org/tool/stationary- activity-mapping/.
Limitations:
● Users were observed for a single day during the month of June, which does not capture
the variation in the number of users (weekend, seasonal, annual, special events,
holidays, etc.).
● Scenic Quality and Views: Creates iconic views of Manhattan as demonstrated by
11,037 social media posts from 2013 to 2018 referring to the Manhattan skyline
and the site.
Methods:
The site has multiple overlook points, along with seating and loungers along the waterfront. This
design provides space for the users to engage and absorb the scenic view of the Manhattan
skyline from their side of the East River. The research team chose to use social media to

quantify this aspect of the project by scanning the following platforms for images of the
Manhattan and/or its skyline taken from Hunter’s Point South.
Tagboard is an online tool that helps find all posts across Flickr, Instagram, Facebook, and
Twitter that have used a specified hashtag or geotag. Using Tagboard8, we found the number
of posts on social media for the following hashtags and geotags:
#licwaterfront
#hunterspointsouthpark
#hunterspointpark
#hunterspointsouth
#LICLanding
#liclandingbycoffeed
Geotag: LIC Landing
The search results of these hashtags were then shortlisted for views of the Manhattan skyline,
and were cross-referenced with the hashtag #manhattan.
Calculations:
Hashtags
1. Facebook : 63 + 81 + 19 + 72 + 84 + 13 + [81] = 413 9
2. Twitter : 13 + 20 + 5 + 16 + 20 + 0 + [19] = 93 10
3. Instagram : 1344 + 2443 + 663 + 1324 + 2113 + 253 + [1205] = 9345 11
4. Flickr : 2 + 422 + 7 +231 + 348 + 176 + [N.A.] = 1186 12
413 + 93 + 9345 + 1186 = 11,037
Sources: 8 https://tagboard.com/, 9 https://www.facebook.com, 10 https://www.instagram.com, 11 https://twitter.com, 12 https://www.flickr.com.
Limitations:
● Social media posts that use more than one hashtag mentioned above for the same post
may have been counted multiple times, thus overestimating the total number of social
media posts.
● Some users also share the same images across multiple social media platforms, which
would also result in overestimating the overall tally.
● There is potential for human error since there is no algorithm to filter through the posts
for the criteria required for this method.
● Transportation: Contributes to an increase in ridership for the East River route of the
New York City Ferry. Annual ridership was roughly estimated to be around 200,000 in
2018, up from 19,055 in 2010.
Methods:
The current East River route of the NYC Ferry, run and operated by Hornblower, connects the
growing residential and business communities along the East River to communities in Midtown
and the Financial District,13 and Hunter’s Point South Waterfront Park connects the ferry landing
and the neighborhood. The Citywide Ferry Study 2013,14 performed by New York City
Economic Development Corporation, was used to obtain the number of riders in 2010.
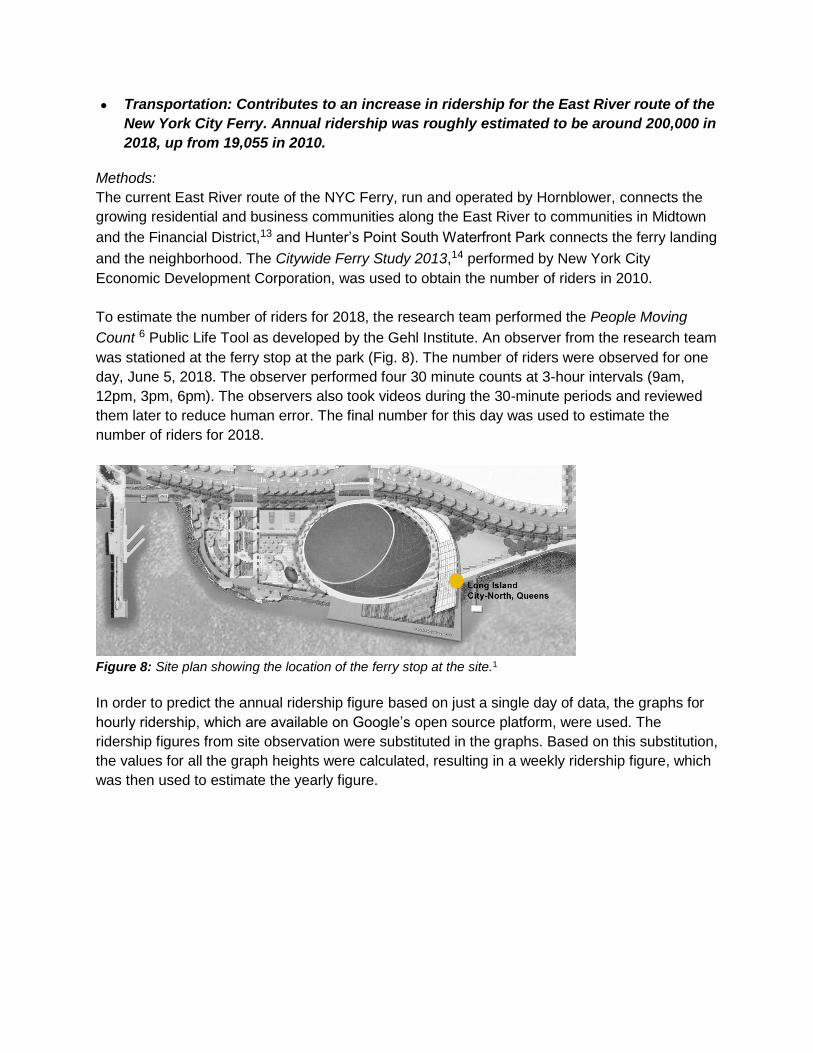
To estimate the number of riders for 2018, the research team performed the People Moving
Count 6 Public Life Tool as developed by the Gehl Institute. An observer from the research team
was stationed at the ferry stop at the park (Fig. 8). The number of riders were observed for one
day, June 5, 2018. The observer performed four 30 minute counts at 3-hour intervals (9am,
12pm, 3pm, 6pm). The observers also took videos during the 30-minute periods and reviewed
them later to reduce human error. The final number for this day was used to estimate the
number of riders for 2018.
Figure 8: Site plan showing the location of the ferry stop at the site.1
In order to predict the annual ridership figure based on just a single day of data, the graphs for
hourly ridership, which are available on Google’s open source platform, were used. The
ridership figures from site observation were substituted in the graphs. Based on this substitution,
the values for all the graph heights were calculated, resulting in a weekly ridership figure, which
was then used to estimate the yearly figure.

Figure 9: Screenshot from the Citywide Ferry Study showing the average number of riders for the year
2010 at ‘Long Island City- North, Queens’ ferry stop.14
Figure 10: Ridership graph for Hunter’s Point South Ferry stop. Google provides such graphs for all
seven days of the week.
Calculations:
Figure 11: Screenshot of the overall tally from the site observation.
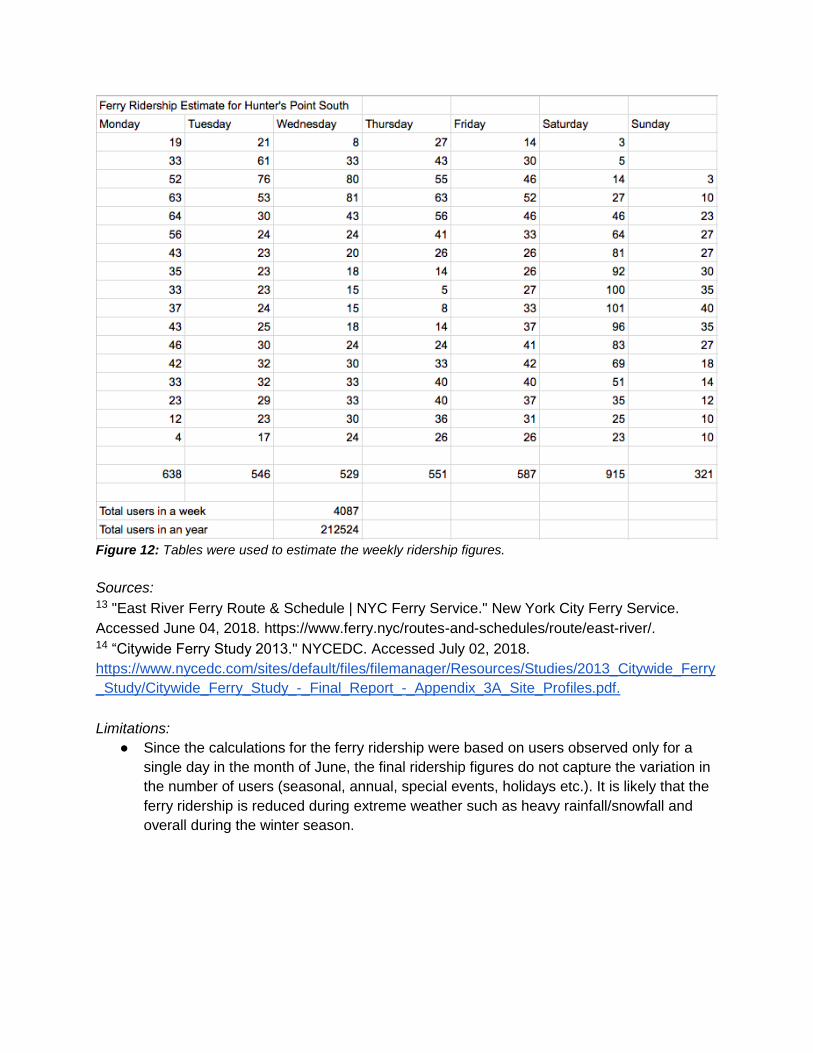
Figure 12: Tables were used to estimate the weekly ridership figures.
Sources: 13 "East River Ferry Route & Schedule | NYC Ferry Service." New York City Ferry Service.
Accessed June 04, 2018. https://www.ferry.nyc/routes-and-schedules/route/east-river/. 14 “Citywide Ferry Study 2013." NYCEDC. Accessed July 02, 2018.
https://www.nycedc.com/sites/default/files/filemanager/Resources/Studies/2013_Citywide_Ferry
_Study/Citywide_Ferry_Study_-_Final_Report_-_Appendix_3A_Site_Profiles.pdf.
Limitations:
● Since the calculations for the ferry ridership were based on users observed only for a
single day in the month of June, the final ridership figures do not capture the variation in
the number of users (seasonal, annual, special events, holidays etc.). It is likely that the
ferry ridership is reduced during extreme weather such as heavy rainfall/snowfall and
overall during the winter season.

Economic Benefits
● Property Value: Contributed to a 49% average increase in assessed property value
for 8 randomly selected parcels within a 3-block radius from 2012 to 2017.
Methods:
Within a 3-block radius of Hunter’s Point South Waterfront Park, 10 plots (Fig.13) were selected
at random and were analyzed to understand the impact of the park on neighboring property
values. The Digital Tax Map published by the New York City Dept. of Finance15 was used to
obtain plot numbers, which were then cross-referenced with property values published by the
City of New York Dept of IT and Telecommunications16 for the year 2011-12, which is right
before the site opened in August 2013, and for the year 2017-18. The percentage increase in
property value for each plot was calculated, the upper and lower outliers removed, and then the
average for these eight plots was used as a final estimate for the change in property values
from 2012 to 2017.
Figure 13: The plots for which the property value rates were observed and compared.15

Calculations:
After removing the upper and lower outliers, 177.1770225% and 6.892123288%, the average
percentage increase in property values for 8 randomly-selected properties within 3 blocks of the
park is: 391.38345/8 = 48.9229312%
Sources: 15 “New York City Dept. of Finance Digital Tax Map." #ReimagineZoLa. Accessed July 02, 2018.
http://gis.nyc.gov/taxmap/map.htm. 16 "NYCProperty Select a BBL." City of New York, Dept of IT and Telecommunications.
Accessed July 02, 2018. https://nycprop.nyc.gov/nycproperty/nynav/jsp/selectbbl.jsp.
Limitations:
● There are several factors that affect the real estate prices. While there is a positive
increase in the property values in the Queens borough for the ten plots, there is no way
to verify the extent to which the Hunter’s Point South Waterfront Park contributed to the
said increase in property value, particularly since property value increases varied so
widely.
Cost Comparison Methods
The synthetic turf in the oval lawn had a higher installation cost of $31.25 per sf, compared to
$3.75 per sf for natural turf installation. However, the maintenance cost for synthetic turf is
projected to be $3,500 total annually, compared to $40,300 total for natural turf. Based on these
projected annual costs, 7 years is the break-even point at which the synthetic turf will begin
saving in maintenance costs, well before it needs to be replaced at 10 years.

Calculations:
Breakeven analysis (Assuming breakeven after Z years)
● Area of the oval lawn = 29,825 sf1
Natural Turf:
● Unit price for the installation of natural turf = $3.75/sf17
● Total installation cost for installing natural turf = $3.75/sf x 29,825 sf
= $195,000 (111,843.75)
● Annual maintenance cost for natural turf = $40,300 18
● Cost of resodding every two years = $195,000
● Cost of resodding over Z years = $195,000 x Z/2
= $97,500 x Z
Synthetic Turf:
● Unit Price for the installation of synthetic turf = $31.25/sf17
● Total installation cost for installing synthetic turf = $31.25/sf x 29,825 sf
= $1,625,000 (932,031.25)
● Annual maintenance Cost for synthetic turf = $3,500 18
● Replacement duration for synthetic turf = 10 years 19
● Turf fabric replacement after Z years = $5/sf 19 x 29,825 sf x Z/10 19
= $26,000 (14,912.5) x Z
For Synthetic Turf:
Cost of initial installation + [Cost of annual maintenance X Z years] + Cost of turf replacement
Life Cycle Cost = 932,031.25 + [3500 x Z] + [14,912.5 x Z]
For Natural Turf:
Cost of initial installation + [Cost of annual maintenance X 20 years] + Cost of resodding
Life Cycle Cost = 111,843.75 + [40,300 x Z] + [97,500 x Z]
Since they break even, the calculated ‘Life Cycle Cost’ values will be the same for Synthetic
Turf and Natural Turf after Z years. To calculate Z,
3,500Z + 14,912.5Z + 932,031.25 = 40,300Z + 97,500Z + 111,843.75
or, 932,031.25 - 111,843.75 = 137,800Z - 18,412.5Z
or, 820,187.5 = 119,387.5Z
or, Z = 820,187.5 / 119,387.5
or, Z = 6.97 years (6 years 10 months)
Sources: 17 2018 Engineer's Estimate for Bid Pricing, New York City Department of Parks and
Recreation.18 "Township of Denville Official Website." City Department. Accessed May 31,
2018. http://www.denvillenj.org/docs/Misc/Artificial_Turf_LifeCycle_Costs.pdf. 19 Dave Wheaton, AstroTurf Representative

Appendix I: National Stormwater Calculator Results for Hunter’s Point South Waterfront
Park- Phase 1