human capital accounting in the united states: context ... · human capital accounting in the...
TRANSCRIPT
Human Capital Accounting in the United States: Context, Measurement, and Application
Michael S. Christian Wisconsin Center for Education Research
July 2011
Abstract This study updates Christian's (2010) human capital account for the United States to the year 2009, refining the underlying data and putting the account into international context by reviewing applications in the rest of the world. It also measures the sensitivity of human capital measures to alternative assumptions about income growth rates, discount rates, the treatment of taxes, smoothing and imputation of labor force and school enrollment data, and the valuation of non-market time. It concludes with an application to the measurement of the output of the education sector. Contact info: Michael Christian, Wisconsin Center for Education Research, 1025 W. Johnson Street, Madison, WI 53706; Tel: (734) 255-1278; E-mail: [email protected]

1
I. Introduction
Research in human capital has experienced a resurgence over the past several
years, with human capital accounts having been produced recently in Australia, Canada,
China, Finland, New Zealand, Norway, Sweden, the United Kingdom, and the United
States. Christian's (2010) account for the United States, using an approach based on that
of Jorgenson and Fraumeni (1989, 1992), measured the human capital stock and human
capital investment in both nominal and real terms over the period between 1994 and
2006. The account broke down net human capital investment among five components:
investment from births, depreciation from deaths, investment from education net of the
aging of enrolled persons, depreciation from the aging of non-enrolled persons, and a
residual component that takes into account both migration and measurement error.
The discussion below adds to the work in Christian (2010) in three ways. First, it
puts the results for the United States in international context by reviewing recent efforts
in human capital around the world. Second, it updates the results to 2009 to reflect both
the availability of new data and improvements to the data set using previously existing
data. Third, it investigates the sensitivity of the results to alternative approaches to
accounting for discounting and income growth, the measurement of taxes, the smoothing
and imputation of data, and the classification of nonmarket activities as production.
A review of recent work finds that most work in human capital has focused on
income-based approaches, particularly approaches based on lifetime income in the vein
of Jorgenson and Fraumeni (1989, 1992). Using a lifetime income approach and
assuming an income growth rate of 2 percent and a discount rate of 4 percent, the human
capital stock of the United States in 2009 was equal to about three quarters of a

2
quadrillion dollars, split between market and non-market components by a ratio of about
one third to two thirds. Net investment in human capital from education, net of the aging
of persons enrolled in school, was equal to $7.0 trillion, split about evenly between its
market and nonmarket components. The market component alone, equal to $3.7 trillion,
is larger than the size of the education sector in the U.S. national accounts by a factor of
about four. While levels of human capital often change substantively with changes in the
assumptions of the model, real growth in net investment in education, equal to 1.6
percent per year across both the market and nonmarket components, is quite robust to
changes in the income growth rate, the discount rate, the treatment of taxes, the approach
to smoothing and imputation, and the definition of nonmarket work.
II. Recent Efforts in the Measurement of Human Capital
Le et al (2003) identifies three major approaches to measuring human capital: the
cost-based approach, the income-based approach, and the educational-stock-based or
indicators approach. This distinction has sufficient currency that it also appears in Liu
and Greaker (2009), Gu and Wong (2010a), Li et al (2010), and Jones and Chiripanhura
(2010). The indicators approach is the simplest; it uses an indicator or combination of
indicators, such as years of schooling or the rate of literacy, to measure a country's human
capital. The cost-based approach values the human capital stock at the cost of producing
it. A frequently cited text on the cost-based method is Kendrick (1976), which measures
human investment using the cost of rearing children, educating people, and other human-
capital-related activities. A recent application of the cost-based approach is Kokkinen
(2008), which estimates human capital in Finland.
3
The income-based approach values the human capital stock using the earnings of
the persons in that stock. Jorgenson and Fraumeni (1989, 1992), which measure human
capital using lifetime incomes in present discounted value, are seminal applications of the
income-based approach. The income-based approach has been the most popular
approach in recent applications, having recently been employed to create human capital
measures for China (Li et al, 2010), the United States (Christian, 2010), the United
Kingdom (Jones and Chiripanhura, 2010), Canada (Gu and Wong, 2010a), Australia
(Wei, 2004, 2008), New Zealand (Le et al, 2006), Sweden (Ahlroth et al, 1997), and
Norway (Liu and Greaker, 2009). The income-based approach is also being used for the
human capital project at OECD, which aims to produce human capital accounts across
eighteen countries for international comparisons (Mira and Liu, 2010). Abraham (2010)
identifies the cost-based approach and the income-based approach as analogous to the
income and production sides of a national income and product account but notes that,
unlike the two sides of a national income and product account, cost-based and income-
based human capital accounts should not necessarily lead to identical results.
Many implementations of the income-based approach limit the data set to the
working-age population, to persons in the labor force, or to employed persons only. This
limitation is described in Jones and Chiripanhura (2010) as "consistent with the OECD's
guidance on the measurement of physical capital which states that, 'be counted as part of
the capital stock all that is required is that assets are present at production sites and
capable of being used in production or that they are available for renting by their owners
to producers'." A human capital measure that is limited to the working-age population is
denoted in Li et al's (2010) paper on China as "active human capital", since it is the
4
human capital of people who are active in the labor force. Active human capital is
measured in Gu and Wong's (2010a) study of Canada (working-age population), Le et
al's (2006) study of New Zealand (employed persons), Jones and Chiripanhura's (2010)
study of the United Kingdom (employed persons), and Liu and Greaker's (2009) study of
Norway (persons in the labor force). Wei's (2004) account for Australia presents results
for both the working-age population as a whole and for people in the labor force only,
and finds that the human capital stock for people in the labor force is about 80 percent the
size of the human capital stock for the entire working-age population. Christian's (2010)
paper on the United States, Ahlroth et al's (1997) paper about Sweden, and Li et al's
(2010) paper on China include results for the entire populations of the countries studied.
Most recent work focuses on the market component of human capital, which,
under the income approach, is the component of human capital that is attributable to the
value of a population's market work. The other component of human capital in Jorgenson
and Fraumeni (1989, 1992), the nonmarket component, is attributable to the value of a
population's nonmarket time. In some applications, the non-market component is
excluded, sometimes purposefully under the premise that the market component alone is
the preferable measure of human capital. For example, Le et al's (2006) paper about New
Zealand states that "assuming equal value between a full-time worker and a non-
participant is not justifiable, from an economic point of view." (See also Ervik et al,
2003; and Gu and Wong, 2010a.) Non-market human capital is included in Christian's
(2010) paper about the United States and Ahlroth et al's (1997) paper about Sweden.
Education is measured in the Jorgenson-Fraumeni approach using the number of
years of education received. In the original Jorgenson and Fraumeni (1989, 1992) papers,
5
people were classified as having between 0 and 18 years of education. This approach
was particularly well-suited for the demographic data available in U.S. Census data at the
time, which measured education levels in the U.S. population in the same way. Most of
the more recent work in human capital outside of the United States, however, has used
data that measures education levels using qualifications earned (perhaps in part because
of the existence of multiple educational tracks), and it is typically the case that these
qualifications require more than a year to complete. As a result, many researchers
outside the United States have adapted the Jorgenson-Fraumeni method to accommodate
the circumstances in the country in which human capital is being measured. For
example, Wei's (2004, 2008) account for Australia classifies people into four educational
qualification groups: unqualified, skilled labor, bachelor degree, and higher degree. In
the United States, the Census education variables changed in 1992 from individual years
to degrees earned, although it is possible to recover individual years from the basic
Current Population Survey starting in 1997 (see Jaeger, 1997, 2003). Christian's (2010)
study of human capital in the United States imputed individual years of education.
One interesting difference that appears among studies is in approaches to
deflating the stock of human capital over time to make comparisons across time possible.
In some cases, the human capital stock is deflated using a consumer or labor price index
(Wei, 2004, 2008). Under this approach, changes in lifetime incomes relative to changes
in prices remain after deflation. If human capital accounts purport to measure human
capital stocks and investments as quantities, this approach implies that changes in real
lifetime incomes reflect changes in the quality of human capital within age, sex, and
education levels. In other cases, the human capital stock is deflated using prices for
6
human capital itself, eliminating changes in lifetime incomes and leaving a quantity index
based entirely on the number and distribution of persons by age, sex, and education (Gu
and Wong, 2010a; Christian, 2010). The quality of human capital within age, sex, and
education level is implicitly presumed to be constant over time.
Several different approaches to disaggregating changes in the quantity of human
capital from one year to the next into investment and depreciation are employed. Wei's
(2008) disaggregation for Australia is especially novel, identifying (among several other
things) human capital formation from post-school education and on-the-job investment,
as well as depreciation of human capital formed by post-school education and on-the-job
investment. Many human capital studies focus entirely on the stock of human capital and
do not attempt to measure investment or depreciation.
Human capital accounting has particularly interesting applications for the
measurement of the education sector. This application is specifically mentioned in the
Atkinson (2005) report, which sets an agenda for measurement in the United Kingdom.
Ervik et al (2003) is an interesting application of human capital in that it focuses on the
output of the education sector, to the extent that it does not present a measure the stock of
human capital. The authors find that the higher education sector in Norway is more than
seven times larger when measured using the Jorgenson-Fraumeni methodology for
human capital investment than when measured as it was in the Norwegian national
accounts. Christian (2010) similarly finds very large values for investment in education
in the United States. In contrast, Ahlroth et al (1997) find measures of investment in
education in Sweden that are often smaller than those measured in the Swedish national
accounts.

7
Several applications of the income-based approach to human capital use measures
of income other than lifetime income to value human capital. Haveman et al (2003) uses
a measure of human capital denoted "earnings capacity", which measures the value of the
human capital stock as the expected income in a single year of all working-age persons in
an economy if all persons worked full-year full-time. Earnings capacity is a measure of
the potential annual rental value of human capital, in contrast to the asset value measured
by the Jorgenson-Fraumeni approach. Since earnings capacity is based on current
income (or, more accurately, potential current income, were persons working full-time
full-year) rather than lifetime income, it does not require assumptions about the discount
rate or income growth rate to produce. O'Mahony and Stevens (2009) present a measure
of the output of the education sector that aggregates enrollments across multiple levels of
education using a weight based on the effects on earnings from completing each level of
education.
III. Updated Measures for the United States
Updates of the human capital measures for the United States presented in
Christian (2010) are presented in Table 1 below for 2009 and for the each year between
1998 and 2009 in the Appendix. The update introduces results for three more recent
years (2007, 2008, and 2009), and also incorporates changes to the data set since
Christian (2010). Both the account in Christian (2010) and this updated human capital
account measure human capital by applying a method broadly similar to the Jorgenson-
Fraumeni approach. The data set from which the account is produced uses the October
school enrollment supplements to the Current Population Survey (CPS) to measure
population and school enrollment, the March demographic supplements to the CPS to
8
measure wages and hours worked, and the life tables of the Centers for Disease Control
to measure survival rates. The account includes all persons, whether working-age or not,
with age topcoded at 80 and years of education topcoded at 18. When measuring lifetime
incomes in present discounted value, an annual income growth rate of 2 percent and a
discount rate of 4 percent is used. Measures of real growth are measured using quantity
indexes of the population by age, sex, and education; consequently, all real growth
measures are determined entirely by changes in the size and distribution of the population
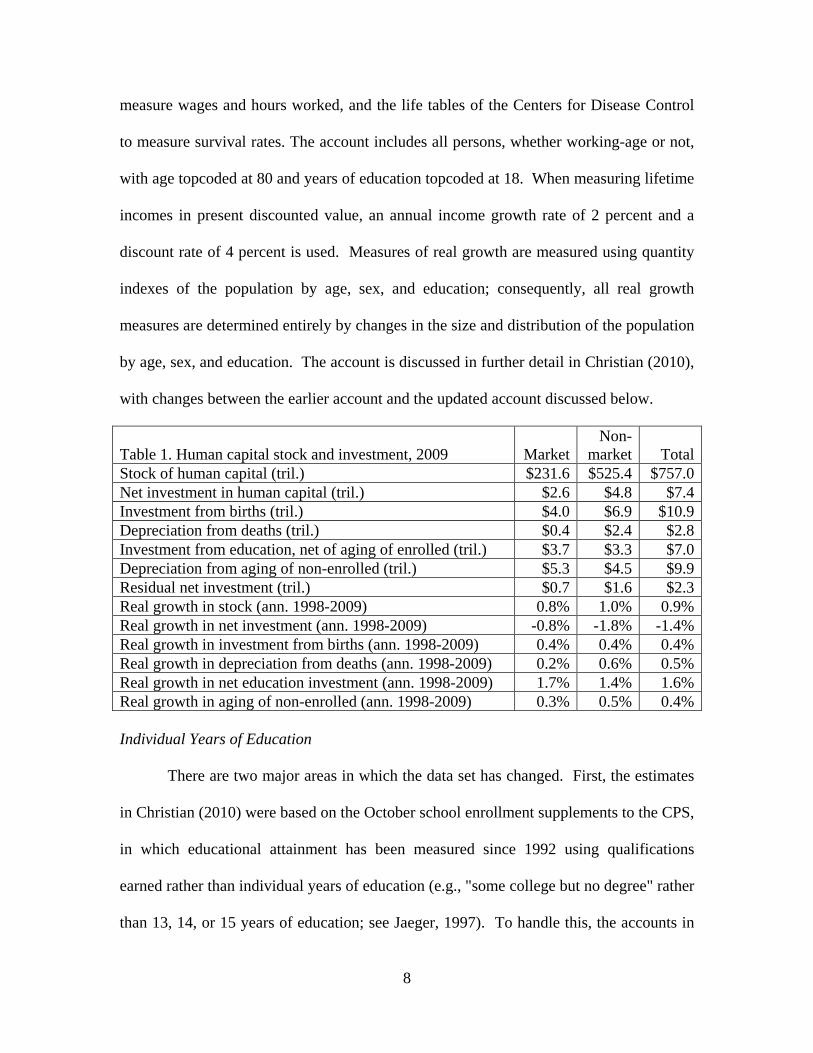
by age, sex, and education. The account is discussed in further detail in Christian (2010),
with changes between the earlier account and the updated account discussed below.
Table 1. Human capital stock and investment, 2009 Market Non-
market Total Stock of human capital (tril.) $231.6 $525.4 $757.0 Net investment in human capital (tril.) $2.6 $4.8 $7.4 Investment from births (tril.) $4.0 $6.9 $10.9 Depreciation from deaths (tril.) $0.4 $2.4 $2.8 Investment from education, net of aging of enrolled (tril.) $3.7 $3.3 $7.0 Depreciation from aging of non-enrolled (tril.) $5.3 $4.5 $9.9 Residual net investment (tril.) $0.7 $1.6 $2.3 Real growth in stock (ann. 1998-2009) 0.8% 1.0% 0.9% Real growth in net investment (ann. 1998-2009) -0.8% -1.8% -1.4% Real growth in investment from births (ann. 1998-2009) 0.4% 0.4% 0.4% Real growth in depreciation from deaths (ann. 1998-2009) 0.2% 0.6% 0.5% Real growth in net education investment (ann. 1998-2009) 1.7% 1.4% 1.6% Real growth in aging of non-enrolled (ann. 1998-2009) 0.3% 0.5% 0.4% Individual Years of Education
There are two major areas in which the data set has changed. First, the estimates
in Christian (2010) were based on the October school enrollment supplements to the CPS,
in which educational attainment has been measured since 1992 using qualifications
earned rather than individual years of education (e.g., "some college but no degree" rather
than 13, 14, or 15 years of education; see Jaeger, 1997). To handle this, the accounts in
9
Christian (2010) drew from, among other sources, lagged enrollments to impute the
distribution of the population by individual years of education. The updated account
recovers individual years of education by merging data from the publicly available basic
CPS files, which since 1998 have included additional education questions from which
variables that measure individual years of education can be created (Jaeger, 2003).
Because these variables are unavailable before 1998, the updated account only goes as far
back as then. A human capital account for the United States that uses the Current
Population Survey that includes the years 1992 (the first year of the switch from
individual years of education to qualifications earned) through 1997 (the last year before
the new education questions were added to the publicly available basic CPS) will still
require imputation or adaptation to account for the absence of individual years of
education.
One useful aspect of being able to measure individual years of education at the
person level is that all of the variables used to measure human capital--wages, the
employment rate, hours worked, school enrollment, etc.--can vary by the individual year
of education organically within the sample. In contrast, the imputations used in Christian
(2010) made assumptions that limited that variability. In particular, the wage rate for any
age and sex only varied across five broad educational groups--no high school diploma,
high school diploma, some college, college degree, and advanced degree. One concern
noted in Christian (2010) was that this might have led to inflated values of gross
investment in education. The reasoning was that each year of education completed took
on an immense gross investment value because, for many students, not completing a year
of education meant falling behind the typical age-education progression (finishing high
10
school at age 18, college at age 22, etc.), which in turn substantially reduced the
likelihood that one would finish a diploma or degree down the road. Since the
imputations only put direct wage gains in the data set when one completes a diploma or
degree, the gross investment value of each year of education would be inflated by not
allowing for direct wage gains from the intermediate years of education in between.
Indeed, gross investment in education measured in Christian (2010) was immense; the
market component was $16.4 trillion in 2005. For this reason, Christian (2010) measured
investment in education net of the aging of persons enrolled in school; since this
measured the value of moving along the age-education progression rather than the value
of not falling behind it, the results were of a more plausible magnitude. Interestingly,
allowing wages to vary by individual year of education, as the new data set does by
measuring individual year of education at the person level, does not seem to have
alleviated the problem. In the new data set, gross investment in education remains very
large, with a market component of $15.6 trillion in 2005. Given this magnitude, most of
the discussion of education that follows will, like Christian (2010), focus on investment
in education net of aging.
The Treatment of Taxes
Second, the estimates in Christian (2010) used the federal marginal tax rate
variable in the CPS to compute the post-tax wage used to value nonmarket time. The
updated estimates compute the post-tax wage using federal and state marginal tax rates
from the Internet version (v9) of TAXSIM (Feenberg and Coutts, 1993,
http://www.nber.org/taxsim/). The post-tax wage only affects measures of the non-
market component of human capital; the market component of human capital is measured

11
using pre-tax wages to reflect the marginal return to labor received both by the workers
themselves and by the government.
Table 2 presents selected human capital results for the non-market sector for 2009
using the CPS federal marginal tax rate variable, the federal marginal tax rate computed
from TAXSIM, and federal and state marginal tax rates computed from TAXSIM. In all
three of these cases, marginal tax rates are computed at the individual level: a separate tax
rate is computed for each person in the sample used to compute human capital. A fourth
set of human capital results are presented for 2009 using an average federal and state
marginal tax rate that applies to all persons in a given year (published at the TAXSIM
web site at http://www.nber.org/~taxsim/marginal-tax-rates/at.html). The fourth
approach, unlike the previous three, eliminates progressivity in marginal tax rates. Only
the non-market component is presented because the market component is unaffected by
the choice of tax rate.
Table 2. Nonmarket human capital, 2009 CPS TAXSIM
fed only TAXSIM fed+state
Average fed+state
Stock of human capital $557.1 $550.4 $525.4 $515.7 Net investment in human capital $5.2 $5.1 $4.8 $5.1 Investment from births $7.3 $7.2 $6.9 $6.8 Depreciation from deaths $2.4 $2.5 $2.4 $2.2 Investment from education, net of aging $3.7 $3.5 $3.3 $3.9 Depreciation from aging of non-enrolled $5.0 $4.8 $4.5 $4.9 Residual net investment $1.7 $1.6 $1.6 $1.5 Real growth in stock 1.0% 1.0% 1.0% 1.0% Real growth in net investment -1.9% -1.8% -1.8% -1.6% Real growth in investment from births 0.4% 0.4% 0.4% 0.4% Real growth in depreciation from deaths 0.6% 0.6% 0.6% 0.7% Real growth in net education investment 1.5% 1.5% 1.4% 1.6% Real growth in aging of non-enrolled 0.4% 0.5% 0.5% 0.3% The inclusion of state taxes has a modest negative effect on nominal measures of
nonmarket human capital. When the TAXSIM model is used, including state taxes as
12
well as federal taxes reduces the nonmarket stock of human capital by 5 percent,
nonmarket net investment in human capital by 5 percent, and nonmarket net investment
in education by 7 percent. The disproportionately large effect on investment in education
is likely a result of state taxes adding to the progressivity of the tax structure in the data
set; as taxes become more progressive, the post-tax wage return to education drops. In
contrast, the inclusion of state taxes has only small effects on growth rates of real
measures of nonmarket human capital.
Larger distortions take place when the progressivity of marginal taxes is ignored
entirely and a single average marginal tax rate is applied to everyone. While the nominal
human capital stock is for the most part unaffected, nominal measures of investment
change more substantively. Total nonmarket net investment is 6 percent higher and, of
particular interest, nonmarket net investment in education is 18 percent higher. Real
growth rates in investment are also changed by the use of a flat marginal tax rate, with the
rate of growth in total net investment higher by 0.2 percentage points and the rate of
growth in net investment in education higher by (after rounding) 0.1 percentage points
per year.
IV. Discount and Income Growth Rates
The Jorgenson-Fraumeni approach to measuring human capital requires
specifying an income growth rate (for projecting future annual incomes from current
annual incomes) and a discount rate (for aggregating current and future annual incomes
into lifetime incomes in present discount value). The income growth rate of 2 percent
and discount rate of 4 percent used in Christian (2010) and in the account presented here
13
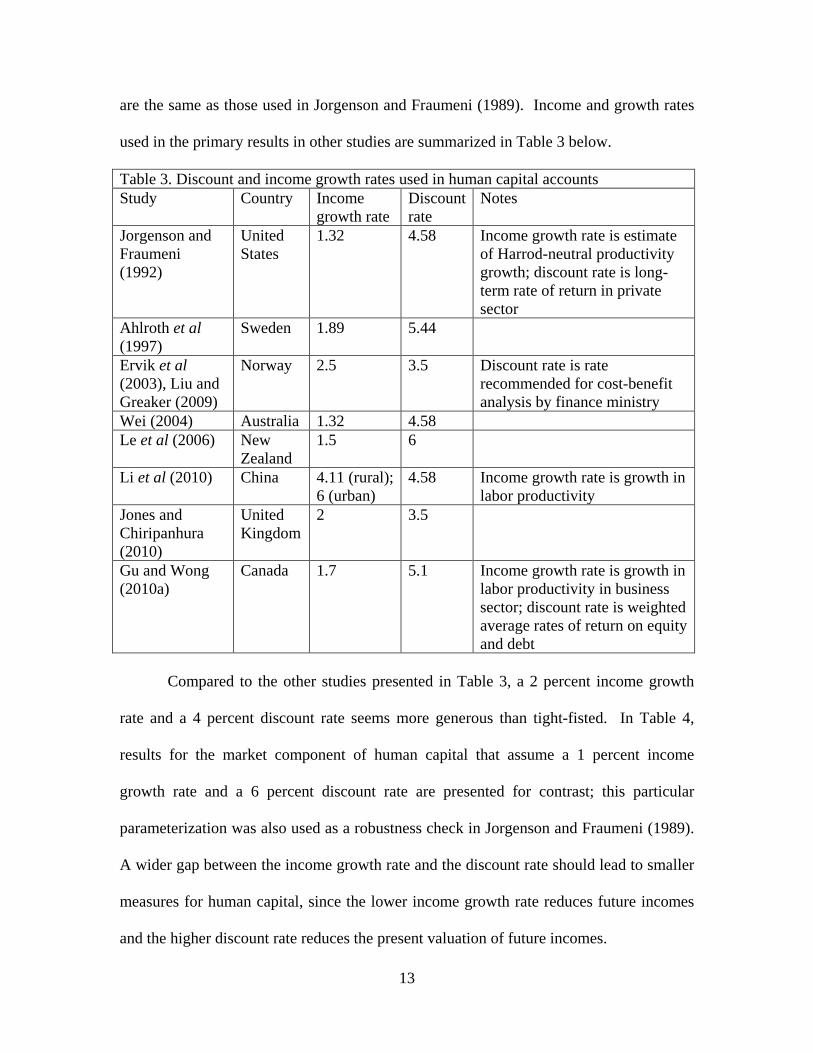
are the same as those used in Jorgenson and Fraumeni (1989). Income and growth rates
used in the primary results in other studies are summarized in Table 3 below.
Table 3. Discount and income growth rates used in human capital accounts Study Country Income
growth rate Discount rate
Notes
Jorgenson and Fraumeni (1992)
United States
1.32 4.58 Income growth rate is estimate of Harrod-neutral productivity growth; discount rate is long-term rate of return in private sector
Ahlroth et al (1997)
Sweden 1.89 5.44
Ervik et al (2003), Liu and Greaker (2009)
Norway 2.5 3.5 Discount rate is rate recommended for cost-benefit analysis by finance ministry
Wei (2004) Australia 1.32 4.58 Le et al (2006) New
Zealand 1.5 6
Li et al (2010) China 4.11 (rural); 6 (urban)
4.58 Income growth rate is growth in labor productivity
Jones and Chiripanhura (2010)
United Kingdom
2 3.5
Gu and Wong (2010a)
Canada 1.7 5.1 Income growth rate is growth in labor productivity in business sector; discount rate is weighted average rates of return on equity and debt
Compared to the other studies presented in Table 3, a 2 percent income growth
rate and a 4 percent discount rate seems more generous than tight-fisted. In Table 4,
results for the market component of human capital that assume a 1 percent income
growth rate and a 6 percent discount rate are presented for contrast; this particular
parameterization was also used as a robustness check in Jorgenson and Fraumeni (1989).
A wider gap between the income growth rate and the discount rate should lead to smaller
measures for human capital, since the lower income growth rate reduces future incomes
and the higher discount rate reduces the present valuation of future incomes.
14
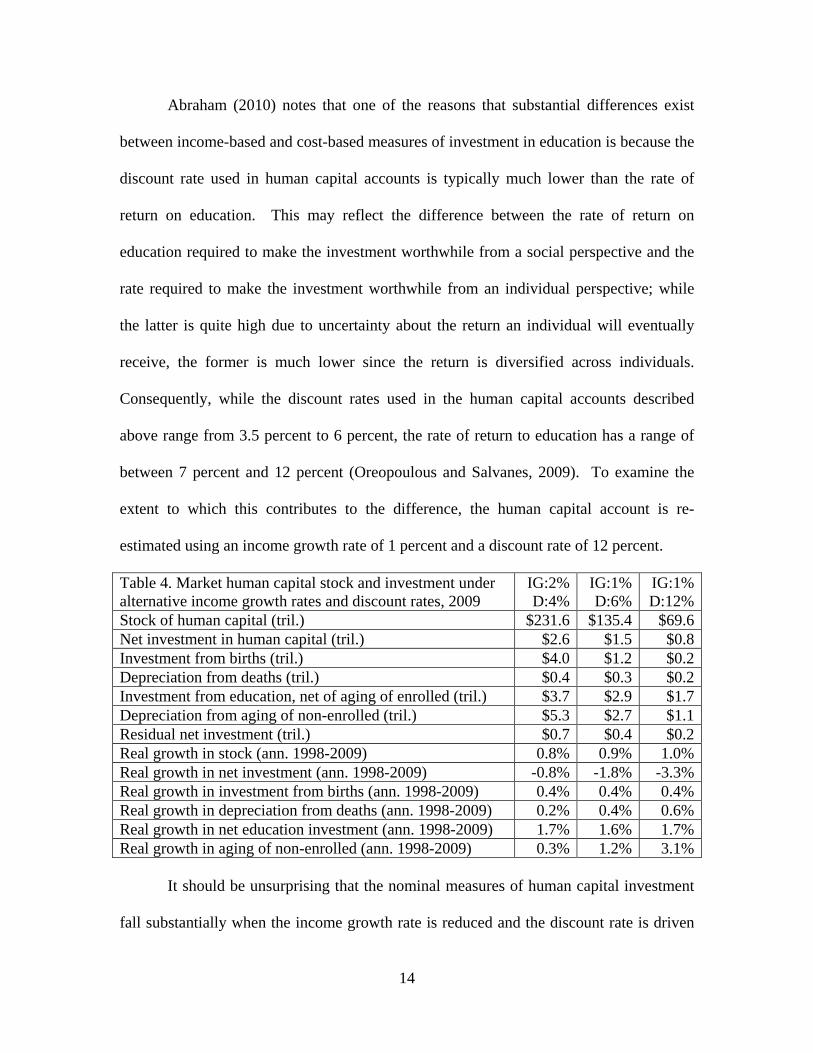
Abraham (2010) notes that one of the reasons that substantial differences exist
between income-based and cost-based measures of investment in education is because the
discount rate used in human capital accounts is typically much lower than the rate of
return on education. This may reflect the difference between the rate of return on
education required to make the investment worthwhile from a social perspective and the
rate required to make the investment worthwhile from an individual perspective; while
the latter is quite high due to uncertainty about the return an individual will eventually
receive, the former is much lower since the return is diversified across individuals.
Consequently, while the discount rates used in the human capital accounts described
above range from 3.5 percent to 6 percent, the rate of return to education has a range of
between 7 percent and 12 percent (Oreopoulous and Salvanes, 2009). To examine the
extent to which this contributes to the difference, the human capital account is re-
estimated using an income growth rate of 1 percent and a discount rate of 12 percent.
Table 4. Market human capital stock and investment under alternative income growth rates and discount rates, 2009
IG:2% D:4%
IG:1% D:6%
IG:1% D:12%
Stock of human capital (tril.) $231.6 $135.4 $69.6 Net investment in human capital (tril.) $2.6 $1.5 $0.8 Investment from births (tril.) $4.0 $1.2 $0.2 Depreciation from deaths (tril.) $0.4 $0.3 $0.2 Investment from education, net of aging of enrolled (tril.) $3.7 $2.9 $1.7 Depreciation from aging of non-enrolled (tril.) $5.3 $2.7 $1.1 Residual net investment (tril.) $0.7 $0.4 $0.2 Real growth in stock (ann. 1998-2009) 0.8% 0.9% 1.0% Real growth in net investment (ann. 1998-2009) -0.8% -1.8% -3.3% Real growth in investment from births (ann. 1998-2009) 0.4% 0.4% 0.4% Real growth in depreciation from deaths (ann. 1998-2009) 0.2% 0.4% 0.6% Real growth in net education investment (ann. 1998-2009) 1.7% 1.6% 1.7% Real growth in aging of non-enrolled (ann. 1998-2009) 0.3% 1.2% 3.1% It should be unsurprising that the nominal measures of human capital investment
fall substantially when the income growth rate is reduced and the discount rate is driven
15
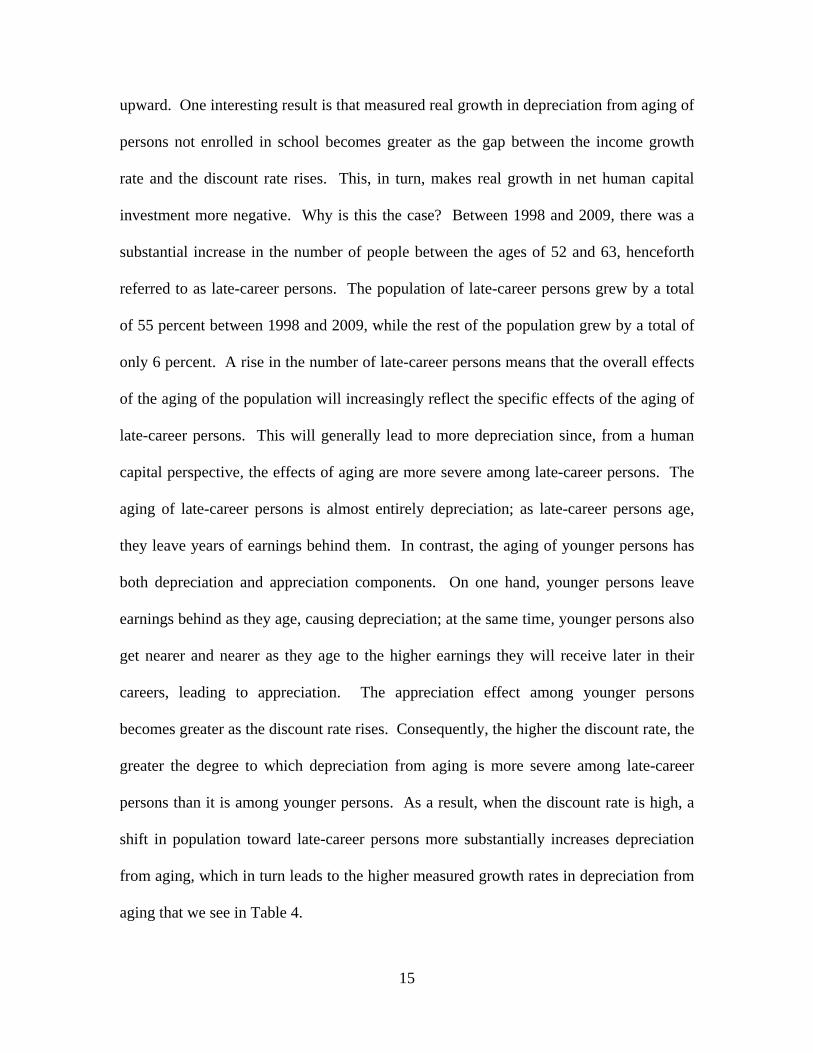
upward. One interesting result is that measured real growth in depreciation from aging of
persons not enrolled in school becomes greater as the gap between the income growth
rate and the discount rate rises. This, in turn, makes real growth in net human capital
investment more negative. Why is this the case? Between 1998 and 2009, there was a
substantial increase in the number of people between the ages of 52 and 63, henceforth
referred to as late-career persons. The population of late-career persons grew by a total
of 55 percent between 1998 and 2009, while the rest of the population grew by a total of
only 6 percent. A rise in the number of late-career persons means that the overall effects
of the aging of the population will increasingly reflect the specific effects of the aging of
late-career persons. This will generally lead to more depreciation since, from a human
capital perspective, the effects of aging are more severe among late-career persons. The
aging of late-career persons is almost entirely depreciation; as late-career persons age,
they leave years of earnings behind them. In contrast, the aging of younger persons has
both depreciation and appreciation components. On one hand, younger persons leave
earnings behind as they age, causing depreciation; at the same time, younger persons also
get nearer and nearer as they age to the higher earnings they will receive later in their
careers, leading to appreciation. The appreciation effect among younger persons
becomes greater as the discount rate rises. Consequently, the higher the discount rate, the
greater the degree to which depreciation from aging is more severe among late-career
persons than it is among younger persons. As a result, when the discount rate is high, a
shift in population toward late-career persons more substantially increases depreciation
from aging, which in turn leads to the higher measured growth rates in depreciation from
aging that we see in Table 4.
16
It is also interesting to note that even in the case where the income growth rate is
set to 1 percent and the discount rate is set to 12 percent, the market component of net
investment in education is equal to $1.7 trillion, which is still nearly twice the size of the
$909 billion education sector measured in the cost-based National Income and Product
Accounts.1 Does this suggest that persons are receiving a substantial surplus from
education? On the income side, while investment in the education sector net of aging is
used in this account because it is easy to compute and because it relies on fewer
counterfactual assumptions, a measure of gross investment in education that does not
include the effects of aging while in school is what ultimately ought to drive personal
decisions about education. This is because people will age regardless of whether they
attend school or not; consequently, the decision to pursue education should be neutral to
the effects of aging. Under traditional assumptions, gross investment in education is very
large (even when the income growth rate is 1 percent and the discount rate is 12 percent,
its market component is equal to $3.1 trillion), but this is primarily because the traditional
model assumes that students who miss a year of education fall "off track" and face a
much lower probability of completing diplomas and degrees down the road. In contrast,
gross investment in education is more modest when one assumes that students who
attended school would not have fallen "off track" had they missed a year of education,
and instead would have enrolled in school a year later with the same probabilities as a
year before. Under this counterfactual, explained in more detail in Christian (2010), the
market component of gross investment in education is $1.18 trillion when the income
1 Author's calculation from the National Income and Product Accounts, adding personal consumption expenditures on education services ($223 billion, from table 2.4.5) to government consumption expenditures on education ($686 billion, from table 3.17).
17
growth rate is 1 percent and the discount rate is 12 percent.2 However, the government
claims a substantial part of the return to this investment in taxes. After accounting for
taxes by adjusting the wage rate with an average tax rate and re-estimating human capital,
the market component of gross investment in education drops to $979 billion. Since the
return to education is not enjoyed until a year later, this amount ought to be multiplied by
1.01 and divided by 1.12 to account for income growth and discounting; this further
reduces the amount to $883 billion.
On the cost side, the cost to persons (as opposed to governments) of education
includes both direct costs and foregone earnings. The direct costs of education to persons
were $223 billion in 2009 while, using the data in the human capital account, the
opportunity cost of time spent in school was $377 billion. Adding the direct cost and
time cost together yields a total personal cost of $600 billion, which, even at a very high
discount rate, is substantially less than the $883 billion personal return to education.
Even at these very high discount rates, the personal return to education is about half again
as much as the personal cost.
It is useful to note that the above computation includes both elementary and
secondary education as well as higher education. Elementary and secondary education is
an interesting case, especially from the cost side, since much of it is compulsory, free of
direct cost, and attended by students who (at least in this account) are too young to have
an opportunity cost of time. Higher education, by contrast, is more characteristic of an
economic decision. Applying the above computations to higher education alone yields a
personal return of $440 billion (computed from a $648 billion pretax gross investment,
2 This is smaller than investment net of aging because, in this particular case, depreciation due to aging is negative, likely because of the cases of children and young adults, who come closer to their prime earning adult ages as they get older.
18
adjusted after taxes to $488 billion, multiplied by 1.01 and divided by 1.12). The time
cost to persons of higher education was $217 billion and the direct cost was $146 billion,
combining to a total cost of $363 billion.3 Comparison of the return and cost estimates
suggests that the personal return to higher education is a little more than 20 percent
greater than the personal cost, which in turn suggests that individuals receive a substantial
surplus from education, even when the parameterization is conservative.
V. Smoothing and Imputation
The human capital model for Sweden produced by Ahlroth et al (1997) was
created from an annual survey of about 6,000. This sample is too small to estimate
realistic means of wages, hours worked, school enrollment, and other variables for each
age, sex, and education cell in the human capital data set; given there are 61 age groups, 2
sexes, and 18 levels of education in their model, there are up to 2,196 cells to fill. To fill
these cells, the authors specified wages, probability of employment, hours spent at work
conditional on employment, and probability of school enrollment as regression functions
of sex, age, education, age squared, education squared, age times education, and age
squared times education squared. The authors then estimated these regressions over their
person-level sample (with log wages and hours spent at work as linear regressions and
probabilities of employment and enrollment as logistic regressions) and used the
estimated regression coefficients to impute values for these variables to each cell. These
imputations make measuring human capital possible even with a small sample.
There are few problems from small samples in the United States, where the
Current Population Survey regularly interviews more than 100,000 persons each month.
However, an approach that imputes the variables used to build human capital using a 3 Direct cost is measured from the National Income and Product Accounts, table 2.4.5.
19
regression equation with age and education on the right-hand side has some interesting
qualities. In particular, it smooths wages, hours, earnings, and enrollment, reducing
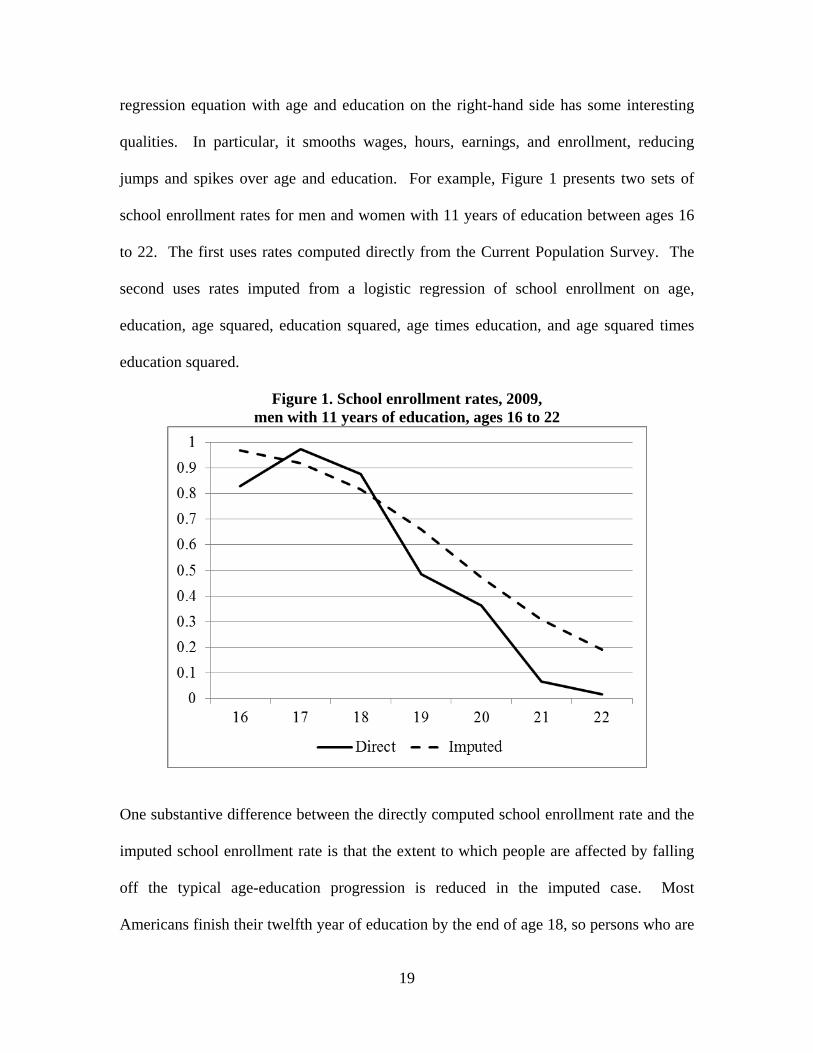
jumps and spikes over age and education. For example, Figure 1 presents two sets of
school enrollment rates for men and women with 11 years of education between ages 16
to 22. The first uses rates computed directly from the Current Population Survey. The
second uses rates imputed from a logistic regression of school enrollment on age,
education, age squared, education squared, age times education, and age squared times
education squared.
Figure 1. School enrollment rates, 2009, men with 11 years of education, ages 16 to 22
One substantive difference between the directly computed school enrollment rate and the
imputed school enrollment rate is that the extent to which people are affected by falling
off the typical age-education progression is reduced in the imputed case. Most
Americans finish their twelfth year of education by the end of age 18, so persons who are
20
19 years old but who have only finished 11 years of education have fallen off track. In
the directly computed case, a man with 11 years of education faces a serious drop in the
probability of continuing further education upon reaching age 19, with school enrollment
rates dropping from 88 percent to 49 percent. However, in the imputed case, the school
enrollment rate drops from 82 percent to 66 percent. This is still a substantial drop, but
from the perspective of years of education ultimately completed, the implication of
missing a year of school is smaller.
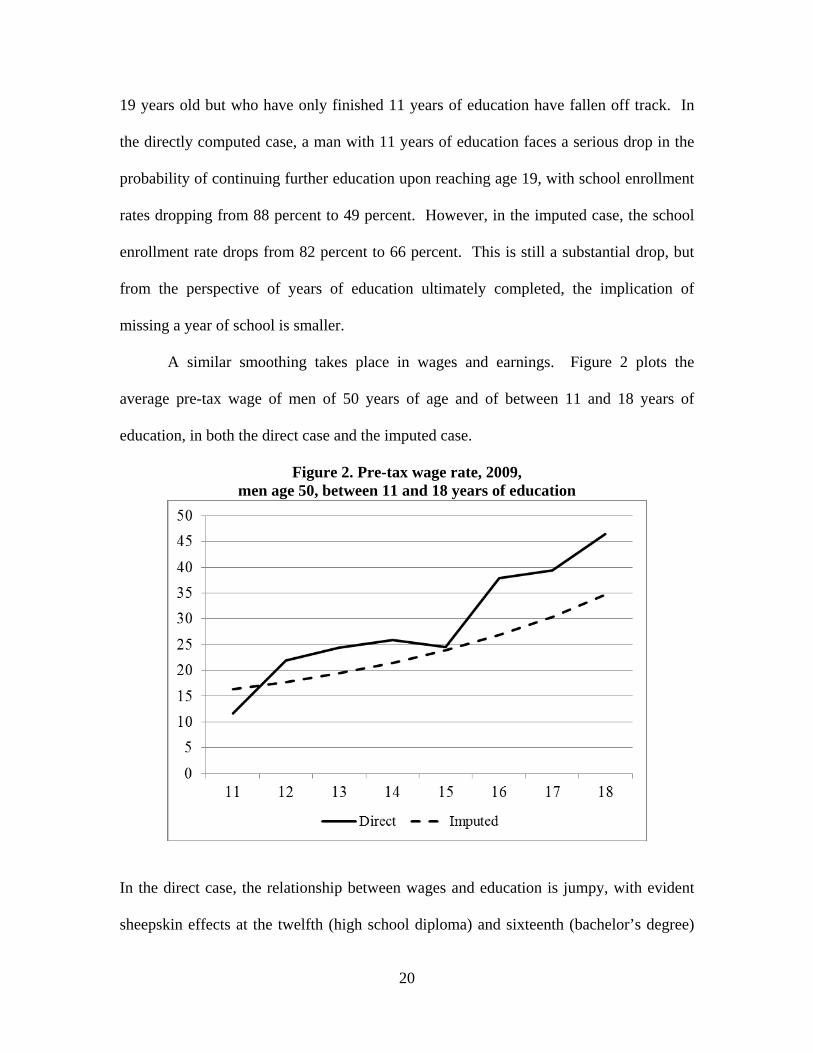
A similar smoothing takes place in wages and earnings. Figure 2 plots the
average pre-tax wage of men of 50 years of age and of between 11 and 18 years of
education, in both the direct case and the imputed case.
Figure 2. Pre-tax wage rate, 2009, men age 50, between 11 and 18 years of education
In the direct case, the relationship between wages and education is jumpy, with evident
sheepskin effects at the twelfth (high school diploma) and sixteenth (bachelor’s degree)
21
year of education. In the imputed case, the wage rate rises smoothly as years of
education rise. This may also reduce the implication of missing a year of school. If
missing a year of school reduces the probability of finishing a diploma or a degree down
the line, the imputed approach may reduce the cost of missing a year of school by
reducing the importance of degree and diploma years and increasing the returns to the
intermediate years of education in between.
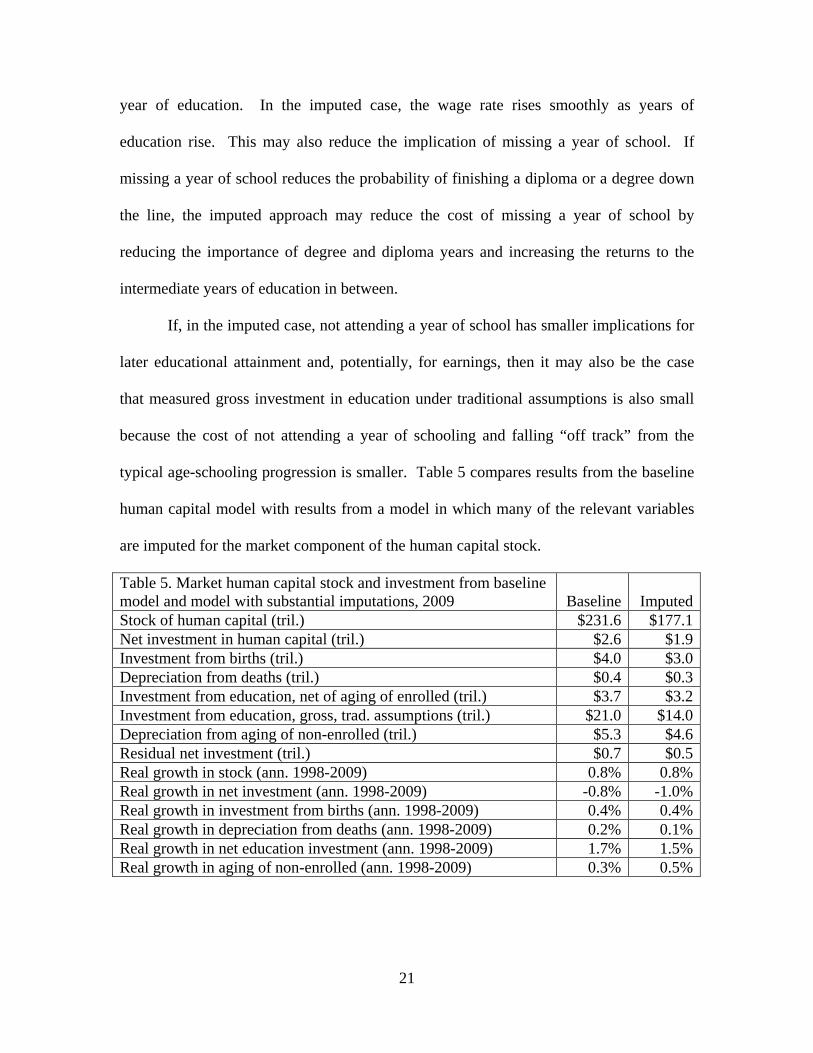
If, in the imputed case, not attending a year of school has smaller implications for
later educational attainment and, potentially, for earnings, then it may also be the case
that measured gross investment in education under traditional assumptions is also small
because the cost of not attending a year of schooling and falling “off track” from the
typical age-schooling progression is smaller. Table 5 compares results from the baseline
human capital model with results from a model in which many of the relevant variables
are imputed for the market component of the human capital stock.
Table 5. Market human capital stock and investment from baseline model and model with substantial imputations, 2009 Baseline Imputed Stock of human capital (tril.) $231.6 $177.1 Net investment in human capital (tril.) $2.6 $1.9 Investment from births (tril.) $4.0 $3.0 Depreciation from deaths (tril.) $0.4 $0.3 Investment from education, net of aging of enrolled (tril.) $3.7 $3.2 Investment from education, gross, trad. assumptions (tril.) $21.0 $14.0 Depreciation from aging of non-enrolled (tril.) $5.3 $4.6 Residual net investment (tril.) $0.7 $0.5 Real growth in stock (ann. 1998-2009) 0.8% 0.8% Real growth in net investment (ann. 1998-2009) -0.8% -1.0% Real growth in investment from births (ann. 1998-2009) 0.4% 0.4% Real growth in depreciation from deaths (ann. 1998-2009) 0.2% 0.1% Real growth in net education investment (ann. 1998-2009) 1.7% 1.5% Real growth in aging of non-enrolled (ann. 1998-2009) 0.3% 0.5%
22
The imputations used in the alternative model are similar but not identical to those in
Ahlroth et al (1997). The right-hand-side variables in each regression were age,
education, age squared, education squared, age times education, and age squared times
education squared. However, rather than include sex among the right-hand-side
variables, separate regressions were estimated by sex instead. For each sex and each
year, three different school enrollment regressions for three different left-hand-side
variables were run using logistic regression: full-time enrollment in grades one through
twelve; full-time enrollment in postsecondary education; and part-time enrollment in
postsecondary education. Logistic regression was also employed for a model with the
probability of employment as the left-hand-side variable. Finally, hours worked
conditional on employment, log pre-tax wage rate, and log post-tax wage rate were
imputed using ordinary least squares regression.
The imputations do have an effect on the market component of gross investment
in education as measured under traditional assumptions; by using the imputation, the
measured amount drops by a third, from $21.0 trillion to $14.0 trillion. However, this is
still an enormous quantity that rivals the entire gross domestic product of the United
States, a result that is in substantive contrast to Ahlroth et al (1997), whose income-based
measure of gross investment in education in Sweden was actually lower than the cost-
based measure used in the Swedish national accounts. The size of the human capital
stock is also smaller after the imputations. This is at least partially a result of having
imputed wage rates using a regression that uses log wage as the left-hand-side variable;
when the model is re-run using the wage rate in levels, the market component of the
human capital stock is a more comparable $206.7 trillion. The rest of the results are for
23
the most part unaffected by the use of imputation, which bodes well for human capital
accounting in cases where sample sizes are small. Levels of human capital investment
are smaller in the imputed case in for the most part roughly equal proportions to each
other, with net investment in education being smaller by a slightly lesser extent than the
others. Real growth in human capital investment from one year to the next is barely
different between the baseline case and the case with substantial imputations.
VI. Valuation of Nonmarket Time
The human capital accounts presented both here and in Jorgenson and Fraumeni
(1989, 1992) include both a market and non-market component. The non-market
component is measured under the assumption that time spent outside of work, school
(assumed to be 1300 hours a week for full-time enrolled students), and personal
maintenance (assumed to be 10 hours a day) is spent in non-market activities that are
valued at the post-tax marginal wage. Some of these activities are undeniably work that
leads to production of goods and services in the home, such as cooking, laundry, home
repairs, and child care. Other activities, such as watching television, make a weaker case
for being classified as non-market production; one can make such a case (the only way to
draw any utility from a television, for example, is to actually spend time watching it), but
the case is weaker.
It is possible, with time-use survey data, to put restrictions on which activities are
valued in the non-market component of a human capital account and which activities are
not valued. Using the American Time Use Survey, the time of individuals is split into
categories that reflect the degree to which it ought to be considered home production.
Time is split into six different kinds of activities: market work, school, non-market
24
production, child and adult care, leisure, and maintenance. Non-market production
includes housework, cooking, cleaning, laundry, home repairs and maintenance, home
management, shopping, using services (going to the post office, for example), and
religious and civic activities. Child and adult care includes not just basic child care
(feeding, grooming, etc.), but also educational (helping with homework, etc.) and
recreational (playing sports, etc.) child care as well. Leisure includes reading, sports,
hobbies, entertainment, socializing, and watching television. Finally, maintenance
includes not only sleeping, eating, and personal care, but also commuting to work.
Commuting is included in maintenance because commuting only exists to support work,
so the value of time spent commuting to work is already accounted for in earnings from
market work. These categories borrow heavily from Aguiar and Hurst's (2007)
classification of time into non-market work and leisure. They also correspond reasonably
well with Abraham and Mackie's (2005) recommendations for identifying household
production for a satellite account.
The American Time Use Survey is a smaller sample; it surveys about 13,000
individuals each year between 2003 and 2009. To incorporate the smaller sample into
the human capital estimates, imputations based on regressions similar to those used in
Ahlroth et al (1997) are used. The proportion of total time spent in non-market
production, child and adult care, leisure, and maintenance were each regressed on: a) age,
education, age squared, education squared, age times education, and age squared times
education squared; b) the proportion of time spent in market work and the proportion of
time spent in school; and c) the variables in (a) interacted with the variables in (b). These
regressions were estimated separately by sex and year and used to predict time spent in
25
non-market production, child and adult care, leisure, and maintenance under three
different approaches. In the first approach, maintenance is still assumed to be 10 hours
per day and full-time school enrollment is still assumed to be 1300 hours per year. The
remaining time outside of market work is divided among non-market production, child
and adult care, and leisure in proportion to their predicted time from the above
regressions. Only time spent in non-market work is valued in the human capital account.
The second approach is the same as the first approach, except that both non-market work
and child and adult care are valued. In the third approach, maintenance time is increased
to 11.08 hours per day, and school time among those enrolled in school full-time is
increased to 1647 hours per year for elementary and secondary students and reduced to
1105 hours per year for postsecondary students. This is in accordance with the average
time spent on maintenance and schooling measured from the American Time Use Survey.
Like the second approach, both non-market work and child and adult care are valued in
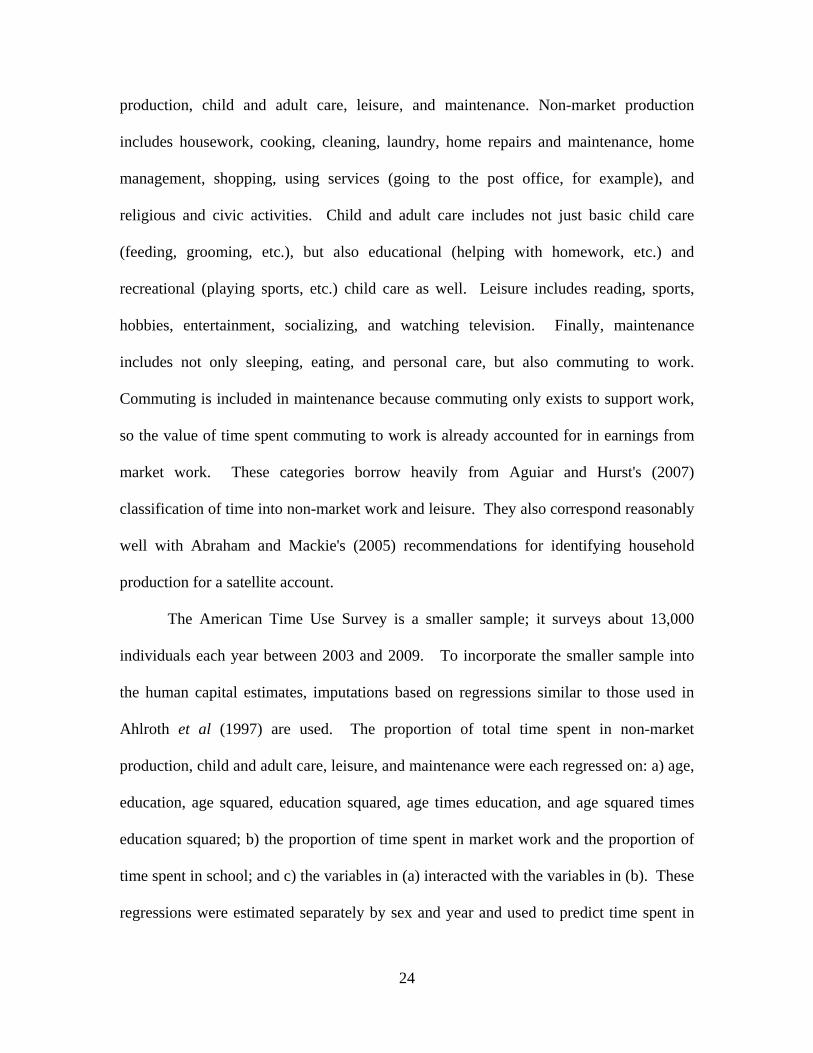
the third approach. The results from the three approaches are presented in Table 6.
Table 6. Nonmarket human capital stock and investment under alternative accounting for nonmarket time, 2009
Base model
Non-market
work only
Non-market w/child
care
Maint., school
from ATUS
Stock of human capital (tril.) $525.4 $174.6 $210.6 $189.0 Net investment in human capital (tril.) $4.8 $1.8 $2.1 $1.9 Investment from births (tril.) $6.9 $2.3 $2.9 $2.6 Depreciation from deaths (tril.) $2.4 $0.7 $0.8 $0.7 Investment from education, net of aging (tril.) $3.3 $1.4 $1.8 $1.6 Depreciation from aging of non-enrolled (tril.) $4.5 $1.7 $2.5 $2.2 Residual net investment (tril.) $1.6 $0.5 $0.6 $0.6 Real growth in stock (ann., 2003-2009) 0.9% 0.9% 0.9% 0.9% Real growth in net investment (ann.) 2.7% 3.9% 4.5% 4.4% Real growth in investment from births (ann.) 0.2% 0.2% 0.2% 0.2% Real growth in depreciation from deaths (ann.) 0.1% 0.2% 0.2% 0.2% Real growth in net education investment (ann.) 1.3% 1.4% 1.4% 1.4% Real growth in aging of non-enrolled (ann.) 0.3% 0.3% 0.2% 0.2%

26
Opting to only value time spent in specifically defined nonmarket work has a very
large negative effect on measures of the nonmarket component of the human capital
stock, reducing it to one-third its value when all non-market, non-school time outside of
maintenance is included. Net investment is reduced in rough proportion, with the largest
proportional drop in depreciation due to deaths and the smallest in net investment from
education. This would be the case if older people spent relatively less time in nonmarket
work and if people increase the amount of non-market time spent in non-market work as
their levels of education rise. Real growth rates in the human capital stock are unchanged
when only time spent in nonmarket work activities is valued, but real net investment in
human capital grows considerably faster in the alternative accounting. Interestingly, this
growth in real net investment does not come from the measured causes of investment
(births, deaths, aging, or education), but rather from the residual component of net
investment--the changes in population that are left over once calculations for births,
deaths, aging, and education have been made. This residual includes migration and
measurement error, and faster growth in residual net investment in the alternative
accounting implies that growth in this residual was in groups that spent relatively more of
their non-market time in household work.
When child and adult care is added to the non-market component of human
capital, the most substantive effect for nominal human capital investment is on aging of
persons not enrolled in school. This is a result of people spending less time on child and
adult care as they become older. Real growth in net investment becomes faster, and this
is again primarily in the residual component of net investment. Changing the number of
hours spent in school conditional on enrollment and on maintenance reduces the

27
components of the human capital stock and investment in rough proportion to each other
and has very little effect on real growth in stock and investment.
The above analysis is merely a start at exploiting the possibilities for alternative
measurements of non-market time in human capital. For example, this account and the
account of Jorgenson and Fraumeni (1989, 1992) value time spent in non-market
activities at the tax-adjusted marginal wage of the person performing the activity. This
approach to valuating non-market tasks will value tasks more highly when they are
performed by more educated persons, even in cases where the performance of the task is
not likely to improve with education; this point is made in Rothschild (1989) and
elsewhere. Consequently, valuing non-market tasks at market wage will yield a
substantive non-market component of investment from education. Alternatives to
valuating non-market tasks at market wages include valuing them at a replacement wage
equal to the cost of hiring someone in the market to perform the task for you, possibly
adjusted for differences in productivity between the amateurs working in the home and
the professionals working in the market; this is the approach recommended for a satellite
account for household production in Abraham and Mackie (2005). Abraham (2010)
considers an approach that differentiates the relationship between education and
productivity between different non-market activities.
VII. Real Output of the Education Sector
One of the most frequently cited applications of a human capital account is the
use of investment in education as a measure of the output of the education sector. This is
the motivation for one of the original Jorgenson and Fraumeni (1992) papers, is

28
recommended for a satellite account in the Atkinson (2005) report, and was discussed
among possible approaches for the United States in Christian and Fraumeni (2005).
In an income-based human capital account, investment in education is equal to the
sum of persons who are enrolled in school across sexes, ages, and levels of education
weighted by the lifetime return in present discounted value to a year of education by sex,
age, and level of education. If investment in education is measured in real terms using
enrollments as quantities and lifetime returns as weights, then real investment in
education is a volume-based measure of the real output of the education sector. A
volume-based measure of the real output of the education sector measures real output
using a measure of the amount of education services produced, which is typically
identified as enrollments; examples of volume-based measures for the United States are
presented in Fraumeni et al (2009) and in Christian (2006). On the other hand, if
investment in education is measured in real terms by deflating a nominal measure of net
investment in education using a price index such as the Consumer Price Index, then
investment in education is an outcome-based measure of the real output of the education
sector. The measure is outcome-based since it would not measure the amount of services
produced, but rather the outcome of those services, namely the value of the amount of
extra production and consumption of goods and services made possible by the education.
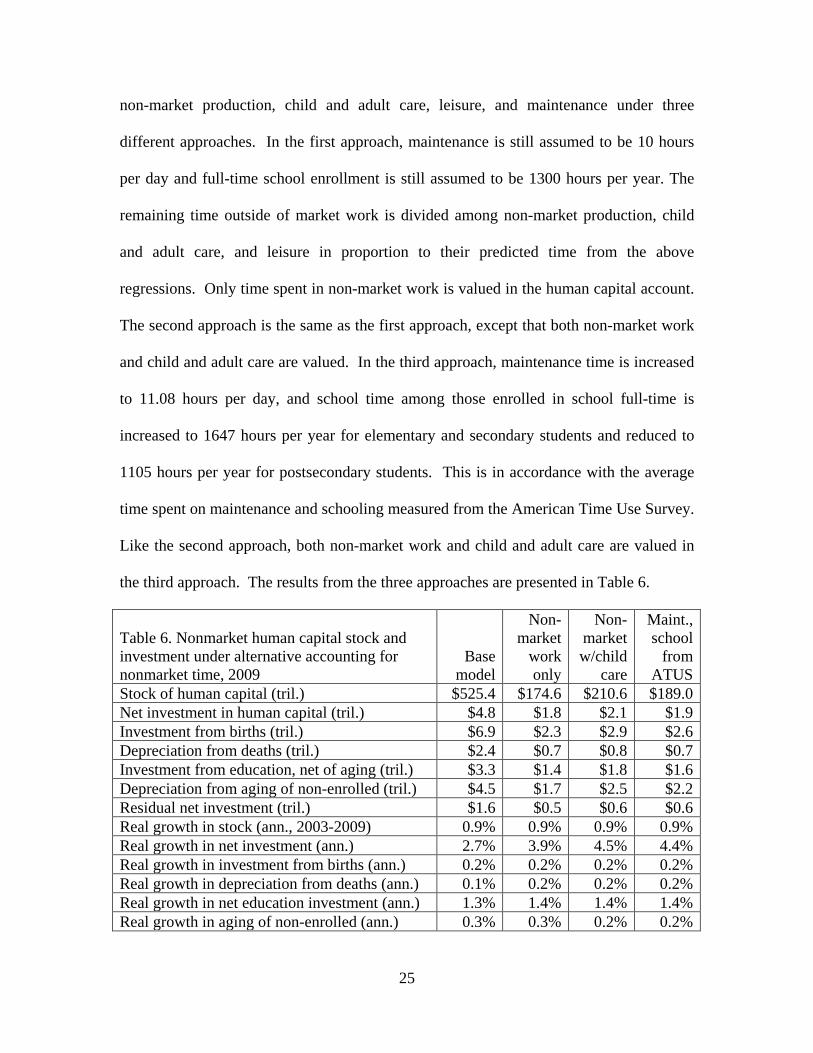
Figure 3 below presents comparisons between three measures of the real output of
the elementary and secondary education sector between 1998 and 2009. The first is a
simple count of students enrolled in school--a straightforward volume index with no
adjustments for changes in the quality of education over time. The second is growth in
real investment in education net of aging of persons enrolled in school, using the baseline
29
human capital account and treating enrollments as quantities and lifetime returns as
weights. This approach, like the simple count of students, also does not account for
changes in the quality of education over time but, unlike the simple count of students,
weights enrollments of students by sex, age, and level of education using their net
investment values. The third measure is real investment in education net of aging of
persons enrolled in school, also using the baseline human capital account but computed
by deflating nominal investment in education net of aging using the Consumer Price
Index. This is a measure of the real purchasing power of the return to education and is an
outcome-based rather than a volume-based approach. Both the market and non-market
components of net investment in education are included.
Figure 3. Real elementary and secondary education output (2004=100)
We can see in Figure 3 that the simple count and the volume index follow each other
relatively closely. Both grew at an annual rate of 0.5 percent between 1998 and 2009,
although the volume index grew more slowly in the 1998-2004 period (0.5 percent
compared to 0.7 percent) and more quickly in the 2004-2009 period (0.4 percent
30
compared to 0.2 percent). In contrast, nominal net investment deflated with the CPI
presents a substantively different story, having declined at an annual rate of 1.1 percent
between 1998 and 2009. This would be consistent with a decline in the lifetime return to
elementary and secondary education in real terms over the period studied.
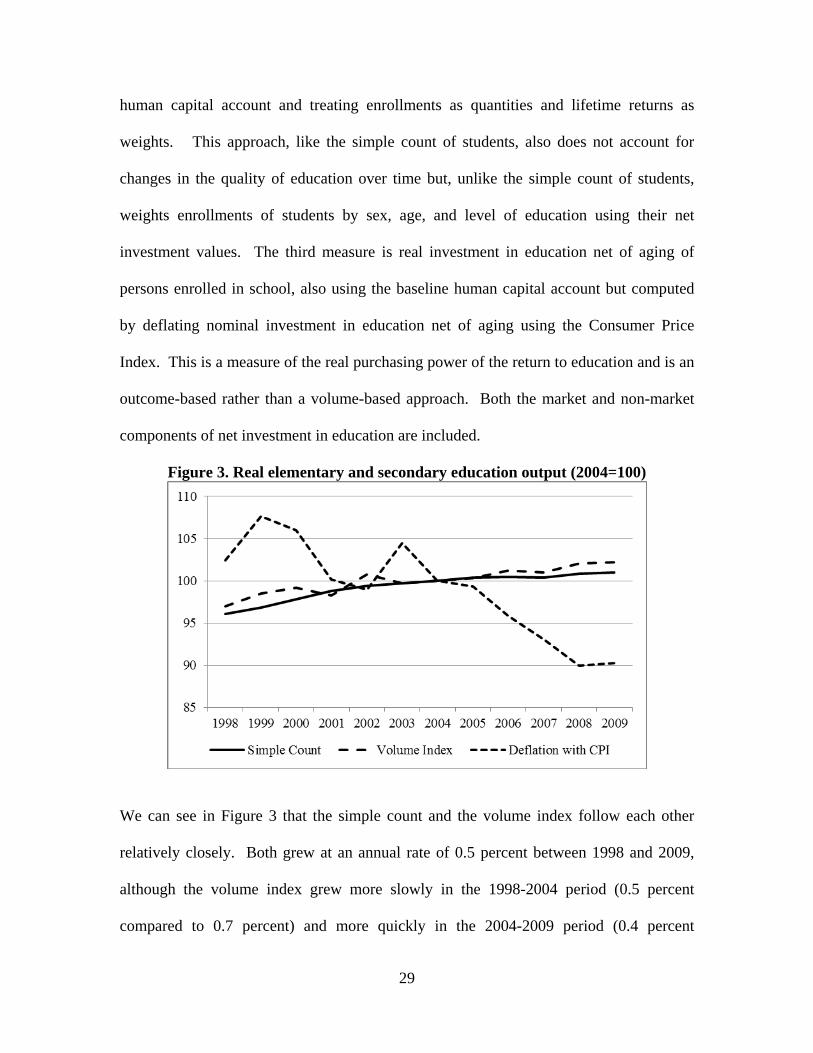
Figure 4 repeats this analysis for higher education, with the exception that the
simple count of enrollments is measured in full-time equivalents rather than as an
unadjusted headcount.
Figure 4. Real higher education output (2004=100)
All three series exhibit the same annual growth rate of 3.0 percent between 1998 and
2009, although there are wrinkles in growth between them in the intermediate years. In
the 1998-2004 period, the simple count grows the fastest (3.3 percent), the volume index
the second-fastest (2.7 percent), and the CPI-deflated index the slowest (1.7 percent),
indicating a shift in higher education enrollments toward persons with lower levels of
return to education and also a general decline in the return to education by sex, age, and
level of education. Both trends reverse completely in the 2004-2009 period, so that the

31
simple count (2.5 percent) grows more slowly than the volume index (3.4 percent), which
in turn grows more slowly than the CPI-deflated index (4.5 percent).
These results are consistent with those of Gu and Wong (2010b), who conduct a
similar analysis comparing the growth in real output of the education sector between a
cost-based approach and an income-based approach, with both approaches producing
volume indexes based on the number of students enrolled. In their estimates for Canada,
a simple count of students grew at a rate of 0.6 percent per year, a cost-based volume
index grew at a rate of 0.9 percent per year, and an income-based volume index grew at a
rate of 0.7 percent per year between 1996 and 2005.
VIII. Conclusions and Suggestions for Further Research
The findings above suggest that an income-based approach to measuring human
capital in the United States similar to that of Jorgenson and Fraumeni (1989, 1992) yields
a very large estimate of the stock of human capital. In 2009, using an income-based
approach that assumes a 2 percent income growth rate and a 4 percent discount rate, the
stock of human capital in the United States was about three-quarters of a quadrillion
dollars, of which about one-third was market and two-thirds was non-market. The
market component of net investment in education was $3.7 trillion, which is nearly four
times as great than the $909 billion education sector measured in the National Income
and Product Accounts. When the analysis focuses strictly on costs and returns to
individual persons and the discount rate is increased to 12 percent to reflect the riskiness
of education as an investment, there appears to be substantial consumer surplus from
education.

32
Real growth in net investment from education, which was 1.6 percent per year
between 1998 and 2009 is, for the most part, robust to changes in the income growth rate,
the discount rate, the treatment of taxes, the approach to smoothing and imputation, and
the valuation of non-market time. Other aspects of human capital are less robust. While
it should not be surprising that changing the income growth rate, the discount rate, the
treatment of taxes, or the activities classified as nonmarket production changes the levels
of the human capital stock or human capital investment substantially, there are also some
cases where real growth in investment in human capital is changed as well. For example,
reducing the income growth rate and increasing the discount rate substantially reduces the
growth rate in net investment, primarily by increasing the magnitude of depreciation from
aging among persons aged in their fifties and early sixties.
In general, the human capital account as a whole was robust to using regressions
to impute employment, school enrollment rates, and wages by age, sex, and education.
Levels of human capital stock and investment tend to be lower, but real growth rates in
the components of net investment were virtually the same. This bodes well for
measuring human capital from small data sets from which reliable sample means cannot
be measured by age, sex, and individual year of education.
The work above lends itself to many extensions. Perhaps the most immediately
interesting extension would be to extend the series further back in time. Haveman et al
(2003) presents results for a potential-income-based model that go back to 1975, and
readily available data from the Current Population Survey can be used to extend a human
capital account for the United States as far back as 1969. This could be used to identify
effects on human capital of long-run phenomena such as rising educational attainment
33
and increased participation of women in market work. Extending the time series
backward would also allow for empirical analysis of the differences between the lifetime-
income-based approach of Jorgenson and Fraumeni (1989, 1992) and the potential-
income-based approach of Haveman et al (2003).
It would also be useful to see if results generated from other data sets within the
United States would generate results similar to those generated in the Current Population
Survey. This might be especially useful for the purposes of measuring human capital
from a small data set that requires regressions or similar approaches to impute wages,
employment and school enrollment by age, sex, and individual year of education. While
measured human capital was for the most part robust to using regressions rather than
sample means in the analysis of Section V, it is useful to note that this was the case when
using regression coefficients from a large data set, the Current Population Survey, which,
being large, will produce precisely measured regression coefficients. It would be useful
to see if a human capital account generated entirely from a smaller data set, such as the
Panel Study of Income Dynamics, would generate comparable results.
The alternative measures of the non-market component of human capital in
Section VI is only a start to the application of time-use data to human capital accounts.
The approach used was a model that uses regression techniques to impute the distribution
of time using age, sex, education, and the extent of time spent in the market and in
schooling. The robustness of these results to alternative assumptions about the function
that determines the distribution of time across different activities is relatively low-
hanging fruit. In addition, using alternative assumptions about the meaning of non-
market work could yield further informative results. For example, in the results in
34
Section VI, the classification of activities as non-market work is a bright-line rule--either
an activity is production or it is not. An alternative approach would allow that some
activities are partially production and partially consumption. For example, Christian's
(2007) account for household production of health care counted 20 percent of time spent
in sports and exercise toward health-related production and the remaining 80 percent
toward consumption. A third aspect of non-market production that suggests further
investigation is the effect on the accounts from valuing of time spent in nonmarket
activities at the wage of the person performing the activities rather than at the market cost
of hiring another person to do it.
Abraham (2010) discusses a substantial number of important issues in human
capital measurement, most of which focused on measuring the output of the education
sector. The discussion sets out a plan for an satellite education account that includes both
cost-based and income-based approaches to measuring human capital, mirroring the
expenditure and income sides in the double-entry bookkeeping structure of a national
account. Costs and income could include both market and non-market components, the
latter of which would likely require further use of time-use data. Jorgenson (2010)
elaborates on the relevant issues of a satellite account. Abraham (2010) also discusses
fundamental questions about the attribution of income differences across different
education levels to formal education itself. For example, persons who attain higher levels
of education may have received more inputs not just from schooling but also from their
families, and may also receive more on-the-job training. Income growth from
technological change, even when skills-neutral, will also amplify differences in lifetime
35
earnings between different education levels, even through the technology is completely
divorced from the education sector.
The usefulness of human capital ultimately comes down to its potential for
practical application. This point is made by McGrattan (2010), who finds a disconnect
between human capital accounting and applied economics research and recommends that
research in human capital focus less on the size of the human capital stock and more on
economic questions. The results on the real output of the education sector in Section VII
are in part an attempt to connect human capital to an economic application, in this case to
a related issue in the economics of education. Gu and Wong (2010b) conduct a similar
analysis for the output of the education sector in Canada, comparing real growth in
education output between cost-based and income-based approaches. Recently produced
accounts in several countries discuss macroeconomic applications, with a particular focus
on economic growth, sustainable development, and productivity (Kokkinen, 2008; Le et
al, 2006; Gu and Wong, 2010a; Jones and Chiripanhura, 2010; Li et al, 2010; Liu and
Greaker, 2009). The OECD project should facilitate international comparison (Mira and
Liu, 2010). Wei (2008) mentions that the human capital framework can be particularly
useful for studies of education, migration, and aging. Haveman et al (2003) makes use
of disaggregations of a potential-income-based measure of human capital to analyze
potential earnings and capacity utilization by race, age group, and education level.
Jorgenson (2010) identifies human capital as one of the most important additions to
accounting for non-market activities in national accounts. As human capital estimates
become internationally more widespread and the number of researchers to whom they
36
become available increases, the number of applications of human capital should increase
with the collective creativity of its users.
References Abraham, Katharine (2010), "Accounting for Investments in Formal Education," Survey of Current Business 90(6), pp. 42-53. Abraham, Katharine, and Christopher Mackie (2005), eds., Beyond the Market: Designing Nonmarket Accounts for the United States (Washington, D.C.: The National Academies Press). Ahlroth, Sofia, Anders Bjorklund, and Anders Forslund (1997), "The Output of the Swedish Education Sector," Review of Income and Wealth 43(1), pp. 89-104. Aguiar, Mark, and Erik Hurst (2007), "Measuring Trends in Leisure: The Allocation of Time Over Five Decades", Quarterly Journal of Economics 122(3), pp. 969-1006. Atkinson, Tony (2005), Atkinson Review: Final Report: Measurement of Government Output and Productivity for the National Accounts (Basingstoke, U.K.: Palgrave MacMillan). Christian, Michael (2006), "Measuring the Education Function of Government in the United States," presented at the Workshop on Measurement of Non-Market Output in Education and Health, London, England. Christian, Michael (2007), "Measuring the Output of Health Care in the United States," Survey of Current Business 87(6), pp. 78-83. Christian, Michael (2010), "Human Capital Accounting in the United States, 1994-2006," Survey of Current Business 90(6), pp. 31-36. Christian, Michael, and Barbara Fraumeni (2005), "Measuring the Education Function of Government," Background materials for the May 13, 2005 meeting of the Bureau of Economic Analysis Advisory Committee. Ervik, Astrid Oline, Erling Holmoy, and Torbjorn Haegeland (2003), "A Theory-Based Measure of the Output of the Education Sector," Discussion Papers No. 353, Statistics Norway. Feenberg, Daniel, and Elizabeth Coutts (1993), "An Introduction to the TAXSIM Model," Journal of Policy Analysis and Management 12(1), pp. 189-194.
37
Fraumeni, Barbara, Marshall Reinsdorf, Brooks Robinson, and Matthew Williams (2009), "Price and Real Output Measures for the Education Function of Government: Exploratory Estimates for Primary and Secondary Education,” in W. Erwin Diewert, John Greenlees, and Charles Hulten, eds., Price Index Concepts and Measurement (Chicago: University of Chicago Press). Gu, Wulong, and Ambrose Wong (2010a), "Estimates of Human Capital in Canada: The Lifetime Income Approach," Economic Analysis (EA) Research Paper Series, Catalogue no. 11F0027M, No. 062, Economic Analysis Division, Statistics Canada. Gu, Wulong, and Ambrose Wong (2010b), "Investment in Human Capital and the Output of the Education Sector in Canada," presented at the 31st General Conference of the International Association for Research in Income and Wealth (IARIW), St. Gallen, Switzerland. Haveman, Robert, Andrew Berdshadker, and Jonathan Schwabish (2003), Human Capital in the United States from 1975 to 2000: Patterns of Growth and Utilization (Kalamazoo, Mich.: W.E. Upjohn Institute for Employment Research). Jaeger, David (1997), "Reconciling the Old and New Census Bureau Education Questions: Recommendations for Researchers," Journal of Business and Economic Statistics 15(4), pp. 300-309. Jaeger, David (2003), "Estimating the Returns to Education Using the Newest Current Population Survey Education Questions," Economics Letters 78(3), pp. 385-394. Jones, Richard, and Blessing Chiripanhura (2010), "Measuring the U.K.'s Human Capital Stock," Economic and Labour Market Review 4(11), pp. 36-63. Jorgenson, Dale, and Barbara Fraumeni (1989), "The Accumulation of Human and Nonhuman Capital, 1948-84," in Robert Lipsey and Helen Stone Tice, eds., The Measurement of Saving, Investment, and Wealth (Chicago: University of Chicago Press). Jorgenson, Dale, and Barbara Fraumeni (1992), "The Output of the Education Sector," in Zvi Griliches, ed., Output Measurement in the Service Sectors (Chicago: University of Chicago Press). Jorgenson, Dale (2010), "Human Capital and the National Accounts," Survey of Current Business 90(6), pp. 54-56. Kendrick, John (1976), The Formation and Stocks of Total Capital (New York: National Bureau of Economic Research) Kokkinen, Arto (2008), "Human Capital and Finland's Economic Growth in 1910-2000," Paper Prepared for the 30th General Conference of the International Association for Research in Income and Wealth, Portoroz, Slovenia, August 24-30, 2008.
38
Le, Trinh, John Gibson, and Les Oxley (2003), "Cost and Income-Based Measures of Human Capital," Journal of Economic Surveys 17(3), pp. 271-307. Le, Trinh, John Gibson, and Les Oxley (2006), "A Forward-Looking Measure of the Stock of Human Capital in New Zealand," The Manchester School 74(5), pp. 593-609. Li, Haizheng, Yunling Liang, Barbara Fraumeni, Zhiquiang Liu, and Xiaojun Wang (2010), "Human Capital in China," Paper Prepared for the 31st General Conference of the International Association for Research in Income and Wealth, St. Gallen, Switzerland, August 22-28, 2010. Liu, Gang, and Mads Greaker (2009), "Measuring the Stock of Human Capital for Norway: A Lifetime Labour Income Approach," Documents 2009/12, Statistics Norway. Mira, Marco, and Gang Liu (2010), "The OECD Human Capital Project: Progress Report," presented at the 31st General Conference of the International Association for Research in Income and Wealth (IARIW), St. Gallen, Switzerland. McGrattan, Ellen (2010), "Comment on Michael Christian's 'Human Capital Accounting in the United States, 1994-2006'", Survey of Current Business 90(6), pp. 37-41. O'Mahony, Mary, and Philip Stevens (2009), "Output and Productivity Growth in the Education Sector: Comparisons for the US and UK," Journal of Productivity Analysis 31(3), pp. 177-194. Oreopoulous, Philip, and Kjell Salvanes (2009), "How Large Are Returns to Schooling? Hint: Money Isn't Everything," NBER Working Paper no. 15339. Rothschild, Michael (1989), "Comment on 'The Accumulation of Human and Nonhuman Capital'", in Robert Lipsey and Helen Stone Tice, eds., The Measurement of Saving, Investment, and Wealth (Chicago: University of Chicago Press). Wei, Hui (2004), "Measuring the Stock of Human Capital for Australia," Research Paper, ABS Catalogue no. 1351.0.55.001, Australian Bureau of Statistics. Wei, Hui (2008), "Measuring Human Capital Flows for Australia: A Lifetime Labour Income Approach," Research Paper, ABS Catalogue no. 1351.0.55.023, Australian Bureau of Statistics.
39
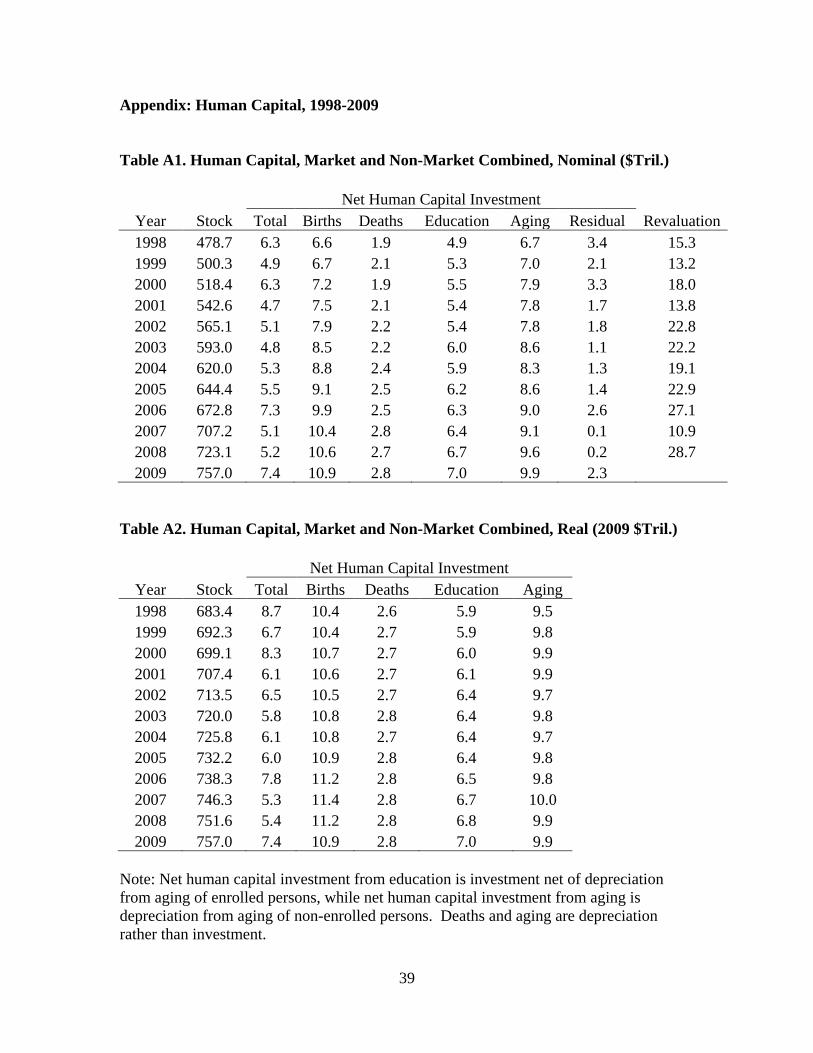
Appendix: Human Capital, 1998-2009 Table A1. Human Capital, Market and Non-Market Combined, Nominal ($Tril.)
Year Stock Net Human Capital Investment
Revaluation Total Births Deaths Education Aging Residual 1998 478.7 6.3 6.6 1.9 4.9 6.7 3.4 15.3 1999 500.3 4.9 6.7 2.1 5.3 7.0 2.1 13.2 2000 518.4 6.3 7.2 1.9 5.5 7.9 3.3 18.0 2001 542.6 4.7 7.5 2.1 5.4 7.8 1.7 13.8 2002 565.1 5.1 7.9 2.2 5.4 7.8 1.8 22.8 2003 593.0 4.8 8.5 2.2 6.0 8.6 1.1 22.2 2004 620.0 5.3 8.8 2.4 5.9 8.3 1.3 19.1 2005 644.4 5.5 9.1 2.5 6.2 8.6 1.4 22.9 2006 672.8 7.3 9.9 2.5 6.3 9.0 2.6 27.1 2007 707.2 5.1 10.4 2.8 6.4 9.1 0.1 10.9 2008 723.1 5.2 10.6 2.7 6.7 9.6 0.2 28.7 2009 757.0 7.4 10.9 2.8 7.0 9.9 2.3
Table A2. Human Capital, Market and Non-Market Combined, Real (2009 $Tril.)
Year Stock Net Human Capital Investment
Total Births Deaths Education Aging 1998 683.4 8.7 10.4 2.6 5.9 9.5 1999 692.3 6.7 10.4 2.7 5.9 9.8 2000 699.1 8.3 10.7 2.7 6.0 9.9 2001 707.4 6.1 10.6 2.7 6.1 9.9 2002 713.5 6.5 10.5 2.7 6.4 9.7 2003 720.0 5.8 10.8 2.8 6.4 9.8 2004 725.8 6.1 10.8 2.7 6.4 9.7 2005 732.2 6.0 10.9 2.8 6.4 9.8 2006 738.3 7.8 11.2 2.8 6.5 9.8 2007 746.3 5.3 11.4 2.8 6.7 10.0 2008 751.6 5.4 11.2 2.8 6.8 9.9 2009 757.0 7.4 10.9 2.8 7.0 9.9
Note: Net human capital investment from education is investment net of depreciation from aging of enrolled persons, while net human capital investment from aging is depreciation from aging of non-enrolled persons. Deaths and aging are depreciation rather than investment.
40
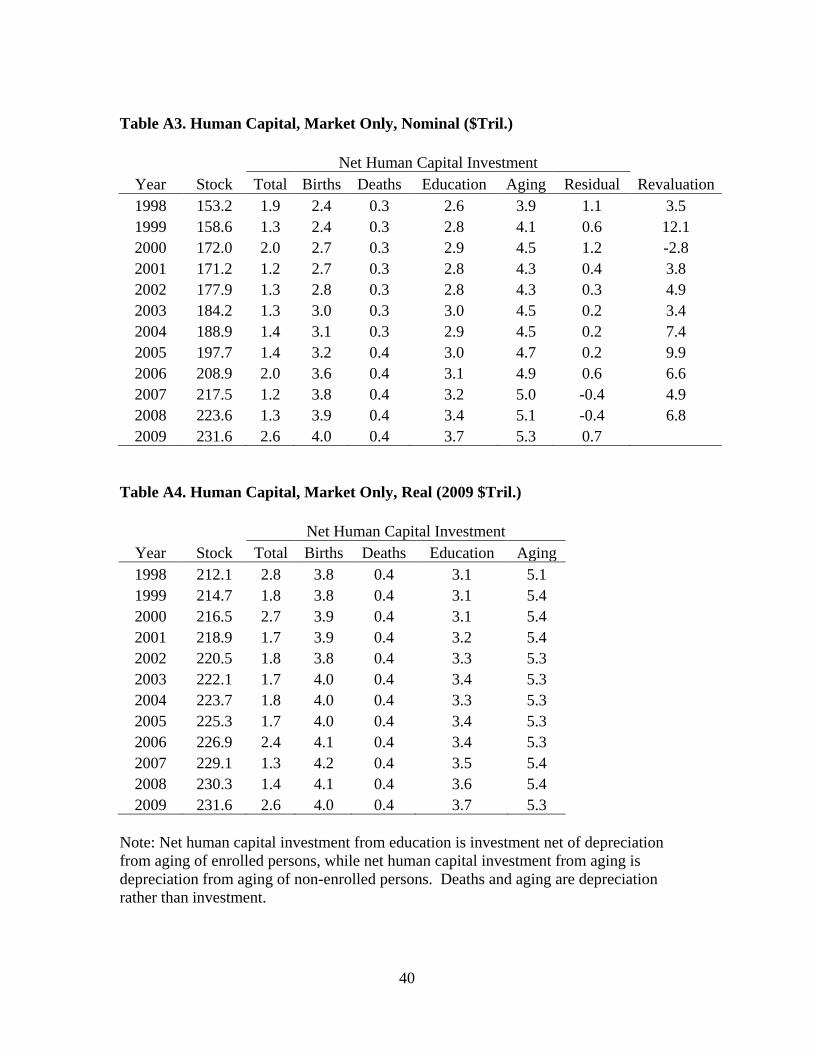
Table A3. Human Capital, Market Only, Nominal ($Tril.)
Year Stock Net Human Capital Investment
Revaluation Total Births Deaths Education Aging Residual 1998 153.2 1.9 2.4 0.3 2.6 3.9 1.1 3.5 1999 158.6 1.3 2.4 0.3 2.8 4.1 0.6 12.1 2000 172.0 2.0 2.7 0.3 2.9 4.5 1.2 -2.8 2001 171.2 1.2 2.7 0.3 2.8 4.3 0.4 3.8 2002 177.9 1.3 2.8 0.3 2.8 4.3 0.3 4.9 2003 184.2 1.3 3.0 0.3 3.0 4.5 0.2 3.4 2004 188.9 1.4 3.1 0.3 2.9 4.5 0.2 7.4 2005 197.7 1.4 3.2 0.4 3.0 4.7 0.2 9.9 2006 208.9 2.0 3.6 0.4 3.1 4.9 0.6 6.6 2007 217.5 1.2 3.8 0.4 3.2 5.0 -0.4 4.9 2008 223.6 1.3 3.9 0.4 3.4 5.1 -0.4 6.8 2009 231.6 2.6 4.0 0.4 3.7 5.3 0.7
Table A4. Human Capital, Market Only, Real (2009 $Tril.)
Year Stock Net Human Capital Investment
Total Births Deaths Education Aging 1998 212.1 2.8 3.8 0.4 3.1 5.1 1999 214.7 1.8 3.8 0.4 3.1 5.4 2000 216.5 2.7 3.9 0.4 3.1 5.4 2001 218.9 1.7 3.9 0.4 3.2 5.4 2002 220.5 1.8 3.8 0.4 3.3 5.3 2003 222.1 1.7 4.0 0.4 3.4 5.3 2004 223.7 1.8 4.0 0.4 3.3 5.3 2005 225.3 1.7 4.0 0.4 3.4 5.3 2006 226.9 2.4 4.1 0.4 3.4 5.3 2007 229.1 1.3 4.2 0.4 3.5 5.4 2008 230.3 1.4 4.1 0.4 3.6 5.4 2009 231.6 2.6 4.0 0.4 3.7 5.3
Note: Net human capital investment from education is investment net of depreciation from aging of enrolled persons, while net human capital investment from aging is depreciation from aging of non-enrolled persons. Deaths and aging are depreciation rather than investment.

41
Table A5. Human Capital, Non-Market Only, Nominal ($Tril.)
Year Stock Net Human Capital Investment
Revaluation Total Births Deaths Education Aging Residual 1998 325.5 4.4 4.2 1.6 2.3 2.8 2.3 11.8 1999 341.6 3.6 4.3 1.8 2.5 2.9 1.6 1.2 2000 346.4 4.3 4.6 1.6 2.6 3.5 2.1 20.8 2001 371.5 3.5 4.8 1.8 2.6 3.5 1.3 10.0 2002 387.1 3.8 5.1 1.9 2.6 3.5 1.5 17.9 2003 408.9 3.5 5.5 1.8 3.0 4.1 1.0 18.8 2004 431.1 3.9 5.7 2.0 3.0 3.8 1.1 11.7 2005 446.7 4.1 5.9 2.1 3.2 4.0 1.2 13.0 2006 463.9 5.3 6.3 2.1 3.2 4.1 2.0 20.5 2007 489.7 3.9 6.6 2.3 3.2 4.1 0.5 6.0 2008 499.6 3.9 6.7 2.3 3.3 4.5 0.6 21.9 2009 525.4 4.8 6.9 2.4 3.3 4.5 1.6
Table A6. Human Capital, Non-Market Only, Real (2009 $Tril.)
Year Stock Net Human Capital Investment
Total Births Deaths Education Aging 1998 471.3 5.9 6.6 2.2 2.8 4.3 1999 477.5 4.9 6.6 2.3 2.8 4.5 2000 482.6 5.6 6.8 2.3 2.9 4.5 2001 488.4 4.4 6.7 2.3 2.9 4.5 2002 493.0 4.8 6.7 2.3 3.0 4.4 2003 497.9 4.1 6.8 2.4 3.1 4.5 2004 502.2 4.3 6.9 2.3 3.0 4.4 2005 506.8 4.4 6.9 2.4 3.0 4.5 2006 511.4 5.5 7.1 2.3 3.1 4.5 2007 517.2 4.0 7.2 2.4 3.2 4.6 2008 521.3 4.1 7.1 2.4 3.2 4.5 2009 525.4 4.8 6.9 2.4 3.3 4.5
Note: Net human capital investment from education is investment net of depreciation from aging of enrolled persons, while net human capital investment from aging is depreciation from aging of non-enrolled persons. Deaths and aging are depreciation rather than investment.