capital market research in accounting
DESCRIPTION
S.P. KothariSloan School of Management, Massachusetts Institute of Technology, Cambridge, MA 02142,USATRANSCRIPT

Capital markets research in accounting1
S.P. Kothari
Sloan School of Management, Massachusetts Institute of Technology, Cambridge, MA 02142, USA
Abstract I review empirical research on the relation between capital markets and financial statements. The principal sources of demand for capital markets research in accounting are fundamental analysis and valuation, tests of market efficiency, and the role of accounting numbers in contracts and the political process. The capital markets research topics of current interest to researchers include tests of market efficiency with respect to accounting information, fundamental analysis, and value relevance of financial reporting. Evidence from research on these topics is likely to be helpful in capital market investment decisions, accounting standard setting, and corporate financial disclosure decisions. JEL classification: F00; F30; G15; M41 Keywords: Capital markets, financial reporting, fundamental analysis, valuation, market
efficiency 1I thank Jeff Abarbanell, Anwer Ahmed, Sudipta Basu, Patty Dechow, Dan Gode, Wayne Guay, Charles Lee, Bob Lipe, Mike Mikhail, Jowell Sabino, Jake Thomas, Charles Wasley, and Tzachi Zach for helpful comments and discussions. I am especially indebted to Doug Skinner and Jerry Zimmerman, editors, for detailed comments on several drafts of the paper. I acknowledge financial support from the New Economy Value Research Lab at the MIT Sloan School of Management. Corresponding author: Tel.: (617) 253-0994; Fax (617) 253-0603. E-mail address: [email protected]

1. Introduction
Objective of the review article
My assignment is to review research on the relation between capital markets and financial
statements. This is a broad area of research that originated with the seminal publication of Ball and
Brown (1968). The literature has grown rapidly with over 1,000 published papers in leading
academic accounting and finance journals in the past three decades. The approach I adopt for the
review involves a survey of the literature using an economics-based framework. I begin with a
discussion of the demand for and supply of research on the relation between financial information
and capital markets. This is the organizing framework of my discussion of various areas within
capital markets research.
An important objective of the review is to produce a pedagogically valuable document.
Toward this end, the review extends at least two previous comprehensive surveys of the capital
markets research in accounting by Lev and Ohlson (1982) and Bernard (1989). Because they
provide in-depth summaries of research in the 1970s and 1980s, the bulk of the research examined
in my study is from the late 1980s and 1990s. In addition to offering a fairly detailed summary of
research in the past 10-15 years, I discuss the genesis of important ideas in the literature and the
concurrent developments that stimulated many of the ideas. I also critically evaluate the research
findings and research designs employed in past research. The main objective is to offer competing
hypotheses and explanations for the observed findings. This naturally leads to unresolved issues
and directions for future research noted throughout the review. I hope doctoral students (and their
instructors) find the study useful in preparing themselves for successful careers in research.
I review almost exclusively empirical capital markets research. However, empirical
research is (or should be) informed by theory, since interpretation of empirical analysis is
impossible without theoretical guidance. Therefore, I refer to the underlying theory and alternative
hypotheses that bear on the analysis, some of which Verrecchia (2001) reviews.
While I attempt to be thorough, my own tastes and interests as well as my differential
expertise in various areas within capital markets research influence the review’s contents. In
addition, within the empirical capital markets area, there are at least three topics that are examined
extensively elsewhere. Holthausen and Watts (2001) present a critical assessment of the research
on value-relevance in the context of standard-setting. Healy and Palepu (2001) evaluate empirical
research on corporate disclosure and Shackelford and Shevlin (2001) examine tax-related capital
2
markets research. Accordingly, I do not discuss the capital markets research in the above three
areas, although I make references to them.
Summary
Capital markets research in accounting includes several topics, including research on
earnings response coefficients and properties of analysts’ forecasts, fundamental analysis and
valuation research, and market efficiency tests. Instead of summarizing each topic, I comment on
areas of current interest in capital markets research and offer thoughts on how academics can
prepare themselves for producing high impact research.
The capital market research topics of primary interest to researchers currently appear to be
tests of market efficiency with respect to accounting information (e.g., accounting methods and
accruals), fundamental analysis and accounting-based valuation, and value-relevance of financial
reporting (see Holthausen and Watts, 2001). The mounting evidence of apparent market
inefficiency documented in the financial economics and accounting literature has fueled accounting
researchers’ interest in fundamental analysis, valuation, and tests of market efficiency. Evidence of
market inefficiency has created an entirely new area of research examining long-horizon stock-price
performance following accounting events. This is in sharp contrast to the boom in short-window
event studies and studies of economic consequences of standard setting of the 1970s and 1980s.
Future work on tests of market efficiency with respect to accounting information will be fruitful if it
recognizes that (i) deficient research design choices can create the false appearance of market
inefficiency; and (ii) advocates of market inefficiency should propose robust hypotheses and tests to
differentiate their behavioral- finance theories from the efficient market hypothesis that does not rely
on irrational behavior.
I expect capital markets research on issues surrounding market efficiency, fundamental
analysis, and valuation to continue. It is worthwhile thinking about how best to prepare for such
research. A historical perspective provides helpful guidance. Capital markets research in
accounting began in the late 1960s soon after the development of the efficient markets hypothesis
and event study methodology (see section 3) at the University of Chicago. Many of the early
capital markets investigators in accounting also came from Chicago and were typically trained in
finance and economics. I believe future successful capital markets researchers will also be similarly
well trained with a solid grounding in economics-based and behavioral theories of market
inefficiency, which have begun to mushroom in finance and economics. This will prepare
3
accounting academics to make a meaningful contribution, not simply within the field of accounting,
but in finance and economics as well.
Outline of the review
Section 2 presents a discussion of the sources of demand for capital markets research in
accounting. I review early capital markets research in section 3, primarily with a pedagogical
motivation. It contains an overview of the state of accounting research in the era prior to the Ball
and Brown (1968) and Beaver (1968) and the developments in finance and economics in the mid-
1960s that facilitated capital markets research in accounting. I discuss much of the capital markets
research in the past two decades in section 4. Section 4 is split into four subsections. Section 4.1
examines methodological research. Section 4.2 focuses on research evaluating alternative
performance measures. Fundamental analysis research in accounting is the topic of section 4.3 and
tests of market efficiency in accounting are critically eva luated in section 4.4. Capital markets
research on standard setting is also a capital markets research topic, but I refer the reader to the
Holthausen and Watts (2001) review. Section 5 presents a summary and conclusions.
2. Demand for capital markets research in accounting
A large fraction of published research in leading academic accounting journals examines the
relation between financial statement information and capital markets, referred to as capital markets
research. This voluminous published research is an indication of the demand for capital markets
research. 1 There are at least four sources of the demand for capital markets research in accounting
that explain its popularity: i) fundamental analysis and valuation; ii) tests of capital market
efficiency; iii) role of accounting in contracts and in the political process; and iv) disclosure
regulation. I discuss the four sources of demand for capital markets research below, and list the
types of research studies I subsequently summarize in the review. While I believe the four sources
account for a large fraction of the demand for capital markets research in accounting, these sources
are neither mutually exclusive nor collectively exhaustive.
1 I do not examine the decline in the cost of doing capital market research as an explanation for the explosive growth in the supply of capital market research over the past three decades. The cost has declined with the low-cost availability of computing power, statistical packages, and machine-readable databases such as security price data from the Center for Research in Security Prices (CRSP), financial statement data from Standard & Poor’s Compustat, and analysts’ forecast data from Institutional Brokers Estimate System (IBES).

4
2.1 Fundamental analysis and valuation
Shareholders, investors and lenders have an obvious interest in the value of a firm. In an
efficient market, firm value is defined as the present value of expected future net cash flows,
discounted at the appropriate risk-adjusted rate of return. A firm’s current performance as
summarized in its financial statements is an important, but not the only input to the market’s
assessment of the firm’s future net cash flows and thus into the firm’s market valuation. This is
consistent with the Financial Accounting Standard Board’s (FASB’s) conceptual framework that
financial statements should help investors and creditors in “assessing the amounts, timing, and
uncertainty” of future cash flows (FASB Statement of Financial Accounting Concepts, No. 1,
1978). Therefore, a temporal association between current financial performance and future cash
flows, as well as a contemporaneous association between financial performance and security prices
or price changes is expected. An important goal of capital markets research is to provide evidence
on these relations.
The principal focus of fundamental analysis is on valuation aimed at identifying mispriced
securities. This has been popular at least since Graham and Dodd published their book Security
Analysis in 1934.2 A large fraction of the nearly $5 trillion currently invested in U.S. mutual funds
is actively managed, with fundamental analysis as the guiding principle of most mutual fund
managers. Fundamental analysis entails the use of information in current and past financial
statements, in conjunction with industry and macroeconomic data to arrive at a firm’s intrinsic
value. A difference between the current price and the intrinsic value is an indication of the expected
rewards for investing in the security. Capital markets research on fundamental analysis has become
extremely popular in recent years in part because of mounting evidence in the financial economics
literature against the efficient markets hypothesis. The belief that “price convergence to value is a
much slower process than prior evidence suggests” (Frankel and Lee, 1998, p. 315) has acquired
currency among leading academics, spurring research on fundamental analysis. Capital markets
research on fundamental analysis examines whether it successfully identifies mispriced securities.
Fundamental analysis research thus cannot be disentangled from capital markets research on testing
market efficiency.
The research on valuation and fundamental analysis that I review includes valuation models,
such as those presented in Fama and Miller (1972, ch. 2), Beaver, Lambert, and Morse (1980),
2 Recent editions of the book are titled “Graham and Dodd’s Security Analysis” by Cottle, Murray, and Block (1988).
5
Christie (1987), Kormendi and Lipe (1987), Kothari and Zimmerman (1995), Ohlson (1995) and
Feltham and Ohlson (1995). I then examine recent empirical applications of the valuation models
like Dechow, Hutton, and Sloan (1999) and Frankel and Lee (1998). Finally, I discuss studies that
employ fundamental analysis to forecast earnings and future stock returns (i.e., a test of market
efficiency). Examples include Ou and Penman (1989a, and b), Stober (1992), Lev and Thiagarajan
(1993), Abarbanell and Bushee (1997 and 1998), and Piotroski (2000).
2.2 Tests of market efficiency
Fama (1970, 1991) defines an efficient market as one in which “security prices fully reflect
all available information.” Whether security markets are informationally efficient is of great interest
to investors, managers, standard setters, and other market participants. The interest stems from the
fact that security prices determine the allocation of wealth among firms and individuals. The
security prices themselves are influenced by financial information, which explains academic and
practicing accountants and standard setters’ interest in market efficiency research.
Market efficiency has important implications for the accounting profession. For example,
rewards from fundamental analysis would diminish in an efficient market. A switch from one
accounting method to another without a direct cash flow effect, a signaling effect, or incentive
consequences does not affect security prices in an efficient market. Choice between disclosure in
footnotes and recognition in financial statements (e.g., accounting for employee stock options) is
less contentious from the perspective of its effect on security prices in an efficient market.
Naturally, the opposite would be true in all of the above examples if markets were not efficient.
Therefore, there is a demand for empirical research on market efficiency.
There is a huge literature testing market efficiency in finance, economics, and accounting. I
concentrate on the literature in accounting. The accounting literature draws inferences about market
efficiency from two types of tests: short- and long-horizon event studies and cross-sectional tests of
return predictability or the anomalies literature. Event studies, which constitute the bulk of the
literature, include the post-earnings-announcement drift literature (e.g., Ball and Brown, 1968,
Foster, Olsen, and Shevlin, 1984, Bernard and Thomas, 1989 and 1990, Ball and Bartov, 1996, and
Kraft, 1999); market efficiency with respect to accounting methods and method changes and
research on functional fixation (e.g., Ball, 1972, Kaplan and Roll, 1972, and Dharan and Lev, 1993,
Hand, 1990, and Ball and Kothari, 1991); and accrual mana gement and analyst forecast optimism

6
and long-term returns to initial public offerings and seasoned equities (e.g., Teoh, Welch, and
Wong, 1998a and b, Dechow, Hutton, and Sloan, 1999, and Kothari, Sabino, and Zach, 1999).
Cross-sectional tests of return predictability, or the anomalies literature, examine whether
the cross-section of returns on portfolios formed periodically using a specific trading rule are
consistent with a model of expected returns like the CAPM. The trading rules used have been either
univariate indicators like earnings yield, or multivariate indicators employing a fundamental
analysis of accounting ratios. Examples of research using univariate indicators are tests of the
market’s (mis)pricing of earnings and cash flow yield (e.g., Basu, 1977 and 1983, Lakonishok,
Shleifer, and Vishny, 1994), accounting accruals (e.g., Sloan, 1996, Xie, 1997, and Collins and
Hribar, 2000a and b), and analysts’ forecasts (e.g., La Porta, 1996, and Dechow and Sloan, 1997).
Examples of tests using multivariate indicators to earn long-horizon abnormal returns include ratio-
based fundamental analysis (e.g., Ou and Penman, 1989a and 1989b, Greig, 1992, Holthausen and
Larcker, 1992, and Abarbanell and Bushee, 1997 and 1998), and fundamental value strategies (e.g.,
Frankel and Lee, 1998).
2.3 Role of accounting in contracts and in the political process
Positive accounting theory (see Watts and Zimmerman, 1986) predicts that the use of
accounting numbers in compensation and debt contracts and in the political process affects a firm’s
accounting choices. A large body of literature in accounting tests predictions of positive accounting
theory. Many of these tests entail the use of capital market data. For example, tests of the
economic consequences of accounting examine stock price reactions to new accounting standards,
and study whether cross-sectional variation in these stock price reactions are related to financial
variables that proxy for contracting and/or political costs. To perform powerful tests of positive
accounting theory and to ameliorate the effects of correlated-omitted variables on the tests,
researchers attempt to control for the effect of financial information on security prices that is
unrelated to the positive accounting theory. 3 This creates a demand for capital markets research that
aids researchers in designing more powerful stock-price-based tests of the positive accounting
theory.
3 Watts (1992) makes a symmetric argument in the context of tests of the relation between financial statement numbers and stock prices. He contends that in order to perform powerful tests of competing theories about the relation between accounting numbers and stock prices, it behooves researchers to include positive accounting theory-based variables in the tests to control for their effects that are correlated with the capital market relations being tested.

7
I review a large body of methodological capital markets research that facilitates research on
positive accounting theory. The methodological research includes the earnings response coefficient
literature (e.g., Kormendi and Lipe, 1987, Easton and Zmijewski, 1989, and Collins and Kothari,
1989); research on the properties of time series, management, and ana lysts’ forecasts of earnings
(e.g., Ball and Watts, 1972, Foster, 1977, Brown and Rozeff, 1978, Patell, 1976, Penman, 1980, and
Waymire, 1984); research about problems in drawing statistical inferences (e.g., Collins and Dent,
1984, and Bernard, 1987); and discretionary accrual models (e.g., Healy, 1985, Jones, 1991,
Dechow, Sloan, and Sweeney, 1995, and Guay, Kothari, and Watts, 1996).
2.4 Disclosure regulation
In the U.S., the Financial Accounting Standards Board (FASB), with authority delegated by
the Securities and Exchange Commission (SEC), is charged with issuing standards that govern the
disclosure of financial information by publicly-traded firms. Capital markets research can help
ascertain whether FASB’s stated objectives are served by the standards it has issued, either singly or
collectively. For example, do financial statement numbers prepared according to a new standard
convey new information to the capital markets? Are financial statement numbers prepared
according to a new standard more highly associated with contemporaneous stock returns and prices?
What are the economic consequences of the issuance of a new disclosure standard? The nature and
extent of standard setting is also likely influenced by standard setters’ perception of whether
security markets are informationally efficient. Thus, standard setters have an interest in the capital
markets research on tests of market efficiency.
Internationally, standard-setters presumably seek evidence from capital markets research.
The rapid globalization of capital, product, and labor markets has created a strong demand for
international accounting standards in recent years. Perhaps the most important issue facing
practitioners, and standard-setters is whether there should be a uniform set of accounting standards
or whether there should be diversity. If standards were to be uniform, should U.S. generally
accepted accounting principles (GAAP) be the standard? Or should standards be developed
internationally? Or should standards differ across nations, depending on differences in legal,
political, and economic environments? Are capital markets in other countries as (in)efficient as
they are in the U.S., which could affect the nature of international accounting standards? Interest in
these and related issues has precipitated a demand for capital markets research using international
accounting and capital markets data.

8
Holthausen and Watts (2001) review and analyze the capital markets research on issues
surrounding disclosure regulation, so I refrain from reviewing this area of capital markets research
in detail.
3. Early capital markets research
Ball and Brown (1968) and Beaver (1968) heralded empirical capital markets research as it
is now known. This section describes the state of accounting theory and thought that preceded the
positive-economics-based empirical capital markets research of the late 1960s. Concurrent
developments in economics and finance constituted the theoretical and methodological impetus to
the early capital markets research in accounting. In my opinion, this historical detour exploring the
forces that shaped early capital markets research has positive pedagogical externalities, particularly
for guiding new researchers. Seasoned researchers can skip over portions of this section without a
loss of continuity.
More importantly, another reason for a historical review is that capital markets research in
accounting today appears to be in a similar state as accounting theory was prior to 1968. The
efficient markets hypothesis and positive economics, as well as other related developments,
facilitated the birth of capital markets research in the 1960s. In contrast, theoretical models of
inefficient capital markets, research methodology, and evidence of apparent market inefficiency are
the catalysts for a large portion of the capital markets research in accounting today.
3.1 The state of accounting theory in the early 1960s
Until the mid-1960s, accounting theory was generally normative. Accounting theorists
advanced their account ing policy recommendations on the basis of an assumed set of accounting
objectives. Hendriksen (1965, p. 2) defines “a most appropriate theory” as one that “supports the
development of procedures and techniques that best fulfill the objectives of accounting.”4 He adds,
“One of the first steps in the development of accounting theory, therefore, is a clear statement of the
objectives of accounting.” Thus, theory development depended on the objectives assumed by a
researcher, and theory evaluation was based on logic and deductive reasoning. There was little
emphasis on the empirical validity of the theory’s predictions.
4 I use the discussion of accounting theory in Hendrikson’s book as a reasonable description of the state of accounting theory at the time. That description is similar to the one in Ball and Brown (1968) and Watts and Zimmerman (1986, ch. 1).

9
Since the theories were logically consistent, the basis for selecting one accounting policy
over another was reduced to choosing among alternative objectives of accounting. However, since
individuals disagreed on the objectives of accounting, there was no consensus on the optimal set of
accounting policies. This led to skepticism about the usefulness of accounting income reported in
the financial statements. Hendriksen (1965, p. 97) observes that “already there are rumblings that
the income statement will see its demise in the near future unless drastic changes are made to
improve the story it tells." For a variety of reasons, many doubted whether historical cost
accounting numbers conveyed useful information about, or an accurate assessment of, a firm’s
financial health.
3.2 Concurrent developments that facilitated capital markets research
in accounting
While accounting theorists and practitioners held a dim view of whether historical cost
accounting numbers accurately reflected a firm’s financial health, scientific evidence on the issue
did not exist. Providing empirical evidence to ascertain whether accounting numbers contained or
conveyed information about a firm’s financial performance was the major motivation that led to the
research of Ball and Brown (1968) and Beaver (1968). There were three major concurrent
developments in finance and economics that forged the way for the seminal research by both Ball
and Brown (1968) and Beaver (1968): i) positive economics theory, ii) the efficient markets
hypothesis and the capital asset pricing model (CAPM) and iii) the event study of Fama, Fisher,
Jensen, and Roll (1969).
Positive economics
Friedman (1953) was perhaps the most prominent among those who were instrumental in
making positive, as opposed to normative, science the mainstream research methodology in
economics, finance and accounting. Following Keynes’ (1891) definition of positive science as “a
body of systematized knowledge concerning what is,” Friedman (1953, p. 7) describes positive
science as “the development of a ‘theory’ or ‘hypothesis’ that yields valid and meaningful (i.e., not
truistic) predictions about phenomena yet to be observed.” Most accounting research since Ball and
Brown (1968) and Beaver (1968) is positive and the role of accounting theory is no longer
normative. Watts and Zimmerman (1986, p. 2) state: “The objective of accounting theory is to
explain and predict accounting practice.” This is noteworthy departure from the widespread
practice of normative accounting theory.

10
Efficient markets hypothesis and the capital asset pricing model (CAPM)
Building on past theoretical and empirical work, Fama (1965) introduced, and subsequently
made major contributions to the conceptual refinement and empirical testing of the efficient markets
hypothesis. Fama (1965, p. 4) notes “In an efficient market, on the average, competition” among
rational, profit-maximizing participants “will cause the full effects of new information on intrinsic
values to be reflected ‘instantaneously’ in actual prices.”
The maintained hypothesis of market efficiency opened the doors for positive capital
markets research in accounting. Ball and Brown (1968, p. 160) assert that capital market efficiency
provides “justification for selecting the behavior of security prices as an operational test of
usefulness” of information in financial statements. Beaver (1968) offers a similar argument.
Unlike previous normative research on accounting theories and optimal accounting policies,
positive capital markets research began using changes in security prices as an objective, external
outcome to infer whether information in accounting reports is useful to market participants.
Sharpe (1964) and Lintner (1965) developed the capital asset pricing model, CAPM. The
CAPM predicts that a security’s expected rate of return is increasing in the covariance risk of its
cash flows, which is the covariance of a security’s expected return with the expected return on the
market portfolio. Therefore, a portion of the cross-sectional variation in security returns is due to
differences in the covariance risks of the securities. This risk-related variation in returns is
generally not of interest to researchers who focus on firm-specific accounting information and its
relation to the firm-specific component of the stock return. Therefore, the CAPM, along with the
efficient market hypothesis, greatly facilitated the estimation of the firm-specific return component.
The use of the firm-specific component alone enhances the power of the tests of information content
of accounting reports (Brown and Warner, 1980 and 1985).
Event study of Fama, Fisher, Jensen, and Roll (1969)
Fama et al. (1969) conducted the first event study in financial economics. Event studies are
joint tests of market efficiency and the model of expected rates of return used in estimating
abnormal returns. Fama et al.’s research design innovation permits researchers to align sample
firms in event time and to then examine their security price performance before, during and after
economic events such as stock splits (Fama et al., 1969) and earnings announcements (Ball and
Brown, 1968, and Beaver, 1968).

11
Positive accounting theory development: a short detour
Circumstances similar to those that facilitated the Ball and Brown (1968) study also
contributed to Watts and Zimmerman’s positive accounting theory that revolutionized the
accounting literature in the late 1970s (see Watts and Zimmerman, 1978, 1979, 1983, and 1986).
Watts and Zimmerman capitalized on the concurrent developments in finance and economics to
explain some of the puzzles facing accounting researchers and practitioners. The impetus to Watts
and Zimmerman’s work was the seminal work of Jensen and Meckling (1976) and Ross (1977) that
altered the course of the corporate finance literature. Jensen and Meckling (1976) articulate the
implications of the agency problem between a firm’s shareholders (principal) and the management
(agent) and between shareholders and bondholders in an informationally-efficient capital market.
The agency problem arises in part because of the imperfect observability of managerial effort and
costly contracting. This nexus of contracts view of a corporation enabled Watts and Zimmerman to
develop hypotheses as to why there should be predictable variation in how firms account for their
economic activities as well as why accounting standards would matter, even if capital markets were
informationally efficient.
Watts and Zimmerman’s political cost hypothesis extends the economics literature on
regulation in a political process, as distinct from a market process (see Olson, 1971, Stigler, 1971,
Posner, 1974, McCraw, 1975, Peltzman, 1976, and Watts and Zimmerman, 1986, ch. 10). Thus, the
insight that led to the development of Watts and Zimmerman’s positive accounting theory involves
the accounting implications of the concurrent theoretical developments in finance and economics.
Watts and Zimmerman then tailored those theories to explain accounting phenomena.
3.3 Association and event studies
Ball and Brown (1968) and Beaver (1968) are the pioneering studies in capital markets
research in accounting. Both perform an event study and Ball and Brown also conduct an
association study. Both types of studies are now common in the literature.
In an event study, one infers whether an event, such as an earnings announcement, conveys
new information to market participants as reflected in changes in the level or variability of security
prices or trading volume over a short time period around the event (see Collins and Kothari, 1989,
p. 144, and Watts and Zimmerman, 1986, ch. 3). If the level or variability of prices changes around
the event date, then the conclusion is that the accounting event conveys new information about the
amount, timing, and/or uncertainty of future cash flows that revised the market’s previous

12
expectations. The degree of confidence in this conclusion critically hinges on whether the events
are dispersed in calendar time and whether there are any confounding events (e.g., a simultaneous
dividend and earnings announcement) co-occurring with the event of interest to the researcher. As
noted earlier, the maintained hypothesis in an event study is that capital markets are informationally
efficient in the sense that security prices are quick to reflect the newly arrived information. Because
event studies test for the arrival of information through an accounting event, they are also referred
to as tests of information content in the capital markets literature in accounting. Besides Ball and
Brown (1968) and Beaver (1968), other examples of event studies include Foster (1977), Wilson
(1986), Ball and Kothari (1991), Amir and Lev (1996), and Vincent (1999).
An association study tests for a positive correlation between an accounting performance
measure (e.g., earnings or cash flow from operations) and stock returns, both measured over
relatively long, contemporaneous time periods, e.g., one year. Since market participants have
access to many more timely sources of information about a firm’s cash flow generating ability,
association studies do not presume that accounting reports are the only source of information to
market participants. Therefore, no causal connection between accounting information and security
price movements is inferred in an association study. The objective is to test whether and how
quickly accounting measures capture changes in the information set that is reflected in security
returns over a given period. In addition to Ball and Brown (1968), other pertinent studies include
Beaver, Lambert, and Morse (1980), Rayburn (1986), Collins and Kothari (1989), Livnat and
Zarowin (1990), Easton and Harris (1991), Easton, Harris, and Ohlson (1992), Dechow (1994), and
Dhaliwal, Subramanyam, and Trezevant (1999).
3.4 Early evidence from event studies and association studies
Event study evidence
Ball and Brown (1968) and Beaver (1968) provide compelling evidence that there is
information content in accounting earnings announcements. Ball and Brown correlate the sign of
the abnormal stock return in the month of an earnings announcement with the sign of the earnings
change over that firm’s previous year’s earnings. They find a significantly positive correlation.
The maintained hypothesis underlying the Ball and Brown test is that the earnings
expectation model is well specified in providing a clean measure of earnings surprise. That is, at
least a portion of the earnings increase experienced by the firms classified as “good news” firms
was a favorable surprise to the market, which led to increased security prices. Thus, the strength of

13
the association between earnings announcement period abnormal return and the earnings surprise is
a function of both the information content of earnings and the quality of the earnings expectation
model employed. Ball and Brown provide evidence using two earnings expectation models: a
simple random walk model and a market model in earnings.
Beaver (1968) circumvents the problem of specifying an earnings expectation model by
examining the variability of stock returns and trading volume around earnings announcements.
Beaver hypothesizes that the earnings announcement period is characterized by an increased flow of
information compared to a non-earnings announcement period. He uses return volatility to infer the
flow of information. The evidence supports Beaver’s hypothesis.
Beaver also tests for the flow of information by comparing trading volume in the earnings
announcement periods to that in the non-announcement periods. The notion here is that market
participants have heterogeneous expectations about a forthcoming earnings announcement.
Earnings announcements resolve some of the uncertainty and thus narrow the heterogeneity of
beliefs, but in the process contribute to increased trading among the market participants who might
have taken positions based on their pre-earnings announcement period heterogeneous expectations.5
Association study evidence
The Ball and Brown evidence clearly demonstrates that accounting earnings
contemporaneously capture a portion of the information set that is reflected in security returns. The
evidence also suggests that competing sources of information (including quarterly earnings)
preempt the information in annual earnings by about 85%. In this sense, annual accounting
numbers are not a particularly timely source of information to the capital markets.
The use of annual earnings to infer earnings’ timeliness weakens the case in favor of
earnings’ timeliness because one of the sources of other information to the capital markets is
quarterly earnings (see Foster, 1977). Even so, earnings are unlikely to be a particularly timely
source of information. Because accounting earnings measurement rules emphasize transaction-
based revenue recognition, compared to the stock market’s focus on current and expected future net
revenues, earnings’ lack of timeliness is not surprising (e.g., Beaver, Lambert, and Morse, 1980,
and Collins, Kothari, Shanken, and Sloan, 1995). In other words, stock prices lead accounting
earnings in terms of reflecting new information.
5 Recent models of investors’ belief revision show that increased heterogeneity is also possible as a consequence of news events such as an earnings announcement (see Harris and Raviv, 1993, Kandel and Pearson, 1995, and Bamber, Barron, and Stober, 1999).
14
In addition to studying the association and information content of accounting earnings with
respect to security returns, Ball and Brown also test for market efficiency by examining whether the
market’s reaction to good and bad news earnings announcement is quick and unbiased. They find
preliminary evidence of a post-earnings announcement drift in that the market’s adjustment to bad
news in particular takes several months. This suggests market underreaction and subsequent
gradual adjustment to the information in earnings. While Ball and Brown provide preliminary
evidence of a post-earnings announcement drift, the anomaly literature on the drift took a solid root
with the works of Jones and Litzenberger (1970), Litzenberger, Joy, and Jones (1971), Foster,
Olsen, and Shevlin (1984) and Bernard and Thomas (1989, 1990).6 This research is reviewed in
section 4 under tests of market efficiency.
Ball and Brown also compare the informativeness of earnings and cash flows to test whether
the accrual process makes earnings more informative than cash flows. Their evidence suggests the
annual abnormal return adjustment is greater for earnings changes than for cash flow changes,
consistent with the accrual process making earnings more informative. Following Ball and Brown,
a long stream of research examines the relative informativeness of earnings and cash flows.7 This
research is reviewed in section 4.
3.5 Beyond the early evidence
Ball and Brown (1968) and Beaver (1968) spawned an industry of capital markets research,
which is systematically reviewed in the next two sections. Some of the research following Ball and
Brown and Beaver replicates their results in different settings, e.g., in different countries, using
interim earnings compared to annual earnings, using shorter earnings announcement periods, and by
examining both the sign and magnitude compared to only the sign in Ball and Brown. I review this
and subsequent capital markets research in sections 4 and 5.
Market efficiency and evaluation of accounting standards8
The early evidence of earnings’ association with security returns and evidence of capital
market efficiency in finance and economics led some accounting researchers to draw standard-
setting implications. For example, Beaver (1972) in the Report of the American Accounting
6 See Ball (1978) for an early survey of this literature. 7 Examples include Rayburn (1986), Bowen, Burgstahler, and Daley (1987), Wilson (1986, 1987), Bernard and Stober (1989), Livnat and Zarowin (1990), and Dechow (1994). 8 Holthausen and Watts (2001) discuss this topic in detail.

15
Association Committee on Research Methodology in Accounting, suggests that the association of
accounting numbers with security returns can be used to rank order alternative accounting methods
as a means of determining the accounting method that should become a standard. The report states
that the “method which is more highly associated with security prices… ought to be the method
reported in the financial statements” (p. 428), subject to considerations of competing sources of
information and costs.9
The initial high expectations of the usefulness of capital markets research in guiding
accounting standard-setters to the socially most desirable accounting methods proved ephemeral.
Gonedes and Dopuch (1974) and others quickly pointed out weaknesses (e.g., the free rider problem
of non-purchasers’ access to accounting information) in using the strength of the association with
security returns as a determining criterion for the social desirability of an accounting standard. The
debate, however, continues.
Many advocate changes in financial accounting standards because of the perception that
current GAAP earnings have low correlation with security prices (e.g., Lev, 1989). They propose
alternative accounting methods that arguably would improve the correlation with stock returns (e.g.,
Lev and Zarowin, 1999). Others contend that the correlation between accounting numbers and
security returns would be a function of the objectives of financial statements. There is a demand for
objective, verifiable information that is useful for contracting and performance evaluation purposes
(Watts and Zimmerman, 1986). Such demand skews the accounting process in the direction of
presenting historical information summarizing the effects of actual, rather than expected,
transactions, i.e., the application of the revenue recognition principle. In contrast, security price
changes primarily reflect revisions in expectations of future profitability. Consequently, the
contemporaneous return-earnings association is expected to be small (Kothari, 1992). Commenting
on standard-setting and the research on the association between security returns and financial
information, Lee (1999, p. 13) concludes: “Until accounting regulators decide that reported earnings
should include anticipated profits from future exchanges (that is, until we abandon the “revenue
recognition” principle), it is difficult to see how higher correlation with contemporaneous returns
should have any standard setting implications.”10
9 Also see Beaver and Dukes (1972) and Gonedes (1972). 10 Barclay, Gode, and Kothari (1999) make a similar point using managerial performance measurement as the motivation.

16
Notwithstanding the conceptual debate over the appropriateness of the correlation with
security returns as a criterion for evaluating financial accounting standards, the criterion continues
to be used frequently, albeit with some cautionary language. For example, Dechow (1994) uses
correlation with stock returns to compare earnings and cash flows as measures of a firm’s periodic
performance and Ayers (1998) examines whether deferred tax accounting under SFAS No. 109
provides incremental value relevance over the previous standard for income taxes. One of the
objectives of financial reporting, as stated in the FASB’s Statement of Financial Accounting
Concepts No. 1 (1978, paragraph 47), is “Financial reporting should provide information to help
present and potential investors and creditors and other users in assessing the amounts, timing, and
uncertainty” of prospective cash flows. This serves as a major motivation for researchers to use
correlation with stock returns as a criterion for evaluating alternative accounting methods and
performance measures.
Role of maintained hypothesis
A maintained hypothesis in research that uses correlation with stock returns as a criterion for
evaluating accounting methods is that capital markets are efficient. However, in recent years,
market efficiency has been subjected to significant empirical assault. The re is mounting evidence
of capital market anomalies, which suggests that capital markets might be inefficient. Section 4
examines some of this evidence in the context of the accounting capital markets literature. My
limited objective here is to comment on the implications for capital markets research that assumes
capital market inefficiency.
The appealing feature of market efficiency as a maintained hypothesis is that it often
facilitates the specification of a relation between accounting information and security prices under
the null hypothesis. For example, neither systematic positive nor negative abnormal returns are
predicted in periods following the announcement of an accounting method change. Systematic
evidence of non-zero abnormal returns would refute market efficiency.
If market inefficiency is the maintained hypothesis, then the relation between security prices
and financial information under the null hypothesis is difficult to specify a priori. The challenge
facing researchers is to place more structure on the form of the relations under market inefficiency
(Fama, 1998). A wide range of relations is feasible under market inefficiency. It is important to
develop refutable hypotheses on the basis of behavioral theories of inefficient financ ial markets and

17
to perform tests that discriminate between efficient and inefficient market hypotheses.11 This is the
essence of the positive theory of economics that has guided much capital markets research for the
past three decades. Accountants armed with the knowledge of institutional details about accounting
and the use of accounting information by financial analysts have a comparative advantage in
developing theories and in designing more powerful tests of market efficiency and/or specific forms
of market inefficiency.
3.6 Summary
The early event studies and association studies were seminal in several respects. First, they
refuted the then prevailing concern that the historical cost earnings measurement process produces
meaningless numbers. Second, these studies introduced positive empirical methodology and event
study research design to the accounting literature. The early capital markets research amply
demonstrated the benefits of incorporating the developments from, and contributing to, the
economics and finance literature. Finally, the studies helped dispel the notion that accounting is a
monopoly source of information to the capital markets. The early evidence clearly establishes that
accounting is not a particularly timely source of information affecting security prices, with many
competing sources of information pre-empting earnings information. This has accounting standard-
setting implications.
4. Capital markets research in the 1980s and 1990s
Early capital markets research demonstrates that accounting reports have information
content and that financial statement numbers reflect information that influences security prices,
although not on a timely basis. The decades following the early research witnessed an explosive
growth in capital markets research. I categorize the demand of this research into five main areas: i)
methodological capital markets research, ii) evaluation of alternative accounting performance
measures, iii) valuation and fundamental analysis research, iv) tests of market efficiency, and v)
value relevance of disclosures according to various financial accounting standards and economic
consequences of new accounting standards. (Since Holthausen and Watts, 2001, and Healy and
Palepu, 2001, examine item v in great detail, I do not discuss this item).
11 See Barberis, Shleifer, and Vishny (1998), Daniel, Hirshleifer, and Subramanyam (1998), and Hong and Stein (1999) for behavioral models that produce predictable security return patterns consistent with market inefficiency.
18
Considerable overlap exists among the first four areas of research, but they have sufficiently
different motivations and they strike me as quite distinct from each other. The next four subsections
consider the above four areas of research.
4.1 Methodological capital markets research
Capital markets research seeks to answer a wide range of questions. A sample of the
questions examined in previous research includes:
Do current-cost earnings have incremental information content over historical cost earnings?
Do differences in corporate governance structures affect the degree of information asymmetry in capital markets and, in turn, influence the timing and strength of the relation between security returns and earnings information?
Does managerial ownership affect the informativeness of accounting numbers because of the separation of corporate ownership and control?
Does the perceived quality of an auditor affect the relation between corporate earnings and security returns?
How does the reporting of transitory gain as part of ordinary income and transitory loss as an extraordinary item affect prices?
How do we test for the capital market effects of accounting method changes?
Are disclosures about other post-retirement employee benefits (OPEB) value relevant?
Does an EVA® (Economic Value Added) performance measure correlate more highly with stock returns and prices than historical cost accounting earnings?
What would be the consequence of the Securities and Exchange Commission discontinuing the requirement of reconciliation between the U.S. GAAP and the foreign- or the International Accounting Standards-GAAP for the non-U.S. firms seeking to list their shares on the U.S. exchanges and raise capital in the U.S.?
Would financial statements be more informative about current economic income (i.e., change in the market value) if GAAP were changed to permit managers to capitalize R&D outlays?
To answer these questions, a researcher must control for the “normal” relation between
financial statement information and security returns to isolate the treatment effect of interest. The
normal relation obviously varies with the research setting, and could mean any relation other than
the treatment effect. For example, in examining the effect of managerial ownership on the

19
informativeness of accounting numbers, the investigator must control for the influence of growth
opportunities on earnings’ informativeness because managerial ownership percentage is likely to be
correlated with growth opportunities, which affect earnings’ informativeness. This effect of growth
might be unrelated to the potential agency effect of ownership control on earnings’ informativeness.
I review methodological research in four sub-sections.
(i) Earnings response coefficients research (section 4.1.1) (ii) Properties of time series, management, and analysts’ forecasts of earnings and
earnings growth rates (section 4.1.2)
(iii) Methodological issues in drawing statistical inferences from capital markets research (section 4.1.3)
(iv) Models of discretionary and non-discretionary accruals (section 4.1.4). Additional
details on this issue are deferred to section 4.4 on tests of market efficiency because in the capital markets context, the models of discretionary and non-discretionary earnings are frequently used in tests of market efficiency.
4.1.1 Earnings response coefficients research
4.1.1.A Motivation for research on earnings response coefficients
Earnings response coefficient research is motivated by its potential use in valuation and
fundamental analysis. As seen below, a valuation model underlies earnings response coefficient
estimation. Another important methodological motivation for research on earnings response
coefficients is to facilitate the design of more powerful tests of the contracting and political cost
hypotheses or voluntary disclosure or signaling hypotheses in accounting.
4.1.1.B Intuition for earnings response coefficients
Kormendi and Lipe (1987) is an early paper on earnings response coefficients (also see
Miller and Rock, 1985). They build on the accounting association studies literature12 and the
macroeconomics literature on the permanent income hypothesis, which relates the time-series
properties of consumption and income.13 Kormendi and Lipe estimate the magnitude of the relation
between stock returns and earnings, the earnings response coefficient, and test whether firm-specific
estimates of earnings response coefficients cross-sectionally exhibit a positive correlation with the
12 See, for example, Ball and Brown (1968), Foster (1977), Beaver, Clarke, and Wright (1979), Beaver, Lambert, and Morse (1980), Beaver, Lambert, and Ryan (1987), and Watts and Zimmerman (1986, ch. 2). 13 See, for example, Hall (1978), Flavin (1981), and Kormendi and La Haye (1986). The permanent income hypothesis is developed in Modigliani and Brumberg (1954), Friedman (1957), and Ando and Modigliani (1963).

20
time-series properties of the firms’ earnings. Thus, earnings response coefficients are a mapping of
earnings’ time-series properties and discount rates into changes in equity market values. For
example, if earnings’ time-series properties are such that earnings innovations are permanent, then
assuming a one-to-one relation between earnings innovations and net cash flow innovations, the
earnings response coefficient is the present value of the perpetuity of the earnings innovation
calculated by discounting the perpetuity at the risk-adjusted rate of return on equity. The present
value of a $1 permanent innovation in annual earnings is (1 + 1/r), where r is the annual risk-
adjusted discount rate for equity.
To predict earnings response coefficient magnitudes, a researcher thus requires a valuation
model (e.g., dividend discounting model), revisions in forecasts of future earnings based on current
earnings information, and a discount rate. Time-series properties of earnings play a role in
parsimoniously describing the revisions in earnings forecasts based on current earnings, but a
rigorous theory for the time-series properties does not exist. The most promising area of research in
the earnings response coefficient literature is to relate time-series properties of earnings to economic
determinants like competition, technology, innovation, effectiveness of corporate governance,
incentive compensation policies, etc. (see below). I believe further refinements in the valuation
models and more accurate estimates of discount rates are likely to be only incrementally fruitful in
furthering our understanding of the return-earnings relation or the earnings response coefficients.
4.1.1.C Economic determinants of earnings response coefficients
Early research by Kormendi and Lipe (1987), Easton and Zmijewski (1989), and Collins and
Kothari (1989) identifies four economic determinants of earnings response coefficients. These
studies all begin with the discounted net cash flow valuation model that is standard in the finance
and economics literature. To link earnings to security returns, a one-to-one link between revisions
in the market’s expectations of earnings and net cash flows is assumed. The price change in
response to a $1 earnings innovation is the $1 innovation plus the discounted present value of the
revision in expectations of all future periods’ earnings. The four determinants of this price change
or the earnings response coefficient are: persistence, risk, growth, and interest rate. I discuss each
briefly.
Kormendi and Lipe (1987) and Easton and Zmijewski (1989) show that the greater the
impact of an earnings innovation on market participants’ expectations of future earnings, i.e., the
more persistent the time-series property of earnings, the larger the price change or the earnings

21
response coefficients. Collins and Kothari (1989, table 1) relate the earnings response coefficient to
a number of commonly assumed ARIMA time-series properties of earnings, including the random
walk, moving average, and autoregressive properties.
Easton and Zmijewski (1989) explain why risk negatively affects earnings response
coefficient. Risk here refers to the systematic (or non-diversifiable or the covariance) component of
the equity cash flows’ volatility. Single- or multi-beta versions of the CAPM imply that the equity
discount rate increases in the equity cash flows’ systematic risk.14 Thus, greater risk implies a
larger discount rate, which reduces the discounted present value of the revisions in expected future
earnings, i.e., the earnings response coefficient.
Collins and Kothari (1989) predict a positive marginal effect of a firm’s growth
opportunities on the earnings response coefficient. Growth here refers either to existing projects or
to opportunities to invest in new projects that are expected to yield rates of return that exceed the
risk-adjusted rate of return, r, commensurate with the systematic risk of the project’s cash flows (see
Fama and Miller, 1972, ch. 2). A firm’s ability to earn above-normal rates of return on its current or
future investments does not contradict capital market efficiency. It only means that the firm has
monopoly power in the product markets and is able to earn (quasi) rents for a finite period. Stated
differently, entry or exit in the product markets often does not instantaneously eliminate firms’
ability to earn super-normal rates of return. 15 To the extent current earnings are informative about
the firm’s growth opportunities, the price change is expected to be large. Collins and Kothari
(1989, pp. 149-150) argue that the price reaction would be greater than that implied by the time
series persistence of earnings in part because persistence estimates from historical data are likely to
be “deficient in accurately reflecting current growth opportunities.”
Finally, Collins and Kothari (1989) predict a negative temporal relation between earnings
response coefficients and the risk-free rate of interest. The logic here is straightforward. The
discount rate, r, at any point in time is the sum of the risk free rate of return at the time and a risk
14 The Sharpe (1964) and Lintner (1965) CAPM is a single-beta CAPM whereas the Fama and French (1993) three-factor model that includes size and book-to-market factors beyond the market factor or the Carhart (1997) four-factor model that adds the momentum factor to the Fama -French three-factor model are examples of multi-beta CAPM. The state-of-the-art in the finance literature is to use either the three- or the four-factor CAPM models (see Fama and French, 1997). 15 In contrast, in an efficient capital market, prices adjust immediately to reflect changing expectations about a firm’s earnings generating ability such that at any point in time an investor can only expect a normal rate of return on an investment in any stock.

22
premium. If the risk free rate of interest rises, then ceteris paribus the discounted present value of
the revisions in expectations of future earnings innovations falls, inducing a negative temporal
association between interest rate levels and earnings response coefficients.16
4.1.1.D Assessment of the early evidence on earnings response coefficients
Evidence in Kormendi and Lipe (1987), Easton and Zmijewski (1989), and Collins and
Kothari (1989) indicates a statistically significant effect of the cross-sectional and temporal
determinants on estimated earnings response coefficients. Numerous studies replicate these results
and it has become an industry standard now in the capital markets literature to control for the effects
of persistence, risk, and growth and focus on the incremental effect of a treatment variable, like
ownership control, on earnings response coefficients.
Notwithstanding the success and impact of the earnings response coefficients literature,
there are at least three criticisms of this research. First, the research on persistence and its relation
to earnings response coefficients tends to be statistical in nature. I will revisit this issue in the
context of research on time-series properties of earnings. Research on earnings response
coefficients can be enriched by focusing on the economic determinants of the time series properties
of firms’ earnings. There is some work in this area. Ahmed (1994) draws on the works of Lev
(1974, 1983), Thomadakis (1976), Lindenberg and Ross (1981), and Mandelker and Rhee (1984) on
the relation between the potential to earn economic rents on a firm’s assets and the degree of
competition in the firm’s industry and the firm’s cost structure. Ahmed (1994, p. 379) then
proposes and reports consistent evidence that “if accounting earnings reflect information about
future economic rents generated by firms’ assets- in-place, earnings response coefficients will vary
inversely with competition and directly with the ratio of fixed costs to variable costs.”17
16 The argument ignores the possibility that changes in interest are simply changes in expected inflation and that the firm passes on the changes in inflation to its customers in the form of higher prices. In this case earnings response coefficients would be unrelated to interest rate changes. The negative relation between interest rates and earnings response coefficient implicitly assumes either interest rate changes covary positively with changes in real interest rates or inflation negatively impacts stock prices because of unanticipated inflation’s negative effects on economic activity (see Fama and Schwert, 1977, and Fama, 1981). See further discussion in 4.1.1.D. 17 Also see Biddle and Seow (1991) for evidence on cross-industry variation in earnings response coefficients and Baginski, Lorek, Willinger, and Branson (1999) for the impact of economic characteristics on earnings persistence measures.

23
Anthony and Ramesh (1992) draw on research on the relation between a firm’s life cycle
and business strategy18 to explain cross-sectional variation in earnings response coefficients. They
argue that depending on a firm’s stage in its life cycle, financial statement information is
differentially informative about a firm’s cash flow generating ability such that earnings response
coefficients are predictably related to a firm’s stage in its life cycle.19
More recently, Ohlson (1995) introduces a mean-reverting process for residual income,
which is in the spirit of competition eroding a firm’s sustained ability to earn supernormal earnings.
By modeling residual income, instead of total income or changes in income, as an autoregressive
process, Ohlson (1995) better captures the intuitive economic effect of product-market competition.
Dechow, Hutton, and Sloan (1999) report evidence that supports the economic modeling of residual
income as an autoregressive process. However, they are able to achieve “only modest
improvements in explanatory power” over research using simpler earnings capitalization and
dividend discounting models (Dechow, Hutton, and Sloan, 1999, p. 3).
The second weakness of the literature linking earnings response coefficients to persistence is
that it tends to present in-sample evidence. For example, Kormendi and Lipe (1987) and Collins
and Kothari (1989) estimate time-series parameters and perform cross-sectional tests of a relation
between the persistence parameters and earnings response coefficients over the same sample
period.20 The absence of a predictive test weakens our confidence in the results, even though the
arguments and hypothesis are intuitive.21 Dechow, Hutton, and Sloan (1999) confirm that the
autoregressive properties at the industry level have predictive power with respect to the persistence
18 See Porter (1980), and Spence (1977, 1979, and 1981), Wernerfelt (1985), Richardson and Gordon (1980), and Rappaport (1981). 19 There is another stream of literature that derives predictions about the behavior of earnings response coefficients as a function of a firm’s life cycle that is rooted in the resolution of uncertainty about the parameter values of the time-series properties of earnings (see Rao, 1989, and Lang, 1991). 20 Ali and Zarowin (1992) point out that tests that ignore the effect of transitory earnings components (see below) in relating earnings response coefficients to persistence overstate the importance of persistence. However, even after controlling for this overstatement, they report that persistence is a significant determinant of earnings response coefficients. 21 One weakness of Lys, Ramesh, and Thiagarajan (1998) is precisely that their use of in-sample time-series properties does not permit them to convincingly discriminate between the following two hypotheses. The effect of time-series properties on earnings response coefficients and the Easton, Harris, and Ohlson (1992) argument that temporal aggregation of earnings is key to a strong relation between returns and earnings. I will revisit this issue below in the context of research on reasons why estimated earnings response coefficients are too small compared to their predicted values under certain modeling assumptions.

24
of earnings in future, but their objective was not to explicitly link persistence to earnings response
coefficients.
The third criticism of the literature on earnings response coefficient determinants, made in
Watts (1992, p. 238), is that it does “not control for differences in accounting earnings’ ability to
proxy for current and future cash flows and differences in accounting methods. This raises the
distinct possibility of a correlated omitted variables problem.” Salamon and Kopel (1991)
independently make a similar point. The potential for a correlated omitted variables problem arises
in part because of the following two possibilities. (i) There is an association between the earnings
response coefficients’ economic determinants like risk and accounting method choice. (ii)
Accounting method choice is correlated with earnings’ predictive power with respect to future cash
flows. In general, the literature on economic determinants of earnings response coefficients has not
adequately explored economic variables based on the contracting or accounting-choice theory
literature as earnings response coefficients’ determinants.22 This is worthy of future investigation. 23
4.1.1.E Competing hypotheses to explain why estimated earnings response coefficients are “too
small.”
Empirical estimates of earnings response coefficient magnitudes range from 1 to 3 (see, for
example, Kormendi and Lipe, 1987, and Easton and Zmijewski, 1989). Assuming a random walk
as a reasonable description of the time-series of annual earnings (see Ball and Watts, 1972, and
further discussion below) and a discount rate of about 10%, the expected magnitude of the earnings
response coefficient is about 11 (= 1 + 1/r). Using price-earnings multiple as a reasonable estimate
of the earnings response coefficient, one expects a magnitude of 8-20 depending on the time period
examined. The relatively small magnitude of the earnings response coefficient compared to its
predicted value motivated researchers to advance several hypotheses and explanations that I survey
22 Exceptions include studies like Baber, Janakiraman, and Kang (1996) and Baber, Kang, and Kumar (1998) that examine the interplay between earnings response coefficients, investment opportunities, and management compensation. 23 There is another criticism that concerns the temporal relation between interest rates and earnings response coefficients. Is the interest rate a causal determinant of earnings response coefficients? A large component of nominal interest rates is inflation. Finance and macroeconomics literature documents that shocks to inflation are negatively related to both shocks to real economic activity and stock market returns (see Fama and Schwert, 1977, and Fama, 1981). Furthermore, real economic activity and business outlook are negatively related to expected rates of returns on stocks and bonds (see Fama and French, 1988, and 1989, Balvers, Cosimano, and McDonald, 1990, and Chen, 1989). This means interest rates might be positively related to the risk premium, as suggested in the literature on time -varying expected rates of returns. Thus, the interest rate effect on earnings response coefficients (or on price-earnings multiples) might be via time-varying risk premium (i.e., expected return on the market minus the risk free rate of interest). Interest rate itself might not be the causal factor contributing to its negative relation with earnings response coefficients.

25
below. Interestingly, however, the inquiry into a comparison of the estimated with the predicted
magnitude of the earnings response coefficients predates the earnings response coefficient literature
that began with Kormendi and Lipe (1987).
Beaver, Lambert, and Morse (1980) attempt to explain the difference between predicted and
estimated values of earnings response coefficients by introducing three inter-related ideas: prices
lead earnings (see below), a true-earnings-plus-noise model of accounting earnings, and a reverse-
regression econometric research design. Another notable attempt appears in Easton and Harris
(1991). Assuming the book value of equity is a noisy proxy for the market value of equity and
assuming clean surplus, they argue that earnings measures the change in the market value of equity.
They therefore argue that earnings-deflated-by-price should be used in addition to earnings-change-
deflated-by-price in explaining earnings. If the balance-sheet perspective in Easton and Harris
(1991) is adopted, the predicted coefficient on earnings is one, which implies earnings are entirely
transitory. Since earnings are highly persistent, I find the Easton and Harris (1991) explanation
unsatisfactory even though their evidence clearly shows that earnings-deflated-by-price
significantly explains stock returns beyond the earnings-change variable. Kothari (1992) and
Ohlson and Shroff (1992) offer alternative, earnings-expectations-based motivation for using
earnings-deflated-by-price to explain stock returns in a return-earnings regression. In recent years,
researchers estimating a return-earnings regression frequently use earnings-deflated-by-price
variable to explain stock returns. However, the estimated earnings response coefficient is far from
its predicted value of approximately the price-earnings multiple.
At least four hypotheses explain the observed low magnitudes of earnings response
coefficients: (a) prices lead earnings; (b) inefficient capital markets; (c) noise in earnings and
deficient GAAP; and (d) transitory earnings.24 I discuss these below along with a summary of the
evidence.
(a) Prices lead earnings. An important paper, Beaver, Lambert, and Morse (1980),
develops the idea that the information set reflected in prices is richer than that in contemporaneous
24 An additional reason is whether the earnings response coefficient is estimated using time -series data for an individual firm or it is estimated for classes of securities in the cross-section. Teets and Wasley (1996) offer compelling evidence that firm-specific, time -series estimates of earnings response coefficients are substantially larger than those estimated using cross-sectional regression. They show that the firm-specific estimates are on average larger because of a strong negative cross-sectional correlation between the variance of unexpected earnings and firm-specific earnings response coefficient. In pooled estimations, the high, unexpected earnings variance firms receive disproportionate weight, which causes the estimated coefficient to be smaller than the average of the firm-specific estimates.

26
accounting earnings.25 In an efficient market, price changes instantaneously incorporate the present
value of the revisions in the market’s expectations of future net cash flows. In contrast, because of
the revenue realization and expense matching principles that are fundamental to the earnings
determination process (Statement of Financial Accounting Concepts No. 6, paras. 78-79),
accounting earnings incorporate the information reflected in price changes systematically with a lag.
This is parsimoniously referred to as “prices lead earnings.”
One implication of prices leading earnings is that even though annual earnings’ time-series
properties are reasonably described as a random walk and thus successive earnings changes are
unpredictable using the information in past time series of earnings, the information set reflected in
prices contains information about future earnings changes. That is, from the perspective of the
market, successive annual earnings changes are not unpredictable. The econometric consequence of
prices leading earnings is that when returns are correlated with contemporaneous earnings changes,
only a portion of the earnings change is a surprise to the market. In an efficient market, the
anticipated portion of the earnings change is irrelevant in explaining contemporaneous returns. This
informationally irrelevant portion of earnings change contributes to a standard errors-in-variables
problem (see Maddala, 1988, ch. 11, or Greene, 1997, ch. 9), which biases downward the earnings
response coefficient and reduces the explanatory power of the return earnings regression. Thus,
simply correlating earnings change with returns or failure to use an accurate proxy for unexpected
earnings in the presence of prices leading earnings is hypothesized as a reason for earnings response
coefficients that are “too small.”
(b) Inefficient capital markets. If the market fails to correctly appreciate the implications
of a current earnings surprise in revising its expectations of future earnings, the price change
associated with earnings change will be too small. There is a large body of evidence that suggests
that the stock market underreacts to earnings information and recognizes the full impact of the
earnings information only gradually over time (see references in section 3 on the post-earnings-
announcement-drift literature and further discussion in this section under “tests of market
efficiency”). Smaller-than-predicted values of earnings response coefficients are consistent with
25 Following Beaver, Lambert, and Morse (1980), there has been voluminous work on the implications of prices leading earnings. A selected list of papers includes Collins, Kothari, and Rayburn (1987), Beaver, Lambert, and Ryan (1987), Freeman (1987), Collins and Kothari (1989), Kothari (1992), Kothari and Sloan (1992), Easton, Harris, and Ohlson (1992), Warfield and Wild (1992), Jacobson and Aaker (1993), Collins, Kothari, Shanken, and Sloan (1994), Beaver, McAnally, and Stinson (1997), Basu (1997), Ball, Kothari, and Robin (2000), and Liu and Thomas (2000).

27
capital market inefficiency. Such an interpretation, however, should be tempered unless there is a
logically consistent inefficient markets theory that predicts underreaction to earnings information.
The reason is that overreaction is just as easily possible as underreaction in an inefficient market
without a theory that predicts a particular phenomenon.
(c) Noise in earnings and deficient GAAP. The “noise in earnings” argument gained
currency among accounting academics with Beaver, Lambert, and Morse (1980).26 While Beaver et
al. elegantly express the intuition for why prices lead earnings, their modeling (see section 2 in
Beaver et al.) relies on defining accounting earnings as the sum of “true earnings” plus value-
irrelevant noise or a garbling component that is uncorrelated with stock prices (i.e., value) or returns
in all periods.27 This assumption enables Beaver et al. to present one model of the prices-lead-
earnings phenomenon. 28 However, the “true-earnings-plus-noise” view of earnings suggests that
accountants garble an otherwise “true earnings” signal about firm value. This seems
counterintuitive and contrary to evidence on at least two grounds. First, there is evidence that
accounting accruals are informative (see Rayburn, 1986, and Dechow, 1994, and many other
studies). Second, regardless of whether accruals are informative or not, it seems unlikely that
earnings without the accruals would be “true income.” There is no economic intuition to suggest
that an earnings-measurement process that emphasizes a transaction-based approach would generate
“true income,” which means earnings that capture all of the information that is in economic income,
i.e., the change in equity market capitalization. In fact, the thesis of Beaver et al. is that prices lead
earnings, which means the information set in price changes is richer than that in accounting
earnings.
The deficient-GAAP argument takes the major objective of financial reporting to be “the
prediction of future investor cash flows or stock returns” (Lev, 1989, p. 157). Proponents of the
deficient-GAAP argument therefore use the return-earnings correlation as a measure of GAAP’s
success in fulfilling its objective. The maintained hypothesis is that capital markets are
informationally efficient and the major objectives of financial reporting are generally inferred from
26 Also see Choi and Salamon (1990), Collins and Salatka (1993), Ramesh and Thiagarajan (1993), and Ramakrishnan and Thomas (1998). 27 However, there is no consensus in the literature on the definition of value-irrelevant noise. See, for example, Ramakrishnan and Thomas (1998). 28 For a different approach, see Fama (1990), Lipe (1990), Ohlson and Shroff (1992), Kothari (1992), Kothari and Sloan (1992), and Kothari and Zimmerman (1995). This alternative approach is described below.
28
the FASB’s Statements of Financial Accounting Concepts.29 In a series of papers, Baruch Lev with
numerous coauthors has been probably the single biggest advocate of the “deficient GAAP”
argument. Deficient GAAP is claimed to produce “low quality” earnings that exhibit only weak
correlation with security returns. Lev (1989, p. 155) states, “While misspecification of the
return/earnings relation or the existence of investor irrationality (“noise trading”) may contribute to
the weak association between earnings and stock returns, the possibility that the fault lies with the
low quality (information content) of reported earnings looms large.”
Lev expresses similar views in the context of accounting for research and development in
Amir and Lev (1996), Aboody and Lev (1998), Lev and Sougiannis (1996), Lev and Zarowin
(1999), and other papers. In addition, there is a vast positive empirical literature that examines the
“deficient-GAAP” argument without making regulatory prescriptions. See, for example, Abraham
and Sidhu (1998), Healy, Myers, and Howe (1998), and Kothari, Leone, and Laguerre (1999) in the
context of the capitalization versus expensing of research and development costs and Bryant (1999)
in the context of full cost versus successful efforts method of accounting for oil-and-gas drilling
costs.
The noise- in-earnings and deficient-GAAP arguments have similar consequences for the
return-earnings correlation. Both weaken the contemporaneous return-earnings correlation and bias
downward the earnings response coefficient (see, for example, Beaver, Lambert, and Morse, 1980,
the appendix in Lev, 1989, or Kothari, 1992). However, I believe the two arguments are different.
Noise is defined as a variable that is uncorrelated with the information in security returns in all time
periods, i.e., current, past, and future. Deficient GAAP, in contrast, is simply another form of the
prices- lead-earnings argument, except that there is a normative undercurrent in the deficient-GAAP
argument. The deficient-GAAP argument posits that financial statements are slow to incorporate
the information that is reflected in contemporaneous market values. In addition, it assumes that the
greater the contemporaneous correlation of earnings with returns, the more desirable the GAAP that
produces that earnings number. Unfortunately, the reasons why maximizing the earnings’
29 For example, Lev (1989) quotes the following from the FASB’s Statement of Financial Accounting Concepts No. 1 (1978, para. 43): “The primary focus of financial reporting is information about an enterprise’s performance provided by measures of earnings and its components. Investors, creditors, and others who are concerned with assessing the prospects for enterprise net cash flows are especially interested in that information. Their interest in an enterprise’s future cash flows and its ability to generate favorable cash flows leads primarily to an interest in information about its earnings…”

29
correlation with stock returns is desirable are not well articulated or proven logically. I have
touched upon this issue earlier, but a detailed treatment appears in Holthausen and Watts (2001).
(d) Transitory earnings. Although annual earnings are frequently assumed to follow a
random walk, the presence of transitory components in earnings has long been recognized in the
literature (see, for example, Brooks and Buckmaster, 1976, and Ou and Penman, 1989). There are
several reasons for transitory earnings. First, certain business activities, like asset sales, produce
one-time gains and losses.30
Second, because of information asymmetry between managers and outsiders, and because of
potential litigation, there is a demand for and supply of conservative accounting numbers.
Following Basu (1997, p. 4), I define conservatism as asymmetry in the speed with which
accounting numbers reflect economic gains and losses or earnings reflecting “bad news more
quickly than good news” (also see Ball, Kothari, and Robin, 1999). Both information asymmetry
and threat of litigation motivate management to disclose bad news on a more timely basis than good
news. That is, the accounting recognition criteria have evolved to be less stringent for losses than
gains such that anticipated losses, but not gains, are recognized more often and more quickly.
Recognition of anticipated losses approximates recognition of the market value effect (loss) as it
becomes known, so losses, like market value changes, are transitory. Hayn (1995) points out
another reason for losses being transitory. She argues that the firm has an abandonment put option
to discontinue the loss-making (or below-market return generating) operation and recoup the book
value of the firm’s assets. So, only firms expecting to improve will continue operations, which
means observed losses would be temporary. The loss-making firms’ ability to recoup the book
value through abandonment and adaptation enhances the book value’s association with prices in
periods when a firm is performing poorly (also see Berger, Ofek, and Swary, 1996, Burgstahler and
Dichev, 1997, Barth, Beaver, and Landsman, 1998, and Wysocki, 1999).31 The role of book values
in valuation and book values’ association with prices are topics examined in some detail below and
especially in Holthausen and Watts (2001).
30 Here I assume the business events that produce one-time gains or losses are exogenous. If managerial incentives were to influence the occurrence of these events, then they would be endogenous (e.g., Bartov, 1991). The endogenous nature of these events is more realistic and it is discussed below. 31 The abandonment option is a real option. See Robichek and Van Horne (1967) for an early treatment of the abandonment option in capital budgeting. The role of real options in valuation is an important emerging area in financial economics. See Pindyck (1988), Dixit and Pindyck (1994), Abel, Dixit, Eberly, and Pindyck (1996), and Trigeorgis (1996) for excellent treatments of real options and valuation. The idea of real options has recently been applied in accounting (see Wysocki, 1999), but I believe there is far more potential still to be realized.
30
Finally, managerial motivations rooted in agency theory might contribute to transitory gains
and losses. For example, Healy (1985) hypothesizes and documents evidence that for compensation
considerations in a costly-contracting setting, managers might generate discretionary accruals that
reduce high levels of non-discretionary earnings or might take a “big bath” to report an extreme
loss.32 The “big bath” discretionary accrual behavior is also observed with incoming CEOs (see
Pourciau, 1993, and Murphy and Zimmerman, 1993). The discretionary component of the accruals
is likely to be transitory and in fact mean reverting because accruals (eventually) reverse.
Econometric consequence of transitory earnings
The econometric consequence of transitory earnings components is straightforward. A
simple model based on the analysis in Kothari and Zimmerman (1995, section 5.1) illustrates the
effect. I follow it up with a richer analysis later. Suppose
Xt = xt + ut,
where Xt = reported earnings consisting of a random walk component, xt = xt-1 + et, et ~ N(0, s2e)
and a transitory component, ut ~ N(0, s2u). Also assume that the market has no information beyond
the time-series property of earnings and that et and ut are uncorrelated. The earnings response
coefficient on the transitory component is one. However, the market’s sensitivity to the random
walk component, i.e., the permanent component of earnings is β = (1 + 1/r) or the average price-
earnings multiple. Using the beginning-of-period-price, Pt-1, as the deflator, a return-earnings
regression
Rt = γ0 + γ1 Xt/Pt-1 + errort
will yield a slope coefficient that falls between 1 and β because Xt is the sum of two independent
variables with two different slope coefficients relating them to the dependent variable.
Disentangling the two components and including those separately in the regression will yield
coefficients on the two components that are closer to their predicted values (see, for example,
Collins, Maydew, and Weiss, 1997) and the model’s explanatory power will increase. The
γ1 coefficient’s magnitude depends on the relative magnitudes of the variances of the random walk
and transitory components of earnings. If k is defined as s2e/(s2
e + s2u), then γ1 is expected to equal
k(β - 1) + 1. Thus, if there are no transitory earnings, then k = 1 and the slope coefficient will be β .
32 Following Healy (1985), there is a huge literature that examines compensation-motivated earnings management. This and other earnings management literature on the debt and political cost hypotheses that originated with the positive accounting theory (see Watts and Zimmerman, 1978, 1986) is beyond the scope of my review, unless it is related to the capital markets research.
31
Alternatively, at the other extreme, if there are no permanent earnings, then k = 0 and the slope
coefficient will be 1 on entirely transitory earnings.
As the assumption of zero correlation between the random walk and transitory earnings
components is relaxed, the predictions about γ1’s magnitudes naturally change. Economic
hypotheses about managers’ incentives would generally suggest a non-zero correlation between the
two components, which complicates the analysis.
Evidence on transitory earnings’ effect on earnings response coefficients
There is an extensive literature documenting a smaller earnings response coefficient on
transitory earnings as proxied for by non-recurring items reported in the financial statements (see,
for example, Collins, Maydew, and Weiss, 1997, Hayn, 1995, Elliott and Hanna, 1996, and
Ramakrishnan and Thomas, 1998, and Abarbanell and Lehavy, 2000a). In addition, there is a
literature on non- linearities in the return-earnings relation that attempts to infer transitory earnings
from the magnitude of earnings response coefficients. An S-shaped return-earnings relation is seen
from the empirical results of Beaver, Clarke, and Wright (1979). They find that abnormal returns
associated with extreme earnings changes are not proportionately as large as those associated with
the non-extreme earnings change portfolios, which gives rise to an S-shaped return-earnings
relation. One interpretation is that the market does not expect extreme earnings changes to be
permanent, so the price adjustment is smaller. Thus, there is a negative correlation between the
absolute magnitude of the earnings change and the likelihood that it is permanent. An appealing
economic intuition exists for this correlation. Either extreme earnings changes are a result of one-
time, windfall gains and losses, or competition in the product market makes it unlikely that the
extreme high level of profitability can be sustained. At the extreme low level of earnings, the
abandonment option argument is relevant.
Freeman and Tse (1992) model the non- linear relation using an arc-tangent transformation.
Cheng, Hopwood, and McKeown (1992) propose a rank-regression approach to tackle non-
linearity. Other research on the nonlinear return-earnings relation includes Abdel-khalik (1990),
Das and Lev (1994), Hayn (1995), Subramanyam (1996a), Basu (1997), and Beneish and Harvey
(1998). While the research on non- linearity is successful in improving the return-earnings
regression fit, a strong economic foundation for the modeling is not apparent. Therefore,
researchers must exercise caution in employing ad hoc statistical refinements.

32
4.1.1.F Discriminating between competing hypotheses
Researchers have used many different research designs to discriminate between the above
four competing hypotheses to explain the weak return-earnings correlation and why estimated
earnings response coefficients are too small compared to those predicted on the basis of a random
walk time series property of annual earnings. Prices leading earnings and the presence of transitory
earnings appear to be the dominant explanations for the modest contemporaneous return-earnings
association and for the observed magnitudes of earnings response coefficients. A summary of this
research will hopefully make this apparent.
There is another reason for summarizing the above research. In many applications,
researchers choose a research design from among many alternatives available. To facilitate
research design selection in the future, I summarize the central features of and pros and cons of the
research designs using common notation. The modeling below extends Fama’s (1990) analysis of
the effect of expanding the measurement window for both returns and earnings (industrial
production) on the return-earnings correlation and earnings response coefficient.
An important distinction between the analysis in Fama (1990) or similar studies in finance
and the return-earnings literature in accounting centers around the maintained hypothesis and
motivation for the studies. In the finance literature, the maintained hypothesis is that explanatory
variables like industrial production are real, economic, fundamental variables that a researcher has
measured with a reasonable degree of accuracy. The motivation for their tests is to examine
whether time-series or cross-sectional variation in stock returns is rational (efficient) in the sense
that it is largely explained by economic fundamentals. The alternative hypothesis is that pricing in
the market is not an outcome of the market participants’ rational economic behavior. The objective
of the accounting literature like Ball and Brown (1968) or Easton, Harris, and Ohlson (1992) is to
assess whether the accounting earnings determination process captures the factors that affect
security prices, with the maintained hypothesis that capital markets are informationally efficient.
So, market efficiency is a maintained hypothesis and whether accounting captures underlying
economic reality that moves the market is tested in the research (see Patell, 1979, for a
mathematically elegant treatment of these issues).
Assumptions and variable definitions
I present a simple model of the relation between earnings growth rates and stock returns,
which captures the prices-lead-earnings phenomenon. I use growth rates because it simplifies the

33
analysis. However, the intuition from the analysis is equally applicable to return-earnings analysis
that uses earnings or earnings change deflated by price as the earnings variable in the regressions.
The particulars of the econometrics naturally change with different specifications of the variables,
but the qualitative results continue to hold.
Suppose earnings growth in period t, Xt, is
Xt = xt + yt-1 (1)
where xt is the portion of earnings growth that is news to the market, whereas yt-1 is the portion of
earnings growth that the market had anticipated at the beginning of period t. Stated differently, yt-1
is past earnings news that shows up in period t’s earnings, i.e., prices lead earnings. Further assume
that xt and yt-1 are uncorrelated and i.i.d., with σ2(x) = σ2(y) = σ2. These assumptions imply
earnings follow a random walk and that each component of earnings growth contributes to a new
permanent level of earnings. Using earnings growth rates empirically poses practical difficulties
because earnings can be negative. I assume this issue away here in the interest of a simple analysis
that communicates the intuition.
Stock prices respond only to information about earnings growth, i.e., discount rates are
assumed constant inter-temporally and cross-sectionally. Given the assumptions about earnings
growth rates, return in period t, Rt, is
Rt = xt + yt (2)
Current stock return reflects the news in current earnings and news about earnings growth
that will be captured in the next period’s earnings. In this model, the market is assumed to have
information about one-period-ahead earnings growth rate. This is a conservative assumption in that
previous research suggests prices reflect information about two-to-three-year-ahead earnings growth
(e.g., Kothari and Sloan, 1992).
Since all the earnings information is expressed in terms of growth rates and because all
earnings growth is assumed to be permanent, annual stock returns are simply the sum of the
earnings growth rates that are news to the market. That is, there is a one-to-one correspondence
between stock returns and news in earnings growth rates, and the price response to unexpected
earnings growth, i.e., the earnings response coefficient, is one. If, instead of using earnings growth
rates, unexpected earnings deflated by the beginning of the period price are used, then the earnings
response coefficient is (1 + 1/r).
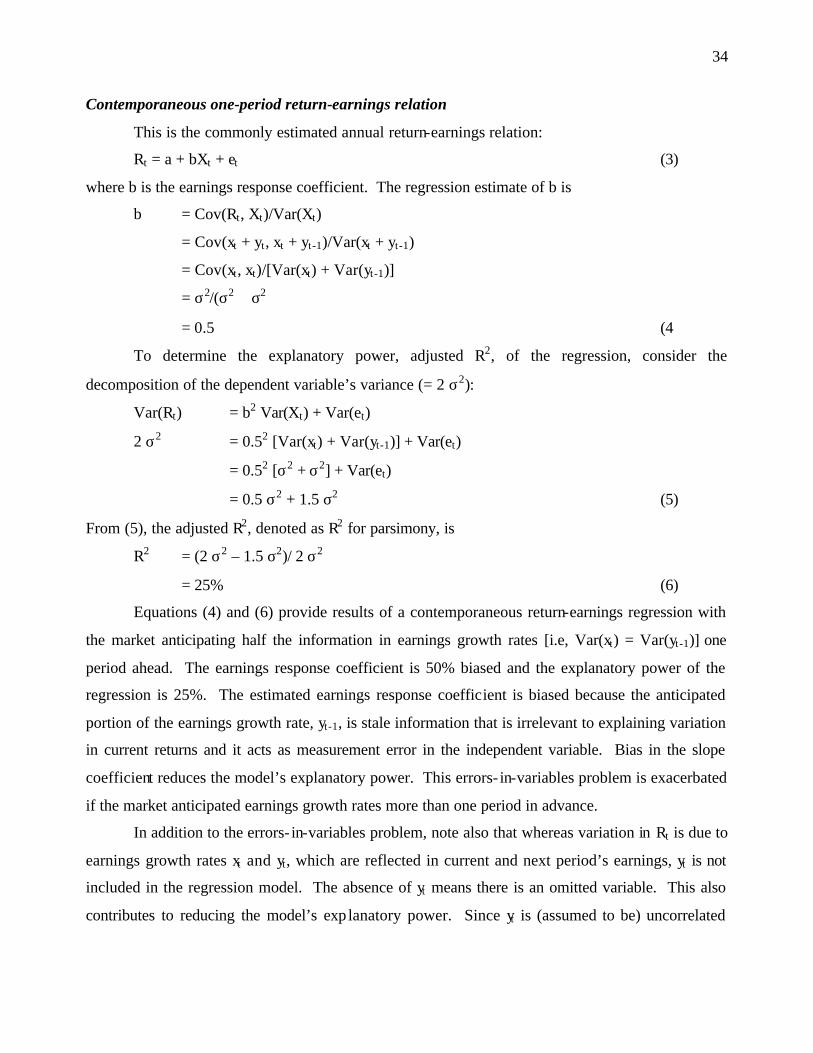
34
Contemporaneous one-period return-earnings relation
This is the commonly estimated annual return-earnings relation:
Rt = a + bXt + et (3)
where b is the earnings response coefficient. The regression estimate of b is
b = Cov(Rt, Xt)/Var(Xt)
= Cov(xt + yt, xt + yt-1)/Var(xt + yt-1)
= Cov(xt, xt)/[Var(xt) + Var(yt-1)]
= σ2/(σ2 + σ2)
= 0.5 (4)
To determine the explanatory power, adjusted R2, of the regression, consider the
decomposition of the dependent variable’s variance (= 2 σ2):
Var(Rt) = b2 Var(Xt) + Var(et)
2 σ2 = 0.52 [Var(xt) + Var(yt-1)] + Var(et)
= 0.52 [σ2 + σ2] + Var(et)
= 0.5 σ2 + 1.5 σ2 (5)
From (5), the adjusted R2, denoted as R2 for parsimony, is
R2 = (2 σ2 – 1.5 σ2)/ 2 σ2
= 25% (6)
Equations (4) and (6) provide results of a contemporaneous return-earnings regression with
the market anticipating half the information in earnings growth rates [i.e, Var(xt) = Var(yt-1)] one
period ahead. The earnings response coefficient is 50% biased and the explanatory power of the
regression is 25%. The estimated earnings response coefficient is biased because the anticipated
portion of the earnings growth rate, yt-1, is stale information that is irrelevant to explaining variation
in current returns and it acts as measurement error in the independent variable. Bias in the slope
coefficient reduces the model’s explanatory power. This errors- in-variables problem is exacerbated
if the market anticipated earnings growth rates more than one period in advance.
In addition to the errors- in-variables problem, note also that whereas variation in Rt is due to
earnings growth rates xt and yt, which are reflected in current and next period’s earnings, yt is not
included in the regression model. The absence of yt means there is an omitted variable. This also
contributes to reducing the model’s exp lanatory power. Since yt is (assumed to be) uncorrelated

35
with the included independent variable, Xt (= xt + yt-1), the coefficients on the included earnings
growth rates are not biased due to a correlated omitted variable.
Include future earnings in the return-earnings model. Previous research in accounting and
finance employs several alternative approaches to mitigate the errors- in-variables and omitted-
variable problems in the return-earnings or similar regressions. Jacobson and Aaker (1993) and
Warfield and Wild (1992) in return-earnings regressions and Fama (1990) and Schwert (1990) in
regressions of returns on industrial production include future years’ earnings or production growth.
In the context of the simple model, their approach estimates the following model (see figure 1):
Rt = a + b Xt + c Xt+1 + et (7)
In this case, since Xt and Xt+1 are uncorrelated (because the x and y components of earnings
growth rates are assumed to be i.i.d.), b is the same as before in the univariate regression of returns
on contemporaneous earnings growth, i.e., b = 0.5. The expected value of c is
c = Cov(xt + yt, xt+1 + yt)/Var(xt+1 + yt)
= 0.5 (8)
To derive the model’s explanatory power, I decompose the variances
Var(Rt) = b2 Var(Xt) + c2 Var(Xt+1) + Var(et)
2 σ2 = 0.52 [2σ2] + 0.52 [2σ2] + Var(et)
= σ2 + σ2(et) (9)
R2 = σ2/2 σ2 = 50% (10)
The explanatory power increases from 25% for the contemporaneous regression model to
50% upon the inclusion of future earnings growth rate. Coefficients on both current and future
earnings growth will be value relevant, but biased because both contain earnings growth rate
components that are irrelevant to explaining Rt. This also dampens the explanatory power. The R2
is greater than the contemporaneous model’s because there is no omitted variable in eq. (7).
Expanding the return-earnings measurement window
Easton, Harris, and Ohlson (1992), Warfield and Wild (1992), Fama (1990), and Schwert
(1990) report results of estimating contemporaneous return-earnings models in which both returns
and earnings measurement windows are allowed to vary. Expanding the measurement window
mitigates both errors- in-variable and omitted variable problems that arise because of prices leading
earnings. In addition, if the noise is mean-reverting, then the ratio of the variance of noise to the

36
variance of value-relevant earnings will decrease as the measurement window is expanded.33
Ignoring noise, the effect of expanding the return-earnings measurement window on the following
contemporaneous regression is (see figure 1):
Rt + Rt+1 = a + b (Xt + Xt+1) + et, t+1 (11)
The slope coefficient is
b = Cov[(xt + yt + xt+1 + yt+1), (xt + yt-1 + xt+1 + yt)]/Var[(xt + yt-1 + xt+1 + yt)]
= 3 σ2 / 4 σ2
= 0.75 (12)
The explanatory power is
Var(Rt + Rt+1) = b2 Var(Xt + Xt+1) + Var(et, t+1)
4 σ2 = 0.752 * 4 σ2 + Var(et,t+1) (13)
From eq. (13), the R2 of the regression model (11) is 56.25%. The above analysis
demonstrates that expanding the return measurement window yields a less biased earnings response
coefficient and a higher explanatory power than in the case of a single-period contemporaneous
return earnings regression. If the measurement window is expanded further, then an even stronger
regression fit will be obtained and the estimated slope becomes less biased.34 However, there will
always be an end-point problem. Some forward- looking information about earnings growth exists
in returns, yt+1 in eq. (12), but it is missing from the earnings variable (i.e., the omitted variable
problem). Similarly, earnings growth at the beginning part of the measurement window contains
some stale information, yt-1 in eq. (12), which serves as measurement error in the independent
variable.
33 In case of mean-reverting noise, variance of the sum of noise over n periods is less than n times the variance of noise in a single period. In contrast, i.i.d. value-relevant growth implies the variance of the sum of earnings growth rates over n periods is n times the single period variance of the earnings growth rate. This causes the ratio of the variance of noise to the variance of earnings growth to decline as the measurement window is expanded. 34 Unfortunately there are disadvantages of expanding the window too much. First, as the window is expanded, a larger fraction of the variation in the dependent variable in the cross-section is accounted for by differences in expected rates of returns in the cross-section. Therefore, it becomes increasingly difficult to unambiguously attribute explained variation from the return-earnings regression to earnings (or cash flow) information (see Easton, Harris, and Ohlson, 1992, for a discussion of this concern and Fama and French, 1988, Fama, 1990, and Sloan, 1993, for a discussion of the sources of variability in returns). Second, as the measurement window is expanded, a researcher must impose increasingly stringent data availability requirements, which introduces survivor biases. Third, discriminating between noise and prices-lead-earnings explanations becomes tenuous.

37
Including leading period return
Kothari and Sloan (1992), Warfield and Wild (1992), and Aaker and Jacobson (1993)
regress current and past returns on current period earnings to overcome the errors-in-variables
problem that arises in a return-earnings regression as a result of prices leading earnings. The
regression in the context of the simple model here is (see figure 1):
(Rt + Rt-1) = a + b Xt + et-1,t (14)
The slope coefficient is
b = Cov[(xt + yt + xt-1 + yt-1), (xt + yt-1)]/Var[(xt + yt-1)]
= 2 σ2 / 2 σ2
= 1 (15)
The explanatory power is
Var(Rt + Rt-1) = b2 Var(Xt) + Var(et-1, t)
4 σ2 = 12 * 2 σ2 + Var(et-1,t). (16)
From eq. (16), the R2 of the regression model (14) is 50%, even though the slope coefficient
is unbiased. The return-earnings association is not perfect because there are omitted (explanatory)
variables in the model to explain information about future earnings growth that is reflected in
current returns. In addition, the dependent variable has some news about earnings in period t-1, xt-1,
that is also not included in the explanatory variable, Xt.
Leading period returns in regression model (14) are helpful in discriminating between the
noise and prices- lead-earnings hypotheses. In the presence of noise the slope coefficient will not
approach one, whereas by including higher-order lagged returns, the prices- lead-earnings
phenomenon will be captured and the slope coefficient will increase towards one. Presence of
transitory components in earnings will prevent the model from yielding a slope coefficient of one,
however. Evidence in Kothari and Sloan (1992) suggests a dramatic rise in the earnings response
coefficient as leading period returns are included, consistent with price leading earnings being an
important characteristic of the information environment. Their estimated slope coefficients fall
short of approaching the price-earnings multiples, consistent with both noise and transitory earnings
components.
Including future earnings and future returns
We saw earlier that when returns are regressed on current and future earnings growth, an
errors- in-variables problem arises in part because future earnings growth contains future
38
information that cannot explain current returns. Drawing on Kothari and Shanken (1992), Collins,
Kothari, Shanken, and Sloan (1994) mitigate this errors- in-variables problem by including future
return as an independent variable. The benefit of future return arises through its correlation with the
new information in future earnings growth. Econometrically, future return removes the new
information error from the future earnings growth variable.35 Specifically, the regression model is
(see figure 1):
Rt = a + b Xt + c Xt+1 + d Rt+1 + et (17)
The intuition for why including Rt+1 mitigates the errors- in-variables problem in using future
earnings growth is best seen from the following equivalent two-stage procedure (see the appendix
of Kothari and Shanken, 1992). If Xt+1 is regressed on Rt+1 in a first stage regression, then the
residual from that regression will be the portion of t+1 period earnings growth that is unrelated to
new information in Rt+1. This residual is (a noisy estimate of) the anticipated portion of earnings
growth or the yt component of Xt+1 in the context of the simple model in this section. The second-
stage of the procedure is a regression of Rt on Xt and the residual from the first stage regression, i.e.,
an estimate of yt.
If proxies for both the new information in future earnings growth and for the anticipated
component of current growth are accurate, then the approach in Kothari and Shanken (1992) and
Collins et al. (1994) will be successful. That is, the estimated earnings response coefficients will be
unbiased and the model’s explanatory power will approach 100%. Note that the model in eq. (17)
will have to be expanded to also include proxies for the anticipated component of current growth,
Xt. Of course, success of the model depends crucially on the quality of the proxies. Evidence in
Collins et al. is largely consistent with the prices- lead-earnings argument and they find little support
for the noise- in-earnings hypothesis.
Use of analysts’ forecasts instead of future returns
Recently, Liu and Thomas (1999a and b), Dechow, Hutton, and Sloan (1999), and others
have begun to directly incorporate information about revised expectations of future earnings growth
in a return-earnings regression through the use of analysts’ forecasts.36 This is similar in spirit to
35 For a related practice in the accounting literature of using prior returns as a proxy for expected earnings, see Brown, Griffin, Hagerman, and Zmijewski (1987b), Collins, Kothari, and Rayburn (1987), and Lys and Sivaramakrishnan (1988). Instead of past returns, Collins et al. (1994) use earnings yield at time t-1 to control for the anticipated earnings growth for period t. 36 Also see Abdel-khalik (1990) for a similar approach with the motivation of developing a return-earnings model that accounts for non-linearity.

39
the model in eq. (17) in which expectations about earnings growth are econometrically backed out
through the use of actual future earnings growth minus the impact of new information on future
earnings growth. The Liu and Thomas (1999a and b) type of research begins with the Edwards and
Bell (1961), Peasnell (1982), Ohlson (1995), and Feltham and Ohlson (1995) residual income
valuation model. This model defines price as the sum of the book value of equity and the
discounted present value of expected future residual earnings (i.e., earnings in excess of the cost of
the expected book value of the equity capital employed in future years).37 Residual income
valuation models are a transformation of the dividend-discounting model (see Feltham and Ohlson,
1995, Dechow, Hutton, and Sloan, 1999, or Lee, 1999), but express value directly in terms of
current and future accounting numbers, book values and earnings. This potentially facilitates the
use of analysts’ forecasts.
Researchers typically use analysts’ forecasts of earnings and book values of equity to proxy
for expected future residual earnings.38 Availability of forecasts in a machine-readable form has
spurred the use of analysts’ forecasts in capital markets research (see below). Recent research that
uses analysts’ forecasts documents a strong association between returns and contemporaneous
earnings and revisions in analysts’ forecasts in a residual income framework. However, more
research is needed to determine whether the source of the improved association is the use of
analysts’ forecasts or the residual income model or a combination. A comparison with simpler
models with and without analysts’ forecasts would be a natural next step. Dechow, Hutton, and
Sloan (1999) have made a very good beginning in this respect.39
Levels regression to obtain less biased estimates of earnings response coefficients
Kothari and Zimmerman (1995) argue that one advantage of the levels regression (i.e., price
regressed on earnings) is that the errors- in-variables problem is avoided. The logic is
straightforward. Current price contains all the information in current earnings plus some forward-
37 For a historical perspective on the concept of residual income valuation, see Biddle, Bowen, and Wallace (1997), who trace it all the way back to Hamilton (1777) and Marshall (1890). 38 Use of analysts’ forecasts generally violates the clean surplus assumption underlying the residual income model because analysts’ forecasts often exclude items that affect book values of equity. However, the use of analysts’ forecasts should be guided by their usefulness in explaining and predicting empirical phenomena rather than whether they are consistent with the clean surplus assumption. 39 While there are advantages of using analysts’ forecasts, there are also problems because of apparent optimism in analysts’ forecasts, which varies cross-sectionally with earnings skewness (see Gu and Wu, 2000). I defer a detailed discussion of these issues to the next section.
40
looking information that is missing from current earnings because prices lead earnings. Therefore,
when price is regressed on earnings, there is no errors- in-variables problem in the right-hand-side
variable. Only forward-looking information, which is uncorrelated with the included independent
variable, earnings, is omitted from the regression. The econometric consequence is that the
estimated earnings response coefficient is unbiased, but that the explanatory power is sacrificed
because of the omitted forward- looking information.
The bad news in using levels regressions is that there are potentially other econometric
problems, like correlated omitted variables (e.g., growth), and heteroskedasticity. These and other
related issues are discussed thoroughly in Brown, Lo, and Lys (2000) and Holthausen and Watts
(2001).
4.1.1.G Bottom line
The earnings response coefficient research has made significant progress in the last decade.
However, notwithstanding these refinements, I believe the best a researcher can do currently is to
test whether a coefficient is statistically significant or whether it is significantly greater than the
coefficient on another variable (e.g., coefficient on earnings versus on cash flow from operations).
The research also suggests that controlling for the effects of persistence, growth, and risk on
earnings response coefficients is important. It is rare to see research examining whether the
estimated coefficient equals some predicted value. Only occasionally have researchers attempted to
test whether the estimated coefficient on transitory earnings equals one (e.g., Barth, Beaver, and
Landsman, 1992). The lack of tests of predicted coefficient magnitudes is in part because predicted
values depend on unobservable forecasted earnings growth rates over all future periods and
expected discount rates for future periods’ earnings. Levels regressions yield earnings response
coefficient estimates that are closer to economically plausible values. However, severe econometric
problems make their use less attractive (see Holthausen and Watts, 2001).
4.1.2 Time series, management, and analysts’ forecasts of earnings
This section explains the motivation for research on properties of time-series, management,
and analysts’ forecasts of earnings (section 4.1.2.A). I then describe research on the properties of
time-series forecasts of earnings in section 4.1.2.B, management’s forecasts in section 4.1.2.C, and
finally the research on analysts’ forecasts in section 4.1.2.D.

41
4.1.2. A Motivation for research on earnings forecasts
There are at least five reasons for research on the time-series properties of earnings and
properties of management and analysts’ forecasts (see Watts and Zimmerman, 1986, ch. 6,
Schipper, 1991, and Brown, 1993, for discussions of some of these reasons). First, almost all
models of valuation either directly or indirectly use earnings forecasts. The discounted cash flow
valuation models (see Fama and Miller, ch. 2) often use forecasted earnings, with some
adjustments, as proxies for future cash flows. The analytically equivalent residual- income valuation
models (e.g., Edwards and Bell, 1961, Ohlson, 1995, Feltham and Ohlson, 1995) discount
forecasted earnings net of “normal” earnings.
Second, capital markets research that correlates financial statement information with
security returns frequently uses a model of expected earnings to isolate the surprise component of
earnings from the anticipated component. In an efficient capital market, the anticipated component
is uncorrelated with future returns, which are measured over the announcement period or the
association study period. Any anticipated component that smears the estimated proxy for the
surprise component of earnings, serves as noise or measurement error in the proxy and weakens the
estimated return-earnings association. Thus, the degree of return-earnings association hinges
critically on the accuracy of the unexpected earnings proxy used by a researcher, which naturally
creates a demand for the time-series properties of earnings or analysts’ forecasts.
Third, the efficient markets hypothesis is being increasingly questioned, both empirically
and theoretically (with behavioral finance models of inefficient markets; see Daniel, Hirshleifer,
and Subramanyam, 1998, Barberis, Shleifer, and Vishny, 1998, and Hong and Stein, 1999).
Accounting-based capital market research has produced evidence that is apparently inconsistent
with market efficiency (see the detailed review below). A common feature of this research is to
show that security returns are predictable and that their predictability is associated with the time-
series properties of earnings and/or properties of analysts’ forecasts, which creates a demand for
research in the time-series properties of earnings and earnings forecasts.
Fourth, positive accounting theory research hypothesizes efficient or opportunistic earnings
management and/or seeks to explain managers’ accounting procedure choices. In this research
there is often a need for “normal” earnings that are calculated using a time-series model of earnings.
For example, tests of the earnings smoothing hypothesis might examine properties of pre-smoothed
and smoothed time series of earnings.

42
Finally, analyst and management forecasts are a source of information in the capital markets.
The forecasts thus affect the information environment and influence the level and variability of
security prices. There is a large literature (see Healy and Palepu, 2001) that examines the nature of
the information environment, the demand and supply of forecasts, the incentives facing
management and analysts and their effect on the properties of the forecasts, the effect of the
properties of the forecasts on the variability of security returns and cost of capital, etc. In this
research, properties of management and analysts’ forecasts are an input.
4.1.2.B Time-series properties of earnings
Brown (1993) examines the large body of literature on the time-series properties of earnings.
I deliberately keep my remarks on the earnings’ time-series properties short because I believe this
literature is fast becoming extinct. The main reason is the easy availability of a better substitute:
analysts’ forecasts are available at a low cost in machine-readable form for a large fraction of
publicly traded firms (see below).
Properties of annual earnings
Random walk
A large body of evidence suggests a random walk or random walk with drift is a reasonable
description of the time-series properties of annual earnings. The early evidence appears in Little
(1962), Little and Rayner (1966), Lintner and Glauber (1967), and additional references in Ball and
Watts (1972). Ball and Watts (1972) conduct the first systematic study and fail to reject the random
walk time-series property for annual earnings. Subsequent research confirms their conclusion (see
Watts, 1970, Watts and Leftwich, 1977, Albrecht, Lookabill, and McKeown, 1977) by testing
against the predictive ability of Box-Jenkins models of annual earnings vis-à-vis the random walk
model. This is notwithstanding the indication of negative first-order autocorrelation in Ball and
Watts (1972, table 3) and other research. 40
The random walk property of annual earnings is puzzling. Unlike the random walk property
of security prices, which is a theoretical prediction of the efficient capital markets hypothesis,
40 In-sample estimates of autocorrelation coefficients are biased downward because of the small sample bias that equals –1/(T-1), where T is the number of time series observations (see Kendall, 1954, and Jacob and Lys, 1995). Bias-adjusted first-order serial correlation coefficients for annual earnings changes are close to zero (see Dechow, Kothari, and Watts, 1998, table 5).

43
economic theory does not predict a random walk in earnings.41 Accounting earnings do not
represent the capitalization of expected future cash flows like prices. Therefore, there is no
economic reason to expect annual earnings to follow a random walk (see, for example, Fama and
Miller, ch. 2, and Watts and Zimmerman, ch. 6).
Mean reversion
Starting with Brooks and Buckmaster (1976), a number of studies document evidence of
mild mean reversion in annual earnings (see Ramakrishnan and Thomas, 1992, Lipe and Kormendi,
1994, and Fama and French, 1998, for recent studies). However, interpreting evidence of mean
reversion from in-sample estimates of the time-series parameter values requires caution.
Notwithstanding the evidence of mean reversion, predictive ability might not be much better than a
random walk model in holdout samples (see Watts, 1970, Watts and Leftwich, 1977, and Brown,
1993).
Economic reasons for mean reversion
There are several economic and statistical reasons to expect mean reversion in earnings.
First, competition in product markets implies that above-normal profitability is not sustainable
(Beaver and Morse, 1978, Lev, 1983, Ohlson, 1995, and Fama and French, 1998). Second,
accounting conservatism (see Basu, 1997) and litigation risk (see Kothari, Lys, Smith, and Watts,
1988, and Ball, Kothari, and Robin, 1999) motivate managers to recognize economic bad news
more quickly than good news. As a result, firms often recognize anticipated losses.42 This
recognition of losses makes losses less permanent and thus induces negative autocorrelation in
earnings. Third, firms incurring losses have the option to liquidate the firm if the management does
not anticipate recovery (Hayn, 1995, Berger, Ofek, and Swary, 1996, Burgstahler and Dichev, 1997,
and Collins, Pincus, and Xie, 1999). That means surviving firms are expected to reverse the poor
performance. Thus, the abandonment option and survivor bias together imply the time series of
earnings will exhibit reversals. Finally, the incidence of transitory special items and losses has
increased dramatically over time (see, for example, Hayn, 1995, Elliott and Hanna, 1996, and
Collins, Maydew, and Weiss, 1997), which means earnings changes are predictable. The increase
41 The random walk property of security prices in an efficient capital market requires the additional assumption of constant expected rates of return, which might not be descriptive (see Fama, 1976, ch. 5, Fama and French, 1988, and Kothari and Shanken, 1998). Therefore, the random walk property is only an approximate prediction. 42 Agency theory-based reasons (e.g., the nature of compensation contracts and CEO turnover) also might motivate managers to take a “big bath” in earnings.

44
in transitory items might be due in part to a shift in standard setting by the SEC and FASB toward
mark-to-market accounting for some assets and liabilities.
Cross-sectional estimation
Fama and French (1998) introduce a cross-sectional estimation approach to the earnings
forecasting literature to uncover the time-series properties of earnings. They argue that time-series
estimation lacks power because there are only a few time-series observations of annual earnings
available for most firms. In addition, use of a long time series introduces survivor bias. The
survivor bias implies more observations of positive earnings changes following positive changes
than expected by chance, for reasons discussed above. This offsets the underlying negative time-
series correlation in earnings changes. The effect of survivor bias, together with low power (i.e.,
large standard errors) of time-series estimation, favors the conclusion of a random walk in annual
earnings.
In a cross-sectional estimation, annual earnings (levels or changes, and with or without a
deflator) are regressed on its lagged observation. The estimation is performed annually and
inferences are drawn on the basis of the time series of annual parameter estimates from the cross-
sectional regressions. This is the well-known Fama-MacBeth (1973) procedure.
One weakness of cross-sectional estimation is that firm-specific information on the time-
series properties is sacrificed. However, this is mitigated through a conditional estimation of the
cross-sectional regression. Conditional estimation is an attempt to capture cross-sectional variation
in the parameters of the time-series process of earnings (e.g., the autocorrelation coefficient). This
approach is grounded in economic analysis, rather than the previous statistical exercise of fitting the
best time-series model of earnings (e.g., fitting the best Box-Jenkins model). The conditional
approach models the cross-sectional variation in earnings’ autocorrelation coefficient as a function
of its economic determinants. That is, the coefficient is hypothesized to vary with the realized
values of a set of conditioning variables like past performance, dividend yield, leverage, industry
competition etc.43 Since the number of observations in a cross-section is typically large, it is
generally possible to accommodate many economic determinants in the estimation. Overall, cross-
sectional estimation enhances power, overcomes survivor bias problems, and permits a researcher to
incorporate the effect of economic determinants of the time-series properties of earnings.
43 The econometric approach to estimate a parameter conditional on a set of (state) variables is well developed in finance and economics. See, for example, Shanken (1990), Chan and Chen (1988), and Ferson and Schadt (1996) for time-varying conditional best estimation.

45
Conditional cross-sectional estimation
Previous research employs at least three different approaches to expand the information set
beyond the past time series of earnings in obtaining conditional earnings forecasts (or conditional
estimates of the parameters of the time-series process of earnings).
First, a conditional forecast is obtained using information on one or more determinants of
the autocorrelation coefficient of earnings. For example, Brooks and Buckmaster (1976) focus on
extreme earnings changes, Basu (1997) examine negative earnings changes, and Lev (1983)
identifies economic determinants like barriers-to-entry in an industry, firm size, product type, and
capital intensity of a firm. Also see Freeman, Ohlson, and Penman (1982) and Freeman and Tse
(1989 and 1992). Recent studies estimating conditional forecasts include Fama and French (1998)
and Dechow, Hutton, and Sloan (1999).
Second, price-based forecasts are used to improve on the time-series forecasts of earnings on
the premise that prices reflect a richer information set than the past time series of earnings (Beaver,
Lambert, and Morse, 1980). Research examining price-based earnings forecasts includes Beaver
and Morse (1978), Freeman, Ohlson, and Penman (1982), Collins, Kothari, and Rayburn (1987),
Beaver, Lambert, and Ryan (1987), and Freeman (1987). Notwithstanding the fact that prices
reflect a richer information set than the past time series of earnings, researchers have found it
difficult to harness the information in prices at the firm level to make an economically important
improvement. Therefore, this research has had only a modest impact on forecasting. The benefit of
prices in improving forecasts or in backing out market expectations is primarily in long-horizon
settings (e.g., Easton, Harris, and Ohlson, 1992, Kothari and Sloan, 1992, and Collins et al., 1994)
precisely because prices anticipate earnings information for several future periods.
Finally, Ou and Penman (1989a and b), Lev and Thigarajan (1993), and Abarbanell and
Bushee (1997 and 1998) use financial statement analysis of income statement and balance sheet
ratios to forecast future earnings and stock returns. The primary motivation for this research is to
employ fundamental analysis to identify mispriced securities. Superior earnings forecasts are only
an intermediate product of this research.
Properties of quarterly earnings
Interest in the time-series properties of quarterly earnings arises for at least four reasons.
First, quarterly earnings are seasonal in many industries because of the seasonal nature of their main
business activity (e.g., apparel sales and toy sales). Second, quarterly earnings are more timely, so

46
the use of a quarterly earnings forecast as a proxy for the market’s expectation is likely more
accurate than using a stale annual earnings forecast.
Third, GAAP requires that the quarterly reporting period is viewed as an integral part of the
annual reporting period [see APB, 1973, Opinion No. 28, SFAS No. 3 (FASB, 1974), and FASB
Interpretation No. 18, (FASB, 1977)]. As a result, firms are required to estimate annual operating
expenses and allocate these costs to quarterly periods. The fourth quarter thus offsets the
intentional (i.e., opportunistic) and unintentional estimation errors in allocating expenses to the first
three quarterly periods. This contributes to differences in the properties of fourth versus the first
three quarterly earnings (see Bathke and Lorek, 1984, Collins, Hopwood, and McKeown, 1984,
Mendenhall and Nichols, 1988, and Salamon and Stober, 1994). More importantly, quarterly
earnings are potentially a more powerful setting to test positive accounting theory based and capital
markets research hypotheses (see, for example, Salamon and Stober, 1994, Hayn and Watts, 1997,
and Rangan and Sloan, 1998). The source of the power comes from the fact that the errors in
estimating operating expenses in the first three quarters are offset in the fourth quarter, thus
permitting tests that exploit this property of error reversals. One downside of using quarterly
earnings is that they are not audited.
Finally, there are four times as many quarterly earnings observations as annual earnings
observations. To the extent there is a loss of information in aggregation, a quarterly earnings time
series has the potential to generate more precise annual earnings forecasts than annual earnings-
based forecasts (see Hopwood, McKeown, and Newbold, 1982, for evidence). That is, less
stringent data availability requirements are necessary using quarterly than annual earnings to
achieve the same degree of precision of the forecasts. This enables the researcher to reduce
survivor biases and to use a larger sample of firms.
While a quarterly earnings forecast is likely a more timely and accurate proxy for the
market’s expectation of earnings at the time of an earnings announcement, this benefit should be
tempered by the following potential downside. The market’s reaction to any information event
reflects the revision in expectation of cash flows for all future periods. The market might be
responding to information about future quarters, which may or may not be highly correlated with
the information over a quarter (a relatively short time period). Therefore, despite greater accuracy,
the strength of the association between the quarterly earnings surprise and narrow-window stock
price reaction to the surprise is no t higher than a long-window association (e.g., one year or longer).
47
Recent evidence in Kinney, Burgstahler, and Martin (1999) shows that the odds of the same sign of
stock returns and earnings surprise are no greater than 60% to 40% even when using composite
earnings forecasts tabulated by First Call Corporation. 44 The lack of a strong association should not
be interpreted mechanically as an indication of noise in the earnings expectation proxy. The modest
association is likely an indication of prices responding to information about future income that are
unrelated to the current earnings information. That is, the forward- looking nature of prices with
respect to earnings becomes an important consideration (see Kinney et al., 1999, Lev, 1989, Easton
et al., 1992, Kothari and Sloan, 1992, and Collins et al., 1994). In addition, increased incidence of
transitory items in earnings in recent years further weakens the relation between current earnings
surprise and revisions in expectations about future periods’ earnings as captured in the
announcement period price change.
ARIMA properties of quarterly earnings
Well-developed Box-Jenkins autoregressive integrated moving average (ARIMA) models of
quarterly earnings exist (Foster, 1977, Griffin, 1977, Watts, 1975, and Brown and Rozeff, 1979).
Research comparing the models shows that the Brown and Rozeff (1979) model is slightly superior
in forecast accuracy at least over short horizons (see Brown, Griffin, Hagerman, and Zmijewski,
1987a). However, this advantage does not necessarily show up as a stronger association with short-
window returns around quarterly earnings announcements (see Brown, Griffin, Hagerman, and
Zmijewski, 1987b). Simpler models like Foster (1977) do just as well as the more complicated
models. The main advantage of the Foster (1977) model is that it can be estimated without the Box-
Jenkins ARIMA software.
Currently the main use of quarterly earnings time-series models is in tests of market
efficiency examining post-earnings-announcement drift (see below). In other capital markets
research, researchers almost invariably use analysts’ or management forecasts of earnings. As seen
below, these forecasts are not only easily available, but they are more accurate and more highly
associated with security returns.
44 Kinney et al. (1999) use annual, not quarterly earnings forecast error. However, since first three quarters’ earnings are known at the time of the annual earnings announcement, examining the association of annual earnings forecast error with a narrow window return is almost equivalent to examining a relation between quarterly earnings surprise and stock returns.

48
Properties of components of earnings
There are at least three reasons for researchers’ interest in the properties of earnings
components. First, to examine whether earnings components are incrementally informative beyond
earnings in their association with security prices.45 This research is generally aimed at evaluating
standards that require earnings components to be disclosed and fundamental analysis. Conclusions
about the incremental association or information content of earnings components hinges on the
accuracy of the proxies for the unexpected portion of the earnings components, which creates a
demand for the time-series properties of earnings components.
Second, accruals and cash flows are the two most commonly examined components of
earnings. Operating accruals represent accountants’ attempt to transform operating cash flows into
earnings that are more informative about firm performance and thus make earnings a more useful
measure for contracting and/or in fundamental analysis or valuation. However, self- interested
managers might use accounting discretion opportunistically and manipulate accruals, which would
distort earnings as a measure of firm performance. Tests of accrual management hypotheses based
on positive accounting theory examine accounting accruals’ properties. These tests provide a
motivation for research in the time-series properties of accruals and cash flows and other earnings
components (e.g., current and non-current accruals, operating and investing cash flows etc.).
Finally, interest in the time-series properties of earnings components also arises because
summing the forecasts of the components might yield a more accurate forecast of earnings. The
logic here is similar to that underlying the aggregation of quarterly earnings forecasts to improve the
accuracy of annual earnings forecasts. The difference is that the aggregation of components is
contemporaneous (i.e., cross-sectional) whereas the aggregation of quarterly forecasts is temporal.
In both cases the assumption is that there is a loss of information in aggregation.
Current status and future directions for research in earnings components
There is an active interest in research on the properties of earnings components because of
both positive accounting research and fundamental analysis. Early research on the properties of
accruals assumed naïve models (e.g., DeAngelo, 1986, and Healy, 1985), but progress has been
made since (e.g., Jones, 1991, Kang and Sivaramakrishnan, 1995, and Dechow, Sloan, and
Sweeney, 1995). I believe that modeling earnings components’ properties using the nature of
45 See, for example, Lipe (1986), Rayburn (1986), Wilson (1986 and 1987), Livnat and Zarowin (1990), Ohlson and Penman (1992), Dechow (1994), and Basu (1997).

49
economic transactions and the accounting recording of those transactions is likely to be more
fruitful than simply fitting time-series models on earnings components (see Guay, Kothari, and
Watts, 1996, and Healy, 1996). Dechow, Kothari, and Watts (1998) represents one attempt at
modeling the time-series properties of accruals, operating cash flows, and earnings with sales as the
starting point or primitive. The economic modeling of accruals or earnings components will not
necessarily provide the best fit for the historical data, but it might have predictive power and ability
to explain managerial behavior better than purely statistical time-series models.
4.1.2.C Management forecasts
Management forecasts have many labels, including earnings warnings, earnings pre-
announcements, and management’s earnings forecasts. Earnings warnings and pre-announcements
precede earnings announcements and typically convey bad news. Management’s earnings forecasts
are often soon after earnings announcements and do not necessarily communicate bad news to the
market. Since management forecasts are voluntary, there are economic motivations for the
forecasts. A detailed discussion of the economic issues surrounding management forecasts appears
in the Healy and Palepu (2001) and Verrecchia (2001) review papers. A few examples of the
economic issues include the following. (i) The threat of litigation influencing management’s
decision to issue voluntary forecasts and forecasts of bad news (e.g., Skinner, 1994, Francis,
Philbrick, and Schipper, 1994, and Kasznik and Lev, 1995). (ii) The effect of management’s
concern about the proprietary cost of disclosure on the nature of management forecasts (e.g.,
Bamber and Cheon, 1998). (iii) The timing of management forecasts and the timing of insider
buying and selling of company stocks (Noe, 1999). In this review, I only summarize the extant
research on the properties of management forecasts. The summary describes the main findings and
the hypotheses tested in the literature.
Early research on management forecasts appears in Patell (1976), Jaggi (1978), Nichols and
Tsay (1979), Penman (1980), Ajinkya and Gift (1984), and Waymire (1984). They collectively
show that management forecasts have information content. Specifically, management forecast
releases are associated with significant increases in return variability (see e.g., Patell, 1976) and
there is a positive association between the unexpected component of the management forecast and
security returns around the forecast date (e.g., Ajinkya and Gift, 1984, and Waymire, 1984).
One of the hypotheses for voluntary management forecasts is that through the forecasts
management aligns investors’ expectations with the superior information that the management

50
possesses (Ajinkya and Gift, 1984). This expectation-adjustment hypothesis implies that
management forecasts are superior to market expectations of earnings at the time of management
forecasts. However, previous evidence in Imhoff (1978) and Imhoff and Pare (1982) suggested
management forecasts are not systematically more accurate than analysts’ forecasts. Evidence
consistent with the superiority of management vis-à-vis analysts’ forecasts as a proxy for the
market’s prevailing expectation appears in Waymire (1984). Recent research examines issues like
the relation between various types, precision, and credibility of management forecasts and security
price changes (e.g., Pownall, Wasley, and Waymire, 1993, Baginski, Conrad, and Hassell, 1993,
Pownall and Waymire, 1989, and Bamber and Cheon, 1998). Overall, the evidence suggests that
management forecasts have information content and the information content is positively correlated
with a number of determinants of the quality of the management forecasts.
4.1.2.D Analysts’ forecasts
There is a huge empirical and theoretical literature on analysts’ forecasts. I focus on the
properties of analysts’ forecasts and some determinants of these properties. I do not review the
research that examines why analysts forecast earnings, the determinants of the number of analysts
following a firm, and the consequences of analysts’ following on the properties of security returns.
Some of these issues are examined in Verrecchia (2001) and Healy and Palepu (2001). I recognize
that the issues not examined here also affect the properties of analysts’ forecasts, but nevertheless I
consider those beyond the scope of my review of the capital markets research.
Buy-side and sell-side analysts issue earnings forecasts. Most research in accounting
examines sell-side analysts’ forecasts because these are publicly available. Analysts from
brokerage houses and investment banking firms in the financial services industry issue sell-side
forecasts. Buy-side analysts are typically employed by mutual funds and pension funds and issue
forecasts primarily for internal investment decision-making purposes. Like most of the research on
analysts’ forecasts, I review the research on sell-side analysts’ forecasts.
Analysts’ forecasts research can be broadly divided into two categories. The first category
examines properties of consensus analysts’ forecasts. A consensus forecast is the mean or median
of the analysts’ forecasts of (either quarterly or annual or long-term) earnings of an individual firm.
An example of research in this category would be “Are analysts’ forecasts optimistic?” The second
category focuses on the properties of individual analysts’ forecasts either in the cross-section or
temporally. This category examines questions like “What are the determinants of an individual

51
analyst’s forecast accuracy?” and “Does skill affect the accuracy of an analyst’s forecast?” There is
overlap between these two areas of research, so the discussion is sometimes applicable to both.
Analysts’ forecasts compared to time-series forecasts
Early research examines the accuracy of analysts’ forecasts and their association with
security returns, and compares these properties with time-series forecasts of earnings. Brown and
Rozeff (1978) were the first to document superior accuracy of analysts’ forecasts over time-series
forecasts of quarterly earnings. Subsequent research offers conflicting evidence (see Collins and
Hopwood, 1980, and Fried and Givoly, 1982, for confirming the evidence in Brown and Rozeff,
1978, whereas Imhoff and Pare, 1982, for contradictory evidence) and also raises the question of
whether analysts’ superiority stemmed from their timing advantage (i.e., access to more recent
information) over time-series models. Brown, Griffin, Hagerman, and Zmijewski (1987a and b) test
for both accuracy and association with security returns in comparing the quality of analysts’
forecasts against time-series forecasts of quarterly earnings. They show that, even after controlling
for the timing advantage, analysts’ forecasts are more accurate and modestly more highly associated
with stock returns than time-series forecasts. O’Brien (1988), however, documents conflicting
evidence in which an autoregressive model forecast is more highly associated with returns than
I/B/E/S forecasts. The conflicting evidence notwithstanding, in recent years it is common practice
to (implicitly) assume that analysts’ forecasts are a better surrogate for market’s expectations than
time-series forecasts. The issues of current interest are whether analysts’ forecasts are biased, the
determinants of the biases, and whether the market recognizes the apparent biases in pricing
securities.
Optimism in analysts’ forecasts
Many studies report evidence that analysts’ forecasts are optimistic 46, although the optimism
appears to be waning in recent years (see Brown, 1997 and 1998, Matsumoto, 1998, and Richardson
et al., 1999). There are at least three hypotheses consistent with the decline in analyst optimism: (i)
analysts are learning from evidence of past biases (see Mikhail, Walther, and Willis, 1997, Jacob,
Lys, and Neale, 1999, and Clement, 1999, for mixed evidence on the effect of experience on
learning); (ii) analysts’ incentives have changed; and (iii) the quality of data used in the research
46 Examples include Barefield and Comiskey (1975), Crichfield, Dyckman, and Lakonishok (1978), Fried and Givoly (1982), Brown, Foster, and Noreen (1985), O’Brien (1988), Stickel (1990), Abarbanell (1991), Ali, Klein, and Rosenfield (1992), Brown (1997 and 1998), Lim (1998), Richardson, Teoh, and Wysocki (1999), and Easterwood and Nutt (1999).

52
examining analysts’ forecast properties has improved (e.g., suffers less from survivor biases or
selection biases).
Estimating bias in analysts’ forecasts
Forecast optimism is inferred from a systematic positive difference between the forecast and
actual earnings per share. The optimism has been documented using Value Line, I/B/E/S, and
Zacks data sources for analysts’ forecasts (Lim, 1998). The estimates of analyst optimism vary
across studies in part because of differences in research designs, variable definitions, and time
periods examined. Consider, for example, the following three recent studies that report properties
of I/B/E/S analysts’ forecasts: Lim (1998), Brown (1998), and Richardson et al. (1999). Each uses
over 100,000 firm-quarter observations and analyzes I/B/E/S forecasts from approximately the same
time period from 1983 or 1984 to 1996 or 1997.
Lim (1998, pp. 9-10) uses “the median of the unrevised estimates of a quarter’s earnings
across all brokerage firms,” although the use of the mean of analysts’ forecasts is not uncommon in
the literature (see, for example, Chaney, Hogan, and Jeter, 1999). 47 Richardson et al. (1999) use
individual analyst’s forecast and average the forecast errors each month, whereas Brown (1998)
reports results using only the most recent analyst forecast. Lim (1998) calculates forecast errors as
the difference between the earnings forecast and actual earnings per share as reported on
Compustat, based on the evidence in Philbrick and Ricks (1991) that actual earnings reported by
I/B/E/S suffers from an “alignment problem.” In contrast, Brown (1998) and Richardson et al.
(1999) use I/B/E/S actual earnings “for comparability with the forecast” (Richardson et al., 1999, p.
7).
Previous research also differs in its treatment of outliers. Lim (1998) excludes absolute
forecast errors of $10 per share or more, while Brown (1998) winsorizes absolute forecast errors
greater than 25 cents per share and Degeorge, Patel, and Zeckhauser (1999) delete absolute forecast
errors greater than 25 cents per share. Richardson et al. (1999) delete price-deflated forecast errors
that exceed 10% in absolute value. Brown (1998), Degeorge et al. (1999), and Kasznik and
McNichols (1997) do not use a deflator in analyzing analysts’ forecast errors, whereas Lim (1998)
and Richardson et al. (1999) deflate forecast errors by price. Analysis without a deflator implicitly
assumes that the magnitude of undeflated forecast error is not related to the level of earnings per
47 Note that even if the distribution of actual earnings might be skewed, the distribution of analysts’ forecasts for a given firm need not be skewed, so the use of the mean or median of analysts’ forecasts might not make much difference. Evidence in O’Brien (1988) indicates that median forecasts are slightly smaller than the mean.

53
share (i.e., forecast errors are not heteroskedastic). In contrast, use of price deflation implicitly
assumes that the deviation of the actual from forecasted earnings depends on the level of earnings
per share or price per share and that price deflation mitigates heteroskedasticity.
Evidence of bias
Notwithstanding the research design differences, the evidence in most of the studies
suggests analysts’ optimism. This conclusion should be tempered by the fact that the forecast
samples examined in various studies are not independent. Lim (1998) finds an average optimistic
bias of 0.94% of price. The bias is considerably higher at 2.5% of price for small firms and it is
0.53% of price for large market capitalization stocks. He also reports that the bias is pervasive in
that it is observed every year and in every market capitalization decile of sample firms, and it is
observed in both newly-covered and not newly-covered securities by analysts.
While the forecast biases reported in Lim (1998) seem both statistically and economically
large, Brown (1998) reports a mean bias of only a cent per share in the most recent analyst’s
forecast. His annual analysis from 1984 to 1997 reveals a range of bias from 2.6 cents per share
optimism in 1993 to 0.39 cents per share pessimism in 1997. Richardson et al. (1999) also find that
the bias declines dramatically, from 0.91% of the price to 0.09% of price, as the forecast horizon is
shortened from one year to one month (also see O’Brien, 1988). Like Brown (1998), Richardson et
al. also report that the bias has turned from optimism to pessimism in recent years. Abarbanell and
Lehavi (2000a) take issue with this conclusion. They argue that forecast data providers like First
Call, Zacks, and IBES have increasingly changed the definition of reported earnings to earnings
from continuing operations and now require analysts to forecast earnings from continuing
operations. Ababanell and Lehavy (2000a) conclude that this change “plays a dominant role in
explaining the recent declines in apparent forecast optimism and increases in the incidence of zero
and small pessimistic forecast errors.
In most studies the median forecast bias is quite small (e.g., 0.01% in Lim, 1998), which
suggests that extreme observations hugely influence the results, i.e., skewness of the earnings
distribution drives the results. Consistent with earnings skewness, Gu and Wu (2000) and
Abarbanell and Lehavy (2000b) find that a small number of forecast error observations
disproportionately contributes to the observed bias.

54
Potential research design problems
Despite the apparently compelling evidence, I remain somewhat skeptical of the evidence of
analysts’ forecast bias for several reasons. First, forecast earnings and actual earnings against
which the forecast is being compared do not always seem to be the same (see I/B/E/S data
definitions), especially when Compustat actuals are used (see Sabino, 1999). Analysts generally
forecast earnings without special items and other one-time gains and losses. I/B/E/S apparently
adjusts the actual reported earnings number for special items and/or one-time gains and losses to
back out the earnings number the firm would have reported consistent with the earnings number
analysts were forecasting (see Sabino, 1999, and Abarbanell and Lehavy, 2000a, for details). This
procedure seems subjective and whether it contributes to the observed bias (or noise) is worthy of
investigation.
Second, the coverage of data has improved dramatically through the years and the degree of
bias has declined steadily (see evidence in Brown, 1997 and 1998, and Richardson et al., 1999). Is
the evidence of bias related to the improvement in the coverage of firms in the data bases? Third,
are there survival biases in the data? Survival bias might arise not simply because firms go
bankrupt, but mostly because of mergers and acquisitions. Finally, what is the effect of mixing stale
forecasts with recent forecasts? Evidence suggests recent forecasts are less biased than forecasts
issued earlier. However, not all analysts revise their forecasts, so the median forecast at any point
in time is for a sample of recent and stale forecasts. What is the contribution to the bias arising
from stale forecasts? Is analysts’ proclivity to revise forecasts diminished if a firm is performing
poorly? This would impart an optimistic bias as a result of using stale forecasts (see Affleck-
Graves, Davis, and Mendenhall, 1990, and McNichols and O’Brien, 1997). Analysis in Richardson
et al. (1999), which examines forecast bias as a function of the horizon, appears to be a step in the
right direction.
Bias in long-horizon forecasts
In addition to quarterly earnings forecasts, there is a large body of recent research that
examines properties of long-horizon analysts’ forecasts. Long-horizon forecasts are generally
forecasts of growth over two-to-five years. Analysis of long-term earnings growth forecasts also
reveals that these are generally optimistic (e.g., La Porta, 1996, Dechow and Sloan, 1997, and Rajan
and Servaes, 1997). An emerging body of research examines analysts’ long-term forecasts in tests

55
of market efficiency (see below). I defer the discussion of some of the properties of analysts’ long-
term forecasts to the tests of market efficiency section of the paper.
Economic determinants of forecast bias
Evidence of optimism in analysts’ forecasts has lead to many studies proposing and testing
hypotheses to explain the optimistic bias. The hypotheses fall in two broad categories. First, there
are economic incentives based explanations for analysts’ forecast optimism. Second, a behavioral
cognitive-bias explanation for analysts’ bias is proposed.
Incentives-based explanations
First, an important economic incentive motivating “sell-side” analysts to issue optimistic
earnings forecasts is the compensation they receive for their services to the corporate finance arm of
an investment-banking firm. 48 The corporate finance division derives revenues mainly from
services related to securities issues and merger-and-acquisition activities. Sell-side analysts’
optimistic forecasts help the corporate finance division generate business. The deterrent to analysts
from issuing overly optimistic forecasts is that a portion of their annual compensation and their
reputation, and thus human capital, are an increasing function of forecast accuracy and a decreasing
function of forecast bias.49 One prediction of the hypothesis here is that analysts working for an
investment-banking firm doing business with the client firm (called affiliated analysts) would issue
more optimistic forecasts than unaffiliated analysts. Lin and McNichols (1998a), Michaely and
Womack (1999), Dugar and Nathan (1995), and Dechow, Hutton, and Sloan (1999), among others,
offer evidence consistent with the hypothesis.
An alternative interpretation for the observed bias in affiliated analysts’ forecasts is as
follows. The determination of affiliated analysts is not exogenous. Suppose there are N analysts,
and all of them are assumed to issue unbiased forecasts. Assume furthermore that they
independently issue N forecasts at time t for a firm i. Firm i’s management is interested in an
investment banking relation with one of the analyst’s firm because it would like to issue new equity.
Firm i might retain the investment-banking firm of the analyst issuing the highest of the N forecasts.
That is, the firm’s choice of the investment-banking analyst is likely in part a function of who is
48 See Adair (1995), Ali (1996), Dechow, Hutton, and Sloan (1999), Dugar and Nathan (1995), Hansen and Sarin (1996), Hunton and McEwen (1997), Lin and McNichols (1998a, b), Michaely and Womack (1999), and Rajan and Servaes (1997). 49 Consistent with this hypothesis, Mikhail, Walther, and Willis (1999) document a significant relation between analyst turnover and relative forecast accuracy.

56
most bullish about the firm’s prospects.50 If the N forecasts were issued independently and since
all the analysts are assumed to issue unbiased forecasts on average, the order statistic of the cross-
sectional distribution of analysts’ forecasts (or a forecast from the high end of the distribution)
selected by the firm’s management will ex post appear optimistic. I believe the challenge is to
discriminate between the above explanation and the incentive-based opportunistic-forecast
explanation.
Second, Lim (1998) and Das, Levine, and Sivaramakrishnan (1998) argue that analysts
might issue optimistic forecasts to gain increased access to information from management,
especially in cases where the information asymmetry between the management and the investment
community is high. Analysts’ investment in developing better relations with firms’ management
improves the flow of information from managers as well as helps obtain more investment banking
and brokerage business, and potentially more brokerage commissions from clients. Lim (1998) and
Das et al. (1998) recognize that forecast bias is bad, but management might reward optimism by
funneling information to the analyst. This information is helpful in improving forecast accuracy.
The benefit to analysts is greatest when prior uncertainty is high. So analysts trade-off bias against
information from management, which reduces the variance of the forecast error. This leads to an
interior equilibrium, rather than a corner solution of huge optimistic bias.51 The hypothesis also
generates a cross-sectional prediction that the bias would be increasing in variables that proxy for
prior uncertainty and information asymmetry (e.g., firm size, and growth opportunities). Evidence
in Lim (1988) and Das et al. (1998) is consistent with the hypothesis.
Third, Gu and Wu (2000) hypothesize that the observed forecast bias results from analysts’
incentives in the presence of earnings skewness. They argue that optimistic bias is rational and
expected because analysts strive to minimize mean absolute forecast error. The median of a skewed
distribution minimizes the mean absolute forecast error. Thus, if the realized earnings distribution
is negatively skewed and if analysts seek to minimize the absolute forecast error, not mean squared
error, then forecasts will be optimistically biased. Evidence in Gu and Wu (2000) is consistent with
their skewness explanation. While Gu and Wu (2000) offer an interesting explanation, in their
50 While this provides an incentive for all analysts to be optimistic, recall that I have assumed unbiased forecasts. The argument I make here is unchanged even if the analysts are on average assumed to make optimistically biased forecasts. If this were the case, the affiliated analyst is expected to appear more optimistically biased than the rest. 51 See Laster, Bennett and Geoum (1996) for a similar argument using publicity from their forecasts traded-off against accuracy as a motivation for analysts’ optimistic bias.

57
setting both optimistic and pessimistic biases are explained so long as analysts forecast median
earnings. Therefore, if skewed earnings distribution suggests extreme surprising outcomes, then in
good economic periods analysts ex post turn out to be pessimistic and they ex post turn out to be
optimistic in bad economic times. Gu and Wu (2000) cannot discriminate between the above
explanation and their hypothesis that analysts have an incentive to forecast the median.
Finally, Abarbanell and Lehavy (2000b) propose that it is management ’s incentive to take
earnings baths that largely contributes to the observed optimistic bias in analysts’ forecasts. That is,
unlike the previous explanations, Abarbanell and Lehavy (2000b) argue that the bias has nothing to
do with analysts’ incentives or cognitive biases (see below). Instead, they show that earnings
management observations disproportionately impact the estimated bias, which prior research seeks
to explain on the basis of analysts’ incentives and/or cognitive biases.
Cognitive bias explanations
Cognitive bias explanations for analysts’ optimism have been proposed mainly to explain
anomalous security-return evidence that suggests market inefficiency in long-horizon returns.
Evidence of apparent market overreaction to past good and bad price performance (i.e., a profitable
contrarian investment strategy) prompted a cognitive-bias in analysts’ forecasts as an explanation.
Drawing upon the behavioral theories of Tversky and Kahneman (1984) and others, DeBondt and
Thaler (1985, 1987, and 1990), Capstaff, Paudyal, and Rees (1997) and DeBondt (1992) propose a
cognitive-bias explanation for analysts’ forecast optimism. Specifically, they hypothesize that
analysts systematically over-react to (earnings) information, which imparts an optimistic bias in
analysts’ forecasts. However, in order for an optimistic bias in analysts’ forecasts to arise, there
must be some asymmetry in overreaction such that analysts’ overreaction to good news is not fully
offset by their overreaction to bad news. Elton, Gruber, and Gultekin (1984) argue that analysts’
overestimate firms performing well and Easterwood and Nutt (1999) document evidence that
analysts overreact to good earnings information, but underreact to bad earnings information. The
source of asymmetry in the analysts’ overreaction is not fully understood in the literature. The
asymmetry also makes it difficult to explain the post-earnings-announcement drift because reversal
in the reaction to good news earnings is not observed.
Research also examines whether there is a cognitive-bias- induced overreaction and
optimism in analysts’ forecasts (see Klein, 1990, Abarbanell, 1991) as well as whether the apparent
58
security-return overreaction52 is a result of the market believing analysts’ cognitive-bias induced
over-reacting and biased forecasts (e.g., LaPorta, 1996, Dechow and Sloan, 1997). Klein’s (1990)
evidence is inconsistent with overreaction in analysts’ forecasts and Abarbanell (1991) infers
underreaction to earnings information, which is consistent with the post-earnings-announcement
drift. In recent work, Abarbanell and Lehavy (2000b) fail to find evidence consistent with cognitive
bias inducing optimistic bias in analysts’ forecasts. I defer the security-return evidence to section 4
where I discuss research on market efficiency with respect to analysts’ long-horizon forecasts.
Other explanations
In addition to the above incentives-based and cognitive bias related explanations for
analysts’ optimism, at least three other explanations are offered in the literature. These are (see
Brown, 1998): herd behavior (Trueman, 1994); low earnings predictability (Huberts and Fuller,
1995); and analysts prefer to withhold unfavorable forecasts (Affleck-Graves, Davis, and
Mendenhall, 1990, and McNichols and O’Brien, 1997).
Properties of individual analyst’s forecasts
Research in this area almost invariably has a descriptive component that documents
properties of individual analyst’s forecasts. Other research analyzes properties of individual
analyst’s forecasts in the context of analysts’ economic incentives in issuing earnings forecasts, i.e.,
the costs and benefits of issuing accurate or biased forecasts. The latter is more interesting, but also
more difficult.
Research on the properties of individual analysts’ forecasts can be categorized into three
streams. First, there is research on cross-sectional variation in and determinants of analysts’
forecast accuracy. Second, research examines whether analysts’ forecasts are efficient in using all
the information available at the time of their forecasts. Third, there is research on systematic
differences in the properties of analysts’ forecasts between groups of analysts (e.g., affiliated versus
unaffiliated analysts), which might be related to differential economic incentives facing the groups
of analysts.
Differential forecast accuracy and its determinants
The early literature fails to find differential forecast accuracy among analysts (see Brown
and Rozeff, 1980, O’Brien, 1990, and Butler and Lang, 1991). Failure to control for the
52 See DeBondt and Thaler (1985 and 1987), Chan (1988), Ball and Kothari (1989), Chopra, Lakonishok, and Ritter (1992), Ball, Kothari, and Shanken (1995), and Fama and French (1995) for research examining whether investors and the stock market overreact to information over long horizons.

59
confounding effect of forecast recency on forecast accuracy contributed to the lack of finding
significant differential forecast accuracy. Using larger data sets and better controls for forecast
horizon, Sinha, Brown, and Das (1997) conclude that analysts differ in terms of their forecast
accuracy. They show that even in hold out samples (i.e., an ex ante analysis), superior forecasters
based on past performance outperform other analysts in forecast accuracy (also see Stickel, 1992,
for the forecast superiority of the Institutional Investor All American Research Team vis-à-vis other
analysts). Sinha et al. also find that poor performers do not necessarily repeat poor performance.
Their evidence is consistent with economic Darwinism in that superior forecasters survive, but poor
performers are possibly weeded out in the marketplace.
Recent examples of research examining the determinants of analyst forecast superiority
include Mikhail, Walther, and Willis (1997), Jacob, Lys, and Neale (1999), and Clement (1999).
The evidence in these studies suggests that experience (or learning), the size of the brokerage firm
that an analyst works for, and the complexity of the analyst’s task (number of firms and industries
followed by an analyst) affect forecast accuracy. The evidence on experience appears mixed in part
because of data problems. For example, data are available only since 1984, so even if some
analysts were experienced at the start of the data availability year, they are coded as no more
experienced as a novice. In addition, inferences about the effect of long experience are confounded
by potential survivor bias problems.
Efficiency of analysts’ forecasts
A number of studies show that analysts’ forecasts are inefficient in the sense that they do not
fully incorporate past information available at the time of their forecasts. Evidence in Lys and Sohn
(1990), Klein (1990), and Abarbanell (1991) suggests that analysts underreact to past information
reflected in prices. There is evidence of serial correlation in forecast revisions of individual
analysts surveyed by Zacks Investment Research (see Lys and Sohn, 1990), in the Value Line
forecasts (see Mendenhall, 1991) and in the I/B/E/S consensus forecasts (see Ali, Klein, and
Rosenfeld, 1992). This research examines whether analysts’ underreaction to past information
and/or earnings information is a potential explanation for the post-earnings-announcement drift
(also see Abarbanell and Bernard, 1992).
The inefficiency of analysts’ forecasts in incorporating available information in revising
their forecasts raises the question of an analyst’s incentive to provide an accurate forecast. Stated
60
differently, is the cost of incorporating all the information outweighed by potential benefits? This
requires better knowledge of (or proxies for) the cost and reward structure of a financial analyst.
Differences in forecast accuracy across classes of analysts
Recent research examines whether economic incentives motivate different cla sses of
analysts (e.g., analysts affiliated with a brokerage firm that has an investment banking relation with
the firm whose earnings are being forecast versus unaffiliated analysts). This research, discussed
earlier, examines both differences in forecast accuracy across the classes of analysts and security
price performance in an attempt to ascertain whether capital markets are fixated on biased analysts’
forecasts. I will revisit the issues surrounding market efficiency below.
4.1.3 Methodological issues and capital markets research
There are several issues involved in drawing statistical inferences in capital markets
research. Although econometric in nature, some methodological research appears in the accounting
literature because it addresses issues that are unique to capital markets research in accounting. The
uniqueness often stems either from the properties of accounting data or from choice of research
design (e.g., levels regressions). There is a voluminous body of research that examines econometric
issues germane to capital markets research. These issues are important and have a tremendous
bearing on the inferences we draw from the statistical analysis presented in the research. However,
to keep the review focused, I survey this research only by way of listing the main issues and refer
the reader to the relevant literature for technical details. The main issues include:
(i) Bias in test statistics because of cross-correlation in the data or regression residuals (see Schipper and Thompson, 1983, Collins and Dent, 1984, Sefcik and Thompson, 1986, Bernard, 1987, Christie, 1987, Kothari and Wasley, 1989, Brav, 2000, and Mitchell and Stafford, 2000);
(ii) Price and return regression models (see Lev and Ohlson, 1982, Christie, 1987,
Landsman and Magliolo, 1988, Kothari and Zimmerman, 1995, Barth and Kallapur, 1996, Barth and Clinch, 1999, Easton, 1999, Brown, Lo, and Lys, 2000, and Holthausen and Watts, 2001);
(iii) Comparing the information content of alternative models, e.g., comparing the
association of earnings versus cash flows with stock returns, (see Davidson and MacKinnon, 1981, Cramer, 1987, Vuong, 1989, Dechow, 1994, Biddle, Seow, and Siegel, 1995, Biddle and Seow, 1996, Dechow, Lys, and Sabino, 1998, and Ball, Kothari, and Robin, 1999).

61
4.1.4 Models of discretionary and non-discretionary accruals
Motivation
I review methodological research on models of discretionary and non-discretionary accruals
because of their preeminent role in researchers’ ability to draw correct inferences in capital markets
and other research in accounting. Discretionary accruals and earnings management are used
synonymously in the literature. Schipper (1989) defines earnings management as “purposeful
intervention in the external reporting process, with the intent of obtaining some priva te gain to
managers or shareholders”. The discretionary accrual models split total accruals into a
discretionary component, which serves as a proxy for earnings management, and a non-
discretionary portion. The non-discretionary accrual together with operating cash flows is the non-
discretionary portion of reported earnings. At least three streams of research use discretionary
accrual models.
First, discretionary accrual models are used in tests of contracting- and political-cost-based
hypotheses about management’s incentives to manipulate accounting numbers (i.e., opportunistic
use of accruals). Alternatively, this research hypothesizes that firms choose accounting policies or
include discretionary accruals in earnings to convey management’s private information about the
firm’s prospects or to more accurately reflect the firm’s periodic performance, i.e., the efficient
contracting use of accruals (see Holthausen and Leftwich, 1983, Watts and Zimmerman, 1990,
Holthausen, 1990, and Healy and Palepu, 1993). This body of research is usually not in the capital
markets area.
Second, using market efficiency as a maintained hypothesis, many studies test the efficient
contracting and opportunism hypotheses by correlating earnings components with stock returns.
This research is frequently aimed at testing the information content or association with security
returns of new mandated recognition or disclosure standards of accounting. Examples of this
research include studies examining whether banks’ disclosures of fair values of investments and
loans contain value-relevant information (see, e.g., Barth, 1994, Barth, Beaver, and Landsman,
1996, and Nelson, 1996). Alternatively, research examines properties of voluntarily disclosed
accounting data to test the efficient contracting and opportunism hypotheses (e.g., Beaver and
Engel, 1996, and Wahlen, 1994). Beaver and Venkatachalam (1999) is an example of research that
simultaneously tests the information content and opportunism hypotheses, i.e., it allows for both
non-strategic noise and opportunistic accrual manipulation.
62
Third, a recent popular area of research tests the joint-hypothesis of market inefficiency and
accrual manipulation with a capital market motivation, e.g., an incentive to manipulate accruals
upward in periods prior to stock issues (see Dechow, Sloan, and Sweeney, 1996, and Jiambalvo,
1996). Recent developments in financial economics and accounting, which are suggestive of
informational inefficiency of the capital markets, have fueled this research. The research tests
whether there is a positive association between current manipulated (or discretionary) accruals and
subsequent risk-adjusted abnormal stock returns. Examples of research in this area include Sloan
(1996), Teoh, Welch and Wong (1998a, and b), Teoh, Wong, and Rao (1998), Rangan (1998), and
Ali, Hwang, and Trombley (1999).
Discretionary accrual models
There are five well-known time-series models of discretionary accruals in the literature.53
These are: the DeAngelo (1986) model, the Healy (1985) model, the industry model used in
Dechow and Sloan (1991), the Jones (1991) model, and the modified-Jones model by Dechow,
Sloan, and Sweeney (1995). Of these only the Jones and modified-Jones models are commonly
used in research in part because they outperform the rest in terms of specification and power (see
Dechow, Sloan, and Sweeney, 1995). Thomas and Zhang (1999) dispute Dechow et al.’s finding
and conclude “Only the Kang-Sivaramakrishnan model, which is coincidentally the least popular
model, performs moderately well.” Kang and Sivaramkrishnan (1995) employ an instrumental
variable approach to estimate discretionary accruals.
Moreover, cross-sectional estimation of the Jones model (see DeFond and Jiambalvo, 1994,
and Subramanyam, 1996b) has replaced the original time-series formulation of the model in terms
of recent application. DeFond and Jiambalvo (1994), Subramanyam (1996b) and other studies have
legitimized the cross-sectional estimation. Their evidence suggests the performance based on cross-
sectional estimation is no worse than that using time-series estimation of the Jones and modified-
Jones models. Cross-sectional estimation imposes milder data availability requirements for a firm
to be included for analysis than time-series estimation. This mitigates potential survivor bias
problems. The precision of the estimates is also likely higher in cross-sectional estimation because
of larger sample sizes than the number of time-series observations for an individual firm. The
downside of cross-sectional estimation is that cross-sectional variation in the parameter estimates is
53 Strictly speaking, they are models of non-discretionary accruals and the residual (or the intercept plus the residual) from each model is an estimate of discretionary accruals.

63
sacrificed. However, conditional cross-sectional estimation is a good remedy for the problem (see
previous discussion in the context of time-series properties of annual earnings forecasts in section
4.1.2, and Fama and French, 1998, and Dechow, Hutton, and Sloan, 1999).
Evaluation of discretionary accruals models
An influential study by Dechow, Sloan, and Sweeney (1995) evaluates the power and
specification of alternative discretionary accrual models. Their conclusion that the “modified
version of the model developed by Jones (1991) exhibits the most power in detecting earnings
management” (Dechow et al., 1995, p. 193) serves as the basis for the widespread use of the
modified-Jones model. Dechow et al. (1995, p. 193) also conclude that, while “all of the models
appear well specified when applied to a random sample”, “all models reject the null hypothesis of
no earnings management at rates exceeding the specified test levels when applied to samples of
firms with extreme financial performance.” Finally, Dechow et al. (1995, p. 193) find that “the
models all generate tests of low power for earnings management…”
Since earnings management studies almost invariably examine samples of firms that have
experienced unusual performance, the most relevant conclusion from Dechow et al. (1995) is that
the discretionary accrual models are seriously misspecified. The misspecification arises because the
magnitude of normal accruals, i.e., non-discretionary or expected accruals, is correlated with past
(and contemporaneous) firm performance. The dependence arises for two reasons. First, as
discussed in section 4.1 on the time-series properties of earnings, firm performance conditional on
past performance does not follow a random walk. Second, both operating accruals and operating
cash flows are strongly mean reverting (see Dechow, 1994, for evidence, and Dechow, Kothari, and
Watts, 1998, for a model that explains the correlation structure), which means these variables are
not serially uncorrelated. However, none of the five discretionary accrual models used in the
literature explicitly captures accruals’ serial correlation property, so estimated discretionary accruals
are biased and contaminated with non-discretionary accruals. Evidence in Guay, Kothari, and
Watts (1996), who use market-based tests, and Hansen (1999), who examines the behavior of future
earnings, suggests that the extent of the non-discretionary accrual component in estimated
discretionary accruals is large. Thomas and Zhang’s (1999) conclusion is still stronger. They infer
that the commonly used models “provide little ability to predict accruals.”
I now turn attention to power of the tests that use discretionary accruals. Power of a test is
the frequency with which the null hypothesis is rejected when it is false. In assessing the power of
64
the discretionary accrual models, there are two relevant issues. First, if a test is misspecified (i.e.,
rejection frequency under the null exceeds the significance level of the test, e.g., 5%), statements
about the power of the test are not particularly meaningful. Second, assuming that the estimated
discretionary accruals are adjusted for bias due to past performance or other reasons, I would argue
that the discretionary accrual models yield tests of high, not low power. This conclusion contrasts
with Dechow et al. (1995). They examine the power of the tests using individual securities, i.e.,
sample size is one. Since almost all research studies use samples in excess of 50-100, assuming
independence, the standard deviation of the mean discretionary accrual is an order of magnitude
smaller than that in Dechow et al. (1995).54 Therefore, in most research settings, the power is
considerably higher than reported in Dechow et al. (1995). Not surprisingly, the null of zero
discretionary accruals is often rejected in empirical research.
Future research: Better models of discretionary accruals and better tests
The misspecification of and bias in the discretionary accrual models suggest that inferences
about earnings management might not be accurate. Accruals should be modeled as a function of a
firm’s immediate past economic performance, so that discretionary accrua ls can be more accurately
isolated (see Kaplan, 1985, McNichols and Wilson, 1988, Guay, Kothari, and Watts, 1996, Healy,
1996, and Dechow, Kothari, and Watts, 1998). Shocks to a firm’s economic performance affect
normal accruals as well as serve as a strong motivation to managers to manipulate accruals both
opportunistically and to convey information. This complicates the researcher’s task of separating
discretionary from non-discretionary accruals.
Collins and Hribar (2000b) point to another problem in identifying not only discretionary
accruals, but total accruals as well. They show that a researcher’s estimate of total accruals using
the balance sheet approach instead of taking information directly from a cash flow statement is
economically significantly biased in the presence of mergers and acquisitions and discontinued
operations.55 Precise information on cash flows and accruals has become available only after the
Statement of Financial Accounting Standard No. 95 became effective in 1987, and many research
studies use the balance sheet approach even in the recent period. The misestimation of total
accruals increases the error in estimating discretionary accruals and potentially biases the estimated
54 Even if the standard deviation is estimated with a correction for cross-sectional dependence, it is likely to be considerably smaller than that for a sample of one firm as in Dechow et al. (1995). 55 Also see Drtina and Largay (1985), Huefner, Ketz, and Largay (1989), and Bahnson, Miller, and Budge (1996).

65
discretionary accrual. If the test sample firms are more active in mergers and acquisitions or have
discontinued operations more frequently than the control sample firms, then Collins and Hribar
(2000b) analysis suggests the inferences might be incorrect. Their replication of the studies
examining seasoned equity offering firms’ accrual manipulation reveals that the bias in estimated
discretionary accruals largely accounts for the apparent manipulation documented in Teoh, Welch,
and Wong (1998a) and elsewhere.
Another complicating factor is whether discretionary accruals are motivated by managerial
opportunism or efficient contracting considerations. Subramanyam (1996b) reports results of the
tests of estimated discretionary accruals’ association with returns and with future earnings and cash
flow performance. He concludes that discretionary accruals are on average informative, not
opportunistic.56 In contrast, portfolios representing firms with extreme amounts of accruals, which
are likely to be flagged as extreme discretionary accrual portfolios, are suggestive of accrual
manipulation with a motivation to (successfully) fool capital markets (see Sloan, 1996, Xie, 1997,
and Collins and Hribar, 2000a and b). Because the opportunism and efficient contracting
motivations are likely linked to managers’ incentives and firm performance, it behooves researchers
to link the development of a discretionary accrual model to firm performance.
Simultaneous with the development of better economic models of discretionary accruals,
improved tests using discretionary accruals are required. The demand for better tests arises for at
least three reasons. First, research using discretionary accruals frequently examines multi-year
performance, whereas methodological studies like Dechow, Sloan, and Sweeney (1995) examine
discretionary accrual performance over only one-year. Second, test statistics calculated assuming
cross-sectional independence might be misspecified especially when a researcher examines
performance over multi-year horizons. See Brav, 1999, for evidence on bias in tests of long-
horizon security-return performance using tests that ignore positive cross-sectional dependence
(also see Collins and Dent, 1984 and Bernard, 1987).
Third, test statistics for multi-year performance might be misspecified because long-horizon
performance is likely right skewed (or might exhibit some other form of non-Normality) and not all
sample firms survive, so there might be a survivor bias. While a t-test using a large sample size is
quite robust to non-Normality, the combination of skewness (or other forms of non-Normality) and
56 However, Subramanyam (1996b) finds that the coefficient on discretionary accruals is smaller than that on nondiscretionary accruals, which is consistent with discretionary accruals being partially opportunistic or that they are less permanent than non-discretionary accruals.

66
cross-sectional dependence might contribute to test misspecification. Use of Bootstrap standard
errors would be an option that is worth examining to tackle problems arising from both non-
Normality and survivor biases.
Fourth, the percentage of firms surviving the multi-year test period in a typical research
study is considerably smaller than 100%. For example, Teoh, Wong, and Rao (1998) study a
sample of 1,514 IPOs for a six-year post-IPO period. In their tests based on the return-on-sales
performance measure using a matched-pair sample, the number of firms surviving in the sixth post-
IPO year is only 288, i.e., 19% of the original sample (see table 2, panel C in Teoh, Wong, and Rao,
1998). Such a large reduction in sample size is not unique to the Teoh, Wong, and Rao (1998)
study. Surprisingly, however, there is no systematic evidence in the literature on whether such a
large degree of attrition imparts a bias. Moreover, in a matched-pair research design, is the attrition
due more often to the lack of survival of test firms or matched control firms? Does this matter?
Finally, evidence in Barber and Lyon (1996) suggests that use of a performance-matched
control firm yields unbiased measures of abnormal operating performance in random and non-
random samples. Use of performance-matched samples is common in research examining
discretionary accruals. However, a systematic study of the specification and power of the tests of
discretionary accruals us ing performance-matched control firm samples is missing in the literature.
Capital market research implications
Of direct relevance in this review of the capital markets literature is the question whether
capital market studies are affected by problems with the discretionary accrual models. I believe
they are. Let me give one example. Consider the hypothesis in Aharony, Lin, and Loeb (1993),
Friedlan (1994), Teoh, Welch, and Wong (1998b), Teoh, Wong, and Rao (1998), and other studies
that in the years leading up to an IPO, management biases financial performance upward through
positive discretionary accruals.
First, management’s IPO decision is endogenous. It is likely to be taken in light of superior
past and expected future economic performance and a need for cash for investments to meet the
anticipated demand for the company’s products and services. However, high growth is mean
reverting. One reason is that a portion of high growth often results from transitory earnings due to a
non-discretionary (or neutral) application of GAAP. Thus, a portion of the subsequent performance
reversal is expected and may not be due to discretionary accruals.

67
Second, the popularly used modified-Jones model treats all of the increase in accounts
receivables as discretionary (see Teoh, Wong, and Rao, 1998, and Dechow, Sloan, and Sweeney,
1995).57 Thus, legitimate revenue growth on credit is treated as discretionary or fraudulent (see
Beneish, 1998). This means, since extreme revenue growth is mean reverting, the modified-Jones
model exacerbates the bias in estimated discretionary accrual in the post-IPO period.
The above example suggests the possibility of bias in estimated discretionary accruals (also
see Beneish, 1998). More careful tests are warranted to draw definitive conclusions. In addition to
documenting evidence of discretionary accruals, researchers correlate the estimated discretionary
accruals with contemporaneous and subsequent security returns to test market efficiency. I defer to
section 4.4 a discussion of potential consequences of misspecified discretionary accrual models for
inferences about the market’s fixation on reported accounting numbers in the context of tests of
market efficiency. As noted above, the capital market motivation for accrual manipulation has
assumed great importance in light of evidence suggesting capital markets might be informationally
inefficient.
4.2 Alternative accounting performance measures
Starting with Ball and Brown (1968), many studies use association with stock returns to
compare alternative accounting performance measures like historical cost earnings, current cost
earnings, residual earnings, operating cash flows, and so on. A major motivation for research
comparing alternative performance measures is perceived deficiencies in some of the performance
measures. For example, Lev (1989), the AICPA Special Committee on Financial Reporting (1994),
also known as the Jenkins Committee, and compensation consultants like Stern, Stewart &
Company (Stewart, 1991) all argue that the historical cost financial reporting model produces
earnings of “low quality” vis-à-vis firm performance.
Researchers’ explicit or implicit use of the term “earnings quality” is either in the context of
examining whether earnings information is useful to investors for valuation or in evaluating
managers’ performance. Capital-markets research typically assumes that an accounting
performance measure serves either the managerial performance measure role or the valuation
57 Teoh, Wong, and Rao (1998, p. 192) describe their estimation of discretionary accruals as follows: “…we first estimate expected current accruals by cross-sectionally regressing current (not total) accruals on only the change in sales revenues. The expected current accruals is calculated using the estimated coefficients in the fitted equation after subtracting the change in trade receivables from the change in sales revenues. The residual of current accruals is the abnormal current accruals.”

68
information role. A managerial performance measure indicates the value added by the manager’s
efforts or actions in a period, whereas a measure designed to provide information useful for
valuation gives an indication of the firm’s economic income or the change in shareholders’ wealth.
The former has a contracting motivation and the latter has an informational or valuation motivation.
Although I expect the performance measure with the contracting motivation to be positively
correlated with the performance measure designed with a valuation motivation, I do not expect the
two to be the same (see discussion below). Therefore, I believe the research design comparing
alternative performance measures should be influenced by the assumed choice of the objective.
Review of past research
Early research on association studies (e.g., Ball and Brown, 1968), which is reviewed in
section 3, firmly establishes that earnings reflect some of the information in security prices.
However, this early research did not perform statistical tests comparing alternative performance
measures, since the primary concern was to ascertain whether there is any overlap between earnings
information and the information reflected in security prices.
In the 1980’s several studies statistically compare stock returns’ association with earnings,
accruals, and cash flows. This research includes long-window association studies by Rayburn
(1986), Bernard and Stober (1989), Bowen, Burgstahler, and Daley (1986 and 1987), and Livnat
and Zarowin (1990) and short-window tests by Wilson (1986 and 1987). Apart from providing a
formal test, their motivation is that previous research used a relatively crude measure of cash flows.
They also use more sophisticated expectation models to more accurately isolate the unexpected
components of earnings (accruals) and cash flows, because returns in an efficient market only
reflect the unanticipated components. The conclusion from most of these studies is that there is
incremental information in accruals beyond cash flows.
In this heavily researched area of the relative information content of earnings and cash
flows, Dechow’s (1994) innovation is in developing cross-sectional predictions about the conditions
that make earnings relatively more informative about a firm’s economic performance than cash
flows (also see Dechow, Kothari, and Watts, 1998). Dechow (1994) argues that the emphasis in
previous research on unexpected components of the performance measures is misplaced. She views
performance measures as primarily serving a contracting purpose. Therefore, she is not interested
in a research design that (i) attempts to obtain the most accurate proxy for the anticipated
component of a performance measure and (ii) correlates the unanticipated component with stock

69
returns. She argues that managers’ compensation contracts almost invariably specify only one
summary performance variable (e.g., earnings) and that the contracts rarely specify it in terms of the
innovation in the variable (e.g., unexpected earnings). Dechow (1994) therefore forcefully argues
that tests evaluating alternative performance measures should seek to identify the best alternative
measure, regardless of whether each measure provides incremental association. 58
Current interest
Recent research examines new performance measures that the FASB requires to be
disclosed (e.g., comprehensive income compared to primary earnings per share by Dhaliwal,
Subramanyam, and Trezevant, 1999). Alternatively, research compares different measures
advocated by compensation consultants like Stern Stewart & Company against earnings (e.g., EVA
compared against earnings by Biddle, Bowen, and Wallace, 1997) or measures that have evolved in
different industries (e.g., Vincent, 1999, and Fields, Rangan, and Thiagarajan, 1998, examine
alternative performance measures used by real estate investment trusts, REITs). Evidence from
these studies suggests that performance measures that have evolved voluntarily in an unregulated
environment (e.g., performance measures in the REIT industry) are more likely to be incrementally
informative than those mandated by regulation (e.g., comprehensive income).
Unresolved issues and future research
Correlation with returns as a criterion. Research evaluating alternative performance
measures frequently uses association with security returns as the criterion to determine the best
measure. Going back to Gonedes and Dopuch (1974), a long-standing issue has been whether
association with stock returns is the right test. Holthausen and Watts (2001) offer an in-depth
analysis of the issue as well. Research evaluating alternative performance measures must recognize
that the objective of a particular performance measure should influence the choice of a test.
Consider the scenario in which the performance measure and financial statements are geared
towards facilitating debt contracts. It is not clear that a performance measure that seeks to measure
58 Dechow (1994) proposes the Vuong (1989) test, which, in substance, is a test of difference between the adjusted explanatory powers of two models, each with one (set of) explanatory variable(s), but the same dependent variable in both the models. Following Dechow (1994), the Vuong (1989) test has become the industry standard. However, there are alternatives to the Vuong test, as developed in Biddle, Seow, and Siegel (1995), or the Davidson and MacKinnon (1981) non-nested J-test. Biddle and Seow (1996) claim that the Biddle, Seow, and Siegel (1995) test’s specification and power are at least as good as or better than the Vuong and J-tests in the presence of heteroskedastic and cross-correlated data (see Dechow, Lys, and Sabino, 1998). Another alternative is to compare r-squares of two models with or without the same dependent variable using the standard error of the r-square as derived in Cramer (1987). This approach is helpful in making comparisons across countries (see for example, Ball, Kothari, and Robin, 1999) or across industries.

70
the change in the value of the firm’s growth options, which would be reflected in the change in the
firm’s market capitalization, is of greatest interest to the firm’s debt-holders.
As another example, if the objective of a performance measure is to report the net value of
the delivered output in the past period, then it may not necessarily correlate highly with stock
returns (see, for example, Lee, 1999, and Barclay, Gode, and Kothari, 1999). The reason is that
return for a period reflects the consequences of only the unanticipated component of the period’s
delivered output and revisions in expectations about future output. Once we accept that highest
correlation with returns is neither a necessary nor a sufficient condition in comparing alternative
performance measures, then incremental information content of a measure becomes a questionable
criterion in evaluating alternative performance measures.
Level or unanticipated component of a performance measure. As noted earlier, Dechow
(1994) argues that most management compensation contracts use only one accounting performance
measure and that the measure is not the unexpected component of the performance variable. She
therefore advocates against using the unexpected component of the performance measure. This
suggests correlating the level of the performance measure with the level of price. Use of beginning-
of-the-period price as a deflator for both dependent and independent variables is motivated by the
econometric benefits (e.g., fewer correlated omitted variables, lesser heteroscedasticity and reduced
serial correlation) that follow from using price as a deflator (see Christie, 1987). However, Ohlson
(1991), Ohlson and Shroff (1992) and Kothari (1992) show that, because price embeds expectations
about future performance, it serves not only as a deflator with econometric benefits, but it in effect
correlates returns with the unexpected component of the performance measure. Therefore, if the
objective is to focus on the total performance measure, not just its unexpected component, then
should it be correlated with returns or prices? Correlation with prices indeed correlates the entire
performance measure with prices because current price contains information in the surprise as well
as the anticipated components of the performance measure (Kothari and Zimmerman, 1995).59 The
down side of correlating prices with a performance measure is that there can be severe econometric
problems due to heteroscedasticity and correlated omitted variables (see Gonedes and Dopuch,
1974, Schwert, 1981, Christie, 1987, Holthausen, 1994, Kothari and Zimmerman, 1995, Barth and
Kallapur, 1996, Skinner, 1996, Shevlin, 1996, Easton, 1999, and Holthausen and Watts, 2001).
59 For other advantages of using price regressions, also see Lev and Ohlson (1982) and Landsman and Magliolo (1988).
71
Correlation with future cash flows. An important stated objective of financial accounting
standards is that financial information should be helpful to users in assessing the amount, timing,
and uncertainty of future cash flows (see SFAC No. 1, 1978). An operational interpretation of this
criterion is to compare performance measures on the basis of their correlation with future cash
flows. Some recent research examines earnings’ correlation with future cash flows (see Finger,
1994, Dechow, Kothari, and Watts, 1998, and Barth, Cram, and Nelson, 1999). If a researcher
employs correlation with future cash flows as the criterion to evaluate alternative performance
measures, then the performance measure’s correlation with prices would serve as a complementary
test. The benefit of using price is that it contains information about expected future cash flows in an
efficient market, which means the vector of expected future cash flows is collapsed into a single
number, price. Of course, the trade-off is econometric problems in using price- level regressions
(see Holthausen and Watts, 2001) and the effect of discount rates on price, holding cash flows
constant.
4.3 Valuation and fundamental analysis research
This section begins with a discussion of the motivation for research on fundamental analysis
(section 4.3.1). Section 4.3.2 explains the role of fundamental analysis as a branch of capital
markets research in accounting. Section 4.3.3 describes the dividend discounting, earnings
capitalization, and residual income valuation models that are used frequently in accounting
research. This section also reviews the empirical research based on these valuation models. Section
4.3.4 reviews the fundamental analysis research that examines financial statement ratios to forecast
earnings and to identify mispriced stocks.
4.3.1 Motivation for fundamental analysis
The principal motivation for fundamental analysis research and its use in practice is to
identify mispriced securities for investment purposes. However, even in an efficient market there is
an important role for fundamental analysis. It aids our understanding of the determinants of value,
which facilitates investment decisions and valuation of non-publicly traded securities. Regardless
of the motivation, fundamental analysis seeks to determine firms’ intrinsic values. The analysis
almost invariably estimates the correlation between the intrinsic value and the market value using
data for a sample of pub licly traded firms. The correlation between market values and intrinsic
value might be estimated directly using intrinsic values or indirectly by regressing market values on
determinants of the intrinsic value. In this section, I examine the latter. The last step in

72
fundamental analysis is to evaluate the success or failure of intrinsic valuation on the basis of the
magnitude of risk-adjusted returns to a trading strategy implemented in periods subsequent to
intrinsic valuation. This is a test of market efficiency and I discuss research on this topic in section
4.4.
4.3.2 Is fundamental analysis accounting research?60
To better answer the question whether research on fundamental analysis should be
considered as part of accounting research, first compare the information set in financial statements
with the set incorporated in market values. Since market value is the discounted present value of
expected future net cash flows, forecasts of future revenues, expenses, earnings, and cash flows are
the crux of valuation. Lee (1999, p. 3) concludes that the “essential task in valuation is forecasting.
It is the forecast that breathes life into a valuation model.” However, in most economically
interesting settings (e.g., IPOs, high growth firms, and efficiency enhancing and/or synergy
motivated mergers), financial statements prepared according to current GAAP are likely to be
woefully inadequate as summary statistics for the firm’s anticipated future sales, and therefore, for
predicted future earnings information that is embedded in the current market values. Therefore,
unless current accounting rules are changed dramatically, it is unlikely that financial statements in
themselves will be particularly useful or accurate indicators of market values.
The reliability principle that underlies GAAP is often cited as the reason why financial
statements do not contain forward- looking information that affects market values. For example,
Sloan (1998, p. 135) surmises “It seems that it is the reliability criterion that makes the difference
between the myriad of variables that can help forecast value and the much smaller subset of
variables that are included in GAAP.” While the reliability principle is important, I believe the
revenue recognition principle is just as, if not more, important. The revenue recognition principle
reduces financial statements to answering the question “What have you done for me lately?” Thus,
even if future revenue were to be reliably anticipated (at least a big fraction of it can be for many
firms), still none of it would be recognized. Since market values and changes in those values
depend crucially on news about future revenues, current GAAP financial statements are unlikely to
be particularly timely indicators of value.
60 This question might be asked of some other research as well (e.g., market efficiency research in accounting). However, my casual observation is that this question is raised more frequently in the context of fundamental analysis.

73
In spite of a lack of timely information in financial statements, I emphasize the following.
First, lack of timeliness in itself does not imply a change in GAAP with respect to the revenue
recognition principle (or the reliability principle) is warranted; I am merely describing current
GAAP. There are economic sources of demand for historical information in financial statements
and therefore for the revenue recognition principle, but that is beyond the scope of this review.
Second, there is still some information conveyed by financial reports that is not already in the public
domain, as seen from the event study research on the information content of accounting. The
association study and the earnings response coefficient literatures seek to ascertain whether
accounting captures some of the information that affects security prices and how timely are
accounting reports in reflecting that information. As discussed earlier, one concern in this literature
is whether GAAP and/or managerial discretion render accounting numbers devoid of value-relevant
information.
Given the historical nature of information in financial statements, meaningful fundamental
analysis research requires accounting researchers to expand the definition of capital markets
research to include research using forecasted earnings information for fundamental analysis. Lee
(1999) offers a spirited defense of this viewpoint. He concludes (p. 17) “User-oriented research,
such as valuation, is definitely a step in the right direction” for accounting researchers. I concur.
However, such research has to move beyond reporting descriptive statistics and evidence of the
success of trading strategies into proposing theories and presenting empirical tests of the hypotheses
derived from the theories.
Students of fundamental analysis and valuation research should have an understanding of
alternative valuation models and fundamental analysis techniques both from the perspective of
fulfilling the demand for valuation in an efficient market and intrinsic valuation analysis designed to
identify mispriced securities. Below I summarize valuation models and empirical research
evaluating the models. I follow this up with fundamental analysis research like Ou and Penman
(1989a and b), Lev and Thiagarajan (1993), and Abarbanell and Bushee (1997 and 1998). Whether
abnormal returns can be earned using intrinsic value calculation or fundamental analysis is deferred
to the next section on tests of market efficiency.
4.3.3 Valuation models
For fundamental analysis and valuation, the accounting literature relies on the dividend-
discounting model or its transformation, like the earnings (capitalization) model or the residual

74
income model. An ad hoc balance-sheet model is also popular in the literature (e.g., Barth and
Landsman, 1995, Barth, 1991 and 1994, and Barth, Beaver, and Landsman, 1992). It implicitly
relies on the assumption that a firm is merely a collection of separable assets whose reported
amounts are assumed to be noisy estimates of their market values. The balance sheet model is used
primarily to test value relevance in the context of evaluating financial reporting standards, which is
not the primary focus of my review (see Holthausen and Watts, 2001). Moreover, when used, the
balance sheet model is typically augmented to also include earnings as an additional variable, which
makes it empirically similar to the transformed dividend-discounting models. I therefore only
discuss the dividend discounting model and its accounting-variable-based transformations.
Dividend-discounting and earnings capitalization models
This model is generally attributed to Williams (1938). The dividend-discounting model
defines share price as the present value of expected future dividends discounted at their risk-
adjusted expected rate of return. Formally,
Pt = Σk = 1 to ∞ {Et[Dt+k] / Πj = 1 to k (1 + rt+j) (18)
where
Pt is the share price at time t,
Σ is the summation operator,
Et[Dt+k] = the market’s expectation of dividends in period t+k,
Π is the product operator, and
rt+j = the risk-adjusted discount rate that reflects the systematic risk of dividends in period t+j.
As seen from eq. (18), price depends on the forecasts of future dividends and the discount
rates for future periods. Gordon (1962) makes simplifying assumptions about both the dividend
process and discount rates to derive a simple valuation formula, known as the Gordon Growth
model. Specifically, if the discount rate, r, is constant through time and dividends are expected to
grow at a constant rate g < r, then
Pt = Et(Dt+1)/(r – g). (19)
Since future dividends can be rewritten in terms of forecasted values of future earnings and
future investments, the divided discounting model can be reformulated. Fama and Miller (1972, ch.
2) is an excellent reference for making the basic transition from the dividend-discounting model to
75
an earnings capitalization model. 61 Fama and Miller make several points that are helpful in
understanding the drivers of share price. First, value depends on the forecasted profitability of
current and forecasted future investments, which means dividend policy per se does not affect firm
value, only a firm’s investment policy affects value (Miller and Modigliani, 1961). Fama and
Miller (1972) entertain dividend signaling to the extent that a change in dividends conveys
information about the firm’s investment policy and in this sense mitigates information asymmetry. 62
Second, the growth rate, g, in eq. (19) depends on the extent of reinvestment of earnings into
the firm and the rate of return on the investments. However, reinvestment itself does not increase
market value today unless the return on investments in the future exceeds the discount rate or the
cost of capital, r. That is, if the expected return on investments in all future periods exactly equals r,
then share price is simply Xt+1/r, where Xt+1 is forecasted earnings for the next period. This
valuation is obtained regardless of the degree of expansion either through reinvestment or through
issuance of new equity. Fama and Miller (1972, p. 90) refer to this valuation as “the capitalized
value of the earnings stream produced by the assets that the firm currently holds.” Share value will
be higher than Xt+1/r only if the firm has opportunities to invest in projects that are expected to earn
an above-normal rate of return (i.e., return in excess of r).
Third, capitalization of forecasted earnings generally yields incorrect valuation because
future earnings also reflect growth due to reinvestment (i.e., plow back of earnings) and investments
financed by new issuance of equity. So, the transformation from a dividend-discounting model to
an earnings capitalization model requires an adjustment to exclude the effect of reinvestment on
future earnings, but include any effect on future earnings as a result of earning an above-normal rate
of return (i.e., the effect of growth opportunities on earnings).
Earnings capitalization models are popular in accounting and much of the earnings response
coefficient literature relies on them (see Beaver, 1998, and Beaver, Lambert, and Morse, 1980). In
earnings response coefficient applications of earnings capitalization models, forecasted earnings are
either based on time-series properties of earnings (e.g., Beaver, Lambert, and Morse, 1980,
Kormendi and Lipe, 1987, and Collins and Kothari, 1989) or analysts’ forecasts (e.g., Dechow,
61 For a more sophisticated treatment that allows for a changing discount rate, see Campbell and Shiller (1988a and b), Fama (1977 and 1996), and Rubinstein (1976). 62 See Ross, 1977, Bhattacharya, 1979, Asquith and Mullins, 1983, Easterbrook, 1984, Miller and Rock, 1985, Jensen, 1986, and Healy and Palepu, 1988, for some of the literature on dividend signaling.
76
Hutton, and Sloan, 1999). This literature finesses the reinvestment effect on earnings by assuming
that future investments do not earn above-normal rates of returns, which is equivalent to assuming a
100% dividend-payout ratio (e.g., Kothari and Zimmerman, 1995). The marginal effect of growth
opportunities is accounted for in the earnings response coefficient literature by using proxies like
the market-to-book ratio, or through analysts’ high forecasted earnings growth. The hypothesis is
that such growth opportunities will have a positive marginal effect on earnings response coefficients
(e.g., Collins and Kothari, 1989) because growth stocks’ prices are greater than Xt+1/r, the no-
growth valuation of a stock.
Residual income valuation models63
The Ohlson (1995) and Feltham and Ohlson (1995) residual income valuation models have
become hugely popular in the literature. Starting with a dividend-discounting model, the residual
income valuation model expresses value as the sum of current book value and the discounted
present value of expected abnormal earnings, defined as forecasted earnings minus a capital charge
equal to the forecasted book value times the discount rate. Ohlson (1995) and others (e.g., Bernard,
1995, and Biddle, Bowen, and Wallace, 1997) point out that the concept of residual income
valuation has been around for a long time.64 However, Ohlson (1995) and Feltham and Ohlson
(1995) deserve credit for successfully reviving the residual income valuation idea, for developing
the ideas more rigorously, and for impacting the empirical literature.
The Ohlson (1995) model imposes a time-series structure on the abnormal earnings process
that affects value. The linear information dynamics in the model (i) specifies an autoregressive,
time-series decay in the current period’s abnormal earnings, and (ii) models “information other than
abnormal earnings” into prices (Ohlson, 1995, p. 668). The economic intuition for the
autoregressive process in abnormal earnings is that competition will sooner or later erode above-
normal returns (i.e., positive abnormal earnings) or firms experiencing below-normal rates of
returns eventually exit. The other information in the Ohlson model formalizes the idea that prices
reflect a richer information set than the transaction-based, historical-cost earnings (see Beaver,
Lambert, and Morse, 1980).
63 Several critiques of the Ohlson and Feltham-Ohlson models appear in the literature. These include Bernard (1995), Lundholm (1995), Lee (1999), Lo and Lys (1999), Sunder (1999), and Verrecchia (1998). 64 The predecessor papers of the residual valuation concept include Hamilton (1777), Marshall (1890), Preinreich (1938), Edwards and Bell (1961), Peasnell (1982), and Stewart (1991).
77
The Feltham and Ohlson (1995) model retains much of the structure of the Ohlson (1995)
model except the autoregressive time-series process. The Feltham-Ohlson residual income
valuation model expresses firm value in terms of current and forecasted accounting numbers, much
like the dividend-discounting model does in terms of forecasted dividends or net cash flows.
Forecasted abnormal earnings can follow any process and they reflect the availability of other
information. This feature enables the use of analysts’ forecasts in empirical applications of the
Feltham-Ohlson model and is sometimes claimed to be an attractive feature of the valuation model
vis-à-vis the dividend-discounting model. For example, in comparing the applications of the
dividend-discounting model to the residual income valuation model, Lee, Myers, and Swaminathan
(1999) conclude that “practical considerations, like the availability of analysts’ forecasts, makes this
model easier to implement” than the dividend discount model (also see Bernard, 1995, pp. 742-
743). The illusion of ease arises because, assuming clean surplus, one can value the firm directly
using abnormal earnings forecasts, rather than backing out net cash flows from pro forma financial
statements. Abnormal earnings forecasts are the difference between (analysts’) forecasts of
earnings and a capital charge, i.e., Et[Xt+k – r*BVt+k-1]. Using abnormal earnings forecasts, the
share price at time t, Pt, is expressed as65
Pt = BVt + Σk = 1 to ∞ Et[Xt+k – r*BVt+k-1]/(1 + r)k (20)
where
BVt = book value of equity at time t,
Et[.] = the expectation operator where the expectation is based on information available at time t, Xt = earnings for period t, and
r = the risk-adjusted discount rate applicable to the equity earnings (or cash flows).
While eq. (20) expresses price in terms of forecasted book values and abnormal earnings, those
forecasts have precisely the same information as forecasts of dividends, which are implicit in
analysts’ forecasts of earnings. Stated differently, the residual income valuation model is a
transformation of the dividend-discounting model (see Frankel and Lee, 1998, Dechow, Hutton, and
Sloan, 1999, and Lee, Myers, and Swaminathan, 1999).
In addition to the apparent ease of implementation, Bernard (1995) and others argue that
another appealing property of the residual income valuation model is that the choice of accounting
65 The pricing equation is misspecified in the presence of complex, but routinely encountered, capital structures that include preferred stock, warrants, executive stock options etc. I ignore such misspecification in the discussion below.

78
method does not affect the model’s implementation. If a firm employs aggressive accounting, its
current book value and earnings would be high, but its forecasted earnings will be lower and the
capital charge (or normal earnings) would be higher. Therefore, lower forecasted future abnormal
earnings offset the consequences of aggressive accounting that appear in current earnings.
Unfortunately, the elegant property that the effect of the management’s choice of accounting
methods on earnings in one period is offset by changes in forecasted earnings has three unappealing
consequences. First, it renders the Feltham-Ohlson model devoid of any accounting content, just as
a dividend-discounting model is not particularly helpful for financial reporting purposes. The
accounting content is lost because the model does not offer any guidance or predictions about firms’
choice of accounting methods or properties of accounting standards, notwithstanding the frequent
use of the term conservative and unbiased accounting in the context of the residual income model.
This point is discussed in detail in Lo and Lys (1999), Sunder (1999), Verrecchia (1998), and
Holthausen and Watts (2001).
Second, from a practical standpoint of an analyst, even though reduced future abnormal
earnings offset the effect of aggressive accounting methods, an analyst must forecast future
abnormal earnings by unbundling current earnings into an aggressive-accounting-method-induced
component and remaining regular earnings.
Third, the interpretation of abnormal earnings is clouded. Some researchers interpret
expected abnormal earnings as estimates of economic rents (Claus and Thomas, 1999, and Gebhardt
et al., 1999). However, the choice of accounting methods mechanically affects the estimates of
expected abnormal earnings, so those estimates by themselves are not an indication of economic
rents. For example, a firm choosing the pooling of interest method of accounting for a merger will
have higher expected “abnormal” earnings compared to an otherwise identical firm that uses the
purchase method of accounting for mergers. In contrast, America Online is expected to report an
amortization charge of approximately $2 billion per year for next 25 years as a result of its merger
with Time Warner, which will be accounted for as a purchase transaction.
Empirical applications and evaluation of valuation models
All valuation models make unrealistic assumptions. This feature is common to most
theoretical models, like the Ohlson (1995) model that imposes a particular structure on the abnormal
earnings process and other information. It is fruitless to criticize one or more of these models on the

79
basis of the realism of the assumptions.66 Assuming efficient capital markets, one objective of a
valuation model is to explain observed share prices. Alternatively, in an inefficient capital market,
a good model of intrinsic or fundamental value should predictably generate positive or negative
abnormal returns. Therefore, in the spirit of positive science, it is worthwhile examining which of
these models best explains share prices and/or which has the most predictive power with respect to
future returns. In this section, I evaluate models using the former criteria, whereas the next section
focuses on the models’ ability to identify mispriced securities.
Several recent studies compare the valuation models’ ability to explain cross-sectional or
temporal variation in security prices (see Dechow, Hutton, and Sloan, 1999, Francis, Olsson, and
Oswald, 1997 and 1998, Hand and Landsman, 1998, Penman 1998, Penman and Sougiannis, 1997
and 1998, and Myers, 1999).67 Two main conclusions emerge from these studies. First, even
though the residual income valuation model is identical to the dividend-discounting model,
empirical implementations of the dividend-discounting model yield value estimates do a much
poorer job of explaining cross-sectional variation in market values than earnings capitalization
models (e.g., Francis, Olsson, and Oswald, 1997, and Penman and Sougiannis, 1998). Second, the
traditional implementation of the dividend-discounting model by capitalizing analysts’ forecasts of
earnings is just about as successful as the residual income valuation model (e.g., Dechow, Hutton,
and Sloan, 1999, Lee, Myers, and Swaminathan, 1999, and Liu, Nissim, and Thomas, 2000). I
discuss and explain the two conclusions below.
The poor showing of the dividend-discounting model, the first conclusion stated above,
appears to be a consequence of inconsistent application of the model in current research (see
Lundholm and O’Keefe, 2000, for an in-depth discussion). Consider the implementation of the
model in Penman and Sougiannis (1998) and Francis et al. (1997) with a five-year horizon for
dividend forecasts plus terminal value. The dividend forecasts for the five years generally account
for a small fraction of current market value. This is not surprising because dividend yield is only a
few percent. The terminal value is estimated assuming a steady-state growth in dividends beyond
year five. It is common to assume the steady-state growth rate, g, to be either zero or about 4%.
66 Lo and Lys (1999), in the spirit of Roll’s (1977) critique of the CAPM, argue that the Feltham and Ohlson (1995) and Ohlson (1995) models are not testable. Any test of the models is a joint test of the model (or the model’s assumptions) and that the model is descriptive of the market’s pricing of stocks. 67 In an influential study, Kaplan and Ruback (1995) evaluate discounted cash flow and multiples approaches to valuation. Since they do not examine earnings-based valuation models, I do not discuss their study.

80
Both Penman and Sougiannis (1998) and Francis et al. (1997) report results using g = 0 or 4% in
perpetuity.
The inconsistent application of the dividend-discount model arises because if g = 0, then the
forecasted dividend in period 6 should be the earnings for period 6. FDt+6 should equal forecasted
earnings for year 6 because once the no-growth assumption is invoked, the need for investments
diminishes compared to that in the earlier growth periods. That is, there is no longer a need to plow
earnings back into the firm to fund investments for growth. Investments roughly equal to
depreciation would be sufficient to maintain zero growth in steady state. Therefore, cash available
for distribution to equityholders will approximate earnings, i.e., the payout ratio will be 100%.
Thus, assuming a zero growth in perpetuity will typically result in a huge permanent increase in
dividends from year 5 to year 6, with dividends equal to earnings in years 6 and beyond. Instead,
both Penman and Sougiannis (1998) and Francis et al. (1997) use FDt+5 * (1 + g), where FDt+5 is
forecasted dividend for year 5. Naturally, they find that dividend capitalization models perform
poorly. 68 However, if the implications of the zero-growth assumption are applied consistently to the
dividend discounting and the residual income valuation models, the fundamental value estimate
from both models will be identical. 69 Similar logic applies to other growth rate assumptions.
Francis et al. (1997, tables 3 and 4) do report results using the dividends = earnings
assumption to calculate the terminal value, but their approach is confounded by the fact that they
use Value Line’s five-year-ahead forecast of the price-earnings multiple. Ironically, either because
of the implicit assumption of dividends = earnings or because Value Line is skilled in forecasting
the future price-earnings multiple, the value estimates in Francis et al. that implicitly use the
dividends = earnings assumption for terminal value, are more accurate than all other models. The
former explanation is more likely because otherwise a trading strategy based on the Value Line
forecasts would yield huge abnormal returns.
The second conclusion from the empirical literature on valuation models is that simple
earnings capitalization models with ad hoc and/or restrictive assumptions do as well as the more
rigorous residual income valuation models in explaining cross-sectional variation in prices. The
economic intuition underlying the residual income valuation model is appealing. In the spirit of the
68 Additional misspecification is possible because earnings are eventually paid to both common and preferred stockholders, but the abnormal earnings valuation model is implemented without full consideration to preferred shareholders. 69 See Lundholm and O’Keefe (2000) and Courteau, Kao, and Richardson (2000) for further details on this point.
81
model, empirical applications generally assume that above-normal rates of returns on investments
will decay and there is a careful attempt to account for the wealth effects of growth through
reinvestment. Still, Dechow, Hutton, and Sloan (1999) find a simple model that capitalizes
analyst’s next period earnings forecast in perpetuity (i.e., a random walk in forecasted earnings and
100% dividend payout, both ad hoc assumptions) does better than the residual income valuation
model. 70, 71 What explains this puzzle?
To understand the lack of improved explanatory power of the more sophisticated valuation
models, consider the variance of the independent variable, forecasted earnings. Forecasted earnings
have two components: normal earnings (= the capital charge) and expected abnormal earnings.
Since the present value of normal earnings is the book value, which is included as an independent
variable, the normal earnings component of forecasted earnings serves as an error in the
independent variable that uses forecasted earnings to explain prices. However, for annual earnings
data, most of the variance of forecasted earnings is due to expected abnormal earnings. Use of a
constant discount rate across the sample firms further reduces the variance accounted for by normal
earnings in the residual income valuation model applications (Beaver, 1999).72 Therefore, in spite
of the fact that forecasted earnings are contaminated by normal earnings, which contributes to
misestimated persistence in the context of valuation, the resulting errors- in-variables problem is not
particularly serious. The variance of the measurement error is small relative to the signal variance,
i.e., the variance of forecasted earnings minus normal earnings. In addition, any error in estimating
the cost of capital employed to calculate normal earnings diminishes the benefit of adjusting
forecasted earnings for normal earnings.
While controlling for normal earnings is not helpful in the above context, as an economic
concept it rests on solid grounds. The preceding discussion is not intended to discourage the use of
70 The improved explanatory power of fundamental values estimated using analysts’ forecasts vis -à-vis historical earnings information highlights the important role of other information that influences expectations of future earnings beyond the information in past earnings (e.g., Beaver, Lambert, and Morse, 1980). 71 Kim and Ritter (1999) find that IPOs are best valued using forecasted one-year-ahead earnings per share and Liu, Nissim, and Thomas (2000) present similar evidence comparing multiples of forecasted earnings against more sophisticated valuation models. 72 However, substituting a firm-specific discount rate is unlikely to make a big difference. Use of firm-specific discount rate is not without a cost: discount rates are notoriously difficult to estimate and existing techniques estimate the rates with a large standard error (see Fama and French, 1997).
82
discount rates or risk adjus tment. It simply highlights one context where the payoff to the use of
risk adjustment is modest. Over long horizons, risk-adjustment is potentially more fruitful.
There are at least three other empirical attempts (Myers, 1999, Hand and Landsman, 1998
and 1999) to test Ohlson’s (1995) linear information dynamics valuation model. All three studies as
well as Dechow, Hutton, and Sloan (1999) find evidence inconsistent with the linear information
dynamics. I do not think one learns much from rejecting the linear information dynamics of the
Ohlson model. Any one-size-fits-all description of the evolution of future cash flows or earnings
for a sample of firms is likely to be rejected. While an autoregressive process in residual income as
a parsimonious description is economically intuitive, there is nothing in economic theory to suggest
that all firms’ residual earnings will follow an autoregressive process at all stages in their life cycle.
A more fruitful empirical avenue would be to understand the determinants of the autoregressive
process or deviations from that process as a function of firm, industry, macroeconomic, or
international institutional characteristics. The conditional estimation attempts in Fama and French
(2000) and Dechow, Hutton, and Sloan (1999) to parameterize the autoregressive coefficient
(discussed in section 4.1.2) are an excellent start.
Residual income valuation models and discount rate estimation
An emerging body of research uses the dividend discounting model and the Feltham-Ohlson
residual income valuation model to estimate discount rates. This research includes papers by
Botosan (1997), Claus and Thomas (1999a and b), and Gebhardt, Lee, and Swaminathan (1999).
The motivation for this research is twofold.
First, there is considerable debate and disagreement among academics and practitioners with
respect to the magnitude of the market risk premium (see Mehra and Prescott, 1985, Blanchard,
1993, Siegel and Thaler, 1997, and Cochrane, 1997) and whether and by how much it changes
through time with changing riskiness of the economy (Fama and Schwert, 1977, Keim and
Stambaugh, 1986, Fama and French, 1988, Campbell and Shiller, 1988a, Kothari and Shanken,
1997, and Pontiff and Schall, 1998). The market risk premium is the difference between the
expected return on the market portfolio of stocks and the risk free rate of return. The historical
average realized risk premium has been about 8% per year (Ibbotson Associates, 1999).
Second, the cost of equity capital of an individual firm is a function of both the market risk
premium and its relative risk (e.g., beta of the equity in the context of the CAPM). In spite of a vast
body of research in finance and economics, the dust has still not settled on the set of priced risk

83
factors. In addition, estimates of a security’s sensitivity to priced factors, i.e., estimates of relative
risks, are notoriously noisy. Therefore, the state-of-the-art estimate of cost of equity (relative risk
times the risk premium plus the risk free rate) is extremely imprecise (see Fama and French, 1997,
and Elton, 1999).
Research that uses the Feltham-Ohlson model to estimate equity discount rates attempts to
improve upon the cost of equity estimates obtained using the traditional methods in finance. The
empirical approach to estimating the cost of equity using the Feltham-Ohlson model is quite
straightforward. It seeks to exploit information in analysts’ forecasts and current prices, rather than
that in the historical time series of security prices, to estimate discount rates. Gebhardt et al. (1999)
note that practitioners have long attempted to infer discount rates from analysts’ forecasts (e.g.,
Damodaran, 1994, Ibbotson, 1996, Gordon and Gordon, 1996, Madden, 1998, and Pratt, 1998), but
that the same approach is not popular among academics.
In an efficient market, price is the discounted present value of the sum of the book value
and the discounted present value of the forecasted residual income stream. Analysts’ forecasts of
earnings and dividend payout ratios are used to forecast the residual income stream. The cost of
equity then is defined as the discount rate that equates the price to the fundamental value, i.e., the
sum of book value and the discounted residual income stream. An analogous approach can be
employed to infer discount rates using forecasts of future dividends.
Since the information used in the residual income valuation model is identical to that needed
for the dividend discount model, discount rates backed out of a dividend discount model should be
exactly the same as those from the residual income valuation model. However, studies using
earnings-based valuation models to back out market risk premiums or equity discount rates claim
that earnings-based valuation models yield better estimates of discount rates than using the dividend
discount model. For example, Claus and Thomas (1999, p. 5) state: “Although it is isomorphic to
the dividend present value model, the abnormal earnings approach uses other information that is
current ly available to reduce the importance of assumed growth rates, and is able to narrow
considerably the range of allowable growth rates by focusing on growth in rents (abnormal
earnings), rather than dividends.”
The striking conclusion from the Claus and Thomas (1999a and b) and Gebhardt et al.
(1999) studies is that their estimate of the risk premium is only about 2-3%, compared to historical
risk premium estimated at about 8% in the literature. In line with the small risk premium, the

84
studies also find that cross-sectional variation in the expected rates of return on equity that would
capture differences in firms’ relative risks is also quite small. However, Gebhardt et al. (1999)
show that the variation in their estimates of costs of equity is correlated with many of the traditional
measures of risk. This increases our confidence in the estimated discount rates.
The attempts to estimate the market risk premium and costs of equity address an important
question. The intuition for why the estimated discount rates are less dispersed is that rational
forecasts are less variable than actual data.73 Therefore, estimates of discount rates using forecast
data are also expected to be less volatile than those obtained using ex post data. While it is
appealing to use forecast data to estimate discount rates, there is also a downside, and hence, I think
it is premature to conclude that the risk premium is as low as 2-3% for at least two reasons.
First, it is possible that forecasted growth, especially the terminal perpetuity growth rate,
used in the abnormal earnings valuation model is too low. The lower the forecasted growth,
mechanically the lower the discount rate must be in order for the price-equal-to-the-fundamental-
value identity to hold.
Second, the earnings-based fundamental valuation approach used to estimate discount rates
assumes market efficiency. However, the same approach is also employed to conclude that returns
are predictable and that the market is currently overvalued (e.g., Lee, Myers, and Swaminathan,
1999, and many other academics and practitioners). That is, assuming forecasts are rational and
accurate estimates of discount rates are used, Lee et al. and others conclude that equities are
predictably mispriced. Ironically, another body of research uses the residual income valuation
model to conclude that analysts’ forecasts are biased, and that the market is naively fixated on
analysts’ forecasts, and therefore returns are predictable (e.g., Dechow, Hutton, and Sloan, 1999,
and 2000).
In summary, of the three variables in the valuation model -- price, forecasts, and discount
rates -- two must be assumed correct to solve for the third. Using different combinations of two
variables at a time, research has drawn inferences about the third variable. Because the assumptions
in the three sets of research are incompatible, the conclusions are weak. Research on stock
mispricing relative to fundamental valuation, properties of analysts’ forecasts, and market’s naïve
reliance on analysts’ forecasts provides evidence on potential settings where the model fails or the
73 See Shiller (1981) for using this argument in the context of testing the rationality of the stock market. Shiller’s work led to a huge literature in finance and economics on examining whether stock markets are excessively volatile.

85
market’s pricing is inconsistent with that based on the valuation model. That is, the evidence is
inconsistent with the joint hypothesis of the model and market efficiency. These are tests of market
efficiency that I review in the next section. A fruitful avenue for future research would be to
provide further evidence on the relation between estimated discount rates and subsequent returns
(see Gebhardt et al., 1999).
4.3.4 Fundamental analysis using financial ratios
This stream of research has two objectives. First, it uses information in financial ratios to
forecast future earnings more accurately than using other methods (e.g., time series forecasts and/or
analysts’ forecasts). Second, it identifies mispriced securities. The underlying premise is that the
financial-ratio-based model predicts future earnings better than the alternatives and this superior
predictive power is not reflected in current share prices (i.e., market are inefficient).
Earnings prediction. There is a long-standing interest in earnings prediction in the
accounting literature (see section 4.1.2). Below I focus on forecasts of future earnings and
accounting rates of returns using financial ratios. There is a long history of practitioners and
academics interpreting univariate ratios like the price-earnings multiple and price-to-book ratio as
leading indicators of earnings growth (see, for example, Preinreich, 1932, Molodovsky, 1953,
Beaver and Morse, 1978, Cragg and Malkiel, 1982, Peasnell, 1982, Penman, 1996 and 1998, Ryan,
1995, Beaver and Ryan, 2000, and Fama and French, 2000). The economic logic for the predictive
power of price-earnings and price-to-book ratios with respect to future earnings is straightfo rward.
Price is the capitalized present value of a firm’s expected future earnings from current as well as
future expected investments, whereas current earnings only measure the profitability of realized
revenues from current and past investments. Price thus has information about the firm’s future
profitability, which contributes to the predictive ability of price-earnings and price-to-book ratios
with respect to future earnings growth. In addition to the predictive ability stemming from the
forward-looking information in prices about future earnings, the ratio-based earnings prediction
literature also examines the role of transitory earnings and accounting methods in forecasting
earnings.
Ou and Penman (1989a, and b) initiated rigorous academic research on earnings prediction
based on a multivariate analysis of financial ratios. The main idea is to examine whether combining
information in individual ratios about future earnings growth can yield more accurate forecasts of
future earnings. Ou and Penman use statistical procedures to reduce a large number of financial
86
ratios to a subset that is most effective in forecasting future earnings. In holdout samples, they
show that the forecasting model using the subset of the ratios outperforms time-series models of
annual earnings in terms of forecast accuracy and contemporaneous association with stock returns.
Several extensions of Ou and Penman’s earnings prediction research appear in the literature.
For example, the innovation in Lev and Thiagarajan (1993) and Abarbanell and Bushee (1997 and
1998) is that, unlike Ou and Penman (1989a and b), they use “a priori conceptual arguments to
study any of their” ratios (Abarbanell and Bushee, 1998, p. 22). They demonstrate that the earnings
prediction signals in variables like growth in accounts receivables relative to sales growth and gross
margin rate are incrementally associated with contemporaneous stock returns and are significantly
helpful in predicting future earnings.
Other ratio-based earnings prediction approaches typically seek to exploit the information in
prices about future earnings. For example, Penman (1996 and 1998) develops techniques that
combine the information in price-earnings ratios and price-to-book ratios that is superior to using
any one ratio to forecast future earnings or the return on equity. Presence of transitory earnings
contaminates price-earnings ratio as an indicator of growth. This weakness in price-earnings ratios
is in part remedied by also using the price-to-book ratio, which signals growth in book equity and
future returns on equity and because it is relatively unaffected by current transitory earnings.
Penman (1998) presents empirical evidence on the benefits of combining the information in price-
earnings and price-to-book ratios for earnings prediction. Specifically, using historical data,
Penman (1998) estimates optimal weights on price-earnings and price-to-book ratios to forecast
one- and three-year-ahead earnings. The evidence suggests moderate forecasting gains from
optimal weighting of information in the two ratios.
Another example of ratio-based earnings prediction research is Beaver and Ryan (2000).
They decompose “bias” and “lag” components of the price-to-book ratios to forecast future book
returns on equity. Bias in the book-to-market ratio arises when a firm uses conservative accounting
such that its book value of equity is expected to be persistently below the share price. Beaver and
Ryan define lag as the time it takes for book values to catch up with stock prices in reflecting a
given economic gain or loss. Consistent with economic intuition, Beaver and Ryan (2000) predict
an inverse relation between bias and future return on equity, i.e., high book-to-market ratio forecasts
low earnings growth. The horizon over which bias is helpful in predicting the return on equity
depends on lag or the speed with which book values adjust to reflect an economic gains and losses.

87
If the lag is short- lived, then the prediction horizon is also short. Evidence in Beaver and Ryan is
broadly consistent with their predictions.
A final example of ratio-based earnings prediction research is Penman and Zhang (2000).
They study the interaction of changes in growth and conservative accounting practices like
expensing of research and development and marketing costs. The interaction is helpful in
forecasting future earnings because extreme changes in growth are mean-reverting and the effect is
noticeable in the case of firms that are intensive in research and development and marketing or
LIFO inventory reserves etc. They predict and find that firms exhibiting extreme changes in
research and development and marketing expenditures and LIFO reserves exhibit a rebound in their
return on net assets. Penman and Zhang label this phenomenon as the predictive ability of earnings
quality.
Summary. The ratio-based earnings prediction literature focuses on the forecasting power
of financial ratios with respect to future earnings. Empirical evidence is generally consistent with
the ratios’ ability to predict earnings growth. These models, however, rarely outperform analysts’
forecasts of earnings, especially forecasts over long horizons. The primary interest in the ratio-
based forecasting models is the lure of above-normal investment returns from simple, cheaply
implementable models.
Return prediction. A large number of the ratio-based earnings prediction studies also
examine whether trading strategies that exploit information about earnings growth earn above-
normal rates of return. For example, Ou and Penman (1989a and b), Lev and Thiagarajan (1993),
Abarbanell and Bushee (1998), Piotroski (2000), and Penman and Zhang (2000) demonstrate that
the information in the earnings prediction signals is helpful in generating abnormal stock returns
(see the next section), which suggests market inefficiency with respect to financial statement
information.
4.4 Tests of market efficiency
Overview
In this section, I discuss the empirical literature in accounting on tests of market efficiency.
The review is deliberately narrowly focused on empirical issues. I do not examine market
efficiency topics like the definition of market efficiency and tests of mean reversion in aggregate
stock returns. These topics are important and essential for understanding the market efficiency
research in accounting, but are beyond the scope of my review. Fortunately, several excellent

88
surveys of the market efficiency literature exist. I encourage interested researchers to read Ball
(1978, 1992, and 1994), Fama (1970, 1991, and 1998), LeRoy (1989), MacKinlay (1997), and
Campbell, Lo, and MacKinlay (1997).
Market efficiency tests in the financial accounting literature fall into two categories: event
studies and cross-sectional tests of return predictability (see Fama, 1991). Event studies examine
security price performance either over a short window of few minutes to a few days (short-window
tests) or over a long horizon of one-to-five years (long horizon tests). Section 4.4.1 discusses the
attractive features as well as research design and data problems in drawing inferences about market
efficiency based on short- and long-window event studies. Section 4.4.2 surveys the empirical
literature on event studies. I review event studies from the post-earnings-announcement drift
literature in section 4.4.2.A, studies of market efficiency with respect to accounting methods and
method changes and functional fixation in section 4.4.2.B, and studies on long-horizon returns to
accrual management and analyst forecast optimism in section 4.4.2.C.
Cross-sectional tests of return predictability (or anomalies studies) examine whether the
cross-section of returns on portfolios formed periodically using a specific trading rule are consistent
with a model of expected returns like the CAPM. These are tests of the joint hypothesis of market
efficiency and the equilibrium expected rate of return model employed by the researcher. Section
4.4.3 reviews the literature on cross-sectional tests of return predictability. Section 4.4.3.A
summarizes results of tests of the market’s (mis)pricing of earnings yields and accounting accruals
and section 4.4.3.B discusses findings from tests of long-horizon returns to fundamental analysis.
4.4.1 Issues in drawing inferences from event studies
Event studies are tests of market efficiency. They test the impact, speed, and unbiasedness
of the market’s reaction to an event. In an efficient capital market, a security’s price reaction to an
event is expected to be immediate and subsequent price movement is expected to be unrelated to the
event-period reaction or its prior period return. The modern literature on event studies originates
with Fama et al. (1969) and Ball and Brown (1968), who examine security return behavior
surrounding stock splits and earnings announcements.74 Since then hundreds of event studies have
been conducted in the legal, financial economics, and accounting literatures. There are two types of
event studies: short-window event studies and long-horizon post-event performance studies. The
74 The first published event study is Dolley (1933). Like Fama et al. (1969), it examines the event-period price effects of stock splits.
89
inferential issues for the short-window event studies are straightforward, but they are quite
complicated for the long-horizon performance studies. I discuss the salient issues of each type of
study below.
Short-window event studies
Short-window event studies provide relatively clean tests of market efficiency, in particular
when sample firms experience an event that is not clustered in calendar time (e.g., earnings
announcement day returns or merger announcement day returns). The evidence from short-window
event studies is generally consistent with market efficiency. The evidence using intra-day, daily,
and weekly returns to wide-ranging events like earnings announcements, accounting irregularities,
mergers, and dividends suggests the market reacts quickly to information releases. In some cases,
the reaction appears incomplete and there is a drift, which contradicts market efficiency.
In a short-window test, researchers face few problems of misestimating the expected return
over the short event window (e.g., Brown and Warner, 1985). Expected market return per day is
about 0.05%, so the misestimation in a security’s return due to risk mismeasurement (e.g., Scholes
and Williams, 1977 and Dimson, 1979) in most cases is likely to be less than 0.01-0.02% per day. 75
This is small relative to an average abnormal return of 0.5% or more that is commonly reported in
event studies. 76
One concern in assessing the significance of the average market reaction in the event period
is that the event might induce an increase in return variability (e.g., Beaver, 1968, reports increased
return variability around earnings announcements). Tests that fail to account for the increased
return variability excessively reject the null hypothesis of zero average abnormal return (e.g.,
Christie, 1991, and Collins and Dent, 1984). Use of the cross-sectional standard deviation of event
period abnormal returns greatly mitigates the potential problem arising from an event-induced
increase in return variability.
Long-horizon event studies
A long-horizon event study tests whether one-to-five-year returns following an event are
systematically non-zero for a sample of firms. These studies assume that the market can overreact
75 An implicit assumption is that the event does not cause the sample securities’ beta risks to increase by an order of magnitude. See Ball and Kothari (1991) for stocks’ daily beta risk in event time over 21 days centered around earnings announcements and Brennan and Copeland (1988) for evidence on risk changes around stock split announcements. 76 The real danger of failing to reject the null hypothesis of no effect when it is false (i.e., a type II error) in a short-window event study stems from uncertainty about the event day (see Brown and Warner, 1985).

90
or underreact to new information and that it can take a long time to correct the misvaluation because
of continued apparently irrational behavior and frictions in the market. The source of underreaction
and overreaction is human judgment or behavioral biases in information processing. There is a
systematic component to the behavioral biases so that in the aggregate the pricing implications of
the biases do not cancel out, but manifest themselves in security prices deviating systematically
from those implied by the underlying fundamentals. Several recent studies model the price
implications of human behavioral biases to explain apparent long-horizon market inefficiency (e.g.,
Barberis, Shleifer, and Vishny, 1998, Daniel, Hirshleifer, and Subrahmanyam, 1998, Hong and
Stein, 1999, DeBondt and Thaler, 1995, and Shleifer and Vishny, 1997).
Recent evidence in the finance and accounting literature suggests huge apparent abnormal
returns spread over several years following well-publicized events like initial public offerings,
seasoned equity issues, and analysts’ long-term forecasts. Collectively this research poses a
formidable challenge to the efficient markets hypothesis. However, before we conclude that
markets are grossly inefficient, it is important to recognize that long-horizon event studies suffer
from at least three problems: risk misestimation, data problems, and the lack of a theory of market
inefficiency as the null hypothesis. For an in-depth discussion of conceptual and empirical
problems in drawing inferences from long-horizon tests of market efficiency, see Barber and Lyon
(1997), Kothari and Warner (1997), Fama (1998), Lyon, Barber, and Tsai (1999), and Loughran and
Ritter (2000).
Risk measurement and risk factors. Misestimation of risk can produce economically and
statistically significant magnitudes of apparent abnormal returns because the post-event return
measurement period is long. Risk misestimation can arise because sensitivity to a risk factor is
measured incorrectly or because a relevant risk factor is omitted from the model of expected
returns. Random errors in estimating stocks’ risks are not a serious problem because almost all the
studies examine performance at a portfolio level.77 Risk misestimation is a problem, however, if the
misestimation is correlated across the stocks in a portfolio. This scenario is plausible because of the
endogenous nature of economic events, i.e., the subset of firms experiencing an economic event is
not random with respect to the population of firms. Typically unusual performance precedes an
event and risk changes are associated with past performance (e.g., French, Schwert, and Stambaugh,
77 Random errors in risk estimation and thus in abnormal return estimation can be a serious problem if the researcher correlates estimated abnormal returns with firm-specific variables like financial data and proxies for trading frictions. The random error weakens the correlation and thus the test’s power.
91
1987, Chan, 1988, Ball and Kothari, 1989, Ball, Kothari, and Watts, 1993, and Ball, Kothari, and
Shanken, 1995).
With regards to potential bias in estimated abnormal performance because of omitted risk
factors, the finance literature has not quite settled on the risk factors priced in stock valuations as
well as the the measurement of the risk factors. Thus, for potential reasons of both risk
mismeasurement and omitted risk factors, misestimation of securities’ expected returns in a long-
horizon event study is a serious concern. Stated differently, discriminating between market
inefficiency and a bad model of expected returns is difficult in long-horizon event studies.
Data problems. A variety of data problems afflict long-horizon event studies and make it
difficult to draw definitive inferences about market efficiency. (i) Survivor and data-snooping
biases can be serious in long-horizon performance studie s, especially when both stock-price and
financial accounting data are used in the tests, as is common in many long-horizon market
efficiency tests in accounting (see Lo and MacKinlay, 1990, Kothari, Shanken, and Sloan, 1995,
and Kothari, Sabino, and Zach, 1999). Since many studies analyze financial and return data for the
surviving subset of the sample firms, inferential problems arise due to potential survivor biases in
the data. It is not uncommon to observe 50% or more of the initial sample of firms fa iling to
survive the long horizon examined in the study.
(ii) Problems of statistical inferences arise in long-horizon performance studies. Sample
firms’ long-horizon returns tend to be cross-correlated even if the event is not perfectly clustered in
calendar time (Bernard, 1987, and Brav, 1999). Long-horizon return data are highly right skewed,
which poses problems in using statistical tests that assume normality (see Barber and Lyon, 1997,
Kothari and Warner, 1997, and Brav, 1999). Because of the statistical properties of return data, the
literature raises questions whether the appropriate return measure is buy-and-hold returns or
monthly returns cumulated over a long period (see Roll, 1983, Blume and Stambaugh, 1983,
Conrad and Kaul, 1993, Fama, 1998, and Mitchell and Stafford, 1999). Loughran and Ritter (2000)
discuss additional inference problems that arise because the timing of events is endogenous. For
example, we witness IPO waves either because there are periods of good investment opportunitie s
and/or because issuers believe the market is overvalued. As a result, it is possible that misvalued
event firms contaminate the benchmark portfolios (e.g., market, size, and book-to-market
portfolios) and inferences from market efficiency tests are flawed.

92
(iii) Skewness of financial variables (returns and or earnings) coupled with non-randomness
in data availability and survivor biases can produce apparent abnormal performance and a spurious
association between ex ante information variables like analysts’ growth forecasts and ex post long-
horizon price performance (see Kothari, Sabino, and Zach, 2000). As noted above, in long-horizon
studies, it is not uncommon to encounter data availability for less than 50% of the initial sample
either because post-event financial data are unavailable or because firms do not survive the post-
event long horizon. If this decline in sample size is not random with respect to the original
population of firms experiencing an event, then inferences based on the sample examined by a
researcher can be erroneous. Kothari, Sabino, and Zach (2000) present evidence to suggest both
skewness in financial data and non-random survival rates in samples drawn from CRSP, Compustat,
and IBES databases.
Long-horizon market inefficiency studies generally report larger magnitudes of abnormal
returns for subsets of firms. These subsets of firms often consist of small market capitalization
stocks, stocks that trade at low prices with relatively large proportionate bid-ask spreads, stocks that
are not traded frequently (i.e., illiquid stocks), and stocks that are not closely followed by analysts
and other information intermediaries in the market (Bhushan, 1994). The pronounced indication of
market inefficiency among stocks with high trading frictions and less information in the market is
interpreted as prices being set as if the market naïvely relies on biased analyst forecasts. While this
is possible, there is at least one alternative explanation. The data problems discussed above are
likely more prevalent in samples where we observe the greatest degree of apparent inefficiency.
Careful attention to data problems will help discriminate between competing explanations for
evidence that currently is interpreted as market inefficiency.
A theory of market inefficiency and specification of the null hypothesis
In addition to potential risk measurement and data problems discussed above, there is
another challenge in drawing definitive conclusions about market efficiency. While much of the
research concludes market inefficiency, further progress will be made if researchers develop a
theory that predicts a particular return behavior and based on that theory design tests that specify
market inefficiency as the null hypothesis. Researchers should then design powerful tests that fail
to reject that null hypothesis. An excellent example of such research is Bernard and Thomas
(1990), who specify stock-price behavior under a naïve earnings expectation model as well as a
sophisticated earnings expectation model. However, there is still a need for a well-developed
93
theory of naïve investor behavior that can be subjected to empirical testing in other contexts or a
theory that would be helpful in explaining observed return behavior in contexts such as those
discussed below.
Currently the null of market efficiency is rejected regardless of whether positive or negative
abnormal return (i.e., under- or over-reaction) is observed. A theory of market inefficiency should
specify conditions under which market under- and over-reaction is forecasted. For example, why
does the market overreact to accruals in annual earnings (as in Sloan, 1996), but under-react to
quarterly earnings information as seen from the post-earnings announcement drift? What
determines the timing of abnormal returns in the long-horizon studies? For example, why does
Frankel and Lee’s (1998, table 8 and figure 2) fundamental valuation strategy, which is designed to
exploit mispricing, produce relatively small abnormal returns in the first 18 months, but large
returns in the following 18 months? Sloan (1996, table 6) finds that more than half of the three-year
hedge portfolio return (i.e., lowest minus the highest accrual decile portfolio) return is earned in the
first year and a little less than one-sixth of the three-year return is earned in the third year of the
investment strategy.
Some have priors that the inefficiency would be corrected quickly, whereas others argue it
can take a long time. For example, Thomas (1999, p. 19) in his analysis of the market’s ability to
process information about the persistence of the foreign component of earnings, states: “… I
proceed under the assumption that mispricing is more likely to cause only a short-term relation with
abnormal returns while unidentified risk is more likely to cause a short- and long-term relation with
abnormal returns.” If transaction costs, institutional holdings, and other related characteristics are
an impediment to speedy absorption of information in stock prices, then long-horizon studies should
test whether there is a positive relation between the horizon over which abnormal returns are earned
and proxies for the information environment. If large stocks earn abnormal returns for several
years, I would interpret that as damaging to the market inefficiency hypothesis.
Another important reason for the demand for a theory of market inefficiency is to
understand what might cause markets to be inefficient (i.e., why might prices deviate systematically
from economic fundamentals?). Several empirical studies document that intrinsic values estimated
using the residual income model predict future returns (see Lee, 1999, and discussion below for
summaries). However, the residual income model or the dividend discount model provide little
guidance in terms of why we should expect to predict future returns using estimated intrinsic values.

94
Such a prediction requires a theory for why and where prices would deviate systematically from
intrinsic values so the theory can be tested empirically.78 The theory would either use investors’
behavioral biases or trading frictions to predict deviations of security prices from their intrinsic
values. Accounting researchers’ efforts on fundamental analysis and tests of market efficiency
would be more fruitful if some energy is channeled into the development and tests of theories of
inefficiency.
Summary
Long-horizon performance studies and tests of market efficiency are fraught with
methodological problems. The problems in data bases, potential danger of researchers engaging in
data snooping, non-normal statistical properties of data, and research design issues collectively
weaken our confidence in the conclusion that markets are grossly inefficient in processing
information in news events quickly and unbiasedly. I foresee considerable research that attempts to
overcome the problems faced in long-horizon tests so that we can draw more definitive conclusions
about market efficiency. Capital markets researchers in accounting should exploit their knowledge
of institutional details and financial data and design more creative long-horizon tests of market
efficiency. However, the challenges in designing better tests also underscore the need for a
sophisticated training in cutting-edge research in finance and econometrics.
4.4.2 Evidence from event studies
Short-window tests.
Like the evidence in the financial economics literature, most of the evidence from short-
window event studies in the capital markets literature in accounting is consistent with market
efficiency. However, some evidence suggests market inefficiency. This is discussed in the context
of post-earnings-announcement drift and functional fixation.
Evidence suggests the market’s reaction to news events is immediate and unbiased.
Consider the market’s reaction to earnings announcements as reported in two illustrative studies:
Lee (1992) and Landsman and Maydew (1999). Lee (1992) uses intra-day return and trading
volume data. He observes a statistically significant price reaction of the same sign as the earnings
surprise. The reaction occurs within 30 minutes of the earnings announcement, with no statistically
78 The parallels here are Jensen and Meckling’s (1976) agency theory to explain deviations from the Modigliani and Miller (1958) and Miller and Modigliani (1961) no-effects predictions for corporate finance in frictionless markets, and Watts and Zimmerman’s (1978) contracting and political cost hypotheses to explain firms’ preference among alternative accounting methods in informationally efficient capital markets.
95
discernible price effect thereafter. Investors’ trading volume reaction reported in Lee (1992) is also
short lived: less than two hours for large trades and a few hours for small trades. Landsman and
Maydew (1999) analyze the market’s reactions to earnings announcements over three decades.
They too find that the stock return volatility and trading volume are significantly greater on earnings
announcement days, but the activity reverts to normal conditions immediately thereafter.
The above findings reinforce previous evidence in Beaver (1968) and May (1971) using
weekly price and trading volume data around annual and quarterly earnings announcement dates
and Patell and Wolfson’s (1984) intraday return analysis around earnings announcements. Other
research offers a variety of refinements to suggest that the market predictably discriminates between
different types of news announcements and the information content of those announcements. For
example, several studies report an inverse relation between the information content (i.e., price and
trading volume reaction) of earnings announcements and transaction costs and pre-disclosure (or
interim) information (see Grant, 1980, Atiase, 1985 and 1987, Bamber, 1987, Shores, 1990, Lee,
1992, and Landsman and Maydew, 1999). Others examine the effects of audit quality, seasonality,
accrual errors in first three quarters versus the fourth quarter, transitory earnings, etc. on the stock
price reaction to earnings announcements (e.g., Teoh and Wong, 1993, Salamon and Stober, 1994,
and Freeman and Tse, 1992) and find evidence generally consistent with rationality in the cross-
sectional variation in the market’s response.
Long-horizon tests
There has been a surge of research on long-horizon tests of market efficiency in recent
years. Collectively this research reports economically large abnormal returns following many
events. As noted earlier, there are methodological questions about this evidence. I review the
evidence of long-horizon abnormal performance following earnings announcements, accrual
management, analysts’ forecast optimism, and accounting method changes.
4.4.2.A Post-earnings-announcement drift
Post-earnings-announcement drift is the predictability of abnormal returns following
earnings announcements. Since the drift is of the same sign as the earnings change, it suggests the
market under-reacts to information in earnings announcements. Ball and Brown (1968) first
observe the drift. It has been more precisely documented in many subsequent studies.79 The drift
79 See Jones and Litzenberger (1970), Brown and Kennelly (1972), Joy, Litzenberger, and McEnally (1977), Watts (1978), Foster, Olsen, and Shevlin (1984), Rendleman, Jones, and Latane (1987), Bernard and Thomas (1989, 1990),
96
lasts up to a year and the magnitude is both statistically and economically significant for the
extreme good and bad earnings news portfolios. A disproportionate fraction of the drift is
concentrated in the three-day periods surrounding future quarterly earnings announcements, as
opposed to exhibiting a gradually drifting abnormal return behavior. Because of this characteristic
and because almost all of the drift appears within one year, I characterize the drift as a short-
window phenomenon, rather than a long-horizon performance anomaly. The profession has
subjected the drift anomaly to a battery of tests, but a rational, economic explanation for the drift
remains elusive.
The property of the drift that is most damaging to the efficient market hypothesis is
documented in detail in Rendleman, Jones, and Latane (1987), Freeman and Tse (1989), and
Bernard and Thomas (1989, 1990). Collectively, these studies show that the post-earnings-
announcement abnormal returns are consistent with the market acting as if quarterly earnings follow
a seasonal random walk process, whereas the true earnings process is more complicated. In
particular, the true process might be more accurately described as a seasonally differenced first
order auto-regressive process with a seasonal moving-average term to reflect the seasonal negative
autocorrelation (Brown and Rozeff, 1979). A large fraction of the drift occurs on subsequent
earnings announcement dates and the drift consistently has the predicted sign for the extreme
earnings portfolios. These properties diminish the likelihood of an efficient markets explanation for
the drift.
Numerous studies seek to refine our understanding of the drift. Ball and Bartov (1996)
show that the market is not entirely naïve in recognizing the time-series properties of quarterly
earnings. However, their evidence suggests the market underestimates the parameters of the true
process. So, there is predictability of stock performance at subsequent earnings announcement
dates. Burgstahler, Jiambalvo, and Shevlin (1999) extend the Ball and Bartov (1996) result by
examining the market’s reaction to specia l items in earnings. Their results also suggest the market
only partially reflects the transitory nature of special items. Soffer and Lys (1999) dispute Ball and
Bartov’s (1996) results. Using a two-stage process to infer infer investors’ earnings expectations,
Soffer and Lys (1999, p. 323) “are unable to reject the null hypothesis that investors’ earnings
expectations do not reflect any of the implications of prior earnings for future earnings.”
Freeman and Tse (1989), Mendenhall (1991), Wiggins (1991), Bartov (1992), Bhushan (1994), Ball and Bartov (1996), and Bartov, Radhakrishnan, and Krinsky (1999), among others.
97
Abarbanell and Bernard (1992) conclude that the market’s failure to accurately process the time-
series properties of earnings is due in part to dependence in analysts’ forecast errors (also see Lys
and Sohn, 1990, Klein, 1990, Abarbanell, 1991, Mendenhall, 1991, and Ali, Klein, and Rosenfeld,
1991).
Research attempting to understand whether the market’s earnings expectations are naïve has
used security prices to infer the expectations. While this approach has many desirable properties,
Thomas (1999) warns of the danger of incorrect inferences and Brown (1999) proposes an
alternative approach examining whether the time-series properties of analysts’ forecasts exhibit the
naïve property. If not, then the search for alternative explanations for the observed security return
behavior gains credibility.
Bhushan (1994) shows that the magnitude of the drift is positively correlated with the degree
of trading frictions, which makes commercial attempts to exploit the drift economically less
attractive. Bartov, Radhakrishnan, and Krinsky (1999) examine whether the magnitude of the drift
is decreasing in investor sophistication, as proxied for by the extent of institutional ownership in a
stock (see Hand, 1990, Utama and Cready, 1997, Walther, 1997, and El-Gazzar, 1998). Brown and
Han (2000) examine predictability of returns for the subset of firms whose earnings exhibit first-
order auto-regressive property, which is far less complex that the Brown and Rozeff (1979) model.
They conclude that the market fails to recognize the autoregressive earnings property only for firms
that have relatively less pre-disclosure information (i.e., small firms with relatively unsophisticated
investors). Even in these cases, they find the drift is asymmetric in that the drift is observed for
large positive, but not negative, earnings surprises.80
Attempts to explain the drift on the basis of transaction costs and investor sophistication, in
my opinion, are not entirely satisfying. Since a non-trivial fraction of the drift shows up on one-to-
three-quarters-ahead earnings announcement days, there is a substantial opportunity for a number of
market participants to exploit the mispricing, at least in the case of stocks experiencing good
earnings news. Many of these market participants likely engage in trades in similar stocks for other
reasons, so the marginal transaction costs to exploit the drift are expected to be small. Risk
mismeasurement is also unlikely to explain the drift because the drift is observed in almost every
quarter and because it is concentrated in a few days around earnings announcements.
80 Since Brown and Han (2000) focus on a relatively small fraction (20%) of the population of firms, their tests might have lower power.

98
Another stream of research in the accounting and finance literature examines whether the
post-earnings announcement drift (or the earnings-to-price effect) is incremental to or subsumed by
other anomalies (see Fama and French, 1996, Bernard, Thomas, and Wahlen, 1996, Chan,
Jegadeesh, and Lakonishok, 1996, Raedy, 1998, and Kraft, 1999, and discussion in section 4.4.3).
The anomalies examined include the size, book-to-market, earnings-to-price, momentum, industry,
trading volume, long-term contrarian investment strategy, past sales growth, and fundamental
analysis effects, and combinations of these effects.81 Kraft (1999) concludes that other anomalies or
the Fama-French three-factor model (see Fama and French, 1993) do not subsume the drift, whereas
evidence in Fama and French (1996) suggests that their three-factor model explains the earnings-to-
price effect.
Summary. The post-earnings announcement drift anomaly poses a serious challenge to the
efficient markets hypothesis. It has survived a battery of tests in Bernard and Thomas (1989 and
1990) and many other attempts to explain it away. It appears to be incremental to a long list of
anomalies that are inconsistent with the joint hypothesis of market efficiency and an equilibrium
asset-pricing model. The survival of the anomaly 30 years after it was first discovered leads me to
believe that there is a rational explanation for it, but evidence consistent with rationality remains
elusive.
4.4.2.B Accounting methods, method changes and functional fixation
Research design issues
Capital markets research has long examined whether the stock market is efficient with
respect to cross-sectional differences in firms’ use of accounting methods and to changes in
accounting methods. Since most accounting method choices do not in themselves create a cash
flow effect, tests of market efficiency with respect to accounting methods have been an easy target.
However, this has proved to be one of the more difficult topics. Firms’ choice of accounting
methods and their decisions to change methods are not exogenous. Cross-sectional differences in
firms’ accounting method choice potentially reflect underlying economic differences (e.g.,
differences in investment-financing decisions, growth opportunities, debt and compensation
81 The following studies report evidence on the anomalies. Banz (1981) on the size effect; Basu (1977 and 1983) on the earnings-to-price effect; Rosenberg, Reid, and Lanstein (1985) and Fama and French (1992) on the book-to-market effect; Lakonishok, Shleifer, and Vishny (1994) on the sales growth (or value-versus-glamour) and cash-flow-to-price effects; DeBondt and Thaler (1985, 1987) on the long-term contrarian effect; Jegadeesh and Titman (1993) and Rouwenhorst (1998) on the short-term momentum effect; Moskowitz and Grinblatt (1999) on the industry-factor effects to explain the momentum effect; Lee and Swaminathan (1999) on the momentum and trading volume effects; and Lev and Thiagarajan (1993) and Abarbanell and Bushee (1997 and 1998) on the fundamental analysis effect.

99
contracts, etc., see Watts and Zimmerman, 1986, and 1990). The economic differences contribute
to variations in the expected rates of return and price-earnings multiples. Therefore, an assessment
of the pricing of accounting effects is clouded by the effect of underlying economic differences
among the firms.
Accounting method change events also have their pros and cons in testing market efficiency.
Managers’ decisions to change accounting methods typically follow unusual economic performance
and accounting method changes might be associated with changes in the firms’ investment and
financing decisions. For example, Ball (1972), Sunder (1975), and Brown (1980) find that the
average earnings and stock-return performance of firms switching to income-decreasing LIFO
inventory method is above normal in the period leading up to the inventory accounting method
change. Since changes in economic performance and changes in investment and financing
decisions are generally associated with changes in expected rates of return, accurate assessment of
long-horizon risk-adjusted performance following accounting method changes is tricky. Another
practical problem with an event study approach to accounting method changes is that many firms do
not publicly announce the accounting method change, so there can be considerable uncertainty
associated with the date the market learns about the method change.82
Another problem is that surprise announcements of accounting method changes themselves
often convey information that causes market participants to reassess firm value.83 For example, the
market frequently greets firms’ announcements of changes in capitalization and revenue recognition
policies with large price swings (e.g., on March 18, 1992, Chambers Development Co. experiences
a –63% stock price reaction to its announcement that it would expense instead of capitalize
development costs, see Revsine, Collins, Johnson, 1999, pp. 19-23). Some academics and the
financial press interpret the reaction as the market’s fixation on reported accounting numbers
because the accounting method change in itself did not affect the firm’s cash flow for the
accounting period. The reasoning is only partially right in that the accounting method change might
easily have influenced the market’s expectation of future cash flows. Thus, in order to interpret the
market’s reaction to accounting method changes as consistent with market efficiency, one must
82 With increasing pressure on firms to publicly disclose accounting events like method changes and the decreasing costs of electronically searching for the information, it is easier in today’s environment to precisely identify the announcement date of an accounting method change. 83 See the literature on signaling and voluntary disclosure.
100
model changes in cash flow expectations concurrent with the accounting method change and other
cash flow effects arising from contracting, tax, and/or regulatory considerations.
Evidence: Accounting method differences
A large body of literature examines whether the market is mechanically fixated on reported
earnings. The conclusion that emerges from this literature is that broadly speaking the market
rationally discriminates between non-cash earnings effects arising from the use of different
accounting methods. However, an unresolved and contentious question is whether there is a modest
degree of inefficiency. I believe the evidence is fairly strong that managerial behavior is consistent
with the market behaving as if it is functionally fixated on reported accounting numbers, but that the
security price behavior itself is at worst only modestly consistent with functional fixation.
Beaver and Dukes (1973) is probably the first study to examine whether the stock market
rationally recognizes the non-cash effects of accounting methods on reported earnings in setting
security prices. They compare the price-earnings ratios of firms using accelerated and straight- line
depreciation methods. Consistent with market efficiency, they find that accelerated depreciation
firms’ price-earnings ratios exceed those of straight- line depreciation method firm. Moreover, the
difference more or less disappears once the straight- line depreciation method firms’ earnings are
restated to those obtained under the accelerated depreciation method. Additional analysis also
reveals that the accelerated and straight-line depreciation samples of firms did not exhibit
statistically or economically significant differences in systematic risk or earnings growth (see
Beaver and Dukes, 1973, table 2).
Many other studies examine market efficiency with respect to accounting method
differences. Lee (1988) and Dhaliwal, Guenther, and Trombley (1997) examine differences in
price-earnings ratios between LIFO and non-LIFO firms. Dukes (1976) shows that the market
values research and development costs as an asset even though they are expensed for reporting
purposes (also see Lev and Sougiannis, 1996, and Aboody and Lev, 1998). Evidence also suggests
the market began to reflect pension liabilities even before they appeared on financial statements
(Dhaliwal, 1986) and a firm’s risk reflects the debt equivalence of operating leases (see Lipe, 2000,
section II.3.2 for a summary of evidence).
While there is considerable evidence consistent with market efficiency, some discordant
notes coexist. Vincent (1997) and Jennings, Robinson, Thompson, and Duvall (1996) examine
stock prices of firms using the purchase and pooling-of- interests accounting methods for mergers

101
and acquisitions. They find that firms using the purchase accounting method are disadvantaged.
The authors compare the price-earnings ratios of the firms using the pooling method to those using
the purchase method. For this comparison, they restate earnings numbers of the pooling method
firms as if these firms used the purchase accounting method. They find that the price-earnings
ratios of the pooling method firms are higher than the purchase accounting method users.
The Vincent (1997) and Jennings et al. (1996) evidence is consistent with the conventional
wisdom among investment bankers that Wall Street rewards reported earnings and thus prefers
pooling-of- interests earnings. Regardless of whether the conventional wisdom is valid in terms of
security price behavior, it appears to have a real effect on the pricing of acquisitions accounted for
using the pooling or purchase method. Nathan (1988), Robinson and Shane (1990), and Ayers,
Lefanowicz, and Robinson (1999) all report that bidders pay a premium for a transaction to be
accounted for as pooling of interests. Lys and Vincent (1995) in their case study of AT&T’s
acquisition of NCR, conclude that AT&T spent about $50 to possibly as much as $500 million to
account for the acquisition using the pooling method.
To complement the analysis of pricing and premium magnitudes in pooling and purchase
accounting, researchers also examine long-horizon returns following merger events accounted for
using the pooling and purchase methods. Hong, Kaplan and Mandelker (1978) and Davis (1990)
are early studies of acquirers’ post-merger abnormal returns. They examine whether abnormal
returns to acquirers using the purchase method are negative, consistent with the market reacting
negatively to goodwill amortization after the merger. Neither study finds evidence of the market’s
fixation on reported earnings.
Rau and Vermaelen (1998) and Andrade (1999) reexamine post-merger performance of
pooling and purchase method users employing state-of-the-art techniques to estimate long-horizon
abnormal returns and using larger samples of mergers from recent decades. They reach somewhat
opposite conclusions. Rau and Vermaelen (1998) compare the post-merger returns of a third of the
acquirers reporting the largest earnings impact of merger accounting against the middle and lowest
third of the acquirers ranked according to the merger earnings impact. The post-merger one-, two-,
or three-year returns for the three samples are not statistically different from zero or different from
each other. Andrade (1999) also examines the post-merger performance, but uses regression
analysis with controls for a large number of confounding variables. He finds a positive and
statistically significant 18-month abnormal return effect attributable to the merger-accounting

102
impact on earnings. However, the effect is “one order of magnitude sma ller than implied by
practitioners’ views” (Andrade, 1999, abstract). He therefore concludes that “it makes little sense
for managers to expend time, effort, and resources in structuring the deal so as to improve its impact
on reported EPS” (Andrade, 1999, p. 35).
Andrade (1999) also analyzes merger announcement-period returns to test whether the
market reaction is increasing in the merger-accounting-earnings effect. He observes a statistically
significant, but economically small positive impact of merger accounting earnings. This is weakly
consistent with functional fixation. Hand (1990) advances an “extended” version of the functional
fixation hypothesis. It argues that the likelihood that the market is functionally fixated is decreasing
in investor sophistication. Hand (1990) and Andrade (1999) find evidence consistent with extended
functional fixation in different types of accounting event studies.84 This is similar to the negative
relation between the magnitude of post-earnings-announcement drift and investor sophistication
discussed earlier in this section.
Summary. Differences in accounting methods (e.g., purchase versus pooling accounting for
mergers and acquisitions) can produce large differences in reported financial statement numbers
without any difference in the firm’s cash flows. We do not observe systematic, large differences in
the prices of firms employing different accounting methods. This rules out noticeable magnitudes
of market fixation on reported financial statement numbers. There is some evidence, however, to
suggest that over long horizons differences in accounting methods produce measurable differences
in risk-adjusted stock returns. Whether these abnormal returns suggest a modest degree of market
in efficiency or they are a manifestation of the problems in accurately measuring long-horizon price
performance is unresolved.
Accounting method changes
Accounting method changes are distinct from accounting method differences in that method
changes are the consequence of a deliberate action to change a method at a point in time and are
thus amenable to an event study centered on the event of accounting method change. In contrast,
accounting method differences between firms can persist indefinitely so long as firms continue with
their respective accounting methods. Thus, there is no accounting event and therefore samples of
firms with accounting method differences are typically not amenable to an event study.
84 See Ball and Kothari (1991) for theory and evidence that calls into question the extended functional fixation hypothesis.

103
Some of the earliest capital markets research analyzes accounting method changes as a
means of testing market efficiency (see, for example, Ball, 1972, Kaplan and Roll, 1972, Archibald,
1972, and Sunder, 1973 and 1975). Collectively this research examines security returns at the time
of and surrounding accounting method changes. Conclusions from this research are that the
announcement effects of accounting method changes are generally small and the long-horizon
performance of firms making accounting method changes is inconclusive with respect to the
efficient markets hypothesis. The lack of conclusive results is because of cash flow effects of some
method changes (e.g., switch to and from LIFO inventory method) and the endogenous and
voluntary nature of accounting method changes. Therefore, there are information effects and
potential changes in the determinants of expected returns associated with the method changes. In
addition, much progress has been made in estimating the long-horizon performance in an event
study (see Barber and Lyon, 1997, Kothari and Warner, 1997, and Barber, Lyon, and Tsai, 1999).
Many studies examine the stock-price effects of accounting method changes. Studies on
firms’ switch to and from LIFO inventory method are particularly popular. See, for example, Ricks
(1982), Biddle and Lindahl (1982), Hand (1993 and 1995). Evidence from these studies remains
mixed. However, with the exception of Dharan and Lev (1993), a study that carefully re-examines
long-horizon stock-price performance around accounting method changes using state-of-the-art
long-horizon performance measurement techniques is sorely missing from the literature. Such a
study would be timely in part because the long-horizon market inefficiency hypothesis has acquired
currency in academic as well as practitioner circles.
4.4.2.C Long-horizon returns to accrual management and analyst forecast optimism
The logic
Several studies examine long-horizon stock market efficiency with respect to accrual
management and analysts’ optimistic earnings growth forecasts. The crux of the argument is that
information from firms’ owners and/or managers and financial analysts about firms’ prospects (e.g.,
earnings growth) reflects their optimism and that the market behaves naively in that it takes the
optimistic forecasts at face value.
Firms’ owners and managers and financial analysts have an incentive to issue optimistic
forecasts.85 Owners and managers issuing new equity can reap benefits if the issue price is inflated.
85 Managers’ incentives are assumed to be aligned with owners’ incentives. In an IPO, this assumption is descriptive because managers are often also major owners and/or managers have substantial equity positions typically in the form of stock options.

104
Owners and managers are hypothesized to attempt to inflate the price of initial public offerings or
seasoned equity offerings by influencing the market’s expectations of future earnings. Toward this
end, they manipulate upward reported earnings through discretionary accounting accruals.
Financial analysts’ incentive to issue optimistic forecasts stems from the fact that the
investment banking firms they work for derive benefits from investment banking and brokerage
business of the client firms. Optimistic forecasts potentially generate greater business from the
clients. In addition, optimistic forecasts might induce client managements to share private
information with the financial analysts.
The cost of accrual management and optimistic forecasts is a loss of credibility and
reputation for accuracy in the event that accrual management and forecast optimism are detected.
In addition, there is the potential danger of facing lawsuits and civil and criminal penalties for fraud
in the event of an eventual decline in share prices when future earnings realizations suggest forecast
optimism. Owners, managers, and financial analysts must trade off the potential benefits against the
costs. The benefits from accrual manipulation and analysts’ optimism obviously depend in part on
the success in inflating security prices. The market’s failure to recognize the optimistic bias in
accruals and analysts’ forecasts requires a theory of market inefficiency that is still being developed
and tested in the literature. There are at least three reasons for systematic mispricing of stocks
resulting from the market’s naïve reliance on optimistic information. They are the presence of
frictions and transaction costs of trading, limits on market participants’ ability to arbitrage away
mispricing, and behavioral biases that are correlated among market participants (e.g., herd
behavior). Capital markets research testing market efficiency primarily examines whether there is
evidence of accrual manipulation and forecast optimism and whether securities are systematically
mispriced. The literature in accounting is yet to develop theories of market inefficiency, which
have begun to appear in the finance and economics journals.
Evidence
Several studies present challenging evidence to suggest that discretionary accruals in periods
immediately prior to initial public offerings and seasoned equity offerings are positive.86 Evidence
in these studies also suggests the market fails to recognize the earnings manipulation, which is
inferred on the basis of predictable subsequent negative long-horizon price performance. Negative,
86 See Teoh, Welch, and Wong, 1998a and b, Teoh and Wong, 1999, Teoh, Wong, and Rao, 1998, and Rangan, 1998.

105
statistically significant cross-sectional association between ex ante estimated accrual manipulation
and stocks’ ex post price performance exists, which violates market efficiency.
A well-developed literature examines whether analysts’ forecasts are optimistic at the time
of initial or seasoned equity offerings. Hansen and Sarin (1996), Ali (1996), and Lin and
McNichols (1998a) fail to find optimism in short-term analysts’ forecasts around equity offerings.
Lin and McNichols (1998a) and Dechow, Hutton, and Sloan (2000) hypothesize that analysts’ long-
term forecasts might be optimistic because the market places less emphasis on the accuracy of long-
term forecasts and long-term forecasts are more relevant for valuation than short-term forecasts.
The Lin and McNichols (1998a) and Dechow et al. (2000) evidence on long-term forecast optimism
is conflicting: Lin and McNichols report negligible optimistic bias (lead analysts forecast 21.29%
growth versus unaffiliated analysts forecast 20.73% growth, table 2, p. 113), whereas the Dechow et
al. evidence suggests a large bias (affiliated analysts 23.3% versus unaffiliated analysts 16.5%, table
2, p. 16). Dechow et al. argue that stocks’ long-horizon negative performance following seasoned
equity offerings is due to the market’s naïve fixation on analysts’ optimistic long-term earnings
growth forecasts. They show that the bias in analysts’ long-term growth forecasts is increasing in
the growth forecast, and post-equity-offer performance is negatively related to the growth rate at the
time of the equity offers. Unlike Dechow et al., Lin and McNichols (1998a) do not find a difference
in future returns.
Research also examines whether analysts affiliated with the investment-banking firm
providing client services are more optimistic in their earnings forecasts and stock recommendations
than unaffiliated analysts’ forecasts. Rajan and Servaes (1997), Lin and McNichols (1998a), and
Dechow, Hutton, and Sloan (2000) all report that affiliated analysts issue more optimistic growth
forecasts than unaffiliated analysts. Similarly, Michaely and Womack (1999) and Lin and
McNichols (1998a and 1998b) find that affiliated analysts’ stock recommendations are more
favorable than unaffiliated analysts’ recommendations.
Assessment of the evidence
The body of evidence in this area challenges market efficiency. However, there are several
research design issues that are worth addressing in future research. Many of these are discussed
elsewhere in the review. First, as discussed in the context of discretionary accrual models (section
4.1.4), estimation of discretionary accruals for non-random samples of firms like IPO firms and
seasoned equity offering firms is problematic. Long horizons further complicate the tests. In

106
addition, the evidence in Collins and Hribar (2000b) that previous findings of accrual manipulation
in seasoned equity offering firms using the balance sheet method might be spurious is damaging to
the market inefficiency hypothesis not only because of problems in estimating discretionary
accruals but also for the following logical reason. Consider the evidence in Teoh, Welch, and
Wong (1998a) that estimated discretionary accruals of seasoned equity offering firms are negatively
correlated with subsequent returns. Collins and Hribar (2000b) show that the estimated
discretionary accruals are biased (i.e., accrual manipulation result is spurious) and that the bias is
correlated with the seasoned equity offering firms’ merger and acquisition activity. This means
subsequent abnormal returns are unrelated to management’s discretionary accruals, and instead
appear to be correlated with firms’ merger and acquisition activity. Thus, either the market is
fixated on discretionary accruals or the market commits systematic errors in processing the
valuation implications of merger and acquisition activity. As always, the possibility of some other
phenomenon driving the return behavior following seasoned equity offerings exists.
Second, the association between ex ante growth forecasts or other variables and ex post
performance variables might be spuriously strengthened because of survivor biases and data
truncation (see Kothari, Sabino, and Zach, 1999, and discussion earlier in this section).
Third, long-horizon performance measurement is problematic. Techniques that recognize
long-horizon issues should be used to estimate abnormal performance (e.g., the Carhart, 1997, four-
factor model or the Fama and French, 1993, three-factor model, or the Daniel, Grinblatt, Titman,
and Wermers, 1999, characteristic-based approach). Some argue that the three- and four-factor
models in the finance literature are empirically motivated and lack a utility-based theoretical
foundation. More importantly, these models might over-correct for the systematic component in
stock returns in that returns to factors like book-to-market might indicate systematic mispricing, i.e.,
market inefficiency (see, e.g., Dechow et al., 2000). Even if empirically motivated factors were to
merely capture systematic mispricing (rather than represent compensation for risk), it is important
to control for these factors in estimating abnormal returns. The reason is straightforward.
Researchers typically test whether a treatment variable or an event generates abnormal performance.
If similar performance is also produced by another variable, like firm size to book to market, then it
becomes less plausible that the observed performance is attributable to the treatment variable or the
event. Abnormal performance can be realized by simply investing in potentially many stocks of

107
similar characteristics regardless of whether or not they experience the event studied by the
researcher.
Finally, classification of affiliated and unaffiliated analysts is not exogenous. As discussed
in the section on the properties of analysts’ forecasts, it is possible that firms choose those
investment bankers whose analysts are (genuinely) most optimistic (i.e., give the highest forecasts)
from among all the analysts.87 So, we expect the affiliated analysts to have larger forecast errors
than the unaffiliated analysts. Therefore, the evidence that affiliated analysts’ forecasts are more
biased than unaffiliated analysts’ forecasts is not particularly helpful. Research must attempt to
demonstrate that analysts bias their forecasts upward because of the lure of investment banking
business (i.e., demonstrate causality).
4.4.3 Cross-sectional tests of return predictability
Cross-sectional tests of return predictability differ from event studies in two respects. First,
to be included in the analysis, firms need not experience a specific event like seasoned equity issue.
Second, return predictability tests typically analyze returns on portfolios of stocks with specific
characteristics (e.g., quintile of stocks reporting largest ratios of accruals to total assets or extreme
analysts’ forecasts) starting with a common date each year, whereas the event date in event studies
is typically not clustered in calendar time.
Cross-sectional return predictability tests of market efficiency almost invariably examine
long-horizon returns, so they face the problems discussed previously. Four problems are worth
revisiting. First, expected return mismeasurement can be serious in long-horizon tests. Second,
researchers typically focus on stocks exhibiting extreme characteristics (e.g., extreme accruals) that
are correlated with unusual prior performance, so changes in the determinants of expected return are
likely to be correlated with the portfolio formation procedure. Third, survival bias and data
problems can be serious, in particular if the researcher examines extreme performance stocks.
Finally, since there is perfect clustering in calendar time, tests that fail to control for cross-
correlation likely overstate the significance of the results.
There are two types of cross-sectional return predictability tests frequently conducted in
accounting: predictability tests that examine performance on the basis of univariate indicators of
market’s mispricing (e.g., earnings yield, accruals, or analysts’ forecasts) and tests that evaluate the
87 If my assumption is not descriptive of the process of selection of an affiliated analyst investment-banking firm, the criticism is not applicable.
108
performance of multivariate indicators like the fundamental value of a firm relative to its market
value (e.g., Ou and Penman, 1989, Abarbanell and Bushee, 1997 and 1998, Frankel and Lee, 1998,
and Piotroski, 2000). Both sets of tests provide strong evidence challenging market efficiency.
Both univariate and multivariate indicators of mispricing generate large magnitudes of abnormal
performance over a one-to-three-year post-portfolio-formation periods. The focus of future
research should be to address some of the problems I have discussed above in reevaluating the
findings of the current research from return-predictability tests. I summarize below the evidence
from the two types of return-predictability tests.
4.4.3.A Return predictability using univariate indicators of mispricing
Early tests of return predictability using univariate indicators of mispricing used earnings
yield (e.g., Basu, 1977 and 1983). This evidence attracted considerable attention in the literature
and the evidence from the earnings yield and other anomalies eventually led to multi-beta CAPM
models like the Fama-French three-factor (i.e., market, size, and book-to-market) model or Carhart
(1997) four-factor model that also includes momentum as a factor.
The recent flurry of research in return-predictability tests examines whether indicators other
than earnings yield generate long-horizon abnormal performance. Examples of this research
include the Lakonishok, Shleifer, and Vishny (1994) tests based on cash flow yield and sales
growth; the La Porta (1996) and Dechow and Sloan (1997) tests of market overreaction stemming
from analysts’ optimism; and the Sloan (1996), Collins and Hribar (2000a and b) and Xie (1999)
tests of the market’s overreaction to extreme accrual portfolios.
The theme most common in this literature is that the market overreacts to univariate
indicators of firm value and it corrects itself over a long horizon. The overreaction represents
market participants’ naïve fixation on reported numbers and their tendency to extrapolate past
performance. However, because there is mean reversion in the extremes (e.g., Brooks and
Buckmaster, 1976), the market’s initial reaction to extreme univariate indicators of value overshoots
fundamental valuation, and thus provides an opportunity to earn abnormal returns.88
88 Variations of the overreaction and extrapolation of past performance arguments appear in the following studies. Lakonishok, Shleifer, and Vishny (1994) in the context of past sales growth and current cash flow and earnings yield; Sloan (1996) in the context of accruals; and LaPorta (1996) and Dechow and Sloan (1997) in the context of analysts’ forecasts.

109
While many of the univariate indicators of return-predictability suggest market overreaction,
using both cash flow and earnings yield as indicators of market mispricing suggests market
underreaction. One challenge is to understand why the market underreacts to earnings, but its
reaction to its two components, cash flows and accruals, is conflicting. Previous evidence suggests
the market underreacts to cash flow and overreacts to accruals. Recently research has begun to
address these issues theoretically as well as empirically. For example, Bradshaw, Richardson, and
Sloan (1999) examine whether professional analysts understand the mean reversion property of
extreme accruals. They find that analysts do not incorporate the mean reversion property of
extreme accruals in their earnings forecasts. Bradshaw et al. (1999, p. 2) therefore conclude
“investors do not fully anticipate the negative implications of unusually high accruals.” While
Bradshaw et al.’s explanation is helpful in understanding return predictability using accruals, it
would be of interest to examine whether similar logic can explain the cash flow and earnings yield
anomalies. Extreme earnings and cash flows are also mean reverting. What is predicted about
analysts’ forecasts with respect to these two variables and how does that explain the market’s
underreaction to earnings?
While much evidence suggests market over- and under-reaction, other studies are
inconsistent with such market behavior. For example, Abarbanell and Bernard (2000) fail to detect
the stock market’s myopic fixation on current performance, i.e., market overreaction. Ali, Hwang,
and Trombley (1999) undertake a different approach to understand whether market participants’
naïveté contributes to cross-sectional return predictability using accruals. As several researchers
hypothesize in the post-earnings-announcement drift literature, Ali et al. (1999) test whether returns
to the accruals strategy are greater in magnitude for the high transaction cost, low analyst following,
and low institutional ownership stocks. The literature hypothesizes these characteristics proxy for
low investor sophistication, so a given level of accrual extremity in these stocks should yield greater
magnitudes of abnormal returns than high investor sophistication stocks. Ali et al. (1999) do not
find significant correlation between investor sophistication and abnormal returns. Zhang (2000)
draws a similar conclusion in the context of market’s fixation on analyst forecast optimism and
auto-correlation in forecast revisions. These findings make it less likely that returns to the accrual
strategy and apparent return reversals following analysts’ optimistic forecasts arise from investors’
functional fixation. The evidence makes it more likely that the apparent abnormal returns represent
compensation for omitted risk factors, statistical and survival biases in the research design, biases in

110
long-horizon performance assessment, or period-specific nature of the anomaly. Naturally, further
research is warranted.
4.4.3.B Return predictability using multivariate indicators of mispricing
Ou and Penman (1989a and b) use a composite earnings change probability measure called
Pr. They estimate the Pr measure from a statistical data reduction analysis using a variety of
financial ratios. The Pr measure indicates the likelihood of a positive or negative earnings change.
Ou and Penman (1989a and b) report positive abnormal returns to the Pr-measure based
fundamental strategy.
The Ou and Penman (1989a and b) studies attracted a great deal of attention in the literature.
They rejuvenated fundamental analysis research in account ing, even though their own findings
appear frail in retrospect. Holthausen and Larcker (1992) find that the Pr strategy does not work in
a period subsequent to that examined in Ou and Penman (1989). Stober (1992) and Greig (1992)
interpret returns to the Pr strategy as compensation for risk. Stober (1992) reports that abnormal
performance to the Pr strategy continues for six years and Greig (1992) finds that size subsumes the
Pr effect.
Lev and Thiagarajan (1993), Abarbanell and Bushee (1997 and 1998) and Piotroski (2000)
extend the Ou and Penman analysis by exploiting traditional rules of financial-ratio-based
fundamental analysis to earn abnormal returns. They find that the resulting fundamental strategies
pay double-digit abnormal returns in a twelve-month period following the portfolio-formation date.
The conclusion of the market’s sluggish adjustment to the information in the ratios is strengthened
by the fact that future abnormal returns appear to be concentrated around earnings announcement
dates when the earnings predictions of the analysis come true (see Piotroski, 2000).
Frankel and Lee (1998), Dechow, Hutton, and Sloan (1999), and Lee, Myers, and
Swaminathan (1999) extend the multivariate fundamental analysis to estimating stocks’
fundamental values and investing in mispriced stocks as suggested by their fundamental values.
They use the residual income model combined with analysts’ forecasts to estimate fundamental
values and show that abnormal returns can be earned.89
89 Lee, Myers, and Swaminathan (1999) results are also somewhat frail in that they fail to find abnormal returns unless they use information in the short-term risk-free rates in calculating fundamental values. Since fundamental analysis never emphasized the importance of, let alone the need of, information in short-term interest rates, I interpret their evidence as not strong.

111
5. Summary and Conclusions
In this paper I review research on the relation between capital markets and financial
statement information. I use an economics-based framework of demand for and supply of capital
markets research in accounting to organize the paper. The principal sources of demand for capital
markets research are fundamental analysis and valuation, tests of market efficiency, the role of
accounting in contracts and in the political process, and disclosure regulation. In summarizing past
research, I critique existing research as well as discuss unresolved issues and directions for future
research. In addition, I offer an historical perspective of the genesis of important ideas in the
accounting literature, which have greatly influenced future accounting thought in the area of capital
markets research. An exploration of the circumstances, forces, and concurrent developments that
led to significant breakthroughs in the literature will hopefully guide future accounting researchers
in their career investment decisions.
Ball and Brown (1968) heralded capital markets research into accounting. Key features of
their research, i.e., positive economics championed by Milton Friedman, Fama’s efficient markets
hypothesis, and the event study research design in Fama, Fisher, Jensen, and Roll (1969), were the
cornerstones of the economics and finance research taking place concurrently at the University of
Chicago. History repeated itself with Watts and Zimmerman’s positive accounting theory research
in the late 1970s. While the above are just two examples, many other developments in accounting
are also influenced by concurrent research and ideas in related fields. The important conclusion
here is that rigorous training in and an on-going attempt to remain abreast of fields beyond
accounting will enhance the probability of successful, high impact research.
Section 4 surveys empirical capital markets research. The topics include methodological
research (e.g., earnings response coefficients, time series and analysts’ forecasts, and models of
discretionary accruals); research examining alternative performance measures; valuation and
fundamental analysis research; and finally, accounting research on tests of market efficiency. The
areas of greatest current interest appear to be research on discretionary accruals, influence of
analysts’ incentives on the properties of their forecasts, valuation and fundamental analysis, and
tests of market efficiency. The revival of interest in fundamental analysis is rooted in the mounting
evidence that suggests capital markets might be informationally inefficient and that prices might
112
take years before they fully reflect available information. Fundamental valuation can yield a rich
return in an inefficient market. A large body of research demonstrates economically significant
abnormal returns spread over several years by implementing fundamental analysis trading
strategies. Evidence suggesting market inefficiency has also reshaped the nature of questions
addressed in the earnings management literature. Specifically, the motivation for earnings
management research has expanded from contracting and political process considerations in an
efficient market to include earnings management designed to influence prices because investors and
the market might be fixated on (or might overreact or under-react to) reported financial statement
numbers.
Evidence of market inefficiency and abnormal returns to fundamental analysis has triggered
a surge in research testing market efficiency. Such research interests academics, investors, and
financial market regulators and standard setters. The current rage is examination of long-horizon
security price performance. However, this research is methodologically complicated because of
skewed distributions of financial variables, survival biases in data, and difficulties in estimating the
expected rate of return on a security. Progress is possible in testing market efficiency if attention is
paid to the following issues. First, researchers must recognize that deficient research design choices
can create the false appearance of market inefficiency. Second, advocates of market inefficiency
should propose robust hypotheses and empirical tests to differentiate their behavioral- finance
theories from the efficient market hypothesis that does not rely on investor irrationality. The above
challenges in designing better tests and refutable theories of market inefficiency underscore the
need for accounting researchers trained in cutting-edge research in economics, finance, and
econometrics.

113
References
Abarbanell, J., 1991, Do analysts’ earnings forecasts incorporate information in prior stock price changes? Journal of Accounting & Economics 14, 147-165.
Abarbanell, J., Bernard, V., 1992, Tests of analysts’ overreaction/underreaction to earnings information as an explanation for anomalous stock price behavior, Journal of Finance 47, 1181-1207.
Abarbanell, J., Bernard, V., 2000, Is the US stock market myopic? Journal of Accounting Research 38, 221-242.
Abarbanell, J., Bushee, B., 1997, Fundamental analysis, future earnings, and stock prices, Journal of Accounting Research 35, 1-24.
Abarbanell, J., Bushee, B., 1998, Abnormal returns to a fundamental analysis strategy, The Accounting Review 73, 19-45.
Abarbanell, J., Lehavy, R., 2000a, Differences in commercial database reported earnings: Implications for inferences in research o analyst forecast rationality, earnings management, and earnings response coefficients, working paper, University of North Carolina.
Abarbanell, J., Lehavy, R., 2000b, Biased forecasts or biased earnings? The role of earnings management in explaining apparent optimism and inefficiency in analysts’ earnings forecasts, working paper, University of North Carolina.
Abdel-khalik, R., 1990, Specification problems with information content of earnings: Revisions and rationality of expectations and self-selection bias, Contemporary Accounting Research 7, 142-172.
Abel, A., Dixit, A., Eberly, J., Pindyck, R., 1996, Options, the value of capital and investment, Quarterly Journal of Economics 111, 753-777.
Aboody, D., Lev, B., 1998, The value-relevance of intangibles: the case of software capitalization, Journal of Accounting Research Supplement 36, 161-191.
Abraham, T., Sidhu, B., 1998, The role of R&D capitalisations in firm valuation and performance measurement, Australian Journal of Management 23, 169-183.
Accounting Principles Board (APB), 1973, Interim Financial Reporting, APB Opinion No. 28, New York, NY: APB.
Adair, T., 1995, The decision process of security analysts: Potential causes of optimistic biases in EPS forecasts, Working paper, Indiana University, Bloomington, IN.
Affleck-Graves, J., Davis, R., Mendenhall, R., 1990, Forecasts of earnings per share: Possible sources of analyst superiority and bias, Contemporary Accounting Research 6, 501-517.
Aharony, J., Lin, C., Loeb, M., 1993, Initial public offerings, accounting choice, and earnings management, Contemporary Accounting Research 10, 61-81.
Ahmed, A., 1994, Accounting earnings and future economic rents: An empirical analysis, Journal of Accounting & Economics 17, 377-400.

114
Ajinkya, B., Gift, M., 1984, Corporate managers’ earnings forecasts and symmetrical adjustments of market expectations, Journal of Accounting Research Autumn 22, 425-444.
Albrecht, W., Lookabill, L, McKeown, J., 1977, The time series properties of annual earnings, Journal of Accounting Research 15, 226-244.
Ali, A., 1996, Bias in analysts’ earnings forecasts as an explanation for the long-run underperformance of stocks following equity offerings, unpublished working paper, University of Arizona.
Ali, A., Hwang, L., Trombley, M., 1999, Accruals and future returns: Tests of the naïve investor hypothesis, working paper, University of Arizona.
Ali, A., Klein, A., Rosenfeld, J., 1992 Analysts’ use of information about permanent and transitory earnings components in forecasting annual EPS, Accounting Review 67, 183-198.
Ali, A., Zarowin, P., 1992, The role of earnings levels in annual earnings-returns studies, Journal of Accounting Research 30, 286-296.
American Institute of Certified Public Accountants, Special committee on financial reporting, 1994, Improving business reporting-a customer focus, comprehensive report of the special committee on financial reporting, American Institute of Certified Public Accountants.
Amir, E., Lev, B., 1996, Value-relevance of nonfinancial information: The wireless communications industry, Journal of Accounting & Economics 22, 3-30.
Ando, A., Modigliani, F., 1963, The ‘life cycle’ hypothesis of saving: Aggregate implications and tests, American Economic Review.
Andrade, G., 1999, Do appearances matter? The impact of EPS accretion and dilution on stock prices, working paper, Harvard Business School.
Anthony, J. Ramesh, K., 1992, Association between accounting performance measures and stock prices: A test of the life cycle hypothesis, Journal of Accounting & Economics 15, 203-227.
Archibald, T., 1972, Stock market reaction to the depreciation switch-back, The Accounting Review 47, 22-30.
Asquith P., Mullins, D., 1983, The impact of initiating dividends on shareholders’ wealth, Journal of Business 56, 77-96.
Atiase, R., 1985, Predisclosure information, firm capitalization, and security price behavior around earnings announcements, Journal of Accounting Research 23, 21-36.
Atiase, R., 1987, Market implications of predisclosure information: Size and exchange effects, Journal of Accounting Research 25, 168-75.
Ayers, B., 1998, Deferred tax accounting under SFAS No. 109: An empirical investiga tion of its incremental value-relevance relative to APB No. 11, The Accounting Review 73, 195-212.
Ayers, B., Lefanowicz, C., Robinson, J., 1999, Do firms purchase the pooling method, working paper, University of Georgia.

115
Baber, W., Janakiraman, S., Kang, S., 1996, Investment opportunities and the structure of executive compensation, Journal of Accounting & Economics 21, 297-318.
Baber, W., Kang, S., Kumar, K., 1996, Accounting earnings and executive compensation: The role of earnings persistence, Journal of Accounting & Economics 25, 169-193.
Baginski, S., Conrad, E., Hassell, J., 1993, The effects of management forecast precision on equity pricing and on the assessment of earnings uncertainty, the Accounting Review 68, 913-27.
Baginski, S., Lorek, K., Willinger, G., Branson, B., 1999, The relationship between economic characteristics and alternative annual earnings persistence measures, The Accounting Review 74, 105-120.
Bahnson, P., Miller, P., Budge, B., 1996, Nonarticulation in cash flow statements and implications for education, research, and practice, Accounting Horizons 10, 1-15.
Ball, R., 1972, Changes in accounting techniques and stock prices, Journal of Accounting Research Supplement 10, 1-38.
Ball, R., 1978, Anomalies in relationships between securities’ yields and yield-surrogates, Journal of Financial Economics 6, 103-126.
Ball, R., 1992, The earnings-price anomaly, Journal of Accounting & Economics 15, 319-345.
Ball, R., 1994, The development, accomplishments, and limitations of the theory of stock market efficiency, Managerial Finance 20, 3-48.
Ball, R., Bartov, E., 1996, How naïve is the stock market’s use of earnings information? Journal of Accounting & Economics 21, 319-337.
Ball, R., Brown, P., 1968, An empirical evaluation of accounting income numbers, Journal of Accounting Research 6, 159-177.
Ball, R., Kothari, S., 1989, Nonstationary expected returns: Implications for tests of market efficiency and serial correlation in returns, Journal of Financial Economics 25, 51-74.
Ball, R., Kothari, S., 1991, Security returns around earnings announcements, The Accounting Review 66, 718-738.
Ball, R., Kothari, S., Robin, A., 2000, The effect of institutional factors on properties of accounting earnings, working paper, Journal of Accounting & Economics 29, 1-51.
Ball, R., Kothari, S., Shanken, J., 1995, Problems in measuring portfolio performance: An application to contrarian investment strategies, Journal of Financial Economics 38, 79-107.
Ball, R., Kothari, S., Watts, R., 1993, Economic determinants of the relation between earnings changes and stock returns, The Accounting Review 68, 622-638.
Ball, R., Watts, R., 1972, Some time series properties of accounting income, Journal of Finance 27, 663-682.
Ball, R., Watts, R., 1979, Some additional evidence on survival biases, Journal of Finance 34, 197-206.

116
Balvers, R., Cosimano, T., Mcdonald, B., 1990, Predicting stock returns in an efficient market, Journal of Finance 45, 1109-1128.
Bamber, L., 1987, Unexpected earnings, firm size, and trading volume around quarterly earnings announcements, The Accounting Review 62, 510-532.
Bamber, L., Barron, O., Stober, T., 1999, Differential interpretations and trading volume, Journal of Financial and Quantitative Analysis 34, 369-386.
Bamber, L., Cheon, Y., 1998, Discretionary management earnings forecast disclosures: Antecedants and outcomes associated with forecast venue and forecast specificity, Journal of Accounting Research 36, 167-190.
Banz, R., 1981, The relationship between return and market value of common stocks, Journal of Financial Economics 9, 3-18.
Barber, B., Lyon, J., 1996, Detecting abnormal operating performance: The empirical power and specification of test statistics, Journal of Financial Economics 41, 359-399
Barber, B., Lyon, J., 1997, Detecting long-run abnormal stock returns: The empirical power and specification of test statistics, Journal of Financial Economics 43, 341-372.
Barberis, N., Shleifer, A., Vishny, R., 1998, A model of investor sentiment, Journal of Financial Economics 49, 307-343.
Barclay, M., Gode, D., Kothari, S., 1999, Measuring delivered performance, working paper, Massachusetts Institute of Technology.
Barefield, R., Comiskey, E., 1975, The accuracy of analysts’ forecasts of earnings per share, Journal of business Research 3, 241-252.
Barth, M. Clinch, G., 1999, Scale effects in capital markets-based accounting research, working paper, Stanford University.
Barth, M., 1991, Relative measurement errors among alternative pension asset and liability measures, The Accounting Review 66, 433-463.
Barth, M., 1994, Fair value accounting: Evidence from investment securities and the market valuation of banks, The Accounting Review 69, 1-25.
Barth, M., Beaver, W., Landsman, W., 1992, The market valuation implications of net periodic pension cost components, Journal of Accounting & Economics 15, 27-62.
Barth, M., Beaver, W., Landsman, W., 1996, Value-relevance of banks’ fair value disclosures under SFAS No. 107, The Accounting Review 71, 513-537.
Barth, M., Beaver, W., Landsman, W., 1998, Relative valuation roles of equity book value and net income as a function of financial health, Journal of Accounting & Economics 25, 1-34.
Barth, M., Cram, D. and Nelson, K., 1999, Accruals and the prediction of future cash flows, working paper, Stanford University.
Barth, M., Kallapur, S., 1996, The effects of cross-sectional scale differences on regression results in empirical accounting research, Contemporary Accounting Research 13, 527-567.
117
Barth, M., Landsman, W., 1995, Fundamental issues related to using fair value accounting for financial reporting, Accounting Horizons 9, 97-107.
Bartov, E., Radhakrishnan, S., Krinsky, I., 2000, Investor sophistication and patterns in stock returns after earnings announcements, The Accounting Review 75, forthcoming.
Basu, S., 1977, The investment performance of common stocks in relation to their price-earnings ratios: A test of the efficient markets hypothesis, Journal of Finance 32, 663-682.
Basu, S., 1983, The relationship between earnings yield, market value, and returns for NYSE common stocks: Further evidence, Journal of Financial Economics 12, 129-156.
Basu, S., 1997, The conservatism principle and the asymmetric timeliness of earnings, Journal of Accounting & Economics 24, 3-37.
Bathke, Jr, A., Lorek, K., 1984, The relationship between time-series models and the security market’s expectation of quarterly earnings, Accounting Review 59, 163-176.
Beaver, W., 1968, The information content of annual earnings announcements, Journal of Accounting Research Supplement 6, 67-92.
Beaver, W., 1972, The behavior of security prices and its implications for accounting research (methods), in the “Report of the Committee on Research Methodology in Accounting,” The Accounting Review 1972 Supplement, 407-437.
Beaver, W., 1998, Financial Reporting: An Accounting Revolution, 3rd edition, Prentice-Hall, Englewood Cliffs, NJ.
Beaver, W., 1999, Comments on “An empirical assessment of the residual income valuation model,’ Journal of Accounting & Economics 26, 35-42.
Beaver, W., Clarke, R., Wright, F., 1979, The association between unsystematic security returns and the magnitude of earnings forecast errors, Journal of Accounting Research 17, 316-40.
Beaver, W., Demski, J., 1979, The nature of income measurement, The Accounting Review, 38-46.
Beaver, W., Dukes, R., 1972, Interperiod tax allocation, earnings expectations, and the behavior of security prices, The Accounting Review 47, 320-332.
Beaver, W., Dukes, R., 1973, Interperiod tax allocation and delta depreciation methods: Some empirical results, The Accounting Review 48, 549-559.
Beaver, W., Engel, E., 1996, Discretionary behavior with respect to allowance for loan losses and the behavior of security prices, Journal of Account ing & Economics 22, 177-206.
Beaver, W., Lambert, R., Morse, D., 1980, The information content of security prices, Journal of Accounting & Economics 2, 3-28.
Beaver, W., Lambert, R., Ryan, S., 1987, The information content of security prices: a second look, Journal of Accounting & Economics 9, 139-157.
Beaver, W., McAnally, M., Stinson, C., 1997, The information content of earnings and prices: A simultaneous equations approach, Journal of Accounting & Economics 23, 53-81.

118
Beaver, W., Morse, D., 1978, What determines price-earnings ratios? Financial Analysts’ Journal 34, 65-76.
Beaver, W., Ryan, S., 2000, Biases and lags in book value and their effects on the ability of the book-to-market ratio to predict book rate of return on equity, Journal of Accounting Research 38, 127-148.
Beaver, W., Venkatachalam, M., 1999, Differential pricing of discretionary, nondiscretionary and noise components of loan fair values, working paper, Stanford University.
Beneish, M., 1998, Discussion of “Are accruals during initial public offerings opportunistic?” Review of Accounting Studies 3, 209-221.
Beneish, M., Harvey, C., 1998, Measurement error and nonlinearity in the earnings-returns relation, Review of Quantitative Finance and Accounting 3, 219-247.
Berger, P., Ofek, E., Swary, I., 1996, Investor valuation of the abandonment option, Journal of Financial Economics 42, 257-287.
Bernard, V., 1987, Cross-sectional dependence and problems in inference in market-based accounting research 25, Journal of Accounting Research, 1-48.
Bernard, V., 1989, Capital markets research in accounting during the 1980's: A critical review, in The State of Accounting Research as We Enter the 1990s, Ed., Thomas J. Frecka, University of Illinois at Urbana-Champaign, Urbana, IL.
Bernard, V., 1995, The Feltham-Ohlson framework: Implications for empiricists, Contemporary Accounting Research 11, 733-747.
Bernard, V., Stober, T., 1989, The nature and amount of information in cash flows and accruals, The Accounting Review 64, 624-652.
Bernard, V., Thomas, J., 1989, Post-earnings-announcement drift: delayed price response or risk premium?, Journal of Accounting Research 27, 1-48.
Bernard, V., Thomas, J., 1990, Evidence that stock prices do not fully reflect the implications of current earnings for future earnings, Journal of Accounting & Economics 13, 305-340.
Bernard, V., Thomas, J., Whalen, J., 1997, Accounting-based stock price anomalies: Separating market efficiencies from research design flaws, Contemporary Accounting Research 14,
Bhattacharya, S., 1979, Imperfect information, dividend policy and ‘the bird in the hand fallacy, Bell Journal of Economics 10, 259-70.
Bhushan, R., 1994, An informational efficiency perspective on the post-earnings-announcement drift, Journal of Accounting & Economics 18, 45-65.
Biddle, G, Lindahl, F., 1982, Stock price reactions to LIFO adoptions: The association between excess returns and LIFO tax savings, Journal of Accounting Research 20, 551-588.
Biddle, G., Bowen, R., Wallace, J., 1997, Does EVA beat earnings? Evidence on associations with returns and firm values, Journal of Accounting & Economics 24, 301-336.
119
Biddle, G., Seow, G., 1991, The estimation and determinants of association between returns and earnings: Evidence from cross- industry comparisons, Journal of Accounting, Auditing and Finance 6, 183-232.
Biddle, G., Seow, G., 1996, Testing relative information using nested likelihood models, Unpublished paper, University of Washington, Seattle, WA.
Biddle, G., Seow, G., Siegel, A., 1995, Relative versus incremental information content, Contemporary Accounting Research 12, 1-23.
Blanchard, O., 1993, Movements in the equity premium, Brookings Papers on Economic Activity 2, 75-138.
Blume, M., Stambaugh, R., 1983, Biases in computed returns: An application to the size effect. Journal of Financial Economics 12, 387-404.
Botosan, C., 1997, Disclosure level and the cost of equity capital 72, 323-350.
Bowen, R., Burgstahler, D., Daley, L., 1986, Evidence on the relationships between earnings and various measures of cash flow, The Accounting Review 61, 713-725.
Bowen, R., Burgstahler, D., Daley, L., 1987, The incremental information content of accrual versus cash flows, The Accounting Review 62, 723-747.
Box, G., Jenkins, G., 1976, Time Series Analysis: Forecasting and Control, 2nd edition (Holden-Day, San Francisco, CA).
Bradshaw, M., Richardson, S., Sloan, R., 1999, Earnings quality and financial reporting credibility: An empirical investigation, working paper, university of Michigan.
Brav, A., 2000, Inferences in long-horizon event studies: A Bayesian approach with application to initial public offerings, Journal of Finance 55, 1979-2016.
Brennan, M., Copeland, T., 1988, Beta changes around stock splits: A note, Journal of Finance 43, 1009-1013.
Brooks, L., Buckmaster, D., 1976, Further evidence on the time series properties of accounting income, Journal of Finance 31, 1359-1373.
Brown, L. Han, J., 2000, Do stock prices fully reflect the implications of current earnings for future earnings for AR1 firms? Journal of Accounting Research 38, 149-164.
Brown, L., 1991, forecast selection when all forecasts are not equally recent, International Journal of Forecasting 7, 349-356.
Brown, L., 1993, Earnings forecasting research: Its implications for capital markets research, International Journal of Forecasting 9, 295-320.
Brown, L., 1997, Analyst forecasting errors: Additional evidence, Financial Analysts Journal, 53, 81-88.
Brown, L., 1998, Managerial behavior and the bias in analyst’s earnings forecasts, working paper, Georgia State University.

120
Brown, L., 1999, Discussion of “Post-earnings announcement drift and the dissemination of predictable information,” Contemporary Accounting Research 16, 341-345.
Brown, L., Griffin, P., Hagerman, R., Zmijewski, M., 1987a, Security analyst superiority relative to univariate time-series models in forecasting quarterly earnings, Journal of Accounting & Economics 9, 61-87.
Brown, L., Griffin, P., Hagerman, R., Zmijewski, M., 1987b, An evaluation of alternative proxies for the market’s expectation of earnings, Journal of Accounting & Economics 9, 159-193.
Brown, L., Rozeff, M., 1978, The superiority of analyst forecasts as measures of expectations: evidence from earnings, Journal of Finance 33, 1-16.
Brown, L., Rozeff, M., 1979a, Univariate time series models of quarterly accounting earnings per share: a proposed model, Journal of Accounting Research 17, 179-189.
Brown, L., Rozeff, M., 1980, Analysts can forecast accurately, Journal of Portfolio Management 6, 31-34.
Brown, P., Foster, G., Noreen, E., 1985, Security analyst Multi-Year Earnings Forecasts and the Capital Market (American Accounting Association, Sarasota, FL).
Brown, R., 1980, Short-range market reaction to changes to LIFO accounting using earnings announcement dates, Journal of Accounting Research 18, 38-63.
Brown, S., Lo, K., Lys, T., 1999, Use of R2 in accounting research: measuring changes in value relevance over the last four decades, Journal of Accounting & Economics 28, 83-115.
Brown, S., Warner, J., 1980, Measuring security price performance, Journal of Financial Economics 8, 205-258.
Brown, S., Warner, J., 1985, Using daily stock returns: The case of event studies, Journal of Financial Economics 14, 3-31.
Bryant, L., 1999, Value-relevance of capitalizing successful exploration activities: implications for R&D accounting, working paper, Ohio State University.
Burgstahler, D., Dichev, I., 1997, Earnings, adaptation, and equity value, The Accounting Review 72, 187-215.
Burgstahler, D., Jiambalvo, J., and Shevlin, T., 1999, Time-series properties and pricing of special items component of earnings, working paper, University of Washington.
Butler, K., Lang, L., 1991, The forecast accuracy of individual analysts: evidence of systematic optimism and pessimism, Journal of Accounting Research 29, 150-156.
Campbell, J., Lo, A., MacKinlay, A., 1997, The Econometrics of Financial Markets, Princeton University Press, Princeton, NJ.
Campbell, J., Shiller, R., 1988a, The dividend-price ratio and expectations of future dividends and discount factors, Review of Financial Studies 1, 195-227.
Campbell, J., Shiller, R., 1988b, Stock prices, earnings, and expected dividends, Journal of Finance 43, 661-676.

121
Capstaff, J., Paudyal, K., Rees, W., 1997, A comparative analysis of earnings forecasts in Europe, Working paper, University of Glasgow, Glasgow, Scotland.
Carhart, M., 1997, On persistence in mutual fund performance, Journal of Finance 52, 57-82.
Chan, K. and N. Chen, 1988, An unconditional asset-pricing test and the role of firm size as an instrumental variable for risk, Journal of Finance 43, 309-325.
Chan, K., 1988, On the contrarian investment strategy, Journal of Business 61, 147-163.
Chan, K., Jegadeesh, N., Lakonishok, J., 1996, Momentum strategies, Journal of Finance 51, 1681-1713.
Chaney, P., Hogan, C., Jeter, D., 1999, The effect of reporting restructuring charges on analysts’ forecast revisions and errors, Journal of Accounting & Economics 27, 261-284.
Chen, N., 1991, Financial investment opportunities and the macroeconomy, Journal of Finance 46, 529-554.
Cheng, C., Hopwood, W., McKeown, J., 1992, Non- linearity and specification problems in unexpected earnings response regression models, The Accounting Review 67, 579-598.
Choi, S., Salamon, G., 1990, Accounting information and capital asset prices, working paper (Vanderbilt University, Nashville, TN).
Chopra, N., Lakonishok, J., Ritter, J., 1992, Measuring abnormal performance: Does the market overreact? Journal of Financial Economics 32, 235-268.
Christie, A., 1987, On cross-sectional analysis in accounting research, Journal of Accounting & Economics 9, 231-258.
Christie, A., 1991, On information arrival and hypothesis testing in event studies, working paper, University of Rochester.
Claus, J., Thomas, J., 1999a , The equity risk premium is much lower than you think it is: Empirical estimates from a new approach, working paper, Columbia University.
Claus, J., Thomas, J., 1999b, Measuring the equity risk premium using earnings forecasts: An international analysis, working paper, Columbia University.
Clement, M., 1999, Analyst forecast accuracy: Do ability, resources, and portfolio complexity matter? Journal of Accounting & Economics 27, 285-303.
Cochrane, J., 1997, Where is the market going? Uncertain facts and novel theories, Economic Perspectives 21, 3-37.
Collins, D., Dent, W., 1984, A comparison of alternative testing methodologies used in capital market research, Journal of Accounting Research 22, 48-95.
Collins, D., Hribar, P., 2000a, Earnings-based and accrual-based market anomalies: One effect or two? Journal of Accounting & Economics 29, 101-123.
Collins, D., Hribar, P., 2000b, Errors in estimating accruals: Implications for empirical research, working paper, University of Iowa.

122
Collins, D., Kothari, S., 1989, An analysis of inter-temporal and cross-sectional determinants of earnings response coefficients, Journal of Accounting & Economics 11, 143-181.
Collins, D., Kothari, S., Rayburn, J., 1987, Firm size and the information content of prices with respect to earnings, Journal of Accounting & Economics 9, 111-138.
Collins, D., Kothari, S., Shanken, J., Sloan, R., 1994, Lack of timeliness versus noise as explanations for low contemporaneous return-earnings association, Journa l of Accounting & Economics 18, 289-324.
Collins, D., Maydew, E., Weiss, I., 1997, Changes in the value-relevance of earnings and book values over the past forty years, Journal of Accounting & Economics 24, 39-67.
Collins, D., Pincus, M., Xie, H., 1999, Equity valuation and negative earnings: The role of book value of equity, The Accounting Review 74, 29-61.
Collins, D., Salatka, W., 1993, Noisy accounting earnings signals and earnings response coefficients: The case of foreign currency accounting, Contemporary Accounting Research 10, 119-159.
Collins, W., Hopwood, W., 1980, A multivariate analysis of annual earnings generated from quarterly forecasts of financial analysts and univariate time-series models, Journal of Accounting Research 18, 390-406.
Collins, W., Hopwood, W., McKeown, J., 1984, The predictability of interim earnings over alternative quarters, Journal of Accounting Research 22, 467-479.
Conrad, J., Kaul, G., 1993, Long-term market overreaction or biases in computed returns, Journal of Finance 48, 39-63.
Cottle, S., Murray, R., Block, F., 1988, Graham and Dodd’s Security Analysis, fifth edition, McGraw-Hill Book Company, New York, NY.
Courteau, L., Kao, J., Richardson, G., 2000, The equivalence of dividend, cash flows, and residual earnings approaches to equity valuation employing terminal value expressions, working paper, University of Alberta.
Cragg, J., Malkiel, B., 1982, Expectations and the Structure of Share Prices, University of Chicago Press, Chicago.
Cramer, J., 1987, Mean and variance of R2 in small and moderate samples, journal of Econometrics 35, 253-266.
Crichfield, T., Dyckman, T., Lakonsihok, J., 1978, An evaluation of security analysts’ forecasts, The Accounting Review 53, 651-668.
Damodaran, A., 1994, Damodaran on Valuation, John Wiley & Sons, New York, NY.
Daniel, K, Grinblatt, M., Titman, S., Wermers, R., 1997, Measuring mutual fund performance with characteristic-based benchmarks, Journal of Finance 52, 1035-1058.
Daniel, K., D. Hirshleifer, and A. Subramanyam, 1998, Investor psychology and security market under- and overreactions, Journal of Finance 53, 1839-1885.

123
Das, S., Lev,B., 1994, Nonlinearity in the return-earnings relation: tests of alternative specifications and explanations, Contemporary Accounting Research 11, 353-379.
Das, S., Levine, C., Sivaramakrishnan, K., 1998, Earnings predictability and bias in analysts’ earnings forecasts, the Accounting Review 73, 277-294.
Davidson, R., MacKinnon, J., 1981, Estimation and Inference in Econometrics, Oxford University Press, New York.
Davis, M., 1990, Differential market reaction to pooling and purchase methods, The Accounting Review 65, 696-709.
DeAngelo, L., 1986, Accounting numbers as market value substitutes: A study of managerial buyouts of public stockholders, The Accounting Review 61, 400-420.
DeBondt, W., 1992, Earnings forecasts and share price reversals, Research Foundation of the Institute of Chartered Financial Analysts, AIMR, Charlottesville, VA.
DeBondt, W., Thaler, R., 1985, Does the stock market overreact? Journal of Finance 40, 793-805.
DeBondt, W., Thaler, R., 1987, Further evidence of investor overreaction and stock market seasonality, Journal of Finance 42, 557-581.
DeBondt, W., Thaler, R., 1990, Do security analysts overreact?, American economic Review 80, 52-57.
DeBondt, W., Thaler, R., 1995,Financial decision-making in markets and firms: A behavioral perspective; in Robert A. Jarrow, Voijslav Maksimovic, and William T. Ziemba, eds.: Finance, Handbooks in Operations Research and Management science 9, 385-410, North Holland, Amsterdam.
Dechow, P., 1994, Accounting earnings and cash flows as measures of firm performance: The role of accounting accruals, Journal of Accounting & Economics 18, 3-42.
Dechow, P., Hutton, A., Sloan, R., 1999, An empirical assessment of the residual income valuation model, Journal of Accounting & Economics 26, 1-34.
Dechow, P., Hutton, A., Sloan, R., 2000, The relation between analysts’ long-term earnings forecasts and stock price performance following equity offerings, Contemporary Accounting Research 17, 1-32.
Dechow, P., Kothari, S., Watts, R., 1998, The relation between earnings and cash flows, Journal of Accounting & Economics 25, 133-168.
Dechow, P., Lys, T., Sabino, J., 1998, Addressing recognition issues in accounting: an evaluation of alternative research approaches, working paper, Massachusetts Institute of Technology.
Dechow, P., Sloan, R., 1991, Executive incentives and the horizon problem: An empirical investigation, Journal of Accounting & Economics 14, 51-89.
Dechow, P., Sloan, R., 1997, Returns to contrarian investment strategies: tests of naïve expectation hypotheses, Journal of Financial Economics 43, 3-27.
124
Dechow, P., Sloan, R., Sweeney, A., 1995, Detecting earnings management, The Accounting Review 70, 3-42.
Dechow, P., Sloan, R., Sweeney, A., 1996, Causes and consequences of earnings manipulation: An analysis of firms subject to enforcement actions by the SEC, Contemporary Accounting Research 13, 1-36.
DeFond, M., Jiambalvo, J., 1994, Devt covenant violation and manipulation of accruals: Accounting choice in troubled companies, Journal of Accounting & Economics 17, 145-176.
Degeorge, F., Patel, J., Zeckhauser, R., 1999, Earnings management to exceed thresholds, Journal of Business 72 (1), 1-33.
Dhaliwal, D., 1986, Measurement of financial leverage in the presence of unfounded pension liabilities, The Accounting Review 61, 651-661.
Dhaliwal, D., Guenther, D., Trombley, M., 2000, Inventory accounting method and earnings-price ratios, Contemporary Accounting Research, forthcoming.
Dhaliwal, D., Subramanyam, K., Trezevant, R., 1999, Is comprehensive income superior to net income as a measure of performance? Journal of Accounting & Economics 26, 43-67.
Dharan, B., Lev, B., 1993, The valuation consequences of accounting changes: A multi-year examination, Journal of Accounting, Auditing, and Finance 8, 475-494.
Dimson, 1979, Risk mismeasurement when share are subject to infrequent trading, Journal of Financial Economics 7, 197-226.
Dixit, A., Pindyck, R., 1994, Investment under Uncertainty, Princeton University Press, Princeton, NJ.
Dolley, J., 1933, Characteristics and procedure of common stock split-ups, Harvard Business Review 11, 316-326.
Drtina, R., Largay, J., 1985, Pitfalls in calculating cash flows from operations, The Accounting Review 60, 314-326.
Dugar, A., Nathan, S., 1995, The Effect of Investment Banking Relationships on Financial Analysts’ Earnings Forecasts and Investment Recommendations, Contemporary Accounting Research 12, 131-160.
Dukes, R., An investigation of the effects of expensing research and development costs on security prices, in Proceedings of the Conference on Topical Research in Accounting, Edited by M. Schiff and C. Sorter, New York University.
Easterbrook, F., 1984, Two agency-cost explanations of dividends, American Economic Review 74, 650-659.
Easterwood, J., Nutt, S., 1999, Inefficiency in analysts’ earnings forecasts: Systematic misreaction or systematic optimism, Journal of Finance 54, 1777-1797.
Easton, P., 1998, Discussion of “Revalued financial, tangible, and intangible assets: Association with share prices and non-market-based value estimates,” Journal of Accounting Research Supplement 36, 235-247.

125
Easton, P., Harris, T., 1991, Earnings as an explanatory variable for returns, Journal of Accounting Research 29, 19-36.
Easton, P., Harris, T., Ohlson, J., 1992, Aggregate accounting earnings can explain most of security returns: the case of long event windows, Journal of Accounting & Economics 15, 119-142.
Easton, P., Zmijewski, M., 1989, Cross-sectional variation in the stock market response to accounting earnings announcements, Journal of Accounting & Economics 11, 117-141.
Eccher, E., Ramesh, K., S. Thiagarajan, S., 1996, Fair value disclosures by bank holding companies, Journal of Accounting & Economics 22, 79-117.
Edwards, E., Bell, P., 1961, The Theory and Measurement of Business Income, University of California Press, Berkeley, CA.
El-Gazzar, S., 1998, Prediclosure information and institutional ownership: A cross-sectional examination of market revaluations during earnings announcement periods, The Accounting Review 73, 119-129.
Elliott, J., Hanna, D., 1996, Repeated accounting write-offs and the information content of earnings, Journal of Accounting Research Supplement 34, 135-155.
Elton, E., 1999, Expected return, realized return, and asset pricing tests, journal of Finance 54, 1199-1220.
Elton, E., Gruber, M., Gultekin, M., 1984, Professional expectations: Accuracy and diagnosis of errors, Journal of Financial and Quantitative Analysis 19, 351-363.
Fama, E., 1965, The behavior of stock market prices, Journal of Business 38, 34-105.
Fama, E., 1970, Efficient capital markets: A review of theory and empirical work, Journal of Finance 25, 383-417.
Fama, E., 1977, Risk-adjusted discount rates and capital budgeting under uncertainty, Journal of Financial Economics 5, 3-24.
Fama, E., 1981, Stock returns, real activity, inflation, and money, American Economic Review 71, 545-565.
Fama, E., 1990, Stock returns, expected returns, and real activity, Journal of Finance 45,1089-1108.
Fama, E., 1991, Efficient capital markets: II, Journal of Finance 46, 1575-1617.
Fama, E., 1996, Discounting under uncertainty, Journal of Business 69, 415-428.
Fama, E., 1998, Market efficiency, long-term returns, and behavioral finance, Journal of Financial Economics 49, 283-306.
Fama, E., Fisher, L., Jensen, M., Roll, R., 1969, The adjustment of stock prices to new information, International Economic Review 10, 1-21.
Fama, E., French K., 1988, Permanent and temporary components of stock prices, Journal of Political Economy 96, 246-273.

126
Fama, E., French K., 1989, Business conditions and expected returns on stocks and bonds, Journal of Financial Economics 25, 23-49.
Fama, E., French K., 1993, Common risk factors in the returns on stocks and bonds, Journal of Financial Economics 33, 3-56.
Fama, E., French K., 1996, Multifactor explanations of asset pricing anomalies, Journal of Finance 51, 55-84.
Fama, E., French K., 1997, Industry costs of equity, Journal of Financial Economics 43, 153-193.
Fama, E., French K., 2000, Forecasting profitability and earnings, Journal of Business, forthcoming.
Fama, E., MacBeth, J., 1973, Risk, return, and equilibrium: Empirical tests, Journal of Political Economy 81, 607-636.
Fama, E., Miller, M., 1972, The Theory of Finance, Dryden Press, Hinsdale, Il.
Fama, E., Schwert, G., 1977, Asset returns and inflation, Journal of Financial Economics 2, 115-146.
Feltham, G., Ohlson, J., 1995, Valuation and clean surplus accounting for operating and financial activities, Contemporary Accounting Research 11, 689-731.
Ferson, W., Schadt, R., 1996, Measuring fund strategy and performance in changing economic conditions, Journal of Finance 51, 425-461.
Fields, T., Rangan, S., Thiagarajan, R., 1998, An empirical evaluation of the usefulness of non-GAAP accounting measures in the real estate investment trust industry, Review of Accounting Studies 3, 103-130.
Financia l Accounting Standards Board, 1978, Statement of financial accounting concepts No. 1: Objectives of financial reporting by business enterprises, FASB, Stamford, CT.
Financial Accounting Standards Boards, 1974, Reporting accounting changes in interim financial statements, Statement of Financial Accounting Standards No.3, FASB, Stamford, CT.
Financial Accounting Standards Boards, 1977, FASB interpretation No. 18: Accounting for income taxes in interim periods, FASB, Stamford, CT.
Finger, C., 1994, The ability of earnings to predict future earnings and cash flow, journal of Accounting Research 32, 210-223.
Flavin, M., 1981, The adjustment of consumption to changing expectations about future income, Journal of Political Economy 89, 974-1009.
Foster, G., 1977, Quarterly accounting data: time-series properties and predictive-ability results, Accounting Review 52, 1-21.
Foster, G., Olsen, C., Shevlin, T., 1984, Earnings releases, anomalies and the behavior of security returns, The Accounting Review 59, 574-603.

127
Francis, J., Olsson, P., Oswald, D., 1997, Comparing the accuracy and explainability of dividends, cash flows, and abnormal earnings equity valuation models, working paper, University of Chicago.
Francis, J., Olsson, P., Oswald, D., 1998, Using mechanical earnings and residual income forecasts in equity valuation, working paper, University of Chicago.
Francis, J., Philbrick, D., Schipper, K., 1994, Shareholder litigation and corporate disclosures, Journal of Accounting Research 32, 137-164.
Frankel, R., Lee, C., 1998, Accounting valuation, market expectation, and cross-sectional stock returns, Journal of Accounting & Economics 25, 283-319.
Freeman, R., 1987, The association between accounting earnings and security returns for large and small firms, Journal of Accounting & Economics 9, 195-228.
Freeman, R., Ohlson, J., Penman, S., 1982, Book rate-of-return and prediction of earnings changes: an empirical investigation, Journal of Accounting Research 20, 639-653.
Freeman, R., Tse, S., 1989, The multiperiod information content of accounting earnings: confirmations and contradictions of previous earnings reports, Journal of Accounting Research 27, 49-84.
Freeman, R., Tse, S., 1992, A nonlinear model of security price responses to unexpected earnings, Journal of Accounting Research 30, 185-209.
French, K., Schwert, G., Stambaugh, R., 1987, Expected stock returns and stock market volatility, Journal of Financial Economics 19, 3-30.
Fried, D., Givoly, D., 1982, Financial analysts’ forecasts of earnings: a better surrogate for market expectations, Journal of Accounting & Economics 4, 85-107.
Friedlan, J., 1994, Accounting choices by issuers of initial public offerings, Contemporary Accounting Research 11, 1-31.
Friedman, M., 1953, The methodology of positive economics, Essays in Positive Economics, Chicago: University of Chicago Press, 1953, reprinted by Chicago: Phoenix Books, 1966.
Friedman, M., 1957, A Theory of the Consumption Function (Princeton, NJ: Princeton University Press).
Gebhardt, W., Lee, C., Swaminathan, B., 1999,Toward an implied cost of capital, working paper, Cornell university.
Gonedes, N., 1972, Efficient markets and external accounting, The Accounting Review 47, 11-21.
Gonedes, N., Dopuch, N., 1974, Capital market equilibrium, information production, and selecting accounting techniques: Theoretical framework and review of empirical work, Journal of Accounting Research Supplement 12, 48-130.
Gordon, J., Gordon, M., 1997, The finite horizon expected return model, Financial Analysts Journal, 52-61.

128
Gordon, M., 1962, The Investment, Financing, and Valuation of the Corporation, Richard D. Irwin, Inc., Homewood, Il.
Grant, E., 1980, Market implications of differential amounts of interim information, Journal of Accounting Research 18, 255-268.
Greene, W., 1993, Econometric Analysis, 2nd ed., Macmillan Publishing Company, New York, NY.
Greene, W., 1997, Econometric Analysis, 3rd ed., Prentice Hall, Upper Saddle River, New Jersey, NJ.
Greig, A., 1992, Fundamental analysis and subsequent stock returns, Journal of Accounting & Economics 15, 413-422.
Griffin, P., 1977, The time-series behavior of quarterly earnings: preliminary evidence, Journal of Accounting Research 15, 71-83.
Gu, Z., Wu, J., 2000, Earnings skewness and analyst forecast bias, working paper, University of Rochester.
Guay, W., Kothari, S., Watts, R., 1996, A market-based evaluation of discretionary accrual models, Journal of Accounting Research Supplement 34, 83-115.
Hall, R., 1978, Stochastic implications of the life cyc le--permanent income hypothesis: Theory and evidence, Journal of Political Economy 86, 971-86.
Hamilton, R., 1777, An introduction to Merchandize, Edinburgh.
Hand, J., 1990, A test of the extended functional fixation hypothesis, The Accounting Review 65, 740-763.
Hand, J., 1993, Resolving LIFO uncertainty: A theoretical and empirical examination of 1974-1975 LIFO adoptions and non-adoptions, Journal of Accounting Research 31, 21-49.
Hand, J., 1995, 1974 LIFO excess stock return and analyst forecast error anomalies revisited, Journal of Accounting Research 33, 175-191.
Hand, J., Landsman, W., 1998, Testing the Ohlson model: ν or not ν, that is the question, working paper, University of North Carolina.
Hansen, G., 1999, Do discretionary accrual proxies measure earnings management? Working paper, Pennsylvania State University.
Hansen, R., Sarin, A., 1996, Is honesty the best policy? An examination of security analyst forecast behavior around seasoned equity offerings, unpublished working paper, Santa Clara University.
Harris, M., Raviv, A., 1993, Differences of opinion make a horse race, Review of Financial Studies 6, 473-506.
Hayn, C., 1995, The information content of losses, Journal of Accounting & Economics 20, 125-153.
129
Hayn, C., Watts, R., 1997, The difference in fourth quarter earnings, working paper, University of Rochester.
Healy, P., 1985, The effect of bonus schemes on accounting decisions, Journal of Accounting & Economics 7, 85-107.
Healy, P., 1996, Discussion of “A market-based evaluation of discretionary accrual models,” Journal of Accounting Research Supplement 34, 107-115.
Healy, P., Myers, S., Howe, C., 1999, R&D accounting and the tradeoff between relevance and objectivity, working paper, Massachusetts Institute of Technology.
Healy, P., Palepu, K., 1988, Earnings information conveyed by dividend initiations and omissions, Journal of Financial Economics 21, 149-175.
Healy, P., Palepu, K., 1993, The effect of firms’ financial disclosure strategies on stock prices, Accounting Horizons 7, 1-11.
Healy, P., Palepu, K., 2001, A review of the voluntary disclosure literature, Journal of Accounting & Economics, this issue.
Hendriksen, E., 1965, Accounting Theory, Richard D. Irwin, Inc., Homewood, IL.
Holthausen, R., 1990, Accounting method choice: opprtunistic behavior, efficient contracting, and information perspectives, Journal of Accounting & Economics 12, 207-218.
Holthausen, R., 1994, Discussion of estimation and market valuation of environmental liabilities relating to superfund sites, Journal of Accounting Research 32, 211-219.
Holthausen, R., Larcker, D., 1992, The prediction of stock returns using financial statement information, Journal of Accounting & Economics 15, 373-411.
Holthausen, R., Leftwich, R., 1983, The economic consequences of accounting choice: Implications of costly contracting and monitoring, Journal of Accounting & Economics 5, 77-117.
Holthausen, R., Watts, R., 2001, The relevance of value relevance, Journal of Accounting & Economics, this issue.
Hong, H., Kaplan, R., Mandelker, G., 1978, Pooling vs. purchase: The effects of accounting for mergers on stock prices, The Accounting Review 53, 31-47.
Hong, H., Stein, J., 1999, A unified theory of underreaction, momentum trading, and overreaction in asset markets, Journal of Finance 54, 2143-2184.
Hopwood, W., McKeown, J., Newbold, P., 1982, The additional information content of quarterly earnings reports: intertemporal disaggregation, Journal of Accounting Research 20, 343-349.
Huberts, L., Fuller, R., 1995, Predictability bias in the U.S. equity market, Financial Analysts Journal 51, 12-28.
Huefner, R., Ketz, J., Largay, J., 1989, Foreign currency translation and the cash flow statement, Accounting Horizons 3, 66-75.

130
Hunton, J., McEwen, R., 1997, An assessment of the relation between analysts’ earnings forecasts accuracy, motivational incentive and cognitive information search strategy, The Accounting Review 72, 497-515.
Ibbotson Associates, Inc., 1999, Stocks, Bills, and Inflation, Yearbook, Chicago, IL.
Ibbotson, Associates, Inc., 1996, Cost-of-Capital Quarterly: 1996 Yearbook, Chicago, IL.
Imhoff, E., 1978, The representatives of management earnings forecasts, The Accounting Review 53, 836-850.
Imhoff, E., Jr., Paré, P., 1982, Analysis and comparison of earnings forecast agents, Journal of Accounting Research 20, 429-439.
Jacob, J., Lys, T., 1995, Determinants and implications of serial correlation in analysts’ earnings forecast errors, working paper, northwestern University.
Jacob, J., Lys, T., Neale, M., 2000, Expertise in forecasting performance of security analysts, Journal of Accounting & Economics, forthcoming.
Jacobson, R., Aaker, D., 1993, Myopic management behavior with efficient, but imperfect, financial markets: A comparison of information asymmetries in the U.S. and Japan, Journal of Accounting & Economics 16, 383-405.
Jaggi, B., 1978, A note on the information content of corporate annual earnings forecasts, The Accounting Review 53, 961-967.
Jegadeesh, N., Titman, S., 1993, Returns to buying winners and selling losers: Implications for stock market efficiency, Journal of Finance 48, 65-91.
Jennings, R., Robinson, J., Thompson II, R., Duvall, L., 1996, The relation between accounting goodwill numbers and equity values, Journal of Business Finance and Accounting 23, 513-534.
Jensen, M., 1986, The agency costs of free cash flows, corporate finance and takeovers, American Economic Review 76, 323-329.
Jensen, M., Meckling, W., 1976, Theory of the firm: Managerial behavior, agency costs and ownership structure, Journal of Financial Economics 3, 305-360.
Jiambalvo, J., 1996, Discussion of “Causes and consequences of earnings manipulation: An analysis of firms subject to enforcement actions by the SEC”, Contemporary Accounting Research 13, 37-47.
Jones, C. and R. Litzenberger, 1970, Quarterly earnings reports and intermediate stock price trends, Journal of Finance 25, 143-148.
Jones, J., 1991, Earnings management during import relief investigations, Journal of Accounting Research 29, 193-228.
Joy, O., Litzenberger, R., McEnally, R., 1977, The adjustment of stock prices to announcements of unanticipated changes in quarterly earnings, Journal of Accounting Research 15, 207-225.
131
Kandel, E., Pearson, N., 1995, Differential interpretation of public signals and trade in speculative markets, Journal of Political Economy 103, 831-872.
Kang, S., Sivaramakrishnan, K., 1995, Issues in testing earnings management and an instrumental variable approach, Journal of Accounting Research 33, 353-367.
Kaplan, R., 1985, Comments on: Evidence on “The effect of Bonus schemes on accounting procedure and accrual decisions”, Journal of Accounting & Economics 7, 109-113.
Kaplan, R., Roll, R., 1972, Investor evaluation of accounting information: Some empirical evidence, Journal of Business 45, 225-257.
Kaplan, S., Ruback, R., 1995, The valuation of cash flow forecasts: An empirical analysis, Journal of Finance 50, 1059-1093.
Kasznik, R., Lev, B., 1995, To warn or not to warn: Management disclosures in the face of an earnings surprise, The Accounting Review 70, 113-134.
Kasznik, R., McNichols, M., 1997,
Keim, D., Stambaugh, R., 1986, Predicting returns in stock and bond markets, Journal of Financial Economics 17, 357-390.
Kendall, M., 1954, Note on bias in the estimation of autocorrelation, Biometrika 41, 403-404.
Keynes, John Neville, 1891, The Scope and Method of Political Economy, Macmillan & Co., London.
Kim, M., Ritter, J., 1999, Valuing IPOs, Journal of Financial Economics 53, 409-437.
Kinney, W., Burgstahler, D., Martin, R., 1999, The materiality of earnings surprise, working paper, University of Texas at Austin.
Klein, A., 1990, A direct test of the cognitive bias theory of share price reversals, Journal of Accounting & Economics 13, 155-166.
Kormendi, R., LaHaye, L., 1986, Cross-regime tests of the permanent income hypothesis, working paper, University of Michigan.
Kormendi, R., Lipe, R., 1987, Earnings innovations, earnings persistence and stock returns, Journal of Business 60, 323-345.
Kothari, S., 1992, Price-earnings regressions in the presence of prices leading earnings: earnings level versus change specifications and alternative deflators, Journal of Accounting & Economics 15, 173-302.
Kothari, S., Laguerre, T., Leone, A., 1999, Capitalization versus expensing: Evidence on the uncertainty of future earnings from capital expenditures versus R&D outlays, working paper, Massachusetts Institute of Technology.
Kothari, S., Lys, T., Smith, C., Watts, R., 1988, Auditor liability and information disclosure, Journal of Accounting, Auditing, and Finance 3, 307-339.

132
Kothari, S., Sabino, J., Zach, T., 1999, Implications of data restrictions on performance measurement and tests of rational pricing, working paper, Massachusetts Institute of Technology.
Kothari, S., Shanken, J., 1992, Stock return variation and expected dividends, Journal of Financial Economics 31, 177-210.
Kothari, S., Shanken, J., 1997, Book-to-market, dividend yield, and expected market returns: A time-series analysis, Journal of Financial Economics 44, 169-203.
Kothari, S., Shanken, J., Sloan, R., 1995, Another look at the cross-section of expected returns, journal of Finance 50, 185-224.
Kothari, S., Sloan, R., 1992, Information in prices about future earnings: implications for earnings response coefficients, Journal of Accounting & Economics 15, 143-171.
Kothari, S., Warner, J., 1997, Measuring long-horizon security price performance, Journal of Financial Economics 43, 301-339.
Kothari, S., Wasley, C., 1989, Measuring security price performance in size-clustered samples, The Accounting Review 64, 228-249.
Kothari, S., Zimmerman, J., 1995, Price and return models, Journal of Accounting & Economics 20, 155-192.
Kraft, A., 1999, Accounting-based and market-based trading rules, working paper, University of Rochester.
Lakonishok, J., Shleifer, A., Vishny, R., 1994, Contrarian investment, extrapolation, and risk, Journal of Finance 49, 1541-1578.
Landsman, W., Magliolo, J., 1988, Cross-sectional capital market research and model specification, The Accounting Review 64, 586-604.
Landsman, W., Maydew, E., 1999, Beaver (1968) revisited: Has the information content of annual earnings announcements declined in the past three decades? Working paper, University of North Carolina.
Lang, M., 1991, Time-varying stock price response to earnings induced by uncertainty about the time-series process of earnings, Journal of Accounting research 29, 229-257.
LaPorta, R., 1996, Expectations and the cross-section of stock returns, Journal of Finance 51, 1715-1742.
Laster D., Bennett, P., Geoum, I., 1999, Rational bias in macroeconomic forecasts, Quarterly Journal of Economics 114, 293-318.
Lee, C., 1988, Inventory accounting and earnings/price ratios: A puzzle, Contemporary Accounting Research 26, 371-388.
Lee, C., 1992, Earnings news and small trades: An intraday analysis, Journal of Accounting & Economics 15, 265-302.
Lee, C., 1999, Accounting-based valuation: A commentary, Accounting Horizons 13, 413-425.
133
Lee, C., Myers, J., Swaminathan, B., 1999, What is the intrinsic value of the Dow? Journal of Finance 54, 1693-1741.
Lee, C., Swaminathan, B., 2000, Price momentum and trading volume, Journal of Finance, forthcoming.
LeRoy, S., 1989, Efficient capital markets and martingales, Journal of Economic Literature 27, 1583-1621.
Lev, B., 1974, On the association between operating leverage and risk, Journal of Financial and Quantitative Analysis, 627-641.
Lev, B., 1983, Some economic determinants of the time series properties of earnings, Journal of Accounting & Economics 5, 31-48.
Lev, B., 1989, On the usefulness of earnings and earnings research: lessons and directions from two decades of empirical research, Journal of Accounting Research 27, 153-201.
Lev, B., Ohlson, J., 1982, Market based empirical research in accounting: A review, interpretations, and extensions, Supplement to Journal of Accounting Research 20, 249-322.
Lev, B., Sougiannis, T., 1996, The capitalization, amortization, and value-relevance of R&D, Journal of Accounting & Economics 21, 107-138.
Lev, B., Thiagarajan, R., 1993, Fundamental information analysis, Journal of Accounting Research 31, 190-215.
Lev, B., Zarowin, P., 1999, The boundaries of financial reporting and how to extend them, Journal of Accounting Research 37, 353-385.
Lim, T., 1998, Are analysts’ forecasts optimistically biased?, working paper, Dartmouth University.
Lin, H., McNichols, M., 1998a, Underwriting relationships and analysts’ earnings forecasts and investment recommendations, Journal of Accounting & Economics 25, 101-127.
Lin, H., McNichols, M., 1998b, Analyst coverage of initial public offering firms, unpublished working paper, Stanford University.
Lindenberg, E., Ross, S., 1981, Tobin’s q and industrial organization, Journal of Business, 1-32.
Lintner, J., 1965, The valuation of risky assets and the selection of risky investments in stock portfolios and capital budgets, Review of Economics and Statistics 47, 13-37.
Lintner, J., Glauber, R., 1967, Higgledy piggledy growth in America? Seminar on the Analysis of Security Prices, Graduate School of Business, University of Chicago.
Lipe, R., 1986, The information contained in the components of earnings, Journal of Accounting Research 24, 37-64.
Lipe, R., 1990, The relation between stock returns and accounting earnings given alternative information, Accounting Review 65, 49-71.
Lipe, R., 2000, Review of research on lease accounting, working paper, University of Oklahoma.

134
Lipe, R., Kormendi, R., 1994, Mean reversion in annual earnings and its implications for security valuation, Review of Quantitative Finance and Accounting 4, 27-46.
Little, I., 1962, Higgledy Piggledy Growth, Institute of Statistics, (Oxford) 24.
Little, I., Rayner, A., 1966, Higgledy Piggledy Growth Again, A. M. Kelly, New York, NY.
Litzenberger, R., Joy, M., Jones, C., 1971, Ordinal predictions and the selection of common stocks, Journal of Financial and Quantitative Analysis 6, 1059-1068.
Liu, J., Nissim, D., Thomas, J., 2000, Equity valuation using multiples, working paper, Columbia University.
Liu, J., Thomas, J., 2000, Stock returns and accounting earnings, Journal of Accounting Research 38, 71-101.
Livnat, J., Zarowin, P., 1990, The incremental information content of cash-flow components, Journal of Accounting & Economics 13, 25-46.
Lo, A., MacKinlay, A., 1990, Data-snooping biases in tests of financial asset pricing models, Review of Financial Studies 3, 431-467.
Lo, K., Lys, T., 1999, The Ohlson model: Contributions to valuation theory, limitations, and empirical applications, Journal of Accounting, Auditing, and Finance forthcoming.
Loughran, T., Ritter, J., 2000, Uniformly least powerful tests of market efficiency, Journal of Financial Economics 55, 361-389.
Lundholm, R., 1995, A tutorial on the Ohlson and Feltham/Ohlson models: Answers to some frequently asked questions, Contemporary Accounting Research 11, 749-761.
Lundholm, R., O’Keefe, T., 2000, Reconciling value estimates from the discounted cash flow value model and the residual income model, working paper, University of Michigan Business School.
Lyon, J., Barber, B., Tsai, C., 1999, Improved methods for tests of long-run abnormal stock returns, Journal of Finance 54, 165-201.
Lys, T., Ramesh, K., Thiagarajan, R., 1998, The role of earnings levels vs. earnings changes in explaining stock returns: Implications from the time series properties of earnings, working paper, Northwestern University.
Lys, T., Sohn, S., 1990, The association between revisions of financial analysts’ earnings forecasts and security price changes, journal of Accounting & Economics 13, 341-363.
Lys, T., Vincent, L., 1995, An analysis of value destruction at AT&T’s acquisition of NCR, Journal of Financial Economics 39, 353-378.
MacKinlay, A., 1997, Event studies in economics and finance, Journal of Economic Literature 35, 13-39.
Maddala, G., 1988, Introduction to Econometrics, Macmillan Publishing Company, New York, NY.
Madden, B., 1998, CFROI Valuation: A Total System Approach to Valuing the Firm, Holt Value Associates, Chicago, IL.

135
Mandelker, G., Rhee, S., 1984, The impact of operating and financial leverage on systematic risk of common stocks, Journal of Financial and Quantitative Analysis, 45-47.
Marshall, A., 1890, Principles of Economics, The Macmillan Press Ltd, London, New York.
Matsumoto, D., 1998, Management’s incentives to influence analysts’ forecasts, working paper, Harvard Business School.
May, R., 1971, The influence of quarterly earnings announcements on investor decisions as reflected in common stock price changes, Journal of Accounting Research Supplement 9, 119-163.
McGraw, T., 1975, Regulation in America: A Review Article, Business History Review 49, 159-183.
McNichols, L., Wilson, P., 1988, Evidence of earnings management from the provision of bad debts, Journal of Accounting Research Supplement 26, 1-31.
McNichols, M., O’Brien, P., 1997, Self-selection and analysts coverage, Journal of Accounting Research 35, 167-199.
Mehra, R., Prescott, E., 1985, The equity premium: A puzzle, Journal of Mone tary Economics 15, 145-161.
Mendenhall, R., 1991, Evidence on the possible under-weighting of earnings-related information, Journal of Accounting Research 29, 170-179.
Michaely, R., Womack, K., 1999, Conflict of interest and the credibility of underwriter analyst recommendations, Review of Financial Studies 12, 653-686.
Mikhail, M., Walther, B., Willis, R., 1997, Do security analysts improve their performance with experience?, Journal of Accounting Research 35, 131-166.
Mikhail, M., Walther, B., Willis, R., 1999, Does forecast accuracy matter to security analysts? The Accounting Review 74, 185-200.
Miller, M., Modigliani, F., 1961, Dividend policy, growth, and the valuation of shares, Journal of Business 34, 411-432.
Miller, M., Rock, K., 1985, Dividend policy under asymmetric information, Journal of Finance 40, 1031-1051.
Mishkin, F., 1983, A rational expectations approach to macroeconometrics, National Bureau of Economic Research Monograph, Chicago, IL: The University of Chicago Press.
Mitchell, M., Stafford, E., 2000, Managerial decisions and long-term stock price performance, Journal of Business forthcoming.
Modigliani, F., Brumberg, R., 1954, Utility analysis and the consumption function, in K. Kurihara, ed., Post-Kenesian Economics (New Brunswick, NJ: Rutgers University Press).
Modigliani, F., Miller, M., 1958, The cost of capital, corporation finance, and the theory of investmentAmerican Economic Review 48, 261-297.
Molodovsky, N., 1953, A theory of price-earnings ratios, Financial Analys ts Journal 9, 65-80.

136
Moskowitz, T., Grinblatt, M., 1999, Do industries explain momentum? Journal of Finance 54, 1249-1290.
Murphy, K., Zimmerman, J., 1993, Financial performance surrounding CEO turnover, Journal of Accounting & Economics 16, 273-315.
Myers, J., 1999, Implementing residual income valuation with linear information dynamics, The Accounting Review 74, 1-28.
Myers, S., Majd, S., 1990, Abandonment value and project life, Advances in Futures and Options Research 4, 1-21.
Nathan, K., 1988, Do firms pay to pool? Some empirical evidence, Journal of Accounting and Public Policy 7, 185-200.
Nelson, K., 1996, Fair value accounting for commercial banks: An empirical analysis of SFAS No. 107, The Accounting Review 71, 161-182.
Nichols, D., Tsay, J., 1979, Security price reaction to long-range executive earnings forecasts, Journal of Accounting Research 17, 140-155.
Noe, C., 1999, Voluntary disclosures and insider transactions, Journal of Accounting & Economics 27, 305-326.
O’Brien, P., 1987, Individual forecasting ability, Managerial Finance, 3-9.
O’Brien, P., 1988, Analysts’ forecasts as earnings expectations, Journal of Accounting & Economics 10, 53-83.
O’Brien, P., 1990, Forecast accuracy of individual analysts in nine industries, Journal of Accounting Research 28, 286-304.
Ohlson, J., 1991, The theory of value and earnings and an introduction to the Ball-Brown analysis, Contemporary Accounting Research 7, 1-19.
Ohlson, J., 1995, Earnings, book values, and dividends in equity valuation, Contemporary Accounting Research 11, 661-687.
Ohlson, J., Penman, S., 1992, Disaggregated accounting data as explanatory variables for returns, Journal of Accounting, Auditing and Finance 7, 553-573.
Ohlson, J., Shroff, P., 1992, Changes versus levels in earnings as explanatory variables for returns: some theoretical considerations, Journal of Accounting Research 30, 210-226.
Olson, M., 1971, The Logic of Collective Action, Harvard University Press, Cambridge, Mass.
Ou, J., Penman, S., 1989a, Financial statement analysis and the prediction of stock returns, Journal of Accounting & Economics 11, 295-329.
Ou, J., Penman, S., 1989b, Accounting measurement, price-earnings ratios, and the information content of security prices, Journal of Accounting Research 27, 111-152.
Patell, J., 1976, Corporate forecasts of earnings per share and stock price behavior: Empirical tests, Journal of Accounting Research Autumn, 246-276.

137
Patell, J., 1979, The API and the design of experiments, Journal of Accounting Research 17, 528-549.
Patell, J., Kaplan, R., The information content of cash flow data relative to annual earnings: Preliminary tests, working paper, Stanford University.
Patell, J., Wolfson, M., 1984, The intraday speed of adjustment of stock prices to earnings and dividend announcements, Journal of Financial Economics 13, 223-252.
Peasnell, K., 1982, Some formal connections between economic values and yields, and accounting numbers, Journal of Business Finance and Accounting 9, 361-381.
Peltzman, S., 1976, Toward a more General Theory of Regulation, Journal of Law and Economics 19, 211-240.
Penman, S., 1980, An empirical investigation of the voluntary disclosure of corporate earnings forecasts, Journal of Accounting Research Spring 18, 132-160.
Penman, S., 1992, Return to fundamentals, Journal of Accounting, Auditing, and Finance.
Penman, S., 1996, The articulation of of price-earnings rations and market-to-book ratios and the evaluation of growth, Journal of Accounting Research 34, 235-259.
Penman, S., 1998, Combining earnings and book values in equity valuation, Contemporary Accounting Research 15, 291-324.
Penman, S., Sougiannis, T., 1997, The dividend displacement property and the substitution of anticipated earnings for dividends in equity valuation, The Accounting Review 72, 1-21.
Penman, S., Sougiannis, T., 1998, A comparison of dividend, cash flow, and earnings approaches to equity valuation, Contemporary Accounting Research 15, 343-383.
Penman, S., Zhang, X., 2000, Accounting conservatism, the quality of earnings, and stock returns, working paper, Columbia University.
Philbrick, D., Ricks, W., 1991, Using Value Line and IBES analyst forecasts in accounting research, Journal of Accounting Research 29, 397-417.
Pindyck, R., 1988, Irreversible investment, capacity choice, and the value of the firm, American Economic Review 78, 969-985.
Piotroski, J., 2000, Value investing: The use of historical financial statement information to separate winners from losers, Journal of Accounting Research, forthcoming.
Pontiff, J., Schall, L., 1998, Book-to-market ratios as predictors of market returns, Journal of Financial Economics 49, 141-160.
Porter, M., 1980, Competitive Strategy: Techniques for analyzing industries and competitors (Free Press, New York, NY.
Posner, R., 1974, Theories of Economic Regulation, Bell Journal of Economics and Management Science 5, 335-358.
Pourciau, S., 1993, Earnings management and non-routine executive changes, Journal of Accounting & Economics 16, 317-336.

138
Pownall, G., Wasley, C., Waymire, G., 1993, The stock price effects of alternative types of management earnings forecasts, The Accounting Review 68, 896-912.
Pownall, G., Waymire, G., 1989, Voluntary disclosure credibility and securities prices: Evidence from management earnings forecasts, 1969-1973, Journal of Accounting Research 27, 227-45.
Pratt, S., 1998, Cost of Capital, John Wiley & Sons, New York, NY.
Preinreich, G., 1938, Annual survey of income theory: The theory of depreciation, Economterica 6, 219-241.
Raedy, J., 1998, A reconciliation of stock market anomalies, working paper, University of North Carolina.
Rajan, R., Servaes, H., 1997, Analyst Following of Initial Public Offerings, Journal of Finance 52, 507-529.
Ramakrishnan, R., Thomas, R., 1992, What matters from the past: market value, book value, or earnings? Earnings valuation and sufficient statistics for prior information, Journal of Accounting, Auditing and Finance 7, 423-464.
Ramakrishnan, R., Thomas, R., 1998, Valuation of permanent, transitory, and price- irrelevant components of reported earnings, Journal of Accounting, Auditing, and Finance 13.
Ramesh, K., Thiagarajan, R., 1993, Estimating the permanent component of accounting earnings using the unobservable components model: Implications for price-earnings research, Journal of Accounting, Auditing, and Finance 8, 399-425.
Rangan, S., 1998, Earnings management and the performance of seasoned equity offerings, Journal of Financial Economics 50, 101-122.
Rangan, S., Sloan, R., 1998, Implications of the integral approach to quarterly reporting for the post-earnings announcement drift, The Accounting Review 73, 353-371.
Rao, G., 1989, The relation between stock returns and earnings: A study of newly-public firms, Ph.D thesis, University of Rochester.
Rappaport, A., 1981, Selecting strategies that create shareholder wealth, Harvard Business Review, 139-149.
Rau, P., Vermaelen, T., 1998, Glamour, value, and the post-acquisition performance of acquiring firms, Journal of Financial Economics 49, 223-253.
Rayburn, J., 1986, The association of operating cash flow and accruals with security returns, Journal of Accounting Research Supplement 24, 112-133.
Rendleman, R., Jones, C., Latané, H., 1987, Further insight into the standardized unexpected earnings anomaly: size and serial correlation effects, Financial Review 22, 131-144.
Revsine, L., Collins, D., Johnson, B., 1999, Financial Reporting & Analysis, Prentice Hall, Upper Saddle River, New Jersey 07458.

139
Richardson, P., Gordon, J., 1980, Measuring total manufacturing performance, Sloan Management Review 22, 47-58.
Richardson, S., Teoh, S., Wysocki, P., 1999, Tracking analysts’ forecasts over the annual earnings horizon: Are analysts’ forecasts optimistic or pessimistic? working paper, University of Michigan.
Ricks, W., 1982, The market response to LIFO adoptions, Journal of Accounting Research 20, 367-387.
Robichek, A., Van Horne, J., 1967, Abandonment value in capital budgeting, Journal of Finance 22, 577-590.
Robinson, J., Shane, P., 1990, Acquisition accounting method and bid premium for target firms, The Accounting Review 65, 25-48.
Roll, R., 1977, A critique of the asset pricing theory’s tests; Part I: On past and potential testability of the theory, Journal of Financial Economics 4, 129-176.
Roll, R., 1983, On computing mean returns and the small firm premium, journal of Financial Economics 12, 371-386.
Rosenberg, B., Reid, K., Lanstein, R., 1985, Persuasive evidence of market inefficiency, Journal of Portfolio Management 11, 9-17.
Ross, S., 1977, The determination of financial structure: The incentive signaling approach, Bell Journal of Economics 8, 23-40.
Rubinstein, M., 1976, The valuation of uncertain income streams and the principle of options, Bell Journal of Economics 7, 407-425.
Ryan, S., 1995, A model of accrual measurement with implications for the evolution of the book-to-market ratio, Journal of Accounting Research 29, 95-112.
Sabino, J., 1999, An empirical examination of the difference between GAAP and IBES earnings, working paper, MIT Sloan School of Management.
Salamon, G., Kopel, 1991, Accounting method related misspecification in cross-sectional capital markets research design, working paper, Indiana University.
Salamon, G., Stober, T., 1994, Cross-quarter differences in stock price responses to earnings announcements: Fourth-quarter and seasonality influences, Contemporary Accounting Research 11, 297-330.
Schipper, K., 1991, Commentary on analysts’ forecasts, Accounting Horizons 5, 105-121.
Schipper, K., Thompson, R., 1983, The impact of merger-related relationships on the shareholders of acquiring firms, Journal of Accounting Research 21, 184-221.
Scholes, M., Williams, J., 1977, Estimating betas from nonsynchronous data, Journal of Financial Economics 5, 309-327.
Schwert, G., 1981, Using financial data to measure effects of regulation, Journal of Law and Economics 24, 121-158.

140
Schwert, G., 1990, Stock returns and real activity: A century of evidence, Journal of Finance 45, 1237-1257.
Sefcik, S. Thompson, T., 1986, An approach to statistical inference in cross-sectional regression with security abnormal return as dependent variable, Journal of Accounting Research 24, 316-364.
Shackelford, D., Shevlin, T., 2001, Empirical tax research in accounting, Journal of Accounting & Economics, this issue.
Shanken, J., 1990, Intertemporal asset pricing: an empirical investigation, Journal of Econometrics 45, 99-120.
Sharpe, W., 1964, Capital asset prices: A theory of market equilibrium under conditions of risk, Journal of Finance 19, 425-442.
Shevlin, T., 1996, The value relevance of nonfinancial information: A discussion, Journal of Accounting & Economics 22, 31-42.
Shiller, R., 1981, Do stock prices move too much to be justified by subsequent changes in dividends? American Economic Review 71, 421-436.
Shleifer, A., Vishny, R., 1997, The limits of arbitrage, Journal of Finance 52, 35-55.
Shores, D., 1990, The association between interim information and security returns around earnings announcements, Journal of Accounting Research 28, 164-181.
Siegel, J., Thaler, R., 1997, The equity risk premium puzzle, Journal of Economic Perspectives 11, 191-200.
Sinha, P., Brown, L., Das, S., 1997, A re-examination of financial analysts’ differential earnings forecast accuracy, Contemporary Accounting Research 14, 1-42.
Skinner, D., 1994, Why firms voluntarily disclose bad news, Journal of Accounting Research 32, 38-60.
Skinner, D., 1996, Are disclosures about bank derivatives and employee stock options “value-relevant”? Journal of Accounting & Economics 22, 393-405.
Sloan, R., 1996, Do stock prices fully reflect information in accruals and cash flows about future earnings, The Accounting Review 71, 289-316.
Sloan, R., 1998, Discussion of “Evaluating non-GAAP performance measures in the REIT industry,” Review of Accounting Studies 3, 131-135.
Soffer, L., Lys, T., 1999, Post-earnings announcement drift and the dissemination of predictable information, Contemporary Accounting Research 16, 305-331.
Spence, A., 1977, Entry, capacity, investment, and oligopolistic pricing, Bell Journal of Economics 8, 534-544.
Spence, A., 1979, Investment strategy and growth in a new market, Bell Journal of Economics 10, 1-19.
Spence, A., 1981, The learning curve and competition, Bell Journal of Economics 12, 49-70.

141
Stewart, G., 1991, The Quest for Value, Harper-Collins, New York, NY.
Stickel, S., 1990, Predicting individual analyst earnings forecasts, Journal of Accounting Research 28, 409-417.
Stickel, S., 1992, Reputation and performance among security analysts, Journal of Finance 47, 1811-1836.
Stigler, G., 1971, The Theory of Economic Regulation, The Bell Journal of Economics and Management Science 2, 3-21.
Stober, T., 1992, Summary financial statement measures and analysts’ forecasts of earnings, Journal of Accounting & Economics 15, 347-372.
Subramanyam, K., 1996a, Uncertain precision and price reaction to information, The Accounting Review 71, 207-220.
Subramanyam, K., 1996b, The pricing of discretionary accruals, Journal of Accounting & Economics 22, 249-281.
Sunder, S., 1973, Relationship between accounting changes and stock prices: Problems of measurement and some empirical evidence, Journal of Accounting Research Supplement 11, 1-45.
Sunder, S., 1975, Stock price and risk related to announcing changes in inventory valuation, The Accounting Review 50, 305-315.
Sunder, S., 1999, Discussion of ‘Analysis of the impact of accounting accruals on earnings uncertainty and response coefficients,’ Journal of Accounting, Auditing, and Finance forthcoming.
Teets, W., Wasley, C., 1996, Estimating earnings response coefficients: Pooled versus firm-specific models, Journal of Accounting & Economics 21, 279-296.
Teoh, S., Welch, I., Wong, T., 1998a, Earnings management and the long-run underperformance of seasoned equity offerings, Journal of Financial Economics 50, 63-100.
Teoh, S., Welch, I., Wong, T., 1998b, Earnings management and the long-run underperformance of initial public offerings, Journal of Finance 53, 1935-1974.
Teoh, S., Wong, T., 1993, Perceived auditor quality and the earnings response coefficient, The Accounting Review 68, 346-367.
Teoh, S., Wong, T., 1999, Analysts’ credulity about reported earnings and overoptimism in new equity issues, Review of Financial Studies, forthcoming.
Teoh, S., Wong, T., Rao, G., 1998, Are accruals during initial public offerings opportunistic? Review of Accounting Studies 3, 175-208.
Thomadakis, S., 1976, A model of market power, valuation and the firm’s returns, Bell Journal of Economics, 150-162.
Thomas, J., 1999, Discussion of “Post-earnings announcement drift and the dissemination of predictable information,” Contemporary Accounting Research 16, 333-340.

142
Thomas, J., Zhang, X., 1999, Identifying unexpected accruals : a comparison of current approaches, working paper, Columbia University.
Thomas, W., 1999, A test of the market’s (mis)pricing of domestic and foreign earnings, working paper, University of Utah.
Trigeorgis, L., 1993, The nature of option interactions and the valuation of investments with multiple real options, Journal of Financial and Quantitative Analysis 28, No.1, 1-21.
Trigeorgis, L., 1996, Real Options: Managerial Flexibility and Strategy in Resource Allocation, The MIT Press, Cambridge, MA.
Trueman, B, 1994, Analyst forecasts and herding behavior, The Review of Financial Studies 7, 97-124.
Tversky, A., Kahneman, D., 1984, Judgement under uncertainty: heuristic and biases, Science 185, 1124-1131.
Utama, S., Cready W., 1997, Institutional ownership, differential predisclosure precision and trading volume at announcement dates, Journal of Accounting & Economics 24, 129-150.
Verrecchia, R., 1998, Discussion of accrual accounting and equity valuation, Journal of Accounting Research Supplement 36, 113-115.
Verrecchia, R., 2001, Essays on disclosure, Journal of Accounting & Economics, this issue.
Vincent, L., 1997, Equity valuation implications of purchase versus pooling accounting, The Journal of Financial Statement Analysis, 5-19.
Vincent, L., 1999, The information content of funds from operations (FFO) for real estate investment trusts (REITs), Journal of Accounting & Economics 26, 69-104.
Voung, Q., 1989, Likelihood ratio tests for model selection and non-nested hypotheses, Econometrica 57, 307-333.
Wahlen, J., 1994, The nature of information in commercial bank loan loss disclosures, The Accounting Review 69, 455-478.
Walther, B., 1997, Investor sophistication and market earnings expectations, journal of Accounting Research 35, 157-192.
Warfield, T., Wild, J., 1992, Accounting recognition and the relevance of earnings as an explanatory variable for returns, Accounting Review 67, 821-842.
Warfield, T., Wild, J., Wild, K., 1995, Managerial ownership, accounting choices, and informativeness of earnings, Journal of Accounting & Economics 20, 61-91
Watts, R., 1970, The time series of accounting earnings: Appendix A to “The information content of dividends,” Ph.D. Dissertation, University of Chicago.
Watts, R., 1975, The time-series behavior of quarterly earnings, Working paper (University of Newcastle).
Watts, R., 1978, Systematic abnormal returns after quarterly earnings announcements, Journal of Financial Economics 6, 127-150.

143
Watts, R., 1992, Accounting choice theory and market-based research in accounting, British Accounting Review 24, 235-267.
Watts, R., Leftwich, R., 1977, The time-series of annual accounting earnings, Journal of Accounting Research 15, 253-271.
Watts, R., Zimmerman, J., 1978, Towards a positive theory of the determination of accounting standards, The Accounting Review 53, 112-134.
Watts, R., Zimmerman, J., 1979, The demand for and supply of accounting theories: the market for excuses, The Accounting Review 54, 273-305.
Watts, R., Zimmerman, J., 1983, Agency problems, auditing and the theory of the firm: Some evidence, Journal of Law and Economics 26, 613-634.
Watts, R., Zimmerman, J., 1986, Positive Accounting Theory, Prentice Hall, Englewood Cliffs, NJ.
Watts, R., Zimmerman, J., 1990, Positive accounting theory: A ten-year perspective, The Accounting Review 65, 131-156.
Waymire, G., 1984, Additional Evidence on the Information Content of Management Earnings Forecasts, Journal of Accounting Research Autumn, 703-718.
Wernerfelt, B., 1985, The dynamics of prices and market shares over the product life cycle, Management Science 31, 928-939.
White, H., 1980, A heteroskedasticity consistent covariance matrix estimator and a direct test for heteroskedasticity, Econometrica 48, 817-838.
Williams, J., 1938, The Theory of Investment Value, Harvard University Press, Cambridge, MA.
Wilson, P., 1986, The relative information content of accruals and cash flows: Combined evidence at the earnings announcement and annual report release date, Journal of Accounting Research Supplement 24, 165-200.
Wilson, P., 1987, The incremental information content of the accrual and funds components of earnings after controlling for earnings, The Accounting Review 62, 293-322.
Wysocki, 1999, Real options and the informativeness of segment disclosures, working paper, University of Michigan.
Xie, H., 1997, Are discretionary accruals mispriced? A reexamination, University of Iowa working paper.
Zhang, H., 2000, How rational is the stock market towards properties of analyst consensus forecasts? Working paper, University of Illinois at Chicago.

144
Figure 1
Returns regressed on current and future earnings: Rt = a + b Xt + c Xt+1 + et
Earnings measurement
Return measurement
Expanded return-earnings measurement window: Rt + Rt+1 = a + b (Xt + Xt+1) + et, t+1
Earnings measurement Return measurement
Include leading period returns: Rt + Rt-1 = a + b Xt + et-1,t
Earnings measurement Return measurement
Include future earnings and future returns: Rt = a + b Xt + c Xt+1 + d Rt+1 + e t
Earnings measurement Return measurement,
independent variable Return measurement,
dependent variable