hrm - cipmlk.orgthe impact of job satisfaction on turnover intention of operational level employees:...
TRANSCRIPT

Institute of Personnel Management Sri Lanka (Inc.)(Incorporated by an Act of Parliament No. 24 of 1976)
HR HOUSE, No.43, Vijaya Kumaranathunga Mawatha, Narahenpita, Colombo 05.Tel: 011 2199988, 011 2819988 Fax: 011 2819988 Web: www.ipmlk.org
ISSN 2513-2733
9 772513 273004
Insights on Human Resource Management Practices
HRMPERSPECTIVES
Committee for Research & Publication
Issue 02 I December 2017
• Continuing Professional Development of Academics in Sri Lankan National Universities
• Generations and Work Related Factors of Executives: Evidence From Five Leading Commercial Banks in Sri Lanka
• Dexterity and Performance of Sewing Machine Operators: In Case of A Garment Factory Situated in Katunayake Industrial Processing Zone, Sri Lanka
• Impact of Training Practices on Development of Public Sector Employees’ Skills and Knowledge: A Study Based on Executive Grade Employees of the Parliament of Sri Lanka
• Work-Life Balance of the Female Academics of Private Higher Education Institutes, Sri Lanka
• Organizational Culture and Employee Retention: A Case Study of a Beverage Company in Sri Lanka
• Big Five Personality Traits and Job Performance
• Impact of Organizational Culture on Innovation in Information Technology Industry
• The Impact of Job Satisfaction on Turnover Intention of Operational Level Employees: A Case Study of a Garment Factory in Sri Lanka
• Job Stress and Employee Turnover Intention at D. G. Fashion Garment (Pvt) Ltd
JOURNAL TOPICS
HRM PERSPECTIVES Insights on Human Resource Management Practices
Institute of Personnel Management Sri Lanka (Inc.)
(Incorporated by an Act of Parliament No. 24 of 1976)
HR HOUSE, No. 43, Vijaya Kumaranathunga Mawatha, Colombo 05.
Tel: 011 2199988 / Fax: 011 2199939 / Web: www.ipmlk.org

ii

iii
Editor-in-Chief
Prof. Prasadini Gamage, Professor in HRM, Department of HRM, Faculty of
Commerce & management Studies, University of Kelaniya, Sri Lanka
Advisory Board
Dr. Neil Bogahalanda, Chairman of the Research & Publication Committee, Institute
of Personnel Management Sri Lanka Inc.
Dr. Jayantha Pathiratne, HR Consultant, Member of the Research & Publication
Committee, Institute of Personnel Management Sri Lanka Inc.
Editorial Board
Prof. Arosha Adikaram, Professor in HRM, Department of HRM , Faculty of
Management & Finance, University of Colombo, Sri Lanka
Dr. Chandana Jayawardena, Senior Lecturer, Department of Agri Extension,
Faculty of Agriculture, University of Peradeniya
Dr. T.L Sajeevanie, Senior Lecturer, Department of HRM, Faculty of Management
Studies & Commerce, University of Sri Jayewardenepura, Sri Lanka
Dr. Susantha Udagedara, Senior Lecturer, Salford Business School, University of
Salford, United Kingdom
Dr. Richard Wickramaratne, Senior Lecturer, Department of HRM, Faculty of
Management, University of Peradeniya, Sri Lanka
Dr. Duminda Kuruppuarachchie, Senior Lecturer, Department of Decision Science,
Faculty of Management Studies & Commerce, University of Sri Jayewardenepura, Sri
Lanka
Dr. Gayani Hewagama, Senior Lecturer, Northtec College, Northland, New Zealand
Dr. Jayantha Pathiratne, HR Consultant, Member of the Research & Publication
Committee, Institute of Personnel Management Sri Lanka Inc.

iv
Coordination
Mr. Chandima Pinsiri, Senior Manager, Research & Publication Committee of IPM
Formatting
Mr. Indika Kaluarachchie, Senior Lecturer, Division of Management Studies,
University College of Matara, Sri Lanka
Layout
Ms. Sewwandi Kumarapperuma, Junior Executive Graphic Designing of IPM
HRM Perspectives is a peer reviewed journal published by Institute of Personnel
Management of Sri Lanka. It is published bi –annually. The prime aim of the journal
is to promote research in human resource management in Sri Lanka and south
Asian region.

v
ISSN 2513-2733
June 2014
The content and the opinions expressed in the papers of this journal are
those of the author(s) and do not express the opinions by the editors or
editor-in-chief and of Institute of Personnel Management (IPM) Sri
Lanka.
Institute of Personnel Management Sri Lanka (Inc.)
(Incorporated by an Act of Parliament No. 24 of 1976)
HR HOUSE,
No.43, Vijaya Kumaranathunga Mawatha, Narahenpita,
Colombo 05.

vi

vii
Contents
Editorial
Research Papers
Continuing Professional Development of Academics in Sri Lankan National
Universities
- Prabhashini Wijewantha … 01
Generations and Work Related Factors of Executives: Evidence From Five
Leading Commercial Banks in Sri Lanka
- Dilrukshi Rajapaksha & Prasadini Gamage … 15
Dexterity and Performance of Sewing Machine Operators: In Case of A Garment
Factory Situated in Katunayake Industrial Processing Zone, Sri Lanka
- Indika Priyantha Kaluarachchi … 43
Impact of Training Practices on Development of Public Sector Employees’ Skills
and Knowledge: A Study Based on Executive Grade Employees of the
Parliament of Sri Lanka
- K. Jayeratne & T. L. Sajeevanie … 57
Work-Life Balance of the Female Academics of Private Higher Education
Institutes, Sri Lanka
- H.K.G.N.D. Samarakoon & K.K.K. Sylva … 81
Organizational Culture and Employee Retention: A Case Study of a Beverage
Company in Sri Lanka.
- W.A. Mahikala Niranga & K. Kajendra … 109
Big Five Personality Traits and Job Performance
- Dilini De Silva & Prasadini Gamage … 129
Impact of Organizational Culture on Innovation in Information Technology
Industry
- N.P.T. Madhubashinie & Suneth Hitihamu … 151

viii
The Impact of Job Satisfaction on Turnover Intention of Operational Level
Employees: A Case Study of a Garment Factory in Sri Lanka
- Ravindi Navoda Gamage & Janitha Mandawala … 181
Job Stress and Employee Turnover Intention at D. G. Fashion Garment (Pvt) Ltd
- P. K. H. Randima & T. S. A. Samsudeen … 209

ix
Editorial
Editorial Desk
You are holding the second issue of 2017 of the “HRM Perspectives”
Journal published by the Research and Publication Committee of the
Institute of Personnel Management Sri Lanka Inc. It gives me immense
pleasure in writing this message as the Editor –in- Chief.
Management thoughts are growing exponentially in this globalized
business environment. While appreciating the past success of ‘HRM
Perspectives’ we would also recognize that today's accelerating pace of
change is putting pressure on our organizations to be at the forefront of
HR management thinking since every organization runs with people.
HRM Perspectives is a peer-reviewed bi-annual journal that provides a
platform to researchers, academicians, professionals, and students in all
areas of Human Resource Management to share research achievements,
their perspectives, and practical experiences. This issue of HRM
Perspectives journal throws light on the various areas of Human
Resource Management and showcases total number of ten papers
consisting of two research articles, six case studies, one concept paper
and one literature survey.
Moreover we have given an opportunity for our own students and
members of the IPM to use this journal as a platform to publish their
own research findings. We are glad to say both members and the
students made 60% contribution to the journal this time. And also the
contributors of the journal this time are combination of both academics
and HR professionals from the industry. The changes made with regard
to the appearance and the contents and composition of the journal from
this year has been appreciated by many of our members. Our efforts
will continue to explore broader horizons of knowledge and for that we
want the cooperation from all of you by submitting your scientific
papers online.

x
As Editor of “HRM Perspectives” I anticipate that this issue would be
of immense value and will be definitely useful to both HR
Professionals and academics in their practice or thinking process. This
collection will also offer a window for new perspectives and directions
in the area of HRM the readers’ mind for long. To achieve progress and
to meet objectives we have to cross numerous milestones.
We request researchers who are associated with research on Human
Resource Management to contribute research articles in the form of
original research, case reports, and reviews for consideration of
publication in the next volume of the HRM Perspectives in June 2018.
We welcome any suggestions for improvement in the Journal.
Wish you happy reading!
Yours sincerely
Prof. Prasadini Gamage
Editor –in-Chief

-1- HRM Perspectives – December, 2017
CONTINUING PROFESSIONAL DEVELOPMENT OF
ACADEMICS IN SRI LANKAN NATIONAL
UNIVERSITIES
Prabhashini Wijewantha - MBA, AMIPM
Senior Lecturer
Department of Human Resource Management
Faculty of Commerce and Management Studies,
University of Kelaniya, Sri Lanka.
ABSTRACT
The teaching and learning processes in the Higher Education (HE)
sector are changing rapidly with the chronological evolutions in the
field. Consequently, the focus on CPD of academics is gaining
attention of the human capital development projects in HE world over.
However, so far only a limited amount of studies has been undertaken
in the world, in this upcoming research area. Considering this void in
literature, this paper reports the results of a survey conducted with the
aim of ascertaining the sources used by academics for their CPD. Data
was collected from academics in Management and Arts disciplines
(n=102), selected based on convenience to access; and the responses
indicated that CPD can be achieved through a wide array of sources.
According to the findings, the most common source of CPD is the
quality time spent with senior or parallel colleagues engaging in
formal and informal intellectual discussions or debates. However, it
was perceived by many that the main barrier for CPD is, the low time
available to engage in the same due to ceremonial and administrative
activities popularizing in universities these days, and organizational
politics. This finding contradicts with literature coming from the West,
where the main barrier for CPD, is the demand for greater focus on
research. Thus, it could be stated that both the Higher Education
Institutions (HEIs) and the academics need to pay attention on creating

-2- HRM Perspectives – December, 2017
synergies on both formal and informal sources of CPD, rather than
depending on only one source. Finally, the most important conclusion
of the study is that, it is much needed to inculcate the insight, that CPD
should be part and partial of the life of an academic rather than
focussing on it, only during one stage of the career.
Keywords: Academics, Continuous Professional Development (CPD),
Higher Education Institutes (HEIs), Sources and Barriers
Introduction
Continuing Professional Development (CPD) is gradually gaining a
position in the agenda of priorities in the higher education system of Sri
Lanka at present, compared to European countries where CPD is a
higher-ranking item in the priority agenda of the HE system (Chatterton
& Goddard, 2000). Alongside, the Ministry of Higher Education
(MoHE), the University Grants Commission (UGC), and the Quality
Assurance and Accreditation (QAA) Council of the UGC are
extensively engaged in developing the quality of the teaching and
learning process in Sri Lankan universities, within which CPD is
progressively gaining momentum. These policy efforts at State and
institutional levels need to be further streamlined for Sri Lanka to be in
par with the Western countries such as the United Kingdom (UK),
Australia, New Zealand, United States of America (USA), and Nordic
countries etc. (Wood et al., 2011). Furthermore, the number of action
level or implementation level activities taking place in Sri Lanka to
promote CPD are gradually increasing and the National Forum on
Continuing Professional Development (NFCPD) -2017, where the
Abstract of this paper was presented is one such initiative
(http://conf.kln.ac.lk/nfcpd/).
In my opinion, despite the importance of focusing on the area of CPD
in Higher Education, only a very limited number of research studies are
undertaken in Sri Lanka in this area (e.g., Karunaratne, Chandratilake,
& Wijayaweera, 2015; Kulathunga, Marasinghe, Karunathilake, &
-3- HRM Perspectives – December, 2017
Dissanayake, 2013) and thus there is a timely need for deeper
exploration in this area. Accordingly, this paper attempts to contribute
by some extent, by presenting the results of a survey conducted to
ascertain the nature of CPD sources used by academics in higher
education in Sri Lanka. The main objective of this small-scale survey is
to look at the CPD experiences of Sri Lankan state university
academics from the Social Sciences disciplines and to identify the most
widely used and most effective sources of CPD for them. The study
provides a better understanding of what CPD activities, academics are
currently engaged in for the purpose of developing their teaching and
research practices.
What is CPD in Higher Education? And Sources for CPD in Higher
Education
The general understanding among the academia and the HEIs on CPD
is, it is some form of training undergone by the academics for the
purpose of their career development. Formally, it can be defined as “the
maintenance and enhancement of knowledge, expertise, and
competence of professionals throughout their careers to a plan
formulated with regard to the needs of the professional, the employer,
the profession, and the society” (Madden & Mitchell, 1993).
In Sri Lanka, this offering of formal training and development for
academics in State Universities is largely handled by the Staff
Development Centres established in those universities under the
guidance and control of the university administration and the
University Grants Commission (UGC). However, after completing the
staff development certification, it is very rare that the academics
participate in any other formal course on the areas of teaching, learning,
and research other than the 1-2-day workshops/seminars that they
participate on a voluntary basis or upon nomination.
These formal workshops appear to be the dominant form of the CPD
world over (King, 2004), though the effectiveness of these programmes
and the transfer of training is in a questionable state. Though it is
believed that this kind of formal training sessions or courses are the

-4- HRM Perspectives – December, 2017
most popular methods of CPD for academia, literature (e.g., Becher,
1996; King, 2004) indicates that this is not the most appropriate source
of CPD for the academia. Actually CPD would take many forms
(Ferman, 2002), such as, short and long term courses, discussions with
colleagues, student feedback and peer observation reviews,
participation and presenting papers and posters in conferences,
attending workshops/lectures, and seminars on improvement of
teaching practice, networking and interacting with renowned scholars
locally and internationally, consultations and networking with experts
in the practitioner community, engaging in empirical research on the
area of CPD, learnings through the preparations for teaching and the
teaching process itself, being mentored under a professionally qualified
mentor, professional reading, engaging in postgraduate teaching and
research supervision (Masters and Doctor of Philosophy programmes),
and participating in exchange programmes etc.
The above sources indicate that the society needs to be aware of the
wide array of sources available for CPD, beyond formal initiatives and
that those informal sources play a crucial role in one’s development
based on each individual academic’s learning style (Grace, 2001).
According to Baume and Yorke (2002), the academics need to first
understand their preferred method out of the variety of CPD sources
available and then choose the suitable developmental avenue.
Furthermore, these sources indicate that there are a lot of low cost
sources of CPD (e.g., strong networks and interactions with leading
academics both locally and internationally, peer observation, reflective
journaling) that the HEIs had not been paying much attention or have
not successfully implemented.
The main reasons for the low motivation and lack of interest in the
society on CPD is the lack of understanding of the society about the
benefits that it would produce. The major advantage of engaging in
CPD for academics is that they would enhance the teaching practice
and develop the complete academic role and it would lead to an
improved reputation for them. Actually, the CPD activities should
-5- HRM Perspectives – December, 2017
cover not only the teaching role of an academic, but also all the
elements of the academic role including research and administration.
Serious consideration about the field of higher education, the state
university system, and CPD has become pivotal today, with the
challenges and threats faced by the education industry world over,
especially including developing countries like Sri Lanka. Considering
the literature, the challenges which have been recognized world over
and also applicable to Sri Lanka in the area of CPD are, low focus of
academics on CPD upon completion of the formally required basic
postgraduate qualification and getting confirmed in the post, though the
literature on higher education and best practices of research emphasises
on collaboration, the academics of Sri Lankan state universities do not
effectively engage in the same practice. If done effectively
collaboration can be utilized in a wide spectrum of activities such as
curriculum development, peer review, networking, research and so on
and so forth. Another point that needs to be paid attention on
collaboration is that it can happen with a number of parties such as
colleagues from the same department, colleagues from the same
faculty, colleagues from the same discipline, colleagues from across
disciplines, and across institutions etc. It can also be expanded to
national, regional, and international levels (Wareing, 2004), and low
emphasis paid by certain academics to ensure that the subject contents
delivered are up-to-date despite the requirements of HEIs to conduct
curriculum revisions once in every 3-4 years.
Considering these passive interests on CPD despite its benefits, this
study aimed at conducting a survey on CPD experiences of state
university academics and the following section discusses the process of
designing the survey.
Survey Design
This is a very small-scale study which looked at the sources of CPD
used by academics in Social Sciences (Management and Arts

-6- HRM Perspectives – December, 2017
disciplines) in 08 state universities in Sri Lanka. The Social Sciences
discipline was chosen for this study since my own discipline, Business
Management and Administration also belongs there. Furthermore, this
is a widely popular subject area and 99% of the state universities have
separate faculty/faculties offering Social Sciences subjects and as a
result a large number of academics can be conveniently accessed for
the purpose of data collection for the study. Even though Social
Sciences stream involves well established traditional subject areas,
there are lots of concerns today in the job market about the output
produced by state universities specializing in Social Science subjects as
they lack soft and job driven skills to gain suitable employment. Hence,
there is a lot of interest among both the academics and the government
to develop and improve the teaching-learning processes in these
disciplines by focusing on CPD of academics in those areas. The
ultimate expectation here is that through these CPD initiatives
academics will improve the learning environments and develop
creativity and innovative thinking in their graduate outputs.
The survey questionnaire was sent to academics mainly through an
email in the form of a Google Form. The questionnaire contained a list
of different CPD activities which are presented in the Table 1 in the
next section. The respondents were required to mark the CPD activities
that they engaged in during the period of last 03 years. In addition, they
were also asked to mark the main barriers for engaging in CPD among
a list of common barriers and to explain it further in an open-ended
question. The Table 2 in the next section presents the results marked by
respondents on the ‘main barrier’ item. The questionnaire also included
a section on personal details at the end of the questionnaire for the
purpose of collecting demographic data about the respondents.
Data collected were analysed using descriptive statistics mainly
including frequencies and percentage calculations. Summarized results
of the survey are reported in the next section.

-7- HRM Perspectives – December, 2017
Reporting Survey Data
Out of the 112 responses received, 102 responses were in usable state,
and they indicated that CPD can be achieved through a wide array of
sources, some of which are not in the limelight of the discussion.
Findings indicate that the most common source of CPD is, the quality
time spent with senior or parallel colleagues engaging in formal and
informal intellectual discussions or debates.
The majority of respondents perceived, the low time available to
engage in intellectual discussions or debates due to ceremonial and
administrative activities popularizing in universities and organizational
politics as the main barrier for CPD. The respondents had identified
these ceremonial and administrative activities as ‘other activities
prioritized by the university administration’. However, it exemplified
from the responses to the open-ended question on barriers that the
nature of these other priorities seems to change according to the culture
of the university, where certain universities give more priority to
research and publications in contrast to the HEIs which focus on
ceremonies, events, and teaching- learning processes etc. Furthermore,
under the additional comments related to the unavailability of support
response, few respondents had indicated the inefficiency of the
promotional schemes of academics in SL, where the teaching related
activities undertaken by the academics except for the number of hours
are very rarely applauded. Due to this reason, it can be observed that
there is a low regard among the academics about improving their
quality of teaching and thus, they do not strive to improve the same.

-8- HRM Perspectives – December, 2017
Table 1 – Sources of CPD used by Academics
Source of CPD Activity Percentage
Quality time spent with senior/parallel colleagues
engaging in formal/informal intellectual
discussions/debates
89
Networking with renowned academics locally and
internationally
73
Reading books/journal articles and other material (e.g.,
web based sources) on teaching and learning
55
Participating in teaching and learning
workshops/lectures
52
Following formal short/long term courses on teaching
and learning (excluding the compulsory staff
development course)
20
Participation in a teaching and learning conference
(locally/internationally)
17
Engaging in research work on teaching and learning 35
Consultations and networking with experts in the
practitioner community
42
Obtaining student feedback and adjusting in response to
them
30
Using reflective journaling to record teaching–learning
experiences
00
Peer observation/peer review 38

-9- HRM Perspectives – December, 2017
Table 2 – Barriers for engaging in CPD
Barrier Response
Percentage
Lack of time 83
Emphasis to engage in research 35
Lack of financial support/funding 75
No interest 32
Unavailability of support 59
Another issue that was inferred through the responses was the lack of
enthusiasm among the academics to utilize informal sources of CPD,
rather than blaming and criticizing for lack of financial support and
administrative encouragement. This was mainly associated with their
misconceptions regarding the definition of CPD and the unawareness
about informal sources of CPD.
However, despite the other priorities and barriers, the results indicate
that a large number of the state university academics are aware about
the importance of improving their teaching and related academic
practices. But the pathetic situation is that there are also a significant
number of academics who were neither involved nor enthusiastic about
improving their teaching practice.
Discussion of Findings
Most of the prior research that has been undertaken in CPD comes from
Western countries, in the form of in-depth qualitative studies (e.g.,
Ferman, 2002) and some of the findings of this survey are in line with
those while some completely differ. Comparing the Sri Lankan context
with the foreign teaching environments the academics are exposed to, it

-10- HRM Perspectives – December, 2017
is obvious that there are lots of development opportunities available for
the academics of developed countries compared to the limited number
of opportunities available to Sri Lankans (Lueddeke, 2003). The
findings indicate that the barriers for CPD in Sri Lankan and Western
contexts are largely different, where, the main barrier for CPD in UK is
identified as lack of time or the need to focus on research in most
institutions (King, 2004).
Directions for the Future Studies/ Surveys
One of the major limitations of this study is that it has only collected
data from academics in state universities in Sri Lanka. But there are so
many semi-governmental and private degree and postgraduate
qualification awarding institutes and professional bodies that award
certain professional qualifications, which need to be studied, to
understand what are the CPD sources adopted by the lecturers of those
institutes and the organizations. It would provide very enlightening
insights as some of these organizations may be utilizing very advanced
CPD techniques due to their affiliation with foreign professional bodies
and esteemed foreign universities.
Apart from that, this study is only limited to a sample from the Social
Science faculties, and the future studies need to consider more mixed
disciplinary groups or try to specifically identify the specialized CPD
techniques adopted by academics from specialized disciplines such as
law, medicine, engineering, architecture etc. Such an initiative would
also increase the representativeness of the sample and increase the
generalizability of the study.
The scope of the CPD studies can also be broadened by including
samples of school teachers in addition to limiting the focus only to
HEIs. It will enable to ascertain different sources of CPD undertaken to
develop teaching practices among school teachers.

-11- HRM Perspectives – December, 2017
Conclusions and Recommendations
By collating the findings of this small-scale survey with other similar
studies (Eraut, 1994; Johnston, 1998), the following broad guidelines/
recommendations can be proposed to the HEIs and the academia.
1. Increase collaboration and communication between academic
staff of cross disciplines and the corporate.
2. Involve the professional organizations and associations in the
educational development activities of HEs going beyond the
Industry-University cells.
3. Develop a policy framework incorporating financial provisions
for rewarding excellent teaching and engagement in CPD.
4. Improve provisions in the promotional schemes of academia to
incorporate a mandatory requirement and points for engaging in
CPD.
5. Formally implement and regulate the use of mechanisms for
improving teaching and learning such as peer review and peer
observation.
6. A formal CPD training needs analysis has to be conducted
before an academic is directed for such training to address the
real requirements of career development of the academics.
7. Value the formal and informal activities of CPD engaged by
academics and further motivate them to continuously engage in
those activities.
8. Pay attention on creating synergies on both formal and informal
sources of CPD, rather than depending on only one source.
9. Focus on sources of CPD in the areas of both teaching and
research and create a culture where CPD for both teaching and
research are equally valued, emphasized, and rewarded.
10. Improve widened communication systems/networks engaging
cross disciplinary academics from across institutions which
create platforms that enable them to share their teaching
practices and other activities.
11. Establish professional standards for teaching and research in
higher education in a more formal manner.

-12- HRM Perspectives – December, 2017
In conclusion, it is suggested that it is very important to inculcate the
attitude that CPD should be part and partial of the professional life of
an academic rather than focussing on it, only during one stage of the
career. This means that professional development should be evidenced
throughout the career of every academic (Johnston, 1998). As such, the
academics need to be self-motivated and engage in CPD activities,
irrespective of whether they receive the pressure or support of the HEIs
and other related stakeholders to engage in ongoing development.
However, it is required for this attitude to be inculcated within the
mind-sets of all the stakeholders of the Higher Education sector of a
country for the sector to enjoy the greatest outcomes.
-13- HRM Perspectives – December, 2017
References
Baume, D., & Yorke, M. (2002). The reliability of assessment by
portfolio for a course to develop and accredit teachers in higher
education. Studies in Higher Education, 27(1), 7-25. doi:
10.1080/03075070120099340
Becher, T. (1996). The learning professions. Studies in Higher
Education, 21(1), 43-55 doi: 10.1080/03075079612331381447
Chatterton, P., & Goddard, J. (2000). The response of higher education
institutions to regional needs. European Journal of Education, 35(4),
475-496. doi: 475-496. doi:10.1111/1467-3435.00041
Eraut, M. (1994). Developing Professional Knowledge and
Competence: Psychology Press.
Ferman, T. (2002). Academic professional development practice: What
lecturers find valuable. International Journal for Academic
Development, 7(2), 146-158. doi: 10.1080/1360144032000071305
Grace, M. (2001). Continuing professional development: Learning
styles. British Dental Journal, 191(3), 125-128. doi:
10.1038/sj.bdj.4801116
Johnston, S. (1998). Academics as Learning Professionals. HERDSA.
Retrieved from
http://www2.auckland.ac.nz/cpd/HERDSA/HTML/StaffDev/JOHNSTO
N.HTM
Karunaratne, D., Chandratilake, M., & Wijayaweera, K. (2015).
Exploring perceptions of medical professionals on Continuing
Professional Development (CPD) in Sri Lanka. Paper presented at the
12th Asia Pacific Medical Education Conference (APMEC), National
University of Singapore. Poster retrieved from
http://medicine.nus.edu.sg/cenmed/apmec12/documents/12th_APMEC_
and_3rd_ICFDHP_2015-Conference_Abstract_Book.pdf

-14- HRM Perspectives – December, 2017
King, K. P. (2004). Both sides now: Examining transformative learning
and professional development of educators. Innovative Higher
Education, 29(2), 155-174. doi: 10.1023/b:ihie.0000048796.60390.5f
Kulatunga, G. G., Marasinghe, R. B., Karunathilake, I. M., &
Dissanayake, V. H. (2013). Development and implementation of a web-
based continuing professional development (CPD) programme in
medical genetics. Journal of Telemedicine and Telecare, 19(7), 388-
392. doi:10.1177/1357633x13506525
Lueddeke, G. R. (2003). Professionalizing teaching practice in higher
education: A study of disciplinary variation and 'teaching-scholarship'.
Studies in Higher Education, 28(2), 213-228. doi:
10.1080/0307507032000058082
Madden, C. A., & Mitchell, V. A. (1993). Professions, standards and
competence: A survey of continuing education for the professions.
Bristol University, Department of Continuing Education.
Wareing, S. (2004). It ain't what you say, it's the way that you say it:
An analysis of the language of educational development. English
Language Subject Centre Newsletter. London: English Language
Subject Centre, University of the Arts.
Wood, L. N., Vu, T., Bower, M., Brown, N., Skalicky, J., …Bloom, W.
(2011). Professional development for teaching in higher education.
International Journal of Mathematical Education in Science and
Technology, 42(7), 997-1009. doi: 10.1080/0020739X.2011.608864

-15- HRM Perspectives – December, 2017
GENERATIONS AND WORK RELATED FACTORS
OF EXECUTIVES: EVIDENCE FROM FIVE
LEADING COMMERCIAL BANKS IN SRI LANKA
Dilrukshi Rajapaksha - MHRM, AMIPM
TVET & Training Manager,
USAID
Sri Lanka
and
Prasadini Gamage – PhD, AMIPM
Professor
Department of Human Resource Management
Faculty of Commerce & Management, University of Kelaniya
Sri Lanka
ABSTRACT
In the modern business environment, organizations have to accomplish
their business activities in a more competitive way. One of the biggest
challenges faced by the modern organizations is to retain satisfied and
productive workforce over the other competitors in the market. In order
to accomplish that it is essential to understand and cater to fulfill their
needs, it is essential that employers pay attention to generational
differences in the workplace. This study attempts to identify the
generational difference between three generations and their behavior
and desires in work related factors within the employment.
The sample of the study consists of 108 employees in Managerial and
line managerial level working in five commercial banks in Sri Lanka.
The independent variable of the study is generations consisted of Baby

-16- HRM Perspectives – December, 2017
Boomers, Generation X and Y. The dependent variable is the work
related factors such as Teamwork, Career Development, Work
Engagement and Job Security. To gather data a structured
questionnaire was distributed among the respondents and data were
analyzed by using descriptive statistical techniques and one-way
Enova.
The statistical results of the study showed that perceived expectation of
job security among Baby Boomers is higher than employees belong to
Generation X and Y but the perceived expectation of challenging jobs is
higher among employees belong to Generation X and Y than Baby
Boomers. Results showed that Gen Y was more engaged at work than
Gen X. Gender also plays a major role in work related factors and the
study analysis these factors in detailed.
Keywords: Team work, Career Development, Work Engagement and
Job Security Baby Boomers, Generation X and Y
Introduction
A new generation of employees with novel expectations has entered the
workplace (Halvorson, 2013). They are known by many names, but
most will recognize them as the Millennials or Generation Y (Gen Y).
With many Gen Y members already in the workforce, managers are
likely to be required to deal with the generational differences that
appear to exist among employees (Haserot, 2008). Given that Gen Y
members are likely to work closely with Gen X members, the following
study will explore possible differences between Gen X and Gen Y on
their work-related beliefs. A core challenge over the next decade will
be to attract and retain a skilled workforce as the labor market
continues to tighten, technology continues to evolve (American
Management Association, 2007). This situation is exacerbated as
companies find themselves managing four generations of workers:

-17- HRM Perspectives – December, 2017
Silents
Silent or Traditionalist is considered among the most loyal workers.
They are highly dedicated and the most risk averse (American
Management Association, 2007). Their values were shaped by the
Great Depression, World War II, and the postwar boom years. Silents
possess a strong commitment to teamwork and collaboration and have
high regard for developing interpersonal communication skills. Silents
now consist of the most affluent elderly population in history due to
their willingness to conserve and save after recovering from the
financial impact of the postwar era.
Baby Boomers
Boomers are the first generation to actively declare a higher priority for
work over personal life (American Management Association, 2007).
They generally distrust authority and large systems. They are more
optimistic and open to change than the prior generation, but they are
also responsible for the “Me Generation,” with its pursuit of personal
gratification, which often shows up as a sense of entitlement in today’s
work force.
Because of the fall of the dot.com marketplace, retirement savings of
Baby Boomers were decimated and many now find themselves having
to work longer than they had planned. A recent AARP survey of 2001
people born in this era revealed that 63% plan to work at least part-time
in retirement, while 5% said that they never plan to retire, some
because they like working, others because they need the money to
replace lost retirement savings.

-18- HRM Perspectives – December, 2017
Generation Xers
Generation Xers is often considered the “slacker” generation. They
naturally question authority figures and are responsible for creating the
work/life balance concept (American Management Association, 2007).
Born in a time of declining population growth, this generation of
workers possesses strong technical skills and is more independent than
the prior generations.
Because Gen Xers place a lower priority on work, many company
leaders from the Baby Boomer generation assume these workers are not
as dedicated; however, Gen Xers are willing to develop their skill sets
and take on challenges and are perceived as very adaptable to job
instability in the post-downsizing environment.
Millennials or Generation Ys
This group is the first global-centric generation, having come of age
during the rapid growth of the Internet and an increase in global
terrorism. They are among the most resilient in navigating change
while deepening their appreciation for diversity and inclusion.
With significant gains in technology and an increase in educational
programming during the 1990s, the Millennials are also the most
educated generation of workers today. Additionally, they represent the
most team-centric generation since the Silents, as they have grown up
at a time where parents programmed much of their lives with sports,
music, and recreational activities to keep them occupied while their
Boomer parents focused on work. A major influence from Boomer
parents is their willingness to work hard and set goals to achieve the
lifestyle they want. They also share many of the common values of
patriotism and family from the Silents era. At times, they can appear
more demanding than previous generations.

-19- HRM Perspectives – December, 2017
Banking Sector of Sri Lanka
With an economy worth $64 billion (2012 IMF estimate) ($170 billion
PPP estimate), [1] and a per capita GDP of about $7900 (PPP), Sri
Lanka has mostly had strong growth rates in recent years (Wikipedia,
2013). GDP per capita terms, it is ahead of other countries in the South
Asian region. The Central Bank of Sri Lanka is the monetary authority
of Sri Lanka and was established in 1950. The Central Bank is
responsible for the conduct of monetary policy in the country and also
has supervisory powers over the financial system
Sri Lanka's banking sector is sound amidst a global rout thanks to early
regulatory action taken to safeguard the banking system (Trade Chakra,
2010). When all the other countries were expanding credit at a very
high rate, banking was given massive amounts of loans to fuel the
housing as well as the land prices in Sri Lanka.
As a result of that Sri Lanka was able to smoothen and safeguard the
banking system before it could form and have disastrous consequences
in the economy. Economic analysts have said that Sri Lanka's economy
is mostly damaged by government action, usually central bank
accommodation of fiscal deficits. Printing money to plug deficits
causes interest rates to fall (financial repression), which in turn leads to
high inflation and balance of payments problems.
The banking sector in Sri Lanka at present needs a complete overhaul
to make it globally competitive. Clearer regulatory guidelines are
needed to cover changes in ownership in the banking sector and to
handle the implications of mergers and acquisitions (Trade Chakra,
2010)
Hence, the generational differences in work related factors are regarded
as a vitally important concept that organizations have to learn from the
success of any organization. In reviewing the Sri Lankan research
literature for the purpose of finding the work-related factors to enhance
a satisfied work force, the researcher could identify different

-20- HRM Perspectives – December, 2017
generations in a workplace and managers should handle these
generations effectively to support the concepts.
Problem Statement
New Generation Y employees (those who have entered the workplace
since about 2001) require more management time than their older
counterparts did (Scanlan, 2007). This is frustrating to Baby Boomer
partners and managers and the Gen Xers who crave autonomy and like
to do things their way. Having very structured lives since childhood,
the Millennials (Generation Y) need structure and guidance at work to
channel their dedication to producing excellent results (Haserot, 2008).
The existence of the multi-generational workforce poses unique
challenges to today’s business environment. A lack of understanding
regarding generational differences contributes to conflict within
working relationships, lowers productivity, and increases turnover.
More seasoned staff can become frustrated by a seemingly aloof
younger generation. Younger staff can become disenfranchised with
entrenched hierarchal structures. Moreover, those employees caught in
the middle can become frustrated with everyone (Ballone, 2007).
However, in Sri Lankan context no empirical study has been conducted
to compare & contrast the Baby Boomers, Generations X and
Generation Y in relation to their work beliefs. This is the research gap
that has been addressed in this research. The following questions are
addressed in this study.
1. What is the difference between Baby Boomers, Generations X
and Generation Y in relation to their work beliefs of being
engaged at work?
2. What is the difference between Baby Boomers, Generations X
and Generation Y in relation to their fulfillment of Career
Development?

-21- HRM Perspectives – December, 2017
3. What is the difference between Baby Boomers, Generations X
and Generation Y in relation to being a part of teamwork?
4. What is the difference between Baby Boomers, Generation X
and Generation Y in relation to job security?
Objectives
The following are the objectives of the study.
1. To identify the difference between baby boomers, generations X
and generation Y in relation to job engagement.
2. To examine the difference between baby boomers, generations
X and generation Y in relation to their fulfillment of career
development.
3. To investigate the difference between baby boomers,
generations X and generation Y in relation to team work.
4. To examine the difference between baby boomers, generation X
and generation Y in relation to Job Security.
Literature Survey
It is important to note how the work environment has changed over
time, and realize that at the same time the next generation (i.e., Gen Y)
has entered the workforce. In traditional bureaucratic structures, the
interactions between people from different generations followed
hierarchical lines. Although this structure is still common in various
organizations, the introduction of total quality management and
continuous quality improvement has actually led many organizations to
implement a more team-based approach. Such an approach allows
-22- HRM Perspectives – December, 2017
individuals from various "levels" of the organization to become
involved as equal members of a team, and as a result, it attempts to
neutralize the hierarchical structure and permit individuals of different
age groups to interact as peers. This whole concept of the older getting
help from the young or vice versa is difficult to accept because each
generation has their own way of carrying out a task. What makes this
concept even harder to adopt is that unfortunately there are still
members of each generation that seem to believe their values and
expectations are universal. The following section reviews, industry and
research findings on three work-related beliefs, namely work
engagement, career development, teamwork, and how Gen X and Gen
Y view these work-related beliefs.
Work Engagement
There are many different definitions of work engagement. Some define
engagement as "the degree to which employees are satisfied with their
jobs, feel valued, and experience collaboration and trust", still others
define it as "a state where employees find meaning in their work and
devote discretionary effort and time to work". Of the many definitions,
the definition suggested by was chosen because it makes reference to
not only the organizational benefits, but to the personal benefits that
can come from having organizationally committed and engaged
employees.
As to how the engagement findings apply to the generations of focus in
this study, suggest that Gen Y employees are significantly more
focused than earlier generations on finding work that is meaningful and
that allows them to make a meaningful contribution. For this
generation, the factors that drive engagement, go beyond tangibles like
rewards and benefits; the Gen Y cohort rather seeks a meaningful
compensation that is more closely aligned with their values. Therefore,
placing members of this generation in cross-functional teams where
they are constantly given diverse and new information about the

-23- HRM Perspectives – December, 2017
business, industry or the world in general is where Gen Y-ers will be
best utilized and more likely to stay engaged at work.
Career Development
Developing experienced and skilled employees is vital to any
organization hoping to compete in the future. Employees want their
organization to help them meet their career development aspirations.
Therefore, in this study, career development refers to the employees'
fulfillment of having career development discussions with their
managers and developing their personal career goals. That is important,
because knowing how to properly address career growth and
development concerns to different generations should be something
managers should stay on top of. As mentioned earlier, the views of
Gen X and Gen Y are quite different when it comes to authority and
organizations. One of the clearest contrasts between Gen X and Gen Y
members is the issue of pessimism versus optimism. Members of Gen
X are rather pessimistic, which might make them believe that climbing
the ladders to success are not very likely in their future (Cole et al.,
2002). Furthermore, the lack of promotional opportunities and growth
has contributed to a small chance of Gen X members staying with the
same employer (Weston M, 2006). This generation has taken such lack
of career growth to heart and therefore believe that no job is guaranteed
and as a result, they do not see an advantage of being loyal to or
sacrificing for any one employer (Weston M, 2006). Gen Y-ers, on the
other hand, are optimistic about what they could accomplish and how
they will do in life. This generation is likely to tackle tasks at work with
the expectation that success is likely (Cole et al., 2002). Yet, this
generation can be rather impatient because they want immediate
feedback and not just once or twice a year, but as often as possible
(Sujansky, 2004). This is how members of this generation get an idea
of how and where they are going from the very onset of their career.
Gen Y member has achieved his/her goals; the organization needs to
fulfill their part of the psychological contract or actual agreement, and

-24- HRM Perspectives – December, 2017
provide him/her with the promised reward. This is important because
research has found that when specific promises go unmet, this can be
interpreted by an employee that they are not valued by the organization,
lowering the employee's organizational trust (Smola & Sutton, 2002).
Further, psychological contract breach can lead to an employee's
unwillingness to engage in organizational citizenship behavior (Coyle-
Shapiro & Kessler, 2000), reduced levels of job satisfaction, and higher
levels of absenteeism.
Teamwork
As mentioned earlier, teamwork appears to be one of those work
attributes in which may have a clear difference between Gen X and
Gen Y. Teamwork is often a crucial part of a business, as it is often
necessary for colleagues to work well together, trying their best in any
circumstance. Teamwork means that people will try to cooperate, using
their individual skills and providing constructive feedback, despite any
personal conflict between individuals. Furthermore, such collaboration
allowed them room for higher levels of job satisfaction, but most
importantly, it gave these nurses a higher probability of positively
impacting patient outcomes. Cooperative and diverse teams offer a
strategic advantage to the learning of both the individual and what the
team as a whole can accomplish. Therefore, creating cooperative and
cohesive teams that allow different generations to learn from each other
and work well together can further enhance an organization's value
(Weston M, 2006).
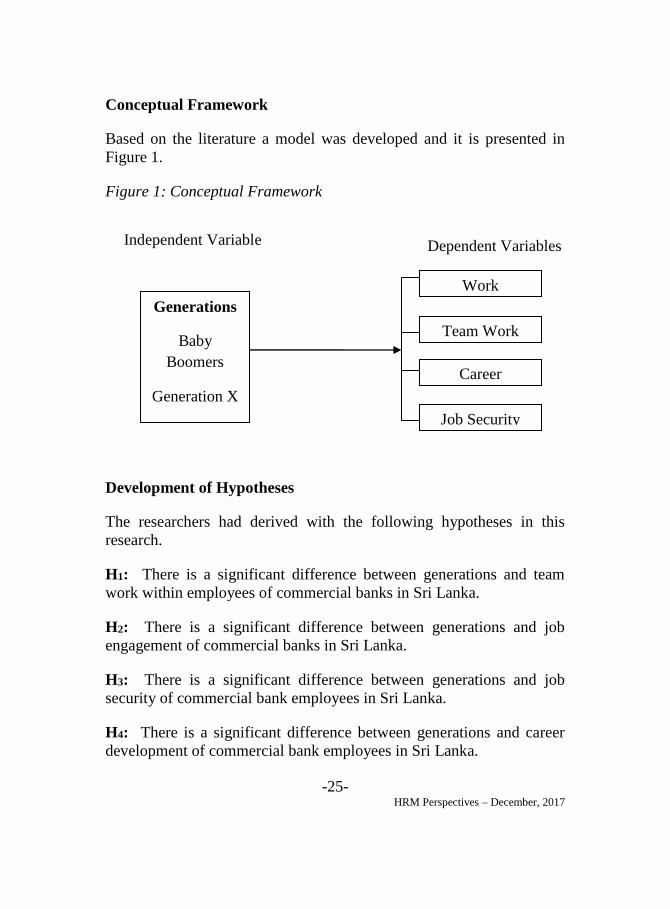
The below figure 01 signifies the conceptual framework that specifies
the variables that the researcher intends to explore in the following
research. The three generations (Baby boomers, generation X and
generation) are the independent variables and work related factors are
considered as the dependent variables of the study. The researcher
intends to explore 04 work related factors such as work engagement,
teamwork, career development and job security.
-25- HRM Perspectives – December, 2017
Conceptual Framework
Based on the literature a model was developed and it is presented in
Figure 1.
Figure 1: Conceptual Framework
Development of Hypotheses
The researchers had derived with the following hypotheses in this
research.
H1: There is a significant difference between generations and team
work within employees of commercial banks in Sri Lanka.
H2: There is a significant difference between generations and job
engagement of commercial banks in Sri Lanka.
H3: There is a significant difference between generations and job
security of commercial bank employees in Sri Lanka.
H4: There is a significant difference between generations and career
development of commercial bank employees in Sri Lanka.
Independent Variable Dependent Variables
Work
Engagement
Team Work
Career
Development
Generations
Baby
Boomers
Generation X
Generation Y Job Security

-26- HRM Perspectives – December, 2017
Research Design
The purpose of this research is to find out the generational difference in
work related factors in the banking sector. Hypothesis testing will be
done for finding out the correlation among variables. This research is
mainly based on a survey and researcher interference of this type of
researches is minimal. Time horizon means, how long it will take to do
the particular research. Time perspectives are independent of which
research strategies pursuing by the researcher. There are two levels of
time horizon, they are cross sectional and longitudinal. This present
study hopes to carry out as a cross-sectional study. It can be used
within a short space of time and data can be summarized statistically.
Unit of analysis for this study will be individual which the level of data
collection to be analyzed.
Population & Sampling
The population of this present study consists of private commercial
banks in Colombo. The study population is selected from the Head
Offices of these banks and the sample has been derived from the study
population. There are two methods of sampling as random sampling
and non-random sampling. Considering the availability of resources
cluster sampling will be used under random sampling to specify the
target geographical area.
The target population of the study is all the manager level employees in
private sector commercial banks in Sri Lanka. It is around 2000. But
for the purpose of the study, the researcher has selected 03 leading
private sector commercial banks based on the market share.
The sample size (frame) is a representation of all the elements in the
population from which the sample is drawn (Sekaran & Bougie, 2005).
Therefore, the researcher obtained, the staff information from the HR

-27- HRM Perspectives – December, 2017
department of the Head Offices of 5 banks in Colombo in order to
derive at the sample size. According to the table provided by Uma
Sekeran and Roger Bougies, the sample size was 175 as the population
was 300 employees at the managerial level in all 5 banks. (Sekeran &
Bougie, 2005, p.295). The target population was 300 employees from
the Head Office of all 03 commercial banks in Sri Lanka listed in the
stock market. It has been limited to the head office was that more
managerial positions were visible in head offices rather than branch
offices.
Testing of Hypotheses
The work related factors have been divided into 4 sections in order to
conduct the analysis clearly. It comprises of Team Work, Career
Development, Job Security and Work Engagement. The sample details
have been categorized into the four sections and the Mean values and
the standard deviation has recorded below.
H1: There is a significant difference between generational and team
work within employees of commercial banks in Sri Lanka.
The one-way ANOVA has been used to test the H1, since the researcher
is interested to find out the differences between more than two groups.

-28- HRM Perspectives – December, 2017
Table 01: One-way ANOVA for generation differences and team work.
Descriptive
Team Work
N Mean Std.
Deviatio
n
Std.
Error
95% Confidence
Interval for Mean
Minimum Maxi
mum
Lower
Bound
Upper
Bound
Baby
Boomers 11 2.0130 .43544 .13129 1.7205 2.3055 1.00 2.57
Generation
X 59 1.9556 .38247 .04979 1.8559 2.0553 1.00 2.71
Generation
Y 38 1.8835 .34493 .05596 1.7701 1.9968 1.00 2.57
Total 108 1.9361 .37411 .03600 1.8647 2.0074 1.00 2.71
Test of Homogeneity of Variances
Team Work
Levene Statistic df
1
df2 Sig.
.372 2 105 .690
The Homogeneity of variance of P value of Team Work is 0.690. The
degree of freedom are 2 and 105. Since the p value is >0.05, hence
equality of variance can be assumed.
ANOVA
Team Work
Sum of Squares Df Mean Square F Sig.
Between Groups .193 2 .096 .685 .507
Within Groups 14.783 105 .141 Total 14.976 107
The test of one-way Anova and the P value is 0.507.
The F value is 0.685 and the degree of freedoms are 2 and 105. The p
values of the test is 0.507 which is more than 0.05. Based on the p
value in the ANOVA table, there is no significant (analysis of variance)

-29- HRM Perspectives – December, 2017
difference between generations and team work. Hence H1 cannot be
accepted.
H2: There is a significant difference between generational and job
engagement of commercial banks in Sri Lanka.
The one-way ANOVA has been used to test the H2, since the researcher
is interested to find out the differences between more than two groups.
Table 02: One-way ANOVA for generation differences and work
engagement.
N Mean Std.
Deviation
Std.
Error
95% Confidence Interval
for Mean
Minimu
m
Maximu
m
Lower
Bound
Upper
Bound
Baby
Boomers 11 2.0303 .34099 .10281 1.8012 2.2594 1.33 2.33
Generation
X 59 2.0876 .38368 .04995 1.9876 2.1876 1.00 2.78
Generation
Y 38 2.1111 .37257 .06044 1.9887 2.2336 1.22 2.67
Total 108 2.0900 .37308 .03590 2.0189 2.1612 1.00 2.78
Test of Homogeneity of Variances
Work Engagement
Levene Statistic df1 df2 Sig.
.129 2 105 .879

-30- HRM Perspectives – December, 2017
The Homogeneity of variance of P values of Team Work is 0.879. The
degree of freedom are 2 and 105. Since the p value is >0.05, the
equality of variance can be assumed.
Sum of Squares Df Mean Square F Sig.
Between Groups .056 2 .028 .200 .819
Within Groups 14.837 105 .141 Total 14.893 107
The test of one-way Anova and the P value is 0.819.
The F value is 0.200 and the degree of freedoms are 2 and 105. The p
values of the test is 0.819 which is more than 0.05. Based on the p
value in ANOVA table, there is no significant (analysis of variance)
difference between generations and work engagement. Hence H2
cannot be accepted.
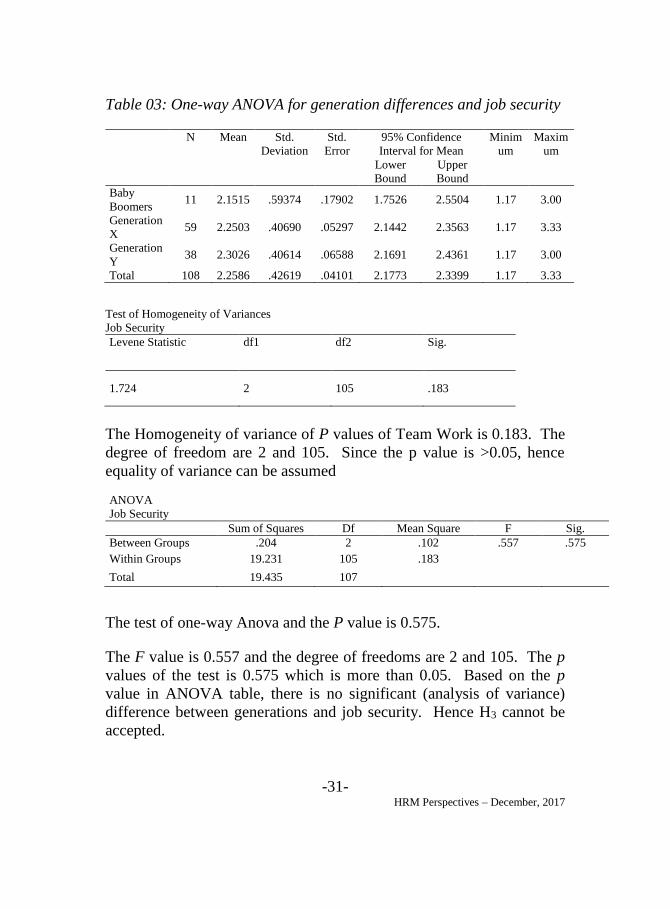
H3: There is a significant difference between generations and job
security of commercial bank employees in Sri Lanka.
The table shows the mean value and the standard deviation of the
sample. The Baby Boomers mean is 2.1 and a standard deviation of
0.593. The Generation X mean value is 2.2 with a standard deviation
of 0.406. The Generation Y has a mean of 2.3 with a standard
deviation of 0.406.
The one-way ANOVA has been used to test the H3, since the researcher
is interested to find out the differences between more than two groups.
-31- HRM Perspectives – December, 2017
Table 03: One-way ANOVA for generation differences and job security
N Mean Std.
Deviation
Std.
Error
95% Confidence
Interval for Mean
Minim
um
Maxim
um
Lower
Bound
Upper
Bound
Baby
Boomers 11 2.1515 .59374 .17902 1.7526 2.5504 1.17 3.00
Generation
X 59 2.2503 .40690 .05297 2.1442 2.3563 1.17 3.33
Generation
Y 38 2.3026 .40614 .06588 2.1691 2.4361 1.17 3.00
Total 108 2.2586 .42619 .04101 2.1773 2.3399 1.17 3.33
Test of Homogeneity of Variances
Job Security
Levene Statistic df1 df2 Sig.
1.724 2 105 .183
The Homogeneity of variance of P values of Team Work is 0.183. The
degree of freedom are 2 and 105. Since the p value is >0.05, hence
equality of variance can be assumed
ANOVA
Job Security
Sum of Squares Df Mean Square F Sig.
Between Groups .204 2 .102 .557 .575
Within Groups 19.231 105 .183 Total 19.435 107
The test of one-way Anova and the P value is 0.575.
The F value is 0.557 and the degree of freedoms are 2 and 105. The p
values of the test is 0.575 which is more than 0.05. Based on the p
value in ANOVA table, there is no significant (analysis of variance)
difference between generations and job security. Hence H3 cannot be
accepted.

-32- HRM Perspectives – December, 2017
H4: There is a significant difference between generations and career
development of commercial bank employees in Sri Lanka.
The one-way ANOVA has been used to test the H4, since the researcher
is interested to find out the differences between more than two groups.
Table 04: One-way ANOVA for generational differences and career
development.
N Mean Std.
Deviation
Std.
Error
95% Confidence Interval
for Mean
Minimu
m
Maximu
m
Lower
Bound
Upper
Bound
Baby
Boomers
11 2.4286 .49073 .14796 2.0989 2.7582 1.71 3.57
Generation
X
59 2.2107 .34523 .04494 2.1207 2.3006 1.43 2.86
Generation
Y
38 2.0677 .35109 .05695 1.9523 2.1831 1.43 2.86
Total 108 2.1825 .37560 .03614 2.1109 2.2542 1.43 3.57
Test of Homogeneity of Variances
Career Development
Levene Statistic df1 df2 Sig.
.355 2 105 .702
The Homogeneity of variance of P values of Team Work is 0.702. The
degree of freedom are 2 and 105. Since the p value is >0.05, hence
equality of variance can be assumed.

-33- HRM Perspectives – December, 2017
ANOVA
Career Development
Sum of Squares Df Mean Square F Sig.
Between Groups 1.214 2 .607 4.591 .012
Within Groups 13.881 105 .132 Total 15.095 107
The test of one-way Anova and the P value is 0.012.
The F value is 4.591 and the degree of freedoms are 2 and 105. The p
values of the test is 0.012 which is less than 0.05. Based on the p value
in ANOVA table, there is a significant (analysis of variance) difference
between generations and career development. Hence H4 will be
accepted.
Turkey Testing
Tukey HSD
(I) Q2 (J) Q2 Mean
Difference
(I-J)
Std.
Error
Sig. 95% Confidence Interval
Lower
Bound
Upper
Bound
Baby
Boomers
Generation X .21792 .11941 .166 -.0660 .5018
Generation Y .36090* .12449 .013 .0649 .6569
Generation X
Baby
Boomers -.21792 .11941 .166 -.5018 .0660
Generation Y .14298 .07563 .146 -.0368 .3228
Generation Y
Baby
Boomers -.36090* .12449 .013 -.6569 -.0649
Generation X -.14298 .07563 .146 -.3228 .0368
(*). The mean difference is significant at the 0.05 level.
In order to find out the differences, the Multiple mean comparison was
conducted. And the Turkey HSD states with an asterisk (*) mark, the
differences in the generations. The results show that the baby boomers

-34- HRM Perspectives – December, 2017
and generation Y has a difference in relations to career development.
The p values for the mean difference are given in the column under
significant value. The 95% confidence intervals for the mean
differences are given in the last 2 columns.
In the comparison of baby boomers and generation Y, the mean
difference is 0.36090*, the p value is 0.013, which is less than 0.05,
under the 95% confidence interval for the mean difference does not
contain the value of 0 (zero).
Findings, Recommendations and Conclusion
Findings
Job Engagement
When compared with the literature, it was stated that baby boomers
were more engrossed in work more than the other generations.
Boomers have been characterized as individuals who believe that hard
work and sacrifice are the price to pay for success. They started the
workaholic trend;( Zemke et al., 2000) believe (d) in paying their dues
and step-by-step promotion. This was affirmed by another research
conducted in a Sri Lankan context by (Gamage, 2012). It refers that
Wong et al (2008) has mentioned that the generation of Baby Boomers
includes loyalty to an organization, idealism and ambition. Therefore,
an alternative and a null hypothesis were developed in order to derive
at the conclusion of generational differences of employees in the
banking sector.
Literature stated that generation X members may have more
commitment to their own careers than to their organizations and may
prefer organizations which value skills development, productivity and
work-life balance rather than status and tenure (Smola and Sutton,
2002). Accordingly, people who belong to the Generation X are more
likely to leave a job in search of a more challenging work environment
or, higher pay as previous generations as a result of an economic crisis
in their formative years.

-35- HRM Perspectives – December, 2017
Similarly, Generation Y has reported to be less committed to their
organization and more likely to leave if not satisfied (Twenge et al.,
2010).
As per the data analysis, it was affirmed that there is a significant
difference between generation in relation to job engagement.
Career Development
The literature stated that generation X & Y are more career minded
than baby boomers.
Many scholars (Kupperschmidt, 2000; Lancaster and Stillman, 2005;
Smola and Sutton, 2002) suggest that Baby Boomer employees value
job security and a stable work environment. Wong et al (2008) has
mentioned that the generation of Baby Boomers includes loyalty to an
organization.
Accordingly, people who belong to the Generation X are more likely to
leave a job in search of a more challenging work environment or,
higher pay as previous generations.
Generation Y has been characterized as demanding (Martin, 2007), and
as the most confident generation. Like Xers, they are also purported to
be entrepreneurial, and as being less process focused (Crampton &
Hodge, 2006).
As per the data analysis in the current study, it could be revealed that in
the Sri Lankan banking sector, this difference is visible. In order to
find out the difference, a Post Hoc test was conducted and it revealed
that the difference is between baby boomers and generation Y.
Team Work
According to Collins (1998); baby boomers have a strong focus on hard
work and achievement may mean that this group values status and
extrinsic rewards as recognition of loyalty and commitment. Good

-36- HRM Perspectives – December, 2017
supervisor relations and positive interactions with co-workers have also
been found to be important. It was stated that generation X is more
individualistic and is not strong in team work. But generation Y is
more prone to teamwork as per the literature.
It was found that the three generations have a significant difference in
relation to teamwork of the employees in the banking sector in Sri
Lanka.
Job Security
Literature states that; Kupperschmidt, 2000; Lancaster and Stillman,
2005; Smola and Sutton, 2002) suggest that Baby Boomer employees
value job security and a stable work environment. Wong et al., (2008)
have mentioned that the generation of Baby Boomers includes loyalty
to an organization, idealism and ambition. Baby Boomers have been
found to rate the people who belong to the Generation X are more
likely to leave a job in search of a more challenging work environment
or, higher pay as previous generations as a result of an economic crisis
in their formative years.
Generation Y has reported to be less committed to their organization
and more likely to leave if not satisfied (Twenge et al., 2010).
Recommendations
Implications to the Theory
The present study contributes to the body of knowledge of the
generational differences in a workplace by providing a novel approach
to understand the different generations inside out. The existing
employees and their different approaches never recognized the
subjective success that comprises of different thinking approaches and
satisfaction of life as either an ultimate need.

-37- HRM Perspectives – December, 2017
The current study will influence the impact of generational differences
in a work place. A study has not been conducted in Sri Lanka in
relation to the four work related factors stated in the study. Hence the
study results will add literature of new areas to the existing knowledge.
The present study contributes to the emerging work-related behaviors
for knowledge management by introducing subjective generations as
the measurements of the tacit dimension of success of performance of
different level of employees.
Implication to the Practice
Most of the organizations lack the practical aspect of handling people
in an organization. Since the date has been collected from the banking
sector employees, the responses will portray their state of expectations
in a career. It was revealed in the study that different work groups or
employees from different generations have a variety of expectations.
Therefore, hands on experience in handling different work forces are
crucial to people managers in an organization.
The Baby Boomers are gradually leaving the workforce and it could be
observed that the Generation X and Y have many differences.
Generation Y is the hi-tech generation and therefore the training
managers will have to be creative in organizing training sessions for
this generation. Gathering them in a classroom would be challenging
and modern technology would come into rescue in dealing with this
generational need.
It was also noted that a new generation is yet to be found and still they
have not entered into the job market. The professional marketers are
also keeping their fingers crossed to identify their needs. Product
promotions will have to be targeted based on understanding the new
generation which could be identified and Generation Z.
HR professional will not have the luxury of carrying-out the same
training programs for all generations in years to come. The practices
will need to revamp, according to upcoming generational differences in
the workplace.

-38- HRM Perspectives – December, 2017
Suggestions for Future Researches
Limited background information on Sri Lankan researches in
generational analysis, the current study may be considered as one of the
new attempts to study generational behaviors in work related beliefs.
Future studies are expected to conduct similar exploration about the
comprehensive knowledge and understanding of the generations and
their work related beliefs in other enterprises within Sri Lanka.
Further, to generalize the findings of the work-related beliefs and their
behaviors, large-scale quantitative studies on different samples need to
be conducted by using the same variables and also the other possible
work-related belief factors other than the variables identified by the
present study. It is predictable to increase the studies on the other work
related topics of employees in different level of employee categories in
Sri Lanka, and different industries using different types of work
engagement subject matters.
Conclusion
Below, I discuss the key findings from the study. (Gilbert, 2011)
Generational gaps do exist. The results reveal that employee
engagement differences are likely to exist across generations. These
gaps have distinct impacts on employee engagement. While companies
have unique drivers within their organizations, there were trends among
the participating companies in this study that indicate which drivers are
more likely to become a high priority for employees (managing
performance, recognition, career opportunities). Furthermore, this
study helped identify that drivers can be categorized by generation.
This is a new learning not currently discussed in existing research.
As per the conclusion of a study completed by Gilbert (2012), it was
stated that Job Security was more in Baby Boomers than generation X
and Y. But as per the analysis of this study, it was found that there
was no significant difference in relation to Job Security within the 3

-39- HRM Perspectives – December, 2017
generations. Though the study makes a valuable contribution to
existing literature, it is significant to note that a few limitations which
should be taken into account in future investigations. Despite its
limitations, the study will make a valuable contribution to the
understanding of the relationships investigated during the above
research and researchers conclude that more focus should endow with
when managing employees. Hence it is more important to address their
preserved different expectations.

-40- HRM Perspectives – December, 2017
References
Ballone, C. (2007). Multi Generational Workforce. Journal of
PRactical Consulting , 2-3.
Crampton, S. M., & Hodge, J. W. (2006). The supervisor and
generational differences. Proceedings of the Academy of
Organizational Culture, Communications and Conflict
Cole, L. L. (2002). The Debate of Generations in American Workforce.
Journal of Business Administration , 1-10.
Gilbert, J. (2011). Improving the Practice of Management. Ivey
Business Journal , 1.
Halvorson, C. (2013, March 19). When I Work. Retrieved November 9,
2013, from Understanding Generation Ys: http://wheniwork.com
Haserot, P. W. (2008, November 5). Tips of Managers and Mentors in
Handling Different Generations. Retrieved November 9, 2013, from
Accounting Web: http://www.accountingweb.com
Kupperschmidt, B. R. (2000). Multigenerational employees: Strategies
for effective management. The Health Care Manager, 19, 65–76.
Lancaster, L. C., & Stillman, D. (2002). When Generations Collide:
Who They Are, Why They Clash. In L. C. Lancaster, & D. Stillman,
How to Solve the Generational Puzzle at Work. HarperCollins
Publishers Inc.
Martin, M. (2007). Generational differences in the workplace.
Retrieved April 15, 2014 from
http://www.dnr.mo.gov/env/swcp/docs/Generational%20
Differences%20in%20the%20Workplace.pdf.

-41- HRM Perspectives – December, 2017
Scanlan, K. (2007). Workplace Vision. Publication of the Society of
Human Resource Management , 2.
Smola, K. W. & Sutton, C. (2002). Generational differences: Revisiting
generational work values for the new millennium. Journal of
Organizational Behavior
Sekaran, U., & Bougie, R. (2005). Research Methods for Business.
New Delhi: Wiley India.
Coyle-Shapiro, Jacqueline A-M. and Kessler, Ian (2000) Consequences
of the psychological contract for the employment relationship: a large
scale survey. Journal of Management Studies, 37 (7). pp. 903-930.
ISSN 1467-6486
Sujansky, J. (2004) Leading a multi-generational workforce.
Occupational Health & Safety, 73, 16-18. http://search.proquest.com
Trade Chakra. (2010, May 17). Retrieved Feb 2, 2014, from
Tradeindia.com: http://www.tradechakra.com
Twenge, J.M. in press. Generational differences in work values: A
review of the empirical evidence. Journal of Business and Psychology
Weston, M., (May 31, 2006) "Integrating Generational Perspectives in
Nursing" OJIN: The Online Journal of Issues in Nursing Vol. 11 No. 2,
Manuscript 1.
Wong, M., Gardiner, E., Lang, W., & Coulon, L. (2008). Generational
differences in personality and motivation: Do they exist and what are
the implications for the workplace? Journal of Managerial Psychology,
23(8), 878-890.

-42- HRM Perspectives – December, 2017
Zemke, R., Raines, C., & Filipczak, B. (2000). Generations at Work:
Managing the Clash of Vererans, Booners, Xers Nexters in Your
Workplace. American Management Association .

-43- HRM Perspectives – December, 2017
DEXTERITY AND PERFORMANCE OF SEWING
MACHINE OPERATORS: IN CASE OF A GARMENT
FACTORY SITUATED IN KATUNAYAKE
INDUSTRIAL PROCESSING ZONE, SRI LANKA
Indika Priyantha Kaluarachchi – MHRM, AMIPM Senior Lecturer
Division of Management Studies
University College of Matara, Sri Lanka
ABSTRACT
Dexterity is the skill in performing tasks, especially with the hands. It is
the ability to perform a difficult action quickly and skilfully with the
hands, or the ability to think quickly and effectively. Some garment
factories, highly concentrate on the dexterity of Sewing Machine
Operators to check their competence and it is used in the stages of
recruitment, training and performance evaluations etc. This paper
explores the impact of dexterity on their work performance. 88 machine
operators from a garment factory situated in Katunayake Industrial
Processing Zone were selected. This factory currently uses four types
of dexterity tests such as Marble, Pin Board, Cards and Puzzle. These
four types of dexterity tests were conducted among the selected sample
and their scores were recorded. Their current performance records
were obtained from the factory Management Information System.
Hypotheses were tested by using multiple regression analysis and it
was found that Marble, Cards and Puzzle abilities positively impact on
Operators’ performance.
Keywords: Dexterity, Job Performance, Sewing Machine Operator
-44- HRM Perspectives – December, 2017
Introduction
Dexterity is commonly used for describing the coordination of small
muscle movements in relation to motor skills of the hands and fingers,
which usually in coordination with the eyes. Further the word of
dexterity can be described as skill and grace in physical movement,
especially in the use of the hands & eye with the mental skill. The
physical skills are movement, coordination, manipulation, speed,
actions demonstrate someone’s psychomotor ability. Motor skill is the
word used to describe the movements and action of the muscles. When
applied to the theory of human aptitude, this is called "manual
dexterity”. This motor skill of a person is described under two sections.
One is “gross motor skill” and the other one is called “fine motor skill”.
In fine motor skills use the small muscles of the fingers, toes, wrist, lips
and tongue. Gross motor skills are, the bigger movements which use
large muscles in the arm, legs & feet. Basically, a dexterity test is a test
that is done to inspect someone's eye & finger coordination when the
person doing a task. In dexterity test, given task needs to be complete
within a specified time period and therefore the person who is involved
in a dexterity test is supposed to complete the allocated task accurately.
This provides an opportunity to identify how the person’s ability to
coordinate eye & finger as well as concentration in an assigned task.
A garment factory situated in the Katunayake industrial processing
zone was selected for this study. This factory highly concentrates
dexterity abilities of machine operators. The interview process for
selecting none experienced employees as a trainee sewing machine
operator is consisted testing the dexterity ability. In the processes of
training and development and performance evaluation also, dexterity
abilities are considered. Currently this factory uses four types of
dexterity tests; Pin Board Test, Marble Test, Card Test and Puzzle Test.

-45- HRM Perspectives – December, 2017
Pin Board Test
Sewing machine operator is expected to flip some pins and insert them
in the other side of the board using both hands. Time taken to perform
the test must be recorded. The objective is to measure the applicant’s
dexterity, ability such as fingers, hand & eye coordination.
Marble Test
Sewing machine operator is supposed to transfer marbles from one box
to another by passing it through the tube. While performing the test the
candidate is allowed to look only at the tube. Time taken to perform the
test will be recorded. The objective is to measure the applicant’s
dexterity, ability in coordination of fingers & eye.
Card Test
The sewing machine operators are supposed to divide the 56 cards into
two sides & time taken will be recorded. Expected to measure the
finger and hand dexterity by doing this exercise.
Puzzle Test
The sewing machine operator is expecting to follow the puzzle lines
using the eyes with concentration to identify the end points of each line
in the puzzle. In here the operator cannot move either the pencil or the
finger along the puzzle lines. Then the operator needs to transfer the
figures from the left column to the right column, which matches with
the end lines. Time taken to perform the test must be recorded. The
objectives of this study are to asset the eyesight and the concentration
power of the candidate.

-46- HRM Perspectives – December, 2017
Although the garment factories, consider these dexterity abilities to
check their competence, it is doubtful whether these existing dexterity
tests are able to predict the operators’ job performance. This study aims
to find out the impact of dexterity abilities on employee job
performance. “Identifying the impact of the scores of dexterity tests;
pin board test, marble test, card test and puzzle test on job performance
of sewing machine operators” is identified as the main objective of this
study within the following problem statement.
“To what extent dexterity test scores have an effect on employee
performance predictions.”
Literature Review
Oxford Dictionary describes the dexterity as skill in performing tasks,
especially with the hands. Dexterity is the ability to perform a difficult
action quickly and skilfully with the hands, or the ability to think
quickly and effectively (Cambridge English Dictionary).
A test which uses applicative selecting or to predict the suitability to
perform a job are two types and one type is attainable or achievement
tests and other type is the ability or aptitude tests. The manual dexterity
is one of aptitude tests which use to predict the job performance in
many industries. These aptitude tests consisted with general learning
ability, verbal aptitude, numerical aptitude, general learning perception,
clerical perception, motor coordination, finger dexterity & manual
dexterity (Pendlebury, 1970).
According to (Latash & Turvey, 1996), dexterity is an ability to solve a
motor problem. “Dexterity still refers to quickness, agility, flexibility,
and skilfulness of our body”. Further, they impress that the notion of
quickness also has both qualitative and quantitative aspects. Dexterity
ability developing by magicians and it is very interesting. Magicians
develop a unique set of dexterity skills that focus on making their hands
quicker than the eyes of those watching. These manipulative skills

-47- HRM Perspectives – December, 2017
appear to be involved in a variety of different jobs. As a few examples,
some kinds of manipulative ability seem important in such jobs as a
pilot, bombardier, small parts assembly man, typist, tool and die maker,
watch repairman, and machinist (Fleishman & Hempel, 1954).
Various psychomotor tests have been devised since the early 20th
century to test human dexterity and reaction times. A psychomotor test
not only gauges a person's effectiveness in performing various
mechanical tasks, but also his or her ability to process and follow
instructions succinctly. A vocational psychomotor test is administered
to trainees in several occupations. A manufacturing operation may
perform a cursory psychomotor test for a job candidate by simply
placing that person in a high-speed assembly line section and asking
him or her to perform the task for a set period of time. This can give the
employer an idea of how fast and efficient the employee will be in
other capacities. According to Lundergan, W. P., Chambers, D. W., &
Soderstrom, E. J. (2007), surgery and dentistry are two professions that
are generally assumed to require a high degree of manual dexterity or
psychomotor skills. Therefore, assess manual dexterity as an applicant
screening instrument for these professions.
A range of basic skills is tested during a psychomotor test, from
precision, dexterity, coordination and control to reaction times,
stability, speed and coherence. According to Latash & Turvey, (1996)
“A skills professional deserves to be called dexterous, and this is not
because of speed, elegance or other features of his movement, but first
of all, because of the quality of the things made with his hands.”
Dexterity skill levels are varied as the tasks performed by humans. At
present dexterity abilities are checking in many of the fields. They are
specially using for surgery tasks, sports, mechanical activities, as well
as magicians. Dexterity is a very special, attractive and valued as it can
be applied in many different situations. It required for professional
skills, labour movements as well as in the sport fields. According to
Otaki (2012), crucial growth of a firm depends on how efficiently the
dexterity is internalized. The correct evaluation of the dexterity is the
engine for the growth of a firm. Further, as per Latash & Turvey,

-48- HRM Perspectives – December, 2017
(1996) another feature of dexterity is it builds a bridge to the area of
genuine intellect. It is an accumulation of life experience in the field of
movement & actions. Therefore, dexterity frequently increases with age
and is preserved until later years more than other psychophysical
capacities.
According to the (Bobrow,1989), one of the validation projects which
is conducted by a professional resource group showed the results. They
have developed a pre- employment test to predict the operational
performance. This test consisted of 02 parts and the first part was used
to measure the operator’s dexterity & the second part of the test
measured the operator’s reasoning ability. In this test an operator would
have to pass both the tests (dexterity & test paper for check the
reasoning ability) from the interview. They used current operators in
selected plants to try the test. This study revealed that operators who
have passed the written and dexterity, ability test ware earn $30 a week
more in direct labour dollars than the persons who did not pass the test.
Therefore, that means according to Bobrow (1989) passing ability has a
direct relationship with the performance of work.
Amarasinghe (2004), says that significant efficiency improvements and
quality of workmanship gains can be achieved by using motor ability
tests with right selection-ratios. The writer has used for this
investigation a test called “Canadian Force General Aptitude Test
Battery”. Though the dexterity is used to predict the suitability for
certain job performance and though it is used as an employee recruiting
criterion it is indicates another feature of this dexterity ability. Latash &
Turvey (1996) describes that “Everyday experience indicates that
dexterity is not an inborn, unchangeable capacity that is impossible to
gain just as it is impossible to change one’s inborn eye colour”.
Dexterity is exercisable.
When considering the dexterity ability, it cannot be described as a
unitary ability. Because, as per Fleishman & Hempe (1954) if manual
dexterity was a unitary ability it would seem that people proficient at
one manual activity would have the aptitude to become equally

-49- HRM Perspectives – December, 2017
proficient at any other type of manual activity. Above authors would
expect any good test of manual dexterity to predict about equal success
in a wide variety of manual jobs. However, Fleishman & Hempe (1954)
introduce an idea about the dexterity test validity, in their surveys
called “A Factor Analysis of Dexterity Tests”. According to them
validities of such tests “indicate that the same dexterity test may show
zero validity for one manual job and significant validity for another.
Similarly, for the same job, one dexterity test may be useful and
another test useless. Moreover, the correlations among different
dexterity tests are generally not high. Under the area of “Operator-
related Predictors”, Racine, Chen and Swift (1992) expressing another
idea about the predictions using dexterity test under the tropic of
psychomotor potentials. They say that “An operator with high dexterity
may learn faster, regardless of the operation. This factor is intended to
capture the dexterity of an operator and is used as a co-variant to offset
the non-operating-related variation in learning progress among trainees.
It will also be used to predict the performance of the individual
operator”. According to this situation, the researcher aims to discover
the real impact of dexterity, ability on operators’ performance through
this study.
Method
Using Simple Random Sapling method, 88 Sewing Machine Operators
were selected from a garment factory situated in Katunayake Industrial
Processing Zone. Their current performance records were obtained
from the factory Management Information System.
According to the factory performance evaluation system, performance
of a Sewing Machine Operator has been described using 02 criteria of
efficiency percentage and defect percentage.
Efficiency is calculated as (Earned Minutes / Working minutes) * 100

-50- HRM Perspectives – December, 2017
Earned minutes are the total standard minutes value the operator has
produced for the considering period, which calculated by the standard
minute values for each operation is multiplying by the quantity
produced from each operation. Operation wise standard minute values
are established by the qualified work study officers using worldwide
acceptable work measurement techniques which using in the garment
industry. Working minutes is the actual working time in minutes for the
same period, which the operator elapsed for the particular production.
Defects percentage can define as; (The number of defects findings in
inline inspections) / (Total quantity checked) * 100.
These defects percentages also considered for the same period where
the efficiency calculated.
This garment factory currently uses four types of dexterity tests such as
marble, pin board, cards and puzzle. These dexterity, ability tests were
carried out for the selected sample of sewing machine operators and the
actual time taken for each test were recorded. These tests were
conducted at a special location in the training center to avoid
disturbances and obstacles. According to the factory standard based on
actual timing, following point system was allocated to evaluate the test
score of each participant and following hypothesis were developed.
Point scheme for Pin Board exercise
T= Time taken in minutes
T<=0.65min=4 Points
T=0.65-0.85min=3 Points
T=0.85-1.05 min=2 Points
T>1.05=1 Points
Hypothesis one - If test score is higher in Pin Board exercise, then the
operator performance is high.

-51- HRM Perspectives – December, 2017
Point scheme for Marble Exercise
T= Time taken in minutes
T<=1.25min=4 Points
T=1.25-1.50min=3 Points
T=1.50-1.75 min=2 Points
T>1.75=1 Points
Hypothesis two - If test score is higher in Marble exercise, then the
operator performance is high.
Point scheme for Cards Exercise
T= Time taken in minutes
T<=0.75min=4pts
T=0.75-1.00min=3
T=1.00-1.25 min=2
T>1.25=1
Hypothesis three - If test score is higher in Cards exercise, then the
operator performance is high.
Point scheme for Puzzle Exercise
T= Time taken in minutes
T<=2min=4 Points
T=2min -3min= 3 Points
T=3min-4min=2 Points
T>4min=1 Points

-52- HRM Perspectives – December, 2017
Hypothesis four - If test score is higher in Puzzle exercise, then the
operator performance is high.
Results
Correlation Analysis
The Correlation analysis was conducted in order to find the correlations
existing between the variables. The Pearson’s coefficient of correlation
was used to measure the associations between dexterity test scores and
the operators’ performance. The results of the correlation analysis are
presented in the following table.
Table 1. Correlations
PBT MT CT PT
PER .352(**) .402(**) .373(**) .265(*)
**Correlation is significant at the 0.01 level (2-tailed).
*Correlation is significant at the 0.05 level (2-tailed).
N= 88
The results of the correlation analysis reveal that dexterity
competencies tend to be strongly associated with the work
performance. All correlation coefficients are positively significant. The
strongest positive significant association shows in between marble test
ability and work performance and its coefficient of correlation is 0.402
at a 0.01 significance level. (r= 0.402, p< 0.01). Card test ability and
work performance shows a positive and significant association. Its
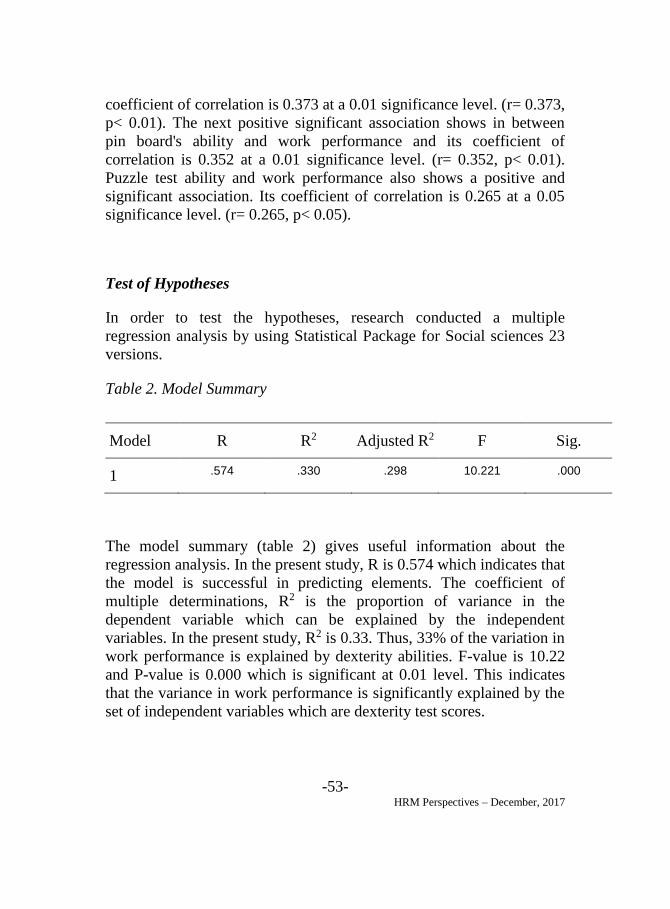
-53- HRM Perspectives – December, 2017
coefficient of correlation is 0.373 at a 0.01 significance level. (r= 0.373,
p< 0.01). The next positive significant association shows in between
pin board's ability and work performance and its coefficient of
correlation is 0.352 at a 0.01 significance level. (r= 0.352, p< 0.01).
Puzzle test ability and work performance also shows a positive and
significant association. Its coefficient of correlation is 0.265 at a 0.05
significance level. (r= 0.265, p< 0.05).
Test of Hypotheses
In order to test the hypotheses, research conducted a multiple
regression analysis by using Statistical Package for Social sciences 23
versions.
Table 2. Model Summary
Model R R2 Adjusted R2 F Sig.
1 .574 .330 .298 10.221 .000
The model summary (table 2) gives useful information about the
regression analysis. In the present study, R is 0.574 which indicates that
the model is successful in predicting elements. The coefficient of
multiple determinations, R2 is the proportion of variance in the
dependent variable which can be explained by the independent
variables. In the present study, R2 is 0.33. Thus, 33% of the variation in
work performance is explained by dexterity abilities. F-value is 10.22
and P-value is 0.000 which is significant at 0.01 level. This indicates
that the variance in work performance is significantly explained by the
set of independent variables which are dexterity test scores.

-54- HRM Perspectives – December, 2017
Table 3. Model Parameters
Independent Variables
(Test Scores)
β t Sig.
Pin Board .139 1.577 .119
Marble .263 2.655 .010
Card .185 2.309 .023
Puzzle .279 3.188 .002
Dependent Variable: Job Performance
According to the regression result, the highest magnitude represents the
puzzle ability. It indicates that there is a positive relationship with work
performance. In this case the regression coefficient is 0.279 at a 0.01
significance level. Marble and card abilities also show positive
relationships with work performance. In this case regression
coefficients are respectively 0.263 and 0.185. Here, marbling ability is
significant at 0.01 level and card ability is significant at 0.05 level.
Based on these results, status of hypotheses can be summarized as
follows.

-55- HRM Perspectives – December, 2017
Table 4. Status of Hypotheses
Hypotheses Status Reason
If test score is higher in pin board
exercise, then the operator performance
is high.
Reject Insignificant
If test score is higher in marble
exercise, then the operator performance
is high.
Accept Significant at
0.01 level
If test score is higher in cards exercise,
then the operator performance is high.
Accept Significant at
0.05 level
If test score is higher in puzzle exercise,
then the operator performance is high.
Accept Significant at
0.01 level
Conclusion
The aim of the study was to find out the impact of dexterity abilities on
sewing machine operators’ performance. Four types of dexterity
exercises; marble, pin board, cards and puzzle were conducted among
machine operators of a selected garment factory situated in Katunayake
Industrial Processing Zone. According to the findings of the study, it
was found that marble, cards and puzzle abilities positively impact on
operators’ performance. Puzzle ability has the highest impact on their
performance. Therefore, dexterity tests are recommended to use to
predict machine operators’ performance in the garment industry.

-56- HRM Perspectives – December, 2017
References
Amarasinghe, A., 2004. Telescoping failures in industrial sewing
machines. Retrieved September 19, 2017, from www.lib.mrt.ac.lk:
http://dl.lib.mrt.ac.lk.
Bobrow, W., 1989. Using pre-employment testing to improve profits.
Retrieved September 26, 2017, from www.allaboutperformance.biz:
http://www.allaboutperformance.biz/pdfs/HRpreemployment.pdf.
Fleishman, E. A., & Hempel, W. E., 1954. Personnel Psychology, A
Factor Analysis of Dexterity Tests, pp 15-32.
Latash, L., & Turvey, T., 1996. Dexterity and its developments, New
York: Psychology Press.
Lundergan, W. P., Chambers, D. W., & Soderstrom, E. J., 2007,
"Tweezer Dexterity Aptitude of Dental Students", pp 1090-1097.
Otaki, M., 2012, Modern Economy, The Evaluation of Dexterity and a
Theory of the Growth of a Firm", pp 226-229.
Pendlebury, C., 1970. Industrial & Commercial Training, Deciding to
use tests, pp 229-228.
Racine, R., Chen, C., & Swift, E., 1992. Clothing Science and
Technology, The Impact of Operator Efficiency on Apparel Production
Planning, pp 18-25.
Wirtz, W. W., 1966. Reliability; Test Validity. Retrieved September 20,
2017, from www.eric.ed.gov:
http://files.eric.ed.gov/fulltext/ED061337.pdf.

-57- HRM Perspectives – December, 2017
IMPACT OF TRAINING PRACTICES ON
DEVELOPMENT OF PUBLIC SECTOR
EMPLOYEES’ SKILLS AND KNOWLEDGE: A
STUDY BASED ON EXECUTIVE GRADE
EMPLOYEES OF THE PARLIAMENT OF SRI
LANKA
K. Jayeratne - MHRM
Faculty of Graduate Studies
University of Colombo
and
T. L. Sajeevanie - PhD
Senior Lecturer
Department of Human Resource Management
University of Sri Jayewardenepura, Sri Lanka
ABSTRACT
Human resources are the most valuable assets of any institute over all
other resources. Practices of Training are complementing the process
of conducting Training to enhance the Skills, Knowledge and Attitudes.
Many scholars have been empirically found that there is a strong
positive relationship in between the Training Practices and the Skills
and Knowledge. As per the constitution of the People’s Republic of Sri
Lanka, the Parliament is a unique organization in the country and the
staff of the Parliament could be considered as a ‘Special Group of State
Workers as per the same constitution and the ‘Parliamentary Staff Act
as amended 1994’ and the ‘Powers and Privileges Act, 1999 of the

-58- HRM Perspectives – December, 2017
Parliament of the Democratic Socialist Republic of Sri Lanka’. The
objectives of this study are; to find out the relationship between
Training and Development Practices in the Development of Skills of the
Executive Grade Employees of the Parliament and to find out the
relationship between Training and Development Practices in the
Development of Knowledge of the Executive Grade Employees of the
Parliament. The total Executive Grade Employees of the Parliament
were 53 and only 51 have been responded to the research as the
researcher has taken the total population for the study. It has been
revealed that there was no relationship between Training and
Development Practices in the Development of Skills and the Knowledge
of the Executive Grade Employees. The development of skills and
knowledge could be enhanced by introducing different practices of
Training, other than the practices in use at present, as different
organization may have to use the practices of Training unique to them
to gain the success as found in the literature. Further, it is
recommended to study ‘the impact of Training Practices on motivation
of employees’ for future researchers.
Key Words: Training Practices, Development of Skills, Development of
Knowledge, Parliament of Sri Lanka
Introduction
It is a well-known fact that the Human Resources are very important
and significant for a sustainability of any organization. For integration
and maintenance of the required human resources for a certain
organization, they are to be managed. Hence the management of the
Human Resource or more commonly said Human Resource
Management (HRM) immerged to make a strategic and coherent
approach to manage the most valuable Human Resources of an
organization to achieve the best outcomes of strategic aspects of an
organization and to accomplish the goals and needs of the individual
employees. This could be done through effective selection and
utilization of employees (Werner & DeSimone, 2006).

-59- HRM Perspectives – December, 2017
To make sure the Human Resources of any organization, meet these
requirements the smooth functioning of the functions of Human
Resources is very vital. Contribution, for the development of high
performance culture is a goal of Human Resources Management
(Armstrong, 2003). Hence, to achieve a better job performance the
effective and efficient functioning of the functions of HRM is vital.
Training and Development is one of the very important functions of
HRM. By the definition itself, the Training and Development is a
formal process, which enhances the ability and motivation of
employees to reach and fulfill the vision, mission and objectives of an
organization (Opatha, 2012). These successful end results of Training
and Development are achieved from development of the knowledge,
skills and positive attitudes (Ban & Faerman, 1990). At the same time a
well-designed Training and Development programme creates higher
Employee Job Performance by proper enhancement in Knowledge,
Skills and Attitudes (Salas, Tannenbaum, Kraiger & Smith-Jentsch,
2012). On the other way the development of knowledge, skills and
positive attitudes build competencies (Opatha, 2012). Competency
means the ability of someone who has got to do a certain job
successfully.
At the same time the Practices of Training are another important
function in HRM too in developing competency as it affects on the
acquisition of Knowledge, Skills and Attitudes (Salas, Tannenbaum,
Kraiger & Smith-Jentsch, 2012). On the other way, enhancing the Job
Performance is a goal of Training and Development. Hence the
enhanced Knowledge, Skills and Attitudes lead to develop Job
Performance. Therefore, the enhanced Competency leads to develop
Job Performance. But to achieve the best results in conduct of Training
and Development, the way the Training and Development is done, is
very much vital as it creates a favorable background for achieving
better Job Performance (Thavakumar & Nawaratne, 2015; Kaufman,
1985).
-60- HRM Perspectives – December, 2017
The Parliament has been described in the section four of the
Constitution of the country as one of the most unique out of three;
those are the executive and the judiciary being the other two. Hence the
Parliament of Sri Lanka is itself a unique institute, which exercises the
legislative power of the people as per the section 4 (a) of the
Constitution of Democratic Socialist Republic of Sri Lanka. As per the
section 170 of the Constitution of the Democratic Socialist Republic of
Sri Lanka a ‘Public Officer’ is a person who holds any office under the
Republic, other than a judicial officer. At the same time the Secretary
General of the Parliament and the staff also has been excluded under
the category of a ‘Public Officer’ by the same section of the
Constitution (The Constitution of the Democratic Socialist Republic of
Sri Lanka, 2001, p.127-128).
The Secretary General and the staff of the Parliament have been
defined as a ‘Separate Service’ by the ‘Parliamentary Staff act as
amended 1994’ of the Parliament of Ceylon. The officer of the
Parliament, has been defined as ‘any person who may from time to time
be appointed to the staff of Parliament, whether permanently or
temporarily, and includes the clerk and any police officer on duty
within the precincts of Parliament’ as per the Powers and Privileges
Act, 1999, of the Parliament of the Democratic Socialist Republic of
Sri Lanka (p.2).
There are 834 total numbers of employees working and out of them 53
have been belong to the Executive Grade as per the Annual
Performance Report 2014 of the Parliament of Sri Lanka. As one of the
foremost institution, who engaged in the process of decision making to
rule the country, the execution of its duty efficiently, effectively and on
time is paramount. Though the requirement is such sometimes it has
been witnessed that those aspects have not been reached or sometime
those have been reached with a great difficulty. Most of the time, the
timely completion of them has been a great challenge. The mismatch in
the existing knowledge with the current technology in use, the issues in
the competencies of the replacements made to cover the turnover of
employees due to retirements or any other reasons, attitudinal issues in

-61- HRM Perspectives – December, 2017
using modern technology are some reasons for the above issues as
found in the literature and survey data. Not only that though the
Members of Parliament have not commented negatively so far, some of
them have emphasized on developing the existing performance level of
the employees of the Parliament (Parliamentary debates date 03rd
December 2015, P 56-57).
All these above incidents indicate that there is a lack in the
Competency. Training and Development is one of the solutions to
minimize this competency gap (Hoffmann, 1999; Opatha, 2012). Not
only in the global context (Abdulla & Al-Homoud, 1995), but in the
local context, the studies done with regard to the Training and
Development or the Practices of Training, Competency and Job
performance are very much minimal (Thavakumar & Nawaratne,
2015). Further to this, that there are no or minimal studies done in this
subjective area with regard to the Parliament of Sri Lanka. Hence it is
not possible to identify whether the present scenario has been existed
mainly from the hands of the Executive Grade or the Non-executive
Grade employees.
Employee Job Performance is a function of Ability and the Motivation
(Opatha, 2012). Hence, when the motivation is constant the relationship
of the Employee Job Performance and the Ability would become
directly proportionate to each other. Ability is the Competency as
described by Opatha (2012). Hence, when the Competency is high, the
Employee Job Performance is also to be high. Further to that the
Competency is built by the Skills, Knowledge and the Attitudes. Skills,
Knowledge and the Attitudes are the outcome of the Training and
Development (Opatha, 2012). The efficient and effective Training
Practices develop a better Employee Job Performance through the
enhancement of Knowledge, Skills and Attitudes (Salas, Tannenbaum,
Kraiger & Smith-Jentsch, 2012). According to the observed issue, the
lack in the Skills, Knowledge and the Attitudes of the current
employees may be one of the prime reasons which have been made the
current situation as it has been revealed in the interviews held with the
Heads of the Departments. That means there is a problem in the

-62- HRM Perspectives – December, 2017
Employee Competency and there off the Employee Job Performance. A
pilot survey carried out using 10% of the total population of the
Parliament of Sri Lanka, revealed following statistical values.
Table 1- Descriptive Statistics
N Minimum Maximum Mean Std. Deviation
EJP before T & D 84 2.00 4.00 2.5714 .54410
EJP after T & D 84 2.00 4.00 2.8929 .56007
Competency before T&D 84 2.00 4.00 2.6071 .54370
Competency after T&D 84 2.00 4.00 3.0000 .41797
Valid N (list wise) 84
According to table 1, it is revealed that there is no considerable
development either in Competency or in Employee Job Performance
even after undergone a related Training and Development. These
statistical values have been achieved through the statistical analysis
done for the assessments conducted by the respective superiors on the
employees of the sample population, (all of them have undergone at
least a single Training and Development programme related to their
respective duty.
Literature Review
The literature revealed that there are certain core competencies needed
to enhance the Job performances (as cited in Berge, de Verneil, Berge,
Davis & Smith, 2002, p.45, McLagan, 1983, 1989a, 1996; Richey et
al.,2001:Hoffmann, 1999; Opatha, 2012; Sajeewanie and Opatha, 2007;
Emmerling, Ryan & Spencer, 2009). Hence the competencies build,
may not relevant to the Job Performance. Hence it is required to
identify the needed competencies before sending for Training and

-63- HRM Perspectives – December, 2017
Development (Hayes, Rose-Quirie and Allinson, 1998; as cited in
Deist, & Winterton, 2005, p.27, Scarborough, 1998). This could be
illustrated by the ‘Rummler’s Model’ too. This could happen when
suitable Training and Development Programmes are not being selected
and most relevant employees are not being sent for Training and
Development and etc. that indicates there is a problem in current
practices in Training for the development of Competency.
At the same time the researcher could not identify any definite
Practices in Training, practiced by the Parliament of Sri Lanka. But the
researcher could identify some Practices through the interviews had
with certain Heads of the Departments. Hence out of many reasons it
looks that, for the current Employee Job Performance, the Training
Practices which are in operation currently, may not be fit enough for
the organization’s today’s demand. Hence summarily, there is a need in
enhancing Employee Job Performance in the Parliament of Sri Lanka.
To satisfy the need of enhancing the Employee Job Performance,
developing the Competency, Skills and Attitudes is one vital factor. To
develop them, the Practices of Training use by the Parliament is
another vital factor. At the same time the absence of any research done
or research done with regard to the subjective area in the Parliament of
Sri Lanka has created a situation of further studying. The objectives of
this study are; to find out the impact of Training and Development
Practices in the Development of Skills of the Executive Grade
Employees of the Parliament and to find out the impact of the Training
and Development Practices in the Development of Knowledge of the
Executive Grade Employees of the Parliament.
Methodology
The researchers used the entire population of the Executive Grade
Employees of the Parliament of Sri Lanka for the main research. There
are 53 Executive Grade Employees working in the Parliament. Two of
them refused to respond to the questionnaire. Hence the balance of the
-64- HRM Perspectives – December, 2017
entire population of them has been considered by the researcher for this
research.
The researchers have identified Training Practices as the independent
variable and Employee Job Performance as the dependant variable
throughout the entire analysis. Inter item reliability of the questionnaire
signifies the internal consistency of it. This has been calculated from
‘Cronbach Alpha Value’ (if the Cronbach Alpha Value>0.7, then the
reliability is high) (Lewis & Thornhill; Sekaran & Bargie, 2014).
The SPSS 16 software data analysis package had been used throughout
for analyzing data for all objectives. For the objectives, to find out the
relationship between respective independent and dependent variables,
the correlation in between those is calculated. If a significant
correlation exists (p_value less than 0.05) ‘F’ value, which could be
obtained from the ‘Anova Table’ and ‘t’ value and ‘β’ (beeta) values
could be obtained from the ‘Coefficients Table’. The ‘F’ value could be
used to reveal the significance of the regression line and the ‘t’ value
could be used to illustrate the extent of the significance of the
independent variable to the model. The ‘Darbin Watson Statistic’ could
be used to imply the errors are random and independent, if the value of
it is closer to two. This value could be obtained from the table of the
‘Model Summery’.
Considering the time factor, the study has been limited to the Executive
Grade Employees of the Parliament of Sri Lanka. Due to the sensitivity
and certain rules and regulations of the organization, it has not been
possible to expose some of the demographic data related to the
employees of the Parliament of Sri Lanka.
Knowledge, Skills and the Attitudes are the outcome of Training and
Development, which is the Competency (Opatha, 2012; Armstrong,
2003; Dessler, 2013). Hence Knowledge, Skills and the Attitude have
to be measured to evaluate the ‘Competency’. But due to the difficulty
in measuring the Attitudes of human beings, the researcher has limited
the measuring of Competency to Knowledge and Skills of employees.

-65- HRM Perspectives – December, 2017
The researcher could not identify definite practices in Training used by
the organization. Hence the researcher intended to consider assessing,
Core Skills and Knowledge need to improve the current job, future jobs
and to increase productivity, Training and Development opportunities
provide for employees by the organization, Desire of the employees for
engage in Training and Development, content of them, standard of the
resource personnel and materials use in the Training and Development
Programmes and knowledge acquired and application of such
knowledge as the practices of Training as those have identified through
interviews, the researcher had with the heads of the departments.
Previous researches done in the subjective area have been very much
minimal both in the global and local context. Most probably this would
be the first research in this subjective area, done with regard to the
Parliament of Sri Lanka. Hence the number of literature found related
to the subjective area has become very much limited.
Theoretical Aspects
There are many theoretical aspects which could be utilized in
explaining the Human Resource Practices and the real consequences of
them. Out of those General System Theory, Resource Dependence
Theory, Human Capital Theory, Resource Based Theory, Social
Exchange Theory, Job Demand-Resources Theory are the foremost
(Delaney & Huselid, 1996).
In the General System Theory, it says that all the happenings are
described in systems and different combination of these systems ends
up in different experiences (Bertalanffy, 1968). Under this it is used to
study the systems in general. Then it could be understood that the
combination in different levels of these systems makes different
experiences. More elaborately this could be explained as input,
throughput and output systems engaged in the operation. Input could be
Knowledge, Skills, Attitudes and Resources, the throughput could be
Human Resource Practices and the output could be the Performances
(Wright, 1993). According to the theoretical founding of various
scholars proper Competency develops Employee Job Performances.

-66- HRM Perspectives – December, 2017
This happens only when the appropriate Knowledge, Skills and
Attitudes are combined according to this theory. Hence, if the
Employee Job Performances are not developed due to the Competency,
then the Training Practices used may not appropriate.
The behavior of an organization depends on the critical resources,
which control the critically important operational activities of an
organization (Werner, 2008; Armstrong, 2012; Wright, 1993). Likewise
the Human Resources of an organization could be critically important
for the operation of it due to the competencies the human beings
possessed with. Hence, if the competencies the human beings possessed
with are not critically important then the importance of the human
beings to the Job Performance, deteriorate. Job resources are the
resources which provide those demands such as Payments, Supervisory
Support, Training and Development provided and etc (as cited in
Nawaratne & Thawakumar, 2015, p.618, Schaufeli & Bakker, 2004).
Likewise the Skills, Knowledge and the Attitudes generated depend on
the practices used by the organizations in Training and Development.
In this case the Training Practices become the resource and the Skills,
Knowledge and the Attitudes become the Demands.

-67- HRM Perspectives – December, 2017
The Strategic Impact of Management Development
Figure 1: The strategic impact of management development.
Source; Armstrong, 2003 p.579
As described by Armstrong (2003), (Figure 1) the business strategy of
an organization is formulated considering the existing business
environment. The critical success factors are derived from the business
strategy considering the existing business environment. The success of
the critical success factors depends on the capability of the
organization. The business performance of an organization depends on
the organization capability. But the organization capability mostly
depends on the management capability. Capability of the management
is depending on the management development.
Business
strategy
Critical
Success Factors
Management
Capability
Business
Environment
Organization
Capability
Business
Performance

-68- HRM Perspectives – December, 2017
Conceptualization
Hence the working definition of Training and Development Practices of
this research is the Training and Development Identification,
Opportunities available for Training and Development, Availability of
the Employees for the Training and Development and the Evaluation of
Training and Development. The working definition of the Development
of Competency of an employee in this research is the Development of
Skills and the Knowledge of the employees.
Data Presentation and Analysis
Demographic data of the population of the executive grade employees
were gathered for Age, Executive Grade Experience, Gender and
Opportunity of having Training and Development. There were no
Executive Grade Employees below the age of 25 years. 98% of the total
population were 36 years or above of the age. The data for age was
collected under five groups. Those were, 25 years and below, 26 to 35
years, 36 to 45 years, 46 to 55 years and 55 years and above.
The Executive Grade Experience of the total population was collected
in five groups. Those were 5 years and below, 6 to 10 years, 11 to 15
years, 16 to 20 years and 21 years and above. Out of the total
population, 55% were having six to fifteen years of executive grade
experience. 13% of the total population were having more than sixteen
years of executive grade experience. But 35 % of the total population
were in the group of below five years of executive grade experience.
The data for gender were collected directly from the web. As per the
data found the majority was males (61%). As per the data adapted from
the intranet of the Parliament indicated, that all the Executive Grade
Employees had undergone at least a single Training and Development
Programme within a ten-year period from 2016 and back in the
organization. The mean value of the existing Training and
Development Practices is 3.61, the mean value of the Skills of the
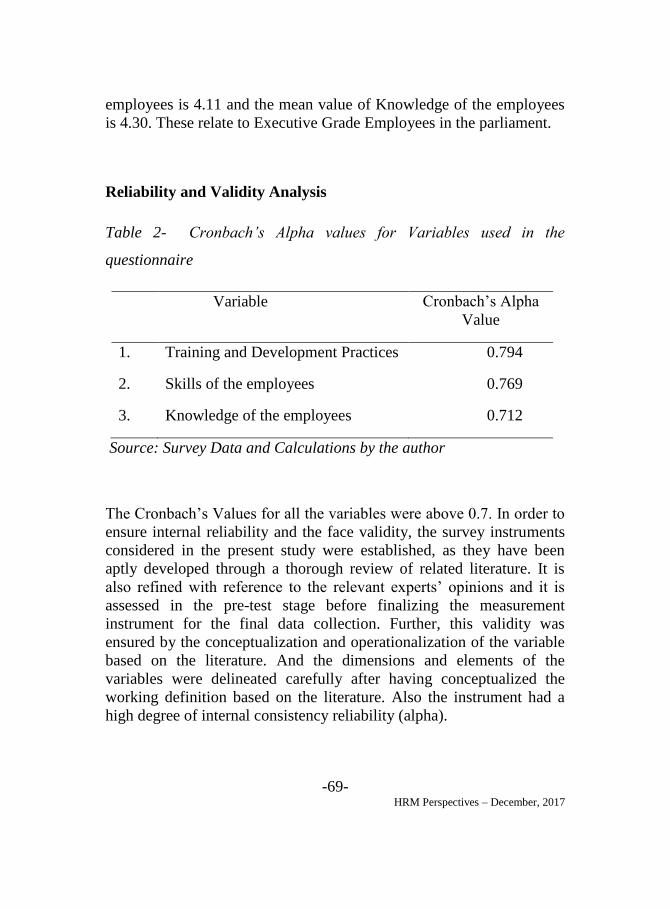
-69- HRM Perspectives – December, 2017
employees is 4.11 and the mean value of Knowledge of the employees
is 4.30. These relate to Executive Grade Employees in the parliament.
Reliability and Validity Analysis
Table 2- Cronbach’s Alpha values for Variables used in the
questionnaire
Variable Cronbach’s Alpha
Value
1. Training and Development Practices 0.794
2. Skills of the employees 0.769
3. Knowledge of the employees 0.712
Source: Survey Data and Calculations by the author
The Cronbach’s Values for all the variables were above 0.7. In order to
ensure internal reliability and the face validity, the survey instruments
considered in the present study were established, as they have been
aptly developed through a thorough review of related literature. It is
also refined with reference to the relevant experts’ opinions and it is
assessed in the pre-test stage before finalizing the measurement
instrument for the final data collection. Further, this validity was
ensured by the conceptualization and operationalization of the variable
based on the literature. And the dimensions and elements of the
variables were delineated carefully after having conceptualized the
working definition based on the literature. Also the instrument had a
high degree of internal consistency reliability (alpha).

-70- HRM Perspectives – December, 2017
Relationship between Training Practices on the Development of
Skills of the Executive Employees of the Parliament of Sri Lanka
As per table 3, the p_value is 0.943. Hence the significance level is
more than 0.05. Therefore, there is no significant correlation in between
Training Practices and the Development of Skills of the Executive
Grade Employees of the Parliament of Sri Lanka.
Thavakumar & Nawaratne, (2015) and Kaufman, (1985) has said that
the Training Practices are positively correlated with the Competency in
their studies. But the Competency is made by Skills, Knowledge and
Attitudes of an employee (Hoffmann, 1999; Opatha, 2012). Hence the
Training Practices would have to be positively correlated with the
development of Skills. But in this research the researcher has found that
there was no significant correlation in between Training Practices and
the Development of Skills due to Training and Development.
Table 3:- Correlations between Training Practices and Development of
Skills of the Executive Grade Employees
Correlations
Training Practices Development of Skills
Training Practices Pearson Correlation
1 .010
Sig. (2-tailed) .943
N 51 51
Development of Skills Pearson Correlation
.010 1
Sig. (2-tailed) .943
N 51 51
Source: Survey Data and Calculations by the author

-71- HRM Perspectives – December, 2017
According to the mean values of table 4 the survey results have been
revealed that the existing Practices in proper identification of core
knowledge and skills for carrying out present and future jobs have been
very good. At the same time the concerns of the organization in adapting
staff into unforeseen changes, increasing productivity and concerns on the
desire of the employee is also very good. But the table 4 revealed that the
survey results received for the opportunities provided for Training and
Development by the organization for the Executive Grade Employees and
the existing Training Evaluation system were not the best but it is alright up
to a certain extent.
Table 4 :- Current Training Practices
Training
Identification
Opportunities
provided for T
& D
Desire of
Employees for
T & D
Training
evaluation
Valid 51 51 51 50
Missin
g 0 0 0 1
Mean 4.4085 2.8431 3.7255
2.94
33
Std. aviation .59751 .98737
1.0968
8
.787
24

-72- HRM Perspectives – December, 2017
Relationship between Training and Development Practices on the
Development of Knowledge of the Executive Grade Employees of the
Parliament of Sri Lanka
Table 5:- Correlations Training Practices and the Development of
Knowledge of the Executive Grade Employees
Correlations
Training Practices
Development of Knowledge
Training Practices Pearson Correlation
1 .089
Sig. (2-tailed) .534
N 51 51
Development of Knowledge
Pearson Correlation
.089 1
Sig. (2-tailed) .534
N 51 51
Source: Survey Data and Calculations by the author
According to the table 5 it was tested the relationship between training
and development practices and development of knowledge of the
employees. According to the results the p - value is 0.534 (Table 5).
Hence the significance level is more than 0.05. Therefore, similar to the
relationship among Training and Development Practices and the
Development of Skills, there is no significant correlation in between the
Training and Development Practices and the Development of
Knowledge due to Training and Development of the Executive Grade
Employees of the Parliament of Sri Lanka. With the similar conditions
of the Training Practices (Table 5) the Development of the Knowledge
level of Executive Grade Employees (Table 6) has been very poor
(Mean value for all the questions under knowledge was below 2).
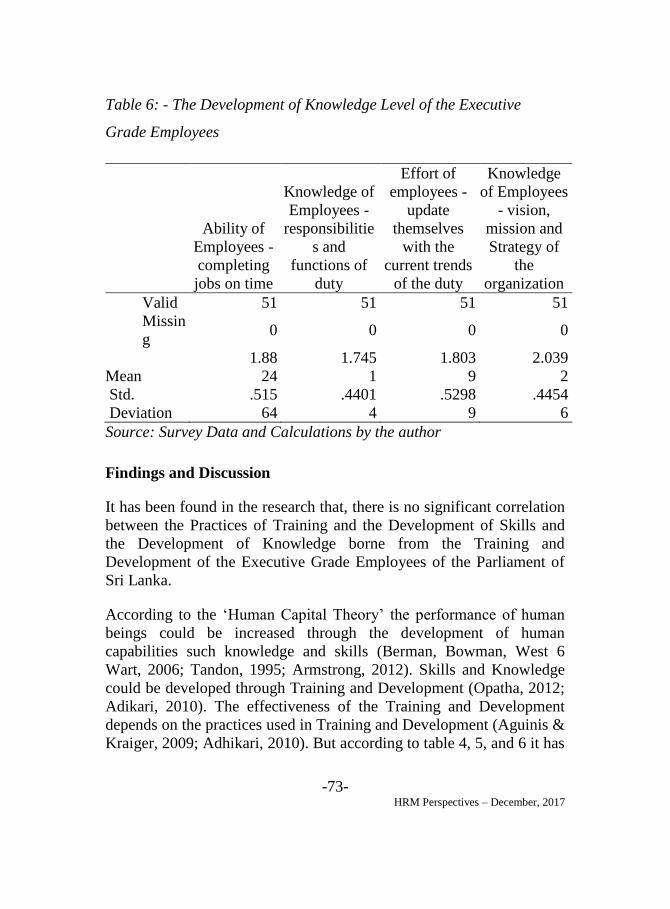
-73- HRM Perspectives – December, 2017
Table 6: - The Development of Knowledge Level of the Executive
Grade Employees
Ability of
Employees -
completing
jobs on time
Knowledge of
Employees -
responsibilitie
s and
functions of
duty
Effort of
employees -
update
themselves
with the
current trends
of the duty
Knowledge
of Employees
- vision,
mission and
Strategy of
the
organization
N Valid 51 51 51 51
Missin
g 0 0 0 0
Mean
1.88
24
1.745
1
1.803
9
2.039
2
Std.
Deviation
.515
64
.4401
4
.5298
9
.4454
6
Source: Survey Data and Calculations by the author
Findings and Discussion
It has been found in the research that, there is no significant correlation
between the Practices of Training and the Development of Skills and
the Development of Knowledge borne from the Training and
Development of the Executive Grade Employees of the Parliament of
Sri Lanka.
According to the ‘Human Capital Theory’ the performance of human
beings could be increased through the development of human
capabilities such knowledge and skills (Berman, Bowman, West 6
Wart, 2006; Tandon, 1995; Armstrong, 2012). Skills and Knowledge
could be developed through Training and Development (Opatha, 2012;
Adikari, 2010). The effectiveness of the Training and Development
depends on the practices used in Training and Development (Aguinis &
Kraiger, 2009; Adhikari, 2010). But according to table 4, 5, and 6 it has

-74- HRM Perspectives – December, 2017
been revealed that though the opportunities provided by the
organization to the Executive Grade Employees for Training and
Development had been alright up to a certain extent the criteria used in
the evaluation of training and development, have not been satisfactory.
But it shows that the Current practices used for the identification of
required knowledge and skills to carry out current jobs and future jobs
and the need of Training and Development to adapt the employees for
unforeseen changes and increasing the productivity are very strong in
the process of the identification of the training need. At the same time
the criteria practiced by the organization to evaluate the content, the
materials used and the quality of the resource personnel of the Training
and Development programs, was not satisfactory. Not only that, even
the system practiced by the organization to evaluate the knowledge
acquired from the Training and Development, evaluate the application
of such knowledge and the contribution of such knowledge for the
future of the organization was not satisfactory too. Hence certain
practices identified by the researcher to understand the criteria used by
the organization in Training and Development have not been
satisfactory. Hence, though it says in the ‘Human Capital Theory’, that
the Employee Job Performance have been developed due to the Skills
and The Knowledge generated, in this study it has been revealed that
the Skills and the Knowledge has not developed the Employee Job
Performance. It has been empirically found, that there is no significant
correlation in between ‘Training Practices’ and the ‘Development of
Skills’ and the ‘Development of Knowledge’ generated from Training
and Development. That means that the Knowledge and Skills generated
might not be significant to the conduct of duty of the Executive Grade
Employees of the Parliament of Sri Lanka.
In this research the researcher has identified the practices of Training as
the resources provided by the organization to acquire the needed
demands, which are the Skills and the Knowledge. But the researcher
has found that there is no significant correlation in between Training
Practices and the Development of Skills and the Knowledge. Hence it
may be because of the resources provided by the organization may not
appropriate enough to produce expected demands.

-75- HRM Perspectives – December, 2017
The Skills and Knowledge, which have been produced by the Training
and Development Programmes so far, might have not been critical in
nature in the performance of the duty of the Executive Grade
Employees of the Parliament of Sri Lanka. Hence it may be a reason
for not producing a significant correlation in between the Training
Practices and the Development of Skills and the Knowledge.
Not only that, according to the model of ‘The Strategic Impact of
Management Development’ (Armstrong, 2003) (Figure 1), the
performance of any business depends on the Organization’s Capability.
The Organization Capability depends on the Management Capability.
The Management Capability to be sustained on the Critical Success
Factors of the respective business and the Organization. The critical
success factors are designed depending on the business environment. If
those Skills and Knowledge generated may not such critical to the
operation, then those competencies may not strongly affect on
enhancing the organization capability. Hence the end performances
may not enhance due to above said Skills and Knowledge (Sajeewanie
and Opatha, 2007; Emmerling, Ryan & Spencer, 2009).
Recommendations
As found in the study most of the drawbacks were in Practices of
Training. Further to that it has been found that the current Practices in
Training do not have any considerable effect on the Development of
Skills and the Knowledge of the Executive Grade Employees. Hence
there is a need in changing the Training Practices used by the
organization. It has been clearly visible that the areas of opportunities
provided by the institute towards the Executive Grade Employees were
satisfactory up to a certain extent only. Even the criteria used by the
organization to evaluate the Training and Development programs were
not satisfactory. Hence it is recommended to create convincing policy
decisions on selecting Executive Grade Employees for Training and
Development Programmes. At the same time, it is recommended to
introduce an efficient evaluation criterion to evaluate the Training and
-76- HRM Perspectives – December, 2017
Development process related to the Executive Grade Employees of the
organization. It may be able to identify the most effective criterion,
through another research.
Conclusion
The researcher has done this study to find out the relationship between
Training Practices on Knowledge and skills of the employees. Further
the researcher has narrowed the scope of the study to the Executive
Grade Employees of the Parliament of Sri Lanka. Finding out the
relationship between Training Practices on the Development of
Knowledge, Development of Skills of the Executive Grade Employees
were the objectives of this study. After a qualitative analysis of the data
it has been found that there is no significant correlation in between the
Training Practices and Development of Skills and the Knowledge of
the Executive Grade Employees. But in the literature review it has been
found that the Training and Development Practices have been
positively correlated with the Skills and the Knowledge of the
employees (Armstrong, 2003; Dessler, 2013; as cited in Delaney &
Huselid, 1996, p.950, Bartel, 1994; Knoke & Kalleberg, 1994; Russell,
Terborg & Powers, 1985). Hence the reasons for having contradictory
results may be because of the Skills and the Knowledge focused to
expect from a particular Training and Development Programme of the
Executive Grade Employees of the Parliament might not be critically
important for the conduct of their duty according to the ‘Resource
Dependence Theory’ (Werner, 2008: Armstrong, 2012; Wright, 1993).

-77- HRM Perspectives – December, 2017
Reference
Abdalla, I.A., & Al-Homoud, M. (1995). A Survey of Management
Training and Development Practices in the State of Kuwait. Journal of
Management, 14(3), 14-25.
Adhikari, D.R. (2010). Human Resource Development for Performance
Management. International Journal of Productivity and Performance
Management, 59(4), 306-324.
Aguinis, H., & Kraiger, K. (2009). Benefits of Training and
Development for Individuals and teams, Organizations, and Society.
Annual Review of Psychology,60, 451-474.
Armstrong, M. (2012). Armstrong’s Handbook of Human Resource
Management Practice (12th ed.). London, Philadelphia, New Delhi:
Kogan Page.
Armstrong, M. (2003). Armstrong’s Handbook of Human Resource
Management Practice (9th ed.). London, New Delhi : Kogan Page.
Ban, C., & Faerman, S.R. (1990). Issues in the evaluation of
Management Training. Public Productivity & Management Review, 13
(3), 271-286.
Barney, J.B. (2001). Resource-Based Theories of Competitive
Advantage: A Ten-Year Retrospective on the Resource-Based view.
Journal of Management, 27, 643-650.
Berge, Z., De-Verneil, M., Berge, N., Davis, L., & Smith, D. (2002).
The Increasing Scope of Training and Development Competency.
Benchmarking: an International Journal, 9(1), 43-61.
Berman, M.E., Bowman, J.S., West, J.P., & Wart, M.V. (2006). Human
Resource Management in Public Service Paradoxes, Processes and
Problems (2nd ed.). Thousand Oaks, London, New Delhi: Sage
Publications.

-78- HRM Perspectives – December, 2017
Bertalanffy, L. V. (1969). General System Theory. New York: George
Braziller.
Delaney, J.T. & Huselid, M.A. (1996). The Impact of Human Resource
Management Practices on Perceptions of Organizational Performance.
Academy of Management Journal, 39(4), 949-969.
Dessler, G. ( 2013). Human Resource Management. (13th ed.). Boston,
Columbus, Indianapolis, New York, Upper Saddle River, Amsterdam,
Cape Town, Dubai, London, Madrid, Milan, Munich, Paris, Montreal,
Toronto, Delhi, Mexico City, Sao Paulo, Sydney, Hing Kong, Seoul,
Singapore, Taipei, Tokyo: Prentice Hall.
Dessler, G & Varkkey, B.(2011). Human Resource Management. (11th
ed.). Dorling Kinderslay (India) pvt. ltd: Pearson
Hayes, J., Rose-Quirie, A. & Allinson, C. W. (2000). Senior Managers’
Perceptions of the Competencies They Require for Effective
Performance: Implications for Training and Development. Personnel
Review,29(1), 92-105.
Hoffmann, T. (1999). The Meanings of Competency. Journal of
European Industrial Training, 23(6), 275-285.
Kaufman, R. (1985). Linking training to Organizational Impact.
Journal of Instructional Development, 8(2), 23-29.
Lakmahal, G.N. (2016, December 14). Personal Interview
Le-Deist, F.D., & Winterton, J. (2005). What is Competence?. Human
Resource Development International, 8(1), 27-46.
Parliament (Powers and Privileges) Act, SS 1999, c 383.
Parliament Secretariat (1993). Standing Orders of the Parliament of the
Democratic Socialist Republic of Sri Lank. Sri Jayawardenapura Kotte,
Sri Lanka: Author.

-79- HRM Perspectives – December, 2017
Parliament Secretariat (2004). The Constitution of the Democratic
Socialist Republic of Sri Lanka. Government Press, Sri Lanka: Author.
Opatha, H.D.N.P. (2012). Human Resource Management Personnel.
Colombo: Author.
Rohanadeera, K.A. (2016, December 06). Personal Interview
Ryan, G., Emmerling, R.J., & Spencer, L.M. (2009). Distinguishing
High-performing European Executives. Journal of Management
Development. 28(9), 859-875.
Sajeewanie, T.L., & Opatha, H.H.D.N.P. (2007). Relationship between
Human Resource Manager-related Factors and Practice of Strategic
Human Resource Management in Sri Lankan Listed Firms. Sri Lankan
Journal of Human Resource Management, 1(1), 71-87.
Salas, E., Tannenbaum, S.I., Kraiger, K., & Smith-Jentsch, K.A.
(2012). The Science of Training and Development in Organizations:
what Matters in Practice. Psychological Science in the Public Interest,
13(2), 74-101.
Samarasekara, A.P. (2016, December 19). Personal Interview
Saunders, M., Lewis, P. & Thornhill, A. Research Methods for
Business Students (3rd ed.). India, Dorling Kindersley (India) Pvt. Ltd.
Sekaran, U. & Bougie, R. (2014). Research Methods for Business (5th
ed.). New Delhi, Wiley India (P.) Ltd.
Sri Lanka, Parliament of Sri Lanka, (2014), Annual performance
report- 2014. Parliament of Sri Lanka
Thavakumar, D., & Nawaratne, N.N.J. (2015). The Relationship
between Training and Development Practices and Work Engagement in
Sri Lankan Insurance Industry. International Journal of Research, 2(3),
615-627.

-80- HRM Perspectives – December, 2017
Werner, J.M., & DeSimone, R.L. (2006). Human Resource
Development (4th ed.). Delhi, Akash Press.
Werner, N. (2008). Resource Dependence Theory: How Well, does it
Explain Behavior of Organizations?. Management Revue, 19 (1/2), 9-
32.
Withana, W.K.D.C. (2016, December 12). Personal Interview
Wright, P.M., & McMahan, G.C. (1993). Strategic Human Resource
Management: Alternative Theoretical Frameworks. Los Angeles, USA:
CEO Publications.

-81- HRM Perspectives – December, 2017
WORK-LIFE BALANCE OF THE FEMALE
ACADEMICS OF PRIVATE HIGHER EDUCATION
INSTITUTES, SRI LANKA
H.K.G.N.D. Samarakoon - MBA
Senior Lecturer
International College of Business & Technology
Colombo, Sri Lanka
and
K.K.K. Sylva - MBA
Senior Lecturer
University of Peradeniya, Sri Lanka
ABSTRACT
Education plays a major role in the country. The study focuses on
private higher education sector which plays a major role within Sri
Lankan education system apart from the state university sector. These
institutes offer different educational qualifications such as diploma,
degrees and masters associated with foreign universities. The role of a
lecturer is very significant for the output of these institutions. They
should be mentally and physically healthy to deliver a quality service.
The nature of the society has changed recently with dual income
earners in the family. So a female has to play different roles in her life.
Majority of the academics are female. So it is important to see how
these female balance their work and life. Work life balance means

-82- HRM Perspectives – December, 2017
drawing a line in between work and life thus a person get the ability to
manage work and life in a well manner without disturbing each other.
Work life balance affects the mental and physical well-being of a
person. Literature has been reviewed related to Sri Lankan context and
in other similar contexts. Then it could be identified that dependent
care issues, support network, demographic factors, hours worked, work
overload, time management, technology advancement, understanding
of the strategies available for work-family balance affect work life
balance.
Key Words: Work Life Balance; Female Work Life Balance; Lecturer
Background
The door to a dignified future in most of the developing countries is
education. Education comprises of primary, secondary and tertiary
level (International Bureau of Education-UNESCO, 2006). Primary and
secondary education of a student makes the foundation of education
where the tertiary education makes them employable. So tertiary
education system of a country should strategically planned in order to
deliver the best outputs. Sri Lankan government pays a higher attention
on developing primary, secondary and tertiary education system of the
country. But as a developing country, the country has to face barriers in
funding the state education system. State university sector was the
major contributor to the higher education. But the capacity of the state
university system in the country is becoming insufficient, limited to 15
local universities. Only 20% of the students who qualify for higher
education get the opportunity for admission at the state sector
universities (Board of Investment of Sri Lanka, 2014). Because of this,
most of Sri Lankan students who successfully complete their secondary
education leave the country for higher studies, admitting themselves to
foreign universities (Jayawardana, 2014). In this milieu, private sector
institutions have to fill the gaps of providing educational needs and
thereby protecting foreign exchange savings and earnings and it makes
-83- HRM Perspectives – December, 2017
a significant contribution to the economic development in Sri Lanka
(Samarasinghe, 2006; Premarathna, 2011). Therefore, quality of the
service provided by them is of paramount importance.
Approximately, there are more than 40 private institutes available
within the country (Ceylon Lanka, 2012). These institutes offer reputed
diplomas, degrees and master level qualifications at an affordable price
in partnership with universities from UK, USA and Australia. There are
various programs available in different streams such as Engineering,
Business management, Computing, Quantity Surveying etc. Programs
are available for any age of student and part time programs are also
available for working people (Jayawardana, 2014). The chairman of the
National Education Commission, Suraweera (2009) states that the
government has introduced many policies to increase the involvement
of private sector in higher education (cited in Samaraweera, 2009).
Because the vision of the country is to become the most preferred
country for higher education in the Asian subcontinent by 2020 by
maintaining local university system as the main provider and with the
help of the private sector higher education institutes (Board of
Investment of Sri Lanka, 2014). Therefore, the demand for the private
higher educational industry increases and it plays a major role in Sri
Lankan higher education industry.
The academic staff is a core competence of an educational institution.
The quality of the education depends on the quality of academics that
provide it. The role of a lecturer is not only to deliver lectures. They are
responsible for updating their knowledge to deliver the best to their
students, generating new knowledge and sharing that to the society for
the betterment of the community. University lecturers are directly
responsible in shaping the quality of the students and they play a
significant role in nation building (Awang, Ahmad, & Zin, 2010;
Lakshmi & Kumar, 2011). So it is important to pay attention on
productivity of faculty and strategies to retain in the productive faculty
in this era of cut throat competition (Fatima & Sahibzada, 2012).

-84- HRM Perspectives – December, 2017
Most of the academics who employed in Sri Lanka are females
(Department of Census and Statistics, 2012) Increasing female labor
participation is a new trend in Sri Lanka. The breadwinner of the family
has been changed from men to men and women both. Both sharing
family responsibilities equally and face the increasing household
expenditure (Lakshmi & Kumar, 2011). Even in Sri Lanka after 1978
when the Sri Lankan economy was started accelerating through foreign
investments by shifting from closed economy to open economy cost of
goods and services has gone up due to different political behaviors.
This straightly influenced the cost of living of the people and mean
household expenditure per month increased exponentially after 1978
(Department of Census and Statistics, 2012/13). This set up lead to a
gradually increasing female labor force participation rate within the
country (Department of Census and Statistics - Sri Lanka, 2014)
The traditional role of a female was only cooking, taking care of
children, cleaning house etc. This traditional role has not changed much
but in addition to that females have to play an economic role outside
the home (Thriveni & Rama, 2012; Bombuwela & Alwis, 2013). So
there is a high possibility for such a female who plays economic/ career
role and family role to face with work family conflicts or work family
imbalance (Asiedu-Appiah, Aduse-Poku, & Acheampong, 2014). It is
an emerging challenge face by these females. So identifying factors
affecting the work life balance of these female lectures is very
important. Because work life balance gives the necessary physical and
mental health for them to deliver a quality output (Emslie, Hunt, and
Macintyre, 2004; Grzywacz, Almeida, and McDonald, 2002;
Lingard, Brown, Bradley, Bailey, and Townsend, 2007 Asiedu-
Appiah et al., 2014).
There are many research on the factors affecting the work life balance
of lectures but there’s no researches found on work life balance of
female lecturers in private higher education institutes in Sri Lanka. So
the objective of this literature review is to establish a theoretical
framework to fill the empirical gap in respect to factors affect Work-

-85- HRM Perspectives – December, 2017
Life Balance (WLB) of Female Lecturers in private higher education
institutes in Sri Lanka.
Work Life Balance
The concept of WLB evolved around 1990s. One of the reasons for the
evolvement of such a concept is the effect of work life imbalcne on
health and performance outcomes of individuals, families and
organisations (Kalliath & Brough, 2008). Another reason that could be
found out with the origin of the work-life studies is the studies of
several roles of women. Barnett and Brunch (1985) researched on how
the psychological thoughts connect to the balance of rewards and
nature of individual women’s role as a mother, wife and a paid worker.
And found that low level of role conflict, role overload and anxiety has
led to a positive role and experience. Further the societal change from
man was the breadwinner to both man and woman is also another
reason for the evolvement of studies of WLB (Lakshmi & Kumar,
2011). So the studies on work-family balance was considered much
important for almost all the organizations as the employees cannot be
ignored. When the employees are struggling in order to balance its
work and family lives; it might affect negatively to the organizations
(Gryzwacz and Carlson, 2007).
Clark (2000) defines work-family balance as satisfaction and good
functioning at work and at home, with a minimum of role conflict (cited
in Kalliath & Brough, 2008). An individual has to play multiple role at
work and at home. Kirchmeyer (2000) says WLB is as satisfaction
between multiple roles. Further he stated for that individuals need
energy, time, and commitment to play multiple roles. Due to that role
conflict occurs (cited in Kalliath & Brough, 2008). Work-life balance
is an inter-role phenomenon. It symbolizes an individual’s orientation
across multiple roles. The extent to which an individual is engaged in –
and equally satisfied with – his or her work role and family role is
called work life balance. Further three components of work family–
balance has been proposed as time balance, involvement balance, and
-86- HRM Perspectives – December, 2017
satisfaction balance (Greenhaus, Collins & Shaw 2003 cited in Kalliath
& Brough, 2008). Frone (2003) stated that low levels of inter-role
conflict and high levels of inter-role facilitation represent work–family
balance (cited in Kalliath & Brough, 2008). Work–life balance is about
people having a measure of control over when, where and how they
work’ (Fleetwood 2007 cited in Kalliath & Brough, 2008). Greenhaus
and Allen (2008) stated that the when an individual’s multiple roles
played in the life is compatible with the individuals’ life role priorities
at a given point in time, then that individual has the WLB (cited in
Kalliath & Brough, 2008). Work–life balance is the individual
perception that work and non-work activities are compatible and
promote growth in accordance with an individual’s current life
priorities (Kalliath & Brough, 2008). The degree to which an individual
satisfies the demands coming from their employement and family
called work life balance (Opatha, 2010 cited in Perera & Opatha,
2014). Work-life balance is defined by Grzywacz and Carlson (2007)
as achievement of expectation related to roles that are shared and
negotiated between individuals and their role partners in the family
domains and workplace. On the other hand, work-life balance is
defined as a global assessment that family and work resources are
adequate to meet the demand of work and family which there is
effective participation in both the domains.
Even though there are many definitions, until 2008, a formal definition
of this term was not be able further there was no direct well developed
measure with the ability to investigate the phenomenon fully (Kalliath
& Brough, 2008).
Mullins (2005) refers work life balance as a major factor of job
satisfaction. Further he says that there is no one standard work/life
balance policy that will suit every business. It is not one thing.
Different work life balances at different points of life. Armstrong
(2009) discuss that work life balance is a key concept under employee
well-being and is a non-financial factor that is crucial in attracting
prospective employees and retaining existing employees. This would
value and would help to persuade them to join or remain with the

-87- HRM Perspectives – December, 2017
business. Work life balance is a feature which affects in defining one
organization as ‘a great place to work’. Further Armstrong says take
steps to improve work–life balance by developing policies including
flexible working that recognize the needs of employees outside work is
a possible action to deal with employee turnover problems. In the
Towers Perrin model of total reward, work life balance is included as a
relational (non-financial) reward and work life balance increase
employee engagement. According to Holly Kortright, senior HR
professional and Strategic HR and Innovation presenter says work life
balance depends on the person, it is something different to everyone.
Work life fit is a more dynamic term which incorporate personal
dilemma and find a unique balance. (Filho, 2013)
The effective approach is to assess the practices of work-life balance
with a professional instance viewpoint whereby offering WLB
practices, organizations may attract new members while reducing the
level of conflicts among existing ones who are struggling for managing
work-life balance. That lead to enhance the effectiveness of the
organization while improving recruitment and reducing work – life
conflicts. The mechanism of work-life practices that affects both the
employee productivity and behavior is still being researched
Alen,2001, Schutte & Eaton, (2004).
Balance of work life and personal life has to properly prioritize
between work that is career and ambition with the personal life style
that includes leisure, family, pleasure, health and spiritual development.
This work-life balance concept depends on the idea that remunerated
work and personal life should be considered as less opposite
significances and more as equally important of a full life. Lewis, (2008)
has observed the way to achieve the balance of this concept is as
conceptualized it as a two-way process that consider the requirements
of the workers and employees.
Study of Friedman and Greenhaus (as cited in Lockwood, 2003),
highlight that to have a grip on the balance of working life, the
employed adults get adjusted to build systems of security for care at

-88- HRM Perspectives – December, 2017
home to work and then in to the society, even though the battle between
family and workplace just not only affecting the quality of the family
life but also deteriorate the inhibits the profession development of both
the women and men. Although for women, the consequence may limit
to career options, along with some chances of employment growth and
a hard choice between family and their thriving career
opportunities. Thus, for men, on the other hand, a simple struggle
between the family roles and their work life. Such people often
communicate well their career ethics and personal life to look for
behaviors which make both job and family responsibilities for the
betterment.
Earlier some authors considered working life and family life as two
independent segments (Clark, 2000 cited in Perera & Opatha, 2014) but
nowadays it is considered that work domain and family domain has
joint influence to each other where the events at work affects the events
at home and vice versa (Edwards & Rothbard, 2000 cited in Perera &
Opatha, 2014; Clark, 2000 cited in Perera & Opatha, 2014). Kanter
(1977) called this as “Myth of separate worlds” (cited in Currie and
Eveline, 2011). “In actuality we never leave one sphere and enter
another…we traverse the false boundaries of either/ or distinctions
while being immersed in both world simultaneously” said Edley (2001)
(cited in Currie and Eveline, 2011)
University workers often noted that their work was part of their life.
Many of them work at home. At nights, on the weekends, when having
a shower or while travelling to work. They enjoy thinking about their
ideas and reflecting on their work. So it is difficult for them to set
boundaries around their work. And academics have the same pressures
towards a long hours culture as other professional occupations (Currie
& Eveline, 2011)
-89- HRM Perspectives – December, 2017
Work Life Balance Theories
There are many therories which describes differetn aspects of WLB.
Conflict model, enrichment model, spill over model and compensation
model describes the joint influence of each other. Further border theory explains how people can influence the interaction (clark, 2000 cited in
perera & opatha, 2014). Bellavia & Michael (2005) explained work
family balacne with three modles. Those are Ecological systems threoy,
role theory and boundry/ boarder theory (cited in Perera & Opatha,
2014)
The imbalance of work life balance cause for work life conflict. Khan
et al (1964) developed a theory called role dynamics which says that
work family conflicts are resulted from role conflicts. Role conflict is a
situation an individual faces when they are expected to perform more
than one role with different, vague and unclear expectations (Cited in
Asiedu-Appiah, 2014 and Keller, 1975).
Boarder Theory/ Segmentation Theory
This theorizes that family and work are two individual domains where
there is no relationship between them, representing that family and
work both are separate domains that may not affect one another
(Edwards & Rothbard, 2000; Clark, 2000 cited in Perera & Opatha,
2014). Moreover, segmentation has observed like an active
psychological procedure that could have used to accomplish the work
and family limit (Rothbard et al., 2005). Better work- life balance can
obtain through high segmentation between family and work. For
instance, a person who can split the effort, time and energy effectively
and efficiently among these two segments may lead to lower work-life
conflicts.
Compensation Theory
Theory of compensation denotes to an effort of creating deficit or else
shortcoming in one role in another, over higher involvement (Edwards
& Rothbard, 2000). All these shortages can be the satisfaction or

-90- HRM Perspectives – December, 2017
demands that could be achieved in an alternative role (Guest, 2002).
For an instance, an employee is extremely involved in his or her work
and life due to certain bad experiences in non-work life. The sense of
doing something useful and achieving better energy in non-work
lifestyles is executed over better commitment at place of work and also
separating the time for relaxing.
Gender and Work Life Balance
A person plays multiple roles in their life. Mainly dual roles; work and
family role. Men gets benefits better mental health by playing both
roles but for women it doesn’t (Gove and Tudor,1973 cited in Barnett
and Baruch,1985). In the past, man was the breadwinner of the family.
Several studies found that working women undergo severe stress when
they try to balance their working life and personal life (Lakshmi &
Kumar, 2011). As mentioned above the reason for the origins of
research on work-life balance is also can be outlined as this women
having multiple roles.(Rantanen et al, 2011)
Some researchers found that WLB and their gender is not related.
Perera & Opatha (2014) found that the there is no significant difference
between WLB of female acccounts professionals and male acccounts
professionals in Sri Lanka.
Where some studies revealed that WLB is related with gender (Felicity
Asiedu-Appiah, 2013 cited in Arif & Farooqi, 2014). Further in some
studies revealed that WLB of male and female university lecturers is
different, male lecturers feel more WLB than female lecturers (Fatima
& Sahibzada, 2012; Elliott, 2003 cited in Fathima and Sahibzada, 2012;
O’Lauhlin and Bischoff, 2005). This may be due to the higher
responsibilities she has on child care, elder care and family obligations
(Daly and Lewis, 2000 cited in Fathima and Sahibzada, 2012;
O’Lauhlin and Bischoff, 2005)

-91- HRM Perspectives – December, 2017
Factors Affecting Work Life Balance of Female Lectures
Sri Lankan Context
There is a deficiency of availability of literature on factors affecting
work life balance within Sri Lanka when comparing with the literature
availability in world wide. One of the studies found on work life
balance is the study of Perera & Opatha (2014). They have studied
three factors affect WLB of accounts professionals in Sri Lanka. Those
three factors are time management, nature of the spouse and
understanding of the strategies available for work-family balance. The
study was conducted with members of ICASL, CIMA and ACCA. Then
found that there was a high level of work family balance among
Accountancy professionals in Sri Lanka and the above three factors
was positively related with WLB. Time management was defined as the
ability of an individual to understand and engage in management of
time. When an individual understands and engages in management of
time he/ she can fulfill most of the demands of life and work. When an
individual doesn’t have time management skills he/ she cannot fulfill
most of the demands of employment and family. Then it arises
complaints grievances from relevant parties. So the degree of time
management decides the degree of work and life balance. The other
factor discussed by the authors was nature of the spouse. A positive
natured life partner has patience and mutual understanding and extend
supports to balance both life and work. The other factor was the degree
of understanding the strategies available for work-family balance which
was the most significant predictor of work life balance among the three
variables identified under the framework, meant to be the know-how of
the individuals about techniques, tools, family friendly policies of
organizations for work life balance. At present, most of the
organizations offer family friendly policies as they have understood the
consequence of the work life conflicts. And this creates a win-win
situation for both employer and employee. So the degree of
understanding the strategies available for work-family balance decides
the degree of work and life balance.
-92- HRM Perspectives – December, 2017
Victor and Thavakumar (2011) have studied on work family conflicts
of women employees with special reference to banking sector in
Batticaloa District in Sri Lanka. The research has been done among
married women employees in public and private sector banks expecting
to find out the degree of work characteristics which includes number of
hours worked, work flexibility, work stressors, and family
characteristics which are number of children, age of children, and
family support influence on work family conflicts. Through the study
researchers found that there is a need for spouse support, flexible work
schedules, child care centres, and family support in order to reduce
work family conflicts. And among the work characteristics they
identified that hours worked has a strong relationship with work family
conflicts as the time spent with children enhance the bond between
mother and children and have identified that working mothers feel
guilty for not spending adequate time with children. Then they figured
out that work schedule inflexibility, work stressors, which affect the
period of time spend with the spouse and the family, while work
stressors create strains which affect marital functioning negatively.
Family characteristics which are number of children, age has a positive
correlation with work family conflicts while the supports of spouse, has
a negative relation with work life conflicts.
Both of the above studies discussed the spouse support. Perera &
Opatha (2014) refered this as nature of spouse. Spouse support
increases WLB.
Another study which could be identified with Sri Lankan context is the
study of Vijayakiruthika (2016) which is done to identify the impact of
demographic factors on work life balance of women employees, who
employed in private banking sector in Batticaloa district. The
considered demographic factors are age, education, marital status, job
experience and income. Then found that all these demographic factors
are related with WLB.

-93- HRM Perspectives – December, 2017
In Other Contexts
Fatima & Sahibzada (2012) found that in Pakistan, both private and
public sector university teachers’ work and life balances determinants
as partner support, colleague support and job resources, unfair criticism
at job. The considered factors mainly classified as the work related
factors and family related factors. Considered work related factors are
job resources, colleague support and unfair criticism. Job resources
referred to the availability of adequate resources at work. Considered
family related factors are partner support, elder dependency, and child
responsibilities. Then found that partner support, colleague support and
job resources are positively related with WLB where unfair criticism at
job is negatively affects the WLB. Further they found that there is a
significant difference of WLB of female and male teachers with respect
to partner support, childcare responsibilities, elder dependency and
colleague support.
Fatima & Sahibzada (2012) has also discussed about the spouse support
as similar to Perera & Opatha (2014) and Victor and Thavakumar
(2011).
Lakshmi and Kumar (2011) has studied the factors affecting work life
balance of women in teaching faculties in India. The study focused on
different designations of a teaching faculty such as dean, head of
department, professor, and assistant professor. Basically they have
studied on work related and family related factors effect on work life
balance. Those factors are age, marital status, no of dependents, support
for child care, designation, and working hours/per week, additional
working hours, support of the functional head and ability to discuss
freely the work life balance issues. The first outcome of the study was
that volume and length of working hours and additional working hours
is significantly affecting women work life balance. This is crucial for
married women. As the second factor it has been found that number of
dependents at home. The work life balance is severely impacted when
these dependents are children. When the dependents are unemployed
then it is supportive for child care. But when the number of dependents

-94- HRM Perspectives – December, 2017
increases, overtime hours taken by women increases due to financial
constraints. As the third factor it has been found a work related factor
that is the support of the functional head and ability to discuss freely
the work life balance issues with the functional head. This reduces the
consequences of work life balance problems. The findings of the study
are more related as it is related to the education sector. And as south
Asian countries, India and Sri Lanka has some similar behaviors.
Similar to Lakshmi and Kumar (2011) the impact of length of working
hours, number of children and family support has also been identified
by Victor and Thavakumar (2011). But Lakshmi and Kumar (2011) has
discussed about number of dependents which includes the number of
children as well further family support has been discussed as
dependents employment status.
Mathew & Panchanatham (2011) have done a study of WLB of women
entrapreneurs in South India. The study revealed that support network,
quality of health, time management, dependent care issues, role over
load impact the work life balance. A female entrapreneur has more
roles to perform as a spouse, parent, housekeeper, employee and an
entrapreneur. This requires more energy and when these responsibilities
are overloaded creates problems in their work life. These female face
dependent care issues such as children, elders, and spouse. And it is
found that women who engage with elder care face more work life
conflicts than people who engage with child care. This overloaded roles
and long work hours cause for mental and physical health problems.
Bad qulity of health affects the success of their career. Further they face
problems in time management. At last the research found that lack of
proper social support from family members, subordinates/employees
and society affects work life imbalance. Understanding the role of the
female by the spouse, family is important. And also they can support in
dependent care issues. Further the study identified that perception on
work life balance differ by age group, education level, income and
marital status.The reserch reveals that women entrapreneurs upto the
age 35 face severe work life balance problems. Because at this age they
have child care issues and also they have less commanding

-95- HRM Perspectives – December, 2017
opportunities in their family and at the work place also. Another
behaviour identified was women with high monthly income having a
better work life balance because they have the ability get support from
servents. Further there is an increment in work life balance with the
education level because an educated female find different alternate
methods to solve problems. the study revealed that married women face
many work life conflicts than unmarried female. The approach used in
this study is qualitative, semi structured interviews involving open
ended questions.
Mathew & Panchanatham (2011) also discussess family support similar
to Lakshmi and Kumar (2011); Victor and Thavakumar (2011).
Mathew & Panchanatham (2011) also discusses support of the
employees which includes the support of the functional head as
discussed by Lakshmi and Kumar (2011) and colleague support as
discussed by Fatima & Sahibzada (2012). Mathew & Panchanatham
(2011) reffered all these as support network. Both Mathew &
Panchanatham (2011) and Perera & Opatha (2014) has identified time
management. Lakshmi and Kumar (2011) discusses number of
dependents at home which is indirectly reflecting the amount of
dependent care issues as discussed by Mathew & Panchanatham
(2011). dependent care issues includes children, elders, and spouse care
issues. Similar to the finding of Mathew & Panchanatham (2011) the
impact of demographic factors such as age, education level, marital
status, and income has also been identified by Vijayakiruthika (2016).
Meththa & Shinde (2012) has conducted study on work life balance
among women employees in service sector with special reference to
Pune city from 2009 to 2012, a longitudinal study. The objectives of
the study were to identify determinants of work life balance, to find out
present practices followed by women employees for Work Life
Balance. They have classified determinants of work life balance into
organizational factors and individual factors as below. Organizational
factors: present annual income of employee, tenure in the present
organization, department in which an employee is working, type of
organization, nature of job, no of years of previous experience, level of

-96- HRM Perspectives – December, 2017
hierarchy in the organization, term of contract, situational factors,
support from employer and management, support from colleagues,
policies of organization, technology and its use, long working hours.
Individual factors: age of an employee/ life stage of employee, marital
status, no of family members, type of family/ family structure, no and
age of the kids, no of dependents, educational qualification, mobility
from native place, attitude and values of employee, psychological
factors, support from family members, energy level of employee, self-
high expectations. The result of the above research indicates that the
female employees under consideration face the problem of balancing
work and personal life more imbalances are observed among the
married females due to more family responsibilities.
Meththa & Shinde (2012) has some similar findings as other studies.
Income, age, marital status, education level of the employee is similar
to Mathew & Panchanatham (2011); Vijayakiruthika (2016). support
from employer and management, support from colleagues, family
members is similar to Mathew & Panchanatham (2011); Lakshmi and
Kumar (2011); Fatima & Sahibzada (2012). Number of children, age of
children similar to Victor and Thavakumar (2011). Number of
dependents at home similar to Lakshmi and Kumar (2011).
Thriveni and Rama (2012) state that there are many factors affect on
work life balance and one set is demographic variables. They
researched on impact of demographic variables on work life balance of
women employee with special reference to Banglore city. The
professions focused here are IT, BPO, Marketing, Insurance, Banking
and including Education. The scope is only demographic variables such
as age, income, experience, type of family, number of dependents, and
marital status. Then the study found when age progress the
responsibilities increase and also responsibility increases with the
marriage of a female and when number of dependents increases further
when experience increases the responsibilities at the work place
increases. When, the responsibility of a female increases possibility of
occurring work life conflict increases. When a female lives with a joint
family not in a nuclear family responsibility at home increases but she

-97- HRM Perspectives – December, 2017
doesn’t have any problem on child care. When the income increases
female can easily meet their economic needs. So the research has been
concluded that there is a significant relationship between demographic
variables and work life balance of women employees.
Thriveni and Rama (2012) has also identified age, income, marital
status, similar to the findings of Mathew & Panchanatham (2011);
Vijayakiruthika (2016). Job experience has also identified by Meththa
& Shinde (2012); Vijayakiruthika (2016). Type of family has also
identified by Meththa & Shinde (2012). Number of dependents at home
similar to Lakshmi and Kumar (2011); Meththa & Shinde (2012).
Levy (2012) has studied on work life balance of working mothers in
terms of full-time and part-time employment. The considered factors
for the study mainly related to the life domain and work domain. Under
life domain the factors such as child-care support, educational
attainment and age of youngest child have been studied while under
work domain the number of hours worked, conflict at work, and high
workload. The study found that there is a significant relationship
between child care support and the work life balance. Here different
child care support options have been considered such as baby sitter,
partner, nursary and others. Only the working women at least with a
one child less than age 12 who live with their partner condidered for the
research and found that there is no relationship of work life balance
with the age of youngest child. And the hypothesis tested related to
educational attainment has been rejected and it has been found that
there is no relationship of work life balance with the level of
education.Then found that there is a significant relationship of work life
balance with all three variables considered under the work domain.
That means when number of hours, conflicts at work, work load
increases the work life balance decreases.
Levy (2012) also has some similar as other authors. Victor and
Thavakumar (2011) has also discussed about child care centres as a
child care support. Number of hours worked has also discussed by

-98- HRM Perspectives – December, 2017
Lakshmi and Kumar (2011); Victor and Thavakumar (2011); Meththa
& Shinde (2012).
Kumarasamy, Pangil, & Isa (2015) found that emotional intelligence,
job engagement and organizational support positively related with work
life balance and technology advancement and work overload are
negatively related with work life balance. Emotional intelligence means
ability to understand and manage people and ability to act wisely in
managing human relations (Thorndike, 1920 cited in Kumarasamy,
Pangil, & Isa, 2015). JothiSree and Jyothi (2012) found that emotional
intelligence plays sn importatnt role in female work life balance (cited
in Kumarasamy, Pangil, & Isa, 2015). Individuls with emotional
intelligence knows how to enjoy the working life with teams, to reduce
stress, to feel motivated and how to enjoy and how to satisfy the
personal life, the demands of spouse and other dependents, to build
good relationships with them (Gardner & Goleman 1998 cited in
Kumarasamy, Pangil, & Isa, 2015). Emmons (2000) defined spiritual
intelligence as “the adaptive use of spiritual information to facilitate
everyday problem solving and goal attainment” (cited in Kumarasamy,
Pangil, & Isa, 2015). An individual with spiritual intelligence has a
good level of consciousness, sanctify everyday experience, and utilize
spiritual resources to solve problems (Emmons, 2000 cited in
Kumarasamy, Pangil, & Isa, 2015). Job engegement means emotional
and intellectual commitment of an individual to the organization
(Jawaharrani & Susi, 2011 cited in Kumarasamy, Pangil, & Isa, 2015)
Some of the findings of Kumarasamy, Pangil, & Isa (2015) are similar
to the previous findings. Organizational support has been discussed by
Mathew & Panchanatham (2011); Lakshmi and Kumar (2011). They
refereed organizational support as support from
subordinates/employees, head of departement, colleague. Technology
advancement has been discussed by Meththa & Shinde (2012) and
Work overload by Levy (2012).
Lee (2002) has done a study on supportive work practices and work life
balance and was conducted on employees from a leading Australian

-99- HRM Perspectives – December, 2017
pharmaceutical company to determine if the supportive work practices
influence employee work life balance while at the same time to
discover whether individual characteristics of employees affect
employee attitudes towards work life issues. the supportive work
practices which were studied are organizational culture, supervisor
support and work-life benefit programs. Organisational culture was
found to be the most associated factor which influences employee work
life balance. But supervisor support and work-life benefit programs
were not associated with WLB. The considered work life benefit
programs were Maternity Leave, Study Assistance Programs, Flexible
Hours, Family/Carer’s Leave, Part-time Work, Employee Assistance
Programs, Paternity Leave, Breastfeeding in the Workplace, Job Share,
Home-based Work, Childcare Subsidiaries, On-site Childcare
Facilities. The awareness on these benefit programs was also been
studied. And found that employees were most aware of the company
offering maternity leave, study assistance programs and flexible hours.
Female employees perceived that these work life benefits are more
supportive than male. Job type was the only individual characteristic
which affected the WLB. Employees who classify their job roles as a
non supervisory have reported higher level of work life balance than
others.
Understanding of the strategies available for work-family balance has
also been discussed by Perera & Opatha (2014) as well as Lee (2002).
Smith & Gardner (2007) has done a study to find factors affecting
employees use of work life balance initiatives in a large New Zealand
organization. The study highlights the importance of work place culture
which enables a supportive environment to work life balance and the
initiatives use by the organization. Through the analysis of the
company policies they have identified sixteen work life balance
initiatives which were offered by the organization. Those WLB
initiatives are paid special leave to care for dependents, unpaid special
leave to care for dependents, paid special leave for other purposes,
unpaid special leave for other purposes, flex time, compressed work
schedules, telecommuting, part-time work, on-site childcare, job

-100- HRM Perspectives – December, 2017
sharing, paid maternity leave, paid paternity leave, eldercare, study
assistance – time off for study, study assistance – financial assistance,
and time off to attend non-work events (making up the time elsewhere).
Among them they found that most frequently used work life balance
initiatives as flex time, time off to attend non work events, special leave
for dependent care issues, Management supports and supervisory
support and also found five initiatives which most frequently
mentioned as being not offered but could offer as telecommuting (work
from home), time off to attend non work events, compressed work
schedules and onsite child care. And they found that employees using
more work life balance initiatives would report lower level of work life
conflicts than employees using lower level of work life balance
initiatives.
Yadav & Dabhade (2013) has studied on Work Life Balance among
working women in public sector banks of India with special reference
SBI, Bhopal (M.P) city head office to figure out the working
environment of Public sector banks for women employees and to
identify the perception of women about initiatives and policies of banks
for women employees and effect of initiatives and policies of banks on
women employees life and identified that increasing demand at work
place and interference between personal life and work life which
demands more attention and has highlighted the importance for
employees to maintain a healthy balance between work and personal
life. Through the descriptive study they identified flexible working
arrangements, good management, comfort ability at work place,
physical and mental stress, supportive management, flexible working
hours, own work schedules, age and qualifications and generous leave
facility affects work life balance of women banking employees and
they suggested that work life balance is not a problem to be solved, it is
an ongoing issue to be managed.
It was found that Work life conflicts is positively associated with the
number of hours worked per week, in an American online survey of
academics (O’Lauhlin and Bischoff, 2005)
-101- HRM Perspectives – December, 2017
Conclusion
Private higher education industry plays a major role in Sri Lankan
economic development. In order to maintain the quality of the
education the role played by lecturers is paramount important. Having
a balance in between work and life gives them required mental and
physical health for them to deliver a quality output. As majority of
them are females the above literature review focused on factors
affecting the work life balance of female lectures of private higher
education institutes.
By digging into the literature it could be identified that there is a gap in
the empirical knowledge available in Sri Lankan perspective about
work life balance of female. There is no previous studies have been
done on work life balance of female lecturers.
One of the commonly identified factors which affects work life balance
of female is dependent care issues. Dependent care issues negatively
affects on work life balance. Most of women face child care issues.
Women with small children face difficulty in work life balance. The
other issue is with elder care. Women who face elder care issues found
to have more work life balance isuuse than the women with children. In
order to study this some of the authors has studied demographic factors
as number of children, age of children, number of dependents at home.
Number of children is negatively related with work lilfe balance where
age of children is positively related.
Another factor which affects work life balance of female is support
network. Support network is positvely related with WLB. This has been
discussed by different authors as family support and organizational
support. Family support indicates the spouse support and the support of
other family members. Specially females need husband’s and family
support to manage child care issues. Child care support is another area
discussed by many authors and which is a part of the support network.
Some authors has studied the type of family as a demographic variable.
And found that female has more work life balance when they live as a

-102- HRM Perspectives – December, 2017
joint family not as a nuclear family. Organizational support includes the
support of colleagues, superior and subordinates.
Many authors has discussed the behavior of work life balance with
related to demographic factors. Those demographic factors are marital
status, age, income, education level, job experience. Married women
has more WLB issues than unmarried female. Age is positively related
with WLB. Because when they get aged they get married and they get
kids. Female with age 35 has more WLB issues. Income is positively
related with WLB. When income increases they are able to get support
from servants to manage their household work. Education level is also
positively related. Because when they are educated they get the
knowledge and ability to find different techniques, approaches to find
WLB. Experience is negatively related with WLB. Because when
experience increases the responsibilities at the work place increases.
Other than above factors it could be identified that number of hours
worked, work overload, time management, technology advancement,
understanding of the strategies available for work-family balance are
also affects WLB.
Practical implications to HR professionals
The above literature review indicated that female WLB is related with
dependent care issues, support network, demographic factors, hours
worked, work overload, time management, technology advancement,
understanding of the strategies available for work-family balance. This
work can be used by HR professionals to find out the factors affecting
the WLB of female lecturers in private higher education institutes in Sri
Lanka. That finding will be contributing to retain an energetic human
resource with private higher education institutes. This is paramount
important as this work force contribute to sustain the quality of Sri
Lankan students which directly impacts the economy of Sri Lanka.
-103- HRM Perspectives – December, 2017
Reference
Arif, B. & Farooqi, Y. A., 2014. Impact of Work Life Balance on Job
Satisfaction and Organizational Commitment AmongUniversity
Teachers: A Case Study of Universityof Gujrat, Pakistan. International
Journal Of Multidisciplinary Sciences And Engineering, pp. 24-29.
Armstrong, M., 2009. Armstrong’s Hand Book Of Human Resource
Management Practice. 11 ed. London: Kogen Page.
Asiedu-Appiah, Aduse-Poku, O. & Acheampong, A. F., 2014. Work-
life balance practices and female lecturers’ career progression in
Ghana. Asian Journal Of Management Research, 4(3), pp. 419-431.
Awang, Z., Ahmad, J. H. & Zin, N. M., 2010. Modelling Job
Satisfaction And Work Commitment Among Lecturers: A Case Of
UiTM Kelantan. Proceedings of the Regional Conference on Statistical
Sciences 2010 (RCSS’10), pp. 241-255.
Board of Investment of Sri Lanka, 2014. Invest in Sri Lanka. [Online]
Available at:
http://www.investsrilanka.com/key_sectors_for_investment/education_
sector_overview.html [Accessed 16 June 2014].
Bombuwela, P. & Alwis, A. C. D., 2013. Effects of Glass Ceiling on
women carrer development in private sector organizations - case of Sri
Lanka. Journal of Competitiveness, 5(2), pp. 3-19.
Ceylon Lanka, 2012. higher education institutes and courses.. [Online]
Available at: http://www.ceylonlanka.info/2012/08/higher-education-
institutes-and-courses.html [Accessed 20 December 2014].
Currie, J. & Eveline, J., 2011. E-technology and work/life balance for
academics with young children. Higher Education, pp. 533-550.
Department of Census and Statistics - Sri Lanka, 2014. Indicators.
[Online]

-104- HRM Perspectives – December, 2017
Available at:
http://www.statistics.gov.lk/Indicators/htdocs/index.php?usecase=indic
ator&action=list&catId=8 [Accessed 01 September 2014].
Department of Census and Statistics, 2012/13. Household Income and
Expenditure Survey. Preliminary Report. Ministry of Finance and
Planning -Sri Lanka.
Department of Census and Statistics, 2012. Sri Lanka Labour Force
Survey. Annual Report. Ministry of Finance and Planning.
BIBLIOGRAPHY \m Edw00\l 1033 Edwards, J.R & Rothbard N.P.,
2000. Mechanisms Linking Work and Family: Clarifying the
Relationships between Work and Family. Academy of Management
Reveiw, 25(1), pp. 178-199.
Fatima, N. & Sahibzada, S. A., 2012. An Empirical Analysis of
Factors Affecting Work Life Balance among University Teachers: the
case of Pakistan. Journal of International Academic Research, pp. 16-
29.
Filho, R. P., 2013. Lifelong learning: It’s Part of Your Job Description.
[Online]
Available at: http://hrdailyadvisor.blr.com/category/hr-management/
[Accessed 10 September 2014].
BIBLIOGRAPHY \m Jos07\l 1033 Grzywacz, J. G. & Carlson, D. S.,
2007. Conceptualizing Work–Family Balance: Implications for Practice
and Research. Advances in Developing Human Resources, 9(4), pp.
455-471.
BIBLIOGRAPHY \m Gue02\l 1033 Guest, D. E., 2002. Perspectives
on the Study of Work-life Balance. Social Science Information, pp.
255-279.
International Bureau of Education-UNESCO, 2006. Worldwide.
[Online]
-105- HRM Perspectives – December, 2017
Available at:
http://www.ibe.unesco.org/fileadmin/user_upload/archive/Countries/W
DE/2006/ASIA_and_the_PACIFIC/Sri_Lanka/Sri_Lanka.pdf
[Accessed 11 December 2014].
Jayawardana, M., 2014. Home. [Online]
Available at: http://magazine.lankahelp.com/2014/03/04/privatization-
of-higher-education-in-sri-lanka/ [Accessed 10 December 2015].
BIBLIOGRAPHY \m KAL08 \l 1033 Kalliath, T. & Brough, P., 2008.
Achieving Work–Life Balance. Journal Of Management &
Organization, 14(3), pp. 224-226.
Kumarasamy, M. A. M., Pangil, F. & Isa, M. F. M., 2015. Individual,
Organizational and Environmental Factors Affecting Work-Life
Balance. Asian Social Science, pp. 111-123.
Lakshmi, K. & Kumar, N., 2011. Work life balance of women
employees – with reference to teaching faculties. , s.l.: In e-proceedings
for 2011 international research conference and colloquium..
Lakshmi, K. S. & Kumar, N. S., 2011. Work Life Balance Of Women
Employees – With Reference To Teaching Faculties. s.l., s.n., pp. 202-
212.
Lee, F., 2002. Supportive Work Practices and Work-Life Balance,
School of Psychology, Deakin University: unpublished Graduate
Diploma Thesis.
Mathew, R. & Panchanatham, N., 2011.. An exploratory study on the
work life balance of women entrepreneurs in South India.. 16 (2), pp.
pp.77-105..
Moser, C. O. N., 1993. Gender planning and development: Theory,
practice and training. London: Routledge.

-106- HRM Perspectives – December, 2017
Mullins, L. J., 2005. Management and Organizational Behaviour. 7 ed.
London: Pearson Education Limited.
Oláh, L. S., Richter, R. & Kotowska, I. E., 2014. The new roles of men
and women and implications for families and societies. Europe:
European Union's Seventh Framework.
BIBLIOGRAPHY \m HPe14 \l 1033 Perera, H. & Opatha, H. H. D.
N. P., 2014. Work-Family Balance Of Accounting Professionals In Sri
Lanka. 11th International Conference on Business Management, pp.
285- 304.
Premarathna, A., 2011. News Features. [Online]
Available at: http://www.nation.lk/2011/10/09/newsfe7.htm
[Accessed 12 December 2014].
Rantanen, J., Kinnunen, U., Mauno, S. & Tillemann, K., 2011.
Introducing Theoretical Approaches to Work-Life Balance. In:
Creating Balance? International Perspectives on the Work Life
Integration of Professionals. s.l.:Springer-Verlag Berlin Heidelberg,
pp. 27-46.
BIBLIOGRAPHY \m Nan05 \l 1033 Rothbard, N. P., Phillips, K. W.
& Dumas, T. L., 2005. Managing Multiple Roles: Work-Family
Policies and Individuals’ Desires for Segmentation. Organization
Science, 16(3), p. 243–258.
Samarasinghe, P., 2006. Midweek. [Online]
Available at: http://www.island.lk/2006/10/18/midweek4.html
[Accessed 12 December 2014].
Samaraweera, D., 2009. Financial Times. [Online]
Available at:
http://www.sundaytimes.lk/090726/FinancialTimes/ft316.html
[Accessed 20 December 2014].

-107- HRM Perspectives – December, 2017
Smith, J. & Gardner, D., 2007. Factors Affecting Employee Use of
Work-Life Balance Initiatives. New Zealand Journal of Psychology, pp.
3-12.
Thriveni, K. K. & Rama, D. V., 2012. Imapct of Demgraphic Variables
on Work Life Balance of Women Epmployees. International Journal of
Advances in Mnagement and Economics, 1(6), pp. 226-229.
Vijayakiruthika, S., 2016. The Demographic Factors influence on
Satisfaction toward work life balance of woman employees in private
banking sector in Batticaloa district. Journal for Studies in
Management and Planning, pp. 147-153.
Yadav, R. K. & Dabhade, N., 2013. Work life balance amongst the
working women in public sector banks – a case study of State Bank of
India. International Letters of Social and Humanistic Sciences, pp. 1-
22.

-108- HRM Perspectives – December, 2017

-109- HRM Perspectives – December, 2017
THE IMPACT OF ORGANIZATIONAL CULTURE ON
EMPLOYEE RETENTION: EVIDENCE FROM A
BEVERAGE COMPANY IN SRI LANKA
W.A. Mahikala Niranga - MA
Lecturer
National School of Business management, Sri Lanka
and
K. Kajendra – Phd
Senior Lecturer
Department of Marketing, Faculty of Management & Finance
University of Colombo, Sri Lanka
ABSTRACT
Organization culture shapes up the behaviors of the employees who are
working for an organization. Employee retention and satisfaction will
be consequences of powerful organizational cultures. Highlighting the
team orientation, innovation & risk taking, people orientation, output
orientation, reward systems, attention to details and competitiveness,
this article investigates the Impact of organizational culture on
employee retention using a case of a beverage company in Sri Lanka.
This is a quantitative study and data was collected through
questionnaire case study method. The sample of this study was 104
employees who are currently working in this organization. Correlation
analysis and multiple regression were used as principle techniques for
the data analysis with the support of SPSS software. Results show that
team orientation, attention to detail and competitiveness have a
moderate linear relationship with employee retention while other
variables show weak relationships. Thus, findings suggest that

-110- HRM Perspectives – December, 2017
organizations must carefully identify the culture practices to improve
the employee satisfaction and retention rates to gain sustainable
competitive advantage with the support of the existing workforce.
Keywords: Organizational Culture, Employee Retention, Beverage
Industry in Sri Lanka
Introduction
Food and beverage industry grew drastically after the war period due to
the free market entries in the country with less risk and uncertainty.
Private sector organizations took the first advantage over it (Industry
Capability Report, 2012). The Sri Lankan economy grew by 6.3 per
cent during the first half of 2013 compared to the 7.2 per cent growth
recorded during the first half of 2012 with a higher contribution from
Food and beverage industry (CBSL annual report, 2013).
According to Industry Capability Report (2012) the industry is
dominated by few large-scale organizations which situated in the
western province in Sri Lanka. However, there are some small-scale
organizations too supporting in food and beverage industry in general.
Even though there is a great contribution from food and beverage
industry to the gross domestic production to the various countries,
many researchers identify employees working in the organizations are
not happy and caused with less retention rate (Lam & Zhang, 2003;
Hazledine, 1979; Ryan , Hazrina , & Mohsin, 2011). Moreover,
Marcoulides & Heck (1993) identified organizational culture as a
common platform for organizational employee for their satisfaction.
The main reasons for the less retention rates are employee
dissatisfaction, less management support, organizational climate and
weak organizational cultures (Mainiero, 1993; Nasir & Sabir, 2012).
-111- HRM Perspectives – December, 2017
Therefore, a medium scale beverage company in Sri Lanka has selected
as the case company for this study as it is contributing to the GDP in
Sri Lanka. The key objectives of this study include;
To identify factors within the cultural context, contributing to
employee retention
To evaluate how different factors of culture have influenced
employee retention
The remaining sections in this paper are structured in the following
manner; it begins with the literature review related to concepts used in
the research and followed by a conceptual framework and hypotheses
development. Then, it outlines the research methodology and the
measurements used. The next section discusses the findings of the
study with reference to limitations and finally discusses the scope for
future research.
Theoretical Background and Hypotheses Development
Organizational culture plays a vital role in many organizations as it
causes for many organizational outcomes such as productivity,
employee retention and job satisfaction. Previous literature defines the
organizational culture in various means. Certo (2009) sated the
organizational culture as a set of shared values that organizational
members have regarding the functioning and existence of their
organization. Further, Robbins (2011) explained organizational culture
as a system of shared meanings held by members that distinguishes the
organization from other organizations. Mullins (2002) characterized the
culture as the collection of traditions, values, policies, beliefs and
attitudes that constitute a pervasive context for everything we do and
think in an organization. Therefore, the organizational culture can be
defined as the behaviors of individuals for certain organizational
contexts. This can be individual, group and the overall performance of
the organization in the long run.

-112- HRM Perspectives – December, 2017
Mullins (2011) stated that there are different types of organizational
cultures can be seen in different organizations such as power culture,
role culture, task culture and person culture. Moreover, these cultures
characterized by different features, namely; innovation and risk taking,
attention to detail, outcome orientation, people orientation, team
orientation, aggressiveness, stability, observed behavioral regularities,
norms, dominant values, philosophy, rules and organizational climate
(Robbins, 2011; Luthans, 2008; Mullins, 2002; O’Reilly, 1991).
Different research studies have carried out to measure how employees
see the organizational culture (Robbins, 2011; Ashkenas, 2014;
Meehan, 2014). Therefore, it is evident that the culture of an
organization creates an environment for employees to perform well in
the organization boundaries. However, all these previous studies
measured the culture in different industries except beverage industry.
On the other hand, employee retention is very much momentous in
contemporary organizations as to the production quality to cater to
industry competition. As per the empirical evidences the reasons for
employee turnover are job dissatisfaction, less management support,
poor career progression, perceived organizational support and
perceived supervisor, weak organizational cultures and organizational
ethical practices (Mainiero, 1993; Maertz Jr, 2007; Coldwell, 2008;
Nasir & Sabir, 2012). Organizational culture has become a substantial
reason for the less employee retention rates as per the previous research
evidences (Shim, 2014; Marcoulides, 1993).
Due to these reasons various researchers measured the relationship
between organizational culture and organizational outcomes such as job
satisfaction, organizational productivity, organizational performances
and employee turnover (Sheridan, 1992; Lee & Yu, 2004; Lund, 2003).

-113- HRM Perspectives – December, 2017
Conceptual framework and Hypotheses
Team Orientation:
Team orientation refers to the “degree to which work is organized
around teams rather than individuals” (Robbins, 2011). Moreover, Lee
& Yu (2004) have brought the same characteristics of the
organizational culture and found out a positive relationship among
variables. Meehan (2014) has explained team performances sustaining
a winning culture with employee satisfaction. Ashkenas (2014) has
expressed team performances can be directly impacts to change the
surroundings of an organization. Thus, it is hypothesized that;
H1: There is a positive relationship between team orientation and
employee retention
Innovation and Risk Taking:
Innovation and risk taking refers to the degree to which employees are
encouraged to be innovative and to take risk (Robbins, 2011). Sheridan
(1992) innovation and risk taking motivates most of the organization’s
workers to stay with the organization in the long run. Further, it is
really common among modern organizations where many youngsters,
providing their services in different sources. Shim (2014) explained
that innovation as a major component to organizational culture and
climate motivates to minimize turnover rates of child welfare agencies.
Thus, it is hypothesized that;
H2: There is a positive relationship between innovation & risk taking
and employee retention
-114- HRM Perspectives – December, 2017
Outcome Orientation:
According to Marcoulides (1993) has enlightened task organizations,
rather an outcome representation of individuals is important for an
organization to keep them happy and retain in the long run. Moreover,
there were other empirical studies which supported a positive
relationship of outcome orientation (O’Reilly, Chatman, & Caldwell,
1991; Sheridan, 1992). Thus, it is hypothesized that;
H3: There is a positive relationship between outcome orientation and
employee retention
Reward Systems:
Shim (2014) has expressed less rewards and incentives will cause to
increase the employee turnover rates of an organization. Further, Nasir
& Sabir (2012) have explained the importance of an incentive to
increase the employee performances in Pakistan. Thus, it is
hypothesized that;
H4: There is a positive relationship between rewards system and
employee retention
People Orientation:
Sheridan (1992) has measured the relationship between organizational
culture and employee retention and expressed his ideas by saying
culture should consists with people oriented values such as respect etc.
Further, the actions of co-workers, support, knowledge sharing,
guidance and decision right should be considered with respect to people

-115- HRM Perspectives – December, 2017
orientation of an organization (Coldwell, 2008; Shim, 2014; Nasir
&Sabir, 2012; Meehan, 2014). Thus, it is hypothesized that;
H5: There is a positive relationship between people orientation and
employee retention
Attention to Detail:
Sheridan (1992) has explained details as a major component to retain
employees with the organization as a part of the organizational culture.
Moreover, Robbins (2011) enlightened attention to details as the degree
to which employees are expected to exhibit precision, analysis and
attention to detail. Thus, it is hypothesized that;
H6: There is a positive relationship between attention to detail and
employee retention
Competitiveness:
O’Reilly, Chatman, & Caldwell (1991) used competitiveness or the
term ‘aggressiveness’ to develop the organizational culture profile and
explained that creates a positive relationship between organizational
activities and the employees who are providing the service to them.
Further, Sheridan (1992) obtained the same variable to measure the
relationship between organizational culture and employee retention in
favor for the organizational culture developed by O’Reilly, Chatman, &
Caldwell (1991). Thus, it is hypothesized that;
H7: There is a positive relationship between attention to detail and
employee retention

-116- HRM Perspectives – December, 2017
The conceptual framework shown in figure 1 shows the variables and
relationships considered in this study.
Source-Author
Figure 1: Conceptual Framework
Research Design
This is a quantitative study and data for the study was collected through
questionnaire case study method. The sample of this study was 104
employees who are currently working in the selected beverage
company in Sri Lanka. The reason for selecting this company as a case
for this study is the fact that it is operating as a medium scale
organization in Beverages industry in Sri Lanka. Moreover, based on
documentary sources and pilot survey, it is evident that there is a high
turnover rate in the organization.
The predictor variables of this study were team orientation, innovation
and risk taking, outcome orientation, rewards system, people
Employee
Retention
Team
Orientation
Innovation &
risk taking
Outcome
orientation
Reward systems
Competitiveness
People
orientation
Attention to
detail
Innovation &
risk taking
Innovation &
risk taking
H1
H2
H3
H4
H5
H6
H7

-117- HRM Perspectives – December, 2017
orientation, competitiveness and attention to detail. The outcome
variable was employee retention.
The questionnaire has been prepared in respect to the 5-point Likert
scale which represents five different opinions to answer questions
where 1 denoted strongly disagree, 2 denoted disagree, 3 denoted
neutral, 4 denoted agree and 5 denoted strongly agree. Further, the
questionnaire has divided into which represents the variables in the first
part and demographic factors in the second part.
In order to analyze data, correlation analysis and multiple regression
were used as principle techniques in this study. Data were analyzed
using SPSS.
Findings and Discussion
Before creating the variables of this study an internal consistency test
was conducted. For this purpose, Cronbach’s Alpha was applied.
Results are provided in table 01.
Table 1: Cronbach’s alpha
Variable Cronbach’s Alpha No. of items
Team orientation 0.721 4
Innovation and Risk Taking 0.577 3
Outcome orientation 0.532 2
Rewards Systems 0.787 4
People orientation 0.506 2
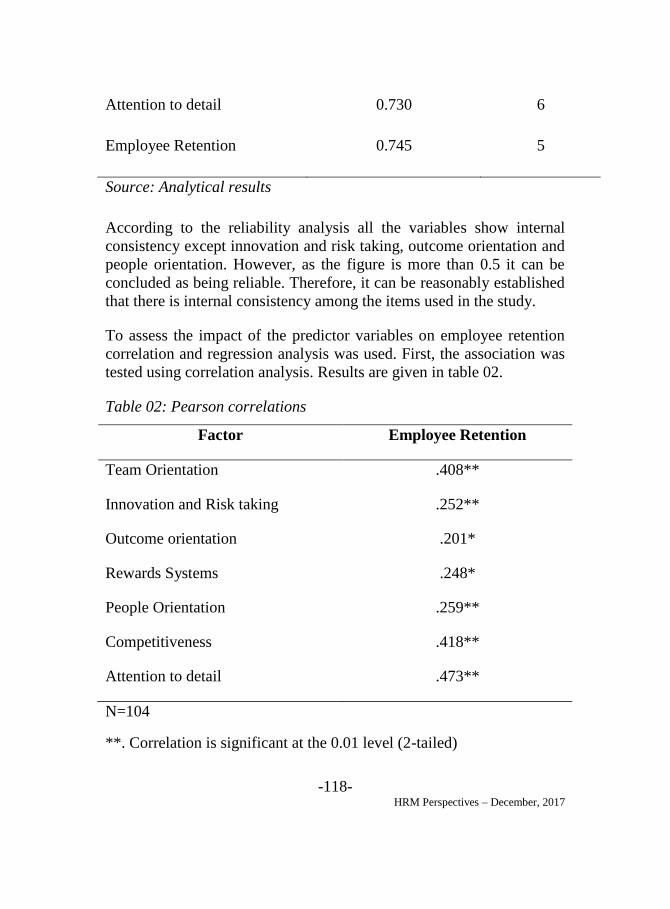
-118- HRM Perspectives – December, 2017
Attention to detail 0.730 6
Employee Retention 0.745 5
Source: Analytical results
According to the reliability analysis all the variables show internal
consistency except innovation and risk taking, outcome orientation and
people orientation. However, as the figure is more than 0.5 it can be
concluded as being reliable. Therefore, it can be reasonably established
that there is internal consistency among the items used in the study.
To assess the impact of the predictor variables on employee retention
correlation and regression analysis was used. First, the association was
tested using correlation analysis. Results are given in table 02.
Table 02: Pearson correlations
Factor Employee Retention
Team Orientation .408**
Innovation and Risk taking .252**
Outcome orientation .201*
Rewards Systems .248*
People Orientation .259**
Competitiveness .418**
Attention to detail .473**
N=104
**. Correlation is significant at the 0.01 level (2-tailed)

-119- HRM Perspectives – December, 2017
*. Correlation is significant at the 0.05 level (2-tailed).
According to the statistical analysis there is a positive relationship
between all predictor variables and the outcome variable. Moreover,
team orientation has a moderate positive linear relationship, Innovation
& risk taking has a weak positive linear relationship, Outcome
orientation a weak positive linear relationship, Reward systems has a
weak positive linear relationship, People orientation has a weak
positive linear relationship, Attention to detail has a moderate positive
linear relationship, Competitiveness has a moderate positive linear
relationship with employee retention.
However, the correlations indicate that are highly significant as the P
values are below 0.01 and 0.05.
To determine the combined effect of the predictor variables and the
outcome variable multiple regression model was used and the model
summary is provided in table 03.
Table 3: Model summary of joint association between organizational
culture factors and employee retention
Model R R Square Adjusted R Square Std. Error of the
Estimate
1 .641a .411 .368 .54039
Source: Analytical results
The multiple correlation (i.e. R) for this study is 0.641 and this result
represents the joint association between organizational culture factors
and employee retention. Coefficient of determination is 0.411. This
indicates that 41.1% of the employee retention has been covered by the
regression model.
Next, the regression ANOVA result is given in table 4.

-120- HRM Perspectives – December, 2017
Table 4: ANOVA
Model Sum of
Squares
df Mean
Square
F Sig.
1 Regression 19.527 7 2.790 9.553 .000b
Residual 28.034 96 .292
Total 47.562 103
Source: Analytical results
Probability of F test statistic is 0.000. This means as results are highly
significant model is jointly significant. This means that regression
results are appropriate and it addressed the research objectives.

-121- HRM Perspectives – December, 2017
Table 5: provides individual coefficients of the factors.
Model Unstandar
dized
Coefficient
s
Standardi
zed
Coefficie
nts
t Si
g.
95.0%
Confidence
Interval for B
B Std.
Err
or
Beta Lower
Boun
d
Upp
er
Bou
nd
1 (Constant) .46
2
.42
0
1.1
01
.2
74
-.371 1.29
5
Team
Orientation
.19
0
.07
6
.230 2.4
85
.0
15
.038 .342
Innovation
and Risk
taking
-
.06
1
.08
8
-.067 -
.69
3
.4
90
-.235 .113
Outcome
Orientation
.05
1
.08
5
.058 .60
5
.5
46
-.117 .220
Reward
systems
.05
9
.06
5
.081 .89
5
.3
73
-.071 .189
People
orientation
.12
1
.07
7
.145 1.5
83
.1
17
-.031 .273
Attention to
detail
.32
8
.11
5
.289 2.8
51
.0
05
.100 .557

-122- HRM Perspectives – December, 2017
Competitive
ness
.19
6
.05
6
.306 3.5
22
.0
01
.085 .306
a. Dependent Variable: Employee Retention
Source: Analytical results
According to the individual coefficients table the probability of team
orientation is 0.015 and the individual beta value is 0.190. This
indicates that team orientation has a positive effect on employee
retention, which supports for the previous research findings (Meehan,
2014; Lee & Yu, 2004; Ashkenas, 2014). Attention to detail is also
significant at 5% as the P value is 0.005. It also has a positive effect on
employee retention as the beta value is 0.328. This acceptance has
brought more evidence from previous scholars (Sheridan, 1992).
Competitiveness is highly significant with a positive beta value of
0.196. This also has a positive effect on employee retention (Sheridan,
1992; O’Reilly, Chatman, & Caldwell, 1991) with significant at 5% as
the P value is 0.001. Innovation and risk taking, outcome orientation,
reward systems and people orientation are not significant as P values
are >0.05 level. However, there is a negative on employee retention of
innovation and risk-taking effect as the beta value is -0.061. Moreover,
outcome orientation, reward systems and people orientation are
positively effective on employee retention as beta values are 0.051,
0.059 and 0.121 respectively. Surprisingly innovation & risk taking,
outcome orientation, reward systems and people orientation were not
supported in hypothesis tests, even though previous scholars found out
a positive relationship with employee outcomes (Sheridan, 1992; Shim,
2014; Marcoulides, 1993; Nasir & Sabir, 2012).
Hence, the regression equation is developed as;
Y= 0.462 + 0.230 -0.067 + 0.058 + 0.081 + 0.145 +
0.289 + 0.306

-123- HRM Perspectives – December, 2017
Conclusion
This study mainly carried out based on two objectives, namely to
identify factors within the cultural context, contributing to employee
retention and to understand how different aspects of culture have
influenced employee retention. Even though there are many cultural
factors available, the researcher has used the cultural profile used by
O’Reilly, Chatman, & Caldwell (1991) with slight modifications.
Based on that team orientation, innovation & risk taking, people
orientation, output orientation, reward systems, attention to details and
competitiveness have been identified as the main cultural factors which
are affecting on employee retention of the case company.
The research outcome suggests that the outcome orientation, attention
to detail, innovation and risk taking, and people orientation have
engaged in creating a relationship on employee retention. Moreover,
Sheridan (1992) found out team orientation has a greater impact on
employee retention of a firm. Even though the research finding of
innovation and risk taking shows a weak positive relationship of
0.252.2 O’Reilly, Chatman, & Caldwell (1991) expressed employees
who like autonomy prefer innovative and risk-taking culture which is
contradicted from the research findings. The reward systems and
employee retention have a weak positive linear relationship with the
correlation value of 0.248. However, according to Shim (2014) rewards
among organizational cultures positively and negatively effect of
employee turnover rates. These evaluations characterized that attention
to details has the highest moderate linear relationship towards the
employee retention of the organization. This would be due to the reason
of close supervision and the guidance providing by the line managers to
the product line of the organization. Moreover, Maertz (2007)
illustrated the significance of organizational support and supervisor
support on employee retention. Further, Taylor, Levy, Boyacigil, &
Beechler (2008) identified management orientation will shape up the
employee commitment which leads to the retention in the long run.

-124- HRM Perspectives – December, 2017
Therefore, it is evident based on above results that team orientation,
attention to detail and competitiveness have a significant impact on
employee retention in the organization by accepting hypotheses.
Managerial Implication
There are several important implications of the results obtained from
the current study. Organizational culture is vital to increase the
satisfaction of employees, which depends on the working environment,
climate and the culture. Organizations should build a culture where
employees can identify their own strengths and weaknesses and as the
management they should support employees with the guidance and
mentoring. Further, it will lead to the employee satisfaction and they
will feel they are a part of the organization with enough recognition,
reputation and value creation. Moreover, employees can self-monitor
their own performances to build up a culture adaptation personality.
Culture shape ups the thinking patterns of the individuals and pros and
cons of different behaviors. If the company can create a positive
culture, that would be a great advantage for both employees and the
organization itself. Due to the traditional working patterns of the case
company, they have not given enough opportunities to employees to
involve with the decision-making process. However, organizations
should break this traditional approach for a better, unique product in the
future to maximize their goals and objectives. Employee participation
may create an impact towards the goal achievement of the organization
through a value creation.
Further, modern practices of the organization are to create an ethical
culture where employees can work in the right way with right
decisions. For that, organizations can create and carry out different
awareness programs, leadership development programs, motivational
programs, workshops and seminars which would help employees adopt
to the ethical culture.
-125- HRM Perspectives – December, 2017
Limitations and direction for future research
This research suffers from few limitations which provide a path
forward for future research. Firstly, the sample of this study works in
one organization, even though many beverage companies are operating
in Sri Lankan beverage industry. Secondly, due to cross sectional data
gatherings the responses were limited to one specific time period and
respondents were given the answers based on the conditions of that
time period. Thirdly, culture is the unique thinking pattern of the
individuals and it cannot be measured through statistics based on the
data gathered.
Since the researcher has focused for all the characteristics, the future
studies can be based on only one characteristic and go for an in-depth
analysis. Moreover, these studies can be based on the qualitative nature
rather than the quantitative analysis with in-depth interviews from
various resource persons. Supplementary, the future researchers can
collect data through different organizations with different sizes (large,
medium, small) to compare cultures with each other for a better
understanding. On the other hand, future research can carry out this by
taking data from service organizations rather than manufacturing firms
since service providers have their own thinking patterns rather than
listening to the traditional ways of the organization.

-126- HRM Perspectives – December, 2017
References
Ashkenas, R. (2014). You can’t dictate culture, but you can influence
it. Harvard Business Review, 8-9.
Central Bank of Sri Lanka: Annual Report2013. (2014, 11 28).
Retrieved from Central Bank Web Site:
http://www.cbsl.gov.lk/pics_n_docs/10_pub/_docs/efr/recent_economic
_development/RED2013/Red2013e/4_Chapter_02e.pdf
Certo, S. C., & Certo, S. T. (2009). Modern Management concepts and
skills. Pearson Education.
Coldwell , D. A., Billsberry, J., Marsh, N. V., & Marsh. (2008). The
effects of person-organization ethical fit on employee attraction and
retention: Towards a testable explanatory model. Journal of Business
Ethics, 611-622.
Hazledine, T. (1979). Explaining Differences in Cyclical Employment
Behavior in Thirteen Canadian Food and Beverage Processing
Industries. Journal of Industrial Economics, 161-175.
Industry Capability Report, (2012). Food and Beverage Sector. Sri
Lanka: Export Development Board (EDB)
Lam, T., & Zhang, H. Q. (2003). Job satisfaction and organizational
commitment in the Hong Kong fast food industry. International
Journal of Contemporary Hospitality Management, 214-220.
Lee, S. J., & Yu, K. (2004). Corporate culture and organizational
performance. Journal of Managerial Psychology, 340 – 359.
Lund, D. B. (2003). Organizational culture and job satisfaction. Journal
of Business & Industrial Marketing, 219-236.

-127- HRM Perspectives – December, 2017
Luthans, F. (2008). Organizational Behavior. New York: McGraw-Hill
Companies.
Maertz, C. P., Griffeth, R. W., Campbell, N. S., & AllenSou. (2007).
The effects of perceived organizational support and perceived
supervisor support on employee turnover. Journal of Organizational
Behavior, 1059-1071.
Mainiero, L. A. (1993). Is your corporate culture costing you? The
Academy of Management Executive, 84-85.
Marcoulides, G. A., & Heck, R. H. (1993). Organizational culture and
performance: Proposing and testing a model. Organization Science,
209-225.
Meehan, P. (2014). Creating and sustaining a winning culture. Harvard
Business Review, 14-16.
Mullins, L. J. (2002). Organizational Behavior. England: Person
Education Limited.
Nasir, S. B., & Sabir, H. M. (2012). The effect of organizational culture
and job climate in employee retention in Pakistan. Elixir International
Journal, 6097-6105.
O’Reilly, C. A., Chatman, J., & Caldwell, D. F. (1991). People and
organizational culture: A profile comparison approach to assessing
person-organization fit. The Academy of Management Journal, 487-
516.
Robbins, S. P. (2011). Organizational Behavior. Pearson Education.
Ryan , C., Hazrina , G., & Mohsin, A. (2011). Determinants of
Intention To Leave A Non-Managerial Job in the fast food industry of
West Malaysia. International Journal of Contemporary Hospital
Management, 344-360.
-128- HRM Perspectives – December, 2017
Sheridan, J. E. (1992). Organizational culture and Employee Retention.
The Academy of Management Journal, 1036-1056.
Shim, M. (2014). Do Organizational Culture and Climate Really Matter
for Employee Turnover in Child Welfare Agencies. British Journal of
Social Work, 542-558.
Taylor, S., Levy, O., Boyacigil, N., & Beechler, S. (2008). Employee
commitment in MNCs: Impacts of organizational culture, HRM and top
management orientations. The International Journal of Human
Resource Management, 501-527.

-129- HRM Perspectives – December, 2017
BIG FIVE PERSONALITY TRAITS AND JOB
PERFORMANCE
Dilini De Silva – B.Sc (HRM)
National School of Business Management, Sri Lanka
and
Prasadini Gamage - PhD, AMIPM
Professor
Department of Human Resource Management
Faculty of Commerce & Management, University of Kelaniya
Sri Lanka
ABSTRACT
One of the biggest challenges faced by the modern organizations is
attracting high performing employees to their organizations to obtain
competitive advantage. To get the maximum efforts of the high
performing employees, organizations have to match their competencies
and characteristics with the job as some jobs emphasize certain
qualities more than others. This study attempts to identify the
relationship between big five personality traits and job performance of
middle managerial level employees of a state bank in Sri Lanka. The
sample of the study consists of 80 staff officers of a state bank in Sri
Lanka. The main objective of the study was to identify the relationship
between big five personality traits and job performance. Independent
variable of the study consists of five dimensions; Extraversion,
Neuroticism, Agreeableness, Conscientiousness and Openness to
experience. Dependent variable job performance was analyzed under

-130- HRM Perspectives – December, 2017
three dimensions, namely; Task Performance, Contextual Performance
and Counterproductive Work Behavior. Data were analyzed by using a
correlation coefficient technique and also regression analysis. To
gather information a structured questionnaire was distributed among
the respondents. As hypothesized, big five personality traits had a
statistically significant, moderate positive relationship with job
performance. Extraversion, agreeableness, conscientiousness and
openness to experience had a significant, moderate positive
relationship with job performance supporting to past literature.
Contrary to the hypothesized, neuroticism was found no statistically
significant relationship with job performance. The study provides new
insights into the management of the banking sector, indicating that
personality should be given due consideration in human resource
management practices in their organizations.
Key words: Personality; Big Five Personality Traits; Job Performance
Background
It is vital for organizations today to recruit high performing employees.
One critical issue that organizations may find hard to address is how to
separate individuals who will perform well from those who will not.
Thus, business organizations seek to find criteria to measure the
employees’ performance for the betterment of the organizations.
Among these criteria, personality traits are important to measure
employee performance as revealed in some research studies (Ghiselli,
1973; Guion & Gottier, 1965; Locke & Huh, 1962; Reilly & Chao,
1982).
In the early 1990s, there was a renewed interest about the impact of
personality in predicting job performance. This was mainly due to the
two prominent meta-analyses (Barrick & Mount, 1991; Tett, Jackson,
& Rothstein, 1991) which stated that the lack of a well-accepted
classification of personality during the last couple of decades accounted
for the discouraging findings concerning the relationships between

-131- HRM Perspectives – December, 2017
particular personality constructs and performance criteria in different
occupations. However, evidence has suggested that personality
measures are valid predictors of diverse job-related criteria (Goldberg,
1993). Recent research showed that personality dimensions are related
to job performance (Rosse et al. 1998; Wright et al. 1995).
Although it is apparent, that these early researchers have further
investigated psychological traits without a significant classification to
study the personality and to measure the employee performance. By
that time, the five-factor model (“Big Five”) had emerged and evolved,
which to its present claims to be the best paradigm for personality
structure. Generally, researchers agree that there are five robust factors
of personality (Neuroticism, Extraversion, Openness to Experience,
Agreeableness, and Conscientiousness) and the value of the model has
widely been proved and is universally accepted. Therefore, Barrick and
Mount (1991) examined the relationship of these five personality
constructs to job performance measures for different occupations,
rather than to focus on the overall validity of personality as previous
researchers had done. A variety of studies and meta-analyses revealed
that personality traits which included in the Five-Factor Model (FFM)
are highly related to job performance (Barrick & Mount 1991; Tett,
Jackson,& Rothstein, 1991; Barrick,Mount,& Judge,2001; Salgado,
1997; Rothmann & Coetzer, 2003). According to Tett et al. (1991),
there is a significant and fairly acceptable correlation between
personality and job performance.
With the beginning of the new millennium, many studies were
conducted to measure the relationship between personality and job
performance (e.g., Barrick, Mount& Judge, 2003). Many of these
research findings have been practically applied in selecting personnel
for occupations such as sales and customer service and there is an
increasing trend among the modern organizations to use personality
tests in predicting the employee performance in making optimal
selection decisions.

-132- HRM Perspectives – December, 2017
Furthermore, studies about personality and its implications on
employee outcomes such as job satisfaction and job performance are
quite common in the western literature. However, compared to the
western world the number of studies conducted in South Asian region
regarding the above topic is low. Moreover, the population that has
been studied for these researches, differ significantly from the local
population due to many reasons such as differences in their culture,
attitude, behaviors, skills, etc. For instance, studies’ regarding the
above topic has been done regarding Indian corporate sector employees
(Karthikeyan & Srivastava, 2012), Swedish sales sector employees
(Klang, 2012) and Iranian public-sector employees (Askarian &
Eslami, 2013). Therefore, the findings and generalizations of these
researches may not be exactly applicable and acceptable in the local
arena. Thus, the researcher intends to examine the relationship between
big five personality traits and job performance in the Sri Lankan
context. Consequently, it is expected that the study would bring new
insights to further studies as well as strengthen existing pieces of
literature. The research will also reveal the extent to which the five
factors of the Big Five Dimensions of personality relate to job
performance among the managerial level employees of a state bank in
Sri Lanka.
The research question in the study is: Is there a relationship between
the Big Five Personality Traits and job performance of middle
managerial level employees of a state bank in Sri Lanka?
Literature Review
In psychology, the Big Five Personality Traits are five broad
dimensions of personality that are used to describe human personality.
The theory based on the Big Five factors is called the Five Factor
Model (FFM) (Costa & McCrae, 1992). The Big Five personality
dimensions are Extraversion, Neuroticism, Agreeableness,
Conscientiousness, and Openness to Experience. Job performance is
generally conceptualized as ‘actions and behaviors that are under the

-133- HRM Perspectives – December, 2017
control of the individual that contribute to the goals of the organization’
(Rotundo & Sackett, 2002).According to Motowidlo et al. (1997), task
performance consists of activities that transform materials into the
goods and services produced by the organization or to allow for
efficient functioning of the organization (Sonnentag et al.,
2008).Contextual performance is referred to as non-job-specific task
proficiency, extra-role performance, organizational citizenship behavior
and interpersonal relations by Campbell (1990), Rotundo (2002) and
Murphy (1989) respectively. Furthermore, counterproductive work
behavior, which is defined as ‘behavior that harms the well-being of the
organization’, has increased in recent years (Rotundo & Sackett, 2002).
It includes behaviors such as absenteeism, being late for work,
engaging in off task behavior, theft, and substance abuse. The
relationship between personality and job performance has been a
research topic which has been frequently studied in organizational
psychology in the past century (Barrick, Mount, & Judge, 2001). It is
widely agreed that the first dimension of the Big Five model is
extraversion and it is characterized by traits such as sociability,
assertiveness, talkativeness and activeness. Extraversion has proved to
be a significant and positive predictor of job performance of
employees, especially in the jobs where interpersonal communications
and interactions are high (Abdullah, Rashid, & Omar,2013).For
instance, extraversion was found to be a valid predictor of job
performance for two occupations involving social interaction, such as
managers and sales personnel (Barrick& Mount, 1991). According to a
BBC internet survey launched in 2009, people who are high in
extraversion and involving sales, finance and marketing jobs love their
jobs as those jobs have so much of social interaction. Further, Johnson
(1997) found a positive relationship between extraversion and job
performance of police personnel, and explained this relationship in
terms of the high level of interaction typically observed in the police
service (Rothmann & Coetzer, 2003).Although Srivastava et al. (2003),
indicates that the need to social support, slightly declines for women
with age but change little in men. Neuroticism is another dimension of
personality which indicates the general tendency to experience negative
effects such as fear, sadness, anger, guilt and disgust. In 1996 Hormann

-134- HRM Perspectives – December, 2017
and Maschke found that neuroticism is a predictor of performance in
various occupations. Dunn, Mount, Barrick and Ones (1995) showed
that emotional stability, which is the opposite of neuroticism, is the
second most important characteristic that affects the employability of
candidates. However, in a study Judge, Higgins, Thoresen and Barrick
(1999) found that neuroticism is related inversely to job performance.
But, there are only few evidences to prove the above claims individuals
with high stress levels are naturally motivated to perform their jobs to
avoid unpleasant situations. However, Barrick and Mount (1991)
argued that most of the correlations for emotional stability were
relatively low. Moreover, Karthikeyan and Srivastava’s (2012)
regression analysis results also confirmed that neuroticism did not
exhibit significant impact on job performance. Moreover Srivastava et
al. (2003), reveals that worry and our sense of instability actually
decrease slightly with age for women but not for men. Further
Donnellan et al. (2008), supports that indicating that neuroticism tend
to decline with age. Agreeableness is the third dimension of the five-
factor model and is often associated with traits such as trust,
straightforwardness, altruism, compliance and tender-mindedness
(Karthikeyan & Srivastava, 2012). Furthermore, it was concluded that
agreeableness does, in fact, have a positive impact on the stability and
consistency of job performance, especially in the service sector where
facets of agreeableness such as compliance, modesty, trust can
influence the stability of performance of employees (Karthikeyan &
Srivastava, 2012). According to Tett et al. (1991), agreeableness is a
significant predictor of job performance. Moreover, Salgado (1997)
found that agreeableness is related to training success. On the other
hand, Rothmann and Coetzer (2003) argued that agreeableness was
practically significantly related to managerial performance. However,
on the contrary, Barrick and Mount (1991) argued that agreeableness is
in fact not an important predictor of job performance, even in jobs
containing large social components (Ex: sales or management). The
fourth dimension of the five-factor model is often labeled as
conscientiousness. Some writers (Fiske, 1949; Hogan, 1983; and John,
1989) have suggested that conscientiousness reflects dependability; that
is, being careful, methodical, organized and responsible. According to

-135- HRM Perspectives – December, 2017
Srivastava et al. (2003), our ability to handle tasks and our
organizational skills grow in our 20s and continue to improve when we
become mature due to new work and family commitments. On the
negative side, high conscientiousness may lead to irritating
fastidiousness, compulsive neatness or workaholic behavior. However,
low scorers may not necessarily lack moral principles, but they are less
likely to be thorough and obsessively rigorous in applying those
(Rothmann & Coetzer, 2003). The final trait is openness to experience
which is associated with traits such as being imaginative, cultured,
curious, original, broad-minded, intelligent, and artistically sensitive.
However, it is also noted as a valid predictor of training proficiency
(Barrick & Mount, 1991). Karthikeyan and Srivastava (2012) also
confirmed the finding stating that individuals who score high on this
dimension (e.g., intelligent, curious, broadminded and cultured) were
likely to experience positive attitudes towards learning experiences in
general. According to a BBC internet survey launched in 2009, people
who are high in openness to experience enjoying investigative jobs, like
science and research that involve a lot of time to discover and develop
new ideas. Further, those highest in Openness were found to be happier
in jobs that involve creativity and abstract thinking, for example
advertising, journalism, art, science, research, and engineering.
Moreover, Tett et al. (1991), reported that openness to experience is not
a valid predictor of job performance. However, a possible explanation
for the paradoxical results regarding the relationship between openness
to experience and job performance can be attributed to the fact that
different jobs have different requirements. For instance, Rothmann and
Coetzer’s (2003) study, which constituted of 159 employees of a
pharmaceutical company, concluded that there is a significant
relationship between openness to experience and managerial
performance.
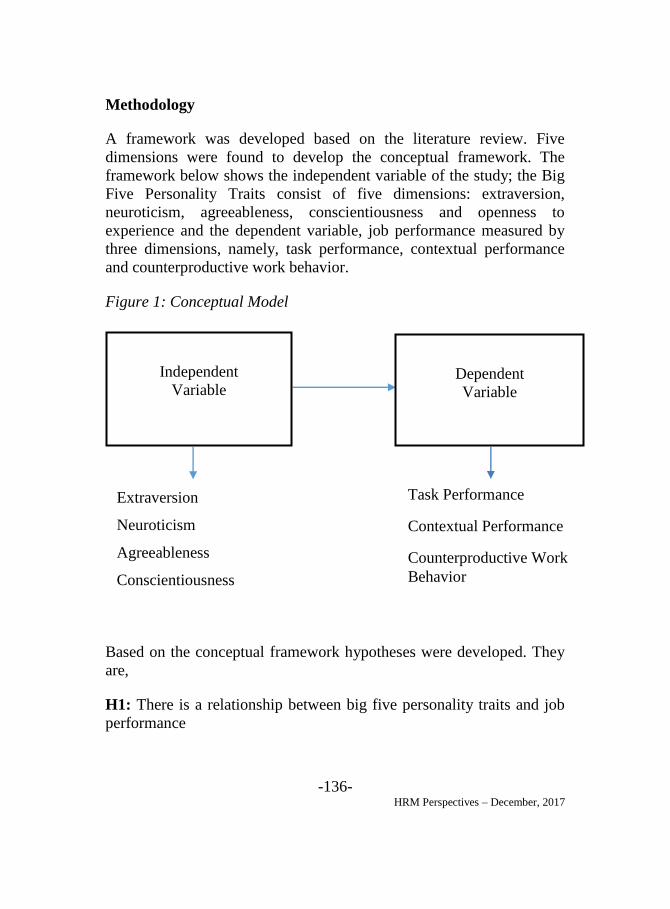
-136- HRM Perspectives – December, 2017
Methodology
A framework was developed based on the literature review. Five
dimensions were found to develop the conceptual framework. The
framework below shows the independent variable of the study; the Big
Five Personality Traits consist of five dimensions: extraversion,
neuroticism, agreeableness, conscientiousness and openness to
experience and the dependent variable, job performance measured by
three dimensions, namely, task performance, contextual performance
and counterproductive work behavior.
Figure 1: Conceptual Model
Based on the conceptual framework hypotheses were developed. They
are,
H1: There is a relationship between big five personality traits and job
performance
Independent
Variable
Big Five
Personality Traits
Dependent
Variable
Job Performance
Extraversion
Neuroticism
Agreeableness
Conscientiousness
Openness to experience
Task Performance
Contextual Performance
Counterproductive Work
Behavior

-137- HRM Perspectives – December, 2017
H1a: There is a relationship between extraversion and job performance
H1b: There is a relationship between neuroticism and job performance
H1c: There is a relationship between agreeableness and job
performance
H1d: There is a relationship between conscientiousness and job
performance
H1e: There is a relationship between openness to experience and job
performance
The population of this study is the middle management level employees
of a state bank in Sri Lanka. The population consisted of employees
who were in staff officer grade 2 and staff officer grade 3-1 of that state
bank. Total number of employees in the above grades was 248.
The researcher used multistage sampling as the sampling technique.
Altogether, there were 28 departments in the state bank and researcher
selected 9 departments due to the time and cost limitations. Further, in
order to get the fair results without being bias 9 departments were
selected from 28 departments where maximum, average and minimum
number of employees in above grades using cluster sampling.
According to Sekaran (2010) sample sizes which are larger than 30 and
less than 500 are appropriate for most research. Thus, the researcher
selected a sample size of eighty (80) employees for this particular
study. The researcher selected those 80 employees by using systematic
random sampling from those 9 departments.
The researcher carried out the research using questionnaires. Questions
were closed ended and Likert scale method was used to measure the
results. The BFI index was used to measure personality traits while job
performance was measured using the Individual Work Performance
Questionnaire (IWPQ).

-138- HRM Perspectives – December, 2017
The researcher examined the relationship between two variables. Thus,
Inferential Statistics were used to test the hypotheses of the study and
correlation analysis was used as the main statistical tool in this study.
Apart from this tool, the researcher used regression analysis to analyze
the data. Furthermore, this study has used descriptive statistical tools
such as mean, mode and standard deviation to analyze the data.
The research covers only middle managerial level employees (Staff
officer grade 2, Staff officer grade 3 – (i) employees) of a state bank in
Sri Lanka.
Discussion of Findings
The findings of the survey are presented in two sections. The first
section provides a description of the demographic factors of the
respondents and the results of univariate analysis of the Big Five
dimensions. The second section addresses the results of testing the
proposed research hypotheses.
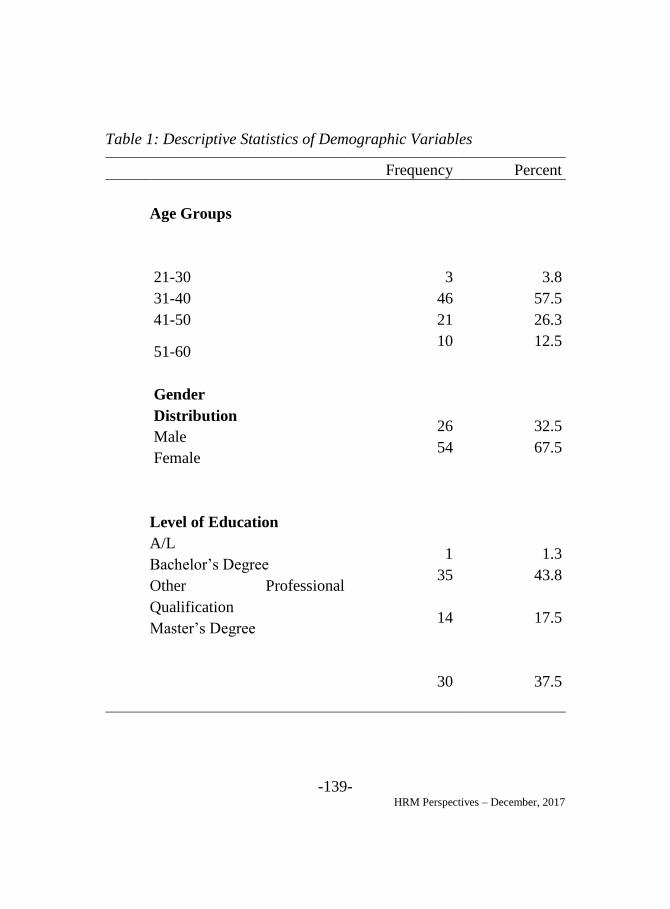
-139- HRM Perspectives – December, 2017
Table 1: Descriptive Statistics of Demographic Variables
Frequency Percent
Age Groups
21-30
3
3.8
31-40 46 57.5
41-50 21 26.3
51-60
Gender
Distribution
Male
Female
Level of Education
A/L
Bachelor’s Degree
Other Professional
Qualification
Master’s Degree
10
26
54
1
35
14
30
12.5
32.5
67.5
1.3
43.8
17.5
37.5
-140- HRM Perspectives – December, 2017
According to the descriptive analysis, the majority of the staff officers
were between the ages of 31 and 40 and the majority possessed a
bachelor’s degree. Further, the sample included a majority of females,
which amounted to 68% of the sample population.
According to the descriptive analysis of the big five dimensions,
extraversion has scored the highest mean value of 3.37. The second
largest mean value obtained by openness to experience. Thus, it is
apparent that the staff officers scored highest on extraversion and
openness to experience than the other three dimensions of personality.
On the other hand, neuroticism scored the lowest mean of 2.87
indicating that the sample scored lowest on that particular dimension.
However, openness to experience scored the highest mode value of the
sample, amounting to 3.57. This indicates that openness to experience
is the dimension which is possessed by many participants than any
other dimension. Conscientiousness gets the second place by scoring a
mode value of 3.29 indicating that it is the next dimensions which is
owned by a large number of participants. Meanwhile neuroticism
appears to be the personality dimension which is owned or displayed by
the least number of staff officers in the sample since it shows the lowest
mode value of 2.83.

-141- HRM Perspectives – December, 2017
Table 2: Testing Hypotheses
Dimension Pearson
Correlati
on
Sig.Val
ue
Relationsh
ip with
Job
Performan
ce
Hypothesis
Accepted/Reject
ed
Big Five
Extraversion
Neuroticism
Agreeableness
Conscientiousn
ess
Openness to
experience
.545**
.351**
.161
.486**
.387**
.369**
.000
.001
.154
.000
.000
.001
Moderate
Positive
Moderate
Positive
Moderate
Positive
Moderate
Positive
Moderate
Positive
Moderate
Positive
Accepted
Accepted
Rejected
Accepted
Accepted
Accepted

-142- HRM Perspectives – December, 2017
Figure 2:Summary of Correlation Analysis
Figure 3:Summary of Regression Analysis

-143- HRM Perspectives – December, 2017
According to the correlation analysis, agreeableness obtained the
highest correlation of coefficient value (r- value) of 0.486 and showed a
significance value of 0.000 proving that it had a statistically significant,
moderate positive relationship between agreeableness and job
performance. Moreover, agreeableness recorded the highest R square
value (R2) of 0.236 indicating that 24% of the total variance of job
performance could be explained by it and showed 0.001 of significance
level proving that agreeableness is statistically a significant predictor of
job performance. Conscientiousness obtained the second highest r-
value of 0.387 and showed a significance value of 0.00. proving that it
had a statistically significant, moderate positive relationship between
conscientiousness and job performance. Additionally, the regression
analysis revealed that conscientiousness was a significantly valid
predictor of job performance and 15% of the total variation of job
performance could be explained by it.
Openness to experience was the dimension which scored third highest
correlation and regression values. It scored an r-value of 0.369 in
correlation analysis, indicating it had a significant, moderate positive
relationship with job performance. According to regression analysis,
openness to experience explained 37% of the total variation of job
performance and was also a significantly valid predictor of
performance. According to the correlation and regression analysis, the
fourth highest scored dimension was extraversion which achieved r-
value of 0.351 indicating that it had a moderate positive relationship
with job performance. According to regression analysis, 12% of the
total variance of job performance could be explained by extraversion
and it was a valid predictor of job performance. Finally, neuroticism
was the lowest scored dimension in both correlation and regression
analysis. According to correlation analysis, it scored 0.161 and it could
only explain a total variation of 3% of job performance according to the
regression analysis. Hence it cannot be concluded that neuroticism is a
predictor of job performance as significance value is greater than 0.05.

-144- HRM Perspectives – December, 2017
Conclusion of the Study
In summary, this study aimed to examine the relationship between big
five personality traits and job performance of middle managerial level
employees of a state bank in Sri Lanka. The research was done by
analyzing the results of given questionnaire gathered from a sample of
80 employees who belonged to staff officer grade 2 and staff officer
grade 3-(i) working at a state bank in Sri Lanka.
The main objective of this study was to examine the relationship
between big five personality traits and job performance of middle
managerial level employees of a state bank in Sri Lanka. The
correlation analysis of big five personality traits and job performance
obtained a Pearson’s correlation value (r value) of 0.545 and a
significance value of 0.000, indicating that big five personality traits
had a statistically significant, moderate positive relationship with the
job performance of employees. Thus, the main objective of the research
was achieved. Furthermore, the regression analysis of the study
obtained a significance value of 0.000 and an R Square (R2) value of
0.297, indicating that personality was a statistically significant
predictor of job performance and 30% of the total variation of job
performance could be explained by personality.
The specific objectives of the research were to identify the relationship
between the big five dimensions of personality and job performance of
employees. According to the correlation analysis, extraversion,
agreeableness, conscientiousness and openness obtained significance
values which were less than 0.05 and r values between 0 and +0.5.
Rothmann and Coetzer argued that agreeableness was practically
significantly related to managerial performance (Rothmann & Coetzer,
2003). However, it was concluded that agreeableness does, in fact, have
a positive impact on the stability and consistency of job performance,
especially in the service sector where facets of agreeableness such as
compliance, modesty, trust can influence the stability of performance of
employees (Karthikeyan & Srivastava, 2012). The research findings are
-145- HRM Perspectives – December, 2017
similar to that past literature as agreeableness showed the highest
correlation on job performance.
According to Barrick and Mount meta-analysis, conscientiousness is a
valid predictor of job performance for all occupational groups studied
(Ex: professionals, police, managers, sales, and skilled/semiskilled) and
for all criterion types (Barrick & Mount, 1991). The study found that
conscientiousness had a statistically significant, moderate positive
relationship with job performance. Hence the study makes a valuable
contribution to the existing literature. According to the results it was
recognized that openness to experience was also a significantly valid
predictor of performance in line with the findings of current literature.
(Rothmann & Coetzer, 2003). Extraversion was also found as a valid
predictor of job performance for two occupations involving social
interaction, such as managers and sales personnel (Barrick & Mount,
1991). The results of this study further revealed that there was a
significant, moderate positive relationship between extraversion and
job performance.
Contrary to the hypothesis, although neuroticism obtained 0.161 as r
value there is no statistically significant relationship between
neuroticism and job performance hence significant value is higher than
0.05. According to those results, it can be concluded that neuroticism is
not a significant predictor of job performance. The reason to
insignificant outcome in this study may be that the present sample was
not representative of neuroticism as a personality trait. Further the
result may have been hurt by the low sample size. Although
Karthikeyan and Srivastava’s (2012) regression analysis results also
confirmed that neuroticism did not exhibit significant impact on job
performance. On the other hand, Srivastava et al.(2003), and Donnellan
et al. (2008), argued that neuroticism tend to decline slightly with age
in women due to family commitments. The researcher used middle
managerial level employees and the majority of the respondents were in
ages between 31 and 40. Further, most respondents were females.
Hence it can be concluded that the respondents may low in neuroticism
and as a result of that it had no statistically significant relationship with

-146- HRM Perspectives – December, 2017
the performance of the middle management level employees of the
state bank. Thus, the findings of this study are supporting to the past
literature. Thus, the researcher was able to achieve the specific
objectives of the research as well.
Practical Implications to the HR professionals, Limitations and
Suggestions for future researches
Practical Implications
Since employees’ personality can significantly predict and affect their
job performance, management should take necessary actions to recruit
and select employees whose personality matches with their job
requirements. For instance, selection tests could include a personality
test to identify employees’ personality traits.
The study revealed that most employees possessed traits of openness to
experience. It had a positive relationship with job performance and was
a significant predictor of performance. According to Barrick & Mount
(1991) individuals who score high in this dimension had the highest
positive orientation toward learning. Normally, motivation to learn is a
key factor in deciding the success of any training program. Hence, the
state bank should pay attention to provide learning and training
experiences to a greater extent to their employees.
According to the study, many of staff officers belonged to
conscientiousness who exhibit traits such as purposeful, strong-willed,
determined, hardworking, responsible, orderly and persistent.
Conscientiousness has been shown to predict a number of other valued
workplace behaviors, such as organizational citizenship and leadership.
Succession planning is a process for identifying and developing internal
people with the potential to fill key business leadership positions in the
company. Hence it is very important to identify employees who belong
to conscientiousness when doing succession planning.
-147- HRM Perspectives – December, 2017
Suggestions for future research
Future research could be carried out to find the relationship and impact
of big five personality traits on factors such as job satisfaction,
effectiveness of selection practices, effectiveness of training programs,
possibility of promotion opportunities and leadership. On the other
hand, the relationship between personality dimensions and job
performance should be studied with larger samples. Future research can
also be conducted, using different instruments to quantify personality.
For instance, this study used the big five inventory (BFI). However,
alternative models such as NEO PI-R or NEO FFI could also be used.
On the other hand, this model used the big five dimensions to measure
personality. Hence, future research may be conducted using models
such as Myers Briggs Type Indicator (MBTI).

-148- HRM Perspectives – December, 2017
References
Abdullah, I., Rashid, Y., & Omar, R. (2013). Effect of personality on
job performance of employees: Empirical evidence from banking sector
of pakistan. Middle-East Journal of Scientific Research, 17 (12), 1735-
1741.
Askarian, N., Eslami, H. (2013).The relationship between personality
traits and job performance, Interdisciplinary Journal of Contemporary
Research in Business, 5 (8), 322-335.
Barrick, M.R., & Mount, M.K. (1991). The big five personality
dimensions and job performance: A meta-analysis. Personnel
Psychology, 44, 1-26.
Barrick, M. R., Mount, M. K., & Judge, T. A. (2001). Personality and
performance at the beginning of the new millennium: What do we
know and where do we go next? International Journal of Selection and
Assessment, 9, 9-30.
Campbell, J. P. (1990). Modeling the performance prediction problem
in industrial and organizational psychology. In M. D. Dunnette & L. M.
Hough (Eds.), Handbook of industrial and organizational psychology
(Vol. 1, pp. 687–732). Palo Alto: Consulting Psychologists Press.
Costa, P.T. & McCrae, R.R. (1992). Revised NEO Personality
Inventory (NEO-PI-R) and NEO Five Factor Model (NEO-FFI)
professional manual. Odessa, FL: Psychological Assessment
Resources.
Ghiselli, E.E.(1973). The validity of aptitude tests in personnel
selection. Personnel Psychology, 26, 461-477.
Guion, R.M., & Gottier, R.F. (1965). Validity of personality measures
in personnel selection. Personnel Psychology, 18,135-164.
-149- HRM Perspectives – December, 2017
Johnson, J.A. (1997). Seven social performance scales for the
California Psychological Inventory. Human Performance,10, 1-30.
Judge. T.A., Higgins, C.A., Thoresen, C.J. & Barrick, M.R. (1999).The
big five personality traits, general mental ability, and career success
across the life span. Personnel Psychology,52, 621-652.
Karthikeyan, & Srivastava, D. K. (2012). The Relationship Between
the Five Factors of Personality, Individual Job Performance and its
Components in the Indian Corporate Sector. International Journal of
Advanced Research in Management, 3 (1), 37-55.
Klang, A. (2012). Context, The Relationship between Personality and
Job Performance in Sales: A Replication of Past Research and an
Extension to a Swedish.
Locke, E.A., & Hulin, C.L. (1962). A review and evaluation of the
validity studies of activity vector analysis. Personnel
Psychology,15,25-42.
Motowidlo,S.J.,Borman,W.C.& Schmit,M.J. (1997).A theory of
individual differences in task and contextual performance. Human
Performance,10(2),71-83.
Murphy, K. (1989). Dimensions of job performance. In R. Dillon, & J.
W. Pellegrino(Eds),Testing: Theoretical and Applied Perspectives (pp.
218-47). New York: Praeger.
Reilly ,R.R. & Chao, G.T. (1982).Validity & fairness of some
alternative employee selection procedures. Personnel Psychology,35,1-
62.
Rosse, J.G., Stecher, M.D., Miller, J.L. & Levin, R.A. (1998). The
impact of response distortion on pre-employment personality testing
and hiring decisions. Journal of Applied Psychology, 83, 634-644.

-150- HRM Perspectives – December, 2017
Rothmann, S., & Coetzer, E. P. (2003). The big five personality
dimensions and job performance. Journal of Industrial Psychology, 68-
74.
Rotundo, M., &Sackett, P. R. (2002). The relative importance of task,
citizenship, and counterproductive performance to global aspects of job
performance: A policy-capturing approach. Journal of Applied
Psychology, 66-80.
Salgado, J. F. (1997). The five-factor model of personality and job
performance in the european community. Journal of Applied
Psychology, 30-43.
Sekaran, U. (2010). Research Methods for Business: A Skill Building
Approach (5th ed.).Wiley.
Sonnentag, S., Volmer, J., &Spychala, A. (2008).Job Performance. In J.
Barling, & C. L.Cooper, The SAGE Handbook of Organizational
Behavior: Volume I –Micro Approaches. SAGE Publications Ltd.
Tett, J., Rothstein, M., & Jackson,D. M. (1991). Personality measures
as predictors of jobPerformance: A meta–analytic review. Personnel
Psychology, 703 - 742.
Wright, P.M., Kacmar, K.M., McMahan, G.C. & Deleeuw, K.(1995).
Cognitive ability and job performance. Journal of Management, 21,
1129-1139.

-151- HRM Perspectives – December, 2017
IMPACT OF ORGANIZATIONAL CULTURE ON
INNOVATION
IN INFORMATION TECHNOLOGY INDUSTRY
N.P.T.Madhubashinie - PQHRM
The Institute of Personnel Management, Sri Lanka
and
Suneth Hitihamu - MBA
HR Consultant
ABSTRACT
Organizational culture has been one of the most studied and theorized
concepts in organizational development. New ways of working and
change in technology have created a greater need for strategic
innovation and co-ordination across units.
The prime objective of this research dissertation is to investigate the
relationship between organizational culture and innovativeness among
the Sri Lankan information technology firms with an emphasis to large
scale firms. The study began with assessing organization culture traits
among 3 large scale IT firms based on the Denison’s organizational
cultural framework and it measures four culture traits namely,
involvement, consistency, adaptability and mission. It moreover
assesses the types of innovation, which are predominant among the
firms and also investigates whether there is a significant relationship
between dominant culture traits and the innovativeness of the three
firms independently.

-152- HRM Perspectives – December, 2017
Keywords: Organizational Culture, Innovation, Information
Technology, Sri Lanka.
Introduction
Background
Organizational Culture
Organizational culture has been one of the most studied and theorized
concepts in Organizational development. A plethora of definitions has
been given to the term “Organizational culture” within the context of
Organizational psychology, anthropology and management theory. Du
Toit (2002) posit that there are as many meanings of culture as people
using the term, but fortunately some of these meanings or definitions of
culture overlap (Du Toit, 2002). Smith (2002) asserted that defining the
term Organizational culture is a difficult task. Organizational culture
has been defined by Harvey and Brown (1996) as a system of shared
meanings, including the language, dress, patterns of behavior, value
system, feelings, attitudes, interactions and group norms of
employees within the organization.
Organizational Innovation and Innovativeness
When significant new value is realized from an invention, it becomes
an innovation. Kotelnikov (2008) says "Science is the conversion of
money into knowledge and Innovation is the conversion of knowledge
back into money. Innovation is the conversion of new knowledge into
new products, structures and strategies and it creates value and increase
production, thereby keeping organizations and people moving ever
onward and upward. Without innovation, new products, new services,
and new ways of doing business would never emerge, and most
organizations would be forever stuck doing the same old things the
same old way.

-153- HRM Perspectives – December, 2017
Research Objectives
Main Objective of the research is to analyze the influence of
organizational culture on organizational innovation. In addition to the
main objective stated above, the researcher also intends to
I. enhance the understanding of organizational culture types within IT
firms
II. to broaden the understanding of organizational innovation types within
Scope of the Study
This study is focused on the large scale IT firms in Sri Lanka so the
population for the study will be the large scale IT firms. The researcher
has selected only the large-scale IT firms for this study. With regard to
the Sri Lankan context, in this research large scale companies are
defined by the companies which have an employee count of more than
800. In this scenario Virtusa, MIT and IFS are selected for this study.
When mentioning IT employees, job ranks whose ideas to be
considered in the research are, Software Engineers, Network Engineers,
Systems Analysts, Quality Assurance Engineers, Team Leads, Business
Analysts, Software and Network Architects, etc.
Literature Review
Definitions of Organizational Culture
Organizational culture has been one of the most studied and theorized
concepts in
Organizational development. A plethora of definitions has been given
to the term “Organizational culture” within the context of
Organizational psychology, anthropology and management theory.
Organizational culture has been defined by Harvey and Brown (1996)
as a system of shared meanings, including the language, dress, patterns
of behavior, value system, feelings, attitudes, interactions and group
norms of employees within the organization. It is seen as a

-154- HRM Perspectives – December, 2017
system of shared values held by employees that distinguishes one
organization from another. In conjunction with this Robbins (1998)
further defined Organizational culture as a common perception by the
organization’s members.
Denison (1990) emphasizes Organizational culture as referring to
underlying values, beliefs and principles that serves as a basis for an
organization’s management system. According to Christensen and
Gordon (1999), it is something that is held to be relatively unique to
each organization. They posit that Organizational cultures evolve from
the adaptation of organizations to the requirements of their
environments.
The Denison Organizational Culture Model
Literature and supporting research with respect to the cultural traits of
the Denison Organizational Culture Model is discussed below.
However, given the scarcity of literature in the IT industry, reference is
also made to research in other industries.
Denison (1990) identifies four basic views of Organizational
culture that can be translated into hypotheses focusing on the cultural
traits, namely, that of involvement, consistency, adaptability and
mission.

-155- HRM Perspectives – December, 2017
Figure 01: Denison’s Culture and Effectiveness Model
Source: Adapted from Denison (1990, p. 15)
Involvement
The involvement hypothesis states that Organizational effectiveness is
a function of the level of involvement and participation of an
organization’s members. A high level of involvement and participation
creates a sense of ownership and responsibility. Out of this ownership
grows a greater commitment to the organization and a growing
capacity to operate under conditions of ambiguity. The result is a
greater employee commitment to the organization, thereby reducing the
:
-156- HRM Perspectives – December, 2017
needs for formal systems of control and leading to performance
enhancement (Denison, 1990).
In the model, involvement is measured with three indices.
Consistency
The consistency hypothesis states that, in consistent cultures,
communication is a more reliable process for exchanging information
because there is overall agreement on the meaning of words, actions
and other symbols. Furthermore, Denison posits that a common
perspective, shared beliefs and communal values among the
organization’s members will enhance internal coordination and
promote meaning and a sense of identification on the part of its
members (Denison, 1990).
Adaptability
The adaptability hypothesis states that a culture that allows an
organization to adapt to
changing demands and circumstances, will promote effectiveness.
Adaptability allows an organization to recognize and respond to its
external environment and internal constituencies. In response to either
internal or external stimuli, it requires the capacity to restructure
behaviors and processes, as appropriate (Denison, 1990). Despite some
of the advantages of well-integrated organizations they can also be the
least adaptive and most difficult to change as internal integration and
external adaptation can be at odds.
Mission
The mission hypothesis states that a culture that provides a shared
definition of the function and purpose of an organization is not
only positively associated with investing their efforts in the

-157- HRM Perspectives – December, 2017
wellbeing of the organization, but also helps in identifying the
direction and goals which makes it easier to choose relevant courses of
action for the organization. A sense of mission allows an organization
to shape current behavior by envisioning a desired future state. Being
able to internalize and identify with an organization’s mission
contributes to both short and long-term commitment to the
organization (Denison, 1990).
Organizational Innovation and Innovativeness
When significant new value is realized from an invention, it becomes
an innovation. Kotelnikov (2008) says "Science is the conversion of
money into knowledge and Innovation is the conversion of knowledge
back into money. Innovation is the conversion of new knowledge into
new products, structures and strategies and it creates value and increase
production, thereby keeping organizations and people moving ever
onward and upward. Without innovation, new products, new services,
and new ways of doing business would never emerge, and most
organizations would be forever stuck doing the same old things the
same old way.
Organizational Culture and Innovation
There seems to be little agreement with the conceptual studies as to
what type of organizational culture will promote creativity and
innovation (Judge et al., 1997). Nevertheless, various researchers have
proved the positive relationship between organizational culture and
innovation. Tushman and O’Reilly (1997) point out that successful
organizations have the capacity to absorb innovation into the
organizational culture and management processes and that
organizational culture lies at the heart of organizational innovation.
Kenny and Reedy (2007) explain that organizational culture affects the
extent to which creative solutions are encouraged, supported and
implemented. Martin and Terblanche (2003) emphasize that a culture
supportive of creativity, encourages innovative ways of representing
problems and finding solutions. From these researches, it can be
concluded that organizational culture and innovation have a

-158- HRM Perspectives – December, 2017
relationship in which organizational culture is an antecedent as well as
an important factor for innovation.
Conceptual Frame Work & Methodology
Conceptual Framework
This model focuses on the drivers that could have an effect on the
workforce innovation success in large scale IT firms in Sri Lanka. The
independent variables are the predictors to employees' innovation, the
factors of organizational culture. On the other hand, the innovation
success is the dependent variable.
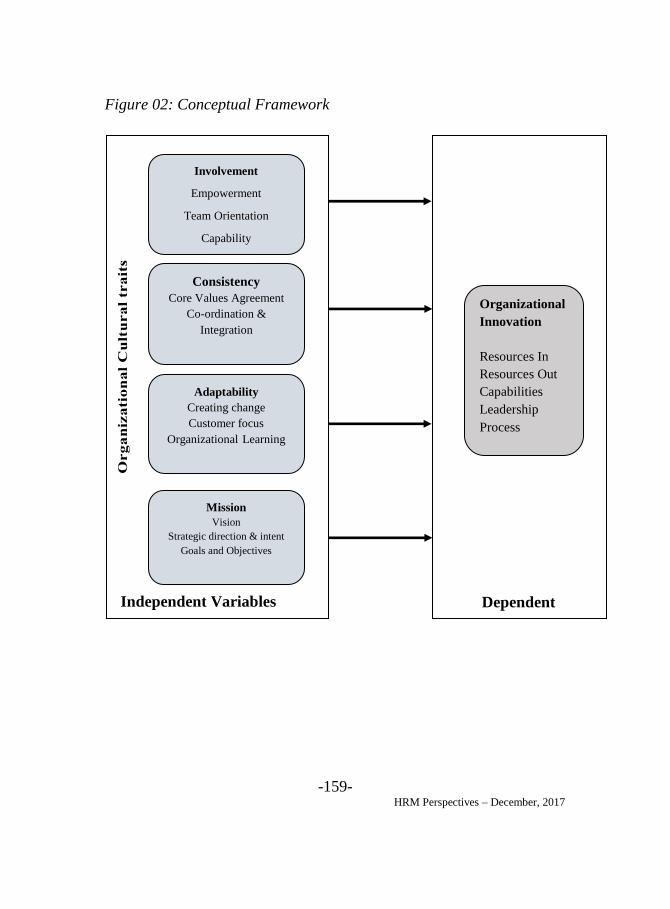
-159- HRM Perspectives – December, 2017
Figure 02: Conceptual Framework
Independent Variables
Org
an
iza
tio
na
l C
ult
ura
l tr
ait
s
Dependent
Variable
Involvement
Empowerment
Team Orientation
Capability
Development
Consistency
Core Values Agreement
Co-ordination &
Integration
Adaptability
Creating change
Customer focus
Organizational Learning
Mission
Vision
Strategic direction & intent
Goals and Objectives
Organizational
Innovation
Resources In
Resources Out
Capabilities
Leadership
Process

-160- HRM Perspectives – December, 2017
Hypotheses Development
In studying the influence of organizational culture on creativity and
innovation, the dimensions of Denison's model of organizational
culture have a direct bearing on the influence of organizational culture
on creativity and innovation. Based on this model the following
hypotheses are developed to test the factors of organizational culture
that can have an influence on the degree to which creativity and
innovation take place in the organization.
H10 – There is no significant relationship between culture trait
involvement & organizational innovation
H1 – There is a significant relationship between culture trait
involvement & organizational innovation
H20 – There is no significant relationship between culture trait
consistency & organizational innovation
H2 – There is a significant relationship between culture trait
consistency & organizational innovation
H30 – There is no significant relationship between culture trait
adaptability & organizational innovation
H3 – There is a significant relationship between culture trait
adaptability & organizational innovation
H40 – There is no significant relationship between culture trait mission
& organizational innovation
H4 – There is a significant relationship between culture trait mission &
organizational innovation
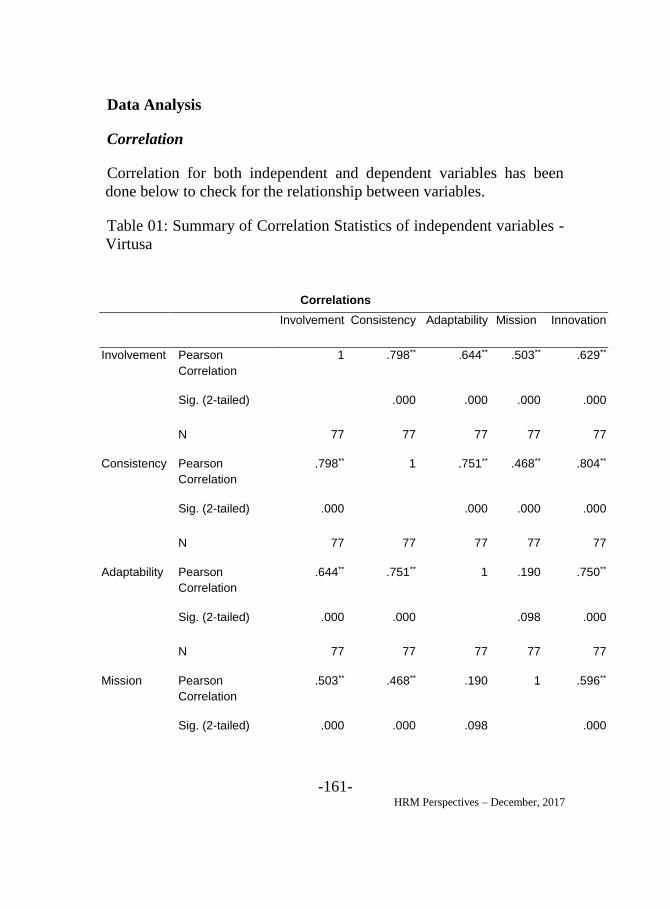
-161- HRM Perspectives – December, 2017
Data Analysis
Correlation
Correlation for both independent and dependent variables has been
done below to check for the relationship between variables.
Table 01: Summary of Correlation Statistics of independent variables -
Virtusa
Correlations
Involvement Consistency Adaptability Mission Innovation
Involvement Pearson
Correlation 1 .798** .644** .503** .629**
Sig. (2-tailed) .000 .000 .000 .000
N 77 77 77 77 77
Consistency Pearson
Correlation .798** 1 .751** .468** .804**
Sig. (2-tailed) .000 .000 .000 .000
N 77 77 77 77 77
Adaptability Pearson
Correlation .644** .751** 1 .190 .750**
Sig. (2-tailed) .000 .000 .098 .000
N 77 77 77 77 77
Mission Pearson
Correlation .503** .468** .190 1 .596**
Sig. (2-tailed) .000 .000 .098 .000

-162- HRM Perspectives – December, 2017
N 77 77 77 77 77
Innovation Pearson
Correlation .629** .804** .750** .596** 1
Sig. (2-tailed) .000 .000 .000 .000
N 77 77 77 77 77
**. Correlation is significant at the 0.01 level (2-tailed).
Table 02: Summary of Correlation Statistics of independent variables –
MIT
Correlations
Involveme
nt Consistenc
y Adaptabilit
y Missio
n Innovatio
n Involveme
nt Pearson
Correlatio
n
1 .732** .558** .205 .707**
Sig. (2-
tailed) .000 .000 .203 .000
N 40 40 40 40 40
Consistenc
y Pearson
Correlatio
n
.732** 1 .515** .201 .728**
Sig. (2-
tailed) .000 .001 .213 .000
N 40 40 40 40 40
Adaptabilit
y Pearson
Correlatio
n
.558** .515** 1 -.248 .757**
Sig. (2-
tailed) .000 .001 .123 .000
N 40 40 40 40 40
Mission Pearson .205 .201 -.248 1 .171

-163- HRM Perspectives – December, 2017
Correlatio
n Sig. (2-
tailed) .203 .213 .123 .291
N 40 40 40 40 40
Innovation Pearson
Correlatio
n
.707** .728** .757** .171 1
Sig. (2-
tailed) .000 .000 .000 .291
N 40 40 40 40 40
**. Correlation is significant at the 0.01 level (2-tailed).

-164- HRM Perspectives – December, 2017
Table 03: Summary of Correlation Statistics of independent variables -
IFS
Correlations
Involveme
nt Consistenc
y Adaptabilit
y Missio
n Innovatio
n
Involveme
nt Pearson
Correlatio
n
1 -.016 .582** -.238 .689**
Sig. (2-
tailed) .924 .000 .163 .000
N 36 36 36 36 36
Consistenc
y Pearson
Correlatio
n
-.016 1 .104 -.039 .285
Sig. (2-
tailed) .924 .546 .822 .092
N 36 36 36 36 36
Adaptabilit
y Pearson
Correlatio
n
.582** .104 1 -.627** .681**
Sig. (2-
tailed) .000 .546 .000 .000
N 36 36 36 36 36
Mission Pearson
Correlatio
n
-.238 -.039 -.627** 1 -.395*
Sig. (2-
tailed) .163 .822 .000 .017
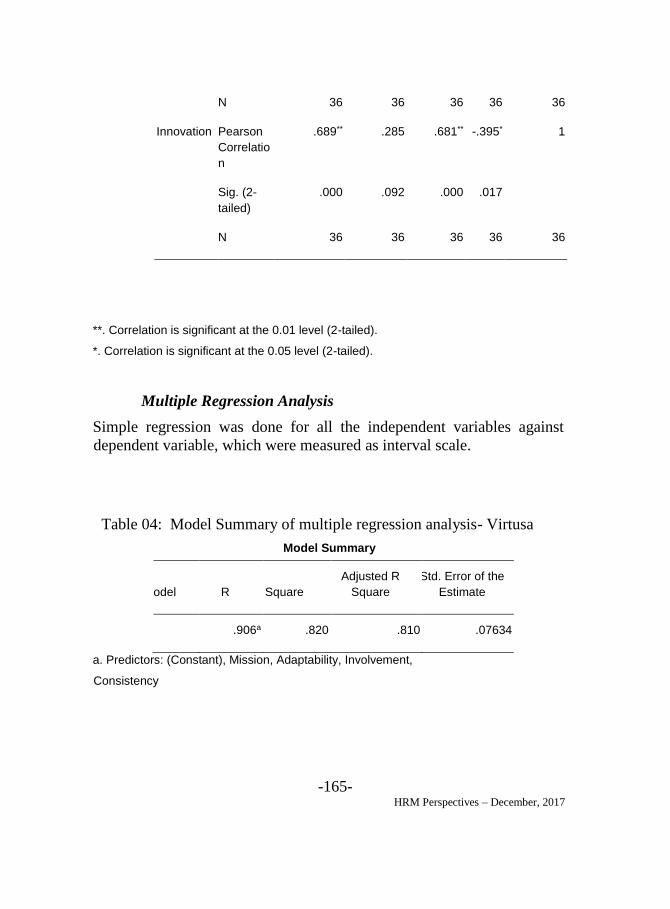
-165- HRM Perspectives – December, 2017
N 36 36 36 36 36
Innovation Pearson
Correlatio
n
.689** .285 .681** -.395* 1
Sig. (2-
tailed) .000 .092 .000 .017
N 36 36 36 36 36
**. Correlation is significant at the 0.01 level (2-tailed).
*. Correlation is significant at the 0.05 level (2-tailed).
Multiple Regression Analysis
Simple regression was done for all the independent variables against
dependent variable, which were measured as interval scale.
Table 04: Model Summary of multiple regression analysis- Virtusa
Model Summary
Model R R Square Adjusted R
Square Std. Error of the
Estimate
1 .906a .820 .810 .07634
a. Predictors: (Constant), Mission, Adaptability, Involvement,
Consistency
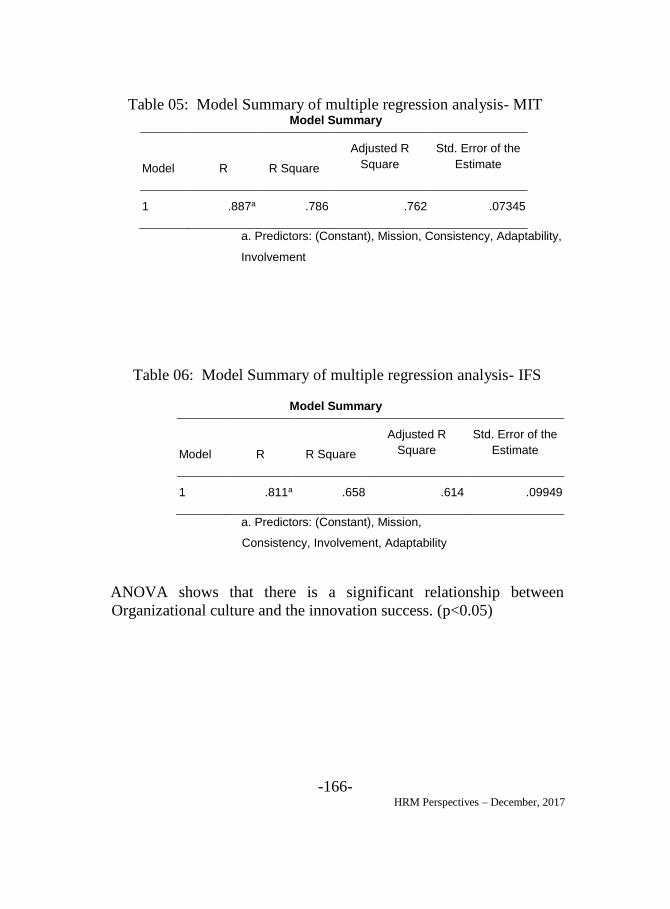
-166- HRM Perspectives – December, 2017
Table 05: Model Summary of multiple regression analysis- MIT Model Summary
Model R R Square
Adjusted R
Square Std. Error of the
Estimate
1 .887a .786 .762 .07345
a. Predictors: (Constant), Mission, Consistency, Adaptability,
Involvement
Table 06: Model Summary of multiple regression analysis- IFS
Model Summary
Model R R Square
Adjusted R
Square Std. Error of the
Estimate
1 .811a .658 .614 .09949
a. Predictors: (Constant), Mission,
Consistency, Involvement, Adaptability
ANOVA shows that there is a significant relationship between
Organizational culture and the innovation success. (p<0.05)
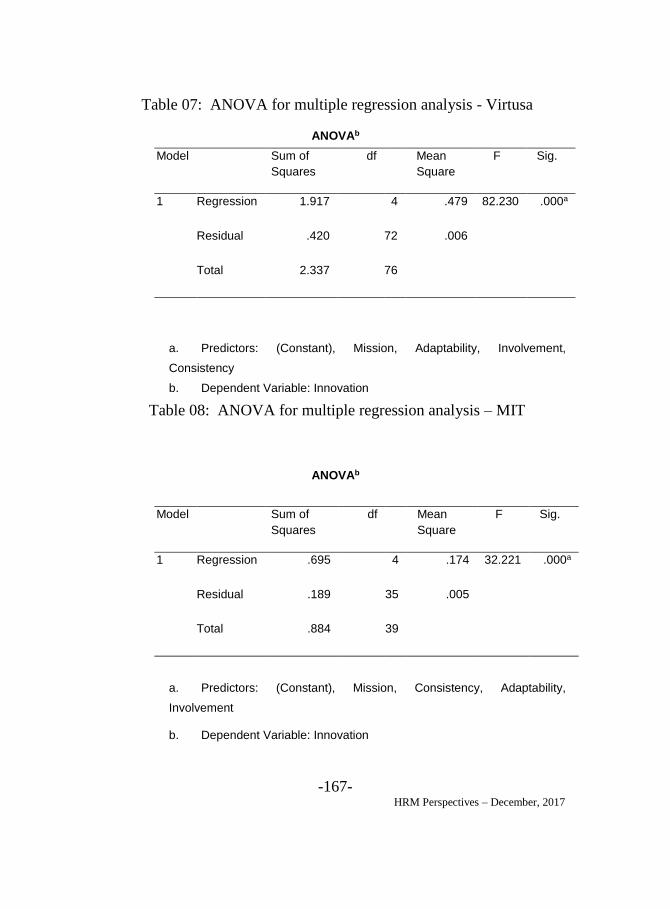
-167- HRM Perspectives – December, 2017
Table 07: ANOVA for multiple regression analysis - Virtusa
ANOVAb
Model Sum of
Squares df Mean
Square F Sig.
1 Regression 1.917 4 .479 82.230 .000a
Residual .420 72 .006
Total 2.337 76
a. Predictors: (Constant), Mission, Adaptability, Involvement,
Consistency
b. Dependent Variable: Innovation
Table 08: ANOVA for multiple regression analysis – MIT
ANOVAb
Model Sum of
Squares df Mean
Square F Sig.
1 Regression .695 4 .174 32.221 .000a
Residual .189 35 .005
Total .884 39
a. Predictors: (Constant), Mission, Consistency, Adaptability,
Involvement
b. Dependent Variable: Innovation

-168- HRM Perspectives – December, 2017
Table 09: ANOVA for multiple regression analysis - IFS
ANOVAb
Model Sum of
Squares df Mean
Square F Sig.
1 Regression .590 4 .147 14.896 .000a
Residual .307 31 .010
Total .897 35
a. Predictors: (Constant), Mission, Consistency, Involvement,
Adaptability
b. Dependent Variable: Innovation
ANOVA shows that there is a significant relationship between
Organizational culture and the innovation success. (p<0.05)
The below Coefficients tables shows Beta value for the independent
variables when they are regressed jointly against dependent variable.
Independent variables having positive Beta values, shows a positive
relationship towards the dependent variable, Innovation success and
negative Beta value shows the negative relationship towards the
Innovation.
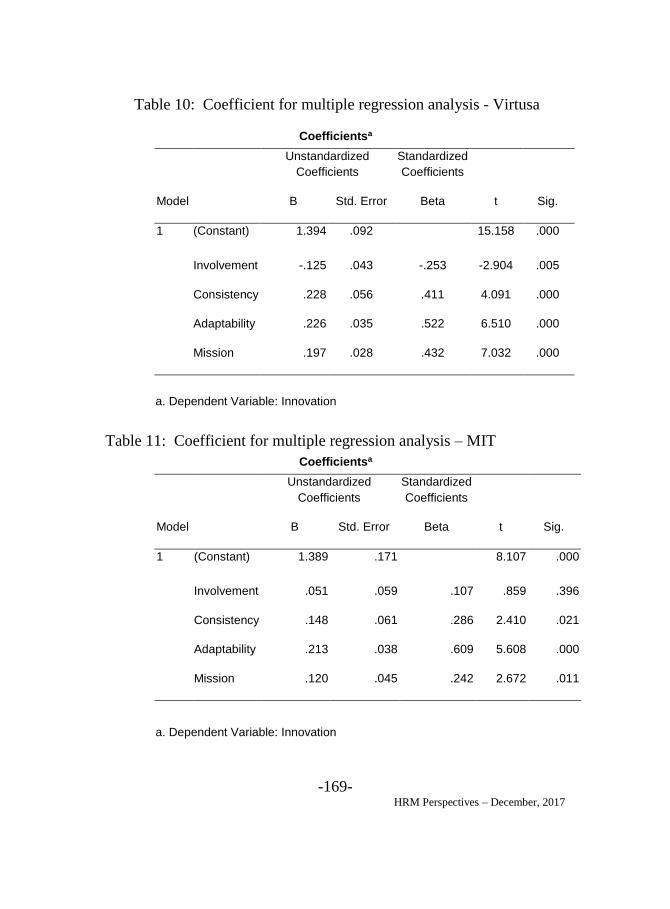
-169- HRM Perspectives – December, 2017
Table 10: Coefficient for multiple regression analysis - Virtusa
Coefficientsa
Model
Unstandardized
Coefficients Standardized
Coefficients
t Sig. B Std. Error Beta
1 (Constant) 1.394 .092 15.158 .000
Involvement -.125 .043 -.253 -2.904 .005
Consistency .228 .056 .411 4.091 .000
Adaptability .226 .035 .522 6.510 .000
Mission .197 .028 .432 7.032 .000
a. Dependent Variable: Innovation
Table 11: Coefficient for multiple regression analysis – MIT
Coefficientsa
Model
Unstandardized
Coefficients Standardized
Coefficients
t Sig. B Std. Error Beta
1 (Constant) 1.389 .171 8.107 .000
Involvement .051 .059 .107 .859 .396
Consistency .148 .061 .286 2.410 .021
Adaptability .213 .038 .609 5.608 .000
Mission .120 .045 .242 2.672 .011
a. Dependent Variable: Innovation

-170- HRM Perspectives – December, 2017
Table 12: Coefficient for multiple regression analysis - IFS
Coefficientsa
Model
Unstandardized
Coefficients Standardized
Coefficients
t Sig. B Std. Error Beta
1 (Constant) 1.289 .405 3.181 .003
Involvement .277 .076 .483 3.645 .001
Consistency .158 .066 .256 2.410 .022
Adaptability .138 .069 .335 2.019 .052
Mission -.032 .074 -.060 -.432 .668
a. Dependent Variable: Innovation
Summary of the Hypotheses Testing
The hypotheses which defined in chapter 3 are assessed by considering
the data gathered from the questionnaire. This will justify whether the
hypotheses considered are supportive or not.
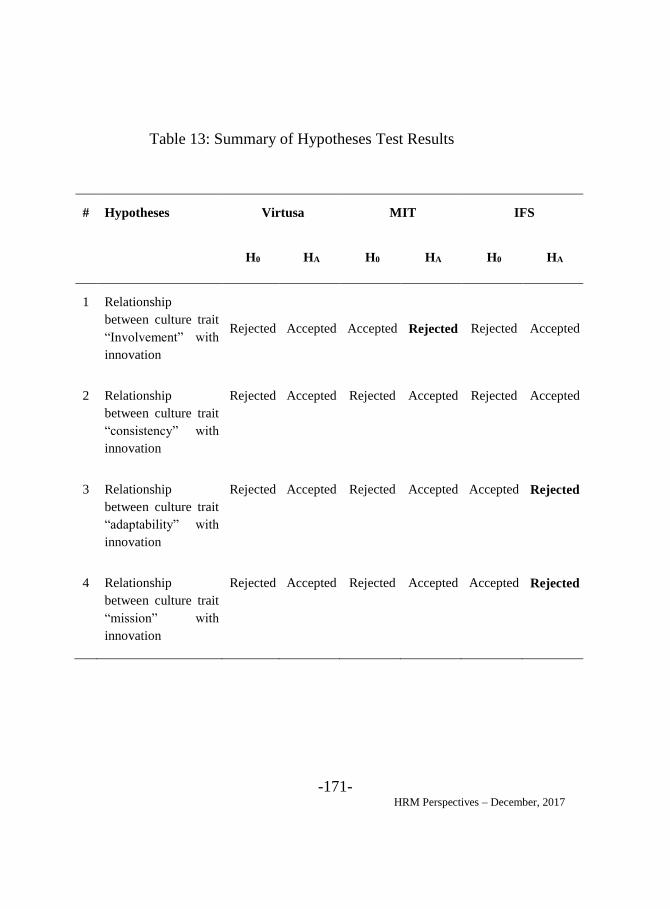
-171- HRM Perspectives – December, 2017
Table 13: Summary of Hypotheses Test Results
# Hypotheses Virtusa MIT IFS
H0 HA H0 HA H0 HA
1 Relationship
between culture trait
“Involvement” with
innovation
Rejected Accepted Accepted Rejected Rejected Accepted
2 Relationship
between culture trait
“consistency” with
innovation
Rejected Accepted Rejected Accepted Rejected Accepted
3 Relationship
between culture trait
“adaptability” with
innovation
Rejected Accepted Rejected Accepted Accepted Rejected
4 Relationship
between culture trait
“mission” with
innovation
Rejected Accepted Rejected Accepted Accepted Rejected

-172- HRM Perspectives – December, 2017
Conclusion and Recommendations
Findings
Findings are presented on an organizational basis (organization wise).
Finally a comparison is made to manifest the differences in between
the considered three organizations.
Findings from the study at Virtusa
Gender distribution at Virtusa is almost equally distributed. 51.9% of
them are males and 48.1% of are females. The mean age of an
employee at Virtusa is 27.48 years. 54.5% of employees at Virtusa are
unmarried and 45.5% of them are married. 79.2% of employees at
Virtusa are having bachelors’ degrees and only 20.8% are having
postgraduate qualifications.
In this model, innovation is explained (82%) by the independent
variables. It means, about 82% of the variance has been significantly
explained by the set of independent variables. All the individual
variables (Involvement, Consistency, Adaptability, and Mission) in
this study are highly influenced to the success of the innovation at
Virtusa.
Findings from the study at MIT
Gender distribution at MIT is more towards males. 55% of them are
males and 45% of are females. The mean age of an employee at MIT
is 28.35 years. 52.5% of employees at MIT are unmarried and 47.5%
of them are married. 80% of employees at MIT are having bachelors’
degrees and only 20% are having postgraduate qualifications.

-173- HRM Perspectives – December, 2017
In this model innovation is explained (78.6%) by the independent
variables. It means, about 78.6% of the variance has been significantly
explained by the set of independent variables. At MIT, Consistency,
Adaptability and Mission are highly influenced to the innovation
success, but the Involvement is not influencing.
Findings from the study at IFS
Gender distribution at IFS is almost equally distributed. 52.8% of them
are males and 47.2% of are females. The mean age of an employee at
IFS is 26.25 years. 63.9% of employees at IFS are unmarried and
36.1% of them are married, 75% of employees at IFS are having
bachelors’ degrees and only 25% are having postgraduate
qualifications.
In this model innovation is explained (65.8%) by the independent
variables. It means, about 65.8% of the variance has been significantly
explained by the set of independent variables. At IFS, while
Involvement and Consistency are highly influencing to the innovation
success, Adaptability and Mission are not influencing to the
innovation success.
General findings and the Comparison in Relation to Literature
The key findings of the comparison study between selected three
companies could be summarized as follows.
Generally the gender distribution at all three companies are almost
similar. But the result indicates IFS has younger employees than
Virtusa and MIT. Generally marital status is similar at Virtusa and
MIT. But compared to the other two companies IFS has a larger
portion (63.9%) of unmarried employees. The educational
qualifications of the employees’ at all three companies in general are
-174- HRM Perspectives – December, 2017
similar. But result indicates IFS has younger employees than Virtusa
and MIT. Using the results of Virtusa employees it can be concluded
that the model was 82% explained by the independent variables. At
MIT it was explained 78.6% and it is quite close to the Virtusa, but the
model is explained only 65.8% at IFS.
Data analysis concludes that all the individual variables (Involvement,
Consistency, Adaptability, and Mission) used in the study are
influencing the innovation success at Virtusa. Further, it is explained
that at Virtusa, innovation success can be influenced by using
empowerment, team orientation, creating change, customer focus,
goals and objectives, vision, core values and capability development.
According to (Bullinger et al. 2007 and Egbetokun et al. 2007,
innovation capability is related to a variety of factors and thus is
affected by different internal and external factors. This is further
emphasized by this research findings.
At MIT, only three out of four individual variables (Consistency,
Adaptability and Mission) are influencing the innovation success of
the organization. Culture trait involvement is not influencing
innovation as per the findings. Subject literature provides evidence of
a significant relation between culture and innovation, what empirical
research has not elucidated is what type of culture actually stimulates
or inhibits innovation.
In conclusion, by analyzing the results of data analysis, it can be stated
that the organizational culture at Virtusa, MIT and IFS are
significantly different. Though three of these companies are in the
same industry, almost same age groups, same gender distribution,
there are still significant differences in the organizational culture.
Organizations have discernible differences based on industry norms
(cf. Pennings & Gresov, 1986). Just as task environments affect how
organizations are structured, assumptions about important constituents
lead to similar values among same-industry organizations (Gordon,
1991). Stated simply, similar organizations likely to share similar
cultures. But as per the findings of this research, it is emphasized that

-175- HRM Perspectives – December, 2017
similar organizations in the same industry may have significant
differences in their cultures.
Study has validated the fact that the model of Denison’s organizational
cultural framework could be successfully employed in classifying
Organizational culture of organizations within Sri Lankan context.
More on, the study shows that organization culture consists of culture
traits, namely, involvement, consistency, adaptability and mission
exerts a significant effect on the innovativeness of an organization.
Although the findings of this research could be tenuous due to the
limited number of large scale IT firms available in Sri Lanka, the
findings provide insight with regards to the organizational culture that
leads to innovation experienced by employees at the large scale IT
firms.
Recommendations
Using the results of this research, the following recommendations are
made to the reader’s consideration.
Recommendations when working in the field of organizational
culture
Robbins (1998) defines organizational culture as a system of shared
meaning that is further defined as a common perception by the
organization’s members. Based on these research findings the
organization seems to possess this shared meaning and common
perception regarding the cultural traits as measured by the Denison
Organizational Culture Survey and how it influences the
organizational innovation success.

-176- HRM Perspectives – December, 2017
It is recommended that line managers should be assisted in
understanding and being made aware of how practices within the
organization can have an impact on the organization’s performance
based on employees’ perceptions. It should therefore become a
business imperative to ensure that the organizational culture is aligned
with the organizational innovation success.
Recommendations for the organization
Managers must assess their own organization’s culture accurately and
should recognize and use the levers available to influence their
cultures. How employees work together and what they believe to be
true about their individual and collective purposes make all the
difference in their willingness to produce innovative quality goods and
services that attract and retain customers. Any changes to the
organizational culture should focus on what people value and what
they do. Organizations should determine which cultural traits should
be promoted or developed in order to enhance the innovation. Against
this ‘backdrop’ the following recommendations are made to address
the lowest rated dimensions.
Capability Development
In order to address low scores obtained in capability development,
information about performance, quality, competition and customers
should be shared throughout the organization. Ideas and contributions
from those who are closest to the work and to the customer by
involving them in decision-making too are important. Building of IT
teams, not individuals by encouraging multi-skilling, so that enabling
mutual understanding of how work is done in other areas and the need
to work together to create value for the customer needs to be
established. Rewarding team work and team accomplishments could
encourage the outcomes. Making performance management a strong

-177- HRM Perspectives – December, 2017
focus in these departments is pivotal to encourage goal setting,
performance reviews, and providing feedback on achieving objectives.
Co-ordination and Integration
To improve on perceptions with regards to co-ordination and
integration Denison (1990) suggests that banners and signs be
displayed throughout the departments. The vision and mission should
also constantly be referred to in decision-making and during
performance reviews so that individuals know where they fit in
relation to the mission and vision of the firm. Furthermore, Denison
suggests improving coordination and integration that focus should be
given to activities that illustrate the core values. In order to actively
create alignment of behavior and core values it should be in the
context of the culture, the core values, and skills development as part
of the firm’s competitive strategy. Increased interaction and
communication between individuals and groups and increased number
of people involved in problem solving, goal setting and generating
new ideas should be encouraged.
Strategic Direction and Intent
To address low scores regarding strategic direction and intent, the IT
organization management teams need to adopt a long-term strategy
and direction as their highest priority. Change the rules of the game in
the IT industry. Necessary Changes need to be adapted in the
organization's operations by focusing on competitors and continuous
innovation of how the organization can create value. Everyone in the
organization needs to be made understood and familiar with the
organization’s strategy and vision. Everyone in the organization,
from the boardroom to the filing room, must be able to define their
goals in terms of the overall mission, vision and strategy of the
organization. Strategic direction must be supported at all levels.
-178- HRM Perspectives – December, 2017
Recommendations for further research
In an attempt to address the limitations of this research, it is
recommended that a number of organizations across industries should
be included in order to achieve true value of the research. Researching
on a set of numerous organizations across industries will add
opportunity and value to explore the concept of a strong organizational
culture and how it influences innovation success. Further research is
needed to validate the Denison Organizational Culture Survey within
an IT firm in a western country, to ensure a multi-cultural sample of
participants. It is also recommended that a balanced stratified random
sample be utilized for further research to ensure that subgroups of the
population, especially older groups are represented.
-179- HRM Perspectives – December, 2017
References
Bullinger, Hans-Jörg, Bannert, M. and Brunswicker, S. (2007).
“Managing innovation capability in SMEs. Tech Monitor, Special
Feature: Innovation & KM by SMEs,
Christensen, E. W., & Gordon, G. G. (1999). An exploration of
industry, culture and revenue growth. Organization Studies
Deal, T., & Kennedy, A. (1982). Corporate cultures. Reading, Canada:
Addison Wesley.
Denison, D. (1990). Corporate culture and organizational
effectiveness. New York: John Wiley & Sons.
Denison, D., & Mishra, A. (1995). Toward a theory of organizational
culture and effectiveness. Retrieved from http:
www.denisonculture.com/articles/toward_theory
Du Toit, W. (2002). The discriminate validity of a culture assessment
instrument: A comparison of company cultures. Unpublished Doctoral
thesis, Rand Afrikaans University. Retrieved from http:
www.DLAarticles.com
Egbetokun, A. A., and Siyanbola, W. O. (2007). Indigenous
Innovation Capability in Sub-Saharan Africa: A Review of the
Nigerian Situation. Hangzhou, China. Retrieved from http:
www.researchgate.net/publication/229038381_Assessment_of_Innova
tion_Capability_in_the_Cable_and_Wire_Manufacturing_Industry_in
_Nigeria_a_case_study_approach
Gordon, G., & Ditomaso, N. (1991).Predicting corporate performance
form organizational culture. Journal of Management Results
Harvey, D., & Brown, D. (1996). An experiential approach to
organizational development (5th ed). New Jersey: Prentice Hall.

-180- HRM Perspectives – December, 2017
Judge, W.Q., Fryxell, G.E. & Dooley, R.S. (1997). The new task of R
& D management: Creating goal-directed communities for innovation.
California Management Review
Kenny, B., & Reedy, E. (2006). The Impact of Organizational Culture
Factors on Innovation Levels in SMEs: An Empirical Investigation.
The Irish Journal of Management
Kotelinkov V. (2008). Systematic Innovation , the new holistic
approach, Retrieved from
http://www.innovarsity.com/1000ventures/business_guide/innovation_
systemic.html
Pennings, J., & Gresov, C. 1986. Technoeconomic and structural
correlates of organizational culture. Organization Studies,
Robbins (1998). Organizational behavior: Concepts, controversies,
applications (8th ed.). New Jersey: Prentice-Hall.
Sekaran,O. (2003). Research Method for Business: A Skill Building
Approach, New York: John Wiley & Sons
Smith, E. (2002). The relationship between organizational culture and
strategy formulation in South African firms. South African Journal for
Business Management
Tushman, M.L. & O'Reilly, C.A. III (1997), Winning through
Innovation: A Practical Guide to Leading Organizational Change and
Renewal, Boston, MA: Harvard Business School Press.

-181- HRM Perspectives – December, 2017
THE IMPACT OF JOB SATISFACTION ON
TURNOVER INTENTION OF OPERATIONAL LEVEL
EMPLOYEES: A CASE STUDY OF A GARMENT
FACTORY IN SRI LANKA
Ravindi Navoda Gamage - PQHRM
and
Janitha Mandawala, MLS
Visiting Lecturer
Institute of Personnel Management, Sri Lanka
ABSTRACT
The purpose of this research is to identify the impact of job satisfaction
on turnover intention of operational level employees in ABC Company.
The design of the research is hypothesis testing, as it explains the
nature of certain relationships and to explain the variance in the
dependent variable.
The main objective of the study is to examine the impact of job
satisfaction on turnover intention of operational level employees in
ABC Company. The target population consists of all 268 employees.
But for the purpose of the study, the researcher selected only 150
operational level employees. Derived from this main objective, there
were five specific objectives in this study. In order to achieve the above
objectives, six hypotheses were developed based on the previous
literature. A structured questionnaire was used to gather information.
Once gathered data, then data analysis was done using SPSS version

-182- HRM Perspectives – December, 2017
21 statistical package. To test the hypotheses of the study persons
correlation and regression analysis were used..
According to the results of the analysis, it has been noted that except
job stress all the other dimensions of job satisfaction are negatively
associated with turn over intention. The results and the
recommendations of this study provide understanding that how these
variables affect the turnover intention and how to reduce turnover rate.
Keywords: Job Satisfaction, Turnover Intention, Working Conditions,
Job Stress, Pay, Supervisor Support, Career Opportunity.
Introduction
Background of the Industry
Garment Iindustry has an important place in Sri Lanka’s economy. It
has become Sri Lanka’s largest export industry since 1986. It is also the
country’s largest net foreign exchange earner since 1992. The total
value of export earnings in the sector was US dollars 2,424 million
accounting for 52 percent of the total export earnings in 2002. This
industry provides more than 330,000 direct employment or 5 percent of
country’s total employment in more than 1,060 garment factories
(Central Bank of Sri Lanka, Annual Report, 2002,). The Sri Lankan
apparel industry provides a remarkable contribution to the GDP,
exports, foreign exchange earnings and employment generation. In
2002, Sri Lanka’s garment sector accounted for 6 % of the GDP, 30 %
of industrial production, 33 % of generating employment, 52 % of total
exports and 67 % of industrial exports. Hence it plays a major role in
advancing the country’s economy. Further, most of apparel factories in
Sri Lanka are small and medium scale. Declare about 85% of the total
value of exports (Board of Investment in Sri Lanka., 2014).
The apparel industry is one of the best in our economy in attracting
foreign currency into the economy and one of the most significant

-183- HRM Perspectives – December, 2017
dynamic contributors to the overall economy of Sri Lanka. The apparel
industry remained competitive through increased productivity,
improved quality, diversification and a gradual recovery in external
demand. Kelegama (2005) emphasized that the garment industry in Sri
Lanka has been contributing to the livelihood of nearly 1.2 million
people. Dheerasinghe (2009) stated that this industry provides more
than 330,000 direct employment or 5 percent of country’s total
employment. The major problem the garment industry is facing is the
problems in developing and maintaining the required manpower
(Dheerasinghe, 2009). High turnover rates have caused poor quality,
low productivity & unfilled orders in this garment factory. This
research tries to identify the root causes job dissatisfaction leading to
turnover intention. Labor problems in garment factories have merged as
a key risk in the apparel sector. Barney & Wright (1997) stated that the
firm's people are its most important asset. Thus, employee retention is a
must to obtain the organizational expected success. Alkandari &
Hammad (2009) contended that the retention of human resources has
been shown to be momentous to the development and the
accomplishment of the organization’s goals and objectives.
Job Satisfaction
The term job satisfaction figures prominently in any discussions on
management of human resources. Job satisfaction is an individual’s
feeling regarding his or her work. It can be influenced by a multitude of
factors (Barbara , 2004). Job satisfaction has been widely used in
scientific research and has been approached from different perspectives
by different authors. A review of relevant definitions and theories on
job satisfaction is as follows. There are some definitions introduced by
different authors such as “job satisfaction is a complex and
multifaceted concept which can mean different things to different
people” Mullins, (2005). The term job satisfactions refer to the attitude
and feelings people have about their work. Positive and favorable
attitudes towards the job indicate job satisfaction. Negative and

-184- HRM Perspectives – December, 2017
unfavorable attitudes toward the job indicate job dissatisfaction”
Armstrong, (2006). Job satisfaction is the key ingredient that leads to
recognition, income, promotion, and the achievement of other goals
that lead to a feeling of fulfillment ( Kaliski, 2007).
Job satisfaction is the collection of feeling and beliefs that people have
about their current job. People’s levels of degrees of job satisfaction
can range from extreme satisfaction to extreme dissatisfaction. In
addition to having attitudes about their jobs as a whole. People also can
have attitudes about various aspects of their jobs such as the kind of
work they do, their co-workers, supervisors or subordinates and their
pay (George et al., 2008 ). Job satisfaction has been linked to many
variables, including performance, absenteeism and turnover. Job
satisfaction is significant because a person's attitude and beliefs may
affect his or her behavior. Attitudes and beliefs may cause a person to
work harder or work less. Job satisfaction also impacts a person's
general well -being for the simple reason that people spend a good part
of the day at work. Consequently, a person's dissatisfaction with work
could lead to dissatisfaction in other areas of life. Dissatisfied
employees will lead to high turnover. (Medina, 2012).
Turnover Intention
Turnover intention is a serious issue, especially today in which
employee leaves the organization or organization fired them.
Employees‟ intention to leave may be defined as an individual’s
intention to leave his/ her organization within a defined period of time.
The intention to leave may have been caused by the individuals”
negative opinions and attitudes toward their job and work place (Shwu-
Ru & Ching-Yu, 2010). Turnover intention is defined as a purpose of
intended departure of an individual from an organization (Cohen &
Golan, 2007). The intention to leave the organization is the last part in a
classification of withdrawal awareness, and an arbitrator between
assessments that are associated with the decision to leave and the actual
-185- HRM Perspectives – December, 2017
turnover in process models of turnover. Job dissatisfaction is a strong
predictor of turnover intention.
There are a number of factors that affect an employee’s intention to
leave. Intentions to leave are positively related to actual leaving. ( Noor
& Maad, 2008 ). An individual’s intention to leave their organization
has been included in numerous attitudinal models. ( Villanueva &
Djurkovic, 2009). Gaertner (2000) suggests the employees are having
high potential to leave if the job requirements are conflicting, unclear
or if opportunities for growth, skill development, and promotions are
lacking. Past research had explained that intention to leave is one of the
biggest predictors and an immediate sign of employees’ turnover
(Griffeth et al.,2000; Rizwan et al., 2013). Comber et al., (2006)
defined turnover intention (or intent to leave/stay) is consequently
considered as an outcome of affective variables (such as job
satisfaction) rather than actual turnover, which may be mediated by
other variables such as age and tenure. Turnover intention is a
tendency, for example, if there is turnover intention tendency in an
organization, therefore the company must find out the problems.
Turnover intentions or intentions to leave a job are seen to be the best
predictors of actual turnover (Griffeth et al., 2000).
Problem Statement
Dheerasinghe (2009) cited the lack of skilled labor and high labor
turnover are some of the main challenges facing the Sri Lankan apparel
industry. There are various causes which impact on turnover intention
of an organization. Likewise, in this research the following causes,
impacted on turnover intention of selected companies. Here, due to
poor working conditions, high job stress, pay problems, problems
regarding supervisor support and due to less career opportunities there
is a high turnover intention of this selected company. The turnover is
costly problem and argued that the cost related to the labor turnover can
be classified as replacement cost, training cost, hidden cost etc. So,
heavy cost is ultimately causes to reduce the profitability. Most of the
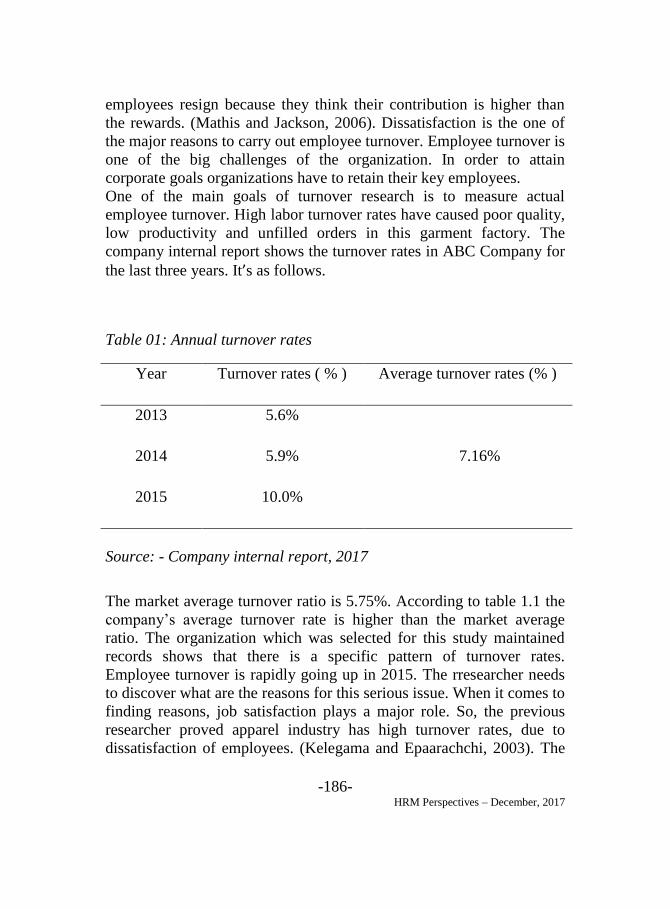
-186- HRM Perspectives – December, 2017
employees resign because they think their contribution is higher than
the rewards. (Mathis and Jackson, 2006). Dissatisfaction is the one of
the major reasons to carry out employee turnover. Employee turnover is
one of the big challenges of the organization. In order to attain
corporate goals organizations have to retain their key employees.
One of the main goals of turnover research is to measure actual
employee turnover. High labor turnover rates have caused poor quality,
low productivity and unfilled orders in this garment factory. The
company internal report shows the turnover rates in ABC Company for
the last three years. It’s as follows.
Table 01: Annual turnover rates
Source: - Company internal report, 2017
The market average turnover ratio is 5.75%. According to table 1.1 the
company’s average turnover rate is higher than the market average
ratio. The organization which was selected for this study maintained
records shows that there is a specific pattern of turnover rates.
Employee turnover is rapidly going up in 2015. The rresearcher needs
to discover what are the reasons for this serious issue. When it comes to
finding reasons, job satisfaction plays a major role. So, the previous
researcher proved apparel industry has high turnover rates, due to
dissatisfaction of employees. (Kelegama and Epaarachchi, 2003). The
Year Turnover rates ( % ) Average turnover rates (% )
2013 5.6%
7.16% 2014 5.9%
2015 10.0%

-187- HRM Perspectives – December, 2017
most common reason why employees leave this organization is that
they see better opportunities elsewhere. Man has a growing desire to
own more things and better pay can give them this. Apart from that,
they are compelled to look for better pay because of financial needs.
Another reason could be that the employees are not happy with the
organization. There are cases when employees leave the organization,
even if they offer competitive salaries. This is because of the
organization itself. The employee does not approve the management
style and they are unhappy with the culture of the organization. These
factors can cause employees say goodbye to the organization. The
condition of the organization could also be a factor. If it is unstable, the
employees will surely look for a more stable organization. They would
not to stay long in an organization that could close any time. The youth
want to get the social reputation while they are doing jobs in a high-
tech or high educated environment. But unfortunately in this garment
factory environment, does not allow to achieve their goals. Factory
owners think only about the "targets". Hence, they are shifting to
another job where they can entertain while doing jobs. Due to these
entire reasons turnover intentions may be occurring in this garment.
The main research issue of this study is “What is the impact of job
satisfaction on turnover intention of non-executive employees in
ABC Company?’’.
Specific Research Issues
1. What is the impact of working conditions on turnover intention of
operational level employees in ABC Company?
2. What is the impact of job stress on turnover intention of
operational level employees in ABC Company?
3. What is the impact of pay on turnover intention of operational level
employees in ABC Company?
4. What is the impact of supervisor support on turnover intention of
operational level employees in ABC Company?

-188- HRM Perspectives – December, 2017
5. What is the impact of career opportunities on turnover intention of
operational level employees in ABC Company?
Objectives of the Study
1. To examine the impact of job satisfaction on turnover intention.
2. To examine the dimensional perspective (working conditions, job
stress,, pay, supervisor support and career opportunities) of job
satisfaction on turnover intention.
Conceptual Framework of the Study
Independent Variables
Job Satisfaction
Dependent Variable
The independent variables of this study is Job satisfaction. The job
satisfaction is measured using five dimensions namely: Working
Working Cconditions
Job Stress
Pay
Supervisor Support
Career Oopportunities
Employee
Turnover
Intention

-189- HRM Perspectives – December, 2017
Conditions, Job Stress, Pay, Supervisor Support and career
opportunities. The dependent variable is Employee Turnover Intention.
Development of Hypotheses
It’s important to understand the satisfaction and its relationship with
turnover. Satisfaction is different between people based on their
interests. Some individuals like repetitive jobs, rotating shifts, and no
overtime. Conversely, others like involving in decision making, flexible
work hours, and high-incentive earnings. ( Al-qahtani ,2009). The
relationship between job satisfaction (JS) and employee turnover is one
of the pathways to better understanding employee turnover--
organization linkages. In fact, Wright and Bonett (2007) stated that the
negative relationship between job satisfaction and turnover is moderate,
with substantial variation across studies. Job satisfaction was found to
have a direct negative relationship with turnover intention. (Amah,
2009). Randhawa (2007) also found job satisfaction to be negatively
related to the turnover intention.
Based on the above literature, it is hypothesized that:
H1 There is a negative relationship between job satisfaction and
turnover intention of operational level employees in ABC company.
Relationship between working conditions and turnover intention
Different research on various working samples have shown that
perceived work conditions may affect turnover intentions. (Houkes et
al., 2001; Huang et al., 2007). Workers in hazardous workplace
conditions are indeed more likely to leave their current employers
voluntarily and in case the employer does not take the necessary
measures in order to improve the work conditions, workers will not
give up their withdrawal intentions (Cottini et al., 2011). Bad working

-190- HRM Perspectives – December, 2017
conditions are strongly related to lower job satisfaction. Similarly the
negative relationship between working conditions and voluntary
turnover has received attention from many researchers.
Based on the above literature, it is hypothesized that:
H1a: There is a negative impact of working conditions on turnover
intention of operational level employees in ABC company.
Relationship between job stress and turnover intention
Job stress influences employees’ job satisfaction which in turn leads to
low performance and the intention to leave the job (Applebaum,
Fowler, Fiedler, Osinubi, & Robson, 2010). There are many researchers
who found that the greater the amount of stress, the higher will be the
turnover intention of employees (Chen et al., 2010; Applebaum et al.,
2010). A positive relationship was also found between work-life
conflict, stress, and turnover intentions ( Noor and Maad , 2008).
Based on the above literature, it is hypothesized that:
H1b: There is a positive impact of job stress on turnover intention of
operational level employees in ABC company.
Relationship between pay and turnover intention
There is a negative impact of pay on turnover intention. Pay
satisfaction had both direct and indirect effects on turnover intent. The
indirect effect of pay satisfaction occurred through job satisfaction and
organizational commitment. Among the rewards given by organizations
in return for employee contribution for working toward the
achievement of organizational goals, pay is thought to be a critical
factor (Heneman and Judge 2000; Milkovitchand & Newman, 2004).

-191- HRM Perspectives – December, 2017
Joseph,Ng, Koh, and Ang (2007) suggested a negative association
between the pay and the turnover intentions. There is a significant
negative association between the compensation and the turnover
intentions (.Zahra, Irum, Mir, & Chishti, 2013).
Based on the above literature, it is hypothesized that:
H1c: There is a negative impact of pay on turnover intention of
operational level employees in ABC company.
Relationship between supervisor support and turnover intention
The employees turnover intention is influenced through support from
the supervisor which also affecting the employees perception and
attitudes relates to the organization itself. (Maertz et al., 2007). By
increasing the Perceived Supervisor Support and level of commitment,
the organization can reduce the turnover intentions of their employees
(Newman, Thanacoody & Hui, 2012). Perceived supervisor support is
crucial to retain employees in the organization (Gentry et al., 2006).
Zahra, Irum, Mir, & Chishti (2013) found supervisor’s support to be
negatively related to the turnover intentions.
Based on the above literature, it is hypothesized that:
H1d: There is a negative impact of supervisor support on turnover
intention of operational level employees in ABC company.
Relationship between career opportunities and turnover intention
The employees are having high potential to leave if the job
requirements are conflicting, unclear or if opportunities for growth,
skill development, and promotions are lacking. (Gaertner, 2000 ). So,
There is a negative impact of career opportunity on turnover intention.

-192- HRM Perspectives – December, 2017
Historically, management theory has emphasized the prominence of
promotional opportunities and the potential for growth for enhancing
employee performance (Kim, 2012). Perceived career opportunities
outside the organization and lack of career advancement opportunities
inside organization increase the employee’s intentions to leave the
organization (Stahl, Chua, Caligiuri, Cerdin, and Taniguchi, 2009).
Based on the above literature, it is hypothesized that:
H1e: There is a negative impact of career opportunities on turnover
intention of operational level employees in ABC company.
Methodology
Sampling Method
According to Welman and Kruger (2004) population is defined as a
study object, which may include individuals, groups, organizations,
events or the conditions to which they are uncovered. The target
population consists of all non-executive employees of the ABC
Garment. The total number of non-executive employees at the ABC
Company is 268. Selecting a sampling technique involves several
decisions of a broader nature (Malhotra & Dash, 2011). In this study a
sample of 130 employees has been obtained from non-executive
employees who are working at ABC Company. Convenience sampling
is normally used for collecting a large number of completed surveys.
(Lym et al., 2010). Due to these benefits of convenience sampling
method such as simplicity of sampling and the ease of research, It’s
inexpensive, compared to other techniques, Data collection can be
facilitated in short duration of time and as well as participants are
readily available, The present study has been utilizing the convenience
sampling technique for selecting the sample of employees. A close-
ended questionnaire has been used in this research for gathering
primary data. In the data analysis descriptive statistics, correlation

-193- HRM Perspectives – December, 2017
coefficient and regression techniques were used. Data analyzed, using
the SPSS Version 21.0 statistical software package.
Measurement
The independent variables of Job Satisfaction, Working Conditions,
Job Stress, Pay, Supervisor Support and Career Opportunity have been
tested by 25 questions on a Five Point Likert Scale. The survey
questionnaire has three parts. The first part is on demographic factors
with questions about gender, age, and marital status, level of education
and work experience of the current job with questions. Whereas the
second part of the questionnaire consists of questions that can measure
the intention of respondents to leave the organization. It has 06 items of
questions.Third part measures the level of employees’ job satisfaction
that influences the turnover intention. This section consists of 25 items
and each of dimension consists of 5 items. Data were collected through
the above mentioned 31 - items survey questionnaire and got responses
from 137 respondents. However 07 questionnaires received were not in
usable state.
Data Analysis and Findings
Profile of the Sample
It clearly showed that the female representation in the sample was
higher than the male representation. Female employees were 83.85%
and their counterparts the males was only 16.15% of the total
respondents. Therefore, this reveals that the majority of the employees
who are working in ABC Company are Female. The majority of the
respondents are in the age group 20- 29 to 48% and those between 30-
39 are 22%. 40 - 49 it was 14% and those under 20 are 15%. There are
58.46% Single non-executive employees and 41.54% Married non-
executive employees who working in the ABC Company. This reveals
the majority of respondents are Single. 72.31% of respondents have
been studied up to G.C.E O/L. 20.77% of the total respondents have
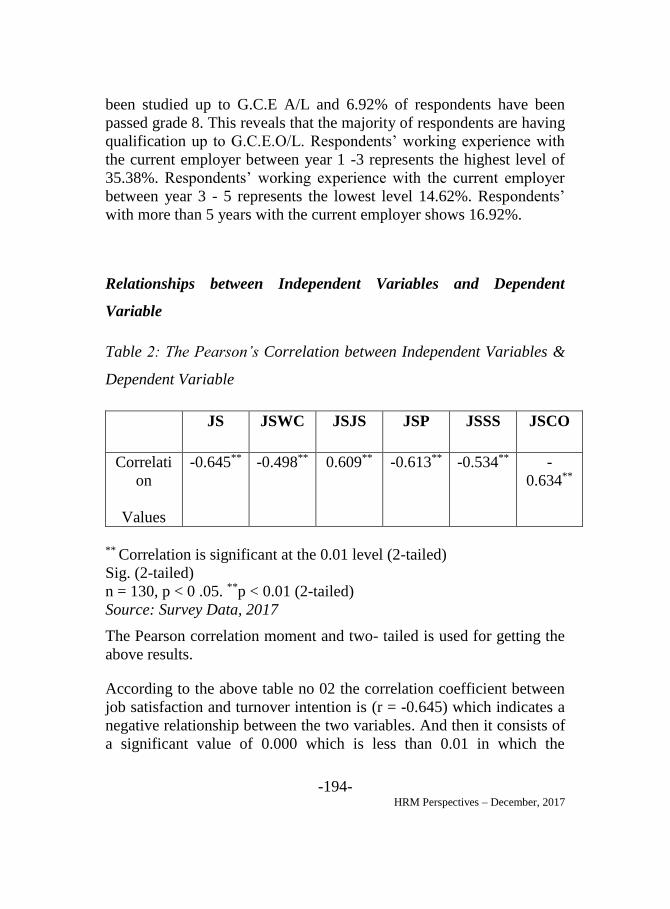
-194- HRM Perspectives – December, 2017
been studied up to G.C.E A/L and 6.92% of respondents have been
passed grade 8. This reveals that the majority of respondents are having
qualification up to G.C.E.O/L. Respondents’ working experience with
the current employer between year 1 -3 represents the highest level of
35.38%. Respondents’ working experience with the current employer
between year 3 - 5 represents the lowest level 14.62%. Respondents’
with more than 5 years with the current employer shows 16.92%.
Relationships between Independent Variables and Dependent
Variable
Table 2: The Pearson’s Correlation between Independent Variables &
Dependent Variable
JS JSWC JSJS JSP JSSS JSCO
Correlati
on
Values
-0.645** -0.498** 0.609** -0.613** -0.534** -
0.634**
** Correlation is significant at the 0.01 level (2-tailed)
Sig. (2-tailed)
n = 130, p < 0 .05. **p < 0.01 (2-tailed)
Source: Survey Data, 2017
The Pearson correlation moment and two- tailed is used for getting the
above results.
According to the above table no 02 the correlation coefficient between
job satisfaction and turnover intention is (r = -0.645) which indicates a
negative relationship between the two variables. And then it consists of
a significant value of 0.000 which is less than 0.01 in which the

-195- HRM Perspectives – December, 2017
correlation is significant at. (r = -0.645, p<0.001). Therefore, the
Pearson correlation using a 2-tailed test, shows there is a negative
significant relationship between job satisfaction and turnover intention.
Moreover, the R2 of job satisfaction and turnover intention is 0.416,
which indicates that 42% of the variation in turnover intention of non-
executive employees in the ABC Company is explained by the job
satisfaction. Value of Beta is -0.645 at a significance level of 0.000
showed strong negative impact of job satisfaction on turnover intention
on the basis of Beta value and its significance. Hence the H1 is
accepted.
Based on the above data the correlation coefficient between
relationship with working conditions and turnover intention is ( r = -
0.498) which indicates a negative relationship between the two
variables. And then it consists of a significant value of 0.000 which is
less than 0.01 in which the correlation is significant at. (r = -0.498,
p<0.001). Therefore, the Pearson correlation using a 2-tailed test,
shows there is a negative significant relationship between working
conditions and turnover intention. Moreover the R Square of
relationship with working conditions is 0.248, which indicates that 24%
of the variation in turnover intention of non-executive employees in the
ABC Company is explained by the relationship with working
conditions. Value of Beta is -0.498 at a significance level of 0.000
showed strong negative impact of relationship with working conditions
on turnover intention on the basis of Beta value and its significance.
Hence the H1a is accepted.
As it’s shown in the table the correlation coefficient between job stress
and turnover intention is (r = 0.609) which indicates a positive
relationship between the two variables. And then it consists of a
significant value of 0.000 which is less than 0.01 in which the
correlation is significant at. (r = 0.609, p<0.001 ). Therefore the
Pearson correlation using a 2-tailed test, shows there is a positive
significant relationship between job stress and turnover intention.
Moreover the R Square of job stress is 0.370, which indicates that 37 %
of the variation in turnover intention of non-executive employees in the

-196- HRM Perspectives – December, 2017
ABC Company is explained by the job stress. Value of Beta is 0.609 at
a significance level of 0.000 showed strong positive impact of job
stress on turnover intention on the basis of Beta value and its
significance. Hence the H1b is accepted.
This means that in Garment Industry, having high job stress among
workers is focused towards the higher turnover intention.
According to the above table the correlation coefficient between pay
and turnover intention is (r = -0.613) which indicates a negative
relationship between the two variables. And then it consists of a
significant value of 0.000 which is less than 0.01 in which the
correlation is significant at. (r = -0.613, p<0.001 ). Therefore the
Pearson correlation using a 2-tailed test, shows there is a negative
significant relationship between pay and turnover intention. Moreover
the R Square of pay is 0.375, which indicates that 37% of the variation
in turnover intention of non-executive employees in the ABC Company
is explained by the pay. Value of Beta is -0.613 at a significance level
of 0.000 showed strong negative impact of pay on turnover intention on
the basis of Beta value and its significance. Hence the H1c is accepted.
Based on the data of the table the correlation coefficient between
supervisor support and turnover intention is (r = -0.534) which
indicates a negative relationship between the two variables. And then it
consists of a significant value of 0.000 which is less than 0.01 in which
the correlation is significant at. (r = -0.534, p<0.001 ). Therefore the
Pearson correlation using a 2-tailed test, shows there is a negative
significant relationship between supervisor support and turnover
intention. Moreover the R Square of supervisor support is 0.285, which
indicates that 28 % of the variation in turnover intention of non-
executive employees in the ABC Company is explained by the
supervisor support. Value of Beta is -0.534 at a significance level of
0.000 showed strong negative impact of supervisor support on turnover
intentions on the basis of Beta value and its significance. Hence the H1d
is accepted.

-197- HRM Perspectives – December, 2017
Based on the data of the table the correlation coefficient between career
opportunity and turnover intention is (r = -0.634) which indicates a
negative relationship between the two variables. And then it consists of
a significant value of 0.000 which is less than 0.01 in which the
correlation is significant at. (r = -0.634, p<0.001 ). Therefore the
Pearson correlation using a 2-tailed test, shows there is a negative
significant relationship between career opportunity and turnover
intention. Moreover the R Square of relationship with career
opportunity is 0.402, which indicates that 40% of the variation in
turnover intention of non-executive employees in the ABC Company is
explained by the relationship with career opportunity. Value of Beta is -
0.634 at a significance level of 0.000 showed strong negative impact of
relationship with career opportunity on turnover intention on the basis
of Beta value and its significance. Hence the H1e is accepted.
Conclusions and Recommendations
Conclusions
Based on the objectives of this study and literature review, this study
developed the model which includes five variables of job satisfaction
and turnover intention. In addition, this study developed the
questionnaire from related literature researches and adjusted it to tally
with the actual situation. Thus, the survey method was distribution
questionnaire which includes 130 respondents and 36 qualified
questionnaires were analyzed.
This study wants to identify determinants of the turnover intention
among non-executive employees in ABC Company. Based on the
analysis following conclusions are made. In the case of reasons for
employee turnover intention, the above analysis proved that intention to
leave from the organization is significantly influenced by employee’s
dissatisfaction. It is highly significant. According to this research,
working conditions, job stress, pay, supervisor support and career
opportunity are the significant predictors of the turnover intention.

-198- HRM Perspectives – December, 2017
Turnover intention of ABC Company, a large number of employees
would quit if they have opportunities for better pay in similar
organizations while they are also not fulfilled about their life
expectations with their present employers. Based on the results, there is
a negative correlation between job satisfaction and turnover intention of
non-executive employees in ABC Company. Turnover intention of
ABC Company is high, but there is still need for improvement.
Based on the results relationship with working conditions negatively
related to turnover intention. There are employees who are not happy
with the company’s health and safety procedure and about their leaving
procedure. But they are satisfied up to some extent regarding their
working hours, having a friendly environment and as well as regarding
their job security. Based on the data of this research proved that, there
is a positive impact from job stress on turnover intention. It emphasized
that the most of the non-executive employees have not agreed with the
statement of having the opportunity to complete my task without any
pressure within the given working hours. Simply it shows that they
have work pressure within their workplace. This work pressure
mentally influences to an employee and finally it focuses towards job
stress. When there is a high stress, then it is positively influenced to the
turnover intention. Not only, but also the most non executive
employees do not agree with , work life balance.
Based on the results, we can say that majority of employees are happy
with their overtime hours and as well as they are satisfied about the
procedures that the company has taken to appreciate employees
whenever their work must be appreciated within the job. But about
their basic salary and other financial rewards such as bonuses and
incentives they show a dissatisfaction. They simply are not happy about
their salary, bonuses and incentives. Therefore, their intention to leave
this garment factory is high. Based on the results the supervisor support
negatively related to turnover intention. It described that they are not
satisfied about the supervisor’s support, especially at the problem
solving and also at their praises. Likewise, the career opportunity also
negatively related to turnover intention. Under the career opportunity

-199- HRM Perspectives – December, 2017
the majority of non-executive employees disagrees with the statements
of having an opportunity for promotions, having an opportunity to
improve skills and talents through workshop and having an opportunity
to apply new ideas and new creations within the workplace. On the
other side, they are satisfied up to some extent about the training given
by the company and as well as they are satisfied about the opportunity
that the company has given them to share their knowledge with other
co-workers.
Various studies indicate that job satisfaction or employee satisfaction is
vital to an organization’s success. A satisfied employee brings positive
affect and desirable work values leading to enhanced efficiency and
productivity. Since the analysis revealed that job satisfaction and its
factors that leads to turnover intention, ABC Company needs to face
this challenge and finding ways to increase job satisfaction in order to
ensure that their businesses stay competitive. A well trained workforce
and satisfied employees is a true competitive advantage as they
contribute towards achieving the goals of the organization.
Recommendations
The study has shown that, job satisfaction has a negative effect on
turnover intention of ABC Company. The findings of this study have
led to the following recommendations. Health and Safety is one of the
most important and essential aspects that management should focus
their attention. Here, it’s compulsory to provide standard high quality
safety equipment to the employees by the company. It’s a must.
Providing safety equipment only is not enough. Management’s
responsibility is to see whether they are wearing those equipments
properly in the working place and also management should ensure that
employees are following particular safety rules and procedures
properly. Not only that, but also the management should focus their
attention regarding the health of employees. Here, the management
should implement specific actions and procedures which company
should take regarding the health of employees. ( Ex:- Sanitary facilities,

-200- HRM Perspectives – December, 2017
work space, ventilation etc.). By maintaining proper Health and Safety
within the workplace, then management can create a more efficient
workforce. The management should grant them leaves properly.
According to the rules and regulations of factory ordinance act the
management should implement their leaving procedure within the
company. Job analysis must be done, especially for all the operational
level employees properly, targets given to them must be calculated
based on the scientific method ( Eg:- Using Work measurement and
Time study). This avoids or minimizes, work or target anomalies
incurred among the various employees.
In order to avoid or reduce this job stress we can apply various types of
tactical methods. In order to get rid of their monotonous life, the
management should organize the extra-curricular activities for their
employees. Employees don’t have a good understanding about how to
balance these work life and personal life. For this, the management
could provide them a proper counselling regarding this.
Compensation/pay has come as one of the important factors under the
research findings. The organization must consider not only the basic
salary, but also should introduce various financial incentive systems
such as “Attendance incentive”, “Production Incentive (Eg:-Both
individual and group bases)”, Bonus, Overtime payments ......etc. A
personal note from manager does wonders and lets them know that
their hard work is appreciated. Job satisfaction of non-executive
employees in ABC garment could be improved upon by introducing on
the job benefits (housing loan, medical services, opportunity to learn
new skills, etc)
When a new recruit join with the organization, supervisory support is
compulsory. If not, employees get frustrated and start leaving. At least
until the new employee gets used to the new environment (ie:- 3 to 6
month period), supervisors must have a very close relationship with the
new comers. Even after getting experience, employees expect their
supervisor’s support to get their problem solved (ie:-Both official and
personal). Supervisors and employees should have effective
communication. It is also advisable that ABC Company must

-201- HRM Perspectives – December, 2017
implement open-door policy which persuades employees to speak
frankly with their managers without any fear in order to increase job
satisfaction among employees. Open communication should be created
between employees and management.
One of the most effective ways to increase employee retention is by
promoting them. ABC Company can offer their employees with a clear
advancement path that will make them more likely to stay with the
organization. Internal promotion systems must be introduced. Policies
and procedures must implement to give promotions and also must be
clearly understood by the employees and must be transparent. Because
of the internal promotion system, employees those who qualify &
perform well will stay with the company for a longer period. In order to
enhance employees’ skills and talents ABC Company could conduct
several workshops time to time. As well as the management should
give them opportunities to apply their new ideas and new creations
within their job. It should be encouraged to convey their opinions and
ideas. They should also be encouraged to take part in the decision
making.
Suggestions for Future Research Study
For future research can develop the model based on this study. In order
to make the framework more comprehensive and can be used in most
other areas, job satisfaction can be measured by more dimensions. For
future research can put more dimensions such as organizational
satisfaction, put new variables in models such as employees’ values. It
is necessary to have further researches to confirm the findings of this
research with the larger sample size and the more diversity of
respondents. In the future research, the further researchers are also
recommended to apply human resource management to explore other
factors, which are correlated with turnover intentions.
The future research should provide an appropriate quantity of questions
to ensure that they can pay attention to each item in the questionnaire.

-202- HRM Perspectives – December, 2017
As much as possible, ask each respondent is serious to ensure that the
data collected will be high quality. The future research should conduct
a longitudinal, multi-year study to track job satisfaction in relation to
contract renewal.
Limitations of the Study
There are certain limitations or constraints to the generalizability of the
study, for example, Job Satisfaction has lot many determinants, but
only five of them are included to keep the study manageable. In this
research data will be gathered within a limited time period. The
employee’s attitude and opinion may change in future. So, the future
relevance for the study cannot be assured. Some respondents may feel
hesitated to express their opinion. Hence attaining an accurate result is
not possible. As the top management is very busy and time conscious,
it is not possible to meet them personally and to have a discussion with
them. As ABC garment is a large factory and many employees are very
busy at the time, it is not officially possible to cover all the employees.
Employees’ intentions to leave the workplace be sensitive, personal and
very private, and it is likely that not all respondents felt comfortable to
answer these questions candidly.
-203- HRM Perspectives – December, 2017
References
Alkandari, Q., & Hammad, A.A. (2009). Employee retention in private
sector: an exploratory study in the state of Kuwait. Open university,
Malaysia.
Al-Qahtani, A.J. (2009). Turnover: Causes and Means to Retain, Case
study for Sabic Affiliate (SADAF). Open University, Malaysia.
Amah, Okechukwu E.( 2009 ). "Job satisfaction and turnover intention
relationship:the moderating effect of job role centrality and life
satisfaction." Research and Practice in Human Resource Management,
vol. 17, no. 1, p. 24.
Armstrong, M. (2006). A Handbook of Human resource Management
Practice (10thed.). London: Kogan Page Publishing, p264 .
Avey, J. B., Luthans, F., & Jensen, S. M. (2009). Psychological capital:
A positive resource for combating employee stress and turnover.
Human Resource Management, 48, 677 693.
Barbara, M. (2004). Nursing Home Administrators‟ Level of Job
satisfaction, Journal of Healthcare Management; Sep/Oct; 49, 5; p.
344.
Bhatti, MA., Mohamed Battour, M., Pandiyan Kaliani Sundram, V., &
Aini Othman, A. (2013). Transfer of training: does it truly happen? An
examination of support, instrumentality, retention and learner readiness
on the transfer motivation and transfer of training.European Journal of
Training and Development, 37(3), 273-297.
Bonnet, D. G. (2007). Job Satisfaction and Psychological Well-Being
as Non additive Predictors of Workplace Turnover. Journal of
Management, 33, 141-160.
http://dx.doi.org/10.1177/0149206306297582.

-204- HRM Perspectives – December, 2017
Central bank of Sri Lanka. (2002). Economic, price and financial
system stability, outlook and policies (Annual report 2002) Sri Lanka:
Central Bank of Sri Lanka.
Chen, M-F., Lin, C-P., & Lien, G-Y. (2010). Modeling job stress as a
mediating role in predicting turnover intention.
Cohen, A., & Golan, R. (2007). Predicting absenteeism and turnover
intentions by past absenteeism and work attitudes: An empirical
examination of female employees in long term nursing care
facilities. Career Development International. 12(5), 416–432.
Cottini, E., Kato, T., and Westergaard-Nielsen, N. (2011). Adverse
workplace conditions, high-involvement, work practices and labor
turnover: evidence from Danish linked employer-employee data. Lab.
Econ. 18, 872–880. doi: 10.1016/j.labeco.2011.07.003.
Dheerasinghe, R. (2009). Garment Industry in Sri Lanka Challenges,
Prospects and Strategies. Staff studies, 33(1&2). 33-72. Doi:
10.4038/ss.v33i1.1246.
Dunham, J. (2001). Stress in the workplace: Past, present and future.
Whurr, London.
Dyk, J., & Coetzee, M. (2012). Retention factors in relation to
organizational commitment in medical and information technology
services: original research. SA Journal of Human Resource
Management, 10(2), 1-11.
Gaertner, S. (2000). A meta-analysis of antecedents and correlates of
employee turnover: Update, moderator tests, and research implications
for the millennium. Journal of Management, 26(3), 463-488.
George, J.M. and Jones, G.R. (2008). Understanding and Managing
Organizational behavior, Fifth Edition, Pearson/Prentice Hall, New
Yersey, p78.

-205- HRM Perspectives – December, 2017
Griffeth, R.W., Hom, P.W. and Gaertner, S. (2000), “A meta-analysis
of antecedents and correlates of employee turnover: update, moderator
tests and research implications for the next millennium”, Journal of
Management, Vol. 26, pp.
Huang T. C., Lawler J., Lei C. Y. (2007). The effects of quality of work
life on commitment and turnover intention. Soc. Behav. Pers.36, 735–
750. 10.2224/sbp.2007.35.6.735 [Cross Ref].
Jamal,M.(2005). Burnout among Canadian and Chinese employees: A
cross-cultural study. European Management Review, 2, 224-230.
Joseph, D., Ng, K. Y., Koh, C., & Ang, S. (2007). Turnover of
information technology professionals: a narrative review, meta-analytic
structural equation modeling, and model development. MIS Quarterly,
31(3), 547-577.
Kabir, M., & Parvin, M. M. (2011). Factors Affecting Employee Job
Satisfaction of Pharmaceutical Sector. Australian [6] Journal of
Business and Management Research ,1 (9), 113–123.
Kaliski, B.S. (2007). Encyclopedia of Business and Finance, Second
edition, Thompson Gale, Detroit, p446.
Kelegama, S. and Epaarachchi, R. (2003), Garment industry in Sri
Lanka, Gopal Joshi (eds.) Garment industry in south Asia: Rags or
riches? Competitiveness, productivity and job quality in post – MFA
environment, New Delhi: South Asia multidisciplinary advisory team
9SAAT), International Labor organization.
Kelegama, S. (2005). Ready-made Garment Industry in Sri Lanka:
Preparing to Face the Global Challenges. Asia-Pacific Trade and
Investment Review, 1(1), 51-67.
Kim, S. (2012). The impact of human resource management on state
government IT employee turnover intentions. Public Personnel
Management, 41(2), 257–279.

-206- HRM Perspectives – December, 2017
Luthans, F., 2001, “Job Satisfaction”, Organisational Behaviour, 9th
ed., pp. 230-235.
Lym, B. Hal Grossman, Lauren Yannotta, Makram Talih, (2010)
"Assessing the assessment: how institutions administered,
interpreted, and used SAILS", Reference Services Review, Vol. 38
Issue: 1, pp.168-186, https://doi.org/10.1108/00907321011020806.
Malhotra, N. K., & Dash, S. (2011). Marketing Research: An Applied
Orientation (Vol. VI). New Delhi, India: Pearson.
Mathis, R. L., & Jackson, J.H. (2006). Human Resource Management
(11thed.).Omaha.
Medina, E. (2012). Job satisfaction and employee turnover intention:
what does organizational culture have to do with it?. Master's theses,
Department of Quantitative Methods in the Social Sciences, Columbia
University, New York.
Mullins, L.J. (2005). Management and Organizational Behavior, (7th
Ed), Pearson Education Limited, Essex, 700.
Newman, A., Thanacoody, R., & Hui, W. (2012). The effects of
perceived organizational support, perceived supervisor support and
intra-organizational network resources on turnover intentions: A study
of Chinese employees in multinational enterprises. Personnel Review,
41(1), 56-72.
Noor, S., & Maad, N. (2008). Examining the Relationship between
work-life conflict, stress and turnover intentions among marketing
executives in Pakistan. International Journal of Business and
Management, 3, 93-102.
Rizwan, M., Shahid, M., Shafiq, H., Tabassum, S., Bari, R. & Umer, J.
(2013) Impact of Psychological Factors on Employee Turnover
Intentions, International Journal of Research in Commerce, Economics
and Management, 3(3), 63-69.
-207- HRM Perspectives – December, 2017
Robbins, S.P. (2003). ). Essentials of organizational behaviour.(7th
edn.). Upper Saddle River, NJ: Pearson Education.
Shwu-Ru, L & Ching-Yu, C 2010, „Organizational climate,
organizational commitment and intention to leave amongst hospital
nurses in Taiwan‟, Journal of Clinical Nursing, Vol. 19, No. 11/12, pp.
1635-1644.
Spector, P. (2008), Industrial and Organizational Psychology:Research
and Practice,5th ed., John Wiley & Sons, New York, NY.
Stahl, G.K., Chua, C.H., Caligiuri, P., Cerdin, J.L.E., & Taniguchi, M.
(2009). Predictors Of turnover intentions in learning-driven and
demand-driven international assignments: The role of repatriation
concerns, satisfaction with company support, and perceived career
advancement opportunities. Human Resource Management, 48(1), 91-
111.
Sun, Y.F., Yan, L.H., Kang, F.X., Zhang, J.X., Yang, S.L., Yu, A.H.,
2002. The psychological reasons and counter measures for nurses
leaving their positions. Chinese Journal of Nursing 36 (2), 92–94 (in
Chinese).
Villanueva, D. & Djurkovic, N. (2009). Occupational Stress and
Intention to Leave Among Employees in Small and Medium
Enterprises. International Journal of Stress Management, 16, 124–137.
Welman, J.C, Kruger S.J. 2004. Research Methodology. Cape Town,
South Africa: Oxford University Press.
Zahra, S., Irum, A., Mir, S., & Chishti, A. (2013). Job Satisfaction and
Faculty Turnover Intentions: A Case of Pakistani Universities.“IOSR
Journal of Business and Management”, 9(2), 83-89.

-208- HRM Perspectives – December, 2017

-209- HRM Perspectives – December, 2017
JOB STRESS AND EMPLOYEE TURNOVER
INTENTION IN D. G. FASHION GARMENT (PVT)
LTD
P. K. H. Randima - PQHRM
Department of Public Administration
Faculty of Management
Uva Wellassa University of Sri Lanka
and
T. S. A. Samsudeen - MBA
Director and Senior Management Consultant
Sensei International, Sri Lanka
ABSTRACT
The apparel industry is one of the main sectors of the Sri Lankan
economy. This industry inherently relates with high rate of labor turnover.
The objective of this study was to see whether there is a significant
relationship between job stress and turnover intention of machine
operators. In addition to that inspect whether what are the significant
stressors which are influence to arise machine operators’ job stress. The
independent variable was the job stress and the dependent variable was
the employee turnover intention.
The population of the study was the machine operators who are working
in the D. G. Fashion Garment (Pvt) Ltd, Dickwella. The sample size was
80 machine operators. A structured questionnaire was used to collect data
from the respondents. Descriptive analysis, Pearson correlation and
-210- HRM Perspectives – December, 2017
regression analysis were used for the analytical purpose to achieve above
objectives.
A significant and strong positive relationship could be identified between
job stress and employee turnover intention throughout the study. There
were three influential significant stressors (Work overload, supervisor’s
support and role ambiguity) and the other stressor (co-workers’ support)
was not significant. Furthermore, work overload was the most influential
stressor for job stress and employee turnover intention.
Keywords: Job Stress, Turnover Intention, Supervisor’s Support, Role
Ambiguity, Work Overload and Co-workers’ Support
Introduction
Apparel industry which is one of the leading segments in Sri Lankan
economy, contributes large amount of foreign currency through exports.
When concerning about the factory industry production index (FIPI), the
highest contributed component was the wearing apparel (Central bank
report, 2015). Human resource is one of the crucial aspects of the garment
industry, as the garment industry is a labour incentive industry. Therefore
it’s very difficult to avoid from the labour related issues like absenteeism
and high labour turnover rate within the highly competitive market.
According to Coleman (1976) employee’s job stress has been the most
frequently investigated variable in many organizations.
Turnover one of the common and burning problems can bring about a loss
of organizational knowledge as experienced and knowledgeable
employees leave the organization for competitors (Nyamubarwa, 2013).
Dheerasinghe (2009) stated that lack of skilled labour and high labour
turnover are some of the main challenges facing the Sri Lankan apparel
industry. Conclusions of past empirical studies observe that the job stress
is a critical reason for employee turnover.

-211- HRM Perspectives – December, 2017
Work related stress creates absenteeism, dissatisfaction, decrease
production, more accidents, turnover and low confidence (Kaur,
Mohindru, & Pankaj, 2013). Stress can yield problem of turnover
intention. Higher the stress, the greater will be the intention to quit the job
(Arshadi & Damiri, 2013). Impact of job stress on turnover intention of
employees is considered very high and is a major threat to existence of
employees at their job (Chathurani & Sangarandenya, 2008).
Within the current competitive environment, organizations try to give
more attention to retain competent workforce within the organizations. As
human resource is the best way to gain the competitive advantages to cope
with the existing rival market, this practice is highly relevant to labour
oriented industries like apparel industry. Work environment became more
and more complex and dynamics. Employees feel high level of stress
when they are given high volume of targets and deadlines, especially
machine operators. As well as today’s garment industry faces high
turnover, high level of work place stress also one of the reason for
employee turnover. It is a problem faced by Apparel industry in Sri Lanka
(Sridarran, 2016).
Problem Statement
D. G. Fashion Garment (Private) Limited has several issues regarding the
human resource like highest rate of the labour turnover. Several issues
may affect to high labour turnover. Such as quality of the work, job
satisfaction, organizational culture and commitment, job stress and work
family conflict etc. Due to D. G. Fashion Garment (Pvt) Ltd has to spend
huge amount on investments to retain existing employees and to recruit
new employees in the company. There is hardly any research done in this
organization in order to find outthe relationship between employees’ stress
and intention to leave. Hence this research will contribute to fill the gap in
the knowledge.This study mainly focuses on the machine operator’s job
stress and their turnover intention in D. G. Fashion Garment (Pvt) Ltd at
Dickwella.

-212- HRM Perspectives – December, 2017
Literature Review
Job Stress
Job stress can be defined as the harmful physical and emotional responses
that occur when the requirements of the job do not match the capabilities,
resources, or needs of the worker (Braaten, 2000). There are various
factors that affect job stress of the employees. Some of the major factors
are health, work environment, job, emotional stability, personal relation,
work load and appreciation and feedback.
Work related stress creates absenteeism, dissatisfaction, decrease
production, more accidents, turnover and low confidence. Results
indicates positive link among stress and intention to quit (Kaur, Mohindru,
& Pankaj, 2013). The effect of stress might be a deviation from the
existing physical and psychological damage of human life. The
occupational stress adversely affects the health and performance of the
employees of an organization. According to Braaten Dan J. (2000), job
stress can be defined as ‘the harmful physical and emotional responses
that occur when the requirements of the job do not match the capabilities,
resources, or needs of the worker’.
Globally stress is common to all people; stress may cause positive and
negative effect on people. Mostly it causes negative effect on people.
Stress is a necessary to people for a certain extent. Stress can affect a
person’s individual and work life. Stress is a one factor which has the
ability to affect another. Today’s fast moving world didn’t allow any
individual free from stress. Stress can change a person psychologically
and physically (Suganya & Rajkumar, 2015).
Stress does not act negatively in all situations. Employees can use the
stress by looking on its optimistic side and by being confidently resistant
(Bono et al., 2013). It can also positively impact on the life of employees
and can help to increase the performance of employees. Optimistic
thinking, reactions and behavioral qualities can boost human potential in
various realms like work, coping with stress and health. By thinking

-213- HRM Perspectives – December, 2017
positively individuals can perceive job stress less threatening (Naseem &
Khalid, 2010).
It is crystal clear that stress is a common phenomenon in the workplace
(Babalola, Gbadegesin, & Patiece, 2013). Workers with stressful job
content may report mental health problems more frequently, including
psychiatric morbidity and psychosocial somatic complaints as well as
physical health problems. Different people have different understanding of
stress. Some people define stress as events or situations that cause them to
feel tension, pressure, or negative emotions such as anxiety and anger.
Others view stress as the response to these situations (Surti & Ambavale,
2013).
Stress is an antagonistic demonstrative practice which is linked with
depression, unhappiness, fury, frustration, panic, dismay and sorrow. We
focus on negative consequence of stress because it considered as a bad
sign for effective performance, it was found (Parvaiz, Batool, Khalid &
Farooqi cited in Motowidlo, Manning, & Packard, 1996). Palmer, Cooper,
& Thomas (2014) stated that role demands, organizational support, control
over work, relationship with co-workers and organizational change can
cause stress in the employees. Therefore, it is important that organizations
have clear understanding of the work stress and the risk it can create.
Supervisor’s Support
Supervisor’s support is linked with stress of subordinates. Leadership
support is a cause of job stress. It is very important for longer retaining the
employees on job and it has said to be in negative relationship with
employee burnout, it was found (Parvaiz, Batool, Khalid & Farooqi cited
in Offermann & Hellmann, 1996). When leaders provide accurate work
environment and provide support to employees they will be able to give
good performance, achieve their goals and face low or no stress (Safaria,
Othman, & Wahab, 2011).

-214- HRM Perspectives – December, 2017
Effective leaders recognize that employees need their support and they
align their behaviour with business objectives by developing emotional
intelligence and recognizing achievements. Leaders provide opportunities
and support to employees to complete their tasks and evaluate his and
employees performance on outcome base. Now leader tries to develop
relation with employees instead of only giving him/her orders (Tummers
& Knies, 2014).
Work Overload
Work overload occurs when the employees is expected to do more than
the time permits. To get the high performance and reduce the stress level
the workload must be moderate it must not be too high or low (Shah,
Jaffari, & Ul-Haq, 2011).
Parvaiz, Batool, Khalid & Farooqi (1986) found that employees feel they
are overloaded with work when many requirements, activities and
responsibilities are expected from them, the given time and abilities are
limited and there are many restrains. Work overload refers the situation
when people have to perform work more than their abilities and skills.
Most researches suppose that the work overload have positive relation
with stress (Lai, Saridakis, & Blackburn, 2013).
Role Ambiguity
Role ambiguity means that there is inadequate information regarding a
role and employees do not have a clear understanding of what to do.
Ambiguous roles can create tension and lower employee’s morale.
Therefore, lack in fulfilment of multiple roles can cause psychological
conflict at the workplace. Role ambiguity is costly both for the employee
and for the organization and it has been reported as being associated with
lower job satisfaction and increased job-related tension (Rahman, & Nas,
2013)

-215- HRM Perspectives – December, 2017
Guimaraes (1997) stated that role ambiguity refers to the difference
between what people expect of us on the job and what we feel we should
do. This causes uncertainty about what our role should be. It can be a
result of misunderstanding what is expected, how to meet the expectations,
or the employee thinking the job should be different.
Co-workers’ Support
Co-worker support has the ability to make a working environment a
pleasure or an unpleasant place to spend the time. Co-workers’ support
refers to co-workers assisting one another in their tasks when needed by
sharing knowledge and expertise as well as providing encouragement and
support (Zhou & George, 2001).
Lindorff (2001) stated that support from work colleagues is appropriate for
work specific problems and can relieve work stress more so than non-
work support. In general, the social support literature has emphasised the
positive effect it has on work stress (McIntosh, 1991). As a consequence
of these feelings of being valued and experiencing less stress, employees
feel more satisfied with their job and are less inclined to have intentions to
quit the organisation. Research shows that a company with higher levels of
co-worker support is likely to be associated with enhanced organisational
performance (Joiner, 2007).
Employee Turnover Intention
Turnover is employee intention to withdraw from the organization. It
threatens organization to accomplish its objectives and achieve its desired
output. It also affects the performance of remaining employees (Ayinde &
Adegoroye, 2012). Price, (1977) stated that turnover is the individual
estimated probability of leaving the organization. Turnover intention is
defined as the “degree of individual movement across the membership
boundary of a social system”. Employee turnover can also bring about a

-216- HRM Perspectives – December, 2017
loss of organizational knowledge and history as experienced and
knowledgeable employees leave the organization for competitors
(Nyamubarwa, 2013).
Employee turnover influences both firms and its workers; firms have to
incur the expenses on recruiting and training of new employees, while
employees may have to learn specific skills relating to new jobs. Incoming
employees on the other hand may be more highly skilled and better
educated. Therefore, employee turnover may increase organizational
performance (Kaur, Mohindru, & Pankaj, 2013). Kelagama and
Epaarachchi (2001) found that 55 per cent of average labour turnover rate
has recorded from Sri Lankan garment industry sector per annum with the
highest rate of 60 per cent being recorded for factories in the western
province.
The work environment has also been identified by many scholars as a key
factor is shaping turnover intentions in organizations and the work
environment refers to both the physical space surrounding the employee
during his day to day duties as well as the psychological space associated
with the work, it was found (Nyamubarwa cited in Mitchell, et al., 2001).
Liyanage & Galhena (cited in Mathis & Jackson 2006) found that turnover
is a costly problem and further, argued that, the cost related to the labour
turn over can be classified as separation cost, replacement cost, training
cost, and hidden cost. Thus, the heavy cost is ultimately causes to decrease
the profitability and the productivity of the firm. Turnover happens when
employees willingly quit their jobs and replaced. If turnover intent is high,
it raises the cost of recruitment, socialization and training expenses.
Salaries and conditions of service, job performance, job stress, career
growth, work environment, job satisfaction, supervisory style, promotional
opportunities, employee commitment and many other factors all play a
significant role in shaping employee turnover; it was found (Nyamubarwa,
cited in Mobley 1982).
Different researchers have followed different measurements to measure
the turnover intention. Among the models, Olusegun (2013) used three

-217- HRM Perspectives – December, 2017
research instruments such as desires to quit, seriously thinking about
quitting, and the intention to quit for measuring the turnover intention.
Relationship between Job Stress and Employee Turnover Intention
Various studies have investigated the relationship between employee job
stress and turnover intention. Kaur, Mohindru & Pankaj (cited in Firth et
al., 2004) found that the intentions to quit were highly influenced by job
dissatisfaction, lack of commitment to the organization, and feeling of
stress. Job stress is positively related with turnover intention and cause of
much negative behaviour. Intent to leave is the best predictor to actually
leave the organization and the results indicates there is strong impact of
job satisfaction, organizational justice and job stress on turnover (Kaur,
Mohindru, & Pankaj, 2013).
Impact of job stress on non-managerial employee turnover intention of the
considered organizations is very high and it has become a burning
problem and enormous threat to the Garment Manufacturing Industry of
Sri Lanka (Chathurani & Sangarandenya, 2008). It is volunteer intention
of person to leave organization within a specified time period. Intent to
leave is the best predictor to actually leave the organization and the results
indicates there is strong impact of job satisfaction, organizational justice
and job stress on turnover (Kaur, Mohindru, & Pankaj, 2013).
Firth et al. (2004) stated that the experience of job related stress; the range
factors that lead to job related stress (stressors) make employees to quit the
organization. An unstable, unsecured work environment that includes job
security, continuity, procedural justice deviate the employees satisfaction
level, insert to stress at work and as a result increase their turnover
intention. Role stressors lead to employees’ turnover. It can be a result of
misunderstanding what is expected, how to meet the expectations, or the
employee thinking the job should be different (Kevin, Joan & Adrian,
2004).

-218- HRM Perspectives – December, 2017
Insufficient information on how to perform the job adequately, unclear
expectations of peers and supervisors, extensive job pressures and lack of
consensus on job functions or duties may cause employees to feel less
involved and less satisfied with their jobs and careers, less committed to
their organizations, undergo stress and eventually display a propensity to
leave the organization. Impact of job stress on turnover intention of
employees is considered very high and is a major threat to existence of
employees at the job (Chathurani & Sangarandenya, 2008).
Apparel Industry of Sri Lanka
After introducing open economy in 1977, the apparel industry developed
rapidly and it is important in some respects in community of Sri Lanka;
the employment generation, the foreign exchange earnings and job
opportunities are foremost. It has also benefited to achieve some
provincial economic balance. According to Samarasinghe, Ariadurai &
Perera (2015) the majority of workers in apparel industry of Sri Lanka are
at the age of 25 to 35 years old unmarried women. Garment factories in
Sri Lanka can be categorized into two; factories in free trade zone and
factories outside the free trade zone. The Central Bank of Sri Lanka
expresses that a further Textile, wearing apparel and leather product which
was the major sub-sector of the export oriented industries. Currently,
apparel organizations are undergoing competition among number of
apparel companies. Thus, there is a need to find the impact of work place
stress on job performance (Sridarran, 2016).
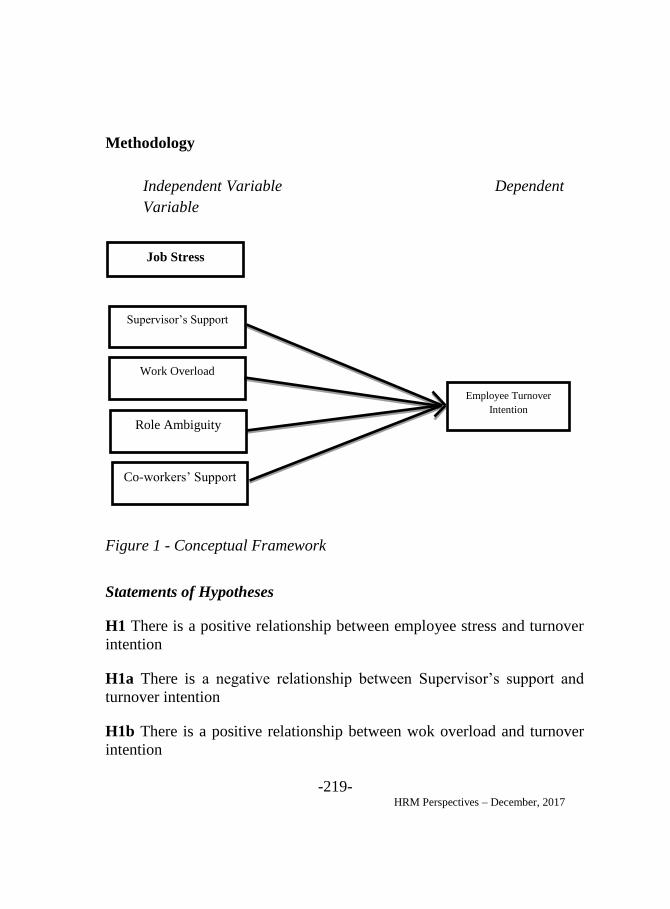
-219- HRM Perspectives – December, 2017
Methodology
Independent Variable Dependent
Variable
Figure 1 - Conceptual Framework
Statements of Hypotheses
H1 There is a positive relationship between employee stress and turnover
intention
H1a There is a negative relationship between Supervisor’s support and
turnover intention
H1b There is a positive relationship between wok overload and turnover
intention
Supervisor’s Support
Work Overload
Role Ambiguity
Employee Turnover
Intention
Co-workers’ Support
Job Stress

-220- HRM Perspectives – December, 2017
H1c There is a positive relationship between role ambiguity and turnover
intention
H1d There is a negative relationship between co-worker support and turn
over intention
Population and Sample
Population of the study is 320 machine operators who are currently
working in D.G. Fashion Garment (Pvt) Ltd and the sample size of the
study is 80 machine operators of the particular company. The sample was
selected by using simple random sampling technique.
Data Collection
The methodology of the study is based on the primary and secondary data.
In order to conduct the research, primary data was used to measure both
job stress and employee turnover intention. Data was collected through
self-administered questionnaire from the selected sample. Secondary data
had been collected in two ways such as internal secondary data, external
secondary data.
Data Analysis
Using Statistical Package for Social Science (SPSS) version 22.0
statistical software data were analysed. Several mathematical statistics
were used to analyse the collected data, such as descriptive statistical
techniques, correlation coefficients analysis and regression analysis and
graphs, tables and other statistical tools are used for analytical and
interpretation purposes.
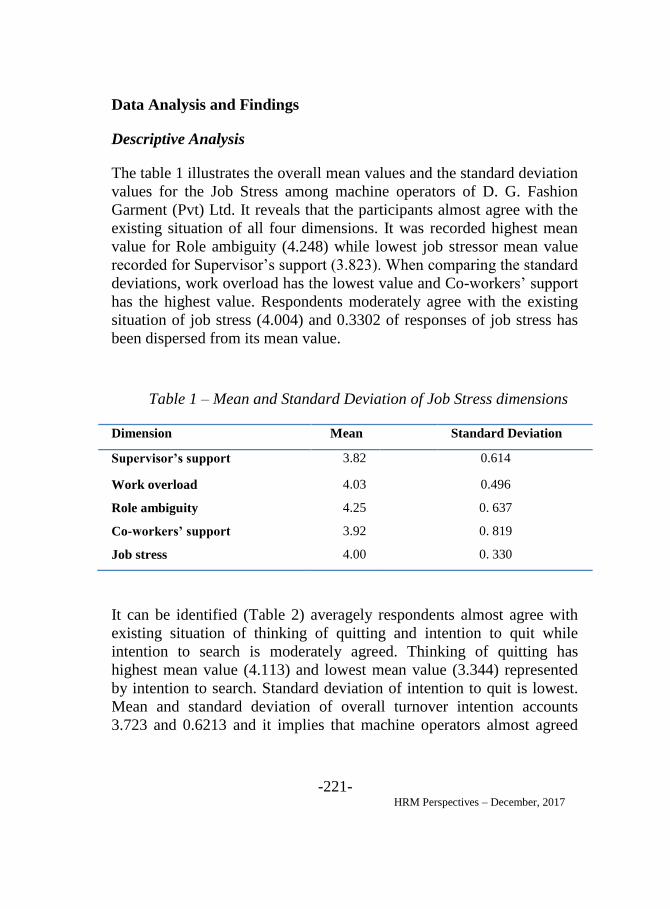
-221- HRM Perspectives – December, 2017
Data Analysis and Findings
Descriptive Analysis
The table 1 illustrates the overall mean values and the standard deviation
values for the Job Stress among machine operators of D. G. Fashion
Garment (Pvt) Ltd. It reveals that the participants almost agree with the
existing situation of all four dimensions. It was recorded highest mean
value for Role ambiguity (4.248) while lowest job stressor mean value
recorded for Supervisor’s support (3.823). When comparing the standard
deviations, work overload has the lowest value and Co-workers’ support
has the highest value. Respondents moderately agree with the existing
situation of job stress (4.004) and 0.3302 of responses of job stress has
been dispersed from its mean value.
Table 1 – Mean and Standard Deviation of Job Stress dimensions
Dimension Mean Standard Deviation
Supervisor’s support 3.82 0.614
Work overload 4.03 0.496
Role ambiguity 4.25 0. 637
Co-workers’ support 3.92 0. 819
Job stress 4.00 0. 330
It can be identified (Table 2) averagely respondents almost agree with
existing situation of thinking of quitting and intention to quit while
intention to search is moderately agreed. Thinking of quitting has
highest mean value (4.113) and lowest mean value (3.344) represented
by intention to search. Standard deviation of intention to quit is lowest.
Mean and standard deviation of overall turnover intention accounts
3.723 and 0.6213 and it implies that machine operators almost agreed

-222- HRM Perspectives – December, 2017
with current situation of turnover intention in D. G. Fashion Garment
(Pvt) Ltd.
Table 2 – Mean and Standard Deviation of Turnover Intention
dimensions
Dimension Mean Standard Deviation
Thinking of quitting 4.11 0.842
Intention to search 3.34 0.884
Intention to quit 3.71 0.834
Turnover intention 3.72 0.621
Testing of Hypotheses
There was a strong positive linear relationship between job stress and
turnover intention (Correlation = 0.605) while p-value of 0.000
emphasize that there was a highly significant association between two
variables. According to the analytical data, there were negative
relationship between co-workers’ support (-0.017) with turnover
intention. There is a positive relationship between, work overload
(0.941) and role ambiguity (0.278) with turnover intention. All
correlations are significant (P>0.01) except co-workers’ support.
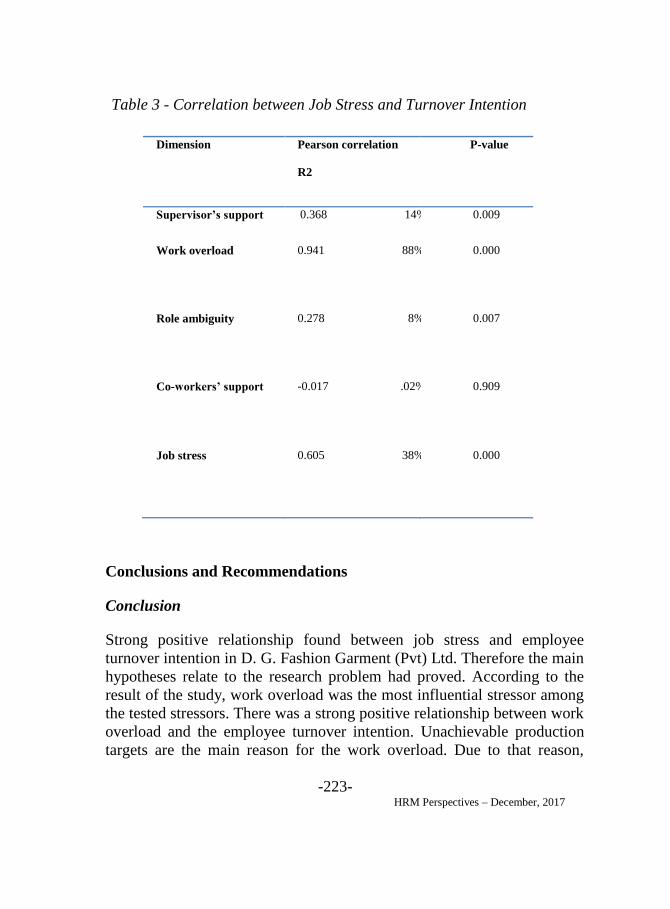
-223- HRM Perspectives – December, 2017
Table 3 - Correlation between Job Stress and Turnover Intention
Dimension Pearson correlation
R2
P-value
Supervisor’s support 0.368 14% 0.009
Work overload 0.941 88% 0.000
Role ambiguity 0.278 8% 0.007
Co-workers’ support -0.017 .02% 0.909
Job stress 0.605 38% 0.000
Conclusions and Recommendations
Conclusion
Strong positive relationship found between job stress and employee
turnover intention in D. G. Fashion Garment (Pvt) Ltd. Therefore the main
hypotheses relate to the research problem had proved. According to the
result of the study, work overload was the most influential stressor among
the tested stressors. There was a strong positive relationship between work
overload and the employee turnover intention. Unachievable production
targets are the main reason for the work overload. Due to that reason,

-224- HRM Perspectives – December, 2017
machine operators have to work under high pressure working
environment. There was a weak positive relationship between supervisor’s
support and turnover intention among machine operators. It could be
found a significant relationship between role ambiguity and turnover
intention of machine operators. A weak negative relationship could be
found the variables between co-workers’ support and employee turnover
intention. However a significant relationship could not be found between
the variables. There is no more influence of co-workers’ support on
employee turnover intention.
As ultimate conclusion there is a significant and strong positive
relationship between machine operator’s job stress and employee turnover
intention in D. G. Fashion Garment (Pvt) Ltd. The most influential
stressors were the work overload and supervisor’s support.
Recommendations
Throughout the study, it has been found that developing the leadership
skills of the production line supervisors is vital factor. Researcher thinks
that the company have to develop the leadership skills of the production
line supervisors. Most of the line supervisors are not good enough in
interpersonal skills. The organization has to design and implement suitable
training programs to develop essential skills of the line supervisors.
Performance appraisal should conduct for each machine operator even
quarterly, since there is no method to measure and identify employee
performance and improving areas. On the other hand, feedback is essential
to develop good relationships between supervisors and machine operators.
It is recommended to conduct effective exit interviews to identify the
reasons for the leaving of machine operators. Through that, it can be
identified existing stressors of the organization effectively.
The study has revealed that there is a significance impact of role
ambiguity on employee turnover intention. Therefore improving the
communication process will help to communicate tasks and

-225- HRM Perspectives – December, 2017
responsibilities of the machine operators clearly. It may reduce the role
ambiguity of the machine operators.
According to the findings of the study, role ambiguity and supervisor’s
support has effect on job stress and turnover intention. By introducing well
designed inauguration procedure, it can give proper understanding on job
duties and responsibilities, other than the organizational culture. It might
be helpful to reduce the role ambiguity and increase supervisor’s support.

-226- HRM Perspectives – December, 2017
References
Arshadi N. & Damiri H. . (2013). The Relationship of Job Stress with
Turnover Intention and Job Performance: Moderating Role of OBSE.
Procedia - Social and Behavioral Sciences, 706 – 710.
Ayinde, A. T., & Adegoroye, A. . (2012). Employees’ Perception of
Career Progression and Turnover Intention among Bank Workers in Life
Central Local Government Area, Osun State. Research Journal in
Organizational Psychology & Educational Studies, 353-360.
Babalola, O. G. (2013). The Place of Job Stress in Labour Turnover of the
Banking Sector in the Nigerian Economy. International Journal of
Business and Management Invention, 93-99.
Bono, J. E., Glomb, T. M., Shenn, W., Kim, E., & Koch, A. J. . (2013).
Building Positive resources: Effects of positive events and positive
reflection on work stress and health. Academy of Management Journal.
Braaten, D. J. (2000). Occupational Stress in Mental Health Counselors.
Menomonie, Wisconsin: The Graduate College, University of Wisconsin-
Stout.
Chathurani R.A.I. & Sangarandenya Y.M.S.W.V. . (2008). Impact of the
Job Stress on Employee Turnover Intention of Non-managerial Employees
in the Garment Manufacturing Industry in. 191-202.
Coleman, C. J. (1976). Abnormal Psychology and Modern Life.
Taraporewalla, Bombay.
Dheerasinghe, R. (2009). Garment Industry in Sri Lanka Challenges,
Prospects and Strategies. 33-7 Firth, L., David J. Mellor, Kathleen A.
Moore and Claude Loquet,. (2007). How can managers reduce employee
intention to quit? J. manage. Psychol.2.

-227- HRM Perspectives – December, 2017
Firth L., Mellor D.J., Moore K.A. & Loquet C. . (2004). How can
managers reduce employee intention to quit. Journal of Managerial
Psychology, 170-187.
Guimaraes, T. (1997). Assessing employee turnover intentions before/after
TQM. International Journal of Quality & Reliability Management, 46-63.
Joiner, T. A. (2007). v. International Journal of Quality & Reliability
Management.
Kaur B., Mohindru & Pankaj. (2013). Antecedents of Turnover Intentions:
A Literature Review. Global Journal of Management and Business
Studies, 1219-1230.
Kevin, M.M., L.C. Joan and J.W. Adrian, . (2004). “Organizational
change and employee turnover” Personnel Rev. 161-166.
Lai, Y., Saridakis, G., & Blackburn, R. . (2013). Job Stress in the United
Kingdom: Are Small and Medium Sized Enterprises and Large Enterprises
Different? Stress Health.
Lindorff, M. (2001). Are They Lonely at the Top? Social Relationships
and Social Support among Australian Managers. Work and Stress. 274-
282.
Liyanage D. M & Galhena B. L. . (n.d.). Determinants of Turnover
Intention of Sewing Machine Operators: Case from leading Apparel
Company. 107-123.
Mathis R.L. & Jackson J.H. . (2006). Human Resource Management
(11thed.). Omaha.
McIntosh, N. J. (1991). Identification and Investigation of Properties of
Social Support. Journal of Organisational Behaviour, 201-217.
Mobley, W. (1982). Some unasnwered questions in turnover and
withdrawal research. The academy of management review, 111-116.

-228- HRM Perspectives – December, 2017
Naseem, Z., & Khalid, R. . (2010). Positive Thinking in Coping with
Stress and Health outcomes: Literature Review. Journal of Research and
Reflections in Education, 42 -61.
Nyamubarwa, W. (2013). “I am considering leaving soon” – Turnover
Intentions of Academic Librarians in Zimbabwe. Journal of Business
Administration and Education, 76-90.
Olusegun, O. S. (2013). Influence of Job Satisfaction on Turnover
Intentions of Library Personnel in Selected Univerisities in South West
Nigeria. Library Philosophy and Practice (e-journal).
Palmer, S., Cooper, C., & Thomas, K. . (2014). A model of work stress to
underpin the Health and Safety Executive advice for tackling work-related
stress and stress risk assessments. Counseling at Work.
Parvaiz L., Batool S., Khalid A. & Farooqi Y. A. . (1996). Impact of
Stressors (Role conflict, Role overload, Leadership Support and
Organizational Politics) on Job Stress and its subsequent impact on
Turnover Intention. International Journal of Business and Management
Invention, 52-63.
Price, J. L. (1977). The study of turnover, vol. 19771. Ame: Iowa State
University Press .
Rahman W. &. Nas Z. (2013). Employee development and turnover
intention. European Journal of Training and development, 564-579.
Safaria, T., Othman, A. b., & Wahab, M. N. . (2011). Role Ambiguity,
Role Conflict, the Role of Job Insecurity as Mediator toward Job Stress
among Malay Academic Staff: A SEM Analysis . Current Research
Journal of Social Sciences, 229-235.
Samarasinghe N.,Ariadurai S. A. and Perera M. E. R. (2015). Facing the
Future Challenges of the Sri Lankan Apparel Industry. Journal of
Engineering and Technology of the Open University of Sri Lanka.

-229- HRM Perspectives – December, 2017
Shah, S. S., Jaffari, A. R., Aziz, J., Ejaz, W., Ul-Haq, I., & Raza, S. N. .
(2011). Workload and Performance of Employees .
INTERDISCIPLINARY JOURNAL OF CONTEMPORARY RESEARCH IN
BUSINESS.
Sridarran, L. (2016). Impact of Work Place Stress on Employees’ Job
Performance. The International Journal Of Business & Management, 63-
66.
Suganya & Rajkumar D. (2015). Eeects of work stress on employee
behavior in leather induestry. International Journal of Contemporary
Research in Social Science.
Tummers, L., & Knies, E. . (2014). The public leadership questionnaire:
The development and validation of five dimensions of public leadership
behaviors.
Zhou, J., & George, J. M. . (2001). When Job Dissatisfaction Leads to
Creativity: Encouraging the Expression of Voice. The Academy of
Management Journal, 682-696.