hpc performance and energy efficiency › download › slides › 2015-06-09-smai_hpc_trends.pdfthe...
TRANSCRIPT

HPC Performance and Energy Efficiency
Overview and Trends
Dr. Sébastien VarretteParallel Computing and Optimization Group (PCOG)
http://hpc.uni.lu
June 9th, 2015SMAI 2015 CongressLes Karellis (Savoie)
Outline
■ Introduction & Context■ HPC Data-Center Trends: Time for DLC ■ HPC [Co-]Processor Trends: Go Mobile■ Middleware Trends: Virtualization, RJMS■ Software Trends: Rethinking Parallel Computing■ Conclusion
2

Introduction and Context

HPC at the Heart of our Daily Life
■ Today... R&D, Academia, Industry, Local Collectivities
■… Tomorrow: digital health, nano/bio techno…
4

Performance Evaluation of HPC Systems
■ Commonly used metrics ✓ ︎FLOPs: raw compute capability✓GUPS: memory performance✓ IOPS: storage performance✓bandwidth & latency: memory operations or network transfer
■ Energy Efficiency✓Power Usage Effectiveness (PUE) in HPC data-centers
‣ Total Facility Energy / Total IT Energy✓Average system power consumption during execution (W) ✓Performance-per-Watt (PpW)
5

Ex (in Academia): The UL HPC Platform
6
http://hpc.uni.lu ■ 2 geographical sites, 3 server rooms■ 4 clusters, ~281 users ✓ 404 nodes, 4316 cores (49.92 TFlops)✓Cumul. shared raw storage: 3,13 PB ✓Around 197 kW
■ > 6,21 M€ HW investment so far■ Mainly Intel-based architecture■ Mainly Open-Source software stack✓Debian, SSH, OpenLDAP, Puppet, FAI...

7
Ex (in Academia): The UL HPC Platform
http://hpc.uni.lu

General HPC Trends
■ Top500: world’s 500 most powerful computers (since 1993) ✓Based on High-Performance LINPACK (HPL) benchmark✓ Last list [Nov. 2014]
‣ #1: Tianhe-2 (China): 3,120,000 cores- 33.863 PFlops… and 17.8 MW
‣ Total combined performance: - 309 PFlops- 215.744 MW over 258 systems
(which provided power information)
■ Green500: Derive PpW metric from Top500 (MFlops/W)✓ #1: L-CSC GPU Cluster (#168): 5.27 GFlops/W
■ Other Benchmarks: HPC{C,G}, Graph500…
8

Computing Needs Evolution
9
1 ZFlops
100 EFlops
10 EFlops
1 EFlops
100 TFlops
10 TFlops
1 TFlops
100 PFlops
10 PFlops
1 PFlops
100 GFlops
10 GFlops
1 GFlops
Manufacturing
Computational ChemistryMolecular Dynamics
Genomics
Human Brain Project
Multi-ScaleWeather prediction
1993 1999 2005 2011 2017 2023 2029

Computing Power Needs Evolution
10
1 ZFlops
100 EFlops
10 EFlops
1 EFlops
100 TFlops
10 TFlops
1 TFlops
100 PFlops
10 PFlops
1 PFlops
100 GFlops
10 GFlops
1 GFlops
Manufacturing
Computational ChemistryMolecular Dynamics
Genomics
Human Brain Project
Multi-ScaleWeather prediction
1993 1999 2005 2011 2017 2023 2029
100 kW
1 MW
10 MW
1 GW
100 MW

Computing Less Power Needs Evolution
11
1 ZFlops
100 EFlops
10 EFlops
1 EFlops
100 TFlops
10 TFlops
1 TFlops
100 PFlops
10 PFlops
1 PFlops
100 GFlops
10 GFlops
1 GFlops
Manufacturing
Computational ChemistryMolecular Dynamics
Genomics
Human Brain Project
Multi-ScaleWeather prediction
1993 1999 2005 2011 2017 2023 2029
100 kW
1 MW
10 MW
< 20 MW
10 MW

The Budgetary Wall
12
1 ZFlops
100 EFlops
10 EFlops
1 EFlops
100 TFlops
10 TFlops
1 TFlops
100 PFlops
10 PFlops
1 PFlops
100 GFlops
10 GFlops
1 GFlops
Manufacturing
Computational ChemistryMolecular Dynamics
Genomics
Human Brain Project
Multi-ScaleWeather prediction
1993 1999 2005 2011 2017 2023 2029
100 kW
1 MW
10 MW
< 20 MW
10 MW
< 1 M€ / M
W / Year
1,5 M€ / M
W / Year
> 3 M€
/ MW / Y
ear

■ H2020 Exascale Challenge: 1 EFlops in 20 MW✓Using today’s most energy efficient TOP500 system: 189MW
Energy Optimization paths toward Exascale
13
Reduced Power Consumption
new [co-]processors, interconnect…
PUE optim. DLC…
Virtualization, RJMS…
New programming/execution models
Hardware
Data-center
Middleware
Software

HPC Data-Center Trends: Time for DLC
Reduced Power Consumption
Hardware
Data-center
Middleware
Software

Cooling and PUE
15
Courtesy of Bull SA

Cooling and PUE
■ Direct immersion: the CarnotJet example (PUE: 1.05)
16

HPC [Co-]Processor Trends: Go Mobile
Reduced Power Consumption
Hardware
Data-center
Middleware
Software

Back to 1995: vector vs. micro-processor
■ Microprocessors ~10x slower than one vector CPU✓… thus not faster… But cheaper!
18
10x

Back to 1995: vector vs. micro-processor
■ Microprocessors ~10x slower than one vector CPU✓… thus not faster… But cheaper!
18

How about now?
■ Mobile SoCs ~10x slower than one microprocessor✓… thus not faster… But cheaper!
✓ the “already seen” pattern?■ Mont-Blanc project: build an HPC system
from embedded and mobile devices
19
10x

Mont-Blanc (Phase 1) project outcomes
■ (2013) Tiribado: the first ARM HPC multicore system
20
Courtesy of BCS
0,15 GFlops/W

The UL HPC viridis cluster (2013)
■ 2 encl. (96 nodes, 4U), 12 calxeda boards per enclosure✓ 4x ARM Cortex A9 @ 1.1 GHz [4C] per Calxeda board
‣ 2x300W, “10” GbE inter-connect
21
0,513 GFlops/W 0.01
0.1
1
10
100
1000
10000
100000
OS
U L
at.
OS
U B
w.
HP
L
HP
L F
ull
Core
Mark
Fhours
tones
Whets
tones
Lin
pack
PpW
−−
LO
GS
CA
LE
Intel Core i7AMD G−T40N
Atom N2600Intel Xeon E7
ARM Cortex A9
[EE-LSDS’13] M. Jarus, S. Varrette, A. Oleksiak, and P. Bouvry. Performance Evaluation and Energy Efficiency of High-Density HPC Platforms Based on Intel, AMD and ARM Processors. In Proc. of the Intl. Conf. on Energy Efficiency in Large Scale Distributed Systems (EE-LSDS’13), volume 8046 of LNCS, Vienna, Austria, Apr 2013.

Commodity vs. GPGPUs: L-CSC (2014)
■ The German L-CSC cluster (Frankfurt) (2014)■ Nov 2014: 56 (out of 160) nodes, on each:✓ 4 GPUs, 2 CPUs, 256 GB RAM✓ #168 on Top 500 (1.7 PFlops)✓ #1 on Green 500
22
5,27 GFlops/W

Mobile SoCs and GPGPUs in HPC
■ Very fast development for Mobile SoCs and GPGPUs■ Convergence between both is foreseen✓CPUs inherits from GPUs multi-core with vector inst.✓GPUs inherits from CPUs cache-hierarchy
■ In parallel: large innovation in other embedded devices✓ Intel Xeon Phi co-processor✓ FPGAs etc.
23
Objective: 50 GFlops/W

Middleware Trends: Virtualization, RJMS
Reduced Power Consumption
Hardware
Data-center
Middleware
Software

■ Hypervisor: Core virtualization engine / environment✓ Type 1 adapted to HPC workload✓Performance Loss: > 20%
Virtualization in an HPC Environment
25
Xen, VMWare (ESXi), KVM Virtualbox

■ Hypervisor: Core virtualization engine / environment✓ Type 1 adapted to HPC workload✓Performance Loss: > 20%
Virtualization in an HPC Environment
25
[CCPE’14] M. Guzek, S. Varrette, V. Plugaru, J. E. Pecero, and P. Bouvry. A Holistic Model of the Performance and the Energy-Efficiency of Hypervisors in an HPC Environment. Intl. J. on Concurrency and Computation: Practice and Experience (CCPE), 26(15):2569–2590, Oct. 2014.
0 1000 2000 3000 4000 5000
100
150
200
250
Time [s]
Powe
r [W
]
ObservedRefined
0
20
40
60
80
100
120
Re
lativ
e P
pW
Performance per Watt normalized by Baseline score for HPCC phases on Taurus cluster
baselineKVM
XenESXi
RandomAccessDGEMMSTREAMFFTPTRANSHPL

Cloud Computing vs. HPC
■ World-widely advertised as THE solution to all problems■ Classical taxonomy: ✓ {Infrastructure,Platform,Software}-as-a-Service✓Grid’5000: Hardware-as-a-Service
26

Cloud Computing vs. HPC
■ World-widely advertised as THE solution to all problems■ Classical taxonomy: ✓ {Infrastructure,Platform,Software}-as-a-Service✓Grid’5000: Hardware-as-a-Service
26
Cloud Middleware for HPC Workload
27
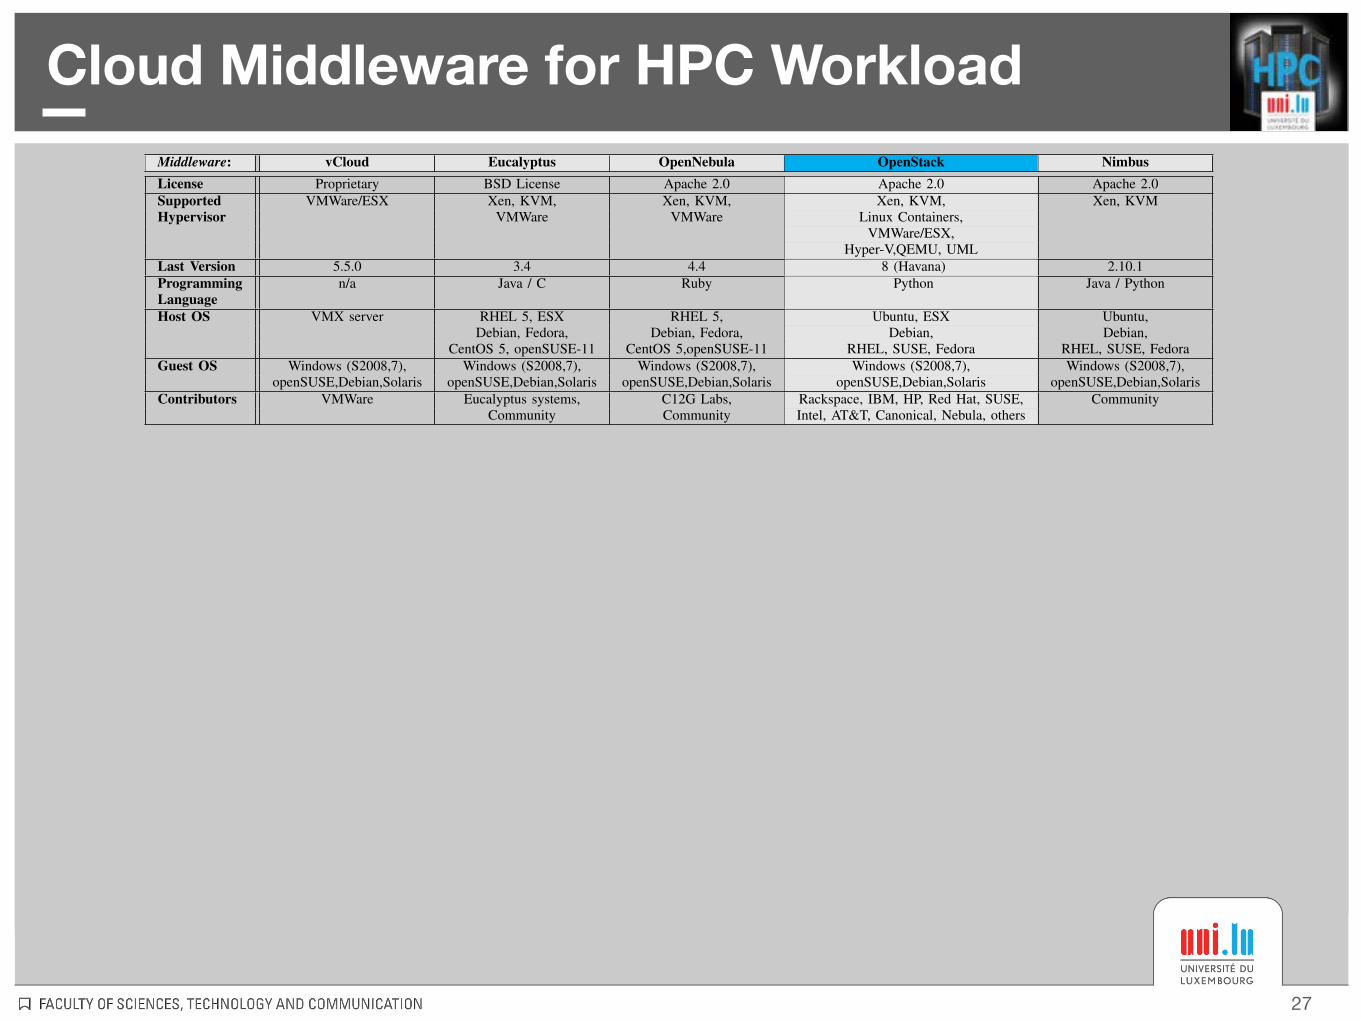
Table II. SUMMARY OF DIFFERENCES BETWEEN THE MAIN CC MIDDLEWARES.
Middleware: vCloud Eucalyptus OpenNebula OpenStack NimbusLicense Proprietary BSD License Apache 2.0 Apache 2.0 Apache 2.0Supported VMWare/ESX Xen, KVM, Xen, KVM, Xen, KVM, Xen, KVMHypervisor VMWare VMWare Linux Containers,
VMWare/ESX,Hyper-V,QEMU, UML
Last Version 5.5.0 3.4 4.4 8 (Havana) 2.10.1ProgrammingLanguage
n/a Java / C Ruby Python Java / Python
Host OS VMX server RHEL 5, ESX RHEL 5, Ubuntu, ESX Ubuntu,Debian, Fedora, Debian, Fedora, Debian, Debian,
CentOS 5, openSUSE-11 CentOS 5,openSUSE-11 RHEL, SUSE, Fedora RHEL, SUSE, FedoraGuest OS Windows (S2008,7), Windows (S2008,7), Windows (S2008,7), Windows (S2008,7), Windows (S2008,7),
openSUSE,Debian,Solaris openSUSE,Debian,Solaris openSUSE,Debian,Solaris openSUSE,Debian,Solaris openSUSE,Debian,SolarisContributors VMWare Eucalyptus systems, C12G Labs, Rackspace, IBM, HP, Red Hat, SUSE, Community
Community Community Intel, AT&T, Canonical, Nebula, others
the platform. As we will detail in Section IV, we have defineda set of common images and environments to be deployedto perform (and eventually reproduce) our experiment. As thisstudy also focuses on the energy consumption, power measureswere required such that we had to select a site where PowerDistribution Units (PDUs) measurements were available. Forthis purpose, the sites of Lyon and Reims were chosen.
B. Considered HPC Performance benchmarks
Several benchmarks that reflect a true HPC usage wereselected to compare all of the considered configurations. Forreproducibility reasons, all of them are open source and webased our choice on a previous study operated in the contextof the FutureGrid platform [12], and a better focus on I/Ooperation that we consider as under-estimated in too manystudies involving virtualization evaluation. We thus arrived tothe following benchmarks:
• The HPC Challenge (HPCC) [13], an industry stan-dard suite used to stress the performance of multipleaspects of an HPC system, from the pure computingpower to the RAM usage or the network communi-cation efficiency. It also provides reproducible results,at the heart of the ranking proposed in the Top500project.
• Graph500 [14] - a recent benchmark for data-intensiveapplications, which stresses the communication sub-system of the system, instead of counting doubleprecision floating-point like in HPL. It is based ona breadth-first search in a large undirected graph andreports various metrics linked to the underlying graphalgorithm, the main one being measure in GTEPS (109Traversed Edges Per Second).
In practice, HPCC basically consists of seven tests: (1) HPL(the High-Performance Linpack benchmark), which measuresthe floating point rate of execution for solving a linear systemof equations; (2) DGEMM, which measures the floating pointrate of execution of double precision real matrix-matrix multi-plication; (3) STREAM, a simple synthetic benchmark programthat measures sustainable memory bandwidth (in GB/s) andthe corresponding computation rate for simple vector kernel;(4) PTRANS (parallel matrix transpose), which exercises thecommunications where pairs of processors communicate witheach other simultaneously. It is a useful test of the totalcommunications capacity of the network; (5) RandomAccessthat measures the rate of integer random updates of memory
(GUPS); (6) FFT which evaluate the floating point rate of ex-ecution of double precision complex one-dimensional DiscreteFourier Transform (DFT). The last test (PingPong) measuresthe latency and bandwidth of a number of simultaneouscommunication patterns.In all cases, the results that are obtained from all consideredbenchmarks provide an unbiased performance analysis of theconfigurations considered.
C. Considered Energy-Efficiency benchmarcks
For decades, the notion of HPC performance has mainlybeen synonymous with speed (as measured in Flops – floating-point operations per second). In order to raise awarenessof other performance metrics of interest (e.g. performanceper watt and energy efficiency for improved reliability), theGreen500 project [15] was launched in 2005. Derived fromthe results of the Top500 – and thus on HPL measures,this list encourages supercomputing stakeholders to producemore energy efficient machines. The same approach has beenproposed in the context of the Graph500 benchmark, leadingto the Green Graph 500 [16] list which collects similarlyperformance-per-watt metrics and acts as a forum for vendorsand data center operators to compare the energy consumptionof data intensive computing workloads on their architectures.
We will show in Section V an energy-efficiency analysisbased on the very same metric used in the Green500 andGreenGraph500 projects.
III. RELATED WORK
At the level of the pure hypervisor performance evaluation,many studies can be found in the literature that attempt toquantify the overhead induced by the virtualization layer. Yetthe focus on HPC workloads is recent as it implies severalchallenges, from a small system footprint to efficient I/Omechanisms.
Early quantitative studies were proposed in 2006 by L.Youseff et al. [17], and in 2007 by A. Gavrilovska et al.[18]. While the claimed objective was to present opportunitiesfor HPC platforms and applications to benefit from systemvirtualization, the practical experimentation in the latter workidentified two main limitations of interest for HPC, to beaddressed by the hypervisors: I/O operations and adaptationto multi-core systems. While the second point is now cir-cumvented on the considered hypervisor systems, the first oneremains challenging.

Cloud Middleware for HPC Workload
27
[ICPP’14] S. Varrette, V. Plugaru, M. Guzek, X. Besseron, and P. Bouvry. HPC Performance and Energy-Efficiency of the OpenStack Cloud Middleware. In Proc. of the 43rd IEEE Intl. Conf. on Parallel Processing (ICPP-2014), Heterogeneous and Unconventional Cluster Architectures and Applications Workshop (HUCAA’14), Sept. 2014. IEEE.
Table IV. AVERAGE PERFORMANCE DROPS (COMPARED TO BASELINE) ACROSS ALL CONFIGURATIONS AND ARCHITECTURES OBSERVED IN THIS STUDY.
Avg. Performance drop Avg. Energy-efficiency dropHPL STREAM RandomAccess Graph500 Green500 GreenGraph500
OpenStack+Xen 41.5% 19% 89.7% 21.6% 56.5% 42%OpenStack+KVM 58.6% 7.2% 67.5% 23.7% 38.5% 40%
the two leading hardware architectures (AMD and Intel). Inparticular, we tested the performance impact given by theIaaS solution and its Xen/KVM virtualization backends whenrunning the reference HPCC/HPL and Graph500 benchmark-ing suites over varying number of physical (up to 12) andvirtualized (up to 72) nodes. Our objective was to quantify theoverhead induced by the Cloud layer when compared with thebaseline configuration that used to operate without any suchvirtualization interface.Our findings, summarized in the table IV, show that thereis a substantial performance impact introduced by the Cloudmiddleware layer across the considered hypervisors, whichconfirms again, if needed, the non-suitability of Cloud envi-ronments for distributed large scale HPC workloads. A non-negligible part of our study includes the energy-efficiencyanalysis, using the typical metrics employed by the Green500and GreenGraph500 projects [15], [16]. Indeed, virtualizationis also emerging as the prominent approach to reduce theenergy consumed by consolidating multiple running VM in-stances on a single server, thus giving credit towards a Cloud-based approach. Here again, we demonstrate the poor powerefficiency of the OpenStack IaaS middleware when facinghigh-demanding HPC-type applications.
The future work induced by this study includes largerscale experiments over various Cloud environments not yetconsidered in this study such as vCloud, Eucalyptus, Open-Nebula and Nimbus. Also, an economic analysis of publiccloud solutions is currently under investigation that will com-plement the outcomes of this work. In general, we wouldlike to perform further experimentation on a larger set ofapplications and machines. Finally, the proposed benchmarkswill of course have to be repeated over time in order to evaluatefuture hardware virtualization ability and new generation ofmiddleware.
Acknowledgments: The experiments presented in this paper werecarried out using the Grid’5000 experimental testbed, being developedunder the INRIA ALADDIN development action with support fromCNRS, RENATER and several Universities as well as other fundingbodies (see https://www.grid5000.fr). This work was completed withthe support of the INTER/CNRS/11/03/Green@Cloud project and theCOST action IC1305.
REFERENCES
[1] M. Guzek, S. Varrette, V. Plugaru, J. E. Sanchez, and P. Bouvry,“A Holistic Model of the Performance and the Energy-Efficiency ofHypervisors in an HPC Environment,” in Proc. of the Intl. Conf. onEnergy Efficiency in Large Scale Distributed Systems (EE-LSDS’13),ser. LNCS. Vienna, Austria: Springer Verlag, Apr 2013.
[2] S. Varrette, M. Guzek, V. Plugaru, X. Besseron, and P. Bouvry, “HPCPerformance and Energy-Efficiency of Xen, KVM and VMware Hyper-visors,” in Proc. of the 25th Symposium on Computer Architecture andHigh Performance Computing (SBAC-PAD 2013). Porto de Galinhas,Brazil: IEEE Computer Society, Oct. 2013.
[3] “Openstack,” http://www.openstack.org/.[4] “Grid’5000,” [online] http://grid5000.fr.
[5] M. Armbrust and al., “Above the clouds: A berkeley view of cloudcomputing,” EECS Department, University of California, Berkeley,Tech. Rep., Feb 2009.
[6] L. M. Vaquero, L. Rodero-Merino, J. Caceres, and M. Lindner, “Abreak in the clouds: towards a cloud definition,” SIGCOMM Comput.Commun. Rev., vol. 39, no. 1, pp. 50–55, Dec. 2008.
[7] P. Barham, B. Dragovic, K. Fraser, S. Hand, T. Harris, A. Ho, R. Neuge-bauer, I. Pratt, and A. Warfield, “Xen and the art of virtualization,” inProceedings of the nineteenth ACM symposium on Operating systemsprinciples, ser. SOSP ’03. New York, NY, USA: ACM, 2003, pp.164–177.
[8] A. Kivity and al., “kvm: the Linux virtual machine monitor,” inOttawa Linux Symposium, Jul. 2007, pp. 225–230. [Online]. Available:http://www.kernel.org/doc/ols/2007/ols2007v1-pages-225-230.pdf
[9] X. Wen, G. Gu, Q. Li, Y. Gao, and X. Zhang, “Comparison of open-source cloud management platforms: OpenStack and OpenNebula,” inFuzzy Systems and Knowledge Discovery (FSKD), 2012 9th Interna-tional Conference on, 2012, pp. 2457–2461.
[10] R. Bolze, F. Cappello, E. Caron, M. Daydé, F. Desprez, E. Jeannot,Y. Jégou, S. Lanteri, J. Leduc, N. Melab, G. Mornet, R. Namyst,P. Primet, B. Quetier, O. Richard, E.-G. Talbi, and I. Touche,“Grid’5000: A large scale and highly reconfigurable experimental gridtestbed,” Int. J. High Perform. Comput. Appl., vol. 20, no. 4, pp.481–494, Nov. 2006. [Online]. Available: http://dx.doi.org/10.1177/1094342006070078
[11] E. Jeanvoine, L. Sarzyniec, and L. Nussbaum, “Kadeploy3: Efficientand Scalable Operating System Provisioning,” USENIX ;login:, vol. 38,no. 1, pp. 38–44, Feb. 2013.
[12] A. J. Younge, R. Henschel, J. Brown, G. von Laszewski, J. Qiu,and G. C. Fox, “Analysis of virtualization technologies for highperformance computing environments,” in The 4th InternationalConference on Cloud Computing (IEEE CLOUD 2011), IEEE.Washington, DC: IEEE, 07/2011 2011, Paper. [Online]. Available:http://www.computer.org/portal/web/csdl/doi/10.1109/CLOUD.2011.29
[13] P. L. J. J. Dongarra, “Introduction to the hpcchallenge benchmark suite,”ICL, Tech. Rep., 2004.
[14] R. C. Murphy, K. B. Wheeler, B. W. Barrett, and J. A. Ang, “Introducingthe graph 500,” in Cray User’s Group (CUG), may 2010.
[15] S. Sharma, C.-H. Hsu, and W. chun Feng, “Making a case for aGreen500 list,” in Parallel and Distributed Processing Symposium,2006. IPDPS 2006. 20th International, 2006, pp. 8 pp.–.
[16] “Green graph 500.” [Online]. Available: http://green.graph500.org[17] L. Youseff, R. Wolski, B. Gorda, and C. Krintz, “Evaluating the perfor-
mance impact of xen on mpi and process execution for hpc systems,”in Proceedings of the 2Nd International Workshop on VirtualizationTechnology in Distributed Computing, ser. VTDC ’06. Washington,DC, USA: IEEE Computer Society, 2006, pp. 1–.
[18] A. Gavrilovska et al., “High-Performance Hypervisor Architectures:Virtualization in HPC Systems,” in Proc. of HPCVirt 2007, Portugal,Mar. 2007.
[19] P. Luszczek, E. Meek, S. Moore, D. Terpstra, V. M. Weaver, and J. Don-garra, “Evaluation of the HPC Challenge Benchmarks in VirtualizedEnvironments,” in VHPC 2011, 6th Workshop on Virtualization in High-Performance Cloud Computing, Bordeaux, France, 08/2011 2011.
[20] K. Ibrahim, S. Hofmeyr, and C. Iancu, “Characterizing the performanceof parallel applications on multi-socket virtual machines,” in Cluster,Cloud and Grid Computing (CCGrid), 2011 11th IEEE/ACM Interna-tional Symposium on, May 2011, pp. 1–12.
[21] A. Marathe, D. Lowenthal, B. Rountree, X. Yuan, M. Schulz, andB. de Supinski, “A user perspective of high-performance computingon the cloud,” Lawrence Livermore National Laboratory (LLNL),Livermore, CA, Tech. Rep., 2012.
[22] “HPC Application Performance on ESX 4.1: Stream,” http://tinyurl.com/VMWareESX-STREAM-Perf.
0
0.5
1
1.5
2
1 2 3 6 11
Gre
en
Gra
ph
50
0 P
pW
[MT
EP
S/W
]
Intel (Lyon)
Baseline OpenStack + Xen OpenStack + KVM
0
500
1000
0 1000 2000 3000Time [s]
Tota
l Pow
er [W
]
Node_idt−13t−16t−3t−4t−5t−6
Table II. SUMMARY OF DIFFERENCES BETWEEN THE MAIN CC MIDDLEWARES.
Middleware: vCloud Eucalyptus OpenNebula OpenStack NimbusLicense Proprietary BSD License Apache 2.0 Apache 2.0 Apache 2.0Supported VMWare/ESX Xen, KVM, Xen, KVM, Xen, KVM, Xen, KVMHypervisor VMWare VMWare Linux Containers,
VMWare/ESX,Hyper-V,QEMU, UML
Last Version 5.5.0 3.4 4.4 8 (Havana) 2.10.1ProgrammingLanguage
n/a Java / C Ruby Python Java / Python
Host OS VMX server RHEL 5, ESX RHEL 5, Ubuntu, ESX Ubuntu,Debian, Fedora, Debian, Fedora, Debian, Debian,
CentOS 5, openSUSE-11 CentOS 5,openSUSE-11 RHEL, SUSE, Fedora RHEL, SUSE, FedoraGuest OS Windows (S2008,7), Windows (S2008,7), Windows (S2008,7), Windows (S2008,7), Windows (S2008,7),
openSUSE,Debian,Solaris openSUSE,Debian,Solaris openSUSE,Debian,Solaris openSUSE,Debian,Solaris openSUSE,Debian,SolarisContributors VMWare Eucalyptus systems, C12G Labs, Rackspace, IBM, HP, Red Hat, SUSE, Community
Community Community Intel, AT&T, Canonical, Nebula, others
the platform. As we will detail in Section IV, we have defineda set of common images and environments to be deployedto perform (and eventually reproduce) our experiment. As thisstudy also focuses on the energy consumption, power measureswere required such that we had to select a site where PowerDistribution Units (PDUs) measurements were available. Forthis purpose, the sites of Lyon and Reims were chosen.
B. Considered HPC Performance benchmarks
Several benchmarks that reflect a true HPC usage wereselected to compare all of the considered configurations. Forreproducibility reasons, all of them are open source and webased our choice on a previous study operated in the contextof the FutureGrid platform [12], and a better focus on I/Ooperation that we consider as under-estimated in too manystudies involving virtualization evaluation. We thus arrived tothe following benchmarks:
• The HPC Challenge (HPCC) [13], an industry stan-dard suite used to stress the performance of multipleaspects of an HPC system, from the pure computingpower to the RAM usage or the network communi-cation efficiency. It also provides reproducible results,at the heart of the ranking proposed in the Top500project.
• Graph500 [14] - a recent benchmark for data-intensiveapplications, which stresses the communication sub-system of the system, instead of counting doubleprecision floating-point like in HPL. It is based ona breadth-first search in a large undirected graph andreports various metrics linked to the underlying graphalgorithm, the main one being measure in GTEPS (109Traversed Edges Per Second).
In practice, HPCC basically consists of seven tests: (1) HPL(the High-Performance Linpack benchmark), which measuresthe floating point rate of execution for solving a linear systemof equations; (2) DGEMM, which measures the floating pointrate of execution of double precision real matrix-matrix multi-plication; (3) STREAM, a simple synthetic benchmark programthat measures sustainable memory bandwidth (in GB/s) andthe corresponding computation rate for simple vector kernel;(4) PTRANS (parallel matrix transpose), which exercises thecommunications where pairs of processors communicate witheach other simultaneously. It is a useful test of the totalcommunications capacity of the network; (5) RandomAccessthat measures the rate of integer random updates of memory
(GUPS); (6) FFT which evaluate the floating point rate of ex-ecution of double precision complex one-dimensional DiscreteFourier Transform (DFT). The last test (PingPong) measuresthe latency and bandwidth of a number of simultaneouscommunication patterns.In all cases, the results that are obtained from all consideredbenchmarks provide an unbiased performance analysis of theconfigurations considered.
C. Considered Energy-Efficiency benchmarcks
For decades, the notion of HPC performance has mainlybeen synonymous with speed (as measured in Flops – floating-point operations per second). In order to raise awarenessof other performance metrics of interest (e.g. performanceper watt and energy efficiency for improved reliability), theGreen500 project [15] was launched in 2005. Derived fromthe results of the Top500 – and thus on HPL measures,this list encourages supercomputing stakeholders to producemore energy efficient machines. The same approach has beenproposed in the context of the Graph500 benchmark, leadingto the Green Graph 500 [16] list which collects similarlyperformance-per-watt metrics and acts as a forum for vendorsand data center operators to compare the energy consumptionof data intensive computing workloads on their architectures.
We will show in Section V an energy-efficiency analysisbased on the very same metric used in the Green500 andGreenGraph500 projects.
III. RELATED WORK
At the level of the pure hypervisor performance evaluation,many studies can be found in the literature that attempt toquantify the overhead induced by the virtualization layer. Yetthe focus on HPC workloads is recent as it implies severalchallenges, from a small system footprint to efficient I/Omechanisms.
Early quantitative studies were proposed in 2006 by L.Youseff et al. [17], and in 2007 by A. Gavrilovska et al.[18]. While the claimed objective was to present opportunitiesfor HPC platforms and applications to benefit from systemvirtualization, the practical experimentation in the latter workidentified two main limitations of interest for HPC, to beaddressed by the hypervisors: I/O operations and adaptationto multi-core systems. While the second point is now cir-cumvented on the considered hypervisor systems, the first oneremains challenging.

Cloud IaaS (OpenStack) on Mobile SoCs
28
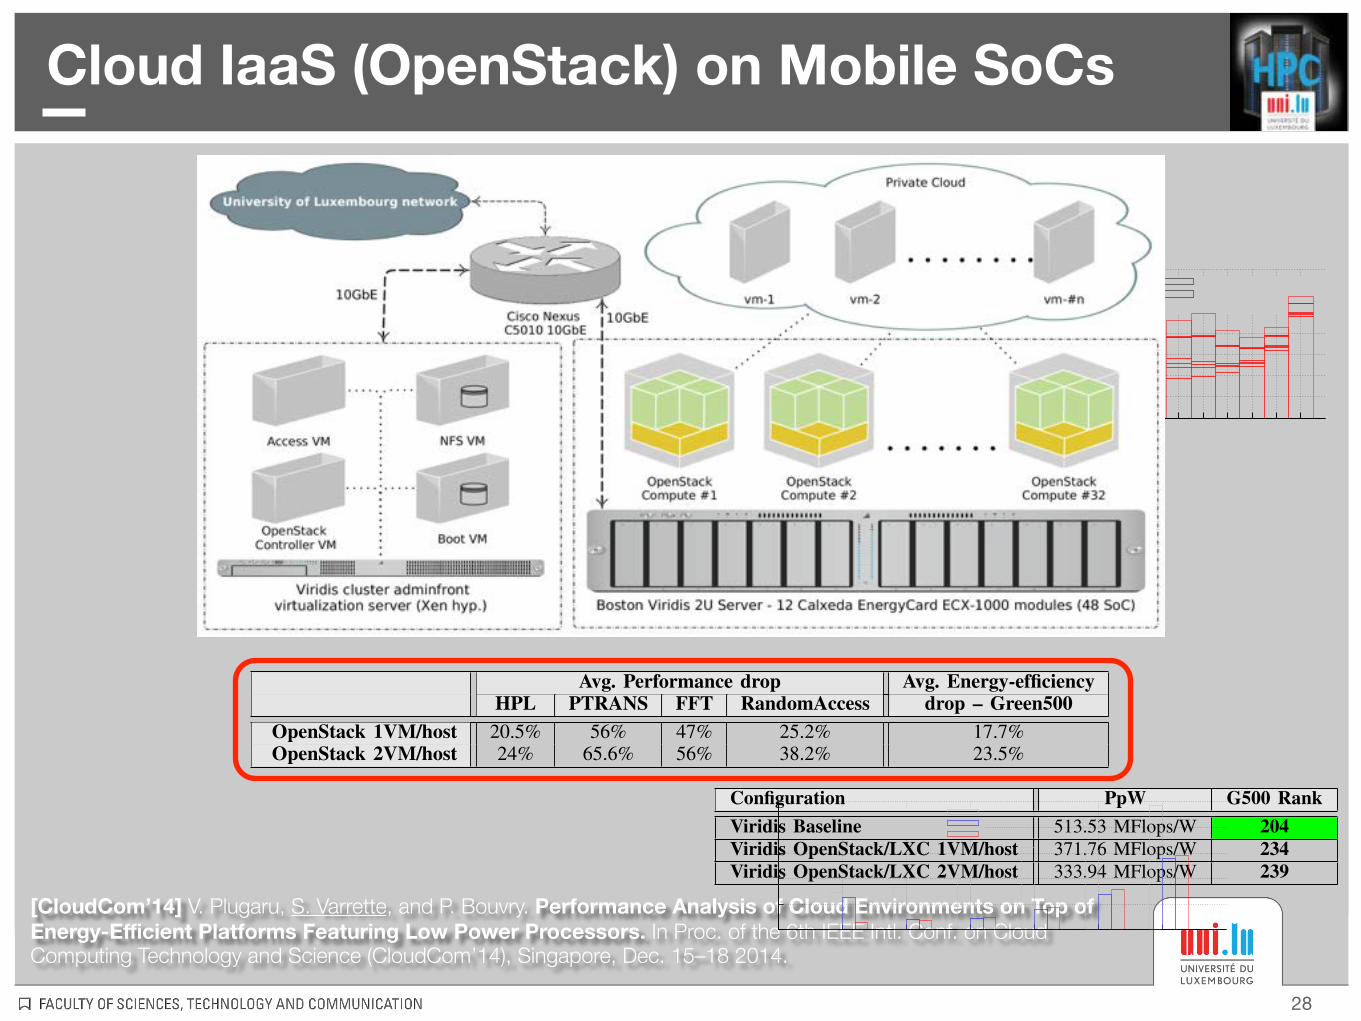
[CloudCom’14] V. Plugaru, S. Varrette, and P. Bouvry. Performance Analysis of Cloud Environments on Top of Energy-Efficient Platforms Featuring Low Power Processors. In Proc. of the 6th IEEE Intl. Conf. on Cloud Computing Technology and Science (CloudCom’14), Singapore, Dec. 15–18 2014.

Cloud IaaS (OpenStack) on Mobile SoCs
28
[CloudCom’14] V. Plugaru, S. Varrette, and P. Bouvry. Performance Analysis of Cloud Environments on Top of Energy-Efficient Platforms Featuring Low Power Processors. In Proc. of the 6th IEEE Intl. Conf. on Cloud Computing Technology and Science (CloudCom’14), Singapore, Dec. 15–18 2014.
TABLE II: Average performance drops observed when compared to baseline executions.
Avg. Performance drop Avg. Energy-efficiencyHPL PTRANS FFT RandomAccess drop – Green500
OpenStack 1VM/host 20.5% 56% 47% 25.2% 17.7%OpenStack 2VM/host 24% 65.6% 56% 38.2% 23.5%
the most recent (June 2014) Green500 list [11] which rankssupercomputers using this metric, the baseline configuration(reaching 513.53MFlops/W) would rank the cluster as #204,with the OpenStack configurations (371.76 and respectively333.94 MFlops/W) ranking as #234 and #239.
Also part of the HPCC suite are two other computationallyintensive kernels - DGEMM and FFT, with their performanceevaluations presented in Figure 4. The result for the Star (embar-rassingly parallel) execution mode of DGEMM is shown whereeach distributed process is running the benchmark concurrently,without explicit communication. It can be seen that whileperformance degradation is present when running the DGEMMtest under OpenStack, the number of VMs per computinghost has no influence over the performance result. This hintsat an important impact on network bandwidth and latencywhen running under the Cloud middleware, reflected in the badperformance obtained by communication-intensive applications.For the FFT test, a slight improvement in performance appearswhen using two VMs per node as opposed to only one forthe tests involving the larger number of hosts, which pointsat caching benefits obtained in these configurations. However,compared to the baseline test a significant performance dropis observed for FFT, with the best result for the 2VM/nodeconfiguration being 76.5% and the worst 28.3% of the valuemeasured in baseline mode.
0
0.2
0.4
0.6
0.8
1
1.2
1.4
1 2 4 8 16 32
Sta
r D
GE
MM
Perf
orm
ance
[G
Flo
ps]
Hig
her
is b
etter
Number of (physical) computing nodes
BaselineOpenStack + LXC 1VM/hostOpenStack + LXC 2VM/host
0
0.2
0.4
0.6
0.8
1
1.2
1.4
1 2 4 8 16 32
MP
I F
FT
Perf
orm
ance
[G
Flo
ps]
Hig
her
is b
etter
Number of (physical) computing nodes
BaselineOpenStack + LXC 1VM/hostOpenStack + LXC 2VM/host
Fig. 4: HPCC experiment - StarDGEMM (above) and MPI FFT(below) benchmark results.
In the PTRANS benchmark, pairs of processors concurrentlyexchange large messages, stressing the network fabric and thusproviding a good measure of the data transfer rate available.The test’s results are presented in Figure 5 and show low datatransfer rates obtained when the communicating processes aresplit between separately running VMs.
Figure 6 shows the results of the RandomAccess testwhich profiles the memory architecture of a system, as
0
0.1
0.2
0.3
0.4
0.5
1 2 4 8 16 32
PT
RA
NS
Perf
orm
ance
[G
B/s
]
Hig
her
is b
etter
Number of (physical) computing nodes
BaselineOpenStack + LXC 1VM/hostOpenStack + LXC 2VM/host
Fig. 5: HPCC PTRANS benchmark results.
0
0.0005
0.001
0.0015
0.002
0.0025
0.003
0.0035
0.004
1 2 4 8 16 32
MP
I R
andom
Acc
ess
[G
UP
S]
Hig
her
is b
etter
Number of (physical) computing nodes
BaselineOpenStack + LXC 1VM/hostOpenStack + LXC 2VM/host
Fig. 6: HPCC RandomAccess benchmark results.
random memory performance often maps directly to applicationperformance. While the test attempts to calculate a peaksystem capability, it does not always scale with the processorcount, and this is apparent in Figure 6 which indicates thatfor applications exhibiting high memory access patterns, anexecution on 8 computing nodes is optimal for the architectureof the Viridis cluster. Finally, the results of the HPCC testsmeasuring network performance are presented in Figure 7, fora randomly ordered ring communication pattern. A very fastdecrease in bandwidth and increase of latency is observed, withthe Cloud IaaS experiments heavily impacted on multiple-nodeexecutions.
0
0.02
0.04
0.06
0.08
0.1
0.12
0.14
0.16
1 2 4 8 16 32
Random
lly O
rdere
d R
ing
Bandw
idth
[G
B/s
]
Hig
her
is b
etter
Number of (physical) computing nodes
BaselineOpenStack + LXC 1VM/hostOpenStack + LXC 2VM/host
0
200
400
600
800
1000
1200
1400
1600
1 2 4 8 16 32
Random
lly O
rdere
d R
ing
Late
ncy
[µ
s]
Low
er
is b
etter
Number of (physical) computing nodes
BaselineOpenStack + LXC 1VM/hostOpenStack + LXC 2VM/host
Fig. 7: HPCC experiment - Random Ring Bandwidth & Latency.
Cloud IaaS (OpenStack) on Mobile SoCs
28
[CloudCom’14] V. Plugaru, S. Varrette, and P. Bouvry. Performance Analysis of Cloud Environments on Top of Energy-Efficient Platforms Featuring Low Power Processors. In Proc. of the 6th IEEE Intl. Conf. on Cloud Computing Technology and Science (CloudCom’14), Singapore, Dec. 15–18 2014.
0
500
1000
1500
2000
2500
3000
3500
1 2 4 8 16 32 1 2 4 8 16 32 1 2 4 8 16 32
AB
ySS
Ph
ase
tim
esp
an
[s]
Lo
we
r is
be
tte
r
LOAD
GEN_ADJ
ERODE
TRIM
COVERAGE
BUBBLES
SPLT_AMBIG
ASSEMBLE
OpenStack + LXC 2VM/hostOpenStack + LXC 1VM/hostBaseline
0
200
400
600
800
1000
1200
1400
1600
1 2 4 8 16 32 1 2 4 8 16 32 1 2 4 8 16 32
AB
ySS
Ph
ase
tim
esp
an
[s]
Lo
we
r is
be
tte
r
GEN_ADJ
ERODE
TRIM
COVERAGE
BUBBLES
SPLT_AMBIG
ASSEMBLE
OpenStack + LXC 2VM/hostOpenStack + LXC 1VM/hostBaseline
Fig. 11: ABySS benchmark: full timeline (left), without the loading phase (right).
be clearly seen that the multi-node execution of ABYSS-P isless efficient than the single node execution, most likely dueto intensive communication patterns reaching a bottleneck, aspreviously identified with HPCC’s bandwidth and latency tests.
TABLE III: Green500 Equivalent Rank (as of June 2014) obtainedfrom the experimental results (HPL) over 32 physical nodes.
Configuration PpW G500 RankViridis Baseline 513.53 MFlops/W 204Viridis OpenStack/LXC 1VM/host 371.76 MFlops/W 234Viridis OpenStack/LXC 2VM/host 333.94 MFlops/W 239
VI. CONCLUSION
This article has tried to combine in a novel way threeelements of the modern IT&C landscape: a Cloud Infrastructure-as-a-Service solution, an energy efficient hardware platformand compute-intensive workloads, asserting that these elementswill be part of future hybrid computing systems - developedto have the flexibility, efficiency and performance needed toanalyze the skyrocketing amounts of data generated every day.More specifically, the research question we wished to addressin this study can be formulated as follows:
Can HPC workloads run on a Cloud platformcomposed of cutting-edge ultra low power processingelements?
To our knowledge, this is one of the first studies of this type,since deployment attempts of the OpenStack infrastructure ontop of ARM platforms are in early stages, and are generallyperformed only for demonstration purposes.
To answer the above question, two main contributionshave been delivered by this work: (1) the development ofthe BACH software framework, able to execute automatedand unbiased performance evaluations and (2) its use for theassessment of the OpenStack IaaS deployed on an energyefficient, ultra low power computing platform based on ARMprocessors. To a minor extend, a third contribution has beenthe efficient configuration of this cutting-edge platform, whichproved to be a real technical challenge, with many issuesbeing overcome during this study. Two synthetic benchmarks –HPCC, containing the well known HPL used to rank the world’ssupercomputers, and the state-of-the-art HPCG developed as itsalternative – were used to evaluate the pure performance andenergy efficiency of these combined platforms. Complementingthese benchmarks, GROMACS, a versatile molecular dynamicspackage and ABySS, a de novo sequence assembler were usedin order to evaluate the platform with real-world HPC taskswithin BACH. From that perspective, the validation of the
BACH framework permits to compare both the native ARM-based platform and the OpenStack middleware run on top of it,while monitoring power consumption and system-level metrics.Through BACH, experiments were ran on up to 32 ARM-basedcomputing nodes with up to 64 Virtual Machine instances beinglaunched.The findings show a substantial performance degradationinduced on the demanding HPC applications by the Cloudmiddleware – at least a drop of 20% on average for compute-intensive tasks and 65.6% drop in communication capacity – anda reflected poor efficiency of the platform close to 18% whencompared to the results obtained in native mode. The precisenumbers are summarized in the Table II on page 7. Whencompared to the reference Green500 list, the results obtainedduring the experiments are indicated in Table III. Despite theseperformance drops, we remain confident in the future of thistechnology since our analysis was performed on early server-targeting processors, which do not integrate virtualization-specific instructions (thus the use of LXC containers in ourstudy).
In this sense, it does not darken the future of Clouddeployment on energy-efficient platforms.
As computing platforms are continuously evolving, alsotheir design, implementation and integration must be frequentlystudied from a cost-benefit point of view. Thus the future workproposed is to extend this study with evaluations of other Cloudsolutions, new hardware platforms and architectures – such asthe recently released ARM64 – and with as diverse workloadsas possible.
Acknowledgments: The experiments presented in this paperwere carried out using the HPC facility of the University ofLuxembourg.
REFERENCES
[1] M. Armbrust and al., “Above the clouds: A berkeley view of cloudcomputing,” EECS Department, University of California, Berkeley, Tech.Rep. UCB/EECS-2009-28, Feb 2009, |Online|.
[2] “OpenStack,” [Online] http://www.openstack.org/.[3] “Open vSwitch,” [Online] http://openvswitch.org/.[4] G. Lee, “Chapter 6 - server virtualization and networking,” in Cloud
Networking, G. Lee, Ed. Boston: Morgan Kaufmann, 2014, pp. 103 –120, |Online|.
[5] X. Wen, G. Gu, Q. Li, Y. Gao, and X. Zhang, “Comparison of open-source cloud management platforms: OpenStack and OpenNebula,” inFuzzy Systems and Knowledge Discovery (FSKD), 2012 9th InternationalConference on, 2012, pp. 2457–2461.
[6] S. A. Baset, “Open source cloud technologies,” in Proceedings of theThird ACM Symposium on Cloud Computing, ser. SoCC ’12. NewYork, NY, USA: ACM, 2012, pp. 28:1–28:2, |Online|.
TABLE II: Average performance drops observed when compared to baseline executions.
Avg. Performance drop Avg. Energy-efficiencyHPL PTRANS FFT RandomAccess drop – Green500
OpenStack 1VM/host 20.5% 56% 47% 25.2% 17.7%OpenStack 2VM/host 24% 65.6% 56% 38.2% 23.5%
the most recent (June 2014) Green500 list [11] which rankssupercomputers using this metric, the baseline configuration(reaching 513.53MFlops/W) would rank the cluster as #204,with the OpenStack configurations (371.76 and respectively333.94 MFlops/W) ranking as #234 and #239.
Also part of the HPCC suite are two other computationallyintensive kernels - DGEMM and FFT, with their performanceevaluations presented in Figure 4. The result for the Star (embar-rassingly parallel) execution mode of DGEMM is shown whereeach distributed process is running the benchmark concurrently,without explicit communication. It can be seen that whileperformance degradation is present when running the DGEMMtest under OpenStack, the number of VMs per computinghost has no influence over the performance result. This hintsat an important impact on network bandwidth and latencywhen running under the Cloud middleware, reflected in the badperformance obtained by communication-intensive applications.For the FFT test, a slight improvement in performance appearswhen using two VMs per node as opposed to only one forthe tests involving the larger number of hosts, which pointsat caching benefits obtained in these configurations. However,compared to the baseline test a significant performance dropis observed for FFT, with the best result for the 2VM/nodeconfiguration being 76.5% and the worst 28.3% of the valuemeasured in baseline mode.
0
0.2
0.4
0.6
0.8
1
1.2
1.4
1 2 4 8 16 32
Sta
r D
GE
MM
Perf
orm
ance
[G
Flo
ps]
Hig
her
is b
etter
Number of (physical) computing nodes
BaselineOpenStack + LXC 1VM/hostOpenStack + LXC 2VM/host
0
0.2
0.4
0.6
0.8
1
1.2
1.4
1 2 4 8 16 32
MP
I F
FT
Perf
orm
ance
[G
Flo
ps]
Hig
her
is b
etter
Number of (physical) computing nodes
BaselineOpenStack + LXC 1VM/hostOpenStack + LXC 2VM/host
Fig. 4: HPCC experiment - StarDGEMM (above) and MPI FFT(below) benchmark results.
In the PTRANS benchmark, pairs of processors concurrentlyexchange large messages, stressing the network fabric and thusproviding a good measure of the data transfer rate available.The test’s results are presented in Figure 5 and show low datatransfer rates obtained when the communicating processes aresplit between separately running VMs.
Figure 6 shows the results of the RandomAccess testwhich profiles the memory architecture of a system, as
0
0.1
0.2
0.3
0.4
0.5
1 2 4 8 16 32
PT
RA
NS
Perf
orm
ance
[G
B/s
]
Hig
her
is b
etter
Number of (physical) computing nodes
BaselineOpenStack + LXC 1VM/hostOpenStack + LXC 2VM/host
Fig. 5: HPCC PTRANS benchmark results.
0
0.0005
0.001
0.0015
0.002
0.0025
0.003
0.0035
0.004
1 2 4 8 16 32
MP
I R
andom
Acc
ess
[G
UP
S]
Hig
her
is b
etter
Number of (physical) computing nodes
BaselineOpenStack + LXC 1VM/hostOpenStack + LXC 2VM/host
Fig. 6: HPCC RandomAccess benchmark results.
random memory performance often maps directly to applicationperformance. While the test attempts to calculate a peaksystem capability, it does not always scale with the processorcount, and this is apparent in Figure 6 which indicates thatfor applications exhibiting high memory access patterns, anexecution on 8 computing nodes is optimal for the architectureof the Viridis cluster. Finally, the results of the HPCC testsmeasuring network performance are presented in Figure 7, fora randomly ordered ring communication pattern. A very fastdecrease in bandwidth and increase of latency is observed, withthe Cloud IaaS experiments heavily impacted on multiple-nodeexecutions.
0
0.02
0.04
0.06
0.08
0.1
0.12
0.14
0.16
1 2 4 8 16 32
Random
lly O
rdere
d R
ing
Bandw
idth
[G
B/s
]
Hig
her
is b
etter
Number of (physical) computing nodes
BaselineOpenStack + LXC 1VM/hostOpenStack + LXC 2VM/host
0
200
400
600
800
1000
1200
1400
1600
1 2 4 8 16 32
Random
lly O
rdere
d R
ing
Late
ncy
[µ
s]
Low
er
is b
etter
Number of (physical) computing nodes
BaselineOpenStack + LXC 1VM/hostOpenStack + LXC 2VM/host
Fig. 7: HPCC experiment - Random Ring Bandwidth & Latency.

Virtualization, RJMS and HPC
29
[JSSPP’15] J. Emeras, S. Varrette, M. Guzek, and P. Bouvry. Evalix: Classification and Prediction of Job Resource Consumption on HPC Platforms. In Proc. of the 19th Intl. Workshop on Job Scheduling Strategies for Parallel Processing (JSSPP’15), part of IPDPS 2015, Hyderabad, India, May 25–2919 2015. IEEE Computer Society.
0.10.20.30.40.50.60.70.80.9
CPU Memory(Avg.)
Memory(Max.)
Reads Writes
Valu
e
indicatorAccuracyAUCKappa
Local Computing Resources
Sleeping (powered off) Ready / Busy (power on)
Virtualized (running VMs instance)
Virtualized / on the Cloud(running VMs instance)
Remote Cloud Resources
RJMS (OAR, PBS etc.)
virtual resources configuration
scheduling
monitoring
energy-saving configuration
Workload analysis
Performance Evaluation
User/Job characterization
On-demand optimization of computing platforms
based on:
Evalix
■ Virtualization not suitable for pure HPC performance✓YET not all workloads running on HPC are pure-parallel

Other Middleware approaches
■ Multi-Agent System (MAS) for energy aware executions
30
[ISSPIT’14] M. Guzek, X. Besseron, S. Varrette, G. Danoy, and P. Bouvry. ParaMASK: a Multi-Agent System for the Efficient and Dynamic Adaptation of HPC Workloads. In Proc. of the 14th IEEE Intl. Symp. on Signal Processing and Information Technology (ISSPIT’14), Noida, India, Dec. 2014. IEEE Computer Society
Key
O
L
W W W
L
W W W
L
W W W
...
Node 1
Node 2 Node 3 Node n
Management Layer
KAAPI Layer
O LOrgManager LocalManager WorkerWWork stealingCoordinationAuthority
0
500
1000
1500
0 100 200 300Time [s]
Tota
l Pow
er [W
]
node_uidsagittaire−24sagittaire−6sagittaire−74sagittaire−9stremi−24stremi−25stremi−26stremi−28
0
500
1000
1500
0 100 200 300Time [s]
Tota
l Pow
er [W
]
node_uidsagittaire−24sagittaire−6sagittaire−74sagittaire−9stremi−24stremi−25stremi−26stremi−28
None 20 s 15 s 10 s 8 s 5 s 2 s 1 s
05
1015
2025
<0.1 % 1.29 % 1.41 %
2.20 % 2.29 % 3.63 %
9.94 %
22.99 %
Ove
rhea
d on
the
Exec
utio
n Ti
me
(%)
Time between Global Coordinations

Software Trends: Rethinking Parallel Computing
Reduced Power Consumption
Hardware
Data-center
Middleware
Software

Why is Exascale different for Software?
■ Extreme power constraints, leading to:✓ clock rate similar to today’s systems✓ heterogeneous computing elements. Ex: IBM Power Cell✓Memory per {core | Flops} will be smaller✓Moving data will be expansive (time and power)
■ HW↦SW Fault detection/correction✓becomes programmer’s job
■ Extreme Scalability✓ 108 - 109 concurrent threads✓Performance is likely to be variable
‣ static decomposition will not scale
32
0
0.2
0.4
0.6
0.8
1
0 1000 2000 3000 4000 5000
Fa
ilin
g P
rob
ab
ility
F(t
)Number of processors
execution time: 1 dayexecution time: 5 daysexecution time: 10 daysexecution time: 20 daysexecution time: 30 days

HPC Applications Compatibility Roadmap
33
Thank you for your attention...
HPC ApplicationsApplication Traditional Traditional Energy efficient CC (C)ompute/(D)ata
(x86_64) +GPU ARMv7 intensive
Synthetic benchmarks
HPCC X TBI X X C+DHPCG X TBI X X C+D
Graph500 X TBI X X C+DFinite Element Analysis, Computational Fluid Dynamics software
LS-DYNA X TBI TBI X C+DOpenFOAM X TBI TBI X C+D
Molecular dynamics applications
AMBER X X TBI X C+DNAMD X X TBI X C+D
Bio-informatics applications
GROMACS X X X X C+DABySS X ⇥ X X C+D
mpiBLAST X ⇥ alt.: GPU-BLAST X X DMrBayes X ⇥ alt.: GPU MrBayes X X C
Materials science software
ABINIT X X X X C+DQuantumESPRESSO X XQE-GPU X X C+D
Data analytics and machine learning benchmarks
HiBench/Hadoop X TBI X X D
33 / 26V. Plugaru, S. Varrette, P. Bouvry (PCO Group, University of Luxembourg) Performance Analysis of Cloud Environments
N

Rethinking Parallel Computing
■ Today’s execution model might be obsolete✓Von Neumann machine
‣ Program Counter, Arithmetic Logic Unit (ALU), addressable memory✓Classic vector machine, GPUs w. collec. of threads (Warps)
■ Plan change in the execution model:✓ no assumption on performance regularity
‣ not unpredictable but imprecise✓ synchronization is costly: don’t make it desirable✓Memory operation are costly: move operations to data?✓Represent key HW operations, beyond simple ALU
‣ Remote update (RDMA), Remote atomic op. (compare & swap)‣ Execute short code sequence (active messages, parcels…
34

Challenges for Programming Models
■ Probably successful: MPI, Map-Reduce■ Still pending challenges for exascale:✓provide a way to coordinate resource allocation✓ clean way to share data with consistent memory models✓Mathematical Model Guidance
‣ continuous representation, possibly adaptative‣ lossy (within accuracy limits) yet preserving essential properties
✓Manage code by Abstract Data Structure Language (ADSL)✓Adaptative with a multi-level approach
‣ lightweight, locally optimized vs. intra node vs. regional‣ may rely on different programming models
35

Conclusion
■ Still a long way to go ;)
■ Questions? 36
Reduced Power Consumption
new [co-]processors, interconnect…
PUE optim. DLC…
Virtualization, RJMS…
New programming/execution models
Hardware
Data-center
Middleware
Software