“hows” of quality for remote sensing data user- a house of ... · “hows” of quality for...
TRANSCRIPT

INTERNATIONAL JOURNAL OF GEOMATICS AND GEOSCIENCES
Volume 6, No 3, 2016
© Copyright 2010 All rights reserved Integrated Publishing services
Research article ISSN 0976 – 4380
Submitted on January 2016 published on February 2016 1708
“Hows” of quality for remote sensing data user- A house of quality
approach Yogdeep Desai1, Kartikeyan B2, Nilam Panchal3
1- Research Scholar, Rai University, Ahmedabad
and Scientist, Space Applications Centre (ISRO), Ahmedabad
2- Scientist, Space Applications Centre (ISRO), Ahmedabad
3- Research Supervisor, Rai University, Ahmedabad
Associate Professor, BK School of Business Management, Gujarat University, Ahmedabad
ABSTRACT
House of Quality (HOQ) is the first phase of Quality Function Deployment (QFD)- A Total
Quality Management (TQM) technique of translating customer expectations-Voice of
Customer (VOC)- into product specifications-Voice of Technician (VOT). The QFD has been
successfully used by manufacturing sector in new product development. This paper
demonstrates how the requirement of user of scientific product like Remote Sensing Data
Product (RSDP) can be translated to technical specification through HOQ, the most crucial
phase of QFD. The paper lists out the organs of HOQ, their significance and also lists out the
quality parameters of RSDP. The paper explains the challenges of defining quality of RSDP
as perceived by the RSDP user owing to its 4-dimensional dependency- its intended use,
satellite, sensor and data product generation. However, first-ever attempt to use HOQ to
understand “Hows” of Quality for RSDP users concludes with optimism about the usability
of this technique which will help in customizing the product to suit user requirement and
increase its utilization in decision-making process related to management of natural resources.
Because the fulfilling of user requirement extend beyond the scope of just the data product
generation process, a broader study encompassing other dimensions need to be undertaken.
Keywords: Quality function deployment, house of quality, TQM, remote sensing
1. Introduction
One of the orthodox definitions of Quality Product is “conformance to specification” which
has been utilized for long time by Quality Departments. This was based on the assumption
that if a product meets the laid down specifications, it is bound to satisfy the customers (Juran
& Godfrey, 1999). The roots of this assumption can be attributed to two aspects prevailing in
those days. The first of which is that the Quality of a product was considered to be the
responsibility of Quality Department and secondly this department rarely had direct contact
with the customer. It was a closed loop interaction between the production team and the
Quality Department team.
The evolution from Quality Control to the Total Quality Management (TQM) philosophy
changed the definition of product quality and the centre of its responsibility. Definitions like
“fitness for use” (Juran & Godfrey, 1999) shifted the focus of quality definition from product
specification to the suitability for its intended use by the customer. In terms of TQM
adoption, the companies which follow the “conformance to specification” quality-standard
have been categorized as “Uncommitted” (Dale, 2003). Thus the advent of TQM has changed
the manner in which the organization pursue Quality. Organizations which are on the path of

“Hows” of quality for remote sensing data user- A house of quality approach
Yogdeep Desai et al.,
International Journal of Geomatics and Geosciences
Volume 6 Issue 3, 2016 1709
TQM have recognized the importance of imbibing Quality into the product right from its
design stage, based on the requirement of customer.
This ‘system of assuring that the customer-needs drive the product design and production
process’ is termed as Quality Function Deployment (QFD) (Chan & Wu, 2005). The first of
the four-phased QFD system, called the House Of Quality (HOQ), identifies the customer
needs of the product quality (Voice Of Customer-VOC) and translates it to technical
requirements (Voice Of Technician-VOT). This paper has developed HOQ for Remote
Sensing Data Products (RSDP) which is generated from optical Earth Observation (EO)
sensors by taking inputs from Agricultural application scientists as well as from literature
survey.
2. Quality of Remote Sensing data product
The RSDP is a digital information generated from the reflected optical signal acquired by the
optical earth observation sensors onboard a satellite orbiting in space. The quality of RSDP is
tied to its end-use (Shen et al., 2010) and hence “one-size fits all” principle is not valid as far
as quality definition of RSDP is concerned. In addition to the application-dependency of
quality parameters of RSDP, the RSDP quality requirement is also controlled by the sensor
which acquires the data, the satellite which carries the sensor and the processes through
which the data is converted to a Product. The 4-dimensional premise about the quality of
RSDP is pictorially depicted in .
Figure 1: 4 D RSDP quality
The space-borne sensor is characterized primarily by four characteristics, the list and its
significance is as follows:
1) Spatial Resolution: It is the smallest size of an object which the remote sensing sensor can
detect from its orbit. The Linear Imaging Self Scanning-3 (LiSS-3) sensor onboard
ResourceSat-2 (RS2) satellite has a spatial resolution of 23.5m. It means that LiSS-3 can
image an object of size 23.5m on ground from its orbit.
2) Spectral Resolution: It is the capability of a sensor to record the various hue-component
from the feature on the ground. The spectral band specification of RS2 LiSS-3 sensor, which
carries four coloured filters (Bands), is as given in Error! Reference source not found..
3) Temporal Resolution: The satellite orbits around the earth in order to image the earth
surface. The motion of satellite is controlled in such a way that it passes over the same
geographical location after a fixed time interval. This fixed time interval after which the
satellite passes over the same geographical location of the earth is called its revisit capability

“Hows” of quality for remote sensing data user- A house of quality approach
Yogdeep Desai et al.,
International Journal of Geomatics and Geosciences
Volume 6 Issue 3, 2016 1710
or Temporal resolution. The LiSS-3 has a temporal resolution of 24 days (Resourcesat-2
Project Team, ISRO, 2011).
Table 1: Spectral Bandwidth of RS2 LiSS3 sensor
Band
Number
Spectral band width (in
micrometer) Hue
B2 0.52 - 0.59 Green
B3 0.62 - 0.68 Red
B4 0.77 - 0.86 InfraRed (IR)
B5 1.55 - 1.70 Short Wave InfraRed
(SWIR)
Source: (Resourcesat-2 Project Team, ISRO, 2011)
4) Radiometric Resolution: The remote sensing sensor is an electro-optical device which
records the intensity of a continuous (analogue) optical signal, reflected from the earth, in
discrete digital numbers (DN). This ‘sampling’ of Continuous signal into discrete numbers
require the sensor to be designed for pre-specified sampling-interval of the signal. This
sampling interval is termed as Radiometric Resolution or the Quantization (Q) of the remote
sensing sensor. A sensor with quantization Q-bits can sample the signal in 2Q levels and is
recorded as a positive digital numbers in the range from 0 to (one less than) “Q” power of 2.
LiSS-3 sensor has a 10-bit quantization and hence the number of levels in which it records
the signal is given by :
210=1024--------------------------------------(1)
Covering the digital numbers from 0 to 1023 (Levin, 1999).
The design specification of each of the above-listed characteristics of a sensor is determined
based on its intended use. A sensor which is launched to cater to crop monitoring or the one
which is launched for monitoring the movement of clouds or the one intended for Urban
planning can have very different specifications.
The acquisition of signal and its conversion into data product involves a hardware and a
software component. The optical remote sensing sensor is the camera-hardware carried by the
satellite which detects and records the sunlight reflected off the ground as it orbits the earth.
These signals are then processed digitally on ground systems to “pack” them into what is
termed as Remote Sensing Data Product. This is the software component which converts the
raw digital numbers, recorded by the sensor, into physical units which the application
scientists can utilize and interpret meaningfully. Thus the four dimensions on which final
quality of remote sensing data product (RSDP) depend are:
1. The features of the sensor;
2. The satellite on which it resides; which in-turn depend on the intended...
3. Application; the accuracy of which depends on the quality of...
4. Product generation process;
3. House of quality
Quality Function Deployment (QFD) is one of the Total Quality Management (TQM)
quantitative tools and techniques used to translate customer requirements and specifications
into appropriate technical or service requirements (Durga Prasad et al., 2010). Of the four
phases (Error! Reference source not found.) which the QFD approach comprise, the last three
“Hows” of quality for remote sensing data user- A house of quality approach
Yogdeep Desai et al.,
International Journal of Geomatics and Geosciences
Volume 6 Issue 3, 2016 1711
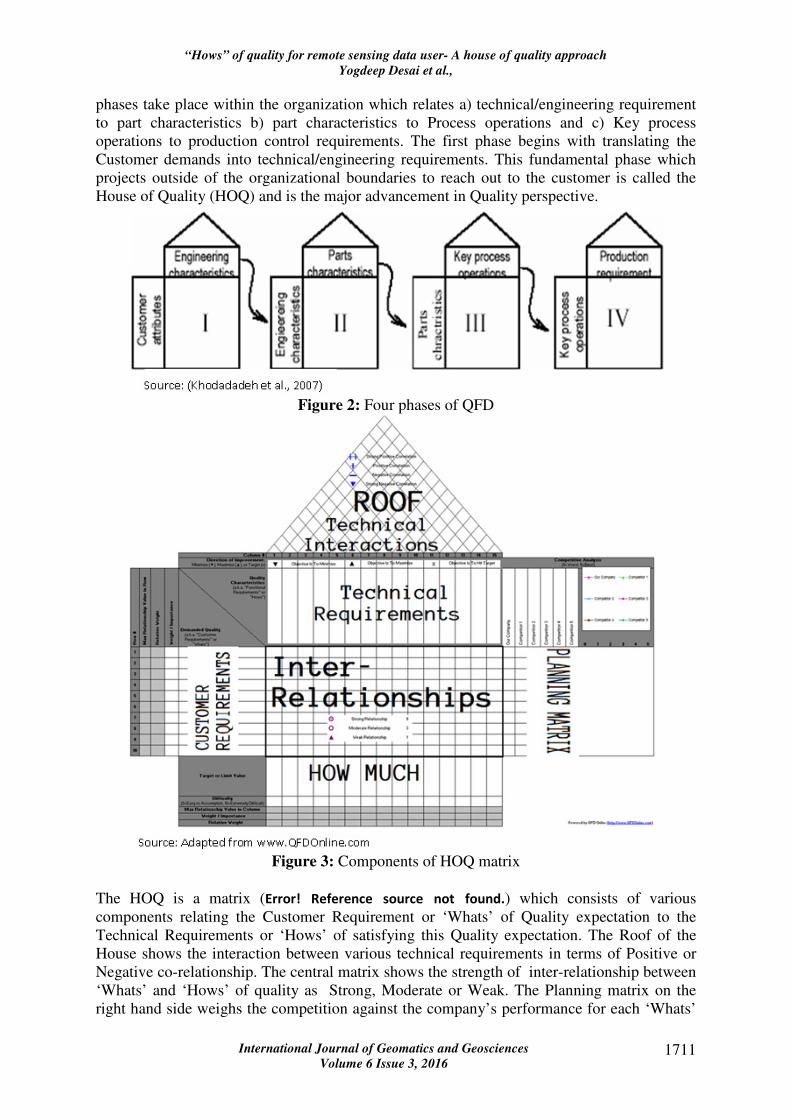
phases take place within the organization which relates a) technical/engineering requirement
to part characteristics b) part characteristics to Process operations and c) Key process
operations to production control requirements. The first phase begins with translating the
Customer demands into technical/engineering requirements. This fundamental phase which
projects outside of the organizational boundaries to reach out to the customer is called the
House of Quality (HOQ) and is the major advancement in Quality perspective.
Figure 2: Four phases of QFD
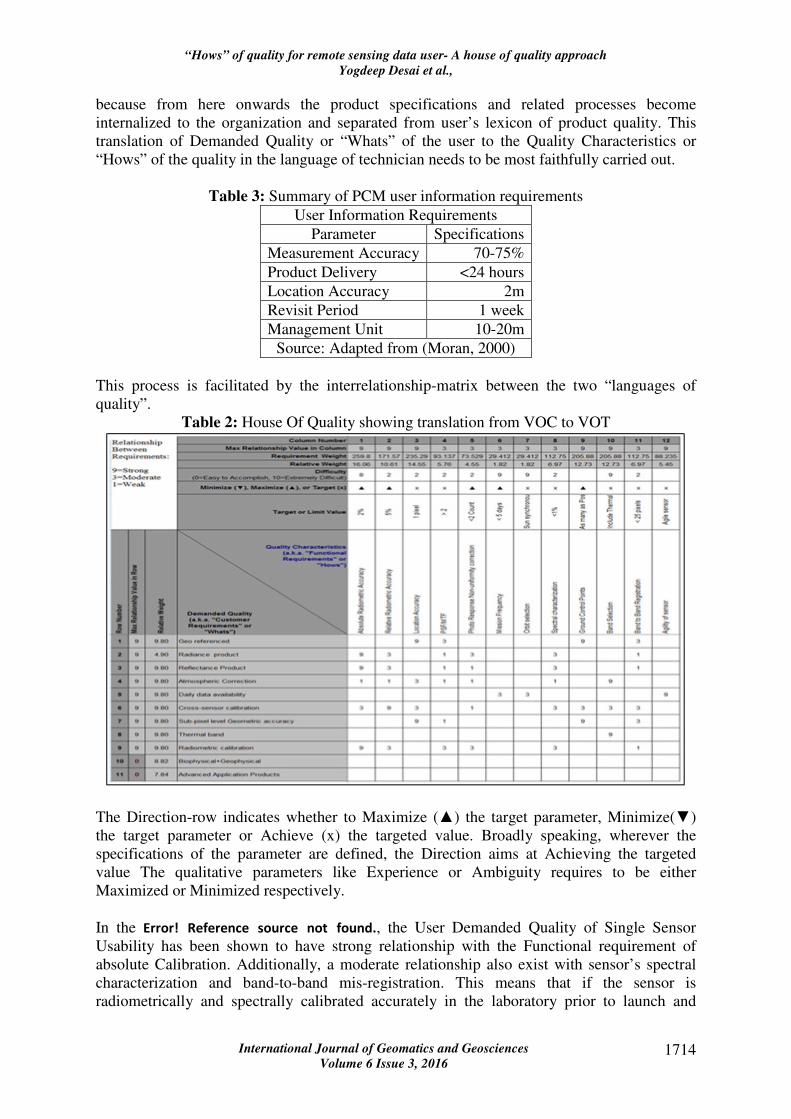
Figure 3: Components of HOQ matrix
The HOQ is a matrix (Error! Reference source not found.) which consists of various
components relating the Customer Requirement or ‘Whats’ of Quality expectation to the
Technical Requirements or ‘Hows’ of satisfying this Quality expectation. The Roof of the
House shows the interaction between various technical requirements in terms of Positive or
Negative co-relationship. The central matrix shows the strength of inter-relationship between
‘Whats’ and ‘Hows’ of quality as Strong, Moderate or Weak. The Planning matrix on the
right hand side weighs the competition against the company’s performance for each ‘Whats’

“Hows” of quality for remote sensing data user- A house of quality approach
Yogdeep Desai et al.,
International Journal of Geomatics and Geosciences
Volume 6 Issue 3, 2016 1712
from Customer’s perspective. The analysis of this can help in gaining competitive edge or
identify own inadequacy against the competition. The bottom most matrix specifies the target
values based on industry standards or the competitors. Hence it helps in setting an objective
target values in the form of ‘How Much’. There are various ways the House of Quality is
expressed (Hochman & O'Connell, 1993). However, there is no equivocalness in the purpose
served by HOQ.
3.1 Understanding the requirement of RSDP Customer
A high level committee formed by the Govt. Of India (Public Accounts Committee (2012-
13), 2012) to look into the matters of ‘Activities of National Remote Sensing Centre' based
on the C&AG Report No. 21 of 2010-11 (Performance Audit), relating to the Department of
Space (DoS) observed, among other things, that the NRSC failed to put sufficient efforts in
customization of data according to private users requirement. The first step towards
customization of any product is understanding the requirement of users (“Whats”) and then
incorporating these requirements into the product quality (“Hows”).
Customers of RSDP, unlike the customers of any other product, covers a very broad spectrum
of applications of remote sensing technology. Relating the ‘Whats’ and ‘Hows’ of Quality for
RSDP users/customers necessitate distinguishing the Customers of RSDP based on their end-
use of the product. This is because the ‘Whats’ and ‘Hows’ of RSDP strongly depend on the
use which the RSDP is put to by the customer (Shen et al., 2010).
The importance of understanding the user requirement as accentuated by TQM has been
realized by RS agencies even without making reference to TQM (Nieke & Reusen, 2007);
(Felbermeier et al., 2010). India being largely agricultural country (Oza et al., 2008), the
space program also focuses on the use of space technology for managing natural resources.
Also, the applications are developed by the scientists who are closely involved with the
Indian space program and subsequently these applications are transferred to various
departments (Ray et al., 2014) who are directly responsible for managing the natural
resources. Hence the requirements of ‘external’ customers are rendered by the ‘internal’
customers of RSDP.
This study uses House of Quality to understand the inter-relationship between user’s
expectation from the RSDP and its conversion to technical requirement. Simply put, this
study demonstrates House Of Quality approach of mapping the “Whats” of quality
requirement to “Hows” of Quality for RSDP users. The RS is a specialized field when
compared to any other industrial product and also it is difficult to specify the user
requirement for RSDP (Nieke & Reusen, 2007). As observed by (Deros et al., 2009), there is
no right or wrong ways to choose samples for measuring customers’ satisfaction surveys.
However, it is important that the samples are consistent with the evaluation objectives. With
this philosophy, the inputs on user requirements for Agricultural application was taken from
Agro-scientists with an experience of more than two decades. The inputs to HOQ were also
taken through literature survey.
4. House of quality for Agricultural application of RSDP
Two sources, input from application scientists involved in using RSDP for agricultural
applications and survey of literature related to utilization of remote sensing techniques for
various applications (Shen et al., 2010) (Oza et al., 2008) (Nigam et al., 2011) (Fox et al.,

“Hows” of quality for remote sensing data user- A house of quality approach
Yogdeep Desai et al.,
International Journal of Geomatics and Geosciences
Volume 6 Issue 3, 2016 1713
2011) (Ke & Dang, 2010) (FERENCZ et al., 2004) , were employed for understanding
customer requirement.
The inputs from these sources pointed to unthought-of aspects of the user expectations. In
addition to the Sensor specification and RSDP itself, the mode of dissemination of RSDP
also featured in the customer requirement, which is not covered in this study. The review of
various studies related to the use of RSDP in agricultural application shows that the users are
required to carry out pre-processing related to geometric, radiometric and atmospheric
correction on the supplied data (Ke & Dang, 2010), (FERENCZ et al., 2004). This implicitly
points to the user’s expectation of a ground Reflectance, geo-referenced product which can be
used for their application forthwith.
Following six components were included in building HOQ:
1. Customer requirements
2. Technical Requirements
3. Inter-relationships
4. Technical Interactions
5. Planning Matrix
6. Target matrix (How Much)
The requirement as received from customer/user is shown in Table 2
Table 2: Voice of Customer
One of the published study, concerning evaluation of RS technology for agricultural
management (Moran, 2000) , noted a gap between what user wanted and what products
provided, thus emphasizing the need to understand the user requirement. In the study, the
user information requirements (Error! Reference source not found.) is categorized under
various heads like Measurement accuracy, Product delivery, Location accuracy, Revisit
period, Spatial resolution.
The next step in HOQ analysis (Error! Reference source not found.) is translating the Voice of
Customer (VOC) to Voice of Technician (VOT) and attribute the inter-relationship between
the two voices as 1,3 or 9; 9 depicting strongest relationship between the demanded quality
and the Functional Requirement identified by the technical team. This is the most crucial step
“Hows” of quality for remote sensing data user- A house of quality approach
Yogdeep Desai et al.,
International Journal of Geomatics and Geosciences
Volume 6 Issue 3, 2016 1714
because from here onwards the product specifications and related processes become
internalized to the organization and separated from user’s lexicon of product quality. This
translation of Demanded Quality or “Whats” of the user to the Quality Characteristics or
“Hows” of the quality in the language of technician needs to be most faithfully carried out.
Table 3: Summary of PCM user information requirements
User Information Requirements
Parameter Specifications
Measurement Accuracy 70-75%
Product Delivery <24 hours
Location Accuracy 2m
Revisit Period 1 week
Management Unit 10-20m
Source: Adapted from (Moran, 2000)
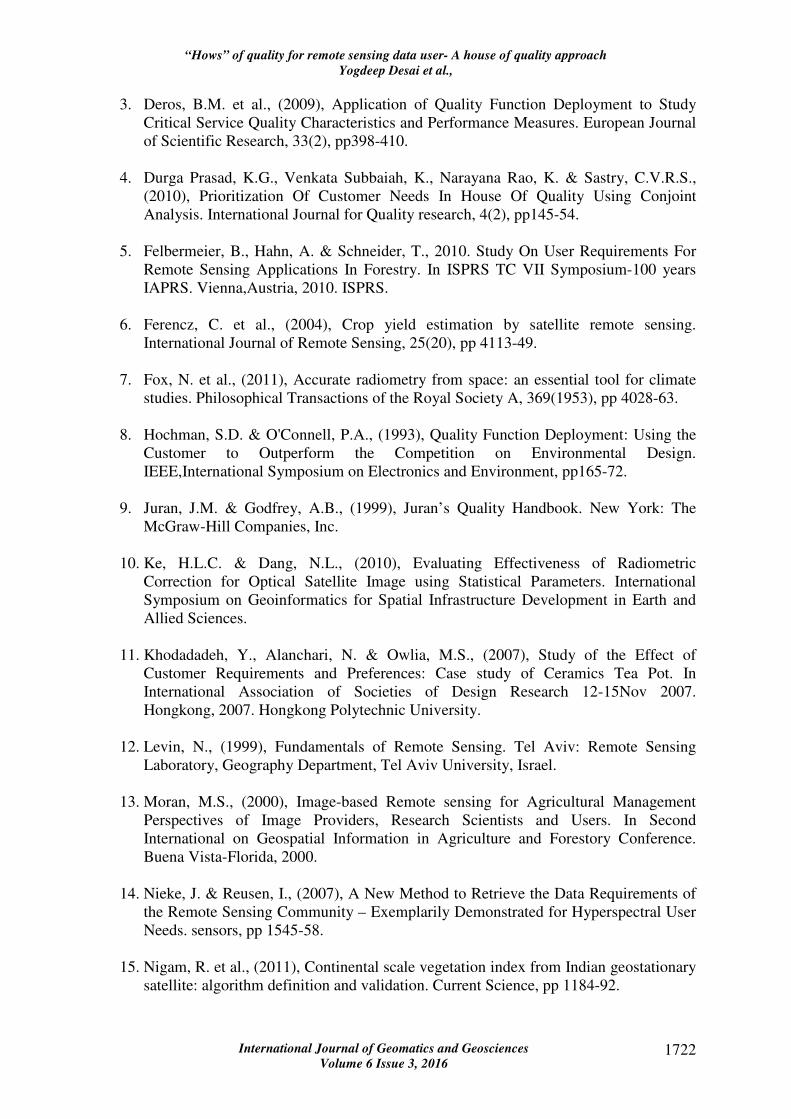
This process is facilitated by the interrelationship-matrix between the two “languages of
quality”.
Table 2: House Of Quality showing translation from VOC to VOT
The Direction-row indicates whether to Maximize (▲) the target parameter, Minimize(▼)
the target parameter or Achieve (x) the targeted value. Broadly speaking, wherever the
specifications of the parameter are defined, the Direction aims at Achieving the targeted
value The qualitative parameters like Experience or Ambiguity requires to be either
Maximized or Minimized respectively.
In the Error! Reference source not found., the User Demanded Quality of Single Sensor
Usability has been shown to have strong relationship with the Functional requirement of
absolute Calibration. Additionally, a moderate relationship also exist with sensor’s spectral
characterization and band-to-band mis-registration. This means that if the sensor is
radiometrically and spectrally calibrated accurately in the laboratory prior to launch and

“Hows” of quality for remote sensing data user- A house of quality approach
Yogdeep Desai et al.,
International Journal of Geomatics and Geosciences
Volume 6 Issue 3, 2016 1715
subsequently remains calibrated in absolute terms throughout the project life of the user, a
single Sensor data can be used for various Agricultural activities and hence bears a strong
inter-relationship between the “Whats” as demanded by the users and “Hows” as offered by
the technicians. However, the absolute radiometric calibration requirement has been assigned
relatively higher Difficulty index of 8 as it is difficult to maintain a accuracy target of 2% and
maintain it throughout the life time. On the other hand, the relative weightage given by the
user is also low. This situation can be comfortably used through the second demand-
Usability in conjunction with contemporary sensors- through another Quality Characteristics
- Relative Radiometric Calibration. If two sensors are cross calibrated, they can be used in
mutually exclusive manner for Agriculture application (Nigam et al., 2011).
The strong relationship with absolute calibration implies that the cross calibration will be
aided if the sensors are independently calibrated in terms of absolute radiometry. The Precise
Location can be achieved through Location Accuracy target of 1-pixel. Aesthetics and
Spectral Purity have been given maximum importance with values 7 and 6 respectively.
These two Customer Requirements identified as the most important rely on Photo Response
Non-Uniformity (PRNU) correction and Spectral characterization by the technical team
respectively. The aesthetics as well as spectral purity is also strongly related to band-to-band-
registration (BBR) quality. The Voice of Technician requires to control BBR in order to
satisfy the two most coveted demand of RSDP user. Also, ‘Aesthetics’ being higher on
importance scale, the detector-to-detector photo-response-non-uniformity, which is the major
cause of striping (Shen et al., 2010) requires to be characterized and corrected with utmost
accuracy. The spectral purity is the function of spectral filter and plays a crucial role in Cross
calibration of sensors with bands having identical bandwidth and coinciding central
wavelength but having different Relative Spectral Response (RSR). Instruments with
difference in spectral characteristics has its bearing on the results obtained through cross-
comparison of these sensors (Nigam et al., 2011).
The quality of RSDP as perceived by users is influenced by a) satellite- its position and
stability; b) sensors- in terms of available bands, spatial resolution, spectral characteristics,
calibration accuracy and ;c) Data product generation system: the use of geometric and
radiometric references, image processing techniques. Thus the Demanded Quality from a
RSDP User for a specific application is an amalgamation of satellite, sensor and product
generation processes. The parameter like Frequency of Data Availability is controlled by the
satellite orbit and frequency of launching the mission. It also partially depends on the agility
(the capability of a sensor camera system to be tilted in a specified angle) of the sensor. The
LiSS-4 camera onboard Resourcesat-2 can be tilted up to ± 26° in the across track direction
thereby providing a revisit period of 5 days (Resourcesat-2 Project Team, ISRO, 2011). The
mechanism is pictorially depicted in Error! Reference source not found.5.

“Hows” of quality for remote sensing data user- A house of quality approach
Yogdeep Desai et al.,
International Journal of Geomatics and Geosciences
Volume 6 Issue 3, 2016 1716
Figure 4: LiSS-4 repeativity obtained through tilting mechanism
The Geo-synchronous orbit has been found to give constant viewing geometry with respect to
earth targets. This, it has been reported (Nigam et al., 2011), is because the orbital drift in
polar orbiting sensors are absent in case of geostationary sensors. However the decision of
launching a satellite in Geo-synchronous orbit is very difficult as it affects the sensor-design,
the launching mechanism, and the product generation process. Similarly the inclusion of
Thermal Band is also a difficult decision to take which increases the satellite configuration
and data processing regimen.The translation of PCM-user requirement (
User Information Requirements
Parameter Specifications
Measurement Accuracy 70-75%
Product Delivery <24 hours
Location Accuracy 2m
Revisit Period 1 week
Management Unit 10-20m
Source: Adapted from (Moran, 2000)
) to specifications for RS system has been shown in
Table 5: Specifications for a RS system
5.
Table 5: Specifications for a RS system
Parameters Values
Algorithm Accuracy 70-75%
Turnaround Time <24 hours
Geo-registration Accuracy 1 pixel
Repeat Cycle 3 days
Pixel Size 2-5m
Source: Adapted from (Moran, 2000)
As against the researcher’s objective of 90-95% accuracy in measurement, the user
requirement is limited only to 70-75 %. Similarly the repeat cycle, rather than repeat period,
was found to be more appropriate parameter from user’s perspective due to the fact that the
later is contained by selection of orbit and repeat cycle often resulted in less than half of
repeat period due to cloud coverage and adverse atmospheric conditions.
In terms of product, the users looked for information on anomaly and its cause so as to spend
resources on decision making rather than identification of errors. A 100% reliability in
product dissemination was a preferred requirement with turn-around-time of less than 24
hours. In spite of having image and related information, a personal interaction with
researchers for its interpretation was also a preferred requirement. A validated image and
“deliver what is promised” were the logical expectations from users.
The “Planning matrix” of HOQ begins with analyzing the strength of competition with that of
organization’s product. The users input on Demanded Quality and the competition’s position
on each with respect to that of organization’s product is shown in Error! Reference source not
found..

“Hows” of quality for remote sensing data user- A house of quality approach
Yogdeep Desai et al.,
International Journal of Geomatics and Geosciences
Volume 6 Issue 3, 2016 1717
Table 5: Competitive Analysis
The pictorial depiction of competitive analysis for four sensors is shown in CA-plot Error!
Reference source not found.6.
Of the eleven parameters listed in Error! Reference source not found., the
Biophysical+Geophysical and Advanced Application products have been put in Level-3 and
Level-4 product category respectively by the user. This study aims at covering basic products
(Level-1 and Level-2) the accuracy of which will have its impact on subsequent levels of
product.
Figure 5: Competitive Analysis Plot

“Hows” of quality for remote sensing data user- A house of quality approach
Yogdeep Desai et al.,
International Journal of Geomatics and Geosciences
Volume 6 Issue 3, 2016 1718
The comparative pictorial representation (Error! Reference source not found.5 indicate relative
strengths and weaknesses among competing sensors and allows the technical team to focus
the efforts to improve upon the weak parameters, especially those with higher Importance
Index from User’s viewpoint. Restricting the analysis to Level-1 and Level-2 products, the
Landsat/MODIS seems to be excelling on all expectations followed by SPOT/Sentinel1A-1B.
However referring to the Error! Reference source not found., the GEO mission INSAT tops the
satisfaction index of the user. INSAT acquires data every half an hour, although with 1km
resolution. An important parameter on which the organization’s product has been rated
“Worst” is the non-availability of Thermal Band. Combined with the Importance index of 10,
it might be an effort worth putting for the technical team to ensure that Thermal band is
included in future missions. The next step in HOQ is analyzing the correlation between
various technical requirements to understand their inter-dependencies.
Termed as the Roof of HOQ (Error! Reference source not found.7), also called correlation
matrix, express the conflict or agreement between multiple quality characteristics which gives
another criterion to the technical team to decide on the allocation of resources. This
correlation matrix between characteristics along with the difficulty level and Importance
index of the user, aids the Technical team to select the quality characteristics and allot
optimum resource to meet or compromise the customer satisfaction.
The Absolute Radiometric accuracy is positively related to relative radiometric accuracy,
PSF/MTF, PRNU correction, and Spectral characterization. This means that improvement in
Absolute radiometric accuracy will result in improved Relative Radiometry. Nevertheless, the
user’s requirement on absoluteness of radiometry is lower (Table 2, (Moran, 2000)).
Similarly an accurate spectral characterization will result in better Absolute radiometry.
Table 7: HOQ Roof indicating correlation between Quality Characteristics

“Hows” of quality for remote sensing data user- A house of quality approach
Yogdeep Desai et al.,
International Journal of Geomatics and Geosciences
Volume 6 Issue 3, 2016 1719
The Band-to-Band registration (BBR) positively impacts the relative radiometry. This is
because, the spectral purity resulting from accurate BBR assists in cross-calibration of
sensors. The improved Location Accuracy, which has been rated highest (Error! Reference
source not found.6 and (Moran, 2000)) by users also has a positive impact on Relative
Radiometric accuracy. However, an agile mission satisfy increased frequency of data
availability can adversely affect the Location accuracy which can however be improved by
using more Ground Control Points and improved PSF/MTF of the sensor. The frequency of
data availability can be increased either by selecting GEO orbit or by launching constellation
of satellites with good relative radiometric accuracy. The BBR is negatively correlated with
number of bands because the presence of more number of bands will increase the probability
of mis-registration among bands. The PSF/MTF- a measure of spatial characteristics- is
positively correlated to radiometric as well as geometric accuracy and hence this parameter
needs to be precisely controlled. PSF/MTF quality itself is controlled by the accuracy with
which PRNU correction is carried out and are positively correlated. An precise PRNU
correction will reduce striping helping accurate spatial characterization and correction of the
sensor.
The first phase of QFD ends with a summarized analysis of HOQ. The summary lists out the
quality characteristics, the action to be taken, the target value and most importantly the
requirement weightage

“Hows” of quality for remote sensing data user- A house of quality approach
Yogdeep Desai et al.,
International Journal of Geomatics and Geosciences
Volume 6 Issue 3, 2016 1720
(
8).
The two most important parameters from the view point of requirement weightage are
Absolute Radiometric Accuracy and Location accuracy. The absolute radiometric accuracy
results in accurate reflectance product, which has a high importance index. The availability of
Ground Control Points impacts positively the Location accuracy and thus results in having
high Requirement Weightage. The inclusion of Thermal Band has also found high
Requirement Weightage followed by Relative radiometric accuracy.
Table 8: Summary Analysis of HOQ
Once the HOQ has been developed, the subsequent phases are contrived for implementation
by the organization. Second phase of QFD translates the characteristics into part
characteristics followed by identifying key operations. Lastly, these key manufacturing
“Hows” of quality for remote sensing data user- A house of quality approach
Yogdeep Desai et al.,
International Journal of Geomatics and Geosciences
Volume 6 Issue 3, 2016 1721
operations are assigned specific control requirements to insure reliability and consistent
quality.
5. Conclusion
Quality Function Deployment (QFD) has been successfully used in manufacturing sector in
optimizing the product development process through understanding the customer
requirement. The QFD begins with House of Quality (HOQ), arguably the most crucial phase
of QFD, which translates the Voice Of Customer (VOC) to Voice of Technician (VOT). This
study takes the HOQ approach to understand the requirement of RSDP users for the first
time. Of the many applications, the study focuses on agricultural application because in
country like India with large variety of geographical features and vast population to feed,
agricultural applications like crop forecasting and production monitoring through RS
technique is a fruitful strategy. During this endeavour, the peculiarity of defining RSDP
quality as against any other product and various agents of RSDP quality have been discussed.
The cyclical relationship-Application driving Specification driving RSDP driving Accuracy
of application- has also been highlighted.
The users of RSDP in agricultural application requires to carry out pre-processing of supplied
data related to geometric, radiometric and atmospheric correction. The users requirement of
accurate geo-referenced product translates to stable platform or availability of ground control
points. The VOT of accurate Absolute Radiometric Accuracy stems from the user’s demand
of a ground Reflectance product. The users in this study expect data on daily basis which is
evident from highest rating given to GEO sensor. These findings are in line with published
literature. Lastly, it is worth the effort to include Thermal Band to fully utilize the RSDP
capability.
5.1 Future scope
The application of RSDP for climate monitoring requires stringent quality requirements. A
similar study on translating Climate Quality data to corresponding technical requirement will
go a long way in monitoring the global warming phenomena. Additionally, a HOQ with a
holistic view of user requirements including method of data dissemination needs to be
developed.
Acknowledgement
The authors acknowledge the support from Director-Space Applications Centre (SAC) and
DD-Signal and Image Processing Area (SIPA) for carrying out research. The study would not
have been possible without unambiguous inputs from application scientists. Their
contribution to this study is thankfully acknowledged.
6. References
1. Chan, L.-K. & Wu, M.-L., (2005), A systematic approach to quality function
deployment with a full illustrative example. The International Journal of Management
Science, pp33 (2), 119-39.
2. Dale, B.G., (2003), Managing Quality. Malden,MA,USA: Blackwell Publishing Ltd.
“Hows” of quality for remote sensing data user- A house of quality approach
Yogdeep Desai et al.,
International Journal of Geomatics and Geosciences
Volume 6 Issue 3, 2016 1722
3. Deros, B.M. et al., (2009), Application of Quality Function Deployment to Study
Critical Service Quality Characteristics and Performance Measures. European Journal
of Scientific Research, 33(2), pp398-410.
4. Durga Prasad, K.G., Venkata Subbaiah, K., Narayana Rao, K. & Sastry, C.V.R.S.,
(2010), Prioritization Of Customer Needs In House Of Quality Using Conjoint
Analysis. International Journal for Quality research, 4(2), pp145-54.
5. Felbermeier, B., Hahn, A. & Schneider, T., 2010. Study On User Requirements For
Remote Sensing Applications In Forestry. In ISPRS TC VII Symposium-100 years
IAPRS. Vienna,Austria, 2010. ISPRS.
6. Ferencz, C. et al., (2004), Crop yield estimation by satellite remote sensing.
International Journal of Remote Sensing, 25(20), pp 4113-49.
7. Fox, N. et al., (2011), Accurate radiometry from space: an essential tool for climate
studies. Philosophical Transactions of the Royal Society A, 369(1953), pp 4028-63.
8. Hochman, S.D. & O'Connell, P.A., (1993), Quality Function Deployment: Using the
Customer to Outperform the Competition on Environmental Design.
IEEE,International Symposium on Electronics and Environment, pp165-72.
9. Juran, J.M. & Godfrey, A.B., (1999), Juran’s Quality Handbook. New York: The
McGraw-Hill Companies, Inc.
10. Ke, H.L.C. & Dang, N.L., (2010), Evaluating Effectiveness of Radiometric
Correction for Optical Satellite Image using Statistical Parameters. International
Symposium on Geoinformatics for Spatial Infrastructure Development in Earth and
Allied Sciences.
11. Khodadadeh, Y., Alanchari, N. & Owlia, M.S., (2007), Study of the Effect of
Customer Requirements and Preferences: Case study of Ceramics Tea Pot. In
International Association of Societies of Design Research 12-15Nov 2007.
Hongkong, 2007. Hongkong Polytechnic University.
12. Levin, N., (1999), Fundamentals of Remote Sensing. Tel Aviv: Remote Sensing
Laboratory, Geography Department, Tel Aviv University, Israel.
13. Moran, M.S., (2000), Image-based Remote sensing for Agricultural Management
Perspectives of Image Providers, Research Scientists and Users. In Second
International on Geospatial Information in Agriculture and Forestory Conference.
Buena Vista-Florida, 2000.
14. Nieke, J. & Reusen, I., (2007), A New Method to Retrieve the Data Requirements of
the Remote Sensing Community – Exemplarily Demonstrated for Hyperspectral User
Needs. sensors, pp 1545-58.
15. Nigam, R. et al., (2011), Continental scale vegetation index from Indian geostationary
satellite: algorithm definition and validation. Current Science, pp 1184-92.

“Hows” of quality for remote sensing data user- A house of quality approach
Yogdeep Desai et al.,
International Journal of Geomatics and Geosciences
Volume 6 Issue 3, 2016 1723
16. Oza, M.P., Pandya, M.R. & Rajak, D.R., (2008), Evaluation and use of Resourcesat-I
data for agricultural applications. International Journal of Applied Earth Observation
and Geoinformation, 10(2), pp194-205.
17. Public Accounts Committee (2012-13), 2012. Activities Of National Remote Sensing
Centre. Department of Space. New Delhi: Loksabha Secretariat.
18. Ray, S.S., Neetu, Mamatha, S. & Gupta, S., (2014), Food and Agriculatural
Organization.
19. Shen, H. et al., (2010), Universal reconstruction method for radiometric quality
improvement of remote sensing images. International Journal of Applied Earth
Observation and Geoinformation, 12(4), pp 278-86.