how winds are created the earth’s winds are caused by pressure differences across the earth’s...
TRANSCRIPT

How Winds are Created The earth’s winds are caused by pressure
differences across the earth’s surface due to uneven heating
Local Winds: During the day the air over the land is heated more than the air over the sea. Opposite during the night Day pattern: Wind blows from sea to land Night pattern: Wind blows from land to sea

How Winds are created
Global Winds: Occur due to greater heating of the air near the equator than the poles. Thus wind blows in the direction from the poles to the equator
Large ocean and land masses also affect the wind pattern
It is important to understand these wind patterns for the evaluation of potential wind sites

U.S. Wind Resource Map

Classes of Wind Power Density at 10 m and 50 m(a)
. 10 m (33 ft) 50 m (164 ft)
WindPower Class
Wind PowerDensity (W/m2)
Speed(b)
m/s (mph)Wind PowerDensity (W/m2)
Speed(b)
m/s (mph)
1 <100 <4.4 (9.8) <200 <5.6 (12.5)
2 100 - 150 4.4 (9.8)/5.1 (11.5) 200 - 300 5.6 (12.5)/6.4 (14.3)
3 150 - 200 5.1 (11.5)/5.6 (12.5) 300 - 400 6.4 (14.3)/7.0 (15.7)
4 200 - 250 5.6 (12.5)/6.0 (13.4) 400 - 500 7.0 (15.7)/7.5 (16.8)
5 250 - 300 6.0 (13.4)/6.4 (14.3) 500 - 600 7.5 (16.8)/8.0 (17.9)
6 300 - 400 6.4 (14.3)/7.0 (15.7) 600 - 800 8.0 (17.9)/8.8 (19.7)
7 >400 >7.0 (15.7) >800 >8.8 (19.7)

Modern Wind Turbine
Wind power systems are composed of: Tower Rotor with 2 or 3 blades (fiberglass reinforced
plastics, epoxy laminates Yaw Mechanism such as a tail vane Low-speed shaft, high-speed shaft, and gearbox
(Mechanical Drive Train) Electrical generator Speed sensors and controlModern wind power systems also include: Power electronics Control electronics Batteries to improve the load availability when in
stand-alone mode Transmission link connecting to the area grid

Characteristic of Wind Turbines
Variations in wind speed causes fluctuations in the amount of power produced Short Term: Gusts and Turbulence Long Term: Seasonal Changes
WTs have a cut-in, cut-out and a peak power output for a given wind velocity
Power from the wind is proportional to the area swept by the rotors
In practice, the max power efficiency is 45%

Global Picture

Source: GWEC (Global Wind Energy Council) 2008: http://www.gwec.net/fileadmin/documents/PressReleases/PR_stats_annex_table_2nd_feb_final_final.pdf
Wind Power

Source: GWEC (Global Wind Energy Council) 2008: http://www.gwec.net/fileadmin/documents/PressReleases/PR_stats_annex_table_2nd_feb_final_final.pdf
Wind Power

Source: GWEC (Global Wind Energy Council) 2008: http://www.gwec.net/fileadmin/documents/PressReleases/PR_stats_annex_table_2nd_feb_final_final.pdf
Top 10 total installed capacity
Top 10 added capacity (2008)

Total Installed Wind Capacity
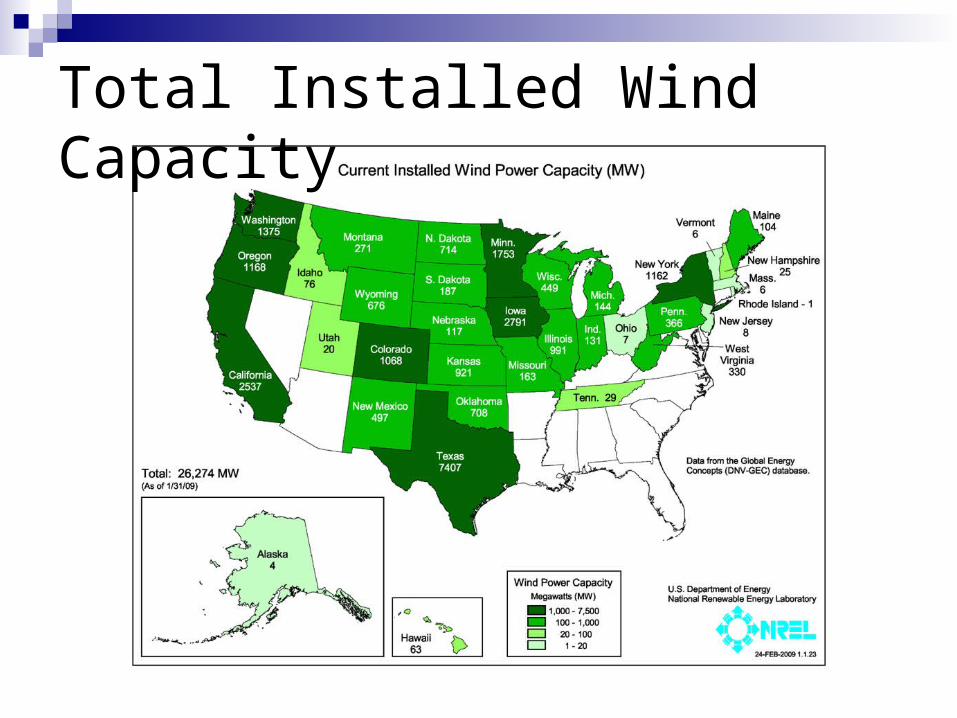
Total Installed Wind Capacity
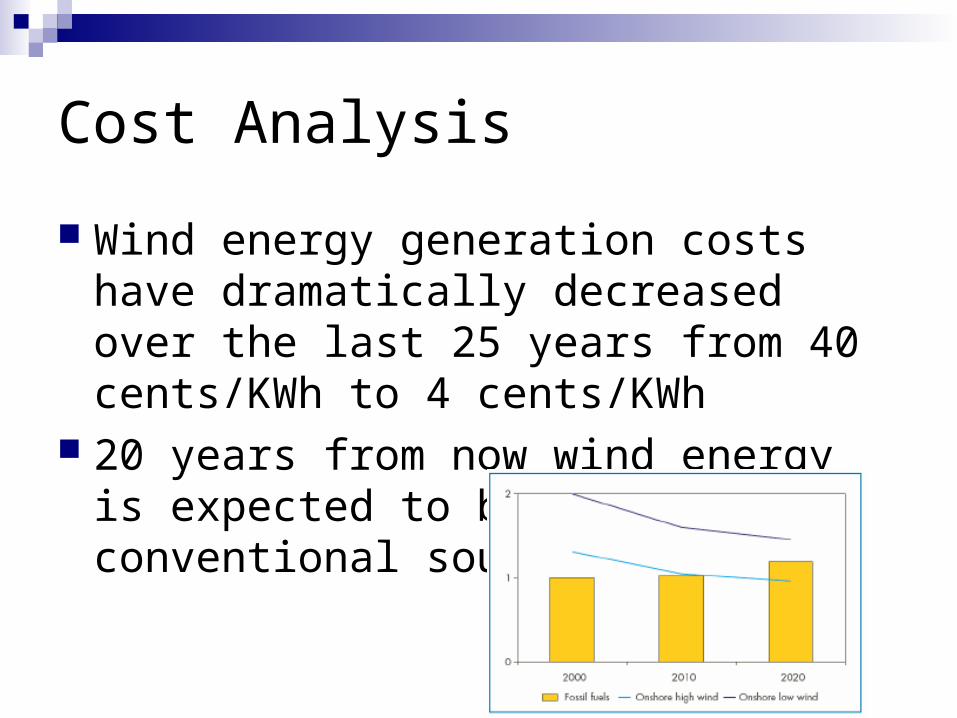
Cost Analysis
Wind energy generation costs have dramatically decreased over the last 25 years from 40 cents/KWh to 4 cents/KWh
20 years from now wind energy is expected to be cheaper than conventional sources of energy

Advantages and Disadvantages of Wind Turbines Advantages
Clean Source of Energy Unlimited Supply Popular with the Public
Disadvantages How do wind plants impact the power system grid
(Not enough data) Very expensive to install and connect to the power
grid

Wind Turbine Power:
P = 0.5 x rho x A x Cp x V3 x Ng x Nb
P = power in watts (746 watts = 1 hp)
rho = air density (about 1.225 kg/m3 at sea level, less higher up)A = rotor swept area, exposed to the wind (m2)Cp = Coefficient of performance (.59 {Betz limit} is the maximum theoretically possible, .35 for a good design) V = wind speed in meters/sec (20 mph = 9 m/s)Ng = generator efficiency (50% for car alternator, 80% or possibly more for a permanent magnet generator or grid-connected induction generator)Nb = gearbox/bearings efficiency (depends, could be as high as 95% if good)


Wind Turbine
Noise Levels

Electricity Demand Varies throughout the Day
Source: ERCOT Reliability/Resource Update 2006
Natural Gas
Nuclear
Coal
Total Coal Capacity

Wind and ERCOT daily load
0
0.2
0.4
0.6
0.8
1
1.2
1 2 3 4 5 6 7 8 9 10 11 12 13 14 15 16 17 18 19 20 21 22 23 24
No
rmal
ized
Hour Ending
Normalized wind
Normailized load
Source: Dispatchable Hybrid Wind/Solar Power Plant, Mark Kapner, P.E

ERCOT load duration curve 2007
ERCOT load Duration curve 2007
0
10000
20000
30000
40000
50000
60000
70000
0 1000 2000 3000 4000 5000 6000 7000 8000 9000 10000
hours
MW
nuclear
Coal
Wind
Source: Dispatchable Hybrid Wind/Solar Power Plant, Mark Kapner, P.E

Average hourly wind speed Jan.-Nov. 2008
Source: West Texas A &M University http://www.windenergy.org/datasites/1405-olfen/index.html
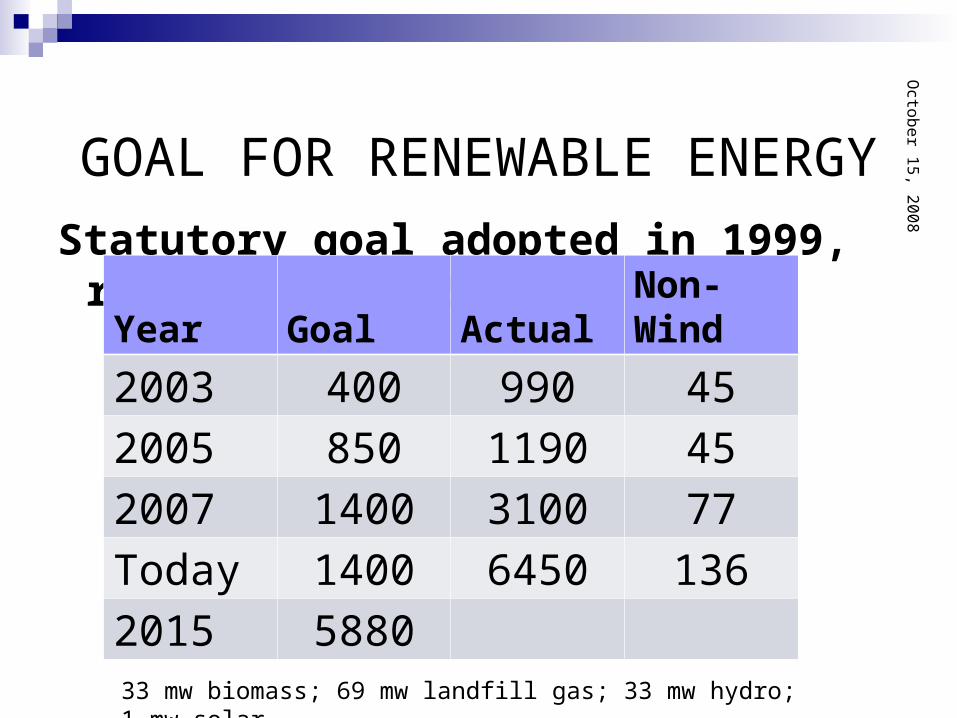
GOAL FOR RENEWABLE ENERGY
Statutory goal adopted in 1999, revised in 2005
Year Goal ActualNon-Wind
2003 400 990 45
2005 850 1190 45
2007 1400 3100 77
Today 1400 6450 136
2015 5880
Octo
be
r 15
, 20
08
24
33 mw biomass; 69 mw landfill gas; 33 mw hydro; 1 mw solar

CREZ SCENARIOSCapacity of New CREZ Wind by Scenario
(MW)
Wind ZoneScen.
1Scen.
2Scen.
3Scen.
4
Panhandle A
1,422 3,191 4,960 6,660
Panhandle B
1,067 2,393 3,720 0
McCamey 829 1,859 2,890 3,190
Central 1,358 3,047 4,735 5,615
Central West
474 1,063 1,651 2,051
Total* 12,053 18,456 24,859 24,419
* Assumes 6,903 MW of existing wind capacity
Octo
be
r 15
, 20
08
25

SCENARIO 2 TRANSMISSION PLAN
•1,705 miles of new 345-kV
double circuits
•453 miles of new 345-kV
single circuit
•371 miles of 345-kV
rebuild & upgrade
$4.9 billion cost, not including interconnection facilities
Octo
be
r 15
, 20
08
26
WHAT’S AHEAD FOR ERCOT WIND DEVELOPMENT Concern about over-development of West Texas wind
Development beyond CREZ plan could reduce market value of all West Texas wind production
In next few years, congestion between West Texas and population centers will be significant
ERCOT transition to nodal market has been delayed Concerns about reliability with high levels of wind
Forecasting wind, adequate thermal generation to match swings in load and wind generation, cost of load-following services
Se
pte
mb
er 1
0, 2
00
8
27