how to access notes 2 ways: –go to: –or –biology homepage, biology dept., undergrad link,...
TRANSCRIPT

HOW TO ACCESS NOTES
• 2 Ways:
– Go to: http://www.sfu.ca/biology/courses/bisc407/
– OR
– Biology homepage, Biology Dept., Undergrad link, Bisc 407 link

SOME INFO
• Textbook: The following textbook is recommended but not required: A Primer of Population Ecology, N. Gotelli
• In addition, copies of relevant original articles will be available via our website.
• Tutorial outline Each week, a portion of the tutorial will be allotted to discussion of and questions pertaining to the current lecture.

SOME INFO:II
• Article reports Each student will prepare 2 written reports on current journal articles of his/her choice. Reports should be less than 3 pages in length and typed if possible. Reports will be graded on (i) demonstration of understanding of the article, and (ii) quality of the written report. The following journals are suggested sources for articles:Ecology, Ecology Letters, American Naturalist, J. Animal Ecology J. Theoretical Biology, Oecologia, Theoretical Population Biology, Oikos, etc.
•

SOME INFO:III
Assignments Each student will be provided several problem sets during the semester. The sets are meant to provide "hands-on" experience with quantitative analysis. Completed assignments should contain all of the analysis. Final solutions alone will be judged insufficient. Late submissions will be docked 5% per day.

SOME INFO:IV
Mark distribution Midterm (Oct. 21) 25%Final Exam (Dec. 12) 45% Tutorial 10%Assignments 15%Reports 5%
Tutorials will be graded on overall contribution to tutorial discussion.

GRADE SCHEME
A+ A A- B+ B B- C+ C C- D F
>= 87 >=80<87
>=78.5<80
>=77<78.5
>=70<77
>=68.5<70
>=67<68.5
>=60<67
>=58.5<60
>=50<58.5
<50

POPULATIONS
• All individuals in a given area
• Group of interbreeding individuals at a given locality
• (Species - groups of actual or potential interbreeding populations)
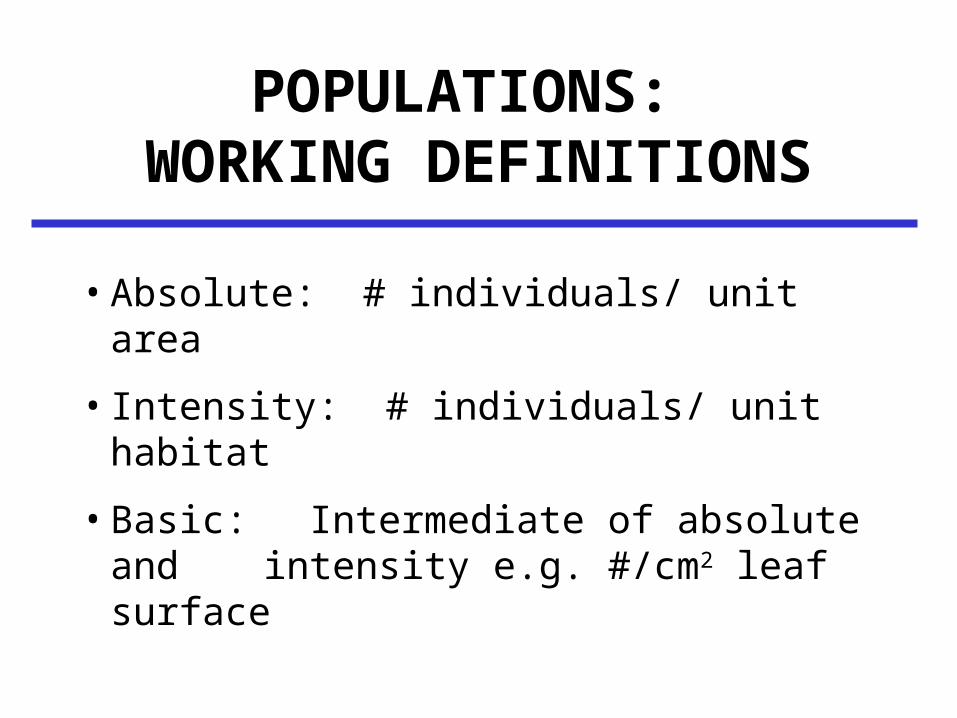
POPULATIONS: WORKING DEFINITIONS
• Absolute: # individuals/ unit area
• Intensity: # individuals/ unit habitat
• Basic: Intermediate of absolute and intensity e.g. #/cm2 leaf
surface

POPULATION TABLE
Day Adult Egg L1 L2 L3 Pupa Adult Egg L1
0 0 0
10 80 140
20 30 450
30 3 0 300
40 0 0 10 280
50 0 0 0 20 200
60 0 0 310
70 0 0 160 10
80 0 0 0 150 500
90 0 0 5 1100 170
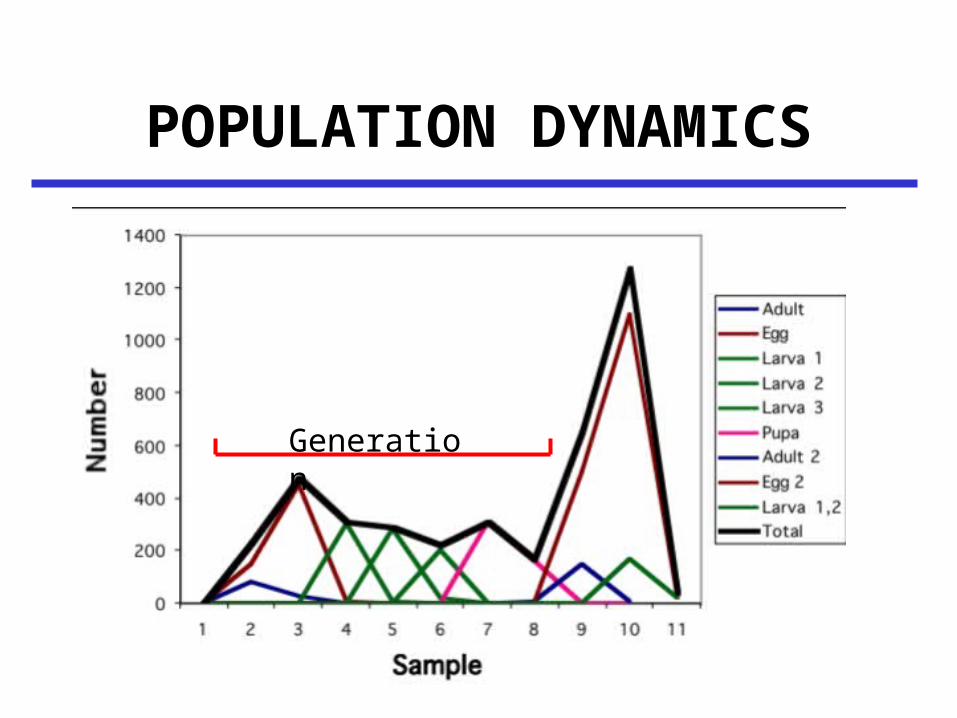
POPULATION DYNAMICS
Generation

POPULATION CURVES
• Total Population Curve: total number of individuals vs. time
• Partial Population Curve: # of individuals of each life stage vs. time

SIMULATION 1
• Three stages: egg(3), larva(3), adult(1)
• All individuals live full life
• Recruit eggs every day via random draw (0,20)
• Calculate number of insect-days

FULL LIFE EXPECTANCY
INSECT-DAYS= 952
PREDICT 952/7
= 136 ADULTS
OBSERVE 136 ADULTS

SIMULATION 2
• Three stages: egg(3), larva(3), adult(1)• All individuals live full life • Recruit eggs every day via random draw
(0,20)• Crisis with probability of 0.15/day• Each crisis kills 0.2 larvae • Calculate number of insect-days

INCLUDES CRISIS
INSECT-
DAYS = 633
PREDICT 633/7
= 91 ADULTS
OBSERVE
74 ADULTS

POPULATION DYNAMICS
G1