how sustainable are we and does it matter?. the february floods 14 - 17 february 2004 lower north...
TRANSCRIPT

How sustainable are we and does it matter?

The February Floods 14 - 17 February 2004Lower North Island and MarlboroughA number of rural communities had to be evacuated, and at the height of the emergency about 2,300 people had to leave their homes and farmsHalf the roads were closed & more than 20 bridge were damagedAround 2,600 farmers were affected with some having to abandon farming their propertiesEconomic Loss: Cost over $112 million in insurance payoutsgovernment granted $135 million in aid to farmers
Total economic impact est $400 million
Pohangina River Flood Damage

Bay of Plenty Floods July 2004Flood waters entered Te Teko and Edgecumbe, and swamped some 17,000 hectares of farmland. Followed by 30 Earthquakes.
200 people had to leave their homes, many sheltering in evacuation centreslandslides on saturated hillsidesmore than 450 farms were affected, with over 200 homes made uninhabitable
Economic Loss:Rural bill $45m for flood damageDamaged houses on a cliff in Ohiwa, Whakatane, on New Zealand's north island after the
collapse of an escarpment during the floods. Picture:Reuters

Photo: NOAA
Hurricane KatrinaHurricane KatrinaHurricane KatrinaHurricane KatrinaAugust 29, 2005August 29, 2005Most damaging storm in US historyMost damaging storm in US historyAugust 29, 2005August 29, 2005Most damaging storm in US historyMost damaging storm in US history
1000 deaths
1,000,000 environmental refugees
$125 billion in damages

Photo: Cameron Laird
Cyclone Larry Innisfail NQCyclone Larry Innisfail NQMarch 200655% of homes destroyedBanana crops wiped out$1billion in damagesConsumers paying $13 - $20 kg

Photo: Fairfax Photos
Sydney Hail Storm, 1999$1.6 bil insurred loss Total economic loss $2.2 bil


Victorian Bush Fires February 2009173 Deaths500 Injured72 Hospitalised78 Townships3,500 Buildings destroyed including 2029 homes 7562 homeless/displaced450,000 Ha Burnt

Drought one of the biggest costs to humanity...

NZ Drought cost $2.8 Billion
Nationwide drought between spring 2007 and autumn 2008 cost the New Zealand economy $2.8 billion ($1.9 billion on-farm and $900 million off-farm)
Current drought...
• Milk production down• Failed crops
Extreme weather patterns increasing
Failed Turnip crop in Kerikeri

Food Security Threatened Seed poisoning Bowen NQ • More than seven million seedlings
poisoned (tomato, capsicum melons, eggplant, zucchini and pumpkin)
• $23 million in lost production targets
• Local service providers $7 million loss
• Bowen community economic impact $50 - $100million
• This is the fourth mass poisoning of seedlings in the Bowen area since 2002. The last was in 2006. No-one has been caught.

So far, how are we doing?
Can we sustain this sort of loss???

The Economics of Climate Change…
Currently costing us 1% of GDP
If no action, could disrupt economic and social activity on a similar scale to that of the great wars and the economic depression of the first half of the 20th century that would be difficult or impossible to reverse.
If no change – cost between 5 – 20% OF THE GLOBAL GDPNOW AND FOR EVER.
Source: Stern Review on the Economics of Climate Change 2006
In Aust CSIRO suggest 3- 15% of GDP

Congratulations NZ on ETS• Not always popular but this is leadership that you will be thankful for in a
few short years – this is your time to innovate and get ahead of the curve.
• Debate over – even China is establishing an ETS.
• Good start to building a green economy. Green Economy in Europe now bigger than Aviation and Pharmaceuticals.
• We have to do more with less.
• Congratulations Horticulture NZ target to double food production by 2020 (ahead of world expectations to double outputs to feed growing population by 2050).
• Influx of Aussies?

How clean and green is NZ in the eyes of the world?
• NZ no longer in race to be carbon neutral country. Tuvalu, Maldives and Costa Rica reaffirmed their commitment to carbon neutrality by 2019, 2020 and 2021 respectively. Tuvalu expects to reach its goal by replacing imported diesel with solar and wind power. Costa Rica is relying heavily on tree planting. Norway is aiming to be zero-carbon by 2030. Antigua & Barbuda, Ethiopia, the Marshall Islands and Samoa all committed to carbon neutrality.
• Not included in UPS carbon neutral shipping program. The 35 countries and territories involved in program include: Argentina, Brazil, Dominican Republic, Mexico, Canada, Puerto Rico, Austria, Belgium, Denmark, Finland, France, Germany, Great Britain, Ireland, Italy, Netherlands, Norway, Poland, Portugal, Spain, Sweden, Switzerland, Australia, Hong Kong, Japan, Malaysia, Singapore, Taiwan, Thailand, India, Indonesia, Philippines, South Korea, China and Macau.

Some NZ communities, businesses and citiesincluded in certification programs
. Initially used in tourism and hospitality. Popular with wine industry.
EarthCheck Assessed to measure water, waste, energy CSR costs AUS$395
EarthCheck Certification once you meet acceptable benchmark AUD $2,800Average savings when using EarthCheck Energy 30%Water 20%, Waste streams 30% and Lower staff turnovers.

PAS 2050, the first standard method for calculating life cycle greenhouse gas (GHG) emissions of products–integrates product life cycle assessment with GHG emission accounting . Carbon Reduction Label provides companies with a certified, consistent and comparable way to display their products’ footprints, along with a commitment to reduce those footprints over time.
Fresh orange juice’s footprint of 360g CO2e is compared to long-life juice with a lower footprint of 240g CO2e; the Carbon Reduction Label also explains why the footprints differ, i.e. due to energy required to chill the fresh juice.

Tesco and the BSI PAS 2050Tesco plc is the third largest grocery retailer in the world. It employs over 440,000 people in 13 markets – 280,000 of those in the UK. Over 30 million people shop with Tesco worldwide every week.
Tesco represents the largest test of the BSI PAS 20501 draft product carbonfoot printing method and the Carbon Trust Carbon Reduction Label. Set in the context of the commitment from Tesco’s CEO to find a “universally accepted and commonly understood measure of the carbon footprint of every product we sell”. It started with light blubs, potatoes, washingdetergent and orange juice – now over 120 products. It identifies threestrategic priorities for tackling climate change:
Setting an example by measuring and reducing Tesco’s own direct carbon footprint. Using ‘resources and relationships to work with others to achieve a low carbon economy of the
future’. ‘Empowering customers to make environmental choices…by providing the information on which
to make an informed choice’.

Opportunity....New Guidelines and Standards
The future ISO 26000 standard giving guidance on social responsibility now Final Draft International Standard (FDIS) is expected to be out by the end of 2010.
• Press release - http://www.iso.org/iso/pressrelease.htm?refid=Ref1299
• Mini-site - http://isotc.iso.org/livelink/livelink/fetch/2000/2122/830949/3934883/3935096/home.html?nodeid=4451259&vernum=0
• Brochure - http://isotc.iso.org/livelink/livelink/fetch/2000/2122/830949/3934883/3935096/02_news/Depliant%20A4%20Social%20responsibility%20-%20E.pdf
• Free Draft of ISO/DIS 26000 - http://infostore.saiglobal.com/store/Details.aspx?ProductID=1137989

WBCSD and WRI developing two new standards
– Product Life Cycle Accounting and Reporting Standard – Scope 3 Accounting and Reporting Standards
It provides the accounting framework for nearly every GHG standard and program in the world - from the International Standards Organization to The Climate Registry - as well as hundreds of GHG inventories prepared by individual companies.
The GHG Protocol, a decade-long partnership between the World Resources Institute and the World Business Council for Sustainable Development, working with businesses, governments, and environmental groups around the world to build a new generation of credible and effective programs for tackling climate change.
Standards due to be completed by December 2010 http://www.ghgprotocol.org/standards/product-and-supply-chain-standard
Opportunity

Opportunity...Climate Change, GDP and
Measurement
• Global movement to look beyond GDP• Focus on people not just economies• Moving from production to well-being
Framework / Standard 2012http://www.eea.europa.eu/pressroom/speeches/2018beyond-gdp2019-accounting-and-climate-change

Ecosystem accounts highlight what is really happening to our stocks of bio-carbon
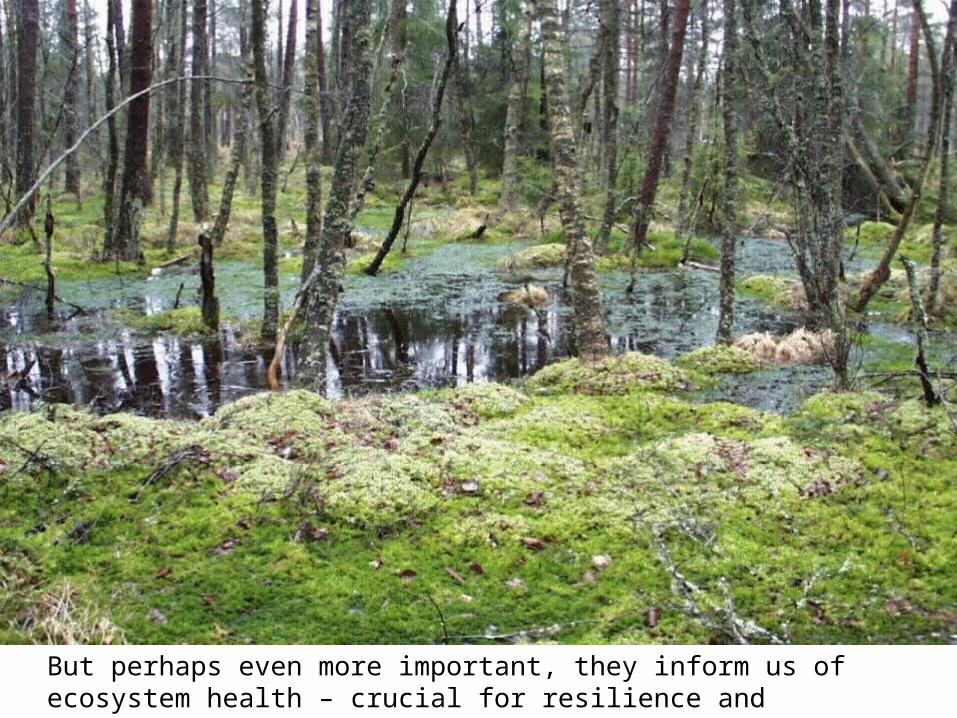
But perhaps even more important, they inform us of ecosystem health – crucial for resilience and adaptation to climate change impacts

Only by communicating in the same language as national accounts can environmental and social perspectives earn the same status

EcoSystems Valuation• First attempt to value ecosystems 10 years ago ecosystems were valued at US
$33 trillion almost twice as high as global gross domestic product (GDP)
• Estimated the world loses natural capital worth between US$1.9 trillion and US$4.5 trillion each and every year. Ecosystem degradation is becoming a sustainability issues for business and society at large.
• Some estimates suggest payments for ecosystem markets for products from certified forests could grow from an estimated US$15 billion in 2010 to around US$50 billion in 2050. Certified agriculture (inc hort) could grow from US$42 million in 2005 to around US$97 billion in 2012 and US$900 billion in 2050.
• Organic production is now the world's fastest-growing food sector.
• WBCSD suggest 10 reasons why business should employ corporate ecosystem valuation as a decision-support tool to improve operational efficiency and or develop new business opportunities whilst reducing environmental impacts or footprint and build your ecosystem assets.

Benefits of Ecosystem Valuation
1. Improves business decision making
2. Capturing and pricing new income streams
3. Saving costs and avoided expenditure
4. Reduces taxes
5. Sustain revenues
6. Revaluing assets
7. Investigating new goods and services
8. Assessing liability and compensation
9. Measuring company and share value
10. Reporting performance

WBCSD Vision 2050 – The new agenda for business.


Advantage being forced to measure your footprint...
Consider carbonneutrality offset with your own carbon Credits…
Put pressure on yoursuppliers…to help you achieve greater success

Lifestyles of Health & Sustainability [Acronym: LOHAS]– 100 million+ people in developed countries
Worth: US$500b+ global market

LOHAS Market Categories

Mainstream – Not fringe or marginalisedDefy typical demographic & psychographic stereotypes
Values driven & this is reflected in their purchasing choices

Actively seeking Valid, Transparent and Authentic InformationDislike spin & hype & untrusted opinions & sources
Certification and labelling becoming the norm

75% consider environmental and social aspects in deciding what to buy; 1/3 are willing to pay more for those benefits “Sustainability: The Rise of Consumer Responsibility” Report, The Hartman Group, Jan 09
35% of U.S. consumers say they would pay more for environmentally-friendly products Mintel survey, March 2010
80% of consumers are interested in some type of green product. LOHAS Consumer Trends Database® study, drawing from research conducted among 50,000+ consumers
in over 20 countries, May 2010
32% of U.S. consumers, said they still look for or often buy green products. 2009 survey of more 1,000 U.S. consumers
More shoppers "systematically" purchased green products in 2008 than in 2007. 34% of Europeans (up 2% from 2007) say they would continue to systematically seek and purchase green products. Boston Consulting Group, January 2009 survey of 9,000 consumers in North America, Europe, China, and Japan
Consumer Attitudes

32% of U.S. consumers, said they still look for or often buy green products. 2009 survey of more 1,000 U.S. consumers
“Green” household products as a whole grew 71% in 2009 compared to 2.5% for
traditional household products. IRI 2009 data
84% “Willing to change lifestyle for the good of environment”
Why? 82% “It’s good for the environment” 78% “It helps future generations” 78% “It’s healthy” 78% “It’s the right thing’ to do” 73% “It fits with my morals or beliefs” Survey of 1000 Americans by Insight Research Group, HGTV, and the NRDC, Jan 08
Consumer demands for green products

Xxx
Latent
Greens
40%
Green
Consumers
27%
Inactive
23%
Green
Activists
10%
High
Activism
Low
Activism
High Willingness
To Pay
Low Willingness
To Pay
Environics 4th annual International Environmental Monitor Survey
Green Behaviour Segments

"Protecting the environment should be a priority, even if it causes slower economic growth and some loss of jobs“
Canada 76% agreed U.S.A. 64% agreedChina 82% agreed
“People should pay higher prices to deal with climate change”
Canada 54% agreedU.S.A. 41% agreed
Pew Global Attitudes Survey, Aug 2009
What the rest of the world think

Responsibility Capacity Index
Dr. Goran CarstedtSenior Director of the Clinton Climate Initiative, C40 Cities. He is chairman of The Natural Step International and engaged in the formation of the SOL Global Network dedicated to the "interdependent development of people and their institutions.” He is the former head of IKEA Retail Europe (1990–1997) and President of Volvo Svenska Bil AB.
http://stonehousesummit.com/goran-presentation
Global Peace IndexIn 4th year

How sustainable are you?
Does it matter?

This is the opportunity of a life time...

Questions?
For further information contact: