floods of january-february 1957 in southeastern kentucky ... · floods of january-february 1957 in...
TRANSCRIPT

Floods of January-February
1957 in Southeastern Kentucky and Adjacent Areas
GEOLOGICAL SURVEY WATER-SUPPLY PAPER 1652-A
Prepared in cooperation with the States of Kentucky, Virginia, West Virginia, and Tennessee and with agencies of the Federal Government

Floods of January-February 1957 in Southeastern Kentucky and Adjacent AreasFLOODS OF 1957
GEOLOGICAL SURVEY WATER-SUPPLY PAPER 1652-A
Prepared in cooperation with the States of Kentucky, Virginia, West Virginia, and Tennessee and with agencies of the Federal Government
UNITED STATES GOVERNMENT PRINTING OFFICE, WASHINGTON : 1964

UNITED STATES DEPARTMENT OF THE INTERIOR
STEWART L. UDALL, Secretary
GEOLOGICAL SURVEY
Thomas B. Nolan, Director
For sale by the Superintendent of Documents, U. S. Government Printing Office Washington, D.G. 20402

CONTENTS
Page Abstract __ ----_-___---__--________-_-____-_____-_--_-____-_---__ AlIntroduction-_____________________________________________________ 1Acknowledgments_ _______________________________________________ 5General description of floods______________________________________ 5
Rainfall._____________________________________________________ 5The floods__________...________________________ 5
Big Sandy River basin__________________________________-_. 8Little Sandy River, Tygarts Creek, and Licking River basins.-- 10Kentucky River basin____________________________________ 10Salt and Green River basins.______-_-____-_-______--_-____- 13Cumberland River basin___________________________________ 14Tennessee River basin___________-_-__-_-_-____--___-____-_- 18
Flood damage_____________________________________________________ 19Determination of flood discharges__________________________________ 25Stages and discharges at stream-gaging stations_______________________ 26
Explanation of data_______-____________-_-___-_-__--___-__---_- 26Summary of flood stages and discharges.__________-__-____-_----__-__ 27Flood frequencies...___--___--____________-___-_---_--__--_-------- 38Streamflow data.___-_-___--____-_____-____---_-__-_---___-_------- 40Index. ___________________________________________ 193
ILLUSTKATIONS
Page FIGURE 1. Map showing area of this report________________________ A2
2. Temperature variation at Hindman Settlement School,Hindman, Ky________________________________________ 2
3. Map showing location of flood-determination points_______ 44. Rainfall map January 27-February 2, 1957________________ 65. Discharge at selected gaging stations in the Big Sandy River
basin _______________________________________________ 86. Discharge at gaging stations in the Kentucky River basin. _ _ _ _ 117. View of washed-out bridge across the North Fork Kentucky
River at Hazard Airport, February 4, 1957______________ 128. Discharge at gaging stations on main stem upper Cumber
land River_________________-__-_____--_-__-_--____- 149. View of flooded Main Street and business district in Cumber
land, Ky., on January 29, 1957_________---___-__-_--- 1510. Aerial view of flooding in Barbourville, Ky., along Cumber
land River, at 2 p.m. January 30, 1957_______.__.___ 1611. Daily mean discharge of Cumberland River at Rowena, Ky.,
and net inflow to Lake Cumberland-___________________ 1812. Volume of water stored in TV A reservoir system. __________ 2013. Frequency of floods in Kentucky and Tennessee.__ ______ 39

IV CONTENTS
TABLES
Page TABLE 1. Damage in the Big Sandy River basin, Kentucky, Virginia,
and West Virginia.___________________________________ A212. Damage in the Licking, Kentucky, and Green River basins, in
Kentucky. __.____________.___..__________ 223. Rural damage along Ohio River main stem and in Wabash
and Saline River basins, Ohio, Indiana, Illinois and Kentucky.__________________________________________ 23
4. Damage in the Cumberland River basin in Kentucky andTennessee ___________________________________________ 23
5. Damage at selected locations in upper Tennessee River basin,in Virginia and Tennessee-________--___--___----_____- 24
6. Summary of damage by stream basin and by State, flood ofJanuary-February 1957_ ___-___--_____-____-__-_______ 24
7. Expenditures by American Red Cross in southeasternKentucky ___________________________________________ 25
8. Summary of flood stages and discharges during the flood ofJanuary-February 1957._--__-_-_--____--__-----_-___- 28

FLOODS OF 1957
FLOODS OF JANUARY-FEBRUARY 1957 IN SOUTHEASTERN KENTUCKY AND ADJACENT AREAS
ABSTRACT
Heavy rains over an extensive area on January 27-February 2, caused ex treme flooding in southeastern Kentucky and adjacent areas in West Virginia, Virginia, and Tennessee. Total rainfall for the storm period ranged from 6-9 inches over most of the report area and was 12% inches at the eastern end of the Virginia-Kentucky State line.
The principal basins affected by.the storm were those of the Big Sandy, Kentucky, Cumberland, and Tennessee Rivers.
Maximum discharge of record occurred in many streams. On Levisa Fork near Grundy, Va., the peak discharge of 33,200 cfs was 50 percent greater than the previous maximum in 17 years of record and was 3.3 times the mean annual flood. The peak discharges on tributaries of the Kentucky River and on the Holston and Clinch Rivers were also .the greatest of record and those on the upper Cumberland River were* nearly as great as .those during the historic floods of 1918 and 1946.
Total flood damage was estimated at .$61 million of which $39 million was in the Big Sandy River basin (mostly in'Kentucky) and $15 million was in the Kentucky River basin $52 million of the total damage was in Kentucky.
INTRODUCTION
Devastating floods occurred on the -streams of southeastern Ken tucky, southwestern West Virginia, western Virginia, and north eastern Tennessee in late January and early February 1957. The areas hardest hit included the headwaters of the Big Sandy, Ken tucky, Cumberland, and Tennessee River basins (fig. 1).
The first 3 weeks in January were drier than normal, but, just prior to the flood, streams were at near-median levels and the ground was saturated due to 1-2 inches of rain a week earlier. The flood was attributable to these antecedent conditions and to the runoff gener ated by precipitation ranging from 4-9 inches during the period January 27-February 2.
Temperatures at the beginning of the storm were above normal and remained so during the period of heavy rainfall. Figure 2 shows variation in temperature at the Weather Bureau station, Hindman Settlement School, Hindman, Ky., near the center of the
Al

A2 FLOODS OF 1957
Area of serious flooding
Boundary of area covered by this report
FIGURE 1. Map showing area of this report.
TEMPERATURE, IN DEGREES FAHRENHEIT
H-« !- ro <*> J> cn CTI v ooooooooc
L
11
5 10 15 JANUARY
20 25 31
1
5 10 1. FEBRUARY
FIGURE 2. Temperature variation of Hindman Settlement School, Hindman, Ky., January 1-February15,1957.

FLOODS OF JANUARY-FEBRUARY 1957 IN KENTUCKY A3
area of greatest flooding. Generally, temperatures began to rise on January 18 when the ground in most parts of the area was frozen to a shallow depth and there was !/£-2 inches of snow on the ground. Thawing and melting occurred during the earlier rains on January 21-23.
Peak stages and discharges along Levisa Fork, the headwater tributary of the Big Sandy Eiver, and its tributaries were the great est of record except for those on tributaries in. the Paintsville, Ky., area and downstream. Similarly, maximum discharges occurred along the North, Middle, and South Forks of the Kentucky Eiver and most of their tributaries and in the Holston and Clinch Rivers. In the Green River basin precipitation was heavy in the area south east of Bowling Green, Ky., and maximum stage and discharge were recorded on Drakes Creek. The upper Cumberland River reached stages that were nearly as great as the historic floods of 1918 and 1946. Poor Fork, the headwater tributary of the Cumberland, and Laurel River had peaks that exceeded all previously known peaks.
This report on the floods is made for the purpose of:1. Presenting records of river stage and discharge in more detail
than that published in the annual series of reports on surface water entitled "Surface-water supply of the United States."
2. Collecting and recording information, other than stages and dis charges, pertinent to an analysis and understanding of the hy drology of the floods.
3. Recording the amounts of damages caused by the floods.4. Recording the comparative magnitude of the subject floods and
the known large floods of the past.The Geological Survey maintains, in cooperation with State and
Federal agencies, a network of stream-gaging stations where records of river stage and discharge are collected. The records thus col lected for stations in the flood area (fig. 3) are published herein.
Data collection was under the supervision of the following district engineers: F. F. Schfader, Kentucky; D. S. Wallace, Virginia; W. R. Eaton, succeeded by J. S. Cragwall, Jr., Tennessee; and W. L. Doll, West Virginia. R. H. Tice, flood specialist assisted on indirect meas urements of peak discharges and prepared the open-file release, "Floods of January-February 1957 in southwestern Virginia," which was in corporated in this report. Most of the text material, that for Ken tucky, was contributed by N. O. Thomas. Data from the four districts was assembled and text material coordinated to cover the entire flood area by J. O. Rostvedt under the direct supervision of Tate Dalrymple, Chief of the Floods Section.

^
Site
of
flood
det
erm
inat
ion
*"
Num
bers
cor
resp
ond
to t
hose
in
tabl
e of
floo
d st
ages
and
dis
char
ges
FIG
URE
3. M
ap o
f the
flo
od a
rea
show
ing
loca
tion
of f
lood
-det
erm
inat
ion
poin
ts.

FLOODS OF JANUARY-FEBRUARY 1957 IN KENTUCKY A5
ACKNOWLEDGMENTS
Records of discharge in the area covered by this report were col lected as part of the cooperative programs between the Geological Survey and the States of Kentucky, Virginia, Tennessee, and West Virginia; the Tennessee Valley Authority; and the Corps of Engineers.
The isohyetal map was prepared from data furnished by the Tennessee Valley Authority and by the Weather Bureau. Damage figures were furnished by the Corps of Engineers.
Acknowledgment of other data furnished is made where the data appears in the report.
GENERAL DESCRIPTION OF FLOODS
RAINFALL
The heaviest rainfall during the storm period, January 27- February 2, occurred in the Pikeville-Haysi area in Kentucky and along the Tennessee-North Carolina State line. Total rainfall for the period ranged from 6 to 9 inches over much of the area (fig. 4). Based on available records, bucket surveys, and other reports, the greatest total rainfall for the period January 27-February 1, was 12i/£ inches in the headwater area of the Middle Fork Kentucky River, a few miles from the Cumberland River drainage divide.
The low density of established rainfall stations in the area cannot be expected to define the variations resulting from strong orographic influences in the mountainous region. Bucket surveys were made in an attempt to fill the gaps, but these were only partly successful be cause catchments or other containers normally found on farms over flowed during the heavy storms. Also, it was difficult to distinguish rainfall caught antecedently, during the period January 21-23, from that of the main storm period. Similarly, trailing-off precipitation during the later general storm period, February 5-10, was difficult to distinguish in analyzing bucket-survey data.
THE FLOODS
The disastrous floods of January-February 1957 in southeastern Kentucky and adjacent areas were the result principally of heavy precipitation and of saturated ground at the beginning of the storm period on January 27. Severe flooding occurred in the headwater areas of the Big Sandy, Kentucky, Cumberland^ and Tennessee Rivers.
The region of severest flooding was in Kentucky, which is char acterized by narrow, deep valleys. The main highways, railroads, business establishments, and homes are built along the river banks or are confined to the relatively narrow floodplains. The flood rises were

>
FIG
URE
4. M
ap o
f flo
od a
rea
show
ing
isoh
yets
, in
inch
es, f
or th
e st
orm
of J
anua
ry 2
7-Fe
brua
ry 2
,195
7.

FLOODS OF JANUARY-FEBRUARY 1957 IN KENTUCKY AT
so rapid that many residents had to flee from their homes without their belongings. Communications were disrupted in many areas so that no flood warning was received or there was some question as to the reliability of the flood heights expected. Early warning might have prevented much damage to personal property, particularly to stocks and supplies in business houses. Food shortages developed as the re sult of extensive damage to stores. In some cities, and towns, water supplies were contaminated and there was no gas for cooking. Ap proximately 7,700 telephones and 103 long-distance circuits were out of service. Electric power was disrupted, but generally, service was restored sooner than for other service's.
In Kentucky the death toll was nine persons. The Red Cross re ported that 597 homes were destroyed, 2,932 substained major dam age, and 8,740 suffered minor damage. At least 30 State and Federal highways were blocked by high water or rock and earth slides. Most of the secondary roads on hillsides above the flood levels were ren dered impassable by the heavy rains.
Ample food and other relief supplies were made available by Fed eral and State agencies and by the Red Cross and other organizations. Flooding and damage to highways made it difficult to distribute the supplies to the people. The Army assigned a group of 14 helicopters to transport food, medical supplies, and clothing into the stricken area. The group was headquartered at London, Ky., along with Army Engineer and Transportation contingents from Fort Knox who were also employed in the distribution of supplies and in relief activities. Units of the National Guard were called to duty to distribute relief supplies, to perform security duties, and to assist in cleanup work.
President Eisenhower .declared the flooded region a disaster area, thus mobilizing Federal agencies and making funds available for relief and rehabilitation. The Federal Civil Defense Administration coordinated the relief and rehabilitation work of Federal agencies.
States agencies reported that 90 percent of the coal mines in Pike, Floyd, Letcher, and Perry Counties in Kentucky were forced to close because of the water, disrupted communications, washed-out roads, or damaged railroad beds. Approximately 900 mines and manufac turing industries employing 28,000 persons in the 12 counties hardest hit either shut down or curtailed operations.
Many schools were closed due to damage or to the disruption of transportion. Several small rural school buildings were destroyed. The most serious school damage -was that to the State Vocational School at Hazard, Ky., in Perry County, which was estimated by State officials to be $373,000 and termed "almost a total loss." Dam age to other schools in the county totaled about $85,000. Damage to

A8 FLOODS OF 1957
schools in Floyd County was the next highest, being estimated at $308,000.
Scores of cable-suspended footbridges, used to provide access to highways from residences located on the opposite bank of streams, were destroyed or damaged by the flood. Ninety-six of these bridges in the Kentucky River basin and approximately 140 in other basins of the area affected by severe flooding were lost.
BIG SANDY RIVER BASIN
In the upper reaches of Levisa Fork, the headwater tributary of Big Sandy River, the flood exceeded the previously known maximum of 1862. Levisa Fork and its large tributary, Russell Fork, have their sources in Virginia. The crests of both streams arrived at the mouth of Russell Fork at about the same time and contributed to the sharp ness of the rise and extreme gage height downstream. The rapidity of the rise is illustrated by the discharge hydrograph for Levisa Fork at Pikeville, Ky. (fig. 5). The stream rose from about 18 feet on January 29 to a crest of 52.72 feet early on January 30, which ex ceeded the stage of about 52 feet recorded for the flood of 1862.
V\Big Sandy River
at Louisa, Ky.
\
\ Levisa Fork at V^Paintsville, Ky.
\\
/\
27 28 29 30 31 1 JANUARY
23456 FEBRUARY
FIGUEE 5. Discharge at selected gaging stations in the Big Sandy River basin January 27-February 6,1957.

FLOODS OF JANUARY-FEBRUARY 1957 IN KENTUCKY A9
The peak stage on January 31, 1957, at Paintsville, Ky., was about seven-tenths of a foot lower than that of the flood in 1862 but ex-
. eeeded the previous maximum in 31 years of record by 3.8 feet.Figure 5 also shows discharge hydrographs for Levisa Fork at
Paintsville, Ky., and for Big Sandy Eiver at Louisa, Ky. The time interval between peaks of the three gaging stations was not great.
Pikeville was almost entirely under water -for the first time since 1862 at the height of the flood. *The maximum stage in 21 years of record (42.9 ft. in 1946) was exceeded by almost 10 feet. Water stood 3 feet deep or more in Main Street business houses and as much as 9 feet deep in some stores on other streets. Much food was contami nated and food shortages developed. Drinking water became pol luted. Highways were submerged and the town was isolated. Police estimated that 400 automobiles were submerged. Telephone service was disrupted by the flood but was partially restored for emergency use as the waters receded.
More than 250 houses were destroyed in Pikeville and the imme diate area. Approximately 2,400 houses were damaged and many families were evacuated. Pikeville city .schools were closed, affecting 1,400 students. A month was required to repair flood damage to schools and return them to full operation.
To a lesser degree, Prestonsburg and Paintsville, J£y.,- and other smaller towns and communities on Levisa Fork and its tributaries suffered similar damage. Three-fourths of Prestonsburg (popula tion 2,500) was under water, and approximately 1,000 persons were forced from their homes. As the waters receded, several fires broke out, which hampered rehabilitation work. The flooding in Prestons burg is typical of the flooding that existed between the mainstream and hillsides in cities and towns along Levisa Fork.
About 700 residences in Paintsville were flooded. Advance warn ing received in Paintsville enabled 200 families to evacuate. The Prestonsburg and Paintsville (Johnson County) areas each suffered losses totaling $4 million. Martin, Ky., a town of 1,100 population on Beaver Creek near its mouth, .was damaged severely by backwater from Levisa Fork. Water reached the roofs of most business estab lishments in Martin. Elkhorn City, Ky., Fishtrap, Ky., and many communities suffered damage.
Two persons lost their lives in the Big Sandy Eiver basin in Ken tucky. A lineman was electrocuted at Pikeville, and a man was killed by exploding gas in Paintsville.
The greatest damage, by far, in any one area was at Pikeville and the surrounding area in Pike County the largest county in Ken tucky damage exceeded $15 million.

A10 FLOODS OF 1957
On the Pound River, the record flood at Pound, Va., and the near- record flood near Haysi, Va., caused extensive damage.
LITTLE SANDY RIVER, TYOARTS CREEK, AND LICKINO RIVER BASINS
The Little Sandy River, Tygarts Creek, and Licking River basins are located on the fringe of the flood area. The magnitude of the floods were not outstanding in these basins and the headwater areas were affected to a small degree. There was some damage by flooding of the Licking River in Salyersville, Ky., but the principal damage was to agricultural lands in the upper part of the basin. The peak stage of 20.79 feet on Licking River near Salyersville had been ex ceeded 7 times since 1938.
KENTUCKY RIVER BASIN
The headwaters of the North, South, and Middle Forks of the Kentucky River were in or near the area of highest precipitation. The North Fork reached a peak stage of 37.54 feet at Hazard, Ky., as compared with the highest previous crest of about 34 feet on May 30, 1927. The three forks rose to unprecedented peak discharges, ex ceeding maximums recorded previously. The gaging stations have lengths of record as long as 24 years.
Discharges at the most downstream stations on the North Fork, Middle Fork, and South Fork Kentucky River are shown in figure 6. Although the maximum discharge at Jackson, Ky., was greater than any recorded previously, the peak stage was lower due to a cutoff, completed in 1956, half a mile below the gage. At the crest of the flood the cutoff was carrying approximately 75 percent of the flow. The Corps of Engineers estimated that the cutoff reduced the peak stage of the flood by about 4 feet.
On the Middle Fork Kentucky River at Buckhorn, Ky., the flood peak was 5.0 feet higher than the peak in 1939, and at Tallega, Ky., the crest stage was 2.83 feet higher than the historic flood of 1939.
In the South Fork Kentucky River basin the greatest flood previ ously recorded occurred in 1947. In January 1957 the peak discharge at Booneville, Ky., was 30 percent greater and the stage was 1.7 feet higher than that in 1947. Peak stage and discharge on the main stem of the Kentucky River at lock 14 at Heidelberg, Ky., 6 miles below the confluence of North and South Forks, were slightly less than that in 1939. Although most damage in the Kentucky River basin was to urban areas along the North, Middle, and South Forks, some damage was reported as far downstream as the mouth.
The worst hit town in the Kentucky River basin was Hazard, Ky., population 20,000. All highways leading into the town were blocked by the floodwaters, and all utilities were out of operation. The main

FLOODS OF, JANUARY-FEBRUARY 1957 IN KENTUCKY All
South Fork Kentucky River at Booneville, Ky.
North Fork Kentucky River at Jackson, Ky.
Middle Fork Kentucky River at Tallega, Ky.
_ 27 28 29 30 31 1 2 3 4 5
JANUARY FEBRUARY
FIGURE 6. Discharge at gaging stations in the Kentucky River basin.
streets of the town were inundated with as much as 17 feet of water. Five persons lost their lives in the Hazard area: three were drowned or died of exposure, and an elderly couple lost their lives at Darfork a few miles downstream when fire destroyed a house in which they had taken refuge. More than 300 residences and 180 commercial and industrial buildings were damaged in Hazard. At least 70 build ings of all types were destroyed. Total damages in the city amounted to about $4i/£ million.
Most of the towns and communities located along the North Fork Kentucky River and its principal headwater tributaries, Rockhouse Creek, Line Fork, Leatherwood Creek, Carr Fork, and Troublesome Creek were damaged in some form. Damage was particularly notable at Whitesburg, Ky., and in the Neon-Fleming area upstream from Whitesburg on the North Fork; at Blackey, below the mouth of Rock- house Creek; at Lothair, just upstream from Hazard; at Darf ork, Airport Gardens, the airport, and Combs in the short reach below Hazard; and at Beattyville near the confluence of the North and South Forks. The greatest damage on tributary streams occurred along Leatherwood Creek.

A12 FLOODS OF 1957
The bridge serving the airport at Hazard was swept down river on January 29 (fig. 7) . The photograph, taken on February 4, shows the erosive action of the waters on the far bank, which occurred before the bridge was lost.
The main business section of Beattyville, Ky., was inundated to a depth of about 6 feet, with 70 commercial establishments and 20 resi- d,ences flooded. Thirty-five miles downstream at Irvine-Kavenna (lock 12) the peak stage was only eight-tenths of a foot below that of 1939, and about 25 residences in low-lying areas were flooded. In the 60-mile reach of the Kentucky River downstream from Irvine- Kavenna, wider flood plains exist and rural damage, particularly to cropland, was high.
\
FIGURE 7. View of bridge at Hazard Airport, swept down by floodwaters of the North Fork Kentucky River. The airstrip paralleling the river in the background was submerged. Photograph by Louisville Courier-Journal and Times.

FLOODS OF JANUARY-FEBRUARY 1957 IN KENTUCKY A13
Many houses and other buildings were washed away, and some were lodged, against bridges, partly obstructing the flow. This resulted in backwater and probably caused additional flooding and additional damage to bridges. Forty bridges were reported washed away in Letcher County, Ky.
In the Middle Fork Kentucky River basin, most of the urban dpm- age was at Hyden and Buckhorn, Ky. There was much damage to rural residences and farm buildings along the Middle Fork and its principal tributary, Cutshin Creek. One person was drowned in Cut- shin Creek at Wooton, Ky. In Hyden, a lumber company, the only industrial plant in town, lost a large amount of lumber, and 20 com pany residences were inundated. About half of the commercial prop erties and 30 percent of the residential properties in the town were affected.
At Buckhorn, Ky., the peak stage was 5.0 feet higher than that of 1939. Practically all properties in this town were inundated, some to a depth of 10 feet. Ten residences were destroyed.
In the South Fork Kentucky River basin, there was appreciable flood damage at Manchester and Oneida, Ky. Although Goose Creek at Manchester reached a stage about 2 feet lower than that of the historic flood of 1947, damage in the town was estimated, at over $200,000. Twenty-five residences and thirty-four commercial prop erties were flooded.
More than 50 residences and about 10 buildings pf other types were flooded at Oneida, just below the confluence of Red Bird River and Goose Creek (head of the South Fork Kentucky River). Flow f room Goose Creek cut across the town and approximately 80 percent of the property was inundated as much as 9 feet. At Booneville, Ky., the South Fork Kentucky River exceeded the peak stage of the flood of 1947 by 1.7 feet and damage was much less than that at Manchester. Thirty residences and one public building were flooded.
SAI/T AND GREEN RIVER BASINS
In the Salt and Green River basins, in the general fringe area of the flood, the most noteworthy peaks occurred in Barren River basin, which d,rains into the Green River from the south. Maximum dis charge occurred at Drakes Creek near Alvaton, Ky. On Barren River at Bowling Green, Ky., the peak discharge was the second highest, and the peak stage was 2.56 feet lower than the previous maximum during the period of gaging-station record beginning in 1938, and its stage was about 10 feet less than tlie alltime high of 52.2 feet in 1913. Dam age in the Green River basin was evaluated at $788,000 by the Corps of Engineers, of which about two-thirds was noncrop agricultural damage.
690-137 O - 64 - 2

A14 FLOODS OF 1957
Several of the peak flows recorded tit-gaging stations in the head water areas of the Salt and Green Rivers did not occur during the main storm period, January 28-February 1, but were the result of other storms that passed over the State a week earlier or about 2 weeks later. Generally, the peaks at these stations were comparatively low and maximums were not approached.
CUMBERI/AND RIVER BASIN
In the Cumberland Eiver basin, the floods exceeded previously known maximum stages at four gaging stations. Poor Fork, the main headwater tributary, reached, a maximum at Cumberland, Ky., exceeding by 1.3 feet the flood peak of 10,2 feet in 1927. A new maxi mum occurred at Laurel Eiver at Corbin, Ky. The Cumberland Eiver at iWilliamsburg, Ky.r reached a stage of 33.78 feet, which is only four-tenths of a foot less than that of the flood in January 1946. Straight Creek had a. discharge of 310 cfs per sq mi (cubic feet per second per square mile) from a drainage area of 53.8 square miles.
Discharge hydrographs at the Harlan, Pineville, and Williamsburg gaging stations on the main stem of the Cumberland Eiver are shown in figure 8.
JANUARY FEBRUARY
FIGURE 8. Discharge at gaging stations on the main stem upper Cumberland River.
Based on records beginning about 1940, the floods of January 1946 are the greatest known, though floods in 1927 may have been somewhat greater along Poor Fork. It is noteworthy that the peak discharges during the January-February 1957 floods at most of the gaging sta tions missed reaching historical maximums by small amounts.

FLOODS OF JANUARY-FEBRUARY 1957 IN KENTUCKY A15
In the Cumberland Kiver basin the greatest impact of the flood was upon the cities and towns along the main stem of the river. Poor Fork, the main headwater tributary, flooded an appreciable part of the business district of the town of Cumberland (fig. 9). There were 53
FIGURE 9. View of flooded main street and business district in Cumberland, Ky., on January 29, 1957, at about 4 p.m. Bridge over Poor Fork in left foreground is partly blocked by submerged debris. Photo graph by Vie Howard, Cumberland, Ky.
commercial establishments and 2 industrial enterprises moderately to severely damaged. More than 200 homes were flooded 17 were rendered unfit for further habitation. The flooding was aggravated by backwater from bridges that were blocked by debris. The peak stage of 11.50 feet at the gaging station downstream in the town was more than a foot higher than that of the flood of 1927 and almost 2 feet higher than that of the flood of 1946.
At Nolansburg, Ky., about 10 miles southwest of Cumberland, a man was drowned when a cable-suspended footbridge was washed out by the floodwaters. This was the only loss of life in the Cumberland Kiver basin.
Near Harlan, just below the confluence of Poor and Clover Forks, the peak stage of the Cumberland River was 2.9 feet below the crest in 1946. Damage at Harlan was negligible although that in Harlan County, including Cumberland and Blair, Ky., was estimated at $1 million.

A16 FLOODS OF 1957
The peak discharge at the gaging station near Pineville was slightly less than that during the flood of 1946, and the peak stage of 47.35 feet was about 2.0 feet lower. The pumps at a newly completed flood- w^all at Pineville were not operational at the beginning of the floods, but emergency pumps w^ere ready for use only a fewT hours before needed on January 29. Damage was relatively minor. Approxi mately 20-25 houses not protected by the wall were flooded.
At Barbourville, Ky., the peak stage wTas only half a foot belowT the known maximum of 42.8 feet in 1946. Approximately 80 percent of the city was inundated to depths as much as 10 feet, and about 200 families (600-800 persons) were evacuated. Damage to residential, commercial, and municipal properties exceeded $1 million.
The aerial view in figure 10 shows flooding in the southern part of Barbourville in the vicinity of the stream-gaging station. The local flood-protection works, of which the levee shown in the photograph is a part, were not completed at a point downstream (off photograph to left) where Richland Creek enters the Cumberland River. Never theless, the completed part of the levee afforded considerable protec tion to the city with a corresponding reduction in damage, for it
FIQTJEE 10. Aerial view of flooding in southern part of Barbourville, Ky., along the Cumberland River at 2 p.m. January 30,1957. The levee that shows in this view looking north was not completed, but it prevented water from flowing through the city. Photograph by Louisville Courier-Journal and Times.

FLOODS OF JANUARY-FEBRUARY 1957 IN KENTUCKY A17
prevented the direct current of the river from flowing through Bar- bourville. The planned protected area of the city was subject only to backwater, and water elevations in the upstream end of town were less than those in the river near that area.
Wiliamsburg is on low rolling hills and was damaged much less than other areas. Water was 3 feet deep in some streets, but only a few families were forced to move. Damage totaled about $70,000.
The hydrologic significance of the floods is demonstrated by the maximum discharge attained at Cumberland Falls, Ky., where 46 years of record are available. The discharge was only 4 percent less than the previous known maximum of 59,600 cfs in 1918.
Damage in Corbin was extensive. Approximately 400 residences, 90 business establishments, 2 industries, and several schools and churches were inundated to depths as much as 10 feet in parts of the city. Total damage exceeded $2 million in the vicinity. Lynn Camp ' Creek, a tributary of Laurel River, flows through the city and numer ous older residents in the city said that it was 5-6 feet higher than in any other flood during the past 50 years.
Rockcastle River did not reach a particularly high stage. Buck and Pitman Creeks approached the maximums of 5 years of record. The South Fork Cumberland River, with headwaters in Tennessee, had a discharge of 61,500 cfs near Stearns, Ky., which was about 12 percent less and had a stage about 2.2 feet less than the maximum dur ing the period of gaging-station operation (1942-56). The peak stage of 36.25 feet was far below that of 52.9 feet in March 1929.
The flood was one of the greatest known in the Cumberland River basin, yet the discharge in the Cumberland River at Rowena, Ky., dur ing the entire flood period was relatively small. The flow in the river at Rowena is regulated by Lake Cumberland (final closure of the dam was made August 1950) and the daily mean discharge during the period January 29-February 1 ranged from about 10,000-24,000 cfs, whereas the peak discharge during the flood of 1946 was 162,000 cfs.
The greatest daily increase in contents in Lake Cumberland was 282,500 cf s-days on January 29. The reservoir cannot be credited with reducing the flow at Rowena by an amount equal to the increase in storage at any given time.
Under natural uncontrolled stream conditions the rate of discharge at Rowena would not have been equivalent to the rate of increase that occurred in reservoir contents. The composite effect of the normal lag pattern of the individual streams, in such a long basin, could be con siderably different than that of the various streams discharging di rectly into the reservoir.

A18 FLOODS OF 1957
A synthetic discharge hydrograph of unregulated discharge could be computed by flood routing studies, but that is beyond the scope of this report.
Figure 11 shows the great difference between the net inflow to the
DAILY MEAN DISCHARGE, IN THOUSANDS OF CUBIC FEET PER SECOND-DAY
tr- »- N> N> O Jl Ol O CJ1 O O1 C
DOO OOOOC
f
t/ .
A
A'
\""
akeC
V
umbe
^ -
rland
^\
V^ ^Cu^--^
mber
-~ _
landf
.^
?jver <it ROV
_--*
i/ena >
^
/\\
^
27 28 29 30 31
JANUARY
567
FEBRUARY
10 11
FIGURE 11. Hydrograph of daily mean discharge of the Cumberland River at Rowena, Ky., and netinflow to Lake Cumberland.
reservoir and the discharge of the Cumberland River below the dam. The peak discharge (22,600 cfs) in the Wolf River near Byrdstown,
Tenn., was 60 percent greater than any other peak since at least 1943. The discharges of the Wolf River and the Obey River were regulated by Dale Hollow Reservoir near Celina, Tenn., and the peak discharge was modified to 6,160 cfs on January 29 below the reservoir.
TENNESSEE RIVER BASIN
In the Tennessee River basin in Virginia and Tennessee the flooding was most intense in the unregulated reaches in the Clinch and Holston River basins and in the small streams originating on the western slopes of the Great Smoky Mountains.
New maximums for the period of gaging-station record (33 and 39 years) occurred in the Clinch River above Tazewell, Tenn., and the Tellico River at Tellico Plains, Tenn. At Chattanooga, Tenn., the Tennessee River reached flood stage for the first time since 1948, and many families were evacuated from the low-lying sections'of the city.
Although an unusually large amount of runoff was produced by the continued heavy rains most of the crests were relatively moderate.

FLOODS OF JANUARY-FEBRUARY 1957 IN KENTUCKY A19
More than 300 families were evacuated at Sevierville, Tenn., as floodwaters from the Little Pigeon River rose to a depth of 3 feet in the residential and business districts. Floods on the Elk River at Fayetteville and the Duck River at Columbia and at Shelbyville, Tenn., forced evacuation of many families from their homes. Dis charges were not determined at these points. Lowlands and roads were flooded at scattered points across Tennessee except on the Cumberland Plateau.
A noteworthy feature of the floods was the large volume of runoff produced by the continued heavy rains. Inflow into reservoirs on Tennessee River tributaries was greater than at any time since the dams were built. The maximum volume stored in the reservoirs above Chattanooga was 3,700,000 acre-feet and the total in the entire Tennessee River reservoir system was 6,700,000 acre-feet.
Tennessee Vallsy Authority officials estimated that if the reservoirs had not been built the peak stage at Chattanooga would have been about 54 feet (412,000 cfs) on February 3, whereas the actual crest was 32.24 feet (208,000 cfs) on February 2. This flood under natural conditions would have been the second highest ever known at Chatta nooga, being exceeded only by that of 1867.
Figure 12 shows the volume of water stored in the reservoir system during the flood period. Each graph shows the total storage in all reservoirs named below it. The vertical difference between any two graphs represents the storage in the reservoir or group of reservoirs indicated between them. For example: on February 10, the total storage in Norris Reservoir and the reservoir system upstream from it was 1,530,000 cfs-days, and that in Norris Reservoir alone was 390,000 (1,530,000-1,140,000) cfs-days.
FLOOD DAMAGE
The floods of January-February 1957 in southeastern Kentucky and adjacent areas in West Virginia, Virginia, and Tennessee caused record damage. Nine lives were lost in Kentucky.
Because the amounts of flood damage are frequently used as guides in the study of flood-control economics, and because some flood damage statistics are a measure of the relative magnitude of inunda tion, especially in urban areas, it has been the practice of the Geo logical Survey to compile available damage statistics in their special reports on floods. On-the-spot surveys of flood damage are not made by the Geological Survey.
Perspnnel of the Corps of Engineers from the Huntington, W. Va., Louisville, Ky., and Nashville, Tenn., district offices began collecting data on flood damage soon after the floodwaters receded (tables 1-5). The data in the tables are published as furnished by the Corps of

A20 FLOODS OF 1957
3600
From TVA Division ofWater Control Planning
River Control Branch
Hales Bar, Guntersville\ Wheeler, Wilson, and Pickwick Lakes x~ --.
,Ft. Loudoun, Watts Bar, Chickamauga Lakes
Hiwassee-Ocoee Systems
South Holston, Watauga Fort Patrick Henry
Boone, and Lakes
20 25JANUARY
10 15 FEBRUARY
25 28
1957
FIGURE 12.. Volume of water stored in the TVA reservoir system. Each line shows the total storage in all reservoir lakes named below it.
Engineers, except the breakdowns by stream reach or location were combined in some cases to permit shorter tables. In some instances, stage-damage curves that incorporated all direct damages in one total were used. These curves were constructed from data gathered in earlier floods but were checked and adjusted as necessary immediately following the January-February 1957 flood.
Table 1 lists direct damage to all improvements including dwellings, outbuildings, farm buildings, commercial and industrial property, and schools and churches in the Big Sandy River basin.
Flood losses in the Licking, Kentucky, and Green Eiver basins shown in table 2 include the damage or destruction of real and personal property in urban and rural areas, crop and noncrop damage,

FLOODS OF JANUARY-FEBRUARY 1957 IN KENTUCKY A21
interruption of business activities, and damage to highways, railroads, and utilities. Under urban damage the following building units were flooded or destroyed:
Industrial and Residential Public commercial Other
Kentucky River Basin. Green River basin ____
1,55957
Total. 1,616
604
4902
549
64 492 63
TABLE 1. Damage in the Big Sandy River basin, Kentucky, Virginia, and WestVirginia
[Compiled by the Corps of Engineers, Dept. of the Army, Huntington, W. Va., district]
Reach or location
Headwater areas upstream from Fishtrap, Ky., on Levisa Fork and Elkhorn City, Ky., on Russell Fork:
Grundy, Va ____________________________Levisa Fork upstream from Fishtrap, Ky .......................Haysi, Va. ....... ...... . ..... ..........................
Russell Fork upstream from Elkhorn City, Ky. ................
Railroads, Russell Fork .........................................Highways, Russell Fork ______________________Utilities, Levisa Fork........ __ ... .Utilities, Russell Fork.................. . . .......
Levisa Fork and major tributaries downstream from Fishtrap, Ky., and Elkhorn City, Ky.:
Levisa Fork, Fishtrap to Millard, Ky.. ............ _ .........
Millard to Pikeville, Ky......... ...............................Pikeville, Ky. ^............... ................ . ...............Pikeville to Alien, Ky.. ........................................Alien, Ky........... ............................................
Alien to Prestonsburg, Ky _______ _____________
Paintsville, Ky.i.. ..............................................
Utilities.................................. ... . ... .......Tug Fork and major tributaries:
Tug Fork upstream form Welch, W.Va. ____________Elkhorn Creek upstream from Welch, W.Va _______ .....Welch, W.Va.L. ................
Welch to Matewan, W. Va. __________________ .....Matewan, W. Va ___________ ............................
Williamson, W. Va.»_ ____.._ Rural reaches along Tug Fork, Williamson to Crum, W. Va.... Chattaroy, W. Va. .............................................Nolan, W. Va. .- .. -
Kermit, W. Va.. . . . ......... ........ ..........Crum, W. Va-.. ....... ...... ..................................Crum to Fort Gay, W. Va... .............................. __ .Railroads, Tug Fork basin-.--.-.-----.............---....--.-.
Utilities, Tug Fork basin....--------.-.......... _ ............
Total.....-.-.....................-.-.---- .................
Kentucky
$75,000
92, 000200, 000
60,000350, 000
2, 500, 0008, 500, 0003, 500, 000
400, 000650,000370, 000
2, 100, 00050, 00070, 000
1,000,00049 ftnfi
250, 0008, 000, 0001,000,000
75,000
104, 000146, 000
§66,606
30,000100, 00300,000125, 000
30, 389, 000
Virginia
$800, 000690, 000200, 000
1, 085, 000130, 000158,000300,000
060,00070,0005,000
...... ......
3, 498, 000
West Virginia
$100,000150,000325,000300,000450, 000850, 000196, 000
1, 250, 000150, 000 70, 0006,5008,000
21,000* 3,000
6,50025,000
300,000400, 000200,000
4, 811, 000
38, 698, 000
1 Includes damage to utilities.

A22 FLOODS OF 1957
TABLE 2. Damage in the Licking, Kentucky, and Green River basins, in Kentucky
[Compiled by the Corps of Engineers, Dept, of the Army, Louisville, Ky., district except as noted]
Stream
Licking Eiver basin:
Kentucky Eiver basin:
Middle Fork Kentucky River, . ___________ ..........
Red River __ _____________________ ...........
Green River basin:
Rough River. _ . __________________________
Grand Total... __ . __ . ___ . __ . _______ .........
Tangible damage
Urban
$4,000
8, 212, 000 563,000 340,000
0 474,000
9, 589, 000
5,400 5,000
0
10,400
9, 603, 400
Rural
$36,000
3, 095, 000 1,460,000
220,000 34,000
572,000 i 473, 303
5, 854, 303
684,000 64,000 30,000
778,000
6, 668, 303
Total
$40,000
11, 307, 000 2, 023, 000
560,000 34,000
1, 046, 000 i 473, 303
15, 443, 303
689,400 69,000 30,000
788,400
16, 271, 703
1 Furnished by Louisville & Nashville Railroad.
The flood occurred during the winter the low point of the crop season and relatively light crop losses occurred in the inundated areas. Noncrop losses in rural areas were many times greater and consisted primarily of damage to buildings, building contents, lands, and stored crops. Land inundation amounted to 8,000 acres in the Licking Eiver basin, 70,850 acres in Kentucky Eiver basin, and 157,100 acres in Green River basin.
Eural damage in the Kentucky Eiver basin (table 2). included damage to highways, roads, and bridges, $662,000; to coal mines and business losses in coal mining operations, $1,015,000, with 600-700 mines affected; and to suspension footbridges over streams. There were 96 suspension footbridges destroyed and replacement of these bridges cost approximately $240,000. Eailroad trackage (single) to taling 142 miles was damaged to some degree. In the Green Eiver basin, highway damage was assessed at $119,000 and railroad damage at $31,000.
Table 3 summarizes damages of noncrop losses from inundation of 68,000 acres of farm land -along the Ohio Eiver, 76,700 acres in Wabash Eiver basin, and 9,100 acres in Saline River basin.
In"areas represented by table 4, acres of farm land inundated and corresponding damages in the reach from the mouth of the Cumber-

FLOODS OF JANUARY-FEBRUARY 1957 IN KENTUCKY A23
g River basins, Ohio, Indiana, Illinois, and Kentucky
[Compiled by Corps of Engineers, Dept. of the Army, Louisville, Ky., district. Urban damage along Ohio River and in Wabash and Saline River basins was negligible]
Along Ohio River main stem, Neville, Ohio, to mouth .....
Total. .............................................
Rural damage
Ohio
$1,000 0 0
1,000
Indiana
$79,000 500
0
79,500
Illinois
$102, 000 89,500 37,000
228,500
Kentucky
$108,000 0 0
180,000
489, 000
land River to Wolf Creek dam were divided between Kentucky and Tennessee approximately as follows:
Flooded land(acres)
Kentucky____-_-_------___--________-------___-------- 66,700Tennessee.-___-___________-_---_____.._________-._-__- 46, 600
Damages $86, 720
60, 580
Total. ___.___.___._._____.____ ________._____ 113,300 147,300,
Damage figures for the upper Tennessee Eiver basin (table 5) are not complete as damage was determined for a study of possible pro tection works at the towns listed and does not include rural damage. Red Cross expenditures of approximately $50,000 in Tazewell County, Va., aire not included in the table. The major part of this went to families in Richlands, Doran, and Raven.
Table 6 summarizes all damages by river basin and by State.
TABLE 4. Damage in the Cumberland River basin in Kentucky and Tennessee[Compiled by the Corps of Engineers, Dept. of the Army, Nashville, Tenn., district except as noted. Urban
damage includes damage to residential, commercial, industrial, and publicly-owned property including streets. Rural damage includes damages to farm houses and other buildings, farm roads, and pasture, and losses of livestock and harvested crops!
Urban Location or stream reach Damage
Cumberland Ky.___._____ ______________ ___ _- ____ $819, 000Blair, Ky.___._.._._.___._________._._.___....___..-._-. 59, 000Harlan, Ky_..__...__________________________________ _ _ _ 400Pineville, Ky. (Protected area)______________________. 12,000Pineville, Ky. (Outside protected area)______________________ 55, 000Middlesboro, Ky________________.____________-_-_---_--__- 1,000Barbourville, Ky._________________________________________ 1,291,800Heidrick, Ky.__.____._____________________________________ 46, 800Williamsburg, Ky___________.______._____.__.-____--.----. 67, 600Corbin, Ky___________________._______.._________- 2, 032, 400Nashville, Tenn.______________________ _____-_______ 64, 000Clarksville, Tenn____ ______________-___ __ 7,000Eddyville, Ky_._____________________________-___.__________ 23, 000Kuttawa, Ky._.______________ _________________ _______ 500
Total urban damage..____.__...________-____-. 4,479,500

A24 FLOODS OF 1957
TABLE 4. 'Damage in the Cumberland River basin in Kentucky and Tennessee Con.Rural' Location or stream reach Damage
Wolf Creek Dam to end of flood plain on Poor Fork. _____-__._ 253, 400 Mouth of Cumberland River to Wolf Creek Dam___ _________ 147, 300
Total rural damage._-_----.---_-----------_---_----- 400,700
Highways Jn Kentucky, State maintained_______________________ 68, 600Railroad, Louisville & Nashville:
Cumberland Valley Diversion.______________________________ * 84, 754Knoxville and Atlanta Division.____________________________ 1 20, 707
Total railroad damage_________________---___---____ 105, 461
Federal loss of closure ^beam^. lock at Old Hickory dam, Tenn_ ______ 20, 000
Grand total-__-____--___--___._..._...__........._...._. 5, 074, 2611 Data furnished by Louisville & Nashville Railroad.
TABLE 5. Damage at selected locations in upper Tennessee River basin, in Virginiaand Tennessee
[Compiled by Corps of Engineers, Dept. of the Army, Nashville, Tenn., district. Based on an investi gation of a few points of interest and not intended as a complete damage survey]
Damage Clinch River 1 Location Virginia . Tennessee
Richlands, Va_________________________________ $189,700 ________Doran, Va__________________.__-_____- 70,300 _._____.Raven, Va_________________________._ 44,900 _.____Cleveland, Va_________________________ 64,500 ________Clinchport, Va__________________________ 121,000 ____-_Fort Blackmore, Va. (on Stony Creek)___________ 12,400 __-_-_--Lake City, Tenn. (on Coal Creek)___--------____ ________ $2,000
Powell River:Big Stone Gap, Va______________________ 3,500
Total.--------_______________________________ 506,300 2,000
Grand total______________________________ ________ 508,300
TABLE 6. Summary of damage, by stream basin and by State, flood of January- February 1957
Flood damage, in dollars
Big Sandy River _ ....Licking River .........Kentucky River.. .....Green River.. .........Along Ohio River
main stem.. .........Wabash River __ .Saline River__ .......Cumberland River ....Upper Tennessee
River i..... .
Total.... ........
Kentucky
30, 389, 00040,000
15,443,303,788,400
180,000
5, 035, 681
51, 876, 384
Virginia
3,498,000
506,300
4 (_n4. ^.fift
West Virginia
4, 811, 000
4 Q1 1 ft/Vl
Ohio
i non
1 000'
Indiana
79,000500
7Q ^Ift
Illinois
102,00089,50037,000
ooo con
Tennes see
151,580
2,000
153,580
Total
38, 698, 00040,000
15, 443, 303788,400
362,00090,00037,000
5, 187, 261
508,300
61,154,264
1 Includes damage at only a few selected locations. See table 5.

FLOODS OF JANUARY-FEBRUARY 1957 IN KENTUCKY A25
Expenditures by the American Red Cross in southeastern Kentucky during and after the flood are tabulated by counties in table 7. Large expenditures were made in several counties. Listed below are the major river basins and counties in which all, or a greater part, of the expenditures were made:
Piver basin CountiesBig Sandy._____________ Floyd, Johnson, and PikeKentucky.-______-__--_ Breathitt, Clay, Leslie, Letcher, and PerryCumberland.___________ Bell, Corbin (city of), Harlan, and Knox
TABLE 7. Expenditures by American Red Cross in the southeastern Kentucky flood of January-February 1957
[Expenditures are listed by counties, except those for the city of Corbin, which Includes expenditures In small adjacent areas in Whitley, Knox, and Laurel Counties]
County
Bell.. . .....-.....-.....__........__.__._.. ..........Breathitt __________________________Clay....................................................Corbin, City of _ ............. _____ .... ___ ....Estm.... ...............................................Floyd... ___ .... __ ................................Harlan ___________________________Johnson-- _____________________ ___ _Knott _ ........................... __ . ____ .. __
Lee _____________________________Leslie ___________________________Letcher __________________________Martin.... ______________________Owsley ___________________________Perry ____________________________Pike......... ................... ...Whitley-. ....................... . ... . .......
Total .......................... ..V.. ...........
Mass care and emergency
$10, 750. 1952,389.7615, 036. 7643,932.592, 365. 22
153, 118. 1317, 934. 8450, 014. 40
335.9895, 961. 67
1,570.2135, 483. 3725,200.393, 854. 55
934. 35190,190.39224,688.36
4, 796. 54
928, 557. 70
Rehabilitation
$1, 145. 5922,550.9114,231.7160, 184. 89
652.30298, 422. 3526,916.5447,865.72
016,062.27
074,030.8623, 986. 04
00
169, 366. 32792,170.00
1,305.29
1, 548, 890. 79
Total
$11, 895. 7874, 940. 6729,268.47
104, 117. 483,017.52
451, 540. 4844, 851. 3897, 880. 12
335.98112,023.94
1, 570. 21109, 514. 2349, 186. 433, 854. 55
934.35359, 556. 71
1, 016, 858. 366, 101. 83
2,477,448.49
DETERMINATION OF FLOOD DISCHARGES
The operation of a stream-gaging station consists principally of the measurement of stage and discharge to define a stage-discharge rela tion from which discharge can be calculated for a given stage. The general method of determining discharge at gaging stations involves computing the stage-discharge relation from current-meter measure ments of discharge at stages varying from low to high water and applying this relation to the records of stage. Short extensions of the stage-discharge relation curve are made by logarithmic plotting, from velocity-area studies, or by use of other measurable hydraulic factors.
In the area of major flooding (fig. 3), most of the stream channels are rocky or have numerous rock ledges, and thus are subject to rela tively small amounts of scour or fill. At a few gaging stations in this report, fall (or slope) in the reach between two gages was a factor in establishing the relation between stage and discharge at medium and high stages and was considered in computing the'dis charge data.

A26 FLOODS OF 1957
During major floods it is often impossible to obtain current-meter measurements because of insufficient notice of flood stage on rapidly changing streams, impassable roads, heavy floating debris, or destruc tion of structures from which flood measurements are made. Because of this, the stage-discharge relation at a number of gaging stations affected by the flood was extended to peak flow by indirect measure ments such as: Computation of flow over roadways or through con tracted openings, slope-area measurement, or a combination of these methods. At several miscellaneous sites where high runoff occurred, the peak flow was also determined by indirect measurement.
STAGES AND DISCHARGES AT STREAM-GAGINGSTATIONS
EXPLANATION OF DATA
The purpose of this report is to present detailed information re garding stages and discharges of streams during the floods of January- February 1957. Much of the information is in addition to the records usually published in the annual series of Surface Water Supply Papers. The data are presented in sufficient detail to be used in studies relative to flood-control measures and watershed development.
The systematic collection of data at a stream-gaging station in cludes a record of stage, measurements of discharge, and any other general information pertinent to the determination of the daily flow of the stream at the gaging station. The record of stage is obtained either from periodic readings of some type of nonrecording gage or from an automatic water-stage-recorder installation, which provides a continuous graphic record of stage. Measurements of discharge are generally made by current meter.
The last section. (Streamflow data) of this report consists, in gen eral, of a description of the gaging station, a table showing the daily mean discharges for 2 months, January and February 1957, and a table of stages and discharges at indicated times for many of the stations during the flood period in late January and early February 1957.
The description of the gaging station gives information of loca tion, datum, type of gage, and size of drainage area. The method of determining the stage and the definition of the stage-discharge relation throughout the ranges of stage experienced during the 1957 floods and the stagetdischarge relation of the previously recorded maximum flood are described. The maximum stage and discharge are given for the January-February period and for the period of previous record. Information regarding floods outside the period of gaging-station "record also is given in as much detail as is available.

FLOODS OP JANUARY-FEBRUARY 1957 IN KENTUCKY A27
Remarks on cooperation, regulation and diversion, and other perti nent information are included where applicable.
The table of daily mean discharges is presented for January and February 1957. This period was chosen so as to show the relation of the flood discharges to the discharges of the preceding and the following periods. The table also shows the monthly mean discharge and the volume of runoff, in inches.
The table of stages and discharges at indicated times is presented generally for the period starting January 27 until the recession reached the point where sufficient definition is furnished by the table of daily mean discharges and is not given for most stations outside of the areas flooded.
The stages at most stations were obtained from records of con tinuous water-stage recorders. If the water-stage recorder was not functioning properly, the interrupted stage graph was completed on the basis of a floodmark or supplemental gage readings, or by comparison with records on the same stream or nearby streams. For stations at which the records of stage consisted of one or more gage reading each day, a stage graph was drawn from these readings, from floodmarks, and by comparison with nearby stations. Details of the methods used in defining the stage record are given in the section of the description concerning the gage-height record.
The stations are numbered and arranged in downstream order from headwater to mouth, with stations on tributaries inserted in corre sponding order, and following the order in which the tributaries enter the main stream. The reference number preceding the name of the gaging station is the same as that used on figure 3 and will aid in identifying the site.
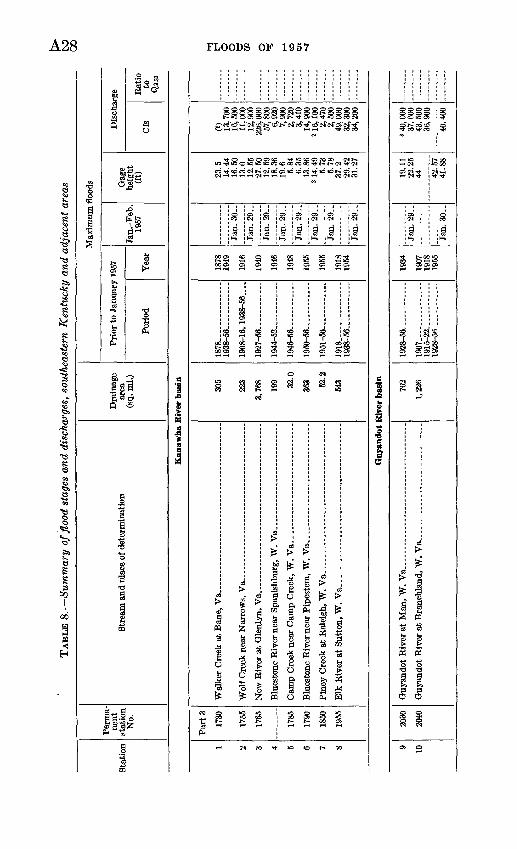
SUMMARY OF FLOOD STAGES AND DISCHARGES
The maximum flood flows at stream-gaging stations and other sites on streams in the area covered by this report are summarized in table 8. The reference number is the same as that designating the site on figure 3 and will aid in identifying the location at which the discharge was determined.
In table 8, the first column under maximum floods shows the pe riod of known floods prior to January 1957. This period does not necessarily correspond to that in which continuous records of dis charge were obtained, and in some cases it extends back to an earlier date. More than one period of record are shown for some stations. Time periods are shown when they can be associated with a maximum stage even though the corresponding discharge is not known a second period of known floods is then given in which the maximum discharge and stage are both known.
TAB
LE 8
. S
umm
ary
of fl
ood
stag
es a
nd d
isch
arge
s, s
outh
east
ern
Ken
tuck
y an
d ad
jace
nt a
reas
to 00
Sta
tion
Per
ma
ne
nt
stat
ion
No.
Stre
am a
nd t>
lace
of
dete
rmin
atio
nD
rain
age
area
(s
q. m
i.)
Max
imum
floo
ds
Pri
or to
Jan
uary
195
7
Per
iod
Yea
r
Jan.
-Feb
. 19
57
Qag
e he
ight
(f
t)
Dis
char
ge
Cfs
Rat
io
toQ
2.33
Kan
awha
Riv
er b
asin
1 2 3 4 5 6 7 8
Par
ts
1730
1755
1765
1785
1790
1850
1955
Elk
Riv
er a
t S
utto
n, W
. V
a..
..
.. ..
....
....
....
..
..
305
223
3,76
8
199 32
.0
363 52
.2
543
18
78
_
- ....
1938-5
6
__
....
1908
-16,
19
38
-56
1927-5
6 .
..
1944
-52 _
_ ..
. _
1946-5
6
__
__
.
1950-5
6
1951
-56-
_ - _
_
1918
1938
-56.
. _ . .
.....
1878
19
49
1916
1940
1946
1948
1955
1955
1918
19
54
Jan.
30
Jan.
29
-
Jan.
29
Jan.
29
-
Jan.
29
Jan.
29.
.
Jan.
29
Jan.
29
23.5
14
.44
16.5
0 13
.0
12.5
5 27
.50
12.5
9 18
.36
19.6
5.
84
6.35
13
.86
2 14
. 49
5.73
5.
78
37.2
29
.42
31.2
7
13,7
00
16,5
00
11,0
00
12,9
00
226,
000
57,8
00
6,92
0 7,
900
2,72
0 3,
410
14,9
00
2 16
, 100
2,
470
2,50
0 49
,000
32
,300
34
,200
3...
.... .
0
0 o -
o
Guy
ando
t R
iver
bas
in
9 10
2030
2040
762
1,22
6
1Q
Oft
_ K
R
1907
.. ______
1915-2
2
1928-5
6 _
...
1934
1907
19
18
1955
Jan.
29
Jan.
30
19.1
1 22
.25
44 42.5
7 41
.88
340,
000
37,6
00
43,5
00
36,9
00
40,4
00

FLOODS OF JANUARY-FEBRUARY 1957 IN KENTUCKY A29
3*gg«»
^
00 O> 00 * * i CO 10
S
r-i O *O r-iiOCOr-i
1O O<x> r-
ZT of
-a -g a?? -g-g
oM ® > !HS<! a t* S
H 53 -S S W1 1 * B§ M £
*.
PH E-< « «
1O O 1O s s « ^ » § s s
tg
Little Sandy
"
So
agt-s
1
,!
i'
!0
1«>.1
OS
sHi
i s
»
690-137 O - 64 - 3

TAB
LE 8
. Su
mm
ary
of fl
ood
stag
es a
nd d
isch
arge
s, s
outh
east
ern
Ken
tuck
y an
d ad
jace
nt a
reas
Con
tinu
ed
Sta
tion
Per
ma
ne
nt
stat
ion
No.
Stre
am a
nd p
lace
of d
eter
min
atio
nD
rain
age
area
(s
q. m
i.)
CO
Max
imum
floo
ds
O
Pri
or to
Jan
uary
195
7
Peri
odY
ear
Jan.
-Feb
. 19
57
Gag
e he
ight
(f
t)
Dis
char
ge
Cfs
Bat
io
to
Qa.ss
Tyg
arts
Cre
ek b
asin
3221
7024
11
94
0-5
6
1948
Jan.
23-
20.3
5 13
.99
12,8
00
4,00
0.5
^3
Lic
king
Riv
er b
asin
£
3324
8514
01
93
8-5
6
1939
Jan.
30
-25
.4
20.7
914
,300
5,
880
O
O..
....
..
w OK
entu
cky
Riv
er b
asin
34 35 36 37 38 39 4n 41 42 43
2773
2775
2780
2785
2800
2809
2810
Mid
dle
For
k K
entu
cky
Riv
er a
t T
alle
ga,
Ky_.. _
66.4
466 2.
21
177
1,10
1
1,29
4
226
420
537
117
1927.
1940
-56
1955
-56 _
19
39
.
1949
-56
1928
-31,
193
6-56
....
1929
-31,
193
9-42
....
1939 _
____ .
1930
-32,
193
9-56
....
1947. _
1927
1951
1956
1939
1951
1939
1939
1942
1939
1939
1951
1947
Jan
. 29..
Jan.
29
-
Jan.
29-
Jan.
29
Jan.
30
Jan.
30
Ja
n.
29
Jan.
29
Jan.
30
Jan.
29
34 27.2
37.5
4 3.
013.
20
29 24.7
823
.35
43.1
040
.41
45.6
28.3
047
.14
38.1
43.1
40
.50
43.3
3
7,73
00) 28
,100
47,8
00
328
375
0) 15,6
0013
,500
46
,800
53,5
00
W 24,2
0055
,000
67
, 500
0) 82,3
00
0) 35,3
0052
, 700
94
4,00
048
.500
1.9
2.8
1.2
1.7
1.7
1.5
6.8
5.3
2.9
8.1

FLOODS OF JANUARY-FEBRUARY 1957 IN KENTUCKY A31
O) ^ O* 00 00 Cfl O* i CO
coco c$ ^4
10 eo -H ufoi o o 3 S cfSOOOWoOOONrto rt
a-8
t-°i to o to *c S eo oo 'C'-1 c os o t-
s $
&§* Mflea
w S S2-a-a
o 2 Sus" US <Q
-s -a-
gfe-ogfi I J S § S
« -s
llO W
US US OS
I-H OS
U, L.
b£« a 1

TAB
LE 8
. Su
mm
ary
offl
oad
stag
es a
nd d
isch
arge
s, s
outh
east
ern
Ken
tuck
y an
d ad
jace
nt a
reas
Con
tinu
ed
Sta
tion
Per
ma
ne
nt
stat
ion
No.
Str
eam
an
d p
lace
of
dete
rmin
atio
nD
rain
age
area
(s
q. m
i.)
Max
imum
flo
ods
Pri
or t
o Ja
nuar
y 1
957
Per
iod
Yea
r
Jan.-
Feb
. 19
57
Gag
e he
ight
(f
t)
Dis
char
ge
Cfs
Rat
io
toQ
t.33
Gre
en R
iver
bas
in
61
62
63
64 65
66
67 69
70
71
3045
3050
3055
3065
3070
3075
3085
3125
3135
3140
3145
2.19
22.4
36.3
742
186 18
.1
1,79
0
"531
7.52
"478
"1,8
48
1951-5
6 .
1951-5
6
1953
-56.
_ . .
......
1913...... .
.....
19
39
-56
1939
-56.
.
1941
-56 _
__
__
_ .
1913
. ...
....
....
...
1915
-22,
192
7-31
, 19
36-5
6.
1939
-56.
__
__
... .
1950-5
6
1939
-56 ...
1913
-56.
_ . _
__ .
1938-5
6.... .
....
1952
1952
1955
1913
19
52
1952
1949
1913
19
37
1952
1952
1948
1913
19
52
Jan
. 22
Jan.
22
Jan
. 22
Jan
. 30
Jan
. 29
Jan
. 22
Feb
. 1
Jan.
30
Jan
. 29
Jan.
29
Jan
. 30
Ja
n.
31
5.40
2.
80
8.93
6.
48
9.40
7.
95
36.2
33
.50
25.6
5 23
.8
17.2
8 10
.00
7.91
»
54. 0
«5
0.40
36.9
4 27
.26
23.7
6 6.
09
5.64
30
.70
31.5
4 52
.2
44.6
3
42.0
7
950
176
10,4
00
1,89
0 5,
300
2,90
0
47,0
00
21,5
00
15,9
00
7,79
0 2,
140
1,51
0 87
,000
72
,200
31
,600
70,0
00
42,8
00
1,64
0 1,
510
30,9
00
34,3
00
77, 4
00
66,1
00
.6 1.0
1.2
1.1 .9 1.0
1.0
2.3
1.9
1.9
1.7
Cum
berl
and
Riv
er b
asin
72
4005
82.3
1927.
1927
19
46Ja
n.
29
10.2
9.
65
11.5
0
12,0
00
7,50
0 11
,800
2.9
to

73 74 75 76 77 7ft 79 80 81 82 83 84 85 86 87 88 80 SO 01 92 93
4010
4020
4030
dfW
;
4040
4045
4050
4060
4065
4071
4073
4075
4085
4095
4105
4125
4135
4140
4145
Hel
ton
Bra
nch
at G
reen
woo
d, K
y __ _
__________
New
Riv
er a
t N
ew E
iver
, T
enn __ ..
........................
Cum
berl
and
Eiv
er n
ear
Row
ena,
Ky
.. . _
__
....
..
374 58
.2
676 53
.880
9
960
1.60
7
1,97
7
201 3.
89
604 .6
7
.85
165
382
272
954 31
.3
5,78
9
5,79
0
"202
1940
-56.
__
__
. ...
1940-56
1929-3
1
1QS
8_K
fi
1946
>. _
-19
22-3
1, 1
948-
56..-
1918-56
1950-5
6 _
_
1907
-11,
1915
-56-
1911
19
13
- -
1922
. _
.
1923
-24.
1942
-56
-
1953-56
1936-56
ICW
fi
19
56
1952
-56-
- -
1Q9O
1934-56
1Q9O
1930
-56-
1Q9O
1942
-56
1953-56 -
1 OK
A
«S
1826-1
956 -
IQS
Q-^
fi
1Q9O
1Q49
_Sfi
1946
1946
1931
1Q4f
i
1946
1927
1951
1946
1951
1918
1911
1913
1922
1Q4f
i
1956
1947
1956
1956
1956
1929
1QSO
1Q9O
1QSQ
1929
1948
ion*
1951
1826
1Q4f
i
1Q9O
10
48
Jan.
29
Jan.
29
Jan.
29
d
o..
Jan.
29
Jan.
30
Jan.
31
Jan.
29
Jan.
29
Jan.
29
Jan.
30
Jan.
29
Jan.
29
Jan.
29
Jan.
29
Jan.
28
Jan.
29
Jan.
22
Feb.
13
Feb.
22
Jan.
29
22.8
119
.89
20.9
215
.31
17.7
632
.62
49.3
147
.35
42.8
40.2
542
.28
34.2
29.8
533
.78
15.5
14.5
5 19 1Q 19 17
94
19.3
0 6.
234.
97
45.4
831
.90
1 V
J"2
.43
u 1.
46
15.7
215
.19
41
9
33.5
826
.00
» 22
. 11ft
f\
12.9
0 52
.938
.50
36.2
57
>\
8
7.43
<
741.
32
< 734
. 40
69.5
64.8
221
.43
30
.727
.20
19.4
1
37,9
0031
,000
6,
160
3,98
0 23
,400
45,0
00
16. 7
00K
»7
QA
A
54,9
00
(0 47,9
00
43,0
00
(0 37,2
0049
,700
59
,600
57,4
00
(0 (') (') 14 4
0016
!200
50
630
6 46
,800
25.0
00
98 198 76 136
10,8
009,
710
74,7
0044
,300
29,2
00
(0 34,0
0015
,000
(0 69
,600
61.5
00
2,43
02,
260
54,9
60M
,580
(0 162,
000
'27,
500
(0 28,3
0016
,900
2.2
1.1
2.0
4.9
3.0
1.5
1.8
1.6
1.8 .6 1.4
1.2
1.8
1.2
1.3
1.0
1.7
See
foot
note
s at
end
of t
able
.

TAB
LE 8
. Su
mm
ary
of fl
ood
stag
es a
nd d
isch
arge
s, s
outh
east
ern
Ken
tuck
y an
d ad
jace
nt a
rea
s C
onti
nued
Sta
tion
Perm
a
nent
st
atio
n N
o.S
trea
m a
nd p
lace
of d
eter
min
atio
nD
rain
age
area
(s
q. m
i.)
Max
imum
flo
ods
Pri
or to
Jan
uary
195
7
Peri
odY
ear
Jan.
-Feb
. 19
57
Gag
e he
ight
(f
t)
Dis
char
ge
Cfs
Rat
io
toQ
2.33
Cum
berl
and
Riv
er b
asi
n C
ontin
ued
94
95
96 97
98
4150
4160
4165
4175
"115
105
935
935
7,32
0
1942-5
6 -
19
43
-56
,
1943
-56.
19
38
-56
1826-1
956
1955
1955
1950
1939
19
46
1826
19
26
1926
Jan.
29
Jan.
29
Feb
. 10
, 11
.
Jan.
29
------
Jan.
29
16.3
0 12
.65
9.06
10
.84
* 65
7. 8
46
50.6
8
ic 4
3, 4
0 21
.90
59.2
~""
~57
~25
~
30.4
4
15,1
00
9,51
0 14
,100
22
,600
«
1, 5
40
« 1,
340
41,4
00
76,1
60(0
14
5, 0
00
1 66
, 500
1.8
3.2
........
Ten
nes
see
Riv
er b
asin
99
100
101
102
103
104
105
106
4700
. 47
15
4725
4730
4735
4740
Lit
tle
Pige
on R
iver
abo
ve W
est
For
k L
ittl
e Pi
geon
Riv
er a
t Se
vier
- vi
lle,
Ter
m.
201 76
.2
353 76
.1
56.0
301 7.
39
132
19
54
-56
1946
-49,
1954
-56
18
75
-19
56
1920-56
19
20
-31
,19
42
-56
19
47
-56
-- -.
1 Q
-17
eft
1Q49
5f
i
1953
1947
1875
19
28
1923
1955
1955
1953
1947
Jan.
31
Jan.
31
Feb
. 1
Jan.
29
Jan.
29
Jan.
29
Jan.
29
.Tan
. 29
13.7
6 15
.59
10.3
0 10
.98
18
15.4
14
.71
199.
0 8.
32
5.75
5.
75
13.7
3 15
.35
7.42
5.
00
9.86
10
. 75
10,8
00
12,8
00
5,64
0 6,
400
(0
32,0
00
28,3
00
6,00
0 3,
800
5,28
0 4,
200
11,4
00
15,1
00
813
309
6,57
0 7.
680
1.3
1.4
1.9
CO

108
1AO
110
in 112
114
115
116
117
lift
119
19ft
121
199
1Q
Q
124
126
197
4765
4700
JQ
QC
4840
4855
4ftf
iO
J.&
AQ
4870
J.&
7K
4880
J.Q
QC
4.Q
4Qfl
ft
AQ
i\ti
4910
4CTC
*
4940
J.Q
QC
5185
'
Nort
h F
ork
Hol
ston
Riv
er n
ear
Sal
tvil
le, V
a... _
___ ..
...
703 13
.7
on a
468
471
137
692
1,84
0
1,90
3
1.93
5
222
402 79
.6
672
2.87
4 47.3
3,42
9
3,42
9
269
118
18fi
71951-56
-
1945-56
1939
-56.
_
1940
- ___ .
1902
-8,1
948-
56 _
_ -
1901. .
..... .
...
1911
-16,
192
0-56
. _
19
01
1925
-49,
1953-5
6 .
19
52
-56
.. .
......
1953-56
19
01
__
1
92
5-5
6. . _
__ .
1907-8
,1920-5
6-
1951
-56.
_
1952-5
6
__
__
.
1931
-56.
...........
18
67
ICU
fl-N
R
1941
-49,
1954
-56.
...
1941-5
6
1867...... ..
.......
1936-5
6
1875
.. ..
....
....
...
1951
56
1840 ..
.........
19
25
-56
1867
1953
1948
1940
1950
1940
1906
1901
1940
1901
1940
1953
1954
1901
1940
1944
1956
1956
1940
1867
1944
1955
1944
1867
1940
1875
1954
1840
1951
Feb
. 11
Feb
. 12
Jan.
29
Feb
. 28
Feb
. 1
Feb
. 1
Feb
. 10
Jan.
29
Ion
9Q
Jan.
31
Feb.
11
Feb.
11
Feb.
1
Jan.
31
U, 7
23. 3
6 5537
.70
40.4
55.
944
AS
29.6 6.45
* 1,
958
. 58
* 1,
946
. 96
0) 0) 35.3
810
.56.
755.
65
21 20.8
78.
61U
, 384
. 52
U, 3
70. 3
6U
, 263
. 80
U, 2
62. 4
221
2321
18.
80
6.67
10.7
513
.20
12.9
316
.50
7.95
8.36
14.7
516
.73
31 17.4
814
.32
6.83
6.73
U
. 074
. 37
U, 0
39. 9
360 41
.82
32.1
931
.018
.44
21.1
8 15 12
.82
13.6
0
»596
(') '3,3
60' 8
. 270 383
278
50,8
002
9 on
5495
«566
20 7
1. 5
0021
,500
'2,8
9039
,000
7,30
04,
990
75.9
0075
, 100
' 8,
000
8194
6140
627.
762
6.5
110,
000
68,8
00'
15, 8
0011
, 700
16,5
0013
, 100
24,3
003,
110
3.34
023
, 700
28, 7
000) 59
.600
' 45,
100
3,28
03,
180
» 1. 5
4067
190) 58
, 700
'25,
900
0) 13,3
0019
,600
21
.500
15,1
0017
.500
1.0
1.3
1.6
See
foot
note
s at
end
of t
able
.

Sta
tion
Perm
a
nent
st
atio
n N
o.St
ream
and
pla
ce o
f det
erm
inat
ion
Dra
inag
e ar
ea
(sq.
m
Max
imum
flo
ods
Pri
or t
o Ja
nuar
y 19
57
Peri
odY
ear
Jan.
-Feb
. 19
57
Gag
e he
ight
(f
t)
Dis
char
ge
Cfs
Rat
io
to
QZ.M
Ten
ness
ee R
iver
bas
in C
onti
nued
128
129
130
.31
132
133
134
135
136
137
138
139
140
141
142
5215
,230
5240
5245
5260
5270
5275
5280
5295
5315
Lit
tle
Riv
er a
t W
arde
ll, V
a.. _
_ ..
....
....
....
....
125
139
103 51
.5
528
87.3
41.4
106
1,12
6 23.1
1,47
4
112 40
70
319
1901. _
__._
.__
1944
-46.
.. .........
1946
-56.
.. _ ..
....
1949
-52.
. ...
....
...
1952-5
6. ..
....
..
1920-5
6. ..
....
..
1949-5
6.
....
....
1918
... ..
....
....
..19
49-5
6. _
. _ ..
..
1947
-56.
__
.......
1895
-195
6. _
......
1952-5
6 ..
....
..
1862
1918
-56
1944
-56.
__
_ ..
....
1944
-47,
1951
-56
.
1944
-56.
__
__
....
1931-56
1901
19
46
1953
1950
1953
1926
1956
1918
19
56
1950
1902
1956
1862
19
23
1946
1946
1946
1946
Jan.
29
Jan.
29
Jan.
29
Jan.
29
Jan.
30
Jan.
29
Jan.
29
Jan.
30
Jan.
30
Jan.
28
Jan.
31
Jan.
29
Jan.
29
Jan.
29
Jan.
30
16 7.4
14.4
1 13
.23
19.3
8.
05
14.3
4 4.
27
4.48
23
.0
24.4
0 10
.83
14.2
0 9 6.
55
6.12
13
.0
9.98
22
26.
6
28.9
2 7.
40
7.34
24
(')
21.0
0 9.
8 9.
67
8.0
8.62
12
.1
8.70
30
.8
26.8
7
0) 4,80
0
5,08
0 9,
640
1,83
00)
2,65
0 2,
740
26,5
00
31, 0
00
4,02
0 6,
360
12,0
00
2,55
0 2,
220
6,80
0 3,
200
42,0
00
45,3
00
800
789
66,0
00
39,7
00
51, 1
00
16,5
00
11,0
00
3,10
0 3,
550
9,70
0 4,
430
30,0
00
19, 8
00
2.0

FLOODS OF JANUARY-FEBRUARY 1957 IN KENTUCKY A37
OOCOCN T-tOJOC*O T-H < ^ ^c
>OT-<OT-<IN
C-C-?qrHC
(N (N
? I
44 f**
j SI -go 3^ O
£ I
* ^
S § ? § « H
£ .1
^ co
Isa »a^If
IS
s ISa«j IiS
§|S Sl°l ill fill> o op 3 5 c a
^

A38 FLOODS OF 1957
The second column under maximum floods shows the year in which the maximum stage or discharge occurred.
The third column under maximum floods gives the date of the maximum stage or discharge during the flood period January- February 1957.
Some of the stages and discharges listed in the table are affected by regulation, backwater, or other factors. These effects are indi cated in footnotes and may be more fully described in the correspond ing station description in the section of station data.
The discharges for gaging stations were determined as described in the preceding section, "Stages and discharges at stream-gaging sta tions." Discharges for points not regularly gaged have been deter mined by indirect measurements. These methods of measurement are named in the section, "Determination of flood discharges." The flood discharges and stages are given as observed; some may be affected by storage, backwater, or miscellaneous factors that would make the figures only partly representative of natural conditions. The user should consult the report (see section, "Streamflow data") to deter mine the degree of such factors at any station.
FLOOD FREQUENCIES
In table 8, the last column under maximum floods gives the ratio of the peak discharge of the floods of January-February 1957 to Q2 .33, the mean annual flood. By definition, the mean annual flood is an annual flood (highest momentary peak discharge in a water year) having a recurrence interval of 2.33 years.
The ratios given in the table were computed from two Geological Survey frequency studies: "Floods in Kentucky, Magnitude and Fre quency," U.S. Geological Survey open-file report and "Floods in Tennessee, Magnitude and Frequency," Tennessee Department of Highways.
Throughout a region of uniform flood-frequency characteristics, a relation exists between the ratio of an annual flood to the mean annual flood and the recurrence interval of the annual flood. However, this does not apply to highly regulated streams and in many cases data are not available to compute the ratio for small drainage areas.
The streamflow stations in Kentucky and Tennessee used in this report lie in four regions, each having different flood-frequency characteristics:
Eegion 1 includes the basins of Big Sandy River, Tygart Creek, upper Licking Eiver, Kentucky Eiver and tributaries above the mouth of Red River, Green River above the mouth of Barren River, that part of Cumberland River that lies in Kentucky, and a few stations in the adjacent areas of Virginia and West Virginia.

FLOODS OF JANUARY-FEBRUARY 1957 IN KENTUCKY A39
Kegion 2 is the main stem of Kentucky River below the mouth of Red River.
Region 3 is that part of Kentucky not in regions 1 and 2.Region 4 is the report area that lies in Tennessee.An estimate of the recurrence interval of a given peak discharge at
any station for which a ratio is known can be made from figure 13.
RATIO OF PEAK DISCHARGE TO MEAN ANNUAL FLOOD
O t t N> N> OJ 0
1~*O CJi O CJi O Ui O C.
^, ^.f^'3^
K*^<£^
^--
k^ - Region.
x,^
----
^
2*»*^ "*"""
>/v-
--
x
"
1 1.1 1.2 1.3 1.5 2 3 4 5 7 10 15 20 30 40 5RECURRENCE INTERVAL, IN YEARS
FiotJBE 13. Frequency of floods in Kentucky and Tennessee.
By using the ratio of a given flood to the mean annual flood of the same station (ordinate) and the frequency curve for the appropriate region, the recurrence interval may be determined on the abscissa.

A40 FLOODS OF 1957
STREAMFLOW DATA
KANAWHA RIVER BASIN
1. WALKER CREEK AT BANE, VA.
Location. Lat 37°16'05", long 80°42'35", on left bank 0.2 mile downstream from bridgeon State Highway 100 at Bane, Giles County, 0.2 mile downstream from Sugar Run, and7.9 miles upstream from mouth.
Drainage area. 305 sq mi. Gage-height record. Water-stage recorder graph. Datum of gage is 1,665.92 ft above
mean sea level, datum of 1929. Discharge record. Stage-discharge relation defined by current-meter measurements
below 7,200 cfs and by slope-area measurement at 16,500 cfs. Maxima. January-February 1957: Discharge, 16,500 cfs 1 a.m. Jan. 30 (gage height,
16.50 ft).1938 to December 1956: Discharge, 13,700 cfs June 17, 1949 (gage height, 14.44 ft). Maximum stage known, about 23.5 ft in September 1878.
Mean discharge, in cubic feet per second, 1957
Day
1.---.2_____3 __ ._4_..._5_____6 __ ..7 __ ..8 __ .9 __ _10 .... 11 __ .
January
230 202 156 192 189 189 177 175 448
2,120 1,440
Monthly mean dis Runoff, in inches
February
4,190 2,820 1,960 1,520 1,220 1,700 1,630 2,040 5,340 3,440 2,340
Day
12 __ _ 13.... 14_._.15 .... 16 .... 17 __ _ 18 __ . 19 __ . 20 __ . 21 __ _ 22 __ .
January
918 700 530 406 347 270 216 205 200 228 240
February
1,700 1,260
982 790 670 569 476 682
2,190 1,360 1,020
Day
23 .... 24. ... 25 .... 26. ... 27.... 28 .... 29....30. ...31 ....
charge, in cubic feet per second - .
January
424 682 547 486 393 603
6,3407,6003,260
971 3.67
February
790 658 564 586 820 852
1,577 5.38
Gage height, in feet, and discharge, in cubic feet per second, at indicated time, 1957
Hour
Jan. 27
12 p.m....
Jan. 28*
12 m __ _.6 p.m.....12 p.m....
Jan. 29
4 __ . __ .6.---. __ .8.........10 __ __ .12 m __ .2 p.m.....4.... __ ..6 ______ .
Gage height
4.53
4.594.705.106.05
6.446.777.057.458.249.45
10.6012.0013.45
Dis charge
388
416470700
1,330
1,6201,8702,0802,3803,0304,2606,0208,400
10.900
Hour
Jan.29-Con.
10..... ...
Jan. 30*
2---,.. ...4__ __ ....6.. ._..___8 .........10... .....12 m .. ...
4.. __ ....6------ ...8__ __ --..10 ___ ....
Gage height
14.5515.65
16.5016.1014.5013.1012.1011.3010.6010.089.67Q Qft
9.008.748 c n
Dis charge
12,80014,80016,000
16,50015,70012,70010,3008,5707,2106,0205,1504,5504,0703,7203,4803,260
Hour
Jan. 31*
12 m_____
12 p.m....
Feb 1*
6 a.m.....12 m .....
Feb. 2*
12 m .....
12 p.m....
Gage height
8.007.988.74
10.12
9.879.509.008.61
8.358.057.687.37
Dis charge
2,8202,8003,4805,210
4,8304,3203,7203,360
3,1202,8602,5602,320

FLOODS OF JANUARY-FEBRUARY 1957 IN KENTUCKY A41
Gage height, in feet, and discharge, in cubic feet per second, at indicated time, 1957 Continued
Hour
Feb. 3*
12 m __ _.
12 p.rn---.
Gageheight
7.116.906.736.61
Dis charge
2,1201,9601,8401,750
Hour
Feb. 4*
12 m __ ..
12 p.m.__.
Gageheight
6.446.306.156.02
Dis charge
1,6201,5201,4001,300
Hour
Feb. 5*
12 m ____-
12 p.m_---
Gageheight
5.895.835.846.13
Dis charge
1,2101,1701,1801,390
*Daily mean discharge cannot be computed exactly from data shown.
2. WOLF CREEK NEAR NARROWS, VA.
Location. Lat 37* 18'20", long 80°5l', on right bank at downstream side of bridge on StateHighway 61, 2.8 miles southwest of Narrows, Giles County, and 3.5 miles upstreamfrom mouth.
Drainage area. 223 sq mi. Gage-height record. Water-stage recorder graph. Datum of gage is 1,583.85 ft above
mean sea level, datum of 1929. Discharge record. Stage-discharge relation defined by current-meter measurements
below 5,700 cfs and by contracted-opening measurement of 12,700 cfs. Maxima. January-February 1957: Discharge, 12,900 cfs 10 p.m. Jan. 29 (gage height,
12.55 ft in gage well and 13.8 ft, from floodmarks, at downstream side of bridge).1908-16, 1938 to December 1956: Discharge, 11,000 cfs July 16, 1916 (gage height,
13.0 ft, from floodmarks).
Mean discharge, in cubic feet per second, 1957
Day
'1 ___ ..2 __ ..3 ___ .4 ___ .5_____.6.. __ .
8-_ __ .9 ___ .10 __ .. 11 __ ..
Monthly Runoff,
January
268 226 164 212 222 240 240 236
1,410 2,980 1,730
February
4,540 3,220 2,020 1,390 1,090 1,220 1,300 1,990 4,600 3,610 2,400
Day
12 _____13 ___ .14__.__15 _____16.. ___17-. ___18-.-.-19____.20_. ___21 _____22. __
January
1,030 780 605 480 420 344 272 256 240 '
252 292
' mean discharge, in cubic feet per seco in inches
February
1,440 1,060
830 680 605 505 412 792
1,640 1,060
858
Day
23.. ___24 _____25 _____26.. ___27 _____28_-._-29 _____30 _____31.-.--
nd __ ____ __. ___
January
520 705 605 510 464
1,220 7,0307,3603,640
1,128 5.83
February
730 630 570 605 655 680
1,469 6.86
Gage height, in feet, and discharge, in cubic feet per second, at indicated time, 1957
Hour
Jan. 27
Jan. 28
12 m __ _ n6 p.m_.._j
Gage height
4.04
4.204.975.97
Dis charge
500
580978
1.700
Hour
Jan. 28-Con,
Jan. 29
4_. __ -.-6__ __ __
Gage height
7.00
7.217.367.44
Dis charge
2,740
2,9903,1703,270
Hour
Jan. 29-Con.
10... .12 m _--..
4 ___ .-.-6-. __ -_-.8_. __ -.--
Gageheight
7.567.878.80
10.1011.3512.2012.40
Dis charge
3,4303,8305,2007,400
10,00012,00012,500

A42 FLOODS OF 1957
Gage height, in feet, and discharge, in cubic feet per second, at indicated time, 1957 Continued
Hour
Jan. 29-Con.
10 p.m....12 p.m....
Jan. 30
8 __ __ .12 m .....4 p.m.....8 __ .....12 p.m_._-
Jan. 31
8.........12 m __ _
8____ __ _.12 p.m....
Gage height
12.5512.40
11.7510.699.758.918.307.77
7.377.127.117.908.538.55
Dis charge
12,90012,500
10,9008,5806,7805,3604,4503,700
3,1802,8802,8703,8704,8004,820
Hour
Feb. 1
12 m .....6 p.m._... 12 p.m....
Feb. 2
12 m .....
12 p.m....
Feb. 3
12 m .....
Gage height
8.688.438.10 7.93
7.757.417.036.65
6.346.07
Dis charge
5,0204,6404,150 3,910
3,6803,2302,7802,510
2,2401,970
Hour
Feb.3-Con.
12 p.m....
Feb. 4
12 m . __ .
12 p.m....
Feb. 5
12 m _____|
Gage height
5.895.70
5.535.375.215.08
4.954.894.914.96
Dis
charge
1,8101,640
1,5001,3801,2701,180
1,0901,0501,0701,100
3. NEW RIVER AT GLENLYN, VA.
Location. Lat 37 e22'20", long 80°51'45",on right bank at upstream side of bridge on U.S. Highway 460 at Glenlyn, Giles County, 0.3 mile upstream from East River and 6.3 miles downstream from Wolf Creek.
Drainage area. 3,768 sq mi.Gage-height record. Water-stage recorder graph. Datum of gage is 1,489.76 ft above
mean sea level, datum of 1929.Discharge record. Stage-discharge relation defined by current-meter measurements
below 65,000 cfs and by slope-area measurement at peak stage.Maxima. January 1957: Discharge, 57,800 cfs 12 p.m. Jan. 29 (gage height, 12.59 ft).
1927 to December 1956: Discharge, 226,000 cfs Aug. 14, 1940 (gage height, 27.50 ft), from rating curve extended as described above.
Flood of Sept. 13, 1878, reached an estimated stage of 33.1 ft, at Narrows, 6.5 miles upstream at different datum (discharge, 240,000 cfs, from stage-discharge relation defined by current-meter measurements to 17,500 cfs and extended above by logarith mic plotting).
4. BLUESTONE RIVER NEAR SPANISHBURG, W. VA.
[Gaging station, discontinued 1952]
Location. Lat 37°26'00", long 81°06'40",on right downstream abutment of bridge on U.S. Highways 19 and 21, 1.1 miles southeast of Spanishburg, Mercer County, 1.4 miles up stream from Rich Creek, 1.7 miles downstream from Blacklick Creek.
Drainage area. 199 sq mi.Gage-height record. Crest-stages only. Datum of gage is 2,051.13 ft above mean sea
level, adjustment of 1912.Discharge record. Stage-discharge relation defined by current meter measurements
below 5,000 cfs.Maxima. January-February 1957: Discharge, 7,900 cfs Jan. 29, crest-stage gage height,
19.6 ft.1944 to September 1952 (discontinued). Discharge, 6,920 cfs Jan. 8, 1946 (gage
height, 18.36).

FLOODS OF JANUARY-FEBRUARY 1957 IN KENTUCKY A43
5. CAMP CREEK NEAR CAMP CREEK, W. VA.
Location. Lat 37°30'15", long 81°07'40", on left bank 1,500 ft downstream from Mash Fork and 2.1 miles upstream from town of Camp Creek, Mercer County.
Drainage area. 32.0 sq mi.Gage-height record. Water-stage recorder graph. Altitude of gage is 2,050 ft (from
topographic map).Discharge record. Stage-discharge relation defined by current meter measurements.Maxima. January-February 1957; Discharge, 3,410 cfs 12:30 p.m. Jan. 29 (gage height,
6.35 ft).1946 to December 1956; Discharge, 2,720 cfs Feb. 14, 1948 (gage height, 5.84 ft).
Mean discharge, in cubic feet per second, 1957
Day
!--__-2 ...._3. __ _4. __5-.___6_ ....7. __ _8 _....9_ ....10.... 11-..-
January
24 22 20 24 26 21 24 23 602 512 219
Monthly mean di Runoff, in inches
February
580 436 194 116 140 246 266 367 622 447 223
Day
12 .....13 ___14 __ ._15. ....16 .....17 _____18 _____19 _____20 _____21 _____22 _____
January
115 78 55 50 36 30 27 25 25 30 35
scharge, in cubic feet per sec<
February
129 93 72 56 53 44 40 128 196 131 93
Day
23 _____24. ....25. ____26--.-.27 __ _.28.....29 _____30_.___31 _____
January
100 120 83 70 62
427 1,900556 385
185 6.65
February
75 64 59 56 49 66
180 5.86
Gage height, in feet, and discharge, in cubic feet per second, at indicated time, 1957
Hour
Jan. 26
12 p.m...
Jan. 27
12 p.m...
Jan. 28
8. __...._12 m -.__
8 __ __ .12 p.m_._
Jan. 29
1 a.m____ 2 ________3 ________4 ________5. __ ....
Gage height
1.67
1.661.701.78
2.002.512.873.303.713.49
3.43 3.383.353.433.74
Dis charge
59
586375
115264406600795686
658 636622658810
Hour
Jan.29-Con.
6 a.m.... 7 ___ ...8 ___ ...9 ________10 _______11___ __ _12 m __ _ 12:30 p.m 1_ __ __ _2 ________3 __ _. ___5 ________6 ________7_ _______9 _...____11 _______12 p.m___
Jan. 30
12 m __ _
12 p.m...
Gage height
4.22 4.705.155.485.766.106.32 6.35 6.326.205.965.655.555.405.004.534.33
3.453.022.792.52
Dis charge
1,070 1,4501,9002,2702,6103,0603,370 3,410 3,3703,2002,8702,4702,3502,1701,7401,3001,150
688474371266
Hour
Jan. 31
4 a.m.... 8_- ___ .12 m ....
8 __ ..__12 p.m__.
Feb. 1
8-..-----12 m ____
8________
Feb. 2
6 a.m.... 12 m ____
12 p.m___
Gage height
2.52 2.452.752.953.153.47
3.393.253.123.063.283.40
3.17 2.90 2.692.50
Dis charge
266 242355442532676
640578519492591645
542 420 331259

A44 FLOODS OF 1957
Gage height, in feet, and discharge, in cubic feet per second, at indicated time, 1957 Continued
Hour
Feb. 3
12 m __ .
12 p.m....
Gage height
2.362.292.192.10
Dis charge
214193166144
Hour
Feb. 4
12 m ___ .
12 p.m....
Gage height
2.031 971.901.85
Dis charge
12911610293
Hour
Feb. 5
12 m ._...
12 p.m_._.
Gage height
1.841 982.282.39
Dis charge
91118191223
6. BLUESTONE RIVER NEAR PIPESTEM, W. VA.
Location. Lat 37°32'45", long 81°00'30", on left bank 1.2 miles downstream from Mountain Creek, 2.5 miles west of Pipestem, Summers County, and 8 miles upstream from mouth.
Drainage area. 363 sq mi.Gage-height record. Water-stage recorder graph. Datum of gage is 1,527.35 ft above
mean sea level, datum of 1929 (Corps of Engineers bench mark).Discharge record. Stage-discharge relation defined by current meter measurements.Maxima. January-February 1957: Discharge, 16,100 cfs 6 p.m. Jan. 29 (gage height,.
14.49 ft).1950 to December 1956: Discharge, 14,900 cfs Feb. 28, 1955 (gage height, 13.86 ft). Maximum discharge known (since 1908), that of Jan. 29, 1957.
Mean discharge, in cubic feet per second, 1957
Day
1. __ .2. __3 _____4. __5-_.._6. __7 _____8-__-.910.__. 11-..-
January
306 254 183 236 269 312 371 392
3,520 5,420 3,460
Monthly mean die Runoff, in inches
February
6,890 5,510 3,190 1,980 1,570 1,880 2,150 3,100 5,740 5,580 3,820
Day
12.-.. 13^..14^ _._ 15. __ 16 ____ 17____ 18. ___ 19 ____ 20 __ . 21....
January
1,800 1,100
800 620 525 406 309 274 291 324
charge, in cubic feet per secc
February
2,240 1,480 1,100
875 760 680 560 995
2,600 1,800
Day
22_____23-.__-24---..25--__.26. ____27.. __28 __ ..29-.__.30. ____31-.__-
January
448 2,520 1,800 1,160
850 723
3,570 12,300 13,800
6,900
2,107 6.69
February
1,250 950 800 700 660 640 580
2,148 6.16
Gage height, in feet, and discharge, in cubic feet per second, at indicated time, 1957
Hour
Jan. 26
12 p.m...
Tun. 27
12 m __
12 n.m___
Gage height
4.82
4.724.704.785.19
Dis charge
728
688680712895
Hour
Jan. 28
2 a.m.....4____ __ -.6__ .......8 __ _____10 __ ____12 m -.--.2 p.m_____4._.._ __ .
Gage height
5.385.776.507.257.908.348.709.22
Dis charge
9901,2001,7202,3703,0003,5103,9404.650
Hour
Jan. 28-Con.
6 p.m....8.-------10-.-.-..12 p.m___
Jan. 29
3 a.m....
Gage height
9.8510.0810.1310.13
10.08
Dis charge
5,6606,0806,1906,190
6,080
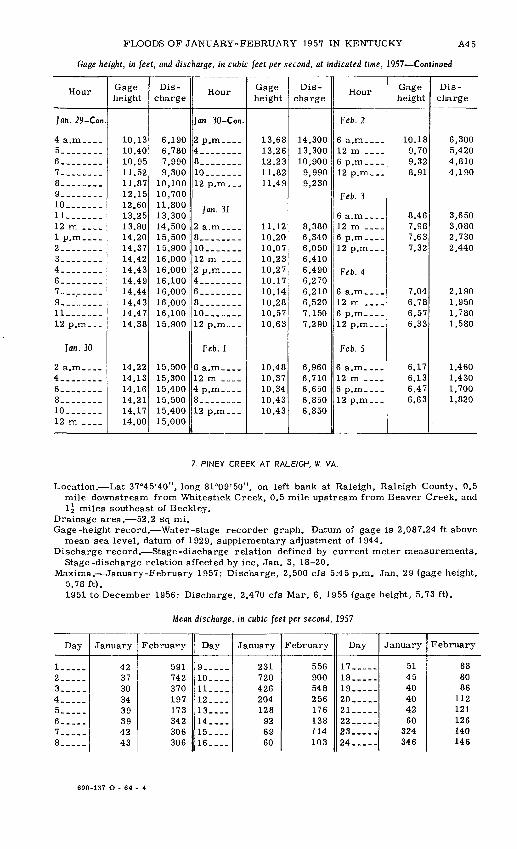
FLOODS OF JANUARY-FEBRUARY 1957 IN KENTUCKY A45
Gage height, in feet, and discharge, in cubic feet per second, at indicated time, 1957 Continued
Hour
Jan. 29 -Con.
4 a.m____ 5__..__._6_ __ ....7_...__8 __ _____9 ____ ..10 ____ .ll---_-_-12 m __._
2____.__.3_ ___ __4__..____6________7________9. __ .__.11. _ __ ..12 p.m___
Jan. 30
2 a.m.... 4. ____...6. ___ ..8. _______10 ___ ..12 m _ __
Gage height
10.13 10.4010.9511.5211.8712.1512.6013.2513.80 14.2014.3714.4214.4314.4914.4414.4314.4714.38
14.22 14.1314.1614.2114.1714.00
Dis charge
6,190 6,7807,9909,300
10,10010,70011,80013,30014,500 15,50015,90016,00016,00016,10016,00016,00016,10015,900
15,500 15,30015,40015,50015,40015,000
Hour
Jan. 30-Con.
2 p.m.... 4 __ ....8____ __ .10 _______12 p.m...
Jan. 31
2 a.m.... 8 ________10__ __ _12 m ....
4___._.._6 ________8 ________10 _______12 p.m...
Feb. 1
8 a.m.... 12 m ....
8___. ____
Gage height
13.68 13.2612.2311.8211.49
11.12 10.2010.0710.2310.2710.1710.1410.2810.5710.63
10.48 10.3710.3410.4310.43
Dis charge
14,300 13,30010,900
9,9909,230
8,380 6,3406,0506,4106,4906,2706,2106,5207,1507,290
6,960 6,7106,6506,8506,850
Hour
Feb. 2
6 a.m.___ 12 m _...
Feb. 3
12 m ....
Feb. 4
12 m ___.
12 p.m...
Feb. 5
6 a.m.... 12 m ....
12 p.m...
Gage height
10.18 9.709.328.91
8.467.98 7.637.32
7.046.786.576.33
6.17 6.136.476.63
Dis charge
6,300 5,4204,8104,190
3,6503,080 2,7302,440
2,1901,9501,7801,580
1,460 1,4301,7001,820
7. PINEY CREEK AT RALEIGH, W. VA.
Location. Lat 37°45'40", long 81°09'50", on left bank at Raleigh, Raleigh County, 0.5mile downstream from Whitestick Creek, 0.5 mile upstream from Beaver Creek, andIf miles southeast of Beckley.
Drainage area. 52.2 sq mi. Gage-height record. Water -stage recorder graph. Datum of gage is 2,087.24 ft above
mean sea level, datum of 1929, supplementary adjustment of 1944. Discharge record. Stage-discharge relation defined by current meter measurements.
Stage-discharge relation affected by ice, Jan. 3, 18 20. Maxima. January-February 1957: Discharge, 2,500 cfs 5:45 p.m. Jan. 29 (gage height,
5.78 ft).1951 to December 1956: Discharge, 2,470 cfs Mar. 6, 1955 (gage height, 5.73 ft).
Mean discharge, in cubic feet per second, 1957
Day
1. __ .2 _____3 __ .4.....5 _____6 __ _7.. __8_..__
January
4237303d.393942d.<?
February
591742370197173342306306
Day
9 _____10.___11 __1 9
13 __14 ____15. __16. ___
January
231720426204128926960
February
556900548256176138114103
Day
17 __ __18 __ -.19 __ ..20 __ __21 __ __22 __ __23 __ __24_____
January
514540404260
324346
February
888086
112121126140146
690-137 O - 64 - 4

A46 FLOODS OF 1957
Mean discharge, in cubic feet per second, 1957 Continued
Day
25 .... 26 .... 27....
January
176 110
90
Monthly mean dis Runoff, in inches
February
138 123 105
Day
28 .... 29 ....
January
258 1,540
charge, in cubic feet per seco
February
115
Day
30 __.._31. ....
January
1,350450
231 5.10
February
257 5.13
Gage height, in feet, and discharge, in cubic feet per second, at indicated time, 1957
Hour
Jan. 26
12 p.m...
Jan. 27
6 a.m.... 12 m .... 6 p.m.... 12 p.m___
Jan. 28
6 a.m.... 12 m .... 6 p.m.... 12 p.m...
Jan. 29
1 a.m.... 4 ........G.. ......8 __ _____9 ._.____.11-------1 p.m____ 2__._.___3 ________4 __ __ _5. _...__.5:45. __ .6 .____...7--__ _8 ________10 .......11. .._.._12. .......
Gage height
2.01
1.99 1.99 1.98 1.98
2.12 2.40 2.88 3.31
3.36 3.48 3.65 4.00 4.24 4.57 4.90 5.00 5.42 5.38 5.58 5.78 5.75 5.66 5.68 5.73 5.55 5.61
Dis charge
94
90 90 88 88
120 200 382575
600 660 750 960
1,130 1,380 1,650 1,740 2,140 2,100 2,300 2,500 2,470 2,380 2,400 2,450 2,270 2,330
Hour
Jan. 30
1 a.m....
3........4__ ___ .5... __ ..6__ __ ...8 ____ ..9. _______10 __ ___ll-_--__-12 m _.__ 1 p.m.... 2________3 __ _____4........5 __ ...__6_....._.8__ __ ._9___ _____10_... ...12 p.m...
Jan. 31
4 a.m.... 8... __ ..12 m .... 4 p.m.... 8. ___ ..12 p.m...
Feb. 1
4 a.m.... 8 ___ ...12 m . .__
Gage height
5.55 5.47 5.30 5.25 5.08 4.95 4.75 4.61 4.53 4.50 4.30 4.27 4.26 4.16 4.10 4.17 4.03 3.86 3.84 3.72 3.57
3.28 3.08 2.93 2.82 2.84 2.89
2.99 3.19 3.28
Dis charge
2,270 2,190 2,020 1,970 1,810 1,700 1,520 1,410 1,340 1,320 1,170 1,150 1,140 1,070 1,030 1,080
981 876 864 792 705
561 471 404 358 366 386
430 520 561
Hour
Feb. 1-Con.
4 p.m.... 8---.----12 p.m...
Feb. 2
4 a.m.... 8 __ __--.4 p.m.... 8 __ _____12 p.m...
Feb. 3
6 a.m.... 12 m .... 6 p.m.... 12 p.m...
Feb. 4
6 a.m.... 12 n ..-- 6 p.m.... 12 p.m...
Feb. 5
6 a.m.... 12 m .-_. 6 p.tn.___ 12 p.m___
Gageheight
3.45 3.70 3.79
3.82 3.73 3.60 3.42 3.27
3.02 2.79 2.65 2.53
2.45 2.38 2.32 2.24
2.18 2.22 2.39 2.62
Dis charge
645 780 834
852 798 720 630 556
444 346 290 246
218 194 176 152
135146
197 278

FLOODS OF JANUARY-FEBRUARY 1957 IN KENTUCKY
8. ELK RIVER AT SUTTON, W. VA.
A47
Location. Lat 38°39'45", long 80°42'35", near left bank on downstream side of pier ofhighway bridge at Button, Braxton County, half a mile upstream from Granny Creekand 2^ miles downstream from Wolf Creek.
Drainage area. 543 sq mi. Gage-height record. Water-stage recorder graph, except, Jan. 2-3, 15-20 for which graph
was constructed from range of stage of recorder graph and from once-daily wire-weightgage readings by Weather Bureau. Datum of gage is 808.03 ft above mean sea level,datum of 1929.
Discharge record. Stage-discharge relation defined by current meter measurementsbelow 29,000 cfs and extended above by logarithmic plotting.
Maxima. January-February 1957: Discharge, 34,200 cfs 11 p.m. Jan 29 (gage height,31.27 ft).
1938 to December 1956: Discharge, 32,300 cfs Oct. 16, 1954 (gage height, 29.42 ft). Maximum stage known, 37.2 ft Mar. 13, 1918, from floodmarks (discharge, about
49,000 cfs).
Mean discharge, in cubic feet per second, 1957
Day
!-__--2_____3 _____4_____5 _____6__.._7 __ .8__._.9-_.-_10.__ _ ll-_-.
January
1,160 1,160 1,000
970 850 735 660 645 635
6,430 6,910
Monthly mean dis Runoff, in inches
February
4,070 8,270 4,360 2,780 2,120 2,480 2,830 2,320 2,160
10,200 6,000
Day
12____ 13 __ _ 14.___ 15 __ _ 16._._ 17__._ 18 __ . 19 __ . 20____ 21_.__ 22... _
January
3,010 2,000 1,440 1,100
970 685 437 520 595 650
1,000
charge, in cubic feet per secc
February
3,190 2,400 2,000 1,660 1,410 1,270 1,060 1,000 1,100 1,000 1,000
Day
23_____24-_-._25 __ ._26-_.._27__...28 __ _.29__-._ 30 __ .31 __ _.
January
6,440 5,200 2,830 1,920 1,440 1,810
18,100 17,0004,580
2,996 6.36
February
1,000 1,100 1,340 1,620 2,160 2,080
2,642 5.07

A48 FLOODS OF 1957
Gage height, in feet, and discharge, in cubic feet per second, at indicated time, 1957
Hour
Jan. 26
12 pjoa _
Jan. 27
6 a.m ____12 m _ ...12 p.m ...
Jan. 28
6 a.m ____12 m ____ 6 p.m ____12 p.m ...
Jan. 29
1 a.m ___.3_--__-.-4________5 _._...__6_. __ ...7__ __ ._.8. __ __9. __ ...10 a.m ___12 m__ ...1 p.m ____ 2_ ___ __3 ___ __4. __ ___5. _......6. __ ....8 ________10 _______11__ __ ._12 p.m...
Gageheight
5.80
5.655.525.31
5.24 5.47 6.338.50
9.4011.4012.1012.7013.1013.6014.6015.9517.1019.5021.10 22.5024.2025.8027.0028.0030.0031.1531.2731.15
Dis charge
1,620
1,5201,4201,280
1,230 1,390 2,0203,910
4,7206,7007,4008,0008,4008,9009,900
11,20012,60015,50017,400 19,60022,20024,80026,70028,30031,90034,00034,20034,000
Hour
Jan. 30
1 a.m _2 _______3 _______4 _.. __5 _______7 _______8 ____ _9 ... ___10 _...._11 ....__12 m____ 1 p.m ... 2 _______3 _______4 . ___ _5 _ __ .._6 . __ ...8 . __ ...9 _______10 __ ...
Jan. 31
8 _--.-_.12 m..._4 p.m ... 8 ._ __ .
Feb. 1
8 __ .__12 m __ _4 p.m _._
Gageheight
30.8030.1029.3028.1027.0024.5023.3022.2521.2520.2018.85 17.60 16.5015.5014.7014.1013.4012.5012.10n ?^11.15
10.229.559.028.58 8.378 no
7.887.777 Q9
8.56
Dis charge
33,30032,10030,60028,50026,70022,70020,80019,20017,70016,30014,700 13,200 11,90010,80010,0009,4008,7007,8007,4007,0506,450
5,5204,8604,3803,980 3,7903 490'
3,3503,2503,3903,960
Hour
Feb. 1 Con.
8 _______12 p.m _ _
Feb. 2
4 a.m_._.8 _______12 m ___
8 _......12 p.m...
Feb. 3
12 m __ _
12 p.m...
Feb. 4
12 m __..
Feb. 5
12 m __ .
Gage height
9.8211.90
13.9214.5713.7512.7011.6010.67
9.608.858.277.82
7 i^n7 236 QO
6 "7 o
6.506.346 0 7
6.50
Dis charge
5,1207,200
9,2209,8709,0508,0006,9005,970
4,9004,2203,7003,300
3,0102,7702,5402 340'
2,1602,0302 nc f\
2,160

FLOODS O^1 JANUARY-FEBRUARY 1957 IN KENTUCKY
GUYANDOT RIVER BASIN
9. GUYANDOT RIVER AT MAN, W. VA.
A49
Location. Lat 37°44'30"
Gage-height record. Wat height record Jan. 31 to
long 81°52'45" , on right bank on downstream side of highwaybridge at Man, Logan County, 500 ft upstream from Buffalo Creek and 0.7 mile down stream from Huff Creek. Records include flow of Buffalo Creek.
Drainage area. 762 sq ml (including that of Buffalo Creek).;r-stage recorder graph, except for periods of doubtful gage- Feb. 1 and Feb. 3-14 for which graph was reconstructed from
existing recorder record and engineers' readings. Datum of gage is 710.88 ft abovemean sea level, adjustment of 1912.
Discharge record. Stagejdischarge relation defined by current meter measurementsbelow 24,000 cfs.
Maxima. January-Februiry 1957: Discharge, 37,600 cfs 10:30 p.m. Jan. 29 (gage height,22.25 ft).
1928 to December 195^: Discharge observed, 40,000 cfs Mar 3, 1934 (gage height,19.11 ft from rating cur-jre extended above 20,000 cfs.
(Vfean discharge, in cubic feet per second, 1957
Day
1__ ...2 ....3.....4 .. _5____6.. ._7 ...8.---.9---..10.... 11-...
January
696 636 525 555 690 708 738 785
5,710 13,600 6,410
Monthly mean dis Runoff, in inches
Februai
9,13 12,50 6,12 3,83 3,41 6,59 5,72 5,56
10,10 13,90 9,10
y
0 0 0 0 0 0 0 0 0 0 0
Day
12 . ...13 _..._14 __ ___15 .....16 -.--.17 -_...18 ---.19 _____20 ...21 .....22 .....
January
3,470 2,460 1,840 1,440 1,210
942 773 745 717 766 882
February
5,080 3,340 2,740 1,880 1,560 1,360 1,140 1,450 3,280 3,160 2,620
Day
23 __ . 24 .... 25 .... 26 .... 27 .... 28 __ _ 29 __ .30 ___31 ....
charge, itn cubic feet per second ________________
January
4,180 5,400 3,220 2,290 1,880 4,480
25,30020,800
6,540
3,883 5.88
February
2,240 2,080 1,880 1,740 1,560 1,440
4,447 6.08
Gage height, in fee^, and discharge, in cubic feet per second, at indicated time, 1957
Hour
Jan. 26
12 p.m....
fan. 27
12 m._ __
12 p.m _ .
Jan. 28
12 m___-_
12 p.m ...
Gage height
5.80
5.715.695.645.63
5.886.779.05
11.50
Dis-
charg
1,98(
1,891)1,8711,8311,82(
2,06^3,06(6,32(
11.10I
«
|)
111"I
111)
Hour
Jan. 29
3 . ____4 _. ....5 -----6 ________7 -----.-.8 ________10 .____._12 m._ .-1 p.m .... 2 ........34 ........5 ________6 ... .
Gage height
12.0012.3212.5512.8513.2013.7014.2515.9017.9018.90 19.7020.2020.6021.1021.45
Dis
charge
12,10012,80013,300
14,80015,90017,20021,20026,20028,800 30,90032,20033,30034,60035.500
Hour
Jan. 29-Con.
8. ---.-.9....- ._10__ ____10:30....11 -_...12 p.m...
Jan. 30
2 a.m.... 4.. ......6.. .....10... ..
2 p.m.
Gage height
22.0022.1222.2222.2522.2222.12
21.40 20.3519.1016.3014.8013.60
Dis
charge
36,90037,20037,50037,60037,50037,200
35,300 32,60029,40022,20018,50015.700

A50 FLOODS OF 1957
Gage height, in feet, and discharge, in cubic feet per second, at indicated time, 1957 Continued
Hour
Fan. 30-Con.
4 p. in ____ 6________10. ______12 p.m___
Jan. 31
46. ___ __8________10_______12 m_.--_2 p.m ____ 4* _ ____6________8________10_______
Feb. 1
Gage height
12.65 11.9310.9510.52
10.149.839.569.329.108.928.77 8.638.628.628.648.72
8.86
Dis charge
13,500 12,00010,0009,140
8,3807,7807,2606,8106,4106,0905,840 5,6105,5905,5905,6205,750
5,990
Hour
Feb. 1-Con.
4 a. in ___ 6 _--.___8 _______10 ______12 m ___ 2 p.m.... 4 _-_--._6 --__-._8 --_-.__10 ______12 p.m __
Feb. 2
4 --__-_.6 -._ __ _8 --_-___10 _ __ _2 p.m __. 4 _______6 _. __ .10 ______
Gage height
9.08 9.309.559.85
10.20 10.62 11.1211.6712.2512.6012.88
13.0013.0813.1513.0812.8812.12 11.7011.3010.56
Dis charge
6,370 6,7707,2407,8208,500 9,340
10,30011,40012,60013,40014,000
14,30014,50014,60014,50014,00012,400 11,50010,7009,220
Hour
Feb. 2-Con.
12 p.m_._
Feb. 3
6 a.m ___ 12 m ____
Feb. 4
12 m ___6 p.m ___ 12 p.m _.
Feb. 5
12 m____
12 p.m __
Gage height
10.22
9.37 8.78 8.328.00
7.. 6 37.347.10 6.85
6.686.60 7.228.38
Dis charge
8,540
6,900 5,860 5,1104,640
4,1603,7803,470 3,160
2,9602,860 3,6305,210
10. GUYANDOT RIVER AT BRANCHLAND, W. VA.
Location. Lat 38°13'15", long 82°12'10", on right bank at downstream side of highway bridge at Branchland, Lincoln County, 20 ft downstream from Fourmile Creek.
Drainage area. 1,226 sq mi.Gage-height record. Water-stage recorder graph. Datum of gage is 547.91 ft above
mean sea level, adjustment of 1912.Discharge record. Stage-discharge relation defined below 32,000cfs by current meter
measurements. For periods of backwater from the Ohio River Jan. 11-13, Jan. 31to Feb. 5 and Feb. 10-13, the discharge is computed by the normal fall method between this station and the U.S. Corps of Engineers wire-weight gage at Midkiff, approximately 4 miles upstream.
Maxima. January-February 1957: Discharge, 40,400 cfs 10:30 p.m. Jan. 30 (gage height, 41.88 ft).
1915-22, 1928 to December 1956: Discharge, 36,900 cfs Jan. 29, 1918 (gage height, 39.24 ft); maximum gage height, 42.57 ft on Mar. 1, 1955 (backwater from the Ohio River)..
Maximum stage known, about 44 ft, from floodmark probably in 1907 (discharge, 43,500 cfs).
Mean discharge, in cubic feet per second, 1957
Day
1_____.2_____.3__ __ .4 ___ .5 ___ .6
January
1,050938838755815914
February
16,00017,00012,8007,4705,4507.420
Day
7_.___8. __ .q
10. __11 ....12____
January
938986
2,24013,60018,1009.000
February
9,4507,9809,800
17,70020,40011.800
Day
13 ..__14 ....15 ....16 ....17 ....18 __ _
January
4,6003,2102,2501,7701,4901.210
February
6,4004,7603,6402,9402.4702.140

FLOODS OF JANUARY-FEBRUARY 1957 IN KENTUCKY A51
Mean discharge, in cubic feet per second, 1957 Continued
Day
19 __ 20 __ . 21 __ .22 ____ 23 __ .
January
1,020 970
1,030 1,170 4,690
Monthly mean dis Runoff, in inches
February
1,870 2,790 4,270 3,920 3,570
Day
24 ___25 .... 26-___27 ....
January
8,750 6,860 4,200 2,830
charge, in cubic feet per seco
February
3,220 3,010 2,790 2,470
Day
28__. 29 __30 __31 ...
nd ____ .. ..__.._
January
3,210 14,30034,70032,500
5,804 5.46
February
2,230
6,991 5.94
Gage height, in feet, and discharge, in cubic feet per second, at indicated time, 1957
Hour
Jan. 26
12 p.m ___
Jan. 27
12 m _____
Jan. 28
12 m_.-__
12 p.m ___
Gage height
7.88
7 497.186 93
6.747 128.42
10.52
Dis charge
3,350
3,0409 7QO
2 con2 470'
9 A.A.O
2 7cn
3,7905,260
Hour
Jan. 29
6 a.ra ____ 12 m __..
Jan. 30
2 _ __ ____4 _-_---..5 ___.8 ___-__..9 ___ _.11 ___ ._1 p.m ____
Gage height
14.63 22 3027.00"* 1 ^^
O O OR
^ nn34.4035.1037.0037.5038.6039.60
Dis charge
8,140 14,80019,500">A. ^nn
oc *>nn26,20028,40029,60032,60033,40035,20036,800
Hour
fan.30-Con.
2 p.m-_-_- 34 _ ____ .58 __ __ .9 _ ____ .10 _______10:30 ___ .11 _.____.12 p.m __.
Gage height
40.00 40.4540.7541.1041.6841.8241.8741.8841.8741.82
Dis charge
37,400 38,10038,60039,20040,10040,30040,40040,40040,40040,300
BIG SANDY RIVER BASIN
11. PRATER CREEK AT VANSANT, VA.
[Crest-stage station]
Location. Lat 37°13'05", long 82°06'10", at Virginia Highway 620 bridge just off Virginia Highway 83, 500 ft downstream from Trace Fork, and 1 mile south of Vansant, Buchanan County.
Drainage area. 19.8 sq mi.Gage-height record. Crest stages only. Altitude of gage is 1,180 ft (by topographic map).Discharge record. Stage-discharge relation defined by current-meter measurement at
260 cfs and by contracted-opening measurements at 1,140 and 4,550 cfs.Maxima. January 1957: Discharge, 4,550 cfs, Jan. 29 (gage height, 9.45 ft).
1951 to December 1956: Discharge, about 1,500 cfs, April 28, 1952.

A52 FLOODS OF 1957
12. LEVISA FORK NEAR GRUNDY, VA.
Location. Lat 37°18', long 82°07'30", on left bank 50 ft downstream from wooden bridge to Appalachian Electric Power Co.'s substation, 2 miles northwest of Grundy, Buchanan County, 2.7 miles downstream from Slate Creek, and 2.8 miles upstream from Poplar Creek.
Drainage area. 235 sq mi.Gage-height record. Water-stage recorder graph except Feb. 13 17 when faulty intake
action occurred. Datum of gage is 986.17 ft above mean sea level, datum of 1929, supplementary adjustment of 1936.
Discharge record. Stage-discharge relation defined by current-meter measurements below 6,500 cfs and by a slope-area measurement at 32,800 cfs and a contracted- opening measurement at 34,100 cfs. Discharge for the period Feb. 13 17 estimated on basis of reconstructed trace.
Maxima. January February 1957: Discharge, 33,200 cfs 1 p.m. Jan. 29 (gage height, 19.06 ft).
1941 to December 1956: Discharge, 17,400 cfs Jan. 7,1946 (gage height, 14.5 ft,from graph based on twice daily gage readings).
Flood of March 1929 reached a stage of 16.0 ft (discharge, 21,800 cfs), from infor mation by local residents.
Mean discharge, in cubic feet per second, 1957
Day
!---._2--.-.3.....4 __ ._5. ___6 .....7__ ...8. ....9. ....10.... 11 __ .
January
121 106
90 154 205 302 336 272
1,070 1,960 1,240
Monthly mean dis Runoff, in inches
February
3,620 3,360 1,600 1,010
748 710
1,130 1,920 3,820 3,620 1,930
Day
12 .... 13 .... 14.... 15.... 16. ... 17__'__ 18. ... 19 .... 20 .... 21 .... 22 ....
January
720 474 336 250 220 152 152 143 140 151 154
charge, in cubic feet per seco
February
1,080 745 550 450 390 350 305 502
1,220 945 720
Day
23 __ . 24 __ . 25.... 26_._. 27___. 28___.9Q
30 __ . 31 __ .
nd_. -
January
796 970 598 402 410
1,590 13,600
3,910 2,080
1,068 5.23
February
566 470 434 422 382 378
---------
1,192 5.28
Gage height, in feet, and discharge, in cubic feet per second, at indicated time, 1957
Hour
Jan. 26
12 p.m...
Jan. 27
6 a.m....12 m ....6 p.m....12 p.m...
Jan. 28
2 a.m.... 4. __ ....
Gage height
2.90
2.863.033.253.55
3.79 4.04
Dis charge
335
323382470598
720 845
Hour
Jan. 28-Con.
6 a,m ____ 8. __ ...10 ____ .12 m ....
4. .......6.. ___ .8. .......10 p.m...12 p.m...
Jan. 29
1 a.m.--_
Gage height
4.30 4.514.745 07<\ ^s5.776.146.486.686.78
6.80
Dis charge
970 1,0801 99fl
1,4001,6201,9202,2302,5902,7702,860
2.860
Hour
Jon.29-Con.
2 a.m.. .- 3. __ ....4. __ .-..5 ........6. __ ....7. ___ ...8 ___ ...910 ___ ...11 .......12 m _ ... 1 p.m.... 2.. ......
Gage height
6.81 6.816.856.977.308.359.00
11.6014.5016.5018.30 19.06 17.90
Dis charge
2,860 2,8602,8603,0403,3204,4905,300
10,00017,40023,50030,200 33,200 28,600

FLOODS OF JANUARY-FEBRUARY 1957 IN KENTUCKY A53
Gage neight, in feet, and discharge, in cubic feet per second, at indicated time, 1957 Continued
Hour
Jan. 29-Con.
3 p.m_.__ 4........5_._- __ .6___. __ _7 __ _____8___. __ _9 __ _ __ _10 __ __ _ll_--__._
Jan. 30
2 a.m____ 4____ __6 __ ....8 __ _ __ _10 __ ____12 m ....2 _......_4 ___ .___6 ___ ...8__ _-_.._10 ____ _12 p.m___
Jan. 3.1
4 a. m____
Gageheight
17.50 17.0015.6014.5013.6013.2512.5511.9511.4510.90
9.80 9.158.588.107.707.347.056.806.606.396.206.04
5.83
Dis charge
27,100 25,20020,60017,40014,90013,80012,30010,8009,600
6,640 5,6204,7404,1403,7203,3203,0402,8602,6802,5002,3202,140
2,000
Hour
Jan. 31-Con.
8 p.m----
8__. __ ..
Feb. 1
4 a.m____8__.--.-_12 m .... 4 p.m____ 8__ __ .-12 p.m__.
Feb. 2
4am8__.-.---12 m ....
8__ __ ...
Feb. 3
6 a.m____
Gage height
5.67 5.615.806.206.97
7.577.657.41 7.26 7.808.56
8.417.817.226.706.265.95
5.56
Dis charge
1,840 1,8001,9602,3203,040
3,6203,6203,420 3,320 3,8204,740
4,4903,8203,2202,7702,4102,100
1,760
Hour
Feb. 3-Con.
12 m _.__
12 p.m___
Feb. 4
12 m .___
Feb. 5
6 a.m-___12 m _ ...6 p.m.___
Feb. 6
6 a.m____12 m ____6 p.m____12 p.m___
Gage height
5.29 5.044.80
4.574.374.204.05
3.923.843.803.72
3.673.763.854.05
Dis charge
1,580 1,4001,240
1,100995920845
770745720b (U
645695745845
13. LEVISA FORK AT FISHTRAP, KY.
Location. Lat 37°25'45", long 82°23'2n",on right bank 300 ft south of U.S. Highway 460, 700 ft downstream from Hurricane Creek, 1 mile southeast of Fishtrap, Pike County, and 6.1 miles upstream from Russell Fork.
Drainage area. 386 sq mi.Gage-height record. Staff gage read twice daily, except Jan. 20-27, Jan. 30 to Feb. 1,
Feb. 3-27; graph drawn Jan. 6, 9-12, 28, 29, and Feb. 2; and Jan. 27, Jan. 30 to Feb. 1, Feb. 3 5 using readings on adjacent days, floodmarks, time of peak, and recorder record for stations near Grundy and at Pikeville as a guide. Datum of gage is 688.10ft above mean sea level, adjustment of 1912 (levels by Corps of Engineers).
Discharge record. Stage-discharge relation defined by current-meter measurements below 15,000 cfs and by slope-area measurement at 33,000 cfs. Discharge for Jan.20- 26, Feb. 6-27 estimated on basis of weather records and records for station near Grundy, W. Va.
Maxima. January-February 1957: Discharge, 33,000 cfs 9:30 p.m. Jan. 29 (gage height, 33.9 ft, from floodmark).
1938 to December 1956: Discharge 23,000 cfs Jan. 7, 1946 (gage height, 22.82 ft, from floodmark), from rating curve extended above 15,000 cfs on basis of slope-area determinations at gage heights 20.26 and 22.82 ft.
Maximum stage known, about 26.5 ft in 1929.

A54 FLOODS OF 1957
Mean discharge, in cubic feet per second, 1957
Day
1-----2_____3. ....4.....5 .....6_____7.....8. ....9_ ....10....11 _._.
January
228210 130 168 273 308 574 502
2,140 4,640 2,600
Monthly mean dis Runoff, in inches
February
5,250 7,200 3,200 1,740 1,290 1,100 1,700 3,100 6,300 5,700 3,000
Day
12 __ .13 .... 14 .... 15 .... 16 __.. 17 __ . 18 .... 19 .... 20 .... 21. ... 22 ....
January
1,410 815 664 530 460 344 270 220 210 230 230
charge, in cubic feet per sec
February
1,700 1,100
900 750 600 550 520 700
1,700 1,400 1,100
Day
23 .... 24 .... 25 .... 26 .... 27.... 28 .... 29 ....30 __ . 31 __ .
January
600 1,400 1,200
650 706
3,050 18,30015,800 4,240
2,036 6.08
February
850 750 680 630 580 552
---------
1,952 5.26
Gage height, in feet, and discharge, in cubic feet per second, at indicated time, 1957
Hour
Jan. 26
Jan. 27
12 m -__.
Jan. 28
4 a.m--.- 8... .....12 m __.-
8... __ ..12 p.m___
Jan. 29
2 a.m_--- 4. .......6 ____ ..8. .......10.. __ ._12 m . ... 2 p.m____
Gage height
3 0
3.23.17 73.8
4.4 5.36.47.68.8
10.3
11.2 12.213.314.817.220.2 23.4
Dis charge
710
645585710
1,060
1,480 2,1102,8803 T>(\
4,6405,870
6,680 7,5808,600
10,10012,60016,200 20,100
Hour
Jan. 29-Con
6 .__._...8 ____....9:30 .....10. __ ...
Jan. 30
4 a.m.... 8. __ __12 m ....
8 __ .....
Jan. 31
6 a.m___. 12 m __ .6 p.m___.
Feb. 1
6 a.m.... 12 m ....
Gage height
30.733.633.933.832.5
27.0 22.218.4 15.413.0112
9.1 7.57.0 7.4
8.69.6
Dis charge
24 30028,80032,60033,00032,80031,200
24,400 18,60014,100 10,700
8,3006,680
4,480 3,6503,300
4,480 5,280
Hour
Feb. 1-Con.
12 p.m....
Feb. 2
12 m . __ .
12 p.m....
Feb. 3
12 m __ _.,
12 p.m....
Feb. 4
12 m -----12 p.m..-.
Feb. 5
12 m . __ .12 p.m....
Gage height
10.311.7
13.612.510.68.9
7.76.65.95.4
4.74.3
4.04.2
Dis charge
5,8707,130
8,9007,8506,1404,720
3,7903,0202,5302,180
1,6901,410
1,2001,340

FLOODS OF JANUARY-FEBRUARY 1957 IN KENTUCKY A55
14. RUSSELL FORK AT HAYSI, VA.
Location. Lat 37°12'25", long 82°17'45", on right bank 180 ft downstream from highwaybridge at Haysi, Dickenson County, and 700 ft downstream from McClure River.
Drainage area. 286 sq mi. Gage-height record. Water -stage recorder graph except Jan. 2 7. Datum of gage is
1,237.96 ft above mean sea level, datum of 1929, supplementary adjustment of 1944. Discharge record. Stage-discharge relation defined by current-meter measurements
below 12,000 cfs and by slope-area measurements at 46,600 cfs. Maxima. January February 1957: Discharge, 46,600 cfs 2 p.m. Jan. 29 (gage height,
23.17 ft).1926 to December 1956: Discharge, 34,500 cfs March 23, 1929 (gage height, 18.5 ft,
from floodmarks).
Mean discharge, in cubic feet per second, 1957
Day
1------2 ___ .3 ___ .4......5 ___ .6......7______8.. __ .q
10 __ .11. _ .
January
137 110
90 130 150 170 180 186 698
1,880 1,160
Monthly mean dis Runoff, in inches
February
5,670 4,470 1,500
853 618 646 971
1,450 4,320 4,680 2,010
Day
12._._.13.....14_.__.15.....16__.__17 ___ .18__...19___._9fl
91
22_.._.
January
650 465 345 261 234 148 150 140 137 145 154
charge, in cubic feet per sec(
February
1,010 671 515 415 350 285 245 904
2,010 1,120
736
Day
23 __ .24.....25.....26 ___ .27 __ .28 __ .29-.--.30 __ .31 __ .
January
999 953 608 440 432
2,230 23,000
6,2702,470
1,456 5.87
February
560 470 425 400 370 465
1 ^62 4.96
Gage height, in feet, and discharge, in cubic feet per second, at indicated time, 1957
Hour
Jan. 26
12 p.m...
Jan. 27
6 a.m....12 m ....
12 p.m...
Jan. 28
12 m . ...
12 p.m.__
Jan. 29
1 a.m....
Gage height
3.00
2.963.063.193.40
3.804.605.767.18
7.19
Dis charge
380
360410475590
8901,6503,2205,720
5.740
Hour
Jan. 29-Con.
2 a.m.... 3 .__...__4_____ __5 __ .. __6 __ .. ...7.. __ ...8. __ ....9. __ ....10 __ ...11 __ .__.12 m ..._
2 __.__...3 _.._..._4. __ ....5... __ _.6 ___ ...7........8 _.._._._
Gage height
7.14 7.056.987.007.227.708.55
10.0014.5017.0019.50 22.1023.1722.8022.1521.1519.9018.3516.60
Dis charge
5,650 5,4905,3605,4005,8006,6608,300
11,4009<j 9nn29,90036,600 43,70046,60045,60043,80041,10037,70034,00028.800
Hour
Jan. 29-Con.
9 p.m____ 10.. __ .-11 .._.._.12 p.m...
Jan. 30
8 ________12 m __4 p.m.___ 8. _______12 p.m...
Jan. 31
12 m .._.6 p.m....
Gage height
15.00 14.1013.3012.55
9.757.586.525.78 5.325.03
4.774.775.44
Dis charge
24,500 22,10019,90017,900
10,8006,4404,5403,250 2,5702,180
1,8401,8402,740

A56 FLOODS OF 1957
Gage height, in feet and discharge, in cubic feet per second, at indicated time, 1957 Continued
Hour
fan. 31 -Con.
12 p.m...
Feb. 1
2 a.m....4--------a._ _ ...8... __ .10.......12 m ....2 p.m....4. _______6.. ______8.. ___ .10. ___ .
Gage height
6.63
7.157.477.537.377.116.826.606.526.757.157.84
Dis charge
4,730
5,6706,2506,3506,0705,6005,0804,6804 R_tn, OrrU
4,9505,6706,910
Hour
Feb. 1-Con.
12 p.m...
Feb. 2
6 a.m___.12 m __6 p.m....12 p.m._.
Feb. 3
6 a.m....12 m __6 p.m._._12 p.m...
Gage height
8.27
7.456.20S 4.7 «j.^ i
4.99
A fitirt .0 «j4.404.19A fl9^,\J £t
Dis charge
7,740
6,2103,9602,7802,130
1,7001,4501,2401,090
Hour
Feb. 4
6 a.m__._12 m __._6 p.m____12 p.m...
Feb. 5
6 a.m____12 m __._6 p.m....12 p.m...
Gage height
3.883.753.623.50
3.453.433.453.42
Dis charge
962845736650
620608620602
15. POTCAMP CREEK NEAR POUND, VA.
[Miscellaneous site]
Location. Lat 37°02'29", long 87°36', at culvert on U.S. Highway 23, 6.0 miles south ofPound, Wise County.
Drainage area. 1.5 sq mi.Gage-height record. Floodmarks only. Datum of 1929. Maximum. January 1957; Discharge, 292 cfs Jan. 29 (stage, 1,667.22 ft above mean sea
level, from floodmarks) from computation of flow through culvert and overflow inditch.
16. POUND RIVER AT POUND, VA.
[Miscellaneous site]
Location. Lat 37°07'20", long 82°35'56", at Pound, Wise County, half a mile downstreamfrom Indian Creek.
Drainage area. 61 sq mi. Maximum. January 1957: Discharge, 15,300 cfs Jan. 29 from slope-area measurement.
17. POUND RIVFR NEAP HAYSI, VA.
Location. Lat 37°12'50", long 82°22'50", on left bank 0.2 mile downstream fromCranesnest River, 0.8 mile upstream from Twin Branch, and 4.7 miles west of Haysi,Dickenson County.
Drainage area. 212 sq mi.Gage-height record. Water-stage recorder graph. Discharge record. Stage-discharge relation defined by current-meter measurements
below 11,000 cfs and by slope-area measurement of 27,600 cfs. Maxima. January-February 1957; Discharge, 27,300 cfs 5p.m. Jan. 29 .(gage height,
18.65 ft).1926 to December 1956: Discharge, 30,000 cfs Mar. 23, 1929 (gage height, 16.5 ft,
from floodmarks, at site 0.8 mile downstream at different datum).

FLOODS OF JANUARY-FEBRUARY 1957 IN KENTUCKY A57
Mean discharge, in cubic feet per second, 1957
Day
1-... .2______3 __ ...4......5......6......7.8......9......10-....11---..
January
148 128
96 134 165 192 214 207 940
2,420 1,380
Monthly mean dis Runoff, in inches
February
3,790 3,610 1,540
937 612 605 790
1,320 3,370 3,650 1,860
Day
12---. 13.... 14.... 15 __ .16. ... 17. __18. __ 19. ... 20.--. 21...- 22---.
January
705 465 330 258 231 156 152 150 141 148 170
charge, in cubic feet per sec
February
955 665 485 369 318 277 236 488
1,380 905 685
Day
JQ
242526---..2728. __._29. ....30. __31 __ .-
January
853 835 545 375 367
1,720 16,1005,2701,850
1,189 6.47
February
545 449 390 363 328 378
1,118 5.49
Gage height, in feet, and discharge, in cubic feet per second, at indicated time, 1957
Hour
Jan. 26
12 p.m...
fan. 27
4 a.m.... 8._ __ -_12 m .... 4 p.m____ 8. ___ -_12 p.m--.
Tan. 28
4 a.m.... 8 __ __ ..12 m .... 4 p.m.... 8 __ . ....12 p.m...
Jan. 29
1 a.m.... 2........3 ____ -_4. .__..._5 ____ -_6... __ ..7. -------8 ____ _-9... __ ..10.......11 .......12 m __ 1 p.m.... 2. __ ...3 ___ ...
Gage height
4.16
4.12 4.13 4.17 4.33 4.54 4.87
5.29 5.84 6.48 7.45 8.48 9.14
9.23 9.30 9.34 9.38 9.50 9.90
10.60 11.90 13.40 14.97 16.00 16.90 17.60 18.05 18.40
Dis charge
320
311 313 323 369 441 572
741 1,000 1,370 2,000 2,970 3,850
3,970 4,070 4,110 4,180 4,350 4,910 5,890 7,970
11,500 15,800 18,900 21,700 23,900 25,400 26,500
Hour
Jan.29-Con.
5. __ .....6. __ .....7.........8 __ . __ j9------..J10 ____ ____ -H
11 __ .....12 p.m....
Jan. 30
46---------8 _____ ..10.. ----._12 m .....2 p.m.....4. _..... ._
8_- ___ ..10... __ ..12 p.m....
Jan. 31
4 a.m..... 8 ______ .12 m __ ..
8 ______ .12 p.m....
Feb. 1
Gage height
18.55 18.65 18.55 18.40 17,90 17.25 16.50 15.65 14,75
13.15 12.00 11.15 10.45 9.85 9.37 8.96 8.60 8.31 8.05 7.82 7.60
7.25 7.04 6.92 7.02 7.35 8.10
8.80
Dis charge
27,000 27,300 27,000 26,500 24,900 22,800 20,400 17,800 15,200
10,900 8,150 6,6'60 5,680 4,830 4,170 3,590 3,110 2,760 2,470 2,270 2,100
1,860 1,710 1,630 1,690 1,920 2,520
3,370
Hour
Feb. 1-Con.
12 m . __ .4 p.m..... 8__ __ __ .12 p.m....
Feb. 2
8 ______ .12 m .....
8 ___ __ .12 p.m....
Feb. 3
12 m ...__
12 p.m....
Feb. 4
12 m .....
12 p.m....
Feb. 5
12 m _____
12 p.m____
Gage height
9.17 9.13 9.00 9.45 9.90
9.95 9.55 8.96 8.40 7.90 7.48
6.98 6.56 6.25 6.98
5.73 5.55 5.35 5.15
4.98 4.91 4.94 4.94
Dis charge
3,890 3,830 3,650 4,280 4,910
4,980 4,420 3,590 2,870 2,330 2,020
1,670 1,420 1,230 1,670
945 858 768 685
617 589 601 601

A58 FLOODS OF 1957
18. RUSSELL FORK AT ELKHORN CITY, KY.
[Miscellaneous site]
Location. Lat 37°18'20", long 82°20'55", 1,500 ft upstream from bridge on State Highway 80 at Elkhorn City, Pike County, 0.3 mile downstream from Lower Branch, and 0.6 mile upstream from Elkhorn Creek.
Drainage area. 555 sq mi.Discharge record. Peak discharge by slope-area measurement.Maximum. January-February 1957; Discharge, 51,200 cfs Jan. 29.
19. LEVISA FORK AT PIKEVILLE, KY.
Location. Lat 37°28'35", long 82°31'05",on left bank at foot of Huff man Avenue in Pike- ville, Pike County, one-quarter of a mile upstream from bridge on U.S. Highway 119, 0.5 mile upstream from Ferguson Fork, and 7.6 miles downstream from Shelby Creek.
Drainage area. 1,237 sq mi.Gage-height record. Water-stage recorder graph. Datum of gage is 633.18 ft above
mean sea level, unadjusted.Discharge record. Stage-discharge relation defined by cur rent-meter measurements
below 45,000 cfs and by slope-area measurement at 85,500 cfs.Maxima. January-February 1957: Discharge, 85,500 cfs 12:30 a.m. Jan. 30 (gage height,
52.72 ft).1937 to December 1956: Discharge, 50,300 cfs Jan. 8, 1946 (gage height, 42.90 ft). Maximum stage known,about 52 ft in February 1862. Flood of January 1918 reached
a stage of 44.7 ft, from floodmark.
Mean discharge in cubic feet per second, 1957
Day
1 ---_-23 __ .4 -----5.....6 __ ..7 --...8 __ .910 __ 11 ....
January
582 522 418 382 530 738
1,010 1,080 3,370
12,700 9,930
Monthly mean di Runoff, in inches
February
13,900 21,800 11,900
5,620 4,150 4,660 5,140 6,790
16,400 23,600 15,700
Day
12 .... 13-... 14 ....15 .... 16 .... 17.... 18 .... 19 .... 20 __ . 21 __ . 22 ....
January
4,480 2,960 2,110 1,520 1,220
888 606 598 570 598 690
scharge, in cubic feet per sec5
February
6,490 4,210 3,230 2,590 2,140 1,870 1,540 1,670 5,420 5,110 3,940
Day
23.... 24 .... 25.... 26 ....27 .... 28 .... 29 .... 30 .... 31 ....
January
3,370 5,520 3,620 2,620 2,120 6,980
40,500 58,700 18,400
6,107 5.69
February
3,260 2,820 2,500 2,300 2,100 1,900
6,527 5.49
Gage height, in feet, and discharge, in cubic feet per second, and indicated time, J957
Hour
Jan. 26
12 p.m...
Jan. 27
6 a.m....12 m ....6p.m___-
Gage height
5.77
5.605.505.55
Dis charge
2,220
2,0802,0002,040
Hour
fflrt.27-Con.
12 p.m __
Jan. 78
4 a.m ...12 m ....
Gage height
6.07
7.1610.9713.38
Dis charge
2,460
3,3306,3808,580
Hour
[on. 28 -Con
12 p.m...
Jan. 29
2 a.m....4 ___ ...5 _____ .
Gage height
18.05
19.1820.3521.10
Dis charge
13,200
14,40015,60016,300

FLOODS OF JANUARY-FEBRUARY 1957 IN KENTUCKY A59
Gage height, in feet, and discharge, in cubic feet per second, at indicated time, 1957-Continued
Hour
Jan. 29
6 a.m____.7 __ __ ..8 ____ ..9 _____ .10 ____ .11 a.m___. 12 m __ _.1 p.m ____ 2 ... __ _.3 __ ___ .4 __ __ _.5 __ _____6 __ . __ .7 __ ___ _8 __ _ __ .9 _____ .10 ____ .11 ._ __ _.
Jan. 30
12:30 a.m. 2 ________34 _._ __ ..5 ... __ __6 ____ _.7 __ . __ _8 ________"9 ________10 _______
Gage height
22.00 23.15 24.28 25.82 27.42 29.59 31.25 33.50 36.04 39.07 41.80 44.65 47.02 48.65 49.98 51.15 51.87 52.38 52.68
52.72 52.50 52.13 51.56 50.93 50.13 49.15 48.20 47.20 46.20
Dis
charge
17,300 18,600 20,000 22,000 24,300 27,600 30,300 34,000 38,500 44,700 51,300 59,000 66,200 71,400 75,900 79,900 82,400 84,300 85,300
85,500 84,700 83,400 81,400 79,200 76,400 73,100 70,000 66,700 63,600
Hour
fan. 30-Con.
12 m_ __ 2 p.m ___ 4 _ __ __6 _______8 ___ __9 _______10 ___ __11 _ ___ _12 p.m ._
Jan. 31
4 a. in ___ 8 __ __ __12 m ___ 4 p.m ___ 8 _______12 p.m __
Feb. 1
4 a.m ___ 12 m ___8 p.m ___ 12 p.m ._
Feb. 2
4 a.m ___8 ____ _12 m __ _
Gage height
44.08 42.00 39.90 37.85 35.75 34.70 33.75 32.80 31.93
28.43 24.85 21.58 18.85 16.85 15.90
16.13 18.57 20.92 22.42
24.50 26.58 27.80
Dis charge
57,400 51,800 46,500 42,000 38,000 36,100 34,400 32,800 31,400
25,800 20,700 16,800 14,000 12,000 11,100
11,300 13,800 16,100 17,800
20,200 23,100 24,900
Hour
Feb. 2-Con.
4 p.m ___. 8 ___ __.12 p.m __.
Feb. 3
4 a.m- ___. 8 .______.12 m __... 4 p.m ___. 8 _____ .12 p.m ...
Feb. 4
4 a.m ___. 12 m ___ .4 p.m ___. 812 p.m ...
Feb. 5
4 a.m ___. 8 _____ .12 m ___ .4 p.m ___. 8 __ ____.12 p.m ...
Gage height
,26.77 25.00 22.94
20.65 18.30 16.12 14.35 12.98 11.94
11.18 9.93 9.34 8.89 8.48
8.17 7.92 7.85 8.08 8.47 8.76
Dis charge
23,400 20,900 18,300
15,800 13,500 11,300 9,550 8,180 7,250
6,560 5,540 5,070 4,710 4,380
4,140 3,940 3,880 4,060 4,380 4,610
20. LEVISA FORK AT PRESTONSBURG, KY.
[Miscellaneous site]
Location. Lat 37°39'50", long 82°46'08", on right bank at water plant in Prestonsburg,Floyd County, 900 ft upstream from Town Brook, and 1,300 ft upstream from highwaybridge.
Drainage area. 1,700 sq mi, approximately. Gage-height record. Staff gage. Datum of gage is 588.12 ft above mean sea level, datum
of 1929.Discharge record. Peak discharge by extension of rating curve above 63,000 cfs. Maximum. January-February 1957: Discharge, 69,700 cfs 5 p.m. Jan. 30 (gage height,
48.78 ft, from floodmark).

A60 FLOODS OF 1957
21. JOHNS CREEK NEAR META, KY.
Location. Lat 37°33'50", long 82°27'20", onleft bank 100 ft upstream from Ford Branch,1,000 ft upstream from U.S. Highway 119 bridge, 1.0 mile upstream from RaccoonCreek, and 1.1 miles southwest of Meta, Pike County.
Drainage area. 55.7 sq mi. Gage-height record. Water-stage recorder graph. Datum of gage is 717.66 ft above
mean sea level, unadjusted. Discharge record. Stage-discharge relation defined by current-meter measurements
below 1,900 cfs and by contracted-opening measurement of 4,680 cfs. Maxima. January-February 1957: Discharge, 4,680 cfs 3 p.m. Jan. 29 (gage height,
14.54 ft).1941 to December 1956: Discharge, 4,480 cfs Feb. 27, 1955 (gage height, 14.28 ft).Flood in 1939 reached a stage of 13.6 ft, from floodmarks 600 ft downstream.
.Menu discharge, in cubic feet per second, 1957
Day
1 __ ..2. __ .3.....4 __ ._5----.6----.7__--_8_____9____-10---. 11-...
January
32 19 16 31 38 36 42 43
1,310 1,110
368
February
815 793 289 181 170 305 268 312
1,060 1,220
390
Day
12.... 13---. 14____15. ... 16. ... 17.... 18. ... 19.... 20.-_. 21...- 22 ....
January
214 142 100
74 65 33 30 31 33 41 65
Monthly mean discharge, in cubic feet per sec Runoff, in inches __________________________
February
214 148 114
84 72 59 51 99
178 160 174
Day
23 .... 24 ___ 25 __ - 26 .... 27 __ . 28 __ _ 29 __ .30 .... 31-..-
January
662 300 192 130 114 693
2,770977 363
325 6.73
February
186 174 141 117
93 92
284 5.31
Gage height, in feet, and discharge, in cubic feet per second, at indicated time, 1957
Hour
Jan. 26
12 p.m....
Jan. 27
12 m __ ..
12 p.m__._
Jan. 28
4. ___ ...6. ___ ...8 ____ ...10 ______12 m .. ...2 p.m.....4 .........6 .........8 __ __ ...10 ..__....12 p.m....
Gage height
4.24
4.214.274 97
4.30
4.394.514.695.035.495.886.507.668.639.169.429.35
Dis charge
111
1061161 1 fi
1 9H
134152188256362460615938
1,2801,4901,6001,570
Hour
Jan. 29
2 a.m___- 3 ___ ....4..... ...5__.__._-6 __ _. ...7 ___ . ...8 ........9 __ .. ...10 .......11.. .....12 m __
2..... ...3 _____ .4_. ....._6 __....._8 ........10 __ ...
Jan. 30
2 a.m....
Gage height
9.05 8.868.738.638.678.899.33
10.0010.8611.8812.83 13 7514.2714.5414 4913.8512.9111.9311.03
10.11
Dis charge
1,450 1,3701,3201,2801,3001,3901,5601,8302,3002,9103,480 4,1004,4704,6804,6404,1803,5302,9402,400
1,880
Hour
Jan. 30-Con.
4 a.m.... 6 ____ ..8 ........10.- .._..12 m ....
4 __ .....6 ._....__8 ........10 .......12 p.m...
Jan. 31
12 m ....
Feb. 1
8 ........12 m .___
Gage height
9.30 8.788.197.657.156.746.386.145.955.825.72
5.395.365.60
5.736.216.96
Dis charge
1,550 1,3401,120
935785675585525478445420
338330390
422542730

FLOODS OF JANUARY-FEBRUARY 1957 IN KENTUCKY A61
Gage height, in feet, and discharge, in cubic, feet per second, at indicated time, 1957 Continued
Hour
Feb. 1-Con.
4 p.m..__ 8........12 p.m...
Feb. 2
4 a.m.... 8........12 m .... 4 p.m.... 8... __ ..
Gage height
7.66 8.759.10
8.52 7.656.82 6.17 5.77
Dis charge
938 1,3301,470
1,240 935695 532 432
Hour
Feb. 2-Con.
12 p.m...
Feb. 3
6 a.m.___ 12 m .... 12 p.m...
Feb 4
Gage height
5.56
5.32 5.15 4.88
4.76
Dis charge
380
320 280 226
202
Hour
Feb. 4-Con.
6 p.m__._
Feb. 5
6 a.m.... 12 m ....
12 p.m...
Gage height
4.54 4.45
4.384.44 4.765.11
Dis charge
158 142
132 141 202272
22. DEWEY RESERVOIR NEAR VAN LEAR, KY.
Location Lat 37°44'16", long 82°43'50", in intake structure of Dewey Dam on Johns Creek, 1.0 mile upstream from Daniels Creek and 2\ miles southeast of Van Lear, Johnson County.
Drainage area. 207 sq mi.Gage-height record. Water-stage recorder graph. Datum of gage at mean-sea level
(levels by Corps of Engineers).Maxima. January-February 1957: Contents, 49,270 acre-feet 4 p.m. Feb. 3(elevation,
670.03 ft).1950 to December 1956: Contents, 81,400 acre-feet Mar. 9, 1955 (elevation, 682.30 ft).
Remarks. Reservoir is formed by rolled earth-fill dam with discharge tunnel, controlled by concrete gravity weir, crest elevation, 644.5ft, 3 gated sluices, and uncontrolled side channel concrete spillway. Dam completed July 22, 1949 and filling of pool be gan May 15, 1950. Conservation pool (elevation, 645.0 ft) first reached June 14,1950. Total capacity at elevation 686.0 ft (spillway crest) is 93,300 acre-feet, of which 81,000 acre-feet above elevation 645.0 ft is reversed for flood control and 12,300 acre-feet below elevation 645.0 ft is for conservation. Figures given herein represent total con tents, of which 69 acre-feet below gate sill, elevation, 608.25 ft, is dead storage. Gage- height record and contents furnished by Corps of Engineers.
Elevation, in feet, and contents, in acre-feet at 12 p.m. of indicated day, 1957
Day
1 ....2---.3.-..4....5____6 ___7....8....9-.__10...11...12 ...1 ^1 O _ _ .
14 ...15 ...16 ...
January
Elevation
645.37645.44645.35645.22645.35645.42645.42645.40646.27649.82648.09645.38645.69645.30645 22645.19
Contents
12,60012,67012,59012,47012,59012,65012,65012,63013,43017,03015,21012,61012 8901 9 <iAnJ. £t t JrtU
12 47012,440
February
Elevation
666.63669.48669.56667.36665.00663.02660.62658.35657.45660.10660.46657.89654.07649 49645.48645.10
Contents
42,21048,08048,25043,66039,06035,48031,45027,94026,62030,61031,11927,26099 flAfl£i£t ,Urtu
1C fiflftID, pol)1 9 7nn1 £* , 1 UU
12,360
Day
17. __18. ._19...20...21 ...22-..23--.24--.25 ...26 __27 ...28 __9 Q^y . _ .3031
January
Elevation
645.04645.11645.22645.23645.30645.69647.14645.72645.34645.30645.17646.78654.60662.68664.78
Contents
12,31012,37012,47012,48012,45012,89014,26012,92012,58012,54012,42013,91022,72034,89038,650
February
Elevation
645.16645.37645.38645.50645.41645.29645.14645.07645.03645.10645.17645.33
Contents
12,41012,60012,61012,72012,64012,53012,40012,33012,30012,36012,42012,570
Supplemental record. Dec. 31, 1956, 12 p.m., 645.32 ft, 12,560 acre-feet.
690-137 O - 64 - 5

A62 FLOODS OF 1957
23. JOHNS CREEK NEAR VAN LEAR, KY.
Location. Lat 37°44'37", long 82°43'27", on right bank 100 ft upstream from LongBranch, 0.3 mile upstream from Daniels Creek, 0.5 mile downstream from DeweyDam, and *i\ miles southeast of Van Lear, Johnson County.
Drainage area. 208 sq mi. Gage-height record. Water-stage recorder graph. Datum of gage is 597.28 ft above
mean sea level (levels by Corps of Engineers). Discharge record. Stage-discharge relation defined by current-meter measurements.
Backwater from Levisa Fork, Jan. 29 to Feb. 3, Feb. 10-12; discharge computed onbasis of releases from Dewey Reservoir.
Maxima. January to February 1957; Discharge, 3,150 cfs 11 a.m. Feb. 14 (gage height,14.96 ft); gage height, 27.88 ft 11 p.m. Jan. 30 (backwater from Levisa Fork).
1939 to December 1956: Discharge, 8,350 cfs Jan. 9, 1946 (gage height, 26.50 ft,from rating curve extended above 3,100 cfs by logarithmic plotting.
Remarks. Flow regulated by Dewey Reservoir (capacity, 93,300 acre-feet).
Mean discharge, in cubic feet per second, 1957
Day
1. __ .2.. __3 __ __4. __ .5. ....6.....7_____8_ __ _9.....10 ___ 11--..
January
5634 96
119 28 50 84
120 713
2,200 2,690
February
0 0
1,200 3,060 3,060 3,060 3,070 3,030 3,070 2,400 2,000
Day
12.-.. 13.-.. 14 __ . 15. ... 16.... 17.... 18 __ 19.... 20 __ . 21.... 22---.
January
2,540 527 500 278 195 190
71 59 88 88
174
Monthly mean discharge, in cubic feet per seco
February
2,800 3,070 3,090 2,420
437 193
88 320 484 578 636
nd_-_ __ ..
Day
23. ... 24. __ 25 .... 26. ... 27.... 28_...29....30....31 ....
January
1,130 2,090
946 446 460 797
1,7300 0
597
February
630 584 495 379 289 297
1,455
24, PAINT CREEK AT STAFFORDSVILLE, KY.
Location. Lat 37°50'05", long 82°52'15", near center of span on downstream side of bridge on U.S. Highway 460, 100ft downstream from Barnetts Creek, 0.8 mile upstream from Mudlick Creek, 1.7 miles west of Staffordsville, Johnson County, 4 miles up stream from Jenny Creek, and 7.6 miles upstream from mouth.
Drainage area. 101 sq mi.Gage-height record. Wire-weight gage read twice daily and peak from crest-stage in
dicator. Graph drawn for days of changing stage. Datum of gage is 600.96 ft above mean sea level, datum of 1929, supplementary adjustment of 1944.
Discharge record. Stage-discharge relation defined by current-meter measurements.Maxima. January-February 1957: Discharge, 4,150 cfs 5 p.m. Jan. 29 (gage height,
16.50 ft, from crest-stage indicator).1950 to December 1956: Discharge, 11,700 cfs Sept. 20, 1950, Mar. 22, 1952, from
rating curve extended above 5,500 cfs by logarithmic plotting; gage height, 24.11ft Mar. 22, 1952.
The flood of July 5, 1939, reached a stage of about 25 ft, from information by local residents.

FLOODS OF JANUARY-FEBRUARY 1957 IN KENTUCKY A63
Mean discharge, in cubic feet per second, 1957
Day
1. __ .2.....3.....4. __ .5. __ .6. __ .7.....8.....9.....10.... 11---.
January
66 51 38 45 55 50 59 70
1,060 1,410
480
Monthly mean dis Runoff, in inches
February
966 1,060
481 293 284 488 390 660
1,960 2,110
675
Day
12.--. 13..-.14 .... 15..-. 16. ... 17.... 18. ... 19- __ 20.--- 21..-- 22...-
January
265 190 141 105
99 72 76 64 76 76
146
charge, in cubic feet per seco
February
432 245 170 136 121 102
94 99 94 88
103
Day
23....24. ... 25 .... 26. ... 27-.-. 28. ... 29. ...30.--.31 ....
January
1,530 465 290 186 166 777
2,9001,7301,990
475 5.42
February
119 118 119 119 108 124
420 4.33
Gage height, in feet, and discharge, in cubic feet per second, at indicated time, 1957
Hour
Jan. 27
12 p.m__.
Jan. 28
8---. ....12 m .... 4 p.m.... 8. ____ .12 p.m...
Jan, 29
4........6... __ -_8 ...._._.10--..-.-12 m ....
4 _____ .5. .__....6 __...._.8. .......10-....--12 p.m...
Jan. 30
4 a.m____
Gage height
3.40
3.53.65.0 7.4 9.3
10.3
10.611.011.512.413.414.6 15.716.416.516.415.313.712.4
10.3
Dis charge
190,
2159in590
1,120 1,5201,760
1,8501,9702,1202,4102,7803,260 3,7204,0904,1504,0903,5402,9002,410
1,760
Hour
Jan. 30-Con.
8 a.m____ 9-. ......12 m --.. 4 p.m-___ 8 __ .....
Jan. 31
4 a.m____ 8.. ___ .12 m .... 4 p.m.... 8 ___ ...
Feb. 1
4 a.m___. 8 ____ ..12 m --.-
8 _..._.__
Feb. 2
4 a.m.... 8 __ . ...12 m -...
Gage height
8.6 8.58.8 9.7
10.9119
12.5 12.211.5 10.6
9.27.5
5.5 4.85.87.28.59.3
9.0 8.06.9
Dis charge
1,360 1,3401,400 1,620 1,9402 O Af\
2,440 2,3402,120 1,850 1,4901,140
715 540790
1,0801,3401,520
1,440 1,2401,020
Hour
Feb. 2-Con.
4 p.m.... 8 ___ ...12 p.m...
Feb. 3
6 a.m.... 12 m ..-.
12 p.m___
Feb. 4
12 m -6 p.m..-_
Feb. 5
6 a.m....12 m ....6 p.m___.12 p.m...
Gage height
6.0 5.65.2
4.84.5A ^
4.1
«y.0
O.I
.0
3.53.64.04.4
Dis charge
840740640
540 465
365
£i y\j£i\> O
240
215240340440
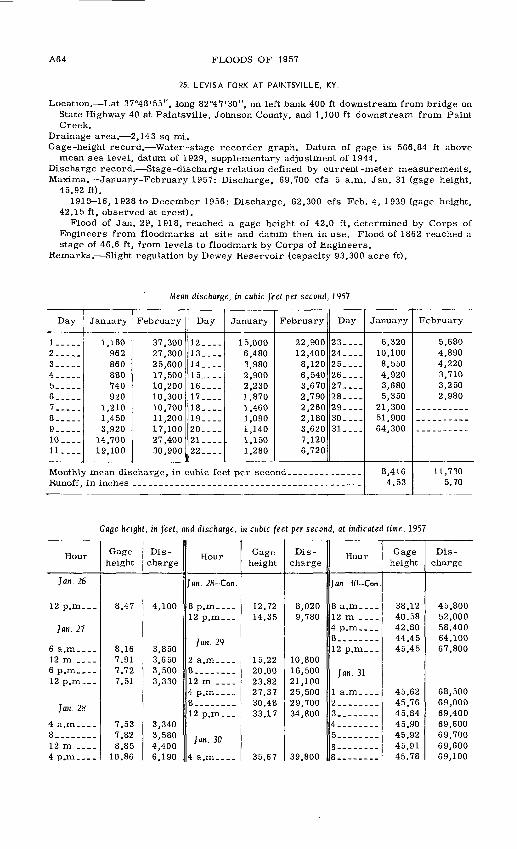
A64 FLOODS OF 1957
25. LEVISA FORK AT PAINTSVILLE, KY.
Location. Lat 37°48'55", long 82°47'30", on left bank 400 ft downstream from bridge onState Highway 40 at Paintsville, Johnson County, and 1,100 ft downstream from PaintCreek.
Drainage area. 2,143 sq mi. Gage-height record. Water -stage recorder graph. Datum of gage is 566.84 ft above
mean sea level, datum of 1929, supplementary adjustment of 1944.Discharge record. Stage-discharge relation defined by current-meter measurements. Maxima. January-February 1957: Discharge, 69,700 cfs 5 a.m. Jan. 31 (gage height,
45.92 ft).1915-16, 1928 to December 1956: Discharge, 62,300 cfs Feb. 4, 1939 (gage height,
42.15 ft, observed at crest).Flood of Jan. 29, 1918, reached a gage height of 42.0 ft, determined by Corps of
Engineers from floodmarks at site and datum then in use. Flood of 1862 reached astage of 46.6 ft, from levels to floodmark by Corps of Engineers.
Remarks. Slight regulation by Dewey Reservoir (capacity 93,300 acre ft).
Mean discharge, in cubic feet per second, 1957
Day
!-___.2_____3. ____4_.___5_____6_____7.....8 __ .9_____10 __ ll_-__
January
1,160 962 860 880 740 920
1,210 1,450 3,920
14,700 19,100
Monthly mean dis Runoff, in inches
February
37,300 27,300 25,600 17,500 10,200 10,300 10,700 11,200 17,100 27,400 30,900
Day
12. ... 13_... 14____ 15_... 16____17.__. 18. ... 19-___ 20 __ _ 21 __ . 22 __ .
January
15,000 6,480 3,980 2,900 2,230 1,870 1,460 1,090 1,140
L 1,150 1,280
charge, in cubic feet per seco
February
22,900 12,400 8,120 6,540 3,670 2,790 2,260 2,180 3,620 7,120 6,720
Day
23---. 24 __ . 25. __ 26_.__27 .... 28.... 29. __30..--31 ....
January
6,320 10,100 8,550 4,920 3,680 5,350
21,30051,90064,300
8,416 4.53
February
5,680 4,890 4,220 3,710 3,250 2,980
__________
11,730 5.70
Gage height, in feet, and discharge, in cubic feet per second, at indicated time, 1957
Hour
Jan. 26
12 p.m...
Jan. 27
6 a.m____12 m __ _6 p.m.__-12 p.m__.
Jan. 28
4 a.m____8__ ._..._12 m ____4 D.m____
Gage height
8.47
8.167.917.727.51
7.537.828.85
10.86
Dis charge
4,100
3,8503,6503,5003,330
3,3403,5804,4006.190
Hour
Jan. 28 -Con.
8 p.m____12 p.m...
Jan. 29
2 a.m____8 __ __ _12 m ....4 p.m.___8-___._._12 p.m...
Jan. 30
4 a.m___.
Gage height
12.7214.35
15.2220.0023.8227.3730.4833.17
35.67
Dis charge
8,0209,780
10,80016,50021,10025,50029,70034,800
39.800
Hour
Jan. 30-Con.
8 a.m____12 m ....4 p.m____8. ._-_-._12 p.m___
Jan. 31
1 a.m____2__ -__.._3. _-_-__.4. ..___..5. _-_-...5-- ...8--------
Gage height
38.1240.5842.8044.4545.45
45.6245.7645.8445.9045.9245.9145.78
Dis charge
45,80052,00058,40064,10067,800
68,50069,00069,40069,60069,70069,60069.100

FLOODS OF JANUARY-FEBRUARY 1957 IN KENTUCKY A65
Gage height, in feet, and discharge, in cubic feet per second, at indicated time, 1957 Continued
Hour
Jan. 31-Con.
10 a.m__.12 m __ .
463. _______1012 p.m___
Feb. 1
2 a.m____4-_.---_-810 _____12 m __ _2 p.m____4------__
Gage height
45.5145.1344.6044.0043.2942.5441.6540.70
39.6138.5336.1234.8233.6332.5331.55
Dis charge
68,00066,50064,60062,50060,00057,60055,00052,200
49,50046,80040,80038,10035,80033,60031,600
Hour
Feb. 1-Con.
6 p.m____8-__--_ _10---_-_.
Feb. 2
6 a.m____12 m ____6 p.m____12 p.m___
Feb. 3
8 ___ __12 m _ __
Gage height
30.7330.1329.6329.30
28.8428.5128.5428.77
28.7628.4127.75
Dis charge
30,10029,20028,50028,000
27,40027,00027,00027,300
27,30026,80026,000
Hour
Feb. 3-Con.
4 p.m____12 p.m-__
Feb. 4
4 a.m____812 m __ _4 p.m____12 p.m_._
Feb. 5
6 a.m____12 m __ _6 p.m____12 p.m___
Gage height
26.9324.80
23.6622.3320.9019.4016.72
15.0014.2914.0214.15
Dis charge
24,90022,300
20,90019,30017,60015,80012,600
10,5009,7209,4209,560
26. TUG FORK AT LITWAR, W. VA.
Location. Lat 37°29'05", long 81°50'40", on left bank 200 ft downstream from WarBranch, 0.5 mile downstream from Litwar, McDowell County, 2.2 miles northwest oflaeger, and 2.7 miles downstream from Dry Fork.
Drainage area. 502 sq mi. Gage-height record. Water-stage recorder graph. Datum of gage is 936.36 ft above
mean sea level, datum of 1929. Discharge record. Stage-discharge relation defined by current meter measurements
below 30,000 cfs and extended above. Stage-discharge relation affected by ice Jan.17-21.
Maxima. January-February 1957: Discharge, 35,700 cfs 7:30 p.m. Jan. 29 (gage height,21.60 ft).
1930 to December 1956: Discharge, 27,600 cfs Mar. 25, 1935 (gage height, 19.0 ft).
Mean discharge, in cubic feet per second, 1957
Day
!__-._2 __ _3 _____4_ __ _56___._78 _____9___._10 ___ 11 ___
January
259 238 197 248 284 370 426 400
2,480 4,240 2,450
Monthly mean dis Runoff, in inches
February
6,800 6,670 3,700 2,570 2,190 2,330 2,510 3,550 7,710 7,140 4,480
Day
12 ___ 13 ___14 ____15____ 16 ___ 17____18____ 19 ___ 20. __ 21 __ 22 .
January
1,410 1,010
764 602 530 470 400 370 360 370 395
charge, in cubic feet per seco
February
2,830 2,210 1,800 1,460 1,310 1,140
991 1,230 2,830 2,150 1,740
Day
23____ 24 ___25. __ 26 ____ 27____ 28 __ 29 __30 ____31.
nd
January
1,410 1,680 1,170
865 821
3,420 19,00010,9004,450
2,000 4.59
February
1,410 1,230 1,120 1,080 1,030 1,010
2,722 5.65

A66 FLOODS OF 1957
Gage height, in feet, and discharge, in cubic feet per second, at indicated time, 1957
Hour
Jan. 26
12 p.m...
Jan. 27
6 a.m....12 m __ .6 p.m....12 p.m.__
Jan. 28
6 a.m.... 12 m ....6 p.m____ 12 p.m...
Jan. 29
1 a.m____ 2........3. ___ ._4........5. _______6. ..__.__7__ __._..8... __ _.9--------10_______ll---_-_.12 m __..
2_. ..___.3 ___ ...4--._..._5________
Gage height
2.81
2.792.822.933.25
3.84 4.906.20 6.77
6.80 6.826.786.786.887.057.307.658.359.35
10.6012.20 14.0015.7017.1518.5019.60
Dis charge
748
732756847
1,150
1,780 3,1105,150 6,160
6,210 6,2506,1706,1706,3506,6607,1407,8009,200
11,20013,70016,900 20,50023,90026,80029,50031,700
Hour
Jan. 29-Con.
6 p.m.... 7. _______7:30 __ .8_. ......9. _______10 __ ___11-------
Jan. 30
4 a.m____ 8 __ __ .12 m ..__ 4 p.m.-__ 8-...-...12 p.m...
Jan. 31
8_. ______12 m _-_.
8 __ , ____
Feb. 1
4 a.m.... 8. .__-.__12 m __-.
8___.___.
Gage height
20.8021.5921.6021.5521.0020.0018.6017.25
12.509.457.80 6.82 6.295.93
5.675.465.375 406.056.28
6.98 7.226 976.837.147.68
Dis charge
34,100 35,70035,70035,60034,50032,50029,70027,000
17,700 11,600
8,300 6,430 5,4704,860
4,4304,100
4,0005,0605,460
6,720 7,180
6,4407,0308,060
Hour
Feb. 2
2 a.m--_- 4____..._8__ ___ _12 m __ _
4........8.. __ ...10. ______12 p.m...
Feb. 3
12 m __ . 6 p.m.... 12 p.m...
Feb. 4
12 m -__.
Feb. 5
12 m ....
12 p.m...
Gage height
7.93 7.887.426.926.656.456.115.955.78
5.425.19 4.92 4.70
4.534.384.244.12
4.004.054.164.16
Dis charge
8,560 8,4607,5606,6106,1205,7605,1704,9004,610
4,0303,680 3,280 2,970
2,7402,5502,3802,230
2,0902,1502,2802,280
27. PANTHER CREEK NEAR PANTHER, W. VA.
Location. Lat 37°26'45", long 81°52'15", on left bank, 200 ft downstream from CubBranch, 2.1 miles upstream from Trace Fork and 3 miles southwest of Panther,McDowell County.
Drainage area. 30.8 sq mi. Gage-height record. Water-stage recorder graph. Altitude of gage is 1,050 ft (from
topographic map). Discharge record. Stage-discharge relation defined by current meter measurements
below 2,800 cfs and extended above. Stage-discharge relation affected by ice, Jan.18-21.
Maxima. January-February 1957; Discharge, 4,900 cfs 11:30 a.m. Jan. 29 (gage height,9.50 ft).
1946 to December 1956: Discharge, 4,200 cfs Mar. 6, 1955 (gage height, 8.98 ft).

FLOODS OF JANUARY-FEBRUARY 1957 IN KENTUCKY
Mean discharge, in cubic feet per second, 1957
A67
Day
l.__._2.....3 __ ..4.....5_____6.....7.....8 _____g10____ 11---.
January
19 16 18 21 27 38 43 35
361 398 198
Monthly mean dis Runoff, in inches
February
580 475 182
97 92
148 171 254 645 630 258
Day
12 .... 13 ____ 14 __ . 15 __ 16 ___ 17____ 18.... 19 __ _ 20---. 21 __ _ 22 __ .
January
107 75 55 40 32 24 18 16 17 20 26
charge, in cubic feet per secc
February
126 81 60 44 39 30 26 72
155 110
80
Day
23... 24 __25 __. 26... 27 ... 28 __ 29 __30 ___ 31. __
January
196 143
86 60 69
418 2,250
478 239
179 6.69
February
65 54 49 45 37 39
166 5.61
Gage height, in feet, and discharge, m cubic feet per second, at indicated time, 1957
Hour
Jan. 26
12 p.m___
Jan. 27
12 m ____
12 p.m...
Jan. 28
6 a.m.... 12 m ---.6 p.m____ 12 p.m.__
Jan. 29
1 a.m.... 3 ________4________5________6 __ _____7 __ .....9________ll--_-_..11:30 _--. 12 m ....
2________
Gage height
2.43
2.432.522.673.30
4.19 4.685.00 4.87
4.864.935.135.906.957.708.509.489.50 9.38 9.008.52
Dis charge
49
495770
148
332 455555 511
508 530602940
1,6202,4403,5004,8704,900 4,730 4,2003,530
Hour
fan. 29 Con.
4 p.m.... 6........1. .......8. ___ ..9. __ ....10 _______11_______12 p.m...
Jan. 30
4 a.m_.__ 8 ___ __12 m .__. 4 p.m.... 8 ________12 p.m...
Jon. 31
8 a.m....
8. _______12 p.m___
Feb. 1
4 a.m..... 3-------.12 m ---.
Gageheight
7.95 7.427.317.106.756.556.236.02
5.38 4.874.47 4.22 4.003.82
3.653.653.924.22
4.43 4.584.66
Dis charge
2,740 2,1001,9701,7601,4601,3001,1001,000
706 511
' 402 340 285248
214214268340
392 430450
Hour
Feb. 1-Con.
4 p.m.... 8. ____ _12 p.m...
Feb. 2
6 a.m....12 m ---. 6 p.m____ 12 p.m...
Feb. 3
6 a.m.... 12 m .... 6 p.m....12 p.m...
Feb. 4
12 m __..6 p.m....12 p.m___
Feb. 5
6 a.m.... 12 m __ . 6 p.m....12 p.m___
Gage height
5.00 6.085.82
5.094.52 4.15 3.85
3.64 3.47 3.303.13
2.922.822.75
2.69 2.83 3.023.18
Dis charge
555 1,030
904
586415 322 254
212179 148122
968578
72 86
108129

A68 FLOODS OF 1957
28. TUG FORK NEAR KERMIT, V. VA.
Location. Lat 37°49'05", long 82°23'20", on right bank 2 miles upstream from WolfCreek, 3 miles upstream from Kermit, Mingo County, and 3 miles downstream fromPigeon Creek.
Drainage area. 1,185 sq mi. Gage-height record. Water-stage recorder graph except 2 a.m. to 4 p.m. Jan. 30 for
which graph was reconstructed on the basis of high-water mark. Datum of gage is581.82 ft above mean sea level, datum of 1929.
Discharge record. Stage-discharge relation defined by current meter measurementsbelow 30,000 cfs and by slope-area measurement of 61,600 cfs.
Maxima. January-February 1957; Discharge, 61,300 cfs 1 p.m. Jan. 30 (gage height,43.88 ft, high water mark in gage well).
1934 to December 1956: Discharge, 44,600 cfs Feb. 28, 1955 (gage height, 40.6 ft). Stage previously known: About 43.3 ft on unknown date prior to 1915.
Mean discharge, in cubic feet per second, 1957
Day
1 __ ._2----.3_.__.4.....5_-.__6_.___?_____8. ....9_____10_.._ 11--..
January
740 670 582 582 688 740 880 980
4,030 17,200 11,400
Monthly mean dis Runoff, in inches
February
12,100 19,200 12,500 6,270 4,380 5,980 5,900 6,120
12,200 21,800 17,200
Day
12.... 13 ___ 14.... 15. __ 16.... 17 __ . 18 __ .19 ___ 20._._ 21 .... 22____
January
4,930 3,200 2,350 1,750 1,430 1,160
940 840 820 860 940
charge, in cubic feet per seco
February
7,940 4,930 3,800 3,100 2,600 2,250 1,950 1,950 3,360 4,570 3,910
Day
23 __ . 24 __ . 25.__. 26..-. 27____ 28.... 29....30 ....31___-
nd
January
4,380 5,470 3,850 2,750 2,150 3,970
22,90052,90023,000
5,777 5.62
February
3,410 3,100 2,800 2,500 2,300 2,150
6,438 5.66
Gage height, in {eel, and discharge, in cubic feet per second, at indicated time, 1957
Hour
Jan. 26
12 p.m.__
Jan. 27
6 a.m____ 12 m _.__12 p.m...
Jan. 28
6 a.m____ 12 m _-_- 6 p.m____ 12 p.m__.
Gage height
7.12
6.83 6.67 6.40
6.63 7.94
11.80 18.30
Dis charge
2,360
2,210 2,140 2,000
2,120 2,770 4,930
10.100
Hour
Jan. 29
12 m ._...
12 p.m....
Ja«. 30
2.........4_. ...... _6. ........7__... __ .8. ._...._.9.... __ __
Gage height
22.64 27.90 35.15 40.00
40.40 40.90 41.70 42.60 43.00 43.30 43.55
Dis charge
14,200 20,400 30,800 42,500
43,900 45,600 48,800 53,600 56,000 57,800 59.300
Hour
Jem. 30-Con.
10 a.m.... ll._.._-_.12 m .....
2---.----.3. .______.4.-.-----.5.... __ ..1. ........9.... __ _J10. _..-_..12 p.m....
Gage height
43.70 43.80 43.87 43.88 43.87 43.80 43.65 43.20 42.00 41.00 40.50 39.00
Dis charge
60,200 60,800 61,200 61,300 61,200 60,800 59,900 57,200 50,000 46,000 44,200 39,500

FLOODS OF JANUARY-FEBRUARY 1957 IN KENTUCKY A69
Gage height, in feet, and discharge, in cubic feet per second, at indicated time, 1957 Continued
Hour
Jan. 31
12 m __ .
12 p.m. _
Feb. 1
4 ______6. .._._._8 ______10 ..__._.12 m ....2 p.m____ 4 ______8 ____ ..10 ___ ._12 p.m...
Gage height
34.3028.8023.7020.00
19.2518.7218.5018.5818.7519.2319.82 20.7322.9024.0024.90
Dis charge
29,40021,50015,40011,600
10,90010,40010,20010,30010,50010,90011,400 12,30014,50015,70016,700
Hour
Feb. 2
4 ___ __ ..6 _______8 _______10 ______12 m . __ .
4. __ _____6 ___ ..-._8 _________10 ___ ....12 p.m....
Feb. 3
12 m __ ._
Gage height
25.6526.3026.8027.2527.5527.7527.8227.7527.5827.2526.7026.00
23.4020.6518.00
Dis charge
17,60018,40019,00019,50019,90020,20020,30020,20020,00019,50018,80018,000
15,00012,2009,800
Hour
Feb. 3-Con.
Feb. 4
6 a.m....12 m __
12 p.m...
Feb. 5
8... _____12 m __ .
8__ ..12 p.m...
Gage height
16.00
14.6313.5312.5511.68
11.2810.8510.52 10.3810.7411.35
Dis charge
8,100
7,0006,1505,4404,860
4,6204,3604,160 4,0804,2904,660
29. BIG SANDY RIVER AT LOUISA, KY.
Location. Lat 38°10'16", long 82°38'05', on left bank, 1.6 miles upstream from BlaineCreek, 4.3 miles northwest of Louisa, Lawrence County, and at mile 21.2.
Drainage area. 3,870 sq mi, approximately. Gage-height record. Water-stage recorder graphs, except for Feb. 9, 10 at auxiliary
gage, 5.0 miles upstream. Datum of gage is 512.81 ft above mean sea level, datum of1929.
Discharge record. Stage-fall-discharge relation or stage-discharge relation definedby current-meter measurements. Fall used as a factor Jan. 12, 13, Jan. 24 28, Jan.30 to Feb. 8, Feb. 11 15. Discharge for Feb. 9, 10 estimated on basis of recordedrange in stage, weather records and summation of records for Levisa Fork at Paints -ville, Ky., and Tug Fork near Kermit, W. Va.
Maxima. January-February 1957: Discharge, 84,900 cfs 6 p.m. Jan. 31 (gage height,44.42 ft); gage height, 44.43 ft at 7 p.m. Jan. 31.
1938 to December 1956: Discharge, 89,400 cfs Mar. 2, 1955; gage height, 46.36 ftMar. 2, 1955.
Flood of Apr. 3, 1908, reached a stage of 48.4 ft, former site and datum.

A70 FLOODS OF 1957
Mean discharge, in cubic feet per second, 1957
Day
!-____2____-3_____4. __5. ....6____-7__.._8____-9--___10-.-- 11--.-
January
2,450 2,200 1,880 1,760 1,780 1,800 2,030 2,410 3,610
21,400 38,200
Monthly mean dis Runoff, in inches
February
68,200 52,000 46,400 36,700 26,700 19,800 19,300 19,800 26,000 45,000 52,000
Day
12 __ 13. __ 14 __ 15 ___ 16. ... 17--.- 18 ___ 19 __ . 20 __ 21 __ . 22 ____
January
28,100 19,000 10,500
7,240 5,480 4,450 3,760 3,100 2,800 2,850 3,220
charge, in cubic feet per seco
February
45,300 31,200 18,600 14,600 10,600
7,320 6,100 5,360 6,130
10,300 12,800
Day
23---. 24 __ .25 ____ 26..-.27. ___ 28. ._.9Q
30-... 31 __ .
nd. __ ___------.
January
9,180 18,200 17,700 12,800 8,750 8,210
23,20058,600 82,000
13,180 3.93
February
11,100 9,730 8,670 7,720 6,970 6,320
-----------
22,530 6.06
Gage height, in feet, and discharge, in cubic feet per second, at indicated time, 1957
Hour
Jan. 27
Jan. 28
4am8-.. __ -.12 m .___
8 __ .....
Jan. 29
8 ____ ..12 m __-- 4 p.m____ 8-_. __ -_12 p.m...
Jan. 30
4---._--_6. .......10 __ ___2 p.m.... 4. .__-.--6 ........8_.._- ...10 ___ -_12 p.m...
Gage height
11.83
11.5211.2411.1111.3811.9612.92
14.9617.7921.49 23.65 25.8227.74
30.9632.4133.3235.0636.81 37.7638.6439.4940.4541.12
Dis charge
7,790
7,7107,5907,7808,3208,960
10,100
12,70017,00023,700 28,200 33,30038,000
43,90046,60050,60056,60061,800 64,60067,10070,00072,30075,000
Hour
Jan. 31
Q
4. __ -_._.5. __ ..-__7. .. _----_9. _____-._ll-______-
3_. -._-_-.4_. ..___.-6__. ..___-7..-.. _ _8- __ _.._-9._ __ ..__10. ._..-_.12 p.m___-
Feb. 1
8. __..__._12 m .....
8_ __ ....-12 p.m____
Feb. 2
12 m __ ..
12 p.m..-.
Gage height
41.4942.0942.4142.8043.3643.6843.9244.2244.3144.3644.4244.4344.3644.2744.2044.02
43.2742.3041.2640.2639.3138.38
37.2236.5236.2035.89
Dis charge
76,10077,90078,80080,00081,70082,60083,40084,30084,50084,70084,90084,40084,30083,60082,50080,300
76,50072,20067,80063,80060,10057,600
53,50051,20049,80049,100
Hour
Feb. 3
4 a.m....8.-.. __ _12 m -__-4 p.m___.8. __ ___.12 p.m___
Feb. 4
4 a.m____8--------12 m ....4 p.m....8__.- __12 p.m...
Feb. 5
6 a.m.... 12 m ._._6 p.m____12 p.m...
Feb. 6
6 a.m....12 m __ _ 6 p.m____12 p.m___
Gage height
35.7035.4635.1534.7434.2133.53
32.7731.8330.8029.6828.5227.24
25.25 23.2621.5420.24
19.4919.54 19.9020.26
Dis charge
48,70048,10046,80045,90043,60042,100
40,40038,30036,60034,30033,60032,000
29,300 27,10023,80021,300
19,90020,000 19,20018,700

FLOODS OF JANUARY-FEBRUARY 1957 IN KENTUCKY A71
30. BLAINE CREEK AT YATESVILLE, KY.
Location. Lat 38°08'40", long 82°41'05", on upstream wall near center of span of cov ered bridge at Yatesville, Lawrence County, 5 miles northwest of Louisa, 5.8 miles upstream from Cat Creek, and 10.2 miles downstream from Little Blaine Creek.
Drainage area. 217 sq mi.Gage-height record. Wire-weight gage and peak from crest-stage indicator. Graph
drawn for days of changing stage. Datum of gage is 561.57 ft above mean sea level, unadjusted.
Discharge record. Stage-discharge relation defined by current-meter measurements.Maxima. January-February 1957: Discharge, 4,320 cfs 7-8 a.m. Jan. 30 (gage height,
16.05 ft, from crest-stage indicator).1915-18, 1938 to December 1956: Discharge, 15,500 cfs Feb. 4, 1939 (gage height,
26.55 ft).Maximum stage known, 27.6 ft, on unknown date prior to 1915.
Mean discharge, in cubic jeet per second, 1957
Day
I......2. __ .3. __ _J4.-___-5_____J6 __ ...7 __ __ |8 __ __ ]9_ ___ 110..__.11--__J
January
137 111
87 94 97
101 101 105 560
2,460 1,400
Monthly mean dis Runoff, in inches
February
1,230 2,700 1,130
719 594 857 737 594
1,210 3,400 2.120
Day
12.....13_.__.14__._.15.....16____.17 __ .]18 __ .1 Q
20_____|21____.22....,
January
540 390 290 226 203 198 176 162 121 376
2,600
charge, in cubic feet per seco
February
864 640 479 364 312 254 213 203 226 175 203
Day
23 __ . 24 .... 25 .... 26 .... 27. ... 28 .... 29 ....30 ....31 __ _
nd. .__.._-.-_-...
January
1,430 872 670 430 314 468
2,6303,7901,160
719 3.82
February
220 208 208 220 220 231
733 3.52
LITTLE SANOY RIVER BASIN
31 LITTLE SANDY PIVFR NEAR GRAYSON, KY
Location. Lat 38°20'25", long 82°55'10", on downstream side of center pier of highwaybridge, 0.3 mile upstream from Lower Stinson Creek, 1.3 miles downstream from U.S.Highway 60, and 1.7 miles northeast of Grayson, Carter County.
Drainage area. 398 sq mi. Gage-height record. Water-stage recorder graph. Datum of gage is 557.95 ft above
mean sea level, datum of 1929.Discharge record. Stage-discharge relation defined by current-meter measurements. Maxima. January-February 1957: Discharge, 6,400 cfs 10 p.m. Jan. 23 (gage height,
17.09 ft).1938 to December 1956: Discharge, 24,500 cfs Sept. 22, 1950; gage height, 27.53 ft
Sept. 22, 1950.

A72 FLOODS OF 1957
Mean discharge, in cubic feet per second, 1957
Day
1-..--2_____3.....4 _____5_____6_____?_____8_____910 ____ 11____
January
295 236 185 174 192 194 181 183 823
3,500 2,790
Monthly mean dis Runoff, in inches
February
2,610 4,980 2,790 1,480 1,050 1,370 1,220 1,020 1,210 4,700 4,180
Day
12 ____ 13 __ 14 ____ 15____ 16 __ 17 __ 18 __ 19-..- 20 ____ 21. ___ 22____
January
1,180 886 679 520 428 330 250 250 250 260 815
charge, in cubic feet per seco
February
1,680 1,260
920 707 590 475 400 352 368 316 308
Day
23 __ 24-.-- 25... _ 26 __ . 27-__. 28. __ 29_._-30 __ .31--__
nd __ _ __ ... __
January
5,720 4,620 1,490
996 748 877
3,4705,6502,650
1,300 3.77
February
304 292 288 300 308 320
1,278 3.35
TYGARTS CREFK BASIN
32. TYGARTS CREEK NEAR GRFENUP, KY
Location. Lat 38°33'51", long 82°57'08", on downstream side of center pier of bridgeon State Highway 7, 100 ft downstream from Lick Run, 0.4 mile upstream from WhiteOak Creek, and 6f miles west of Greenup, Greenup County.
Drainage area. 241 sq mi. Gage-height record. Water-stage recorder graph. Datum of gag,e is 547.14 ft above
mean sea level, datum of 1929.Discharge record. Stage-discharge relation defined by current-meter measurements. Maxima. January-February 1957: Discharge, 4,000 cfs 11:30 p.m. Jan. 23 (gage height,
13.99 ft).1940 to December 1957: Discharge, 12,800 cfs Apr. 13, 1948 (gage height, 20.35 ft).
Mean discharge, in cubic feet per second, 1957
Day
l--._-2_-___3-____4___.-5_____6__.._7 __ ..8. __
10_.._ 11 __ _
January
200 166 140 130 134 130 124 120 547
2,430 1,280
Monthly mean dis Runoff, in inches
February
1,260 2,650 1,170
744 556 784 692 528 818
3,010 1,960
Day
12 ____ 13 __ _ 14__._ 15.__. 16__._ 17.-.. 18 __ 19 __ 20_._- 21 __ . 22....
January
688 512 420 315 220 160 130 120 135 166 583
charge, in cubic feet per seco
February
1,170 804 576 446 370 305 250 208 188 163 147
Day
23.. ._24 __ _ 25 __ . 26 ____ 27.... 28 __ . 29___- 30. __ 31 ____
nd __ ______ ...
January
3,360 1,980
756 552 446 616
1,660 2,260
985
692 3.31
February
140 130 120 122 134 158
700 3.03

FLOODS OF JANUARY-FEBRUARY 1957 IN KENTUCKY A73
LICKING RIVER BASIN
33. LICKING RIVER NEAR SALYERSVILLE, KY
Location. Lat 37°45'03", long 83°05'04", on left bank at upstream side of bridge on State Highway 30, 0.2 mile upstream from Gardner Branch, 1.2 miles west of Salyersville, Magoffin County, and 3.1 miles downstream from State Road Fork.
Drainage area. 140 sq mi.Gage-height record. Water-stage recorder graph. Datum of gage is 823.80 ft above
mean sea level, datum of 1929.Discharge record. Stage-discharge relation defined by current-meter measurements.Maxima. January-February 1957: Discharge, 5,880 cfs 12:30 a.m. Jan. 30 (gage height,
20.79 ft).1938 to December 1956: Discharge, 14,300 cfs Feb. 3, 1939 (gage height, 25.4 ft,
from floodmark).
Mean discharge, in cubic feet per second, 1957
Day
1 __ ..2 _____3_____4 _____5 _____6 _____7_____8 __ ._9 __ __10 ____ 11 ____
January
97 78 63 62 76 74 74 71
669 1,960 1,040
Monthly mean dis Runoff, in inches
February
1,220 2,120 1,100
597 528 904 728 918
1,420 1,820 1,530
Day
12 ____ 13 ____ 14 __ 15 ____ 16 __ 17 ____ 18 ____ 19 ____ 20. ___ 21 ____ 22 ____
January
409 284 211 164 139 107
96 81 78 83
115
charge, in cubic feet per seco
February
596 386 283 218 184 152 132 148 219 206 239
Day
23 __94
25 __26 ____ 27__._ 28__._29 ____30. ___31..-.
nd ______________
January
1,280 815 423 339 318 883
3,5204,3601,370
624 5.14
February
257 246 228 206 182 184
------------
605 4.50
KENTUCKY RIVER BASIN
34. NORTH FORK KENTUCKY RIVER AT WHITESBURG, KY
[Miscellaneous site]
Location. Lat 37°07'12",long 82°49'50",at first railroad bridge downstream from rail road station in Whitesburg, Letcher County, 0.7 mile downstream from bridge on U.S. Highway 119, and 1.3 miles downstream from Solomon Branch.
Drainage area. 66.4 sq mi.Discharge record. Peak discharge by contracted-opening measurement.Maximum. January-February 1957: Discharge, 7,730 cfs Jan. 29.

A74 FLOODS OF 1957
35. NORTH FORK KENTUCKY RIVER AT HAZARD, KY.
Location. Lat 37°14'45", long 83°11'00", near right bank on downstream side of Wood land Park bridge on eastern limits of Hazard, Perry County, 150 ft upstream from city waterworks dam, and 4.0 miles upstream from Lotts Creek.
Drainage area. 466 sq mi.Gage-height record. Wire -weight gage read twice daily and peak from floodmarks.
Graph drawn for days of changing stage. Datum of gage is 839.76 ft above mean sea level, datum of 1929.
Discharge record. Stage-discharge relation defined by current-meter measurements below 20,000 cfs and by contracted-opening measurement at 47,800 cfs.
Maxima. January-February 1957: Discharge, 47,800 cfs 7p.m. Jan. 29 (gage height, 37.54, from floodmarks).
1940 to December 1956: Discharge, 28,100 cfs Feb. 1, 1951 (gage height, 27.2 ft). Flood of May 30, 1927, reached a stage of about 34 ft (from information by local
resident, U.S. Weather Bureau gage reading and relation of 1927 and 1939 floods). Flood of Feb. 3, 1939, reached a stage of 29.95 ft, from floodmark.
Mean discharge, in cubic jeet per second, 1957
Day
!---_-.2_____.3 ___ .4_____.5_____.6_____.7_____.8 ___ .9---'._.|10 ___ . 11--...
January
216 189 138 189 230 382 440 400 680
3,150 2,000
Monthly mean dis Runoff, in inches
February
4,980 6,180 2,530 1,560 1,260 1,480 1,740 2,380 6,150 9,160 3,340
Day
12--.. 13__._14 ____ 15____ 16 .... 17__._ 18 .... 19__._ 20 .... 21 .... 22. ...
January
1,120 821 620 500 382 216 180 180 200 210 246
charge, in cubic feet per seco
February
1,730 1,230
920 766 660 540 470
1,100 1,910 1,350 1,140
Day
23 ____ 24 __ _ 25 __ _ 26 ____ 27.-.. 28 .... 29---. 30 __ .31 ___
nd ____ .--. -
January
2,620 1,570 1,090
755 824
4,590 32,300 15,7003,110
2,427 6.01
February
992 876 788 733 680 650
___________
2,046 4.57
Gage height, in jeet, and discharge, in cubic jeet per second, at indicated time, 1957
Hour
Jan. 26
12 p.m...
Jan. 27
6 a.m____12 m ._--
12 p.m...
Jan. 28
8 ........12 m ..._
8_. __ ...
Gage height
5.00
4.905.005.205.60
6.006.907.808.709.50
Dis charge
700
600700920
1,450
2,0303,3404,6205,8106,850
Hour
Jan. 28 -Con.
12 p.m___
Jan. 29
2 a.m....4_ __ .__6. _______8. __ _._.10 _..___.12 m ....2 p.m____4 ____ -.6__- __ _-7 ________8 ________10-. __ -.
Gage height
10.60
11.5013.0016.4021.6027.2031.6035.6037.2037.5237.5437.4036.60
Dis charge
8,280
9,45011,40015,80023,00031,40038,30044,70047,20047,70047,80047,50046,300
Hour
Jan. 29-Con.
12 p.m_._
Jan. 30
4 a.m_.__8. ___ ._12 m ,.._4 p.m____8___.___-12 p.m...
Jan. 31
6 a.m__._12 m __ _
Gage height
33.80
26.6019.3011.60
9.008.107.60
6.986.596.30
Dis charge
41,800
30,50019,800
9,5806,2005,0304,340
3,4502,8902,460

FLOODS OF JANUARY-FEBRUARY 1957 IN KENTUCKY A75
Gage height, in feet, and discharge, in cubic feet per second, at indicated time, 1957 Continued
Hour
Jan. 31-Con.
Feb. 1
6 a.m____12 m _._.6 p.m....,12 p.m...
Feb. 2
4 a.m_.__
Gage height
6.61
7.207.878.84
10.38
11.12
Dis charge
2 910'
3,7704,7205,9907,990
8,960
Hour
Feb. 2-Con.
12 m _____
8___ __ __.12 p.m....
Feb. 3
12 m ___.
12 p.m....
Gage height
10.458.587.857.376.96
6.536.306.105.94
Dis charge
8,0805,6504,6904,0203,420
2,8002,4602,1801,940
Hour
Feb. 4
6 p.m....12 p.m.__
Feb. 5
6 a.m....12 m ....12 p.m...
Gage height
5.785.555.47
5.405.435.58
Dis charge
1,7101,3801,270
1,1701,2101,420
36. BEAR BRANCH NEAR NOBLE, KY.
Location. Lat 37°27'02", long 83°11'43", on right bank 800 ft upstream from mouth, aquarter of a mile west of Noble, Breathitt County, 1.4 miles east of former site ofNoble Postoffice, and 3^ miles north of Stacy.
Drainage area. 2.21 sq mi. Gage-height record. Water -stage recorder graph, except for periods of lagging intake
action, Jan. 10-14, 23-26, 29-31, Feb. 2, 3, 10-14, when graph was drawn using shapeof recorder trace, occasional staff-gage readings, and floodmark. Datum of gage is807.81 ft above mean sea level, datum of 1929.
Discharge record. Stage-discharge relation defined by current-meter measurementsbelow 150 cfs.
Maxima. January-February 1957: Discharge, 375 cfs 9 a.m. Jan. 29 (gage height, 3.20ft, from floodmark).
1954 to December 1956: Discharge, 328 cfs Feb. 18, 1956 (gage height, 3.01 ft).
Mean discharge, in cubic feet per second, 1957
Day
I.....2.....3_..__4.....5 _....6.....7 __ ..
q10.... 11....
January
0.5 .3 .3 .6
1.0 1.1 1.2 1.2
31 31 12
Monthly mean dis Runoff, in inches
February
46 28 10 5.6 4.5 5.4 7.0
11 35 40 15
Day
12-.-- 13.... 14.... 15....16 ____ 17 ___ 18 .... 19 ____ 20 __ . 21 ___ 22 __ _
January
7.4 4.3 2.6 2.15 1.55 .7 .7 .8
1.2 2,0
11
charge, in cubic feet per secc
February
8.8 4.6 3.2 2.6 2.15 1.85 1.55 4.0 5.4 5.4 7.0
Day
23 _.__ 24 ____ 25 .___ 26 __ . 27 __ . 28 __ . 29 __ . 30 ___ 31.-..
January
24 7.8 5.0 3.7 5.2
44 160 26 18
13.2 6.87
February
6.6 5.4 4.0 3.5 2.9 6.7
10.1 4.76

A76 FLOODS OF 1957
Gage height, in feet, and discharge, in cubic feet per second, at indicated time, 1957
Hour
Jan. 26
12 p.m___
Jan. 27
12 m __6 p.m____ 12 p.m___
Jan. 28
12 m ._..6 p.m____ 12 p.m___
Jan. 29
2 a.m____ 4 __ .__..6 ______8. _____9 ____ ..10 .......
Gage height
1.25
1.271.291.35 1.40
1.621.801.95 1.88
1.97 2.022.243.083.203.10
Dis charge
3.3
3.74.36.6 8.8
254672 59
75 85
135345375350
Hour
Jan. 29-Con.
12 m _____
4 ._6_ ____ __810 ........12 p.m____
Jan. 30
12 m __ __
12 p.m____
Jan. 31
12 m -_-._12 p.m.___
Feb. 1
12 m --.__
Gage height
2.712.472.262.152.041.951.88
1.671.571.521.51
1.531.61
1.631.69
Dis charge
252192140114907259
31201615
1724
2633
Hour
Feb.l-Con.
12 p.m___
Feb. 2
12 m ____ 12 p.m___
Feb. 3
12 m __ _12 p.m___
Feb. 4
12 m ____ 12 p.m___
Feb. 5
12 m __ _12 p.m___
Gage height
2.031.82
1.701.63 1.51
1.411.37
1.32 1.29
1.291.31
Dis charge
8849
3426 15
9.37.4
5.4 4.3
4.35.0
37. TROUBLESOME CREEK AT NOBLE, KY.
Location. Lat 37°26'36", long 83°13'06", on left bank adjacent to State Highway 15, at former site of Noble Post Office, 0.2 mile downstream from Buckhorn Creek, 1.5 miles west of Noble, Breathitt County, and 14 miles upstream from mouth.
Drainage area. 177 sq mi.Gage-height record. Water-stage recorder graph. Datum of gage 768.5 ft above mean
sea level, datum of 1929.Discharge record. Stage-discharge relation defined by current-meter measurements
below 10,000 cfs.Maxima. January-February 1957: Discharge, 13,500 cfs 5p.m. Jan. 29 (gage height,
23.35 ft).1949 to December 1956: Discharge, 15,600 cfs Feb. 1, 1951 (gage height, 24.78 ft). Maximum stage known, about 29 ft in February 1939, from information by local
residents.

FLOODS OF JANUARY-FEBRUARY 1957 IN KENTUCKY
Mean discharge, in cubic feet per second, 1957
A77
Day
!-.--_2_--_.3 __ __4__...5-_.__6 _7 .....8_..__9--.__10___. 11__._
January
79 58 45 64 94 98
110 108
1,460 3,070 1,080
Monthly mean dis Runoff, in inches
February
2,430 2,300
984 594 500 688 730 882
2,460 3,680 1,350
Day
12__._ 13-...14___. 15 __ .16 .... 17 ....18 ....19 .... 20 __ _ 21_.._22 ....
January
562 370 270 206 130 65 60 70 89
122 217
charge, in cubic feet per seco
February
685 475 342 260 217 174 150 322 493 457 529
Day
23.. ._24 .... 25 __ . 26 __ .27 .... 28.... 29.... 30 __ .31___.
nd._. -_.._--_--.
January
2,360 882 529 348 374
2,520 9,230 2,9701,210
931 6.06
February
553 493 415 350 282 330
826 4.86
Gage height, in feet, and discharge, in cubic feet per second, at indicated time, 1957
Hour
Jan. 26
12 p.m...
12 m ....
Jan. 28
4. ___ _.6_._ __ __8.. ......10.. __ _.12 m ._._2 p.m....4... __ _.6... __ ..8 ........10.. __ _.
Jan. 29
1 a.m.... 2.--.....3. -_--._.4________5... __ ..6... __ _.7 _____ .8 ....._._9 __ .....
Gage height
3.08
3.123.243.444.11
4.615.346.207.408.409.17
10.40 11.6512.4812.9513.1512.96
12.85 12.8512.9813.2613.7014.3816.1018.0019.4721.25
Dis charge
300
310340397598
748984
1,2801,7002,0602,3702,880 3,4803,8904,1704,2904,180
4,110 4,1104,1904,3604,6205,0706,2807,8309,170
11,000
Hour
Jan. 29-Con.
1 p.m.... 3. __ ....4_. ______5 ________6__ ___ ..8__.-_.._10 _______ll..---__
Jan. 30
4__.___._6_.__ __ _8 ._._.._.10. .-.___12 m ---.
4. __ ....6. ..-_._.8. .......10 .......12 p.m...
Jan. 31
12 m ....
12 p.m...
Feb. 1
8. .......
Gage height
22.45 23.1023.3023.3523.0222.0320.3719.3018.18
16.0813.7312.0610.65
9.628.90 8.297.787.367.026.726.49
6.025.705.756.52
6.897.50
Dis charge
12,400 13,20013,40013,50013,10011,90010,100
9,0007,990
6,2604,6403,6802,9902,5502,260 2,0201,8401,6901,5701,4701,390
1,2201,1101,1301,400
1,5301,740
Hour
Feb. I-Con.
12 m .... 4 p.m....8. _._..-_12 p.m...
Feb. 2
4 a.m....8 __ ....12 m ____ 4 p.m.... 8. _._..._12 p.m...
Feb. 3
6 a.m___.12 m __-. 6 p.m....12 p.m...
Feb. 4
6 a.m.... 12 m .... 6 p.m.... 12 p.m...
Feb. 5
6 a.m....12 m ....6 p.m____12 p.m...
Gage height
8.45 10.2012.3012.40
11.469.688.39 7.45 6.816.35
5.735.26 4.864.56
4.31 4.08 3.87 3.70
3.603.633.894.32
Dis- , charge
2,080 2,7903,8003,850
3,3802,5702,060 1,720 1,5001,340
1,120956 823733
658 589 526475
445454532661
690-137 O - 64 - 6

A78 FLOODS OF 1957
38. NORTH FORK KENTUCKY RIVER AT JACKSON, KY.
Location. Lat 37°33'05", long 83°23'05",near center of span on upstream side of bridgeon State Highways 30 and 52 at Jackson, Breathitt County, 3 miles downstream fromQuicksand Creek.
Drainage area. 1,101 sq mi. Gage-height record. Graph drawn from twice-daily wire-weight gage readings, except
Jan. 29 to Feb. 1, when graph was based on numerous extra readings and observationsat crest. Datum of gage is 697.67 ft above mean sea level, datum of 1929.
Discharge record. Stage-discharge relation defined by current-meter measurements.Rate of change in stage used as a factor Jan. 9-11, 23, 24, Jan. 28 to Feb. 4, Feb. 8-12.
Maxima. January-February 1957; Discharge, 53,500 cfs 10 a.m. Jan. 30 (gage height,39.34 ft); gage height, 40.41 ft 3:15 p.m. Jan. 30.
1928-31, 1936-37, 1938 to December 1956: Discharge, 46,800 cfs Feb. 4, 1939, (gageheight, 43.10 ft).
Maximum stage known, that of Feb. 4, 1939. Flood of May 30, 1927, reached a stageof 42.9 ft.
Mean discharge, in cubic feet per second, 1957
Day
1. __2-.---3_ ....4. __5___-.6 _____7_.___8_ __q
10 ___ 11.---
January
504 434 300 330 390 455 665 770
4,090 9,480 7,770
Monthly mean dis Runoff, in inches
February
10,800 14,500
9,900 5,640 3,780 4,200 4,350 4,960 8,470
16,300 14,400
Day
12 __ 13.__. 14-...15 ____ 16____ 17.._. 18--..19 ____20 ____ 21-... 22....
January
4,330 2,660 1,700 1,330 1,060
700 525 490 504 581 958
charge, in cubic feet per secc
February
6,800 4,200 2,840 2,300 1,900 1,480 1,310 1,150 2,200 3,450 3,340
Day
23 ____ 24. __ 25____ 26. __ 27--., 28 ___ 29 ____30 __31 __
January
6,850 6,040 3,700 2,530 2,080 6,250
25,30047,80025,100
5,344 5.60
February
3,120 2,790 2,460 2,250 1,950 1,950
5,100 4.82
Gage height, in feet, and discharge, in cubic feet per second, at indicated time, 1957
Hour
Jan. 26
12 p.m...
Jan. 27
12 m __
Jan. 28
4 a.m.___8. __._.__12 m ..._
8. _______12 p.m...
Gage height
5.4
5.15.5
5.76.48.7
11.013.215.3
Dis charge
2,200
1,9002 ^1 n
2,5303,3606,1908,090
10,10012,100
Hour
Jan. 29
4 a.m....8. ____ .
8..., __ .
Jan. 30
2 a.m____4.... __ .6_._. __ .8 ________10 _______12 m ....
Gage height
17.620.524 327.730.733.8
35.0236.2437.3438.3439.3440.00
Dis charge
14,90018,40025,10030,10035,60042,300
44,50047,20049,00051,50053,50052,300
Hour
Jan. 30-Con.
2.p.m____3:15. ____4__ ......6. __ ....8 __ ____10 __ ____12 p.m...
Jan. 31
12 p.m...
Gage height
40.3440.4140.3740.1939.7739.2138.50
34.528.922.2
Dis charge
51,50040,10049,10047,30044,70042,50039,000
30,00019,10013,500

FLOODS OF JANUARY-FEBRUARY 1957 IN KENTUCKY A79
Gage height, in feet, and discharge, in cubic feet per second, at indicated time, 1957-Continued
Hour
Feb. 1
4 a.m._._8 ........12 m _.._4 p.m____12 p.m___
Feb. 2
6 a.m____12 m ....
Gage height
19.015.814.114.116.6
18.419.6
Dis
charge
11,2009,4209,310
10,10013,000
14,80015,400
Hour
Feb. 2-Con.
6 p.m____12 p.m___
Feb. 3
6 a.m____12 m ....6 p.m____12 p.m.__
Gage height
19.418.5
17.114.912.711.4
Dis charge
14,60013,300
11,7009,4308,1807,310
Hour
Feb. 4
6 a.rn.___12 m __ _6 p.m____12 p.m...
Feb. 5
12 m ....12 p.m___
Gage height
10.39.07.76.9
6.66.8
Dis charge
6,5505,6304,7503,950
3,6503,850
39. NORTH FORK KENTUCKY RIVER NEAR AIREDALE, KY.
[Gaging station, discontinued 1942]
Location (revised). Lat 37°36'25", long 83°37'50", on right bank 0.3 mile downstream from Laurel Branch, half a mile northeast of Airedale, Lee County, 3.8 miles up stream from confluence with Middle Fork, and 5 miles northeast of Beattyville.
Drainage area. 1,294 sq mi (revised).Gage-height record. Floodmark only. Datum of gage is 632.29 ft above mean sea level,
datum of 1929.Discharge record. Stage-discharge relation defined by current-meter measurements
below 22,000 cfs made in 1929-31, 1940-42.Maxima.-^January-February 1957; Discharge, about 55,000 cfs Jan. 30, 1957 (gage height,
47.14 ft, from floodmark).1929-31, 1939-42: Discharge, 24,200 cfs July 10, 1942 (gage height, 28.30 ft). Flood of Feb. 4, 1939, reached a stage of 45.6 ft, from data furnished by Corps of
Engineers.
40. MIDDLE FORK KENTUCKY RIVER NEAR HYDEN, KY.
[Miscellaneous site]
Location. Lat 37°10'45", long 83°22'20", 0.8 mile downstream from Owlsnest Branchand 1.2 miles north of Hyden, Leslie County.
Drainage area. 226 sq mi.Discharge record. Peak discharge by slope-area measurement. Maximum. January-February 1957: Discharge, 67,500 cfs Jan. 29.

A80 FLOODS OF 1957
41. MIDDLE FORK KENTUCKY RIVER AT BUCKHORN, KY.
Location. Lat 37°20'45", long 83°28'07", on right bank 25 ft upstream from Squabble Creek, 250 ft upstream from suspension highway bridge on county road, at Buckhorn, Perry County, about 2,000 ft downstream from flood control dam, and at mile 42.9.
Drainage area. 420 sq mi.Gage-height record. Water-stage recorder graph except for periods 12 m. Jan. 29 to
3 p.m. Jan. 31 and Feb. 5 28. Graph for first period was drawn on basis of floodmark, time of peak, and shape of recorder graph on adjacent days, and for Feb. 5 on basis of recorder graph for station at Tallega. Datum of gage is 717.52 ft above mean sea level, datum of 1929.
Discharge record. Stage-discharge relation defined by current-meter measurement below 15,000 cfs and by slope-area measurement at 82,300 cfs. Discharge for Feb. 6 28 estimated on basis of weather records and records for station at Tallega.
Maxima. January-February 1957: Discharge 82,300 cfs 8:30 p.m. Jan. 29 (gage height, 43.1 ft from floodmark).
Flood of January 1939 reached a stage of 38.1 ft, from levels to high-water mark by Corps of Engineers.
.Remarks. Station established Sept. 12, 1956.
Mean discharge, in cubic feet per second, 1957
Day
!-__--2____.3.....4.....5_..._6_____7.....8_____9---.-10_... !!____
January
227 192 152 136 206 346 410 402
1,200 3,320 2,650
Monthly mean dis Runoff, in inches
February
4,060 6,540 2,530 1,370 1,160 1,400 1,500 2,500 5,000 7,500 5,000
Day
12____ 13 __ . 14___. 15l... 16___. 17____ 18____19 ____20_... 21.. _. 22____
January
1,230 824 602 460 396 305 220 190 200 244 519
charge, in cubic feet per secc
February
1,550 1,100
850 700 550 450 450
1,000 1,900 1,600 1,300
Day
23___. 24.... 25.... 26.... 27.... 28-... 29 __ . 30--.. 31 __ .
January
4,750 2,310 1,210
809 728
3,470 37,400 21,000
3,000
2,874 7.89
February
1,100 950 800 750 650 600
1,959 4.86
Gage height, in feet, and discharge, in cubic feet per second, at indicated time, 1957
Hour
*-- -
- Jan. 26
12 p.m___
Jan. 27
12 m ....6 p.m____12 p.m...
Jan. 28
4 a.m....8 ..____._12 m ....4 p.m....
Gage height
4.56
4.514.504.755.52
6.557.899.32
11.64
Dis charge
673
655651743
1,050
1,5202,2303,0604,510
Hour
Jan. 28-Con.
8 p.m.... 12 p.m...
Jan. 29
2_-____._Q
4. __ ....6. __ ....7. __ ....8 ____ ..9_. __ ...10 ____ ..11. ___ _.
Gage height
13.07 15.00
15.7016.5017.4018.2020.0021.2722.6624 1025.6527.50
Dis charge
5,510 6,910
7,4608,1008,8209,460
11,00012,20013,60015,30017,60021.000
Hour
Jan. 29-Cor
12 m .... 1 p.m.... 2. __ -.._3. _______5........6. --_--.-7. .......8 ________8:30 __ _.9. -_.__--10 __ ---.ll_--___.
Gage height
29.4 31.4 33.435.539.741.642.943.0943.143.0942.841.840.4
Dis charge
25,200 30,300 36,20043,70062,80073,30081,10082,20082,30082,20080,50074,50066,600

FLOODS OF JANUARY-FEBRUARY 1957 IN KENTUCKY A81
Gage tteigdt, in Jeet, and discharge, in cubic feet per second, at indicated time, 1957-Continued
Hour
Jan. 30
2 a.m.___ 4. ___ __6----.___8. ___ ..10. __ ..12 m ....
4.. ______6-_--___.8 __ . __10 _______12 p.m...
Jan. 31
8. __ ____12 m ____
Gage height
37.3 34.131.028.025.222.7 20.618.817.215.714.313.0
10.79.18.45 8.16
Dis charge
51,200 38,60029,20022,00016,90013,700 11,500
9,9408,6607,4606,4005,460
3,9002,9302,540 2,380
Hour
Jan. 31 Con.
8 p.m____
Feb. 1
4 a.m____8 __ ____12 m ____
8_ _______
Feb. 2
4 a.m____ 8 ________12 m ____4 p.m____ 8 .
Gage height
8.06 8.11
8.34 8.95
10.2512.4013.6014.54
15.90 16.5515.7513.88 11.95
Dis
charge
2,330 2,360
2,480 2,8403,6205,0405,8906,580
7,620 8,1407,5006,090 4,720
Hour
Feb. 2 -Con.
12 p.m...
Feb. 3
12 m ---.
12 p.m...
Feb. 4
6 a.m____ 12 m -_-. 6 p.m.... 12 p.m...
Feb. 5
12 m _.__ 12 p.m...
Gage height
10.52
9.138.17 7.527.00
6.59 6.18 5.86 5.57
5.5 6.5
Dis charge
3,780
2,9502,380 2,0301,760
1,540 1,340 1,200 1,070
1,040 1,500
42. MIDDLE FORK KENTUCKY RIVFR AT TALLEGA, KY.
Location. Lat 37°33'18", long 83°35'38", on downstream side of left pier of highwaybridge, 100 ft upstream from Lynam Creek, 0.5 mile southwest of Tallega, Lee County,and 7.9 miles upstream from confluence with North Fork.
Drainage area. 537 sq mi. Gage-height record. Water-stage recorder graph. Datum of gage is 642.13 ft above
mean sea level, datum of 1929, supplementary adjustment of 1936. Discharge record. Stage-discharge relation defined by current-meter measurements
below 15,000 cfs and by contracted-opening measurement at 52,700 cfs. Maxima. January -February 1957: Discharge, 52,700 cfs 11 a.m. Jan. 30 (gage height,
43.33 ft).1930-32, 1939 to December 1956: Discharge, 35,300 cfs Feb. 2, 1951 (gage height,
40.07 ft).Flood of February 1939 reached a stage of 40.5 from information by Corps of
Engineers.

A82 FLOODS OF 1957
Mean discharge, in cubic feet per second, 1957
Day
!__---2_.__-3 __ ._4--_._5 _____6_____7.___.8. ____9-._-_10 __ 11____
Monthly Runoff,
January
274 218 175 148 168 286 470 519
1,880 4,110 4,470
February
7,860 7,770 7,100 3,130 1,910 1,920 1,940 2,140 3,370 7,120 9,120
Day
12---. 13____ 14 __ _ 15 __ .16 ____ 17 __ _ 18____19 ____ 20 ____ 21 ____ 22 ____
January
2,760 1,550 1,030
744 596 474 339 278 230 274 682
mean discharge, in cubic feet per seco in inches
February
4,720 2,120 1,500 1,100
874 740 609 658
1,740 2,460 1,980
Day
23____ 24____ 25___. 26____ 27 __ _28 __ . 29.---30 ____31____
January
3,800 5,320 2,660 1,550 1,160 2,770 9,390
40,60018,700
3,472 7.45
February
1,680 1,450 1,220 1,060
946 825
2,824 5.48
Gage height, in feet, and discharge, in cubic feet per second, at indicated time, 1957
Hour
Jan. 26
12 p.m....
Jan. 27
12 m -----
12 p.m....
Jan. 28
4 __ ------6__. ______8 __ .. __ .10 _____ .
4. ___ ...6... __ ...10.. ___ .12 p.m....
Jan. 29
4 ____ ...
8 ____ ...10 _____ .12 m -----
8 __ __ ..10-----...12 p.m....
Jan. JO
Gage height
6.88
6.686.576.516.65
6.807.157.738.659.95
13.5514.9515.9517.5318.25
18.93 19.7521.00 22.6024.209^ 89
9 Q 9f\
30.3431.5433.26
34.50
Dis charge
1,260
1,1801,1301,1001,160
1,2301,3701,5701,8402,1903,1203,5803,9304,5204,820
5,160 5,580
7,1608,140
11,100 12,90014,20016,200
17,900
Hour
Jan. 30-Con.
2 a.m____ 3___ __ .-4. ___ ..6. _______7___ __ ..9________10_______11.. __ ..12 m ____
2-------- 3
5__ __ ___6_.______7________8________9.----..-10_______11_______
Jan. 31
4________8 ________10_______12 m _._.4 p.m____6 ____ ._10 __ .___12 p.m--_
Feb. 1
4 a.m____ 8 _____ _12 m _.-_
Gage height
36.00 37.6339.0041.3442.1443.0543.2543.3343.30A Q Oft
43.0542.8042.1041.7041.4041.0040.5040.1339.6639.24
38.3837.5035.8735.0634.1632.6031.6529.7528.66
26.45 24.3322.50
Dis charge
20,300 25,20030,50041,50045,80051,00052,20052,70052,500 51,90051,00049,50045,60043,40041,80039,80037,30035,60033,50021,600
28,00024,70020,00018,60017,40015,40014,30012,40011,400
9,720 8,2307,100
Hour
Feb.l-Con.
4 p.m____ 8 _____ .12 p.m__.
Feb. 2
4 a.m____12 m .---4 p.m.... 8_____-_.12 p.m...
4 a.m ...8. __ -.--12 m --_.8-p.m_-__12 p.m...
Feb. 4
4 a.m___. 8. __ ---.12 m ._._4 p.m....8. .._---_12 p.m...
Feb. 5
6 a.m--__12 m --..6 p.m.... 12 p.m...
Gage height
21.55 21.5521.80
22.3023.5524.27 24.9025.16
24.9024.0622.8319.6517.80
16.00 14.4313.0411.8410.82
9.99
9.068.518.60 8.79
Dis charge
6,530 6,5306,680
6,9807,7308,190 8,6308,810
8,6308,0407,3005,5204,630
3,950 3,4002,9702,6602,4002,200
1,9601,8001,830 1,890

FLOODS OF JANUARY-FEBRUARY 1957 IN KENTUCKY A83
43. RED BIRD RIVER NEAR BIG CREEK, KY.
[Miscellaneous site]
Location. Lat 37°09'10", long 83°35'10", 700 ft upstream from Elk Creek, 0.4 mile upstream from bridge on U.S. Highway 421, and 1.1 miles southwest of Big Creek, Clay County.
Drainage area. 117 sq mi.Discharge record. Peak discharge by slope-area measurement.Maximum. January-February 1957: Discharge, 48,500 cfs Jan. 29.
44. GOOSE CREEK AT MANCHESTER, KY.
[Miscellaneous site]
Location. Lat 37°09', long 83°45'40", 600 ft upstream from Louisville and Nashville Railroad station at Manchester, Clay County, and 1.1 miles upstream from Little Goose Creek.
Drainage area. 163 sq mi.Discharge record. Peak discharge by slope-area measurement.Maximum. January-February 1957; Discharge, 29,800 cfs Jan. 29.
45. SOUTH FORK KENTUCKY RIVER NEAR ONEIDA, KY.
[Miscellaneous site]
Location. Lat 37°20'45", long'83°41', 0.8 mile downstream from Road Run Branch, 1.0 mile upstream from Sexton Creek, and 5.5 miles northwest of Oneida, Clay County.
Drainage area. 549 sq mi.Discharge record. Peak discharge from slope-area measurement. Maximum. January-February 1957; Discharge, 58,200 cfs Jan. 29.
46. SOUTH FORK KENTUCKY RIVER AT BOONEVILLE, KY.
Location. Lat 37°28'45", long 83°40'38", on right bank 600 ft downstream from BuckCreek, 900 ft downstream from bridge on State Highway 30 at Booneville, OwsleyCounty, and 0.5 mile downstream from Meadow Creek.
Drainage area. 722 sq mi. Gage-height record. Water-stage recorder graph. Datum of gage 642.49 ft above mean
sea level, datum of 1929, supplementary adjustment of 1936. Discharge record. Stage-discharge relation defined by current-meter measurements
below 35,000 cfs and by slope-area measurement at 60,109 cfs. Rate of change instage is a factor Jan. 9-11,23-24, Jan. 28 to Feb. 3, Feb. 9-12.
Maxima. January-February 1957: Discharge, 66,100 cfs 4 a.m. Jan. 30 (gage height,42.50 ft); gage height, 43.40 ft 9 a.m. Jan. 30.
1925-31, 1939 to December 1956: Discharge, 50,700 cfs June 29, 1947 (gage height,41.70 ft).

A84 FLOODS OF 1957
Mean discharge, in cubic /'eet per second, 1957
Day
1. ....2----.3-___.4.....5 .....6 .....7 __ _.8 .....9_..._10 .... 11---.
January
360 295 239 213 255 545 709 673
3,620 10,200 6,820
Monthly mean dis Runoff, in inches
February
8,800 11,300 6,150 2,890 1,930 2,200 2,540 3,150 6,990
13,800 9,870
Day
12 __ .13 .... 14.... 15 __ . 16....17. ... 18 ____ 19 .... 20.... 21. ... 22____
January
2,820 1,690 1,210
876 706 525 402 348 335 345
1,020
charge, in cubic feet per secc
February
3,880 2,070 1,480 1,100
876 722 585 730
2,570 2,710 2,240
Day
23__._ 24 __ . 25...- 26-.-- 27 __ . 28 __ - 29 __ .30 __ .31 ....
January
12,500 8,870 2,880 1,750 1,410 6,630
27,90051,30016,900
5,301 8.47
February
1,880 1,580 1,390 1,230 1,080
909
3,452 4.98
Gage height, in feet, and discharge, in cubic feet per second, at indicated time, 1957
Hour
Jan. 26
12 p.m...
Jan. 27
12 m .__.
12 p.m...
Jan. 28
8 __ .....12 m ....
8 __ .....12 p.m...
Jan. 29
4 a.m.... 8 ___ ...12 m . ... 4 p.m____8 ___ ...12 p.m...
Jan. JO
1 a.m.... 2 __ .._.-
Gage height
6.34
6.196.156.236.75
7.9510.3913.6416.6018.8220.62
22.60 26.0029.35 31.67 34.6939.00
40.10 41.10
Dis charge
1,430
1,3801,3601,3901,640
2,3703,9706,5608,990
10,90012,400
14,600 19,20025,400 31,000 42,10058,300
62,200 65,600
Hour
Jan. 30-Con.
3 a.m____ 4___.__._56__ _._...7... __ ..9 _____ .10.. __ ..11. ......12 m __ . 1 p.m.... 3... __ ..5___ __ _.7__ ..___.8 .__.____9_. ......11 _.___._12 p.m...
Jan. 31
4 a.m.... 8 ........12 m .... 4 p.m.... 8. ___ ..12 p.m...
Feb. 1
6 a.m.... 12 m ....
Gage height
41.94 42.5043.0043.2343.3343.4043.3643.2743.08 42.82 42.1641.3640.4639.9739.4838.4637.94
35.67 32.9229.57 25.81 22.5719.98
16.85 15.28
Dis charge
66,000 66,10065,60062,90061,40060,10058,40056,20053,400 50,800 46,20042,30038,40036,70035,20032,40031,000
25,500 20,00013,700 11,200 10,400
9,540
8,160 7,410
Hour
Feb. 1-Con.
6 p.m.--- 12 p.m...
Feb. 2
6 a.m___-12 m ....
12 p.m...
Feb. 3
12 m -.--6 p.m_--_12 p.m...
Feb. 4
6 a.m___- 12 m --_. 6 p.m.---12 p.m...
Feb. 5
6 a.m..-- 12 m --.- 6 p.m___- 12 p.m__-
Gage height
17.22 19.31
20.9321.5620.6618.51
15.7213.2811.5410.26
9.34 8.63 8.097.61
7.27 7.06 7.25 7.34
Dis
charge
9,310 11,100
12,20012,00010,800
9,140
7,4305,8804,7803,880
3,270 2,810 2,4602,150
1,930 1,810 1,920 1,970

FLOODS OF JANUARY-FEBRUARY 1957 IN KENTUCKY A85
47. KENTUCKY RIVER AT LOCK 14, AT HEIDELBERG, KY.
Location. Lat 37°33'19", long 83°46'06", on right bank 1,000 ft upstream from lock 14at Heidelberg, Lee County, 0.5 mile upstream from Sturgeon Creek, and at mile 249.2.
Drainage area. 2,657 sq mi. Gage-height record. Water-stage recorder graph. Datum of gage 626.66 ft above mean
sea level, Ohio River datum (Corps of Engineers benchmark).Discharge record. Stage-discharge relation defined by current-meter measurements. Maxima. January-February 1957: Discharge, 116,000 cfs 10 p.m. Jan. 30 (gage height,
35.00 ft).1925-31, 1936-37, 1938 to December 1956: Discharge, 120,000 cfs Feb. 4, 1939 (gage
height, 35.6 ft, from floodmarks).
Mean discharge, in cubic \eet per second, 1957
Day
1. ....2 _._..3 .....4 .....5_..._6 .....7 .....8__...9 __ ..10 .... ll..._
January
1,530 1,280 1,040
920 989
1,390 2,030 2,260 8,350
24,000 24,600
Monthly mean dis Runoff, in inches
February
52,900 36,200 31,800 18,000
9,670 9,560
10,200 11,500 17,600 32,800 39,800
Day
12 ....13 __ . 14 .... 15 .... 16 .... 17 .... 18 .... 19 .... 20 .... 21 .... 22 ....
January
15,200 8,200 5,540 4,000 3,080 2,380 1,680 1,330 1,380 1,460 2,910
charge, in cubic feet per seco
February
26,700 12,100
7,630 5,620 4,420 3,610 3,060 2,860 5,730 9,750 8,560
Day
23 ._.. 24 __25_ ... 26.... 27 __ . 28- ... 29 .... 30 ....31. ...
January
20,300 26,400 13,800
7,810 5,640
12,400 39,400 94,300
100,000
14,050 6.10
February
7,510 6,780 6,040 5,300 4,640 4,090
14,090 5.52
Gage height, in feet, and discharge, in cubic feet per second, at indicated time, 1957
Hour
Jan. 26
12 p.m_.._
Jan. 27
12 m ..._.
Jan. 28
12 m .....
12 p.m____
Jan. 29
12 m __ ...
Gage height
12.03
11.8711.7311.6611.64
12.0113.4515.5616.69
17.8619.7121.31
Dis charge
6,350
5,9005,5105,3205,270
6,29010,70018,30023,300
29,40039,90047,800
Hour
Jan. 29-Con.
12 p.m...
]an. 30
4 ..__.._.6 _._._.._8 __ ._.-_10 _._.._.2 p.m..-. 6 _._.___.8 _.___...10___ ____
Jan. 31
2 a.m.... 6 ........8 .___....12 m ....
Gage height
23.46
24.2825.3726.8728.5730.4733.19 34.5434.8935.0034.96
34.77 34.0333.5332.21
Dis charge
57,800
61,60066,90074,40083,10092,800
108,000 114,000116,000116,000116,000
115,000 111,000109,000102,000
Hour
Jan. 31 -Con.
4 p.m___. 8 ____ -_12 p.m___
Feb. 1
12 m _..-
12 p.m___
Feb. 2
6 a.m....12 m _ _. 6 p.m_.__ 12 p.m...
Feb. 3
6 a.m....
Gage height
30.69 29.0927.11
24.3521.9420.1519.26
18.9819.01 19.09 19.05
18.82
Dis charge
94,000 85,80075,700
62,00050,70042,20037,400
35,80036,000 36,400 36,200
34,900

A86 FLOODS OF 1957
Gage height, in /eet, and discharge, in cubic /eet per second, at indicated tiii.e, 1957-Continued
Hour
Feb. 3-Con.
12 m __ . 6 p.m____ 12 p.m__.
Feb. 4
6 a.m____
Gage height
18.38 17.83 17.14
16.36
Dis charge
32,300 29,200 25,500
21,800
Hour
Feb. 4-Con.
12 m ._._ 6 p.m____ 12 p.m.__
Feb. 5
6 a.m____
Gage height
15.35 14.49 13.81
13.30
Dis charge
17,400 14,200 11,900
10,200
Hour
Feb. 5-Con.
12 m .... 6 p.m____ 12 p.m___
Gage height
12.93 12.92 12.97
Dis charge
9,000 8,980 9,100
48. RED RIVER NEAR HAZFL GREEN, KY.
Location. Lat 37°48'44", long 83°27'50",on right bank 600 ft upstream from Buck Creek,0.3 mile downstream from Chapel Branch, and 2.7 miles northwest of Hazel Green,Wolfe County.
Drainage area. 65.8 sq mi. Gage-height record. Water-stage recorder graph. Altitude of gage is 880 ft (from
topographic map).Discharge record. Stage-discharge relation defined by current-meter measurements. Maxima. January -February 1957: Discharge, 2,110 cfs 8:15 p.m. Jan. 29 (gage height,
7.43 ft).1954 to December 1956: Discharge, 3,020 cfs Feb. 28, 1955 (gage height, 10.64 ft).
Mean discharge, in cubic /eet per second, 1957
Day
1 __ ..2 __ ..3 __ __4_____5 _____6_.___7_.___8 _____910__._ 11_.._
January
48 35 30 33 46 43 43 50
647 1,020 340
Monthly mean dis Runoff, in inches
February
562 762
346 217 196 331 268 370 671 954 436
Day
12.... 13____14 _.__ 15 __ . 16 ____ 17___. 18 ____ 19-.__ 20____ 21____ 22....
January
220 152 114 85 64 52 50 42 39 49
221
February
244 175 130 104 89 72 64 70 70 65 80
Day
23 __ . 24 __ . 25 __ .26 __ . 27 __ .28 ____ 29 ___30 ____31____
charge, in cubic feet per second______________
January
986 373 220 150 124 506
1,8201,240385
298 5.22
February
91 93 91 91 82 78
243 3.84

FLOODS OF JANUARY-FEBRUARY 1957 IN KENTUCKY
49. STILLWATER CREEK AT STILLWATER, KY.
A87
Location. Lat 37°45'24", long 83°29'12", on right bank 15 ft downstream from bridge onHighway 15 at Stillwater, Wolfe County, 90 ft downstream from Trace Fork, and 2.1upstream from Laurel Fork.
Drainage area. 24.0 sq mi. Gage-height record. Water-stage recorder graph. Datum of gage is 883.83 ft above
mean sea level, datum of 1929. Discharge record. Stage-discharge relation defined by current-meter measurements
below 1,500 cfs and by slope-area measurement at 2,960 cfs. Maxima. January-February 1957: Discharge, 1,510 cfs 10:30 a.m. Jan. 29(gage height,
8.36 ft).1954 to December 1956: Discharge, 3,890 cfs Dec. 14, 1956 (gage height, 12.91 ft).
Mean discharge, in cubic Jeet per second, 1057
Day
l-__._2-_-._3_____4_____5_____6.....7_._._8 _____9 _____10____ !!____
Monthly Runoff,
January
15 17 17 16 20 18 20 21
460 317 156
February
366 236 128 76 98
136 108 170 308 407 170
Day
12---. 13.. __14 ____15 ____ 16. ___17 ____18.._. 19____ 20---. 21. __ 22___.
January
104 69 44 34 25 20 22 18 17 20
171
r mean discharge, in cubic feet per seco in inches
February
108 71 50 36 30 24 21 30 22 23 30
Day
23. ___ 24..-. 25____ 26 ____ 27 ___ 28 __ . 29 ____ 30____31 __
nd __ __ _______
January
410 150 96 48 45 374 813 202 130
125 6.03
February
32 33 33 33 29 32
101 4.40
50. RED RIVER AT CLAY CITY, KY.
Location. Lat 37°51'52", long 83°55'59", on downstream side of pier on left bank at bridge on State Highway 15 at Waltersville, 500 ft upstream from Brush Creek, half a mile west of Clay City, Powell County, and 4.8 miles upstream from Hardwick Creek.
Drainage area. 362 sq mi.Gage-height record. Water-stage recorder graph. Datum of gage is 600.47 ft above
mean sea level, datum of 1929 (levels by Corps of Engineers).Discharge record. Stage-discharge relation defined by current-meter measurements.
Rate of change in stage used as a factor, Jan. 9-12, 22-25, Jan. 28 to Feb. 4, Feb. 8-12.Maxima. January-February 1957: Discharge, 9,110 cfs 11 a.m. Jan. 30 (gage height,
17.38 ft); gage height, 17.49 ft 2 p.m. Jan. 30.1930-32, 1938 to December 1956: Discharge, 21,100 cfs July 15, 1938 (gage height,
22.8 ft).

A88 FLOODS OF 1957
Mean discharge, in cubic feet per second, 1957
Day
!-__--2__.__3 _..__4.....5.....6. ....7___._8 ___9 __ _.10____ 11.--.
Monthb Runoff,
January
282 232 192 186 226 248 230 232
1,950 3,860 4,520
February
2,730 3,510 3,210 1,480 1,040 1,330 1,300 1,380 3,170 4,760 4,590
Day
12 ___ 13-.-. 14.___ 15. __16 .... 17 .... 18 .... 19 __ _ 20.-.. 21 __ 22....
January
1,710 958 672 500 410 285 240 220 219 228 842
f mean discharge, in cubic feet per seco in inches
February
2,000 1,130
822 630 548 440 389 392 434 365 323
Day
23..-. 24. __25 .... 26 .... 27 .... 28 __ . 29..-- 30 ....31 ....
nd __ ....- __ -_.
January
3,230 4,140 1,600
930 668
1,470 3,950 8,3205,020
1,541 4.91
February
353 359 359 383 331 383
1,362 3.92
51. KENTUCKY RIVER AT LOCK 10, NEAR WINCHESTER, KY.
Location. Lat 37°53'41", long 84°15'44", on left bank at lock 10, 0.9 mile downstream from Otter Creek, 8 miles southwest of Winchester, Clark County, and at mile 176.4.
Drainage area. 3,955 sq mi.Gage-height record. Graph drawn from twice-daily upper staff gage readings and flood-
marks at lock 10, except Feb. 2 5 when estimates of gage height by observer were used. Graph drawn for auxiliary gage, 18.9 miles downstream, from twice-daily readings. Datum of gage is 557.37 ft above mean sea level, Ohio River datum.
Discharge record. Stage-fall-discharge relation or stage-discharge relation defined by current-meter measurements. Fall used as a factor 12 m. Jan. 31 to 6 p.m. Feb. 4.
Maxima. January-February 1957: Discharge, 85,400 cfs 9 p.m. Feb. 1 (gage height, 33.60 ft); gage height, 33.65 ft 12 p.m. Feb. 1 (from floodmarks).
1907 to December 1956: Discharge, 92,400 cfs Feb. 5, 1939; gage height, 35.1 ft Mar. 29, 1913.
Remarks. Gage-height readings furnished by Corps of Engineers.
Mean discharge, in cubic jeet per second, 1957
Day
!-_--_2 ___3 __ -,4 __ ._5 _____6_.-._7 __ _.8 __ __9 __ ..10 __ _11. ...
January
2,740 2,330 1,980 1,770 1,900 2,150 2,510 3,060
12,900 29,200 32,800
Monthly mean dis Runoff, in inches
February
80,600 77,800 65,900 53,400 26,600 14,700 14,000 15,600 25,600 36,800 43,900
Day
12.---13 ____ 14____ 15 .... 16____ 17 .... 18 __ 19 .... 20---. 21 __ . 22 __ .
January
29,200 15,800 9,050 6,750 5,080 3,870 3,140 2,960 2,420 2,330 4,230
charge, in cubic feet per seco
February
45,100 30,400 12,900
8,550 6,750 5,500 4,750 4,260 4,500 7,800
10,400
Day
23 __ 24_.__25 .... 26 __.. 27 ___ 28___.29. ...30 ....31 ....
January
24,400 33,100 30,100 14,800 8,550
14,200 36,500 51,40064,800
14,710 4.29
February
9,330 8,340 7,500 7,120 6,800 6,300
___________
22,900 6.03

FLOODS OF JANUARY-FEBRUARY 1957 IN KENTUCKY
Gage heiflttt, in feet, and discharge, in cubic feet per second, at indicated time, 1957
A89
Hour
Jan. 27
12 p.m___
Jan. 28
6 a.m____12 m ._..6 p.m__--12 p.m___
Jan. 2y
6 a.m____12 m ....6 p.m____12 p.m__.
Jan. JO
6 a.m_-_.12 m ....6 p.m.__-12 p.m__-
Jan. 31
6 a.m____6 p.m....12 p.m__.
Gage height
13.40
13.4014.4016.5517.20
17.7019.2020.3020.70
21.0021.5022.1522.90
24.0027.4028.85
Dis charge
7,800
7,80011,30021,20025,000
28,00037,50044,50046,900
48,70051,20054,10056,400
59,70069,80073,400
Hour
Feb. 1
2 a.m....6 ........10 ___ _-12 m __ _4 p.m___-6.... __ _8. ____ .9 ____....10 ____ .12 p.m___
Feb. 2
4 a.m..__6.... __ _10. ......12 m . ...4 p.m..__8 ........12 p.m__.
Feb. 3
8 a.m____4 p.m....12 p.m...
Gage height
29.3530.2531.2531.7532.9533.3533.5533.6033.6233.65
33.4533.2032.7032.4531.9531.4530.85
29.6028.2026.45
Dis charge
74,90077,00079,80081,00084,10084,70085,20085,40084,90084,200
82,20080,70078,90077,40075,70073,90072,000
68,00063,90059,700
Hour
Feb. 4
6 a.m....12 m __ _6 p.m___-12 p.m...
Feb. 5
6 a.m.__-12 m __ _6 p.m....12 p.m...
Feb. 6
6 a.m....12 m ._._12 p.m__.
Feb. 7
12 m __ _12 p.m.__
Gage height
25.2023.6022.0020.40
18.7017.0015.9015.50
15.3015.2015.10
15.1015.00
Dis charge
57,00053,50050,80045,100
34,00023,80017,90015,900
14,90014,50014,100
14,10013,700
52 KENTUCKY RIVER AT LOCK 8, NEAR CAMP NELSON, KY.
Location. Lat 37 t>44'43", long 84°35'12", on wall of lock 8 near right bank, 2.4 milessoutheast of Camp Nelson, Jessamine County, 2.7 miles downstream from Sugar Creek,4.5 miles upstream from Hickman Creek, and at mile 139.9.
Drainage area. 4,414 sq mi. Gage-height record. Graph drawn from twice-daily upper staff gage readings, except
Feb. 2 when numerous readings were made near crest. Water-stage recorder graphfor auxiliary gage 4.8 miles downstream. Datum of gage is 520.50 ft above mean sealevel, datum of 1929 (levels by Corps of Engineers).
Discharge record. Stage-discharge relation defined by current-meter measurements.Fall used as factor 12 p.m. Jan. 29 to 12 m. Feb. 5, Feb. 10.
Maxima. January-February 1957: Discharge, 89,700 cfs 2 p.m. Feb. 2 (gage height,38.52 ft.
1939 to December 1956: Discharge, 85,400 cfs Feb. 17, 1948 (gage height, 37.6 ft). Flood of Mar. 28, 1913, reached a stage of 40.0 ft (discharge 103,000 cfs). Flood of
Jan. 23, 1937, reached a stage of 41.2 ft (discharge, 91,500 cfs). Flood of Feb. 6, 1939,reached a stage of 38.6 ft (discharge, 94,800 cfs).
Remarks. Gage-height record furnished by Corps of Engineers.

A90 FLOODS OF 1957
Mean discharge, in cubic feet per second, 1957
Day
1. ....2. ___ .3 _....4 __ __5 __ ._6 .....7____.8. ....9---_.10 .... 11....
January
3,120 2,560 2,160 1,890 1,890 2,160 2,320 2,980
15,200 29,000 33,000
Monthly mean dis Runoff, in inches
February
79,800 88,800 82,600 68,700 39,000 17,500 15,000 18,100 31,700 45,200 44,700
Day
12 ....13 .... 14 .... 15 .... 16____ 17 ..__ 18____ 19 .... 20 .... 21 .... 22___.
January
31,700 19,400 10,700
7,240 5,540 4,350 3,500 2,840 2,420 2,460 7,030
charge, in cubic feet per seco
February
48,300 39,800 16,600
9,260 7,300 5,980 5,010 4,420 4,480 7,010
10,500
Day
23 .... 24 .... 25 .... 26 ....27 __ .28 .... 29 .... 30 ....31 __ _
nd__. ____ _. ...
January
28,800 32,200 32,600 18,900 10,100 15,100 41,100 52,40061,400
15,680 4.10
February
9,890 8,920 8,090 7,550 7,770 6,880
26,390 6.23
Gage height, in feet, and discharge, in cubic feet per second, at indicated time, 1957
Hour
Jan. 21
12 p.m___
Jan. 28
4 a.m____8 __ __ _.12 m __ _ 4 p.m.___ 8 __ .. ...12 p.m...
Jan. 29
4 s. m12 m ____
8 ..._..__12 p.m...
Jan. 30
6 a.m.... 12 m __ .6 p.m....12 p.m...
Jan. 31
12 m ____ 12 p.m_._
Gage height
14.40
14.3514.4015.10 17.40 18.7519.30
19.9022.7024.1024.6524.90
25.05 25.4526.0026.70
28.70 31.00
Dis charge
8,580
8,4208,580
11,000 19,600 25,00027,300
29,90042,60048,30050,50051,000
51,100 51,90053,40055,500
61,000 68,300
Hour
Feb. 1
4 a.m..... 8... __ ...12 m __ .. 4 p.m__._- 8 __ . __ .
Feb. 2
2 a.m____.4 ______ .8 __ __ __|12 m _____
4 ______ .8. _____ .10 ____ _.12 p.m....
Feb. 3
4 a.m..... 8 _____ _.12 m _____
8. __ ....12 p.m ____
Gage height
32.00^ 9fl
34.55 36.00 37.0037.66
37.8738.0638.3538.50 38.5238.4938.3538.2238.06
37.70 37 97
36.7636.2035.5634.88
Dis charge
71,200 76,30081,000 85,200 87,10087,600
87,90088,30089,10089,600 89,70089,50088,80088,20087,400
85,900 84,50082,80081,00079,00076,900
Hour
Feb. 4
4 a.m....8 __ ....12 m .... 4 p.m____ 8 ____ ..12 p.m...
Feb. 5
4 a.m....8. ___ ..12 m ___.4 p.m___. 8_. ______12 p.m...
Feb. 6
6 a.m___. 12 m .... 6 p.m.... 12 p.m...
Feb. 7
12 m __ _12 p.m...
Gage height
34.10 33.3032.40 31.40 30.2028.70
27.0025.0022.4020.40 18.7517.80
17.10 16.75 16.45 16.30
16.2016.10
Dis
charge
74,800 72,20069,400 66,500 62,30056,700
51,60047,10039,30032,200 25,00021,200
18,500 17,100 16,000 15,400
15,00014,700

FLOODS OF JANUARY-FEBRUARY 1957 IN KENTUCKY
53.DIX RIVER NEAR DANVILLE, KY.
A91
Location. Lat 37°38'31", long 84°39'39",on right bank 50 ft downstream from bridge on State Highway 52, 1.4 miles downstream from Hanging Fork, and 6 miles east of Dan ville, Boyle County.
Drainage area. 318 sq mi.Gage-height record. Water-stage recorder graph. Graph drawn for auxiliary staff gage
2 miles downstream, from twice-daily readings. Altitude of gage is 750 ft (from top ographic map).
Discharge record. Stage-fall-discharge relation or stage-discharge relation defined by current-meter measurements. Fall used as a factor Feb. 11 to 14.
Maxima. January-February 1957: Discharge, 10,300 cfs 3:30 p.m. Jan. 29 (gage height, 9.97ft).
1942 to December 1956: Discharge, 20,900 cfs Mar. 5, 1945 (gage height, 16.28 ft).
Mean discharge, JH cubic Jeet per sec^ttd, 1957
Day
1 __ __2 _____3 _____4 _____5 __ __6 _____7__ ___8 _____
10 _.__ 11 ____
January
134 112
89 91
120 184 160 149
2,780 3,980 1,410
Monthly mean dis Runoff, in inches
February
3,700 3,730 1,410
890 1,190 2,110 1.140 1,510 2,860 5,500 2,680
Day
12 __13 ____ 14 ____ 15 _.__16 ___17 ____ 18 __19 ____ 20 ____ 21 ____ 22 ____
January
794 560 415 300 227 160 120 115 118 127
1,130
charge, in cubic feet per seco
February
1,040 754 591 440 345 276 227 231 465 405 536
Day
23 ____ 24 ____ 25 ____ 26 ___ 27 ____ 28 __ 29 ____30 __ _31 __
January
6,430 1,930
854 608 490
3,150 7,9105,2101,680
1,340 4.86
February
560 465 395 400 788 680
1,261 4.13
54. HERRINGTON LAKE NEAR BURGIN, KY.
Location. Lat 37°47'08", long 84°42'14", at Dix Dam on Dix River, 2.9 miles upstream from mouth and 8 miles east of Burgin, Mercer County.
Drainage area. 439 sq mi.Gage-height record. Indicator gage read hourly. Datum of gage is at mean sea level
(levels by Kentucky Utilities Co.).Maxima. January-February 1957: Contents, 106,300 acre-feet 12 p.m. Feb. 11 (eleva
tion, 754.7ft).1925 to December 1956: Contents, 123,200 acre-feet, many times (elevation, 760.0ft).
Remarks. Reservoir is formed by earth and rock-fill dam with side channel spillway controlled by 10 vertical lift gates 35 ft long and 10 to 12 ft high. Storage began Nov. 4, 1925; water in reservoir first reached minimum pool elevation Nov. 26,1925. Total usable capacity between elevations 760 ft (top of spillway gates) and 680 ft (minimum pool, dead storage unknown) is 123,200 acre-feet. Reservoir is used for power. Gage- height record furnished by Kentucky Utilities Co.

A92 FLOODS OF 1957
Elevation, in feet, and contents, in acre-feet at 12 p.m. of indicated day, 1957
Day
1 ___2 __ _3____4. __5 ___6 ___7 __ .8 ....9. ...10 ...11 ...12 ...1 q
14...15 ...16 ...
January
Elevation
723.5722.8722.5722.5722.3722.3722.3722.4725.5728.4729.1729.5729 679 Q ^
728.9728.0
Contents
51,10050,10049,70049,70049,40049,40049,40049,60053,90058,20059,20059,80060,00059,800
57,600
February
Elevation
746.9748.9749.0748.5748.2748.6748.2748.4750.2753.9754.7754.4753.8T^^ n752 1751.1
Contents
88,80092,80093,00092,00091,40092,20091,40091,80095,400
103,900106,300105,400103,700101,600
99 40097,200
Day
17 ...18 ...19 ...20 ...21 ...22 ...23...24 ...25 ...26 ...27 ...28 ...OQ
30^1
January
Elevation
727.1726.5726.3726.2725.7726.7732.2733.1732.8732.1731.4733.9740.9744.4744.7
Contents
56,20055,40055,00054,90054,20055,60063,90065,20064,80063,80062,70066,40077,80084,10084,700
February
Elevation
750.0748.9747.6746.8746.4746.0745.9746.0745.8745.6745.6745.7
Contents
95,00092,80090,20088,60087,80087,00086,80087,00086,60086,30086,30086,500
Supplemental record. Dec. 31, 1956, 12 p.m., 723.8 ft, 51,500 acre-feet.
55. KENTUCKY RIVER AT LOCK 6, NEAR SALVISA, KY.
Location. Lat 37°55'32", long 84°49'i7", on right bank at lock 6, Woodford County, 1.6 miles upstream from Clear Creek, 2.1 miles east of Salvisa, and at mile 96.2.
Drainage area. 5,102 sq mi.Gage-height record. Water-stage recorder graph. Graph drawn for auxiliary staff
gage, 14 miles downstream, from twice daily readings. Datum of gage is 487.89 ft above mean sea level, unadjusted (Corps of Engineers' benchmark).
Discharge record. Stage-fall-discharge relation or stage-discharge relation defined by current-meter measurements. Fall used as a factor Jan. 30 to Feb. 5, Feb. 10 13.
Maxima, January-February 1957: Discharge, 88,700 cfs 5 a.m. Feb. 3 (gage height, 33.91 ft).
1925 to December 1956: Discharge, 112,000 cfs Jan. 23, 1937; gage height, 43.35 ft Jan. 25, 1937 (from floodmarks).
Remarks. Auxiliary gage-height readings furnished by Corps of Engineers. Flow reg ulated by Herrington Lake (see station 54) and by hydroelectric plant at lock 7.
Mean discharge, in cubic feet per second, 1957
Day
!-____2__._.3_..._45 .....6__ ...7 __ _.8_..__9 .....10 ....11 ....
Monthly Runoff,
January
3,530 3,380 2,990 2,350 2,130 2,150 2,280 2,770
10,900 31,700 35,600
February
70,200 85,900 87,000 77,400 58,300 25,400 17,800 18,300 29,800 47,900 47,200
Day
12 ....13 .... 14 .... 15 .... 16 .... 17.... 18 .... 19 .... 20 .... 21 .... 22 ....
January
35,300 25,700 14,300
9,860 7,420 5,820 4,530 3,500 2,850 2,930 5,100
February
48,900 46,000 26,000 13,700 10,200 8,450 7,160 6,130 5,820 6,680
11,500
Day
23 ....24 __ . 25 .... 26 .... 27.... 28 __ . 29.--. 30 .... 31_...
mean discharge, in cubic feet per second (unadjusted)- --
January
29,100 34,500 36,600 28,000 14,800 12,900 35,500 52,100 58,500
16,740 3.91
February
11,200 9,630 9,400 8,670 8,710 8,320
28,990 5.92

FLOODS OF JANUARY-FEBRUARY 1957 IN KENTUCKY
Gage heignt, in feet, and discharge, in cubic feet per second, at indicated time, 1957
A93
Hour
Jan. 27
12 p.m...
Jan. 28
4 a.m____8 ....__..12 m ....
8 ______12 p.m___
Jan. 29
4 a.m.___8 ______
8 __ __ ._12 p.m___
Jan. 30
8 ______12 m _.._
12 p.m___
Gage height
12.78
12.6212.3812.4512.8313.6514.64
15.45.15.9416.7517 9018.6719.18
19.5219.7620.0420.4421.07
Dis charge
12,000
11,30010,10C10,4001 9 ^nn16,50022,000
26,60029,500QA inn
41,30045,90049,000
50,70050,80051,80053,40054,800
Hour
Jan. 31
3 a.m....12 m __ _6 p.m____12 p.m__-
Feb. 1
12 m . __3 p.m____
Feb. 2
8 _____ .
12 p.m___
Feb. 3
4 a.m____5 _____ _8__. ___ _4 p.m____8. ___ __12 p.m_._
Gage height
21.6422.3123.1224.03
25.1526.6028.4030.32
31.3232.1233.2233.78
33.9033.9133.89
33.4933.1732.83
Dis charge
56,30058,20060,50063,100
65,40069,10074,50080,200
83,50085,30087,70088,500
88,60088,70088,40086,40085,10083,500
Hour
Feb. 4
6 a.m____5 p.m..__12 p.m_._
Feb. 5
4 a.m____8 ______12 m ___.4 p.m____3 __ ....12 p.m...
FeD. 6
8. __ ..__12 m ....1 p.m....3. ..._._.L2 p.m___
Feb. 7
12 m .___L2 p.m___
Gage height
32.1330.2228.92
27.9126.6825.2623.4021.1018.42
16.4015.4614.8714.5014.2314.08
13.8613.79
Dis charge
80,90074,20070,200
67,00063,50059,80055,40048,90039,900
32,30026,70023,20021,20019,70018,800
17,60017,300
56. KENTUCKY RIVER AT LOCK 4, AT FRANKFORT, KY.
Location. Lat 38°12'06", long 84°52'54", on left bank at downstream side of Broadway Street Bridge at Frankfort, Franklin County, 300 ft upstream from Benson Creek, 0.9 mile upstream from lock 4, and at mile 65.9. Records include flow of Benson Creek.
Drainage area. 5,412 sq mi, includes that of Benson Creek.Gage-height record. Water-stage recorder graph. Graph drawn for auxiliary staff
gage, 16.3 miles upstream, from twice-daily readings. Datum of gage is 462.10 ft above mean sea level, datum of 1929.
Discharge record. Stage-fall-discharge relation or stage-discharge relation defined by current-meter measurements. Fall used as a factor Jan. 12, 13,24 26, Feb. 1 6, 10 14.
Maxima. January-February 1957: Discharge, 84,200 cfs 2 p.m. Feb. 3 (gage height, 35.35 ft); gage height, 35.46 ft 7:30 p.m. Feb. 3.
1925 to December 1956: Discharge, 115,000 cfs Jan. 25, 1937; gage height, 47.46 ft Jan. 25, 1937, from floodniarks, at site 0.9 mile downstream.
Remarks. Auxiliary gage-height readings furnished by Corps of Engineers. Flow regu lated by Herrington Lake (see station 53) and by hydroelectric plant at lock 7.
690-137 O - 64 - 7

A94 FLOODS OF 1957
Mean discharge, in cubic feet per second, 1957
Day
!_-__-2._--_3 _____4_____5__.__6 _____7_____8 __ __910 ____ 11____
Monthly Runoff,
January
4,020 3,430 3,240 2,440 2,170 2,170 2,300 2,650 9,510
29,700 34,600
February
66,000 79,100 83,600 78,800 65,600 36,000 19,200 18,600 30,700 46,900 50,300
Day
12 ____ 13 ____ 14 __ 15 __ _ 16. __ 17____ 18____ 19 _.__ 20 __ 21_.__ 22_.__
January
34,900 27,500 15,500 10,500
7,940 6,420 5,300 4,060 3,050 2,830 6,780
mean discharge, in cubic feet per seco in inches
February
50,200 48,700 31,000 14,900 11,000 9,120 7,890 6,860 6,560 6,780
10,300
Day
23 __ _ 24 __ _25 ____ 26_._- 27 ____ 28 ____ 29 30 __ _31 __ _
nd__-__-__.___-_
January
26,800 33,200 35,800 29,400 15,700 13,000 30,600 49,00056,600
16,490 3.63
February
11,200 9,560 9,070 8,780 8,540 8,450
29,780 5.74
Gage height, in /eel, and discharge, in cubic Jeet per second, at indicated time, 1957
Hour
Jan. 27
Jan. 28
4 a.m____ 8 __ _. __12 m . __
8 _.._.__.12 p.m___
Jan. 29
8 ._...__.12 m __._
8 ______12 p.m___
Jan. JO
12 m __ _12 p.m_._
Jan. 31
6 a.m____ 12 m __ .
Gage height
9.65
9.54 9.389.309.52
10.0610.82
11.5712.1612.88 14.3016.0417.54
19.1220.0721.44
22.10 22.83
Dis charge
12,800
12,200 11,30010,90012,10015,10019,600
23,80026,70029,400 33,80038,90043,000
47,10049,60053,000
54,700 56,500
Hour
Jan. Jl-Con.
12 p.m....
Feb. I
6 a.m_____12 m _____
12 p.m____
Feb. 2
12 m __ __6 p.m_____12 p.m____
Feb. j
8 ______
4 __ _____7:30 ______8_ __ _____12 p.m____
Feb. 4
Gage height
23.6124.56
25.6226.7128.3029.78
31.1632.4233.5234.32
34.7335.0735.3535.4035.4635.4535.40
35.27
Dis charge
58,50060,700
62,80065,10069,10073,200
76,90079,30082,10083,300
83,50083,80084,20083,80083,50083,40082,600
81,400
Hour
Feb. 4-Con.
8 a.m____12 m ____4 p.m____ 8. __ ._--12 p.m.__
Feb. 5
6 a.m____12 m -_-_ 6 p.m____ 12 p.m___
Feb. 6
4 a.m____ 8 ________12 m -._-4 p.m____ 8--_-.__-12 p.m__.
Feb. 7
6 a.m____12 m ____ 6 p.m____ 12 p.m___
Gage height
35.1034.83 34.52 34.1133.61
32.6831.44 29.82 27.41
25.17 22.3819.4816.59 13.9211.88
10.8510.69 10.63 10.57
Dis charge
80,10078,700 77,800 76,00074,500
71,20066,700 61,000 52,700
47,200 41,10035,60030,000 24,80021,300
19,80018,900 18,500 18,200

FLOODS OF JANUARY-FEBRUARY 1957 IN KENTUCKY A95
57. KENTUCKY RIVER AT LOCK 2, AT LOCKPORT, KY.
Location. Lat 38°26'20", long.84°57'48", on left bank at lock 2 at Lockport, HenryCounty, 0.1 mile downstream from Sixmile Creek, and at mile 31.0.
Drainage area. 6,180 sq mi. Gage-height record. Graph drawn from twice-daily upper staff gage readings, except
Feb. 4 when several readings were made. Graph drawn for auxiliary staff gage, 11.0miles upstream, from twice-daily readings. Datum of gage 433.36 ft above mean sealevel, datum of 1929.
Discharge record. Stage-fall-discharge relation or stage-discharge relation defined bycurrent-meter measurements below 100,000 cfs. Fall used as a factor Jan. 10 14,24-27, Jan. 30 to Feb. 17.
Maxima. January-February 1957: Discharge, 86,300 cfs 11 a.m. Feb. 4 (gage height,40.18 ft); gage height, 40.20 ft 11:30 a.m. to 5 p.m. Feb. 4.
1925 to December 1956: Discharge, 123,000 cfs Jan. 26, 1937; gage height, 56.85 ftJan. 24, 1937 (backwater from Ohio River).
Remarks. Gage-height record furnished by Corps of Engineers. Flow regulated byHerrington Lake (see station 53) and hydroelectric plant at lock 7.
Mean discharge, in cubic feet per second, 1957
Day
1 _____2 _____3 _____4_ ____5 _____6 _____7 _____8_ ____9 _____10 ____11 ____
January
5,010 4,050 3,870 3,210 2,860 2,660 2,860 2,860 7,380
31,100 39,400
Monthly mean dis Runoff, in inches
February
64,400 75,600 84,400 85,100 80,400 60,100 29,500 21,600 33,100 52,800 59,600
Day
12 _____13 _____14 _____15 __ .16 _____17 _____18 _____19 _____on21 _____22 _____
January
41,300 37,200 20,100 12,000 9,230 7,270 6,150 4,950 3,900 3,450 8,950
February
58,600 57,500 46,300 23,700 16,900 11,200
8,950 7,900 7,200 7,020 9,500
Day
23 ____ 24 ____ 25 ____26___.27 ____ 28 __ .29 __ . 30 __ .31____
charge, in cubic feet per second (unadjusted) ___
January
25,700 40,300 41,300 38,300 21,500 41,100 33,600 48,80056,200
19,570 3.75
February
11,700 10,300
9,420 9,860
10,100 9,540
34,370 5.80
SALT RIVER BASIN
58. SALT RIVER NEAR HARRODSBURG, KY.
Location. Lat 37°45'26", long 84°52'23", near center of span on downstream side ofbridge on State Highway 152, li miles west of Harrodsburg, Mercer County, and 11miles downstream from Quirks Run.
Drainage area. 41.4 sq mi. Gage-height record. Graph drawn from twice-daily wire-weight gage readings. Datum
of gage is 810.60 ft above.mean sea level, unadjusted. Discharge record. Stage-discharge relation defined by current-meter measurements
below 2,500 cfs. Maxima. January-February 1957: Discharge, 2,420 cfs 4, a.m. Feb. 10 (gage height
10.8 ft).1952 to December 1956: Discharge, 4,140 cfs July 24, 1956 (gage height, 15.0 ft).
Remarks. Some diversion and regulation above station by City of Harrodsburg formunicipal water supply.

A96 FLOODS OF 1957
Mean discharge, in cubic feet per second, 1957
Day
12_3 .....4 _____5 _____6 _____
Q
10 ___11_._.
January
10 8.4 7.7 8.0 9.6
12 12 12
948 422 112
Monthly mean dis Runoff ~ in inches
February
687 255 133 97 80 76 72
402 638
1,060 151
Day
12 .... 13 ....14 __ 15 ....16 __ 17 ___ 18 ___ 19 .... 20 ____ 21 ___ 22 ____
January
84 57 56 29 19 12 11 10 9.0 9.0
672
charge, in cubic feet per secc
February
97 76 55 32 27 22 18 16 16 14 12
Day
23 ____24 ___ 25 ____ 26 __ 27 ___ 28 ___9Q
30____31 ____
January
1,090 124 89 59 44 946
1,200266143
209 5.83
February
11 11 12 14 20 25
147 3.71
59. SALT RIVER NEAR VAN BUREN, KY.
Location. Lat 37°58'06", long 85°08'03", on right bank at downstream side of GoodnightBridge, 1.8 miles east of Van Buren, Anderson County, and 2.3 miles upstream fromCrooked Creek.
Drainage area. 200 sq mi, approximately. Gage-height record. Water-stage recorder graph. Datum of gage is 535.38 ft above
mean sea level, datum of 1929. Discharge record. Stage-discharge relation defined by current-meter measurements
below 9,000 cfs. Maxima. January-February 1957: Discharge, 5,290 cfs 2:30 a.m. Feb. 10 (gage height,
12.41 ft).1938 to December 1956: Discharge, 14,700 cfs Feb. 13, 1948 (gage height, 19.3ft,
from floodmark).Maximum stage known, 22.2 ft in 1928. Flood of January 1937 reached a stage of
19.6 ft.
Mean discharge, in cubic /eet per second, 1957
Day
!.____2_ ____3 _____4 _____5 _____6. ___7 __ __8 _____910 ____ 11 ___
Monthly Runoff,
January
70 56 52 46 46 48 54 60
1,840 2,430
764
February
926 1,740
668 377 281 341 299 320
2,900 4,030 1,370
Day
12 _____13 _____14 _____15 _____16 ___17 _____18 _____19 _____20 _____21 _____22 _____
January
374 257 184 131 110
93 80 70 62 58
1,770
mean discharge, in cubic feet per seco in inches
February
552 347 239 184 152 131 114 104
94 86 77
Day
23 __ . 24 ____ 25 ___ 26 __ _ 27 ____ 28 ___ 29_.__ 30 __ . 31 __ _
nd ___ .
January
3,220 965 400 266 198 591
2,210 1,790
644
611 3.59
February
72 67 65 77
100 125
566 3.01

FLOODS OF JANUARY-FEBRUARY 19'57 IN KENTUCKY A97
60. ROLLING FORK NEAR LEBANON, KY.
Location. Lat 37°21'50", long 85°19'26", on left 'bank at downstream side of bridge on U.S. Highway 68 and State Highway 55, 2.2 miles downstream from Buckhorn Creek, 5.4 miles southwest of city limits of Lebanon, Marion County, and 14| miles down stream from confluence of North and South Forks.
Drainage area. 240 sq mi.Gage-height record. Water-stage recorder graph. Datum of gage is 580.74 ft above sea
level, unadjusted.Discharge record. Stage-discharge relation defined by current-meter measurements
below 14,000 cfs.Maxima. January-February 1957: Discharge, 11,000 cfs 6 a.m. Jan. 23 (gage height,
18.39 ft).1938 to December 1956: Discharge, 26,500 cfs Jan. 1,1945 (gage height, 22.4 ft). Maximum stage known, 24.7 ft in 1913, from information by local residents.
Mean discharge, in cubic feet per second, 1957
Day
1 __ ..2_._._3 .....4 __ _.5 __ _.6 .....7 .....8 _____9_ ____10 __ 11____
January
86 70 60 60 88 95 89 82
500 1,700
738
Monthly mean dis Runoff, in inches
February
3,100 2,270
954 613 727
1,120 673 894
1,780 3,500 1,290
Day
12 __ 13 __14 ____ 15 .._. 16 ____ 17 ____ 18 ____ 19 ____ 20 ____ 21 __ 22 ____
January
484 360 272 186 140
89 85 74 79 91
1,650
charge, in cubic feet per seco
February
686 516 395 317 267 222 194 234 265 212 202
Day
23 ____ 24 ____ 25 .__. 26 __ _ 27 .... 28 __ _ 29 ____30 __ _ 31 ___
nd ______________
January
5,530 1,020
627 464 358
1,860 7,3502,070 1,110
8864.27
February
192 190 196 206 355 372
----------
784 3.41
GREEN RIVER BASIN
61. McGILLS CREEK NEAR McKINNEY, KY.
Location. Lat 37°26'40", long 84°41'55", on right bank 0.3 mile upstream from mouth,3.2 miles northeast of Arabia, and 3.2 miles east of McKinney, Lincoln County.
Drainage area. 2.19 sq mi. Gage-height record. Water-stage recorder graph. Altitude of gage is 970 ft (from
topographic map). Discharge record. Stage-discharge relation defined by current-meter measurements
below 200 cfs and by slope-area measurement at 950 cfs. Maxima. January-February 1957: Discharge, 176 cfs 6:30 p.m. Jan. 22 (gage height,
2.80 ft).1951 to December 1956: Discharge, 950 cfs Mar. 22,1952 (gage height, 5.40 ft).

A98 FLOODS OF 1957
Mean discharge, in cubic feet per second, 1957
Day
1---.-2 _____3--.._4 _____5__ __6__ __7..___8.. ___910_ __ 11-..-
January
0.45 .35 .35 .45
1.0 .9 .9 .9
22 13
5.0
Monthly mean dig Runoff, in inches
February
2813
7.1 4.5
11 9.0 6.3 9.0
31 32
9.4
Day
12 _____13.____14--.__15 _____16-.-.-17 _____18 _____19---..2021 _____22_. ___
January
3.25 2.3 1.55 1.25 1.0 1.0
.9
.75
.75
.9 30
charge, in cubic feet per sec
February
5.5 4.1 3.0 2.3 1.85 1.55 1.4 3.1 3.0 3.8 5.7
Day
23--.. 24__-- 25-.-- 26-.--27 ____ 28. ___ 29 ____ 30..-. 31...-
January
15 5.9 3.8 2.5 2.75
24 64 14 8.4
7.40 3.89
February
6.35.1 4.1 3.8 4.1 3.8
7.96 3.78
62. GREEN RIVER NEAR McKINNEY, KY.
Location. Lat 37°25'19", long 84°45'01", on right bank 10 ft downstream from highwaybridge, 0.8 mile upstream from South Fork, 1.2 miles northwest of Arabia, 2.2 milessouth of McKinney, Lincoln County, and 3.3 miles downstream from McGills Creek.
Drainage area. 22.4 sq mi. Gage-height record. Water-stage recorder graph. Datum of gage is 893.69 ft above
mean sea level, unadjusted. Discharge record. Stage-discharge relation defined by current-meter measurements
below 1,600 cfs and by contracted-opening measurement at 9,610 cfs. Maxima. January-February 1957: Discharge, 1,890 cfs 8 p.m. Jan. 22 (gage height,
6.48 ft).1951 to December 1956: Discharge, 10,400 cfs Mar. 22, 1952 (gage height, 8.93 ft).
Mean discharge, in cubic feet per second, 1957
Day
1 __ _-2__.__3__ __4__ __5__ __6__ ___7_____8.....9_-.__10 ____ 11 ____
January
4.8 3.6 3.4 3.9 7.8 7.3 7.3 7.3
207 160 54
Monthly mean dig Runoff, in inches
February
304 149 74 47 128 101 66 100 314 359 100
Day
12 _____13_____14.....15..-..16 _____17_____18 ___1 Q
9fl
21...--22 _____
January
33 24 17 13 10 10 7.3 6.3 6.3 7.3
346
charge, in cubic feet per sec
February
58 40 29 23 20 16 14 34 32 39 51
Day
23 ____ 24 __ 25 ____ 26 ____ 27... _ 28 ____ 29 ___ 30 ____ 31 ____
January
206 63 42 28 32
324 701 149 91
83.3 4.29
February
53 43 35 37 46 41
84.0 3.91

FLOODS OF JANUARY-FEBRUARY 1957 IN KENTUCKY A99
63. GREEN RIVER NEAR MOUNT SALEM, KY.
Location. Lat 37°24'40", long 84°45'11", on left bank 20 ft upstream from bridge on private road, about 300 ft downstream from South Fork, 0.8 mi downstream from gaging station near McKinney, and 2.6 miles east of Mount Salem, Lincoln County.
Drainage area..- 36.3 sq mi.Gage-height record. Water -stage recorder graph. Altitude of gage is 880 ft (from top
ographic map).Discharge record. Stage-discharge relation defined by current-meter measurements
below 2,000 cfs and by slope-area measurement at 11,700 cfs.Maxima. January-February 1957: Discharge, 2,900 cfs 8:15 p.m. Jan. 22 (gage height,
7.95 ft).1953 to December 1956: Discharge, 5,300 cfs Mar. 21, 1955 (gage height, 9.40 ft).
Mean discharge, in cubic feet per second, 1957
Day
1 _____2 __ _.3 _____4 ___5 __ __6 _____7 _____8 ___
10 ____11 __
January
10 6.4 5.6 7.4
14 14 12 11
442 298 93
Monthly mean dis Runoff, in inches
February
559 332 147 100 242 216 129 221 576 741 219
Day
12 ____ 13 ____ 14 ____15 __ 16 __ 17 ____ 18 __ 19 __ 20 ____ 21 __ 22 __
January
58 38 28 22 14 12 11 10 10 13
609
charge, in cubic feet per seco
February
117 81 55 42 36 28 26 71 67 78
100
Day
23 ____ 24 ____ 25 __ 26__._ 27 ____ 28 ____ 29 ____30 __ 31 ____
January
389 121 87 58 64
537 1,290340 184
155 4.93
February
103 81 67 70 87 81
167 4.79
64. GREEN RIVER AT GREENSBURG, KY.
Location. Lat 37°15'13", long 85°30'11", on left bank 75 ft downstream from bridge on U.S. Highway 68, 300 ft upstream from Clover Lick Creek, a quarter of a mile south of Greensburg, Green County, and 2.6 miles upstream from Russell Creek.
Drainage area. 742 sq mi.Gage-height record. Water -stage recorder graph. Graph drawn for auxiliary wire-
weight gage, 1.8 miles upstream, from twice-daily readings. Datum of gage is 531.81 ft above mean sea level, datum of 1929.
Discharge record. Stage-fall-discharge relation or stage-discharge relation defined by .current-meter measurements. Fall used as a factor Jan. 10 14, Jan. 23 to Feb. 28.
Maxima. January-February 1957; Discharge, 21,500 cfs 10 p.m. Jan. 30 (gage height, 25.63 ft); gage height, 25.65 ft 8-9 p.m. Jan. 30.
1.939 to December 1956: Discharge, 47,000 cfs Mar. 23, 1952 (gage height, 33.50 ft). Maximum stage known, 36.2 ft in 1913, from floodmark.

A100 FLOODS OF 1957
Mean discharge, in cubic feet per second, 1957
Day
1 __ ..
3 __ -.4 .....5 .....6_-.._7 __ _-8 __ ..9 ... ..10 .... 11 ....
Monthl Runoff,
January
405 342 296 269 287 384 468 430 605
3,620 5,630
February
5,350 7,140 6,930 3,160 2,380 5,080 3,640 2,990 3,730 6,800
10,100
Day
12 .... 13__._ 14..-. 15 .... 16 .... 17. ... 18 .... 19 .... 20__._ 21 .... 22 ....
January
2,970 1,760 1,290
974 782 618 492 412 388 356
1,010
y mean discharge, in cubic feet per sec inches
February
5,290 2,520 1,800 1,360 1,100
923 790 841
1,940 2,140 1,630
ond
Day
23 __ . 24 __ .25 __26 .... 27____ 28 .... 29 __ _30 __ .31 ....
January
7,700 13,100
5,390 2,240 1,610 2,540
10,50019,30017,200
3,334 5.18
February
1,490
i,jau 1,170 1,230 1,790
3,069 4.31
65. RUSSELL CREEK NEAR COLUMBIA, KY.
Location. Lat 37°07'09", long 85°23'38", on left bank of downstream side of bridge onState Highway 61, 0.2 mile upstream from Butlers Fork and 5 miles west of Columbia,Adair County. Records include flow of Butlers Fork.
Drainage area. 186 sq mi, includes that of Butlers Fork. Gage-height record. Water-stage recorder graph. Datum of gage is 610.96 ft above
mean sea level, unadjusted. Discharge record. Stage-discharge relation defined by current-meter measurements
below 7,900 cfs, and extended above by logarithmic plotting. Maxima. January-February 1957: Discharge, 7,790 cfs 9 p.m. Jan. 29 (gage height,
17.28 ft).1939 to December 1956: Discharge, 15,900 cfs Mar. 22, 1952 (gage height, 23.8 ft,
from floodmark).Flood of January 1937 reached a stage of about 23 ft, from information by local
residents.
Mean discharge, in cubic feet per second, 1957
Day
!----_2__._.3 ._...4 __ ._5--.-_6 ..._.7 .....8 .....9 .....10 . ll.___
January
100 86 75 87
315 225 180 153 514
1,350 694
Monthly mean dis Runoff, in inches
February
1,730 1,880
906 606 750
1,070 806 950
1,350 3,020 1,250
Day
12 .... 13 .... 14 .... 15 .... 16 .... 17 .... 18 .... 19 .... 20 .... 21____ 22 ....
January
456 337 245 193 167 125 120 110 105 117
1,610
charge, in cubic feet per sec
February
698 505 382 292 254 212 189 784 898 586 498
Day
23.... 24 _ 25---.26 .... 27_...28 .... 29 .... 30 .31 ....
January
4,640 1,020
614 432 396
2,410 6,640 3,350 1,110
902 5.53
February
410 348 337 365 628 561
795 4.40

FLOODS OF JANUARY-FEBRUARY 1957 IN KENTUCKY A101
66. SOUTH FORK LITTLE BARREN RIVER AT EDMONTON, KY.
Location. Lat 36°58'27",long 85°36'll",on right bank 13 ft downstream from bridge onState Highway 496, three-quarters of a mile southeast of Edmonton, Metcalfe County,and 3.0 miles upstream from Rogers Creek.
Drainage area. 18.1 sq mi. Gage-height record. Water-stage recorder graph. Datum of gage is 742.83 ft above
mean sea level, datum of 1929. Discharge record. Stage-discharge relation defined by current-meter measurements
below 1,200 cfs and extended above by logarithmic plotting. Maxima. January-February 1957; Discharge, 1,510 cfs 10:30 p.m. Jan. 22 (gage height,
7.91 ft).1941 to December 1956: Discharge, 2,140 cfs June 15, 1949 (gage height, 10.00 ft).
Mean discharge, in cubic feet per second, 1957
Day
1 _ ..2 _ ..3 __ ..4 .....5.....6 __ ..7 .....8 __ ..
10.... 11 ....
January
4.1 3.2 3.0
18 46 21 15 13 79
126 39
Monthly mean dis Runoff, in inches
February
249 100 55 36
111 76 63
182 133 250 69
Day
12 .... 13 ....14____ 15 ....16 .... 17 .... 18 .... 19 .... 20 .... 21 ___ 22 ....
January
25 1814 11 6.2 5.0 4.4 4.1 5.7 9.5
614
charge, in cubic feet per seco
February
41 30 22 18 17 14 13
168 78 48 40
Day
23 .... 24_...25 .... 26 .... 27 .... 28 __ . 29.... 30 .... 31 ....
January
177 54 37 26 61
475 760 111 86
92.6 5.83
February
30 31 31 51 58 56
73.9 4.21
67- GREEN RIVER AT MUNFORDVILLE, KY.
Location. Lat 37°16'05", long 85°53'10 M , on right bank at downstream side of pier ofbridge on U.S. Highway 31W at Munfordville, Hart County.
Drainage area. 1,790 sq mi, approximately. Gage-height record. Water-stage recorder graph. Datum of gage is 451.70 ft above
mean sea level, datum of 1929.Discharge record. Stage-discharge relation defined by current-meter measurements. Maxima. January-February 1957: Discharge, 31,600 cfs 6 a.m. Feb. 1 (gage height,
36.94 ft).1915-22, 1927-31, 1936-37, 1937 to December 1956: Discharge, 72,200 cfs Jan. 23,
1937 (gage height, 50.40 ft, from floodmarks, at site 0.2 mile downstream at samedatum).
Maximum stage known, 54.0 ft in January 1913, at former site (discharge 87,000cfs).

A102 FLOODS OF 1957
Mean discharge, in cubic feet per second, 1957
Day
1. ....2 .....3_..._4 .....5 .....6 __ ..7_____8_____9 .....10 ....11 ....
January
1,000 866 749 683 731
1,320 1,260 1,140 1,160 3,760 7,760
Monthly mean dis Runoff, in inches
February
31,300 27,000 22,200 15,300 8,700 7,650 8,340 8,060 9,580
12,400 15,500
Day
12 .... 13 .... 14 ....15 .... 16 .... 17 .... 18 ....19 .... 20 .... 21. ... 22 ....
January
8,250 4,920 3,110 2,390 1,900 1,540 1,220
996 976 930
1,700
charge, in cubic feet per sec
February
15,600 11,500 5,620 3,830 3,120 2,620 2,240 2,160 4,700 5,170 4,280
Day
23 ....24 .... 25 .... 26 .... 27 .... 28 .... 29 .... 30 .... 31___.
ond_ ___________
January
12,100 17,700 18,200 14,100 5,420 5,050
14,600 23,500 29,500
6,0824.19
February
3,540 3,170 2,930 2,810 2,970 3,630
8,7835.47
68-. BARREN RIVER NEAR PAGEVILLE, KY.
Location. Lat 36°51'09", long 86°04'37", near right bank on downstream side of bridge pier on U.S. Highway 31E, 100 ft upstream from Hurricane Creek, 1.8 miles south of Pageville, Barren County, and 2.3 miles upstream from Peter Creek.
Drainage area. 531 sq mi, of which about 20 sq mi does not contribute directly to sur face runoff.
Gage-height record. Water-stage recorder graph. Datum of gage is 505.47 ft above mean sea level, datum of 1929.
Discharge record. Stage-discharge relation defined by current-meter measurements below 40,000 cfs.
Maxima. January-February 1957: Discharge, 42,800 cfs 2 a.m. Jan. 30 (gage height, 23.76 ft).
1939 to December 1956: Discharge, 70,000 cfs Mar. 23, 1952 (gage height, 27.26 ft).
Mean discharge, in cubic feet per second, 1957
Day
1_ __ .2_.___3_____4 __ ..5 .....6_____7 .....8_ ....9. ....10 .... 11_.__
January
350 302 257 254 672 969 735 611 543 990
1,690
Monthly mean dis Runoff, in inches
February
4,500 5,980 3,930 2,640 2,050 1,990 1,800 1,850 2,560 3,380 3,560
Day
12 ....13 .... 14 .... 15 ....16 .... 17 .... 18 .... 19 .... 20 .... 21 .... 22. ...
January
1,160 925 762 611 518 424 353 318 286 302
1,700
charge, in cubic feet per sec
February
2,420 1,850 1,460 1,220 1,220 1,120
986 1,670 5,450 3,310 2,230
Day
23 __ . 24 .... 25 .... 26___. 27 .... 28 .... 29 __ _ 30 ....31 __ .
January
12,600 9,820 2,670 1,860 1,470 3,490
20,800 29,400
7,830
3,377 7.33
February
1,690 1,360 1,220 1,350 1,710 1,540
2,359 4.63

FLOODS OF JANUARY-FEBRUARY 1957 IN KENTUCKY A103
69. WEST BAYS FORK AT SCOTTSVILLE, KY.
Location. Lat 36°44'53", long 86°11'47", on downstream side of left abutment of bridgeon U.S. Highway 31E, 0.5 mile southwest of Scottsville, Alien County, and 6.4 milesupstream from mouth.
Drainage area. 7.52 sq mi. Gage-height record. Water-stage recorder graph. Datum of gage is 637.61 ft above
mean sea level, datum of 1929, supplemental adjustment of 1936. Discharge record. Stage-discharge relation defined by current-meter measurements
below 1,100 cfs and by slope-area measurement at 1,640 cfs. Maxima. January-February 1957; Discharge, 1,510 cfs 4 a.m. Jan. 29 (gage height,
5.64 ft).1950 to December 1956: Discharge, 1,640 cfs Mar. 22, 1952 (gage height, 6.09ft).
Mean discharge, in cubic feet per second, 1957
Day
1-----2--..-3.....4__-.-5.....6-.--.7.....8... .9..---10-.-- 11.---
Monthlj Runoff,
January
2.9 2.4 2.2 3.9 6.4 5.7 5.0 4.5 5.5
26 13
February
103 66 41 26 24 22 20 29 38 66 38
Day
12.--. 13.--. 14..-. 15-.-. 16.... 17.... 18-.-- 19.... 20--.. 21..-- 22- __
January
9.9 8.2 6.8 5.7 4.5 3.7 3.4 3.2 2.9 3.4
215
r mean discharge, in cubic feet per seco
February
25 19 15 13 11 9.9 9.0
62 46 28 19
Day
23.--. 24.-.. 25-.-- 26.-.. 27-... 28---. 29---. 30-..- 31--..
nd ------------..
January
82 38 23 16 20
236 528 91 58
46.3 7.15
February
15 13 13 19 22 22
29.84.15
70. DRAKES CREEK NEAR ALVATON, KY. Location. Lat 36°53'42", long 86°23'21",on right bank at downstream side of abandoned
bridge, 0.5 mile upstream from State Highway 71, 2.5 miles northwest of Alvation,Warren County, and 4.8 miles downstream from Trammel Fork.
Drainage area. 478 sq mi, of which about 120 sq mi does not contribute directly tosurface runoff.
Gage-height record. Water-stage recorder graph. Datum of gage is 443.07 ft abovemean sea level, datum of 1929, supplementary adjustment of 1936.
Discharge record. Stage-discharge relation defined by current-meter measurements. Maxima. January-February 1957: Discharge, 34,300 cfs 11 p.m. Jan. 29 (gage height,
31.54 ft).1939 to December 1956: Discharge, 30,900 cfs Feb. 14, 1948 (gage height, 30.70 ft).

A104 FLOODS OF 1957
Mean discharge, in cubic feet per second, 1957
Day
1.---.2_. ...3 _....4-_...5.....6 .....7__ ...8.. ...9.. ...10.... 11..--
January
190 169 154 148 259 428 365 316 287 480 684
Monthly mean dis Runoff, in inches
February
5,180 6,890 4,250 2,510 1,890 2,020 1,780 1,700 2,340 3,620 3,280
Day
12.. ...13._...14 _____15_____16-....17.,---18 _____19-. ___20.. ...21__.._22 __ ._
January
522 440 375 323 284 246 217 195 181 182 692
sharge, in cubic feet per seco
February
2,030 1,580 1,280 1,060 1,100
994 879
2,130 4,530 2,480 1,720
nd
Day
23_.._24____ 25____ 26---. 27.... 28 __ - 29....30 ....31 ....
January
12,900 5,810 2,090 1,370 1,070 2,990
19,40022,200
7,490
2,660 6.42
February
1,350 1,120 1,000 1,340 2,550 2,040
2,309 5.03
71. BARREN RIVER AT BOWLING GREEN, KY.
Location. Lat 37°00'04", long 86°25'51", on downstream side of College Street bridge, 600ft downstream from bridge on U.S. Highways 31W and 68 at Bowling Green, Warren County, 800 ft upstream from Louisville and Nashville Railroad bridge, 6 miles down stream from Drakes Creek, and 8.9 miles upstream from Jennings Creek.
Drainage area. 1,848 sq mi, of which about 490 sq mi does not contribute directly to surface runoff.
Gage-height record. Water-stage recorder graph. Graph drawn for auxiliary staff gage, 7.7 miles downstream, from once or twice daily readings. Datum of gage is 409.83 ft above mean sea level, datum of 1929, supplementary adjustment of 1936.
Discharge record. Stage-fall-discharge relation or stage-discharge relation defined by current-meter measurements. Fall used as a factor Jan. 23 to Feb. 17, Feb. 20 23, 27, 28.
Maxima. January-February 1957: Discharge, 66,100 cfs 10p.m. Jan. 30 (gage height, 41.50 ft); gage height, 42.07 ft 4 a.m. Jan. 31.
1938 to December 1956: Discharge, 77,400 cfs Mar. 24, 1952; gage height, 44.63 ft Mar. 24, 1952.
Maximum stage known, 52.2 ft Jan. 8, 1913, from floodmarks.
Mean discharge, in cubic feet per second, 1957
Day
!____.2____.3..-..4.....5_____6_____7_..._8.....9-. ___10. ... 11-..-
Monthlj Runoff,
January
1,020 916 838 770 765
1,410 1,950 1,620 1,430 1,410 3,230
February
33,000 23,400 19,200 13,400
7,680 7,250 6,930 6,110 7,410 9,600
12,700
Day
12_____13..-..14 __ ..15.- __16.--..17--__.18.--..19. ....20.. ...21....-22 __ .
January
3,530 2,760 2,210 1,820 1,530 1,310 1,130
994 916 874
1,180
' mean discharge, in cubic feet per seco in inches _
February
10,200 6,780 5,060 4,120 3,790 3,660 3,370 3,580 9,310
10,600 7,590
Day
23____.24. __ .25.....26.....97
28.....29 __ ..30__...31.....
January
11,700 21,800 21,500 13,700 4,880 5,760
18,30050,80056,600
7,698 4.80
February
5,270 4,240 3,860 3,800 5,040 5,330
8,653 4.88

FLOODS OF JANUARY-FEBRUARY 1957 IN KENTUCKY A105
CUMBERLAND RIVER BASIN
72. POOR FORK AT CUMBERLAND, KY.
Location. Lat 36°58'26", long 82°59'35", at left downstream side of Second Street Bridge at Cumberland, Harlan County, 0.1 mile upstream from Cloverlick Creek, and 0.5 mile downstream from Looney Creek.
Drainage area. 82.3 sq mi.Gage-height record. Water-stage recorder graph. Datum of gage is 1,415.15 ft above
mean sea level, datum of 1929, supplementary adjustment of 1936.Discharge record. Stage-discharge relation defined by current-meter measurements
below 3,500 cfs and slope-area measurement of 11,700 cfs.Maxima. January-February 1957: Discharge, 11,800 cfs 3 p.m. Jan. 29 (gage height,
11.50 ft).1940 to December 1956: Discharge, 7,500 cfs Jan. 1, 1946 (gage height, 9.65 ft). Flood of January 1927 reached a stage of about 10.2 ft (discharge 12,000 cfs, esti
mated by Corps of Engineers).
Mean discharge, in cubic feet per second, 1957
Day
!_--__2_._._3 ..._.4_..__5_____6 .....7. __ .8.....9-.-_.10 .... 11 __ .
January
93 86 75
103 131 175 178 151 254 880 582
Monthly mean dig Runoff, in inches
February
1,860 1,640
608 374 285 246 284 446 815
1,540 685
Day
12_____13. __ _14.....15 __ .16 __ .17_. ...18 .....19 .....20.....21_____22_____
January
347 251 192 160 135 103
93 82 82 82 93
charge, in cubic feet per seco
February
386 281 215 172 153 131 113 302 466 335 272
Day
23. ... 24_ ... 25. ... 26. ... 27. ... 28. ... 29. ...30 ....31. ...
January
398 293 230 182 202 906
6,7502,280
852
530 7.42
February
228 190 170 160 153 145
452 5.72
Gage height, in feet, and discharge, in cubic feet per second, at indicated time, 1957
Hour
Jan. 26
12 p.m...
Jan. 27
12 m __ _
12 p.m...
Jan. 28
12 m ..__6 p.m.... 12 p.m...
Gage height
0.99
1.121.191.31
1.582.473.95 4.05
Dis charge
165
200218251
344715
1,600 1,680
Hour
Jan. 29
2 a.m_.___4 __ .____.6.........8_. .._._..10.. ......12 m .-.-.
3. ........4... ......6 _____ ..8.........10 __ .....12 p.m.___
Gage height
4.204.505.897.709.00
10.2011.2211.5011.1810.21
9.308.397.65
Dis charge
1,8002,0703,5205,7807,6009,460
11,30011,80011,200
9,4808,0206,7505,710
Hour
Jan. 30
6 a.m....12 m .__-
12 p.m...
Jan. 31
12 m ....6 p.m_-_.12 p.m...
Gage height
5.835.004.484.16
3.973.914.054.48
Dis charge
2,8501,7601,200
910
790735830
1,200

A106 FLOODS OF 1957
Gage height, in feet, and discharge, in cubic feet per second, at indicated time, 1957 Continued
Hour
Feb. 1
12 m ....6 p.m.... 12 p.m...
Feb. 2
6 a.m.... 12 m .... 6 p.m.... 12 p.m...
Gage height
4.824.825.42 5.92
5.384.75 4.34 4.02
Dis charge
1,5801,5802,270 2,840
2,140 1,480 1,080
840
Hour
Feb. 3
12 m .....1 ey .^
Feb. 4
12 m .....12 p.m....
Gage height
3.783.613.33
3.092.92
Dis charge
660586474
358305
Hour
Feb. 5
12 m .....12 p.m___.
Feb. 6
12 m __ .
Gage height
2.872.78
2.742.73
Dis charge
287260
242239
73. CUMBERLAND RIVER NEAR HARLAN, KY.
Location. Lat 36°50'48", long 83°21'21", on left bank 10 ft downstream from bridge onU.S. Highway 119 at Loyall, 1.6 miles upstream from Fourmile Branch, 2.0 milesdownstream from Poor and Clover Forks, and 2 miles west of Harlan, Harlan County.
Drainage area. 374 sq mi. Gage-height record. Water -stage recorder graph except Jan. 17 19. Datum of gage is
1,140.10 ft above mean sea level, datum of 1929, supplementary adjustment of 1936. Discharge record. Stage-discharge relation defined by current-meter measurements
below 22,000 cfs. Discharge for Jan. 17 19 estimated on basis of records for nearbystations.
Maxima. January-February 1957: Discharge, 31,000 cfs 6 p.m. Jan. 29 (gage height,19.89 ft).
1940 to December 1956: Discharge, 37,900 cfs Jan. 8, 1946 (gage height, 22.81 ft). Floods of 1918 and 1929 reached stages of about 22 and 20.0 ft respectively, from
information by local residents.
Mean discharge, in cubic feet per second, 1957
Day
!-_---2.....3..-..4.....5.....6. __ .7 __ .8.....9 __ .10-... 11 __ .
Monthly Runoff,
January
348 310 266 298 410 554 626 548
1,710 5,240 2,980
February
7,200 6,910 3,030 1,890 1,440 1,260 1,390 2,360 3,340 6,580 3,560
Day
12.....13 _____14.....15.. ___16.. __17_____18 _____19.. ___20 _____21__...22_. __
January
1,640 1,110
831 668 566 480 410 360 344 357 370
j mean discharge, in cubic feet per seco in inches
February
2,000 1,440 1,090
875 749 638 554
1,250 2,340 1,650 1,250
Day
23____24 ____ 25. __ 26 ____ 27.... 28 __ 29 ____30. __31 ____
id __ _______ ...
January
2,440 1,850 1,200
882 953
6,790 22,70011,5004,210
2,353 7.25
February
1,010 860 775 730 680 698
________--.
2,055 5.72

FLOODS OF JANUARY-FEBRUARY 1957 IN KENTUCKY
Gage height, in feet, and discharge, in cubic feet per second, at indicated tin.e, 1957
A107
Hour
Jan. 26
Jan. 27
6 a.m_.__j12 m .....
12 p.m____
Jan. 28
10. .-...._12 m _____
6. __ .....8. __ __ ..10-._ __ ..12 p.m....
Jan. 29
4_..._ ...6... __ __8_... __ ..10-..--...12 m .....
4. __ ...._ 5... ......6 ___ ._..-
Gage height
2.30
2.27 2.42 2.70 3.12
3.82 4.765.55 7.18
10.99 11.76 12.04 11.93
11.86 12.06 12.45 13.19 14.29 16.28 18.31 19.43 19.78 19.89
Dis charge
775
756 860
1,080 1,460
2,160 3,2504,260 6,520
12,700 14,100 14,600 14,400
14,200 14,600 15,400 16,800 19,000 23,100 27,500 30,000 30,800 31,000
Hour
Jan. 29 Con.
8. __ . _10.._. __12 p.m___.
Jan. 30
2 a.m__.__4... __ ...8.. __ ...12 m .....
8.........12 p.m....
Jan. 31
8 __ __ ..12 m _____
8... ......12 p.m....
Feb. 1
8 ___ __ .
8._....._. 12 p.m.___
Gage height
19.76 19.49 19.00 18.54
17.34 15.32 10.74 8.19 6.86 6.11 5.59
5.285.09 5.25 5.46 5.85 6.62
7.37 7.69 7.39 8.06 8.77
Dis charge
30,700 30,100 29,000 28,000
25,300 21,100 12,300 8,050 6,050 5,000 4,320
3,910 3.670 3,880 4,150 4,660 5,710
6,800 7,280 6,840 7,850 8,980
Hour
Feb. 2
8 __ .. __ .12 m .__..
8__. ______12 p.m....
Feb. 3
12 m .....
12 p.m....
Feb. 4
12 m .....12 p.m....
Feb. 5
12 m . __ .12 p.m____
Feb. 6
12 m .....12 p.m....
Gage height
8.86 8.387.47 6.59 5.94 5.45
4.89 4.51 4.19 3.92
3.53 3.22
3.08 3.00
2.88 2.85
Dis charge
9,130 8,360 6,960 5,680 4,770 4,140
3,410 2,940 2,560 2,260
1,870 1,560
1,430 1,350
1,240 1,210
74. YELLOW CREEK NEAR MIDDLESBORO, KY.
Location. Lat 36°39'02", long 83°42'04", on right bank on U.S. Highway 25E, 0.4 mileupstream from Low Ash Hollow, 3 miles north of Middlesboro, Bell County, and 6.0miles upstream from Clear Fork.
Drainage area. 58.2 sq mi. Gage-height record. Water-stage recorder graph. Datum of gage is 1,104.20 ft above
mean sea Level, Sandy Hook datum.Discharge record. Stage-discharge relation defined by current-meter measurements. Maxima. January-February 1957: Discharge, 3,980 cfs 8. p.m. Jan. 28 (gage height,
15.31 ft).1940 to December 1956: Discharge, 6,160 cfs Jan. 7, 1946 (gage height, 20.92 ft). Flood of March 1929 reached a stage of about 19.6 ft; flood of Feb. 3, 1939 reached
a stage of 18.5 ft, from floodmarks.

A108 FLOODS OF 1957
Mean discharge, in cubic feet per second, 1957
Day
l--__.2. __ .3.____4. __ .5.....6-..-.7.....8____.9-.---10 __ .11. ...
January
49 42 36 64
204 190 141 109 414 696 416
Monthly mean dis Runoff, in inches
February
1,360 1,010
452 298 323 191 120 482 420 932 497
Day
12. __ .1 ?14. __ .15. __ .16.....17.....18.....19.....9021.....22.....
January
246 167 122 100
84 64 55 50 45 68 84
charge, in cubic feet per seco
February
302 214 156 125 111
95 84
211 298 228 165
Day
23. ... 24.... 25...- 26....27. ... 28 .... 29....30. ...31. ...
January
362 260 182 130 210
2,070 3,0101,150
799
375 7.42
February
129 111 101 101
93 90
315 5.63
Gage height, in feet, and discharge, in cubic feet per second, at indicated time, 1957
Hour
Jan. 26
12 p.m...
Jan. 27
6 a.m.... 6 p.m.... 12 p.m...
Jan. 28
4 a.m.... 8 __ .. ...12 m -.__ 4 p.m___. 6.. ___ .8 __ ....10..--.-.12 p.m...
Jan. 29
4 a.m.... 8 __ ....10.... ... 12 m .... 2 p.m_.__ 4 p.m....6........8 __ ...__
Gage height
1.99
2.00 2.96 3.70
5.65 6.95 9.02
13.72 15.00 15.31 15.16 14.81
14.26 13.30 12.84 12.71 13.08 13.3613.38 13.12
Dis charge
117
119 275 380
687 940
1,460 3,180 3,820 3,980 3,900 3,720
3,450 2,970 2,760 2,700 2,860 3,0003,010 2,880
Hour
Jan. 29 Con.
12 p.m....
Jan. 30
8. ---._._.12 m .....
8 __ . ____12 p.m....
Jan. 31
8 ___ . ... 12 m .....
8 _____ ..12 p.m....
Feb. 1
8... ...__. 12 m .....
8 ______
Gage height
12.04
10.30 8.25 6.94 6.06 5.41 5.04
5.04 5.66 6.32 6.38 7.10 8.08
8.41 8.41 4.12 8.36 9.54 9.95
Dis charge
2,440
1,810 1,260
938 762 646 586
586 689 814 826 975
1,220
1,300 1,300 1,230 1,290 1,580 1,700
Hour
Feb. 2
8____ ....12 m __ ..
8 ___ ....12 p.m....
Feb. 3
12 m .....12 p.m....
Feb. 4
12 m .....12 p.m....
Feb. 5
12 m .....12 p.m....
Feb. 6
12 m .....12 p.m....
Gage height
9.07 7.85 6.80 5.97 5.40 4.93
4.12 3.51
3.09 2.81
2.69 2.52
2.42 2.35
Dis charge
1,470 1,160
910 745 644 569
443 352
294 252
234 207
190 178

FLOODS OF JANUARY-FEBRUARY 1957 IN KENTUCKY A109
75. CUMBERLAND RIVER AT PINEVILLE, KY.
[Gaging station, discontinued 1931]
Location. Lat 36°44'48", long 83°41'34", on left bank 300 ft upstream from bridge on U.S. Highway 119, 300 ft downstream from Clear Creek, and 1 mile south of Pineville, Bell County.
Drainage area. 676 sq mi (revised).Gage-height record. Floodmarks only. Datum of gage is 984.28ft above mean sea level.Discharge record. Stage-discharge relation defined by current-meter measurements in
1929-31 below 23,000 cfs.Maxima. January-February 1957: Discharge, 45,000 cfs Jan. 29 (gage height, 32.62 ft,
from floodmarks).1929-31: Discharge, 23,400 cfs Apr. 22, 1931 (gage height, 17.76 ft).
76. STRAIGHT CREEK AT JENSEN, KY.
[Miscellaneous site]
Location. Lat 36°46'20", long 83°38'55", 0.9 miles downstream from Elliott Branch, 1.0 mile west of Jensen, 1.1 miles east of town of Straight Creek, Bell County, and 1.3 miles upstream from Left Fork Straight Creek.
Drainage area. 53.8 sq mi.Discharge record. Peak discharge by slope-area measurement.Maximum. January-February 1957: Discharge, 16,700 cfs Jan. 29.
77. CUMBERLAND RIVER NEAR PINEVILLE, KY.
Location. Lat 36°48'48", long 93°45'58", on downstream side of bridge on U.S. Highway 25 E, 0.5 mile south of Flat Lick, 2.4 miles downstream from Greasy Creek,4.7 miles upstream from Stinking Creek, and 5.0 miles northwest of Pineville, Bell County.
Drainage area. 809 sq mi.Gage-height record. Water-stage recorder graph, except Jan. 1 11, Jan. 29 to Feb. 1,
when graph was drawn from twice-daily wire-weight gage readings, floodmarks, and shape of graph for auxiliary gage. Graph drawn for auxiliary staff gage, 1.9 miles up stream, from once or twice daily readings, except Jan. 28 to Feb. 2, when hourly readings were made. Datum of gage is 955.45 ft above mean sea level, Sandy Hook datum.
Discharge record. Stage-fall-discharge relation or stage-discharge relation defined by cur rent-meter measurements below 36,000 cfs and by slope-area measurements at gage heights 44.34, 47.3, 47.35, and 49.31 ft. Fall used as a factor Jan. 10-12, 24, 25, 9 p.m. Jan. 29 to Feb. 12, Feb. 20-22.
Maxima. January-February 1957; Discharge, 54,900 cfs 11 p.m. Jan. 29 (gage height, 47.35 ft, from floodmarks.
1938 to December 1956: Discharge, 57,900 cfs Jan. 8, 1946 (gage height, 49.31 ft). Flood of March 1929 reached a stage of 47.3 ft (discharge 51,000 cfs).
Remarks. Auxiliary gage readings Jan. 28 to Feb. 2, furnished by Kentucky Utilities Co.
690-137 O - 64 - 8

A110 FLOODS OF 1957
Mean discharge, in cubic feet per second, 1957
Day
1. __2.....3-__-.4-___.5. __ .6. __7-_...8. __ .9....-10 .... 11____
January
790 682 570 554 970
1,280 1,420 1,320 2,370 9,700 8,220
Monthly mean dis Runoff, in inches
February
14,600 16,200
9,250 4,870 2,920 2,650 2,740 4,610 5,950
12,500 10,200
Day
12.... 13. ... 14. __ 15.... 16 __ . 17---. 18.... 19 .... 20.... 21.... 22....
January
3,810 2,750 1,970 1,520 1,270 1,020
808 727 704 740 790
charge, .in cubic feet per secc
February
4,760 3,220
. 2,430 1,920 1,610 1,380 1,180 2,320 5,480 3,750 2,650
Day
23---.24 .... 25 __ . 26 __ .27 _.._ 28 __ .29 ....30-...31 ....
January
2,990 3,980 2,650 2,730 2,010 9,690
40,10039,40010,600
5,101 7.27
February
2,230 1,820 1,580 1,470 1,400 1,270
4,534 5.84
Gage height, in feet, and discharge, in cubic feet per second, at indicated time, 1957
Hour
Jan. 26
12 p.m.._
Jan. 27
6 a.m____12 m .... 6 p.m.....12 p.m___
Jan. 28
4 a.m.... 8 __ __ .12 m .... 2 p.m.... 6........10 .......12 p.m._.
Jan. 29
4 a.m.... 6 ........8... __ _.10 .......12 m .... 4 p.m.... 5 ........6... _____7__._ ___89 ________
Gage height
9.80
9.66 9.79
10.3411.38
12.37 13.90 16.28 18.50 26.50 32.28 34.08
36.55 37.85 39.45 41.05 42.80 46.05 46.55 46.80 47.00 47.20 47.30
Dis charge
1,830
1,750 1,820 2,1502,780
3,390 4,430 6,450 8,450
15,600 21,600 23,800
27,100 29,000 31,500 34,300 38,200 49,400 51,700 52,800 53,700 54,700 54,800
Hour
Jan. 29 Con
11 p.m.... 12 p.m....
Jan. 30
6.........8 _________10 __ ____12 m .. ___
6. __ ....8. __ ....12 p.m....
Jan. 31
8... ___ .12 m _____
12 p.m....
Feb. 1
12 m . __ .12 p.m....
Feb. 2
12 m .....
Gage height
47.35 47.33
47.30 47.10 46.95 46.65 46.30 45.80 44.00 42.70 40.00
37.40 34.80 32.75 31.30 30.00
30.75 32.80
33.40 32.87
Dis charge
54,900 54,800
54,000 51,000 50,000 48,000 44,500 40,400 25,400 21,000 15,500
11,500 9,400 9,240 9,360
11,600
14,600 17,600
18,200 17,500
Hour
Feb. 2 Con.
12 p.m-...
Feb. 3
6 a.m..... 12 m . __ _12 p.m_.__
Feb. 4
12 m _____
12 p.m.___
Feb. 5
12 m .....12 p.m____
Feb. 6
12 m .....12 p.m....
Feb. 7
6 a.m..... 12 m __ _. 6 p.m..... 12 p.m.__.
Gage height
31.66 29.46
26.87 24.36 19.69
15.71 14.21 13.12
12.41 11.96 11.50
11.19 10.96
10.89 10.98 11.64 12.92
Dis charge
14,200 11,800
10,300 9,210 7,000
4,660 3,830 3,300
3,040 2,840 2,740
2,660 2,530
2,480 2,540 2,880 3,600

FLOODS OF JANUARY-FEBRUARY 1957 IN KENTUCKY Alll
78. CUMBERLAND RIVER AT BARBOURVILLE, KY.
Location. Lat 36°51 I 45", long 83°53'13",near center of span on upstream side of bridge on State Highway 11, at Barbourville, Knox County, 0.4 mile upstream from Richland Creek.
Drainage area. 960 sq mi.Gage-height record. Graph drawn from twice-daily wire-weight gage readings, except
Jan. 29 31, when hourly readings were made, and Jan. 28, Feb. 1 3 when 4 to 8 readings a day were made. Datum of gage is 942.97 ft above mean sea level, datum of 1929.
Discharge record. Stage-discharge relation defined by current-meter measurements below 30,000 cfs and extended above on basis of runoff comparison with nearby sta tions. Rate of change in stage used as a factor Jan. 9 13, 23 25, Jan. 28 to Feb. 5, Feb. 8-13, 19-22.
Maxima. January-February 1957: Discharge, 43,000 cfs 9 a.m. Jan. 30 (gage height, 42.15 ft); gage height, 42.28 ft 12 m. Jan. 30.
1922-31, 1948 to December 1956: Discharge, 47,900 cfs May 31, 1927; gage height, 40.25ft Feb. 2, 1951.
Flood of January 1946 reached a stage of 42.8 ft, present datum.Remarks. Gage readings Jan. 28 to Feb. 3, 1957, furnished by Corps of Engineers.
Mean discharge, in cubic feet per second, 1957
Day
1. __ .2_____3. __ .4 __ .5 __ .6_ __ .7 ___ .8 __ .9. __ .10.. _. 11 __ .
January
882 770 651 606 938
1,310 1,520 1,520 2,580 9,060 9,830
Monthly mean dis Runoff, in inches
February
23,400 23,500 15,600 8,530 5,060 3,060 2,840 4,750 6,020
10,400 12,000
Day
12_.__13 .... 14 .... 15 .... 16 .... 17 .... 18 __ _ 19 .... 20 .... 21 __ _ 22 ....
January
5,280 3,070 2,160 1,690 1,200 1,210 1,310
910 812 847 917
charge, in cubic feet per secc
February
6,290 3,950 2,620 2,120 1,810 1,570 1,350 2,440 6,520 4,950 3,330
Day
23 __ _24____25 .... 26 .... 27.... 28 __ _29 ....30 .... 31 ....
January
3,740 5,850 3,500 2,340 2,060 7,040
30,60039,200 25,800
5,458 6.55
February
2,440 2,090 1,840 1,660 1,540 1,440
-----------
5,826 6.32
Gage height, in feet, and discharge, in cubic feet per second, at indicated time, 1957
Hour
Jan. 26
]an. n
12 m ._..
12 p.m...
Jan. 28
6 a.m____12 m ....
12 p.m___
Gage height
4.52
4.404.484.75
6.03 8.62
15.4023.12
Dis charge
2,090
1,9802,0502,300
3,380 5,320
10,20016.200
Hour
Jan. 29
8 ......._.12 m __ .
4__ ___ __6 ._.....__8 _._._....10 ._......
Jan. 30
4_._ __ __
Gage height
27.0431.0025.0036.5537.8539.1039.9540.6041.01
41.3041.55
Dis charge
20,40026,10032,20035,00036,80038,60039,50039,90040,400
40,60040.700
Hour
Jon. 30 Con
8 ____ ._9 ...._._..10 .___._..12 m _____
4 ___..__._6 .........8 _......_.12 p.m____
Jan. 31
4 a.m_____
Gage height
41.6641.9542.1542.2542.2842.2642.2042.0641.8041.15
40.15
Dis charge
40,90042,50043,00042,50041,70040,80039,80037,80035,50030,000
27,900

A112 FLOODS OF 1957
Gage height, in feet, and discharge, in cubic feet per second, at indicated time, 1957 Continued
Hour
Jan. 31-Cott.
8 a.m.-..12 m ----8 p.m__-_ 12 p.m.__
Feb. 1
6 a.m_-_-12 m .... 12 p.m.--
Feb. 2
6 a.m-_-_
Gage height
39.3538.4036.42 35.62
34.52 33.85 33.40
33.42
Dis charge
26,60025,40023,600 23,000
22,900 23,200 24,500
24,800
Hour
Feb. 2 Con.
12 m .. __
12 p.m____
Feb. 3
12 m .....12 p.m.__.
Feb. 4
6 a.m.....12 m .....12 p.m___.
Gage height
33.6833.2232.65
30.2026.60
24.3021.8016.74
Dis charge
24,40022,50020,300
15,40011,200
9,4108,3206,640
Hour
Feb. 5
12 m ....12 p.m...
Feb. 6
12 m .... 12 p.m...
Feb. 7
12 m .... 12 p.m....
Gage height
11.647.00
5.53 5.16
5.20 6.10
Dis charge
4,9603,700
2,940 2,650
2,680 3,360
79. CUMBERLAND RIVER AT WILLIAMSBURG, KY.
Location. Lat 36°44'38", long 84°09'30", on left bank 10 ft downstream from bridge onU.S. Highway 25 W and State Highway 92 at Williamsburg, Whitley County, and 2.1miles downstream from Clear Fork.
Drainage area. 1,607 sq mi. Gage-height record. Water-stage recorder graph. Datum of gage is 891.52 ft above sea
level, unadjusted.Discharge record. Stage-discharge relation defined by current-meter measurements. Maxima. January-February 1957: Discharge, 49,700 cfs 11 p.m. Jan. 31 (gage height,
33.78 ft).1950 to December 1956: Discharge, 37,200 cfs Feb. 2, 1951 (gage height, 29.85 ft). Maximum stage since at least 1918, 34.2 ft Jan. 10, 1946, from graph based on U.S.
Weather Bureau gage readings. Flood of Mar. 25, 1929, reached a stage of 32.7 ft,from graph baaed on U.S. Weather Bureau gage readings.
Mean discharge, in cubic feet per second, 1957
Day
1-----2. __ .3 _____4.....5. ____6_..._7.....8.....9. __ _10 ____ 11--..
Monthlj Runoff,
January
1,430 1,240 1,060
954 1,640 2,790 2,760 2,600 2,990 7,530
12,500
February
47,600 40,800 32,800 25,400 18,800 9,880 5,500 7,420 9,780
13,100 16,700
Day
12.....13.....14.....15 __ ..16 __ .17.__..18..-..19. __ .20___._21_--_.22_._-.
January
13,100 8,010 4,370 3,140 2,500 2,060 1,650 1,380 1,240 1,260 1,480
r mean discharge, in cubic feet per seco in inches _
February
15,700 10,800
5,810 4,060 3,300 2,830 2,460 3,480 8,630
10,300 7,470
Day
23_.-_-24.....25 __ -26__-_.27 __ .28--.--29. __ .30 ___ . 31.-...
January
4,020 7,300 7,720 5,180 3,940 8,500
28,80037,600 46,700
7,337 5.26
February
5,150 3,910 3,270 3,010 2,920 2,780
-----------
11,560 7.49

FLOODS OF JANUARY-FEBRUARY 1957 IN KENTUCKY
Gage height, in feet, and discharge, in cubic feet per second, at indicated time, 1957
A113
Hour
Jan. 26
12 p.m...
Jan. 27
6 a.m.... 12 m ._..
12 p.m...
Jan. 28
8........12 m .... 4 p.m.... 8........12 p.m...
Jan. 29
4 a.m.... 8 __ __ .12 m .... 4 p.m_... 8........12 p.m...
Jan . 30
6 -a.m....
Gage height
7.92
7.60 7.46 7.567.92
8.419.099.89
11.48 16.8718.55
20.25 23.0026.75 28.00 28.4728.63
28.91
Dis charge
4,220
3,900 3,760 3,8604,220
4,7505,5006,380 8,180
15,20017,700
20,300 24,70031,700 34,200 35,20035,600
36,200
Hour
Jan. 30 Con.
12 m .....
12 p.m....
Jan. 31
8 ___ ____12 m .....
8 __ .. ____10_... ....ll-_---_-.12 p.m....
8___._____
12 p.m-...
Feb. 2
12 m .....12 p.m....
Feb. 3
12 m .....
Gage height
29.3830.1031.03
31.7732.5233.1333.5233.7433.7733.7833.76
33.6833.4932.9532.23
30.8629.31
27.28
Dis charge
37,20038,60041,200
43,30045,50047,40048,80049,50049,60049,70049,600
49,30048,70046,80044,600
40,80037,100
32,800
Hour
Feb.. 3 Con.
Feb. 4
6 a.m.... 12 m ..._12 p.m...
Feb. 5
12 m ....
12 p.m...
Feb. 6
12 m ....
12 p.m...
reb. 7
6 a.m.... 12 m _.._6 p.m.... 12 p.m...
Gage height
26.1525.11
24.15 23.3221.59
19.3818.0516.42
12.5910.92
9.77
9.14 8.848.87 9.26
Dis charge
30,50028,500
26,800 25,30022,400
19,00017,00014,600
9,5107,5106,250
5,550 5,2205,260 5,690
80. CUMBERLAND RIVER AT CUMBERLAND FALLS, KY.
Location. Lat 36°50'14", long 84°20'36", on left bank 700 ft downstream from bridge onState Highway 90 and 1,200 ft upstream from Cumberland Falls, Whitley County.
Drainage area. 1,977 sq mi. Gage-height record. Water-stage recorder graph, except Jan. 1 7. Datum of gage is
825.49 ft above mean sea level, Sandy Hook datum. Discharge record. Stage-discharge relation defined by current-meter measurements.
Discharge for period Jan. 1 7 estimated on basis of recorded range in stage andrecords for stations on nearby streams.
Maxima. January-February 1957: Discharge, 57,400 cfs 3 p.m. Jan. 29 (gage height,14.55 ft).
1907-11, 1915 to December 1956: Discharge, 59,600 cfs Jan. 28, 1918 (gage height,15.5 ft).
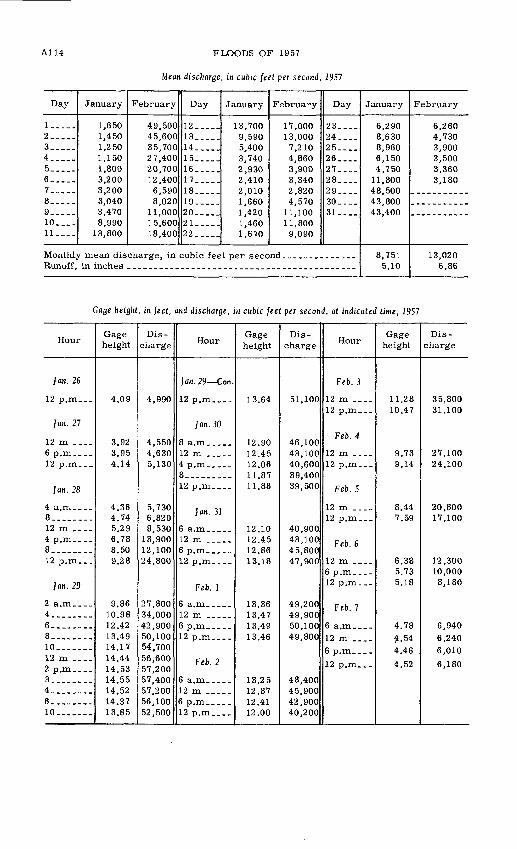
A114 FLOODS OF 1957
Mean discharge, in cubic feet per second, 1957
Day
1. __ .2____.3. ....4_.___5_..__6_ ....7 __ ..8. __ .9 __ .10 __ . 11..-.
January
1,650 1,450 1,250 1,150 1,800 3,200 3,200 3,040 3,470 8,990
13,800
Monthly mean dis Runoff, in inches
February
49,500 45,600 35,700 27,400 20,700 12,400 6,590 8,020
11,000 15,600 18,400
Day
12 ___..13_____14.. __15 ___16 .....17_____18 __ .19 .....20 .....21. __ .22.....
January
13,700 9,590 5,400 3,740 2,930 2,410 2,010 1,660 1,420 1,460 1,670
charge, in cubic feet per seco
February
17,000 13,000
7,210 4,860 3,900 3,340 2,820 4,570
11,100 11,800 9,090
Day
23 .... 24. ... 25.... 26 .... 27____ 28. ... 29 ....30_...31. ...
January
6,290 8,630 8,960 6,150 4,750
11,800 48,50043,80043,400
8,751 5.10
February
6,260 4,730 3,900 3,500 3,360 3,180
13,020 6.86
Goge height, in feet, and discharge, in cubic feet per second, at indicated time, 1957
Hour
Jan. 26
12 p.m...
Jan. 27
12 m ....6 p.m....12 p.m...
Jan. 28
4 a.m____ 8 __ ....12 m ....4 p.m....8. _______12 p.m...
JOB. 29
2 a.m....4.. __ ..6__ ______8 __ __ .10 __ ....12 m ____ 2 p.m.... 3. _______4. ___ ._6 __ ....10 __...__
Gage height
4.09
3.923.954.14
4.36 4.745.296.788.509.28
9.8610.9812.4213.4914.1714.44 14.53 14.5514.5214.3713.85
Dis charge
4,990
4,5504,6305,130
5,730 6,8208,530
13,90012,10024,800
27,80034,00042,90050,10054,70056,600 57,200 57,40057,20056,10052,500
Hour
Jan. 29 Con.
12 p.m....
Jan. 30
12 m .....
8 ____ ...12 p.m....
Jan. 31
12 m __ .
12 p.m....
Feb. 1
12 m .....
12 p.m_...
Feb. 2
12 m __ ._
12 p.m __ .
Gage height
13.64
12.9012.4512.0611.8711.88
12.1012.4512.8613.18
13.361 } d.7
13.4913.46
1 } 9 H
12.8712.4112.00
Dis charge
51,100
46,10043,10040,60039,40039,500
40,90043,10045,80047,900
49,20049 90050,10049,800
48,40045,90042,90040,200
Hour
Feb. 3
12 m .... 12 p.m...
Feb. 4
12 m ....12 p.m___
Feb. 5
12 m ....
Feb. 6
12 m .... 6 p.m.___ 12 p.m...
Feb. 7
12 m _ __
12 p.m...
Gage height
11.28 10.47
9.739.14
8.44 7.59
6.38 5.73 5.18
4.784 54
4.46
4.52
Dis charge
35,800 31,100
27,10024,100
20,800 17,100
12,300 10,000 8,180
6,9406,2406,010
6,180

FLOODS OF JANUARY-FEBRUARY 1957 IN KENTUCKY A115
81. LAUREL RIVER AT CORBIN, KY.
Location. Lat 36°51'09", long 84°07'38", on left bank 200 ft downstream from bridge on State Highway 312, three-quarters of a mile northwest of Corbin city boundary, Whitley County, and 1.0 mile downstream from Lynn Camp Creek.
Drainage area. 201 sq mi.Gage-height record. Water-stage recorder graph except Feb. 4 7; graph for Feb. 4 5
drawn from one staff gage reading Feb. 5, trend of recorder graph, and shape of re cession. Datum of gage is 965.05 ft above mean sea level, Sandy Hook datum.
Discharge record. Stage-discharge relation defined by current-meter measurements below 9,000 cfs and contracted-opening measurement at 16,200 cfs. Discharge for Feb. 6, 7 estimated on basis of weather records and records for stations on nearby streams.
Maxima. January-February 1957: Discharge, 16,200 cfs 3:30 p.m. Jan. 29 (gage height, 19.30 ft).
1922-24, 1942 to December 1956: Discharge, 14,400 cfs Jan. 8, 1946 (gage height, 17.94 ft).
Floods of 1911, 1913, and 1922, reached a stage of 19 ft, from information by Corps of Engineers.
Mean discharge, in cubic feet per second, 1957
Day
1 _____2 _____3__.-_4_ __ ,5. ____6. __7_ __ .8. __ .g10 __ . 11 __ .
January
153 120
93 106 381 406 345 294 930
2,270 1,900
Monthly mean dis Runoff, in inches
February
2,160 2,590 1,740 1,010
658 700 850 940
1,640 3,000 2,290
Day
12-.-..13 ___ .14 __ ..15 ___ .16 __ _.17..._.18---_.199fl
21. __ .22 __ .
January
1,020 580 412 312 267 188 164 126 128 204 463
charge, in cubic feet per secc
February
1,140 606 439 340 302 252 212 586
1,320 840 642
Day
23 .... 24 ___ 25. ___ 26__._ 27 .___ 28. __ 29 ____ 30 __ 31 __ .
January
3,460 2,420 1,090
610 716
2,330 13,000
9,120 2,590
1,490 8.55
February
502 418 370 382 412 361
954 4.94
Gage height, in feet, and discharge, in cubic feet per second, at indicated time, 1957
Hour
Jan. 26
12 p.m...
Jan. 27
6 a.m___- 12 m --._ 6 p.m____ 12 p.m-__
Jan. 28
12 m ---_
Gage height
3.91
3.92 4.11 4.75 5.58
6.21 7.30
Dis charge
504
508 584 875
1,290
1,630 2.280
Hour
Jan. 28 Con.
12 p.m.___
Jan. 29
2 __ -. __ .3 ______4 _______6__. ______8 ______10 ___ _-.12 m _ __
Gage height
8.55 8.86
9.13 10.13 12.55 13.94 15.56 17.11 18.06 18.66
Dis charge
3,100 3,350
3,570 4,530 7,420 9,230
11,300 13,400 14,600 15.400
Hour
Jan. 29 Con.
2 p.m_-__ 3:30 _____5 __ .6_. ___ _8-_-.--_-10 _______12 p.m_._
Jan. 30
6 p.m_._- 12 p.m__.
Gage height
19.14 19.30 19.25 19.11 18.75 18.34 17.83
15.90 11.76 9.69
Dis charge
16,000 16,200 16,100 16,000 15,500 15,000 14,300
11,800 6,400 4,080

A116 FLOODS OF 1957
Gage height, in feet, and discharge, in cubic feet per second, at indicated time, 1957 Cent.
Hour
Jan. 31
12 m __._6 p.m.... 12 p.m___
Feb. 1
6 a.m____ 12 m __ .6 p.m____ 12 p.m___
Gage height
8.397.586.99 6.74
6.69 6.887.71 8.22
Dis charge
2,9702,4102,020 1,870
1,840 1,9602,500 2,850
Hour
Feb. 2
12 m .....12 p.m....
Feb. 3
12 m .....12 p.m....
Gage height
8.107.947.23
6.545.76
Dis charge
2,7702,6602,170
1,7501,310
Hour
Feb. 4
12 m ....12 p.m...
Feb. 5
12 m _.__ 12 p.m...
Gage height
5.134.65
4.36 4.30
Dis charge
995755
634 610
82. WOOD CREEK NEAR LONDON, KY.
Location. Lat 37°09'40", long 84°06'43", on left bank 50 ft downstream from bridge on U.S. Highway 25, 0.2 mile upstream from Peacock Branch, 2.8 miles northwest of London, Laurel County, and about 12 miles upstream from mouth.
Drainage area. 3.89 sq mi.Gage-height record. Water-stage recorder graph. Datum of gage is 1,123.50 ft above
mean sea level, unadjusted.Discharge record. Stage-discharge relation defined by current-meter measurements
below 160 cfs and extended above by logarithmic plotting.Maxima. January-February 1957: Discharge, 306 cfs 8:30 a.m. Jan. 29 (gage height,
4.97 ft).1953 to December 1957: Discharge, 506 cfs Feb. 17, 1956 (gage height, 6.23 ft).
Mean discharge, in cubic feet per second, 1957
Day
1 __ -_2_ __ _3 __ .4 ___ _5 __ .6 .....7. __8 _____9-.--.10 .... ll-.__
January
4.7 4.1 3.9 4.7 5.4 4.5 4.3 8.0
23 41 19
Monthly mean dis Runoff, in inches
February
63 49 29 18 18 16 16 24 60 99 33
Day
12. ____13. ....14 _____15 _____16 _____17 _____18 __ _19 __ ..20.__._21. __ .22 _____
January
14 11 9.1 7.8 6.9 5.7 4.9 4.5 4.7 5.7
57
charge, in cubic feet per seco
February
20 14 11 8.6 7.2 6.3 5.4
15 11 11 11
nd
Day
23 ___ 24 ___ 25 __ 26---.27 ____ 28 .... 29 ____ 30 _.__ 31. __
January
58 23 17 12 18 60 187 74 44
24.1 7.14
February
9.1 8.2 7.5 8.6 6.9 7.2
21.2 5.67

FLOODS OF JANUARY-FEBRUARY 1957 IN KENTUCKY A117
83. ROCKCASTLE RIVER AT BILLOWS, KY.
Location. Lat 37°10'16", long 84°17'46", on left bank 200 ft upstream from bridge on State Highway 8~0 at Billows, Rockcastle County, 1.0 mile downstream from Hawk Creek, 1.0 mile upstream from Pine Creek, and 13 miles west of London.
Drainage area. 604 sq mi.Gage-height record. Water-stage recorder graph. Datum of gage is 802.90 ft above
mean sea level, datum of 1929.Discharge record. Stage-discharge relation defined by current-meter measurements.Maxima. January-February 1957; Discharge, 25,000 cfs 3:30 ? m. Jan. 30 (gage height,
31.90 ft).1936 to December 1956: Discharge, 46,800 cfs June 29, 1947 (gage height, 45.48 ft). Flood of January 1913 reached a stage of about 40 ft, from information by Corps of
Engineers.
Mean disct> nr?c ' -ubic feet per second, 1957
Day
1-----2----_
4 .....56 .....7_____8.-_-_
10---.11 ....
January
400 331 265 252 337 451 433 439
1,310 7,090 4,570
Monthly mean dis Runoff, in inches
February
4,020 7,850 3,840 2,370 1,720 2,390 2,340 2,340 4,640
11,200 7,560
Day
12 .....13 .....14 .....15. ....16 __ .17. __ .18 .....19. __ -9fi
21 __ .22 .....
January
2,280 1,570 1,110
832 688 522 439 373 355 376
1,660
charge, in cubic feet per seco
February
2,840 1,930 1,380 1,040
860 708 588 784
1,760 1,560 1,580
Day
23. ... 24----25- ... 26. ... 27. ... 28. ...9Q
30- ... 31. ...
January
15,300 7,630 2,460 1,660 1,320 4,270
17,80021,100
5,420
3,324 6.34
February
1,520 1,360 1,210 1,190 1,430 1,300
---------
2,618 4.51
84. CANE BRANCH NEAR PARKERS LAKE, KY.
Location. Lat 36°52'04", long 84°26'57",on left bank 2,100 ft upstream from confluencewith West Fork,2.5 miles northeast of Parkers Lake, McCreary County, and 2.6 mileseast of Greenwood.
Drainage area. 0.67 sq mi. Gage-height record. Water-stage recorder graph. Datum of gage is 979.4 ft above mean
sea level, datum of 1929 (levels by U.S. Forest Service). Discharge record. Stage-discharge relation defined by current-meter measurements
below 40 cfs. Maxima. January-February 1957: Discharge, 198 cfs 3:30 a.m. Jan. 29 (gage height,
2.43 ft, backwater from ice).February to December 1956: Discharge, 98 cfs Apr. 6 (gage height, 1.57 ft).

A118 FLOODS OF 1957
Mean discharge, in cubic feet per second, 1957
Day
1-----2__ ...3.. ...4.....5.. ...6.....7.....8.....9-__._10---. 11_.__
January
0.26 .20 .18 .82
1.68 1.19
.94
.78 5.5 6.5 2.6
Monthly mean dis Runoff, in inches
February
8.3 .4.9 2.8 1.89 2.8 2.7 2.5 2.5 2.7 3.7 2.4
Day
12.... 13.... 14 __ . 15-... 16--.. 17_... 18 __ . 19-..- 20.... 21.... 22 __ .
January
1.74 1.25
.88
.78
.60
.49
.42
.39
.48
.94 10.6
charge, in cubic feet per secc
February
1.89 1.46 1.12
.88
.83
.68
.64 3 3.5 2.4 2.04
Day
23 __ .24.... 25_...26 .... 27 .... 28-... 29 ____ 30.--.31.--.
January
8.5 2.9 1.89 1.32 2.2
12.2 84
6.13.7
5.23 8.99
February
1.74 1.46 1.25 1.43 1.12 1.73
2.30 3.57
85. HELTON BRANCH AT GREENWOOD, KY.
Location. Lat 36°53'08", long 84°28'56", on left bank 250 ft upstream from mouth and 1mile northeast of Greenwood, McCreary County.
Drainage area. 0.85 sq mi. Gage-height record. Water-stage recorder graph. Datum of gage is 993.8 ft above mean
sea level (levels by U.S. Forest Service). Discharge record. Stage-discharge relation defined by current-meter measurements
below 65 cfs. Maxima. January-February 1957: Discharge, 136 cfs 2:40 a.m. Jan. 29 (gage height,
1.35 ft).January to December 1956: Discharge, 76 cfs Feb. 18 (gage height, 1.21 ft); gage
height, 1.46 ft Jan. 30 (backwater from debris).
Mean discharge, in cubic feet per second, 1957
Day
!-__--2_____3.....4.....5_____6. ....7.....8.. ...9.....10---. 11-.--
January
0.39 .31 .29 .59
1.18 .99 .81 .69
5.9 8.2 3.6
Monthly mean dis Runoff, in inches
February
11.8 9.4 5.0 2.9 3.3 3.4 3.1 2.9 3.7 5.9 4.0
Day
12-....13-....14.....15 .._..16.....17. __ .18.. ...1920---.-21_____22 __ ..
January
1.9 1.3 .99 .89 .73 .7 .6 .5 .6 .85
9.0
charge, in cubic feet per seco
February
2.5 1.8 1.3 1.18 1.08 .94 .89
3.5 4 2.5 2.35
Day
23....24. ... 25.... 26-... 27.._. 28 .... 29.--. 30-... 31-.-.
January
14.9 4.3 2.3 1.45 2.1
10.8 36 12.7 6.5
4.26 5.78
February
2.1 1.6 1.45 1.8 1.8 2.1
3.15 3.86

FLOODS OF JANUARY-FEBRUARY 1957 IN KENTUCKY A119
86. BUCK CREEK NEAR SHOPVILLE, KY.
Location. Lat 37°12'38", long 84°27'52", on right bank on downstream side of bridge on State Highway 461, 0.2 mile downstream from Brushy Creek, 3.7 miles north of Shop- ville, and 11.5 miles northeast of Somerset, Pulaski County.
Drainage area. 165 sq mi.Gage-height record. Water-stage recorder graph except Jan. 18,19, Feb. 4 14. Datum
of gage is 835.35 ft above mean sea level, unadjusted.Discharge record. Stage-discharge relation defined by current-meter measurements
below 7,000 cfs and by contracted-opening measurement at 14,900 cfs in November 1957. Discharge for Jan. 18, 19, Feb. 8 14 estimated on basis of 1 discharge measure ment, weather records, recorded range in stage, and records for stations on nearby streams.
Maxima. January-February 1957: Discharge, 9,710 cfs 3:45 p.m. Jan. 29 (gage height, 15.19 ft).
1952 to December 1956: Discharge, 10,800 cfs Feb. 18, 1956 (gage height, 15.72 ft).
Mean discharge, in cubic feet per second, 1957
Day
1_ __2_____3_. __4--.-_5---.-6.....7 __ ..8--__.g10 ....11--.-
January
115 92 78 88
149 131 115 105
1,360 2,100
780
Monthly mean dis Runoff, in inches
February
1,830 1,910
872 578 660
1,040 775 828
2,000 3,500 1,000
Day
12 .... 13_... 14. __ 15 __ 16 .... 17 __ . 18 __ . 19-... 20. __ 21.-._ 22._._
January
492 362 270 218 172 115 105
90 98
134 1,430
charge, in cubic feet per seco
February
660 474 362 284 256 211 183 444 456 380 448
Day
23. __ 24. __ 25 __ 26.... 27 __ _ 28 __ . 29.--.30__-_31. __
January
3,860 877 564 407 484
2,300 7,0602,9501,080
909 6.35
February
438 384 331 380 412 394
768 4.84
87. NEW RIVER AT NEW RIVER, TENN.
Location. Lat 36°23'08", long 84°33'17", on left bank at town of New River, Scott County,700 ft downstream from Phillips Creek, 1,000 ft downstream from bridge on U.S.Highway 27, 1.7 miles downstream from Brimstone Creek, and at mile 8.6.
Drainage area. 382 sq mi. Gage-height record. Water-stage recorder graph except 6a.m. Jan. 30 to 9 a.m. Feb. 8
for which graph was estimated on basin of recorded range in stage, floodmark in well,weather records, and records for Clear Fork near Robbins. Datum of gage is 1,092.67ft above mean sea level, datum of 1929.
Discharge record. Stage-discharge relation defined by current-meter measurementsbelow 26,000 cfs.
Maxima. January-February 1957: Discharge, 29,200 cfs 5:30 a.m. Jan. 29 (gage height,26.00 ft).
1934 to December 1956: Discharge, 44,300 Feb. 3, 1939 (gage height, 33.58 ft). Maximum stage known, 41.2 ft Mar. 23, 1929, on old U.S. Weather Bureau gage
1,200 ft upstream and at datum 3.41 ft higher.Flood of March 1902 was approximately 7 ft lower than that of Mar. 23, 1929, from
profile by Corps of Engineers.
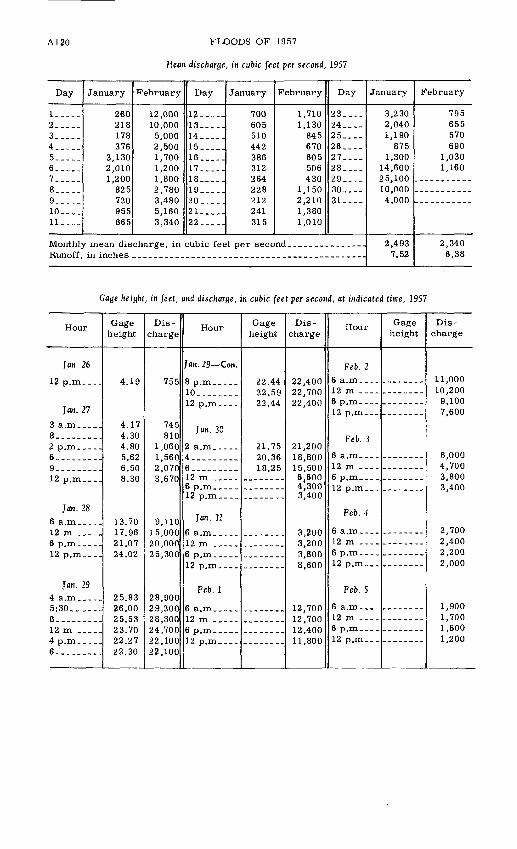
A120 FLOODS OF 1957
Meon discharge, in cubic feet per second, 1957
Day
!..___2.____3.....4.....5---..6.....7_____8.....9----.10.... 11....
January
260 218 178 376
3,130 2,010 1,200
825 720 955 865
Monthly mean dis Runoff, in inches
February
12,000 10,000
5,000 2,500 1,700 1,200 1,800 2,780 3,480 5,160 3,340
Day
12 __ .13 __ ..14--__.15._...16.....17.....18.....1920....-21 __ ..22 __ ..
January
700 605 510 442 386 312 264 228 212 241 315
charge, in cubic feet per seco
February
1,710 1,130
845 670 605 506 430
1,150 2,210 1,380 1,010
Day
23 __ . 24..-.25 .... 26 .... 27 .... 28 __ .29 ....30 ....31 __ -
January
3,230 2,040 1,190
875 1,300
14,600 25,10010,0004,000
2,493 7.52
February
795 655 570 690
1,030 1,160
2,340 6.38
Gage height, in feet, and discharge, in cubic feet per second, at indicated time, 1957
Hour
Jan. 26
12 p.m....
Jan. 27
8 ___ _ .
6. ___ ...g12 p.m__._
Jan. 28
12 m . _ .
12 p.m....
Jan. 29
^ ^n
8. _____ .12 m .....
6 __ ......
Gage height
4.19
4.17 4.30 4.80 5.62 6.508.30
13.70 17.96 21.07 24.02
25.83 26.00 25.53 23.70 22.27 22.30
Dis charge
755
745 810
1,060 1,560 2,0703,670
9,110 15,000 20,000 25,300
28,900 29,200 28,300 24,700 22,100 22,100
Hour
Jan. 29 Con.
8 p.m..... 10--.-.--.12 p.m....
Jan. 30
4. ._...___6.. __ ....12 m .....
12 p.m....
Jar.. 3J
12 m .....
Feb. 1
12 m .....
Gage height
22.44 22.59 22.44
21.75 20.36 18.25
Dis charge
22,400 22,700 22,400
21,200 18,800 15,500 6,600 4,300 3,400
3,200 3,200 3,600 8,600
12,700 12,700 12,400 11,800
Hour
Feb. 2
12 m ....
Feb. 3
6 a.m....12 m ....
Feb. 4
6 a.m....12 m --.-6 p.m....12 p.m...
Feb. 5
6 a.m.--_12 m __ .6 p.m..-.12 p.m...
Gage height
Dis charge
11,000 10,200
9,100 7,600
6,000 4,700 3,800 3,400
2,700 2,400 2,200 2,000
1,900 1,700 1,600 1,200

FLOODS OF JANUARY-FEBRUARY 1957 IN KENTUCKY A121
88. CLEAR FORK NEAR ROBBINS, TENN.
Location. Lat 36°23 ] 18", long 84°37'49", on right bank 300 ft downstream from BurntMill Bridge, 3.3 miles northwest of Robbins, Scott County, and at mile 3.7.
Drainage area. 272 sq mi. Gage-height record. Water-stage recorder graph except 6 a.m. Jan. 29 to 9 a.m. Jan.
31 for which graph was estimated on basis of weather records and records for NewRiver at New River. Datum of gage is 1,081.46 ft above mean sea level, Sandy Hookdatum.
Discharge record. Stage-discharge relation defined by cur rent-meter measurements.Affected by ice Jan. 18-20.
Maxima. January-February 1957: Discharge, 15,000 cfs 8 p.m. Jan. 28 (gage height,12.90 ft).
1930 to December 1956: Discharge, 34,000 cfs Feb. 3, 1939 (gage height, 18.5 ft, atsite 300 ft upstream and at datum 1.00 ft higher), on basis of slope-area measurement.
Maximum stage known, 22.1 ft Mar. 23, 1929, at site 300 ft upstream and datum 1.00ft higher, from information by local residents.
Mean discharge, in cubic feet per second, 1957
Day
1-----2.. ...3----.4___._5_._._6_____7.....8 __ ..9_____10.... 11....
January
232 198 165 234
1,400 1,110
790 571 560 842 742
Monthly mean dis Runoff, in inches
February
6,560 5,240 2,250 1,470 1,160
976 1,130 1,520 1,880 2,310 1,950
Day
12____.13 ___ .14. ....15. ....16____.17. __ .18. __ .1 Q
20.....21.....22
January
576 485 407 343 318 259 223 205 205 256 , 432
charge, in cubic feet per seco
February
1,280 907 676 530 604 525 446
1,140 2,200 1,400
969
Day
23. ... 24. ... 25-... 26. ...27. ... 28 .... 29. ...30 ....31. ...
nd--.- __ _____ .
January
1,860 1,320
934 718
1,000 8,850
11,4004,9003,830
1,463 6.20
February
718 571 490 571 637 598
1,454 5.57
Gage height, in feet, and discharge, in cubic feet per second, at indicated time, 1957
Hour
Jan. 26
Jan. 27
6 _ .....
10 _ ....12 m .._.
4-._._...6.__- __ .8 __ __ .10 __ ....
Gageheight
3 "31
3 9 Q
3 303 0 c
3 443.563.76A. r>94.304.695 045 RR
Dis charge
620
604615648694766894
1,0701,2801,5701,8402 9 Qfi
Hour
Jan. 28
4 ___ . ...6_. .......8-. __ --.10--------12 m -----
4. ___ ...6-._ ......8.. ___ ._10 ___ ...12 p.m....
Jan. 29
Gage height
6.257157 958 "i9
8 979.55
10.3511.3519 £,£,
1 9 Qfl
12.7812.78
12.67
Dis charge
2,9804,1205,2806,1906,9107,9009 39n
11,30014,10015,00014,70014,700
14,500
Hour
Jan. 29 Con. 6 a.m____8-. __ --.10. __ -.12 m .--.
4.. ___ -.6.. __ ...8.. ......10. __ ...12 p.m...
Jan 30
12 m ---.
Gage height
12.30
Dis charge
13,50012,80012,20011,40011,00010,200
9,2308,5808,0607,470
5,8404,580

A122 FLOODS OF 1957
Gage height, in feet, and discharge, in cubic feet per second, at indicated time, 1957 Continued
Hour
Jan. 30-Con.
12 p.m...
Jan. 31
3 a.m....5__ ......7........9 __ .....
8. ....._.12 p.m...
Feb. 1
6 __ ....8 ._.__...
Gage height
6.607.107.397.83
7.998.488.588.58
Dis charge
3,7803,290
3,1503,1503,2203,3904,0504,4605,100
5,3406,1306,2906,290
Hour
Feb. 1-Con.
4 __ ......6.........8__. ______11--------
Feb. 2
4--_--.___6.........8. ...___._10.. ______12 m _____
4. _._...__6 ____ ...8. ..._..._
Gage height
8.608.909.209.449.679.54
9.429.128.808.448.097.747.467.176.966.72
Dis charge
6,3206,8007,3007,7108,1007,880
7,6707,1606,6406,0605,5004,9704,5504,1503,8603,550
Hour
F<M>.2-Con.
10 p.m....12 p.m.--.
Feb. 3
12 m .. ...
12 p.m_-__
Feb. 4
12 m _--__12 p.m.___
Feb. 5
12 m ._---12 p.m....
Gage height
6.526.32
5.845.445.144.88
4.544.31
4.153.99
Dis charge
3,2903,050
2,5402,1701,9201,710
1,4501,280
1,1601,050
89. SOUTH FORK CUMBERLAND RIVER NEAR STEARNS, KY.
Location. Lat 36°37'37",long 84°32',on right bank at mouth of Bear Creek, 1,600 ft up stream from Salt Branch and 5.5 miles southwest of Stearns, McCreary County. Rec ords include flow of Bear Creek.
Drainage area. 954 sq mi, includes that of Bear Creek.Gage-height record. Water-stage recorder graph, except Jan. 28 30, when graph was
reconstructed from numerous radio gage readings and floodmark. Datum of gage is 764.81 ft above mean sea level, datum of 1929, supplementary adjustment of 1936.
Discharge record. Stage-discharge relation defined by current-meter measurements.Maxima. January-February 1957: Discharge, 61,500 cfs 12:30 p.m. Jan. 29 (gage
height, 36.25 ft, from floodmark).1942 to December 1956: Discharge, 69,600 cfs Feb. 13, 1948 (gage height, 38.50 ft). Maximum stage known, 52.9 ft in March 1929, from information by local residents.

FLOODS OF JANUARY-FEBRUARY 1957 IN KENTUCKY
Mean discharge, in cubic feet per second, 1957
A123
Day
l..-_-2.-.--3__--.4 _____5---..6_ ___7 __ _8 __ .g10. ___ 11--..
January
770 660 556 568
3,600 4,680 3,160 2,260 2,790 4,330 3,550
Monthly mean dis Runoff, in inches
February
21,700 20,300
8,280 5,000 3,870 3,380 3,590 5,620 6,770 9,630 8,280
Day
12. ___13 ___ .14 ___ .15 __ .16 ___ _17_ __ _18 _____19 ___ .9n21__ ___22 __ __
January
2,530 1,990 1,610 1,340 1,160
955 770 655 630 730
1,270
charge, in cubic feet per seco
February
4,760 3,340 2,520 1,960 1,810 1,660 1,390 3,160 7,100 4,640 3,330
Day
23. __ 24.---25 ____ 26 ____ 27.... 28 ____ 29.--- 30. ___ 31 ___
nd. _______ __ .
January
7,000 5,970 3,630 2,780 2,780
20,800 55,500 32,300 11,500
5,898 7.13
February
2,580 2,020 1,710 1,720 2,220 2,490
5,172 5.65
90. PITMAN CREEK AT SOMERSET, KY.
Location. Lat 37°07'01", long 84°35'31", on right bank 0.1 mile downstream from DryBranch, 0.5 mile upstream from Caney Fork, and 1.9 miles northeast at Somerset,Pulaski County.
Drainage area. 31.3 sq mi. Gage-height record. Water-stage recorder graph. Datum of gage is 867.34 ft above
mean sea level, datum of 1929. Discharge record. Stage-discharge relation defined by current-meter measurements
below 1,500 cfs. Maxima. January-February 1957; Discharge, 2,260 cfs 9:15 p.m. Jan. 22 (gage height,
7.43 ft).1953 to December 1956: Discharge, 2,430 cfs Mar. 21, 1955 (gage height, 7.58 ft).
Mean discharge, in cubic feet per second, 1957
Day
1----.2. __ .3 __ .4. __ .5---.-6 __ ..7. ____8 ___ .
10 __ . 11 __ _
January
22 18 16 21 37 26 24 21
412 412 167
Monthly mean dis Runoff, in inches
February
436 290 188 114 181 188 160 188 360 684 230
Day
12.....i 314 _____15 _____16 _____17 _____18 _____1 Q
20. ____21 _____22. __ _
January
109 75 57 46 39 26 24 17 21 29
654
charge, in cubic feet per secc
February
133 93 68 56 49 41 36
146 102 93
100
Day
23. __ .24.--..25._-_.26. __ .27. __ .28 __ .29 _____SO.....31
January
600 195 125 82
112 576
1,300 392 262
191 7.03
February
8672 65 72 65 70
156 5.19

A124 FLOODS OF 1957
91. LAKE CUMBERLAND NEAR JAMESTOWN, KY.
Location. Lat 36°52'09", long 85°08'45", in pylon of Wolf Creek dam on Cumberland River, 10 miles southwest of Jamestown, Russell County.
Drainage area. 5,789 sq mi.Gage-height record. Water-stage recorder graph. Datum of gage is at mean sea level,
Sandy Hook datum.Maxima. January-February 1957: Contents, 2,313,200 cfs-days 3 a.m. to 10 a.m. Feb. 13
(elevation 734.40 ft).1950 to December 1956: Contents, 2,505,800 cfs-days Dec. 23, 1951 (elevation,741.32
ft).Remarks. Reservoir is formed by earth embankment and concrete gravity dam sur
mounted by 10 taintor gates 37 ft high by 50 ft wide. Final closure of dam made Aug. 7, 1950. Total capacity at elevation 760.00 ft (top of gates) is 3,070,000 cfs-days, of which 1,056,000 cfs-days above elevation 723.00 ft (crest of spillway) are reserved for flood control and 1,080,000 cfs-days between elevations 673.00 ft (minimum power pool) and 723.0 ft will be used for power production. Figures given herein represent total contents, of which 934,000 cfs-days below elevation 673.00 ft are dead storage. Reservoir is used for flood control, power, and navigation. Gage-height record and contents furnished by Corps of Engineers.
Elevation, in feet, and contents, in cfs-days at 12 p.m. of indicated day, 1957
Day
I....2. __3 ....4____5. ...6. ...7. ...8 ....9. ...-10...11 ...12 ...13 ...14...15 ...16. __
January
Elevation
697.13696.42695.78695.44695.25695.32695.19694.86695.51696.87697.55698.02698.53698.31697.81697.19
Contents
1,409,8001,394,6001,381,0001,373,8001,369,7001,371,2001,368,5001,361,5001,375,3001,404,2001,418,8001,428,9001,439,9001,435,2001,424,4001,411,100
February
Elevation
724.97728.00729.46730.28730.70730.81730.67730.77731.38733.07734.10734.38734.32733.92733.35732.70
Contents
2,064,2002,142,6002,180,9002,202,6002,213,7002,216,6002,212,9002,215,6002,231,8002,277,2002,305,1002,312,7002,311,0002,300,2002,284,7002,267,200
Day
17___18 ...19.._20...21 ...22 ...23 ...24...25 ...26...27. __28 ...29 ...3031 ...
January
Elevation
696.38695.62694.96694.54693.88694.89697.38698.32698.71698.76698.79701.33713.64719.22721.70
Contents
1,393,8001,377,6001,363,6001,354,7001,340,9001,362,1001,415,1001,435,4001,443,8001,444,9001,445,5001,501,1001,783,6001,919,3001,981,200
February
Elevation
732.01731.15731.10731.32731.30731.07730.66730.12729.53728.92728.35727.78
_______
__..._.
Contents
2,248,6002,225,7002,224,3002,230,2002,229,7002,223,5002,212,6002,198,3002,182,7002,166,6002,151,7002,136,800________
________
Supplemental record. Dec. 31, 1956, 12 p.m., 697.49 ft, 1,417,500 cfs-days.

FLOODS OF JANUARY-FEBRUARY 1957 IN KENTUCKY A125
92. CUMBERLAND RIVER NEAR ROWENA, KY.
Location. Lat 36°53'02",long 85°08'22",on right bank, 1.5 miles downstream from WolfCreek Dam, 1.9 miles upstream from Blackfish Creek, 1.9 miles west of Rowena,Russell County, and at mile 459.4.
Drainage area. 5,790 sq mi. Gage-height record. Water-stage recorder graph. Datum of gage is 540.81 ft above
mean sea level, Sandy Hook datum. Discharge record. Stage-discharge relation defined by current-meter measurements
below 50,000 cfs. Maxima. January-February 1957: Discharge, 27,500 cfs 1 6 a.m. Feb. 22 (gage height,
21.43 ft).1939 to December 1956: Discharge, 162,000 cfs Jan. 9, 1946; gage height, 64.82 ft
Jan. 9, 1946.Maximum stage known, 69.5 ft in March 1826 from Cumberland River profile.
Remarks. Flow regulated by Lake Cumberland (see station 90).
Mean discharge, in cubic feet per second, 1957
Day
!_-__.2__ __3_. __4__ __5__ __6 _____7_____8 __ .9 ___ .10 ___ 11____
January
11,700 18,900 16,500 12,400 13,400
8,910 12,300 15,400 11,900 14,600 21,000
February
24,000 26,000 25,800 25,600 25,400 25,400 25,400 25,400 25,600 25,700 25,800
Day
12 ___13 _____14 ___15__...16 _____17 _____18. ___19__ ___20 _____21_ ____22 __ _
January
17,400 7,780
17,200 19,200 20,200 22,400 21,300 19,800 13,300 18,300 16,600
Monthly mean discharge, in cubic feet per sect Adjusted monthly discharge, in cubic feet per .
February
27,300 27,300 27,300 27,200 27,300 27,300 27,200 26,400 26,700 27,400 27,400
Day
23 ___24 ____ 25 __26 ___ 27_... 28____ 29 ___30 ____31. __
January
17,100 20,800 16,200 15,400 17,600 14,900
9,87021,20023,800
16,370 34,550
February
27,300 27,300 27,200 27,100 27,100 27,100
26,500 32,060
93. EAST FORK OBEY RIVER NEAR JAMESTOWN, TENN.
Location. Lat 36°24'58", long 85°01'35", on right bank, 200 ft upstream from bridge onState Highway 52, 0.5 mile upstream from Poplar Cove Creek, 5.3 miles west ofJamestown, Fentress County, and 12.8 miles upstream from confluence with WestFork.
Drainage area. 202 sq mi (includes 6 sq mi without surface drainage). Gage-height record. Water-stage recorder graph except 6 p.m. Feb. 10 toll a.m. Feb.
17 for which graph was constructed based onbi-hourly radio gage readings. Datum ofgage is 680.30 ft above mean sea level, Sandy Hook datum.
Discharge record. Stage-discharge relation defined by current-meter measurements. Maxima. January-February 1957; Discharge, 16,900 cfs 4:30 p.m. Jan. 29 (gage height,
19.41 ft).1942 to December 1956: Discharge, 28,300 cfs Feb. 13, 1948 (gage height, 27.20 ft). Flood of March 1929 reached a stage of about 30 ft, from profile by Corps of
Engineers.
690-137 O - 64 - 9

A126 FLOODS OF 1957
Mean discharge, in cubic feet per second, 1957
Day
1.. ...2.. ...3 .....4 __ .5 __ .6 .....7.. ...8.. ...9.. ...10 .... 11....
January
174 145 123 163 927 752 541 413 437 666 601
Monthly mean dis Runoff, in inches
February
5,190 3,370 1,460
940 779 671 797
1,040 1,320 2,100 1,370
Day
12 __ .13. __ .14 __ .15. __ .16. __ .17.....18 __ .19 __ .20 __ .21. __ .22. __ .
January
492 410 345 291 256 210 183 156 150 185 513
charge, in cubic feet per secc
February
856 640 514 420 489 454 410
1,210 1,590
935 684
>nd
Day
23 __94.
25 . 26. __27.... 28....29 ....30 ____ 31. __
January
1,930 990 680 522 688
7,110 12,8004,370 2,590
1,284 7.33
February
541 458 407 424 451 471
1,071 5.52
Gage height, in feet, and discharge, in cubic feet per second, at indicated time, 1957
Hour
Jan. 26
12 p.m...
Jan. 27
6 a.m.... 9 _...._._12 m .... 6 p.m.... 10 ____ .12 p.m__.
Jan. 28
3 a.m....6. ____ .12 m __ . 3 p.m_._. 6 __ __ .8 __ ....9:30 . ....11 __ ..__12 p.m...
Jan. 29
3 a.m.... 6 ........9____ __ .12 m __ . 3 p.m.... 4:30 .....6 .....__.12 p.m_._
Gage height
2.96
2.92 2.97 3.29 3.93 4.37 4.80
5.90 8.35
10.65 11.85 14.70 16.95 18.00 17.65 17.35
16.19 15.15 13.47 15.93 19.00 19.41 19.15 14.17
Dis charge
464
451 468 588 875
1,100 1,360
2,120 3,930 5,950 7,180
10,400 13,300 14,800 14,300 13,800
12,300 11,000 8,970
11,900 16,200 16,900 16,500
9,800
Hour
Jan. 30
9 ..12 m __ ..
9 ______ .
Jan. 31
6 ______ .9 ______ .12 m .. __ .
9 ______ .12 p.m.....
Feb. 1
8. __ .9 ___ __ .12 m .. __ .
3 ______ .
89. ...
Gage height
11.75 10.00 8.95 8.00 7.35 6.85 6.43 6.15
5.95 5.91 6.09 6.35 6.54 6.91 7.59 8.23
9.45 9.57 9.58 9.38 9.36 9.66
10.78 11.28 11.25 10.58
Dis charge
7,080 5,350 4,410 3,650 3,160 2,780 2,500 2,290
2,140 2,120 2,250 2,430 2,560 2,830 3,340 3,830
4,840 4,960 4,970 4,790 4,770 5,040 6,080 6,580 6,550 5,880
Hour
Feb. 2
3 a.m.... 6. .......9_. -._...12 m _._.3 p.m.... 6.. ......9 ___ ...12 p.m__.
Feb. 3
6 a.m.... 12 m __..6 p.m.... 12 p.m...
Feb. 4
6 a.m.__.12 m . ...6 p.m.... 12 p.m...
Feb. 5
12 m __..12 p.m...
Gage height
9.54 8.63 7.82 7.22 6.72 6.38 6.02 5.71
5.24 4.90 4.62 4.41
4.17 4.01 3.92 3.85
3.72 3.59
Dis charge
4,940 4,150 3,520 3,060 2,690 2,450 2,200 1,980
1,650 1,420 1,240 1,120
995 915 870 838
779 720

FLOODS OF JANUARY-FEBRUARY 1957 IN KENTUCKY A127
94. WEST FORK OBEY RIVER NEAR ALPINE, TENN.
Location. Lat 36°23'49", long 85°10'28", on upstream end of left pier of bridge on State Highway 52, 0.3 mile upstream from Nettlecarrier Creek, 2.4 miles east of Alpine, Overton County, and 7.8 miles above confluence with East Fork.
Drainage area. 115 sq mi (includes 34 sq mi without surface drainage).Gage-height record. Water-stage recorder graph. Datum of gage is 684.28 ft above
mean sea level, unadjusted datum of 1929.Discharge record. Stage-discharge relation defined by current-meter measurements.Maxima. January-February 1957: Discharge, 9,510 cfs 2 p.m. Jan. 29 (gage height,
12.65 ft).1942 to December 1956: Discharge, 15,100 cfs Mar. 21, 1955 (gage height, 16.30 ft). Flood of March 1929 was about 3 ft lower than that of Mar. 21, 1955, from profile
by Corps of Engineers.
Mean discharge, in cubic feet per second, 1957
Day
1. .... 2 _____3 __ _4 __ .
6 __ _7_____8 _____9 ___ .10 __ . 11 __ .
January
55 48 44 94
476 302 229 173 186 295 262
Monthly mean dig Runoff, in inches
February
2,210 1,370
658 435 329 275 394 547 615
1,040 636
Day
12 _____13 _____14 _____15 _____16 _____17. __ _18 _____19 _____20 _____21 _____22. __ .
January
222189 143 114
94 71 61 51 47 50
526
charge, in cubic feet per secc
February
418 299 232 183 196 173 153 832. 770 469 326
Day
23 ____ 24 ____ 25 ____ 26 ____ 27 ____ 28 ____ 29 .___30 ____31 ____
January
1,240 499 329 242 415
2,760 5,4401,7401,120
565 5.66
February
249 206 183 179 176 163
490 4.44
Gage height, in feet, and discharge, in cubic feet per second, at indicated time, 1957
Hour
Jan. 26
Jan. 27
10 _______12 m ____
6 ________g12 p.m ___
Jan. 28
4am6 ________810 _..__._
Gage height
1.80
1.811.872.08 2.603.003 9d
3.81
5 075 ^9
5.605.61
Dis charge
9flQ
212232302d.70
615704Qfi^
1,6201,8701,9201.930
Hour
Jan. 28-Con.
12 m _____
4 _________6 _________8 __ ______9:30 ______12 p.m __ _
Jan. 29
4 __ ______7 __ ______9 __ ______10- __ _ ___12 m _____
4 ______
Gage height
5.976.427.088.488.839.108.67
8.107.706.987.358.00
11.4012.6512.08
Dis charge
2,1402,4502,9804,3904,7705,0704,600
3,9703,5602,8903,2203,8607,8209,5108,640
Hour
Jan. 29-Con.
6 ___ __ .8 ______ .10_-._ __ .12 p.m___.
Jan. 30
4 _____ .6 ______ .8 ______ .10 _____ .12 m __ .
6 ______ .8 ______ .10 __ .12 p.m_._.
Gage height
11.009.808.707.80
6.946.295.795.445.194.954.554.404.274.104.00
Dis charge
7,3005,8604,6303,660
2,8602,3602,0301,8201,6801,5501,3301,2501,1801,1001,050
690

A128 FLOODS OF 1957
Gage height, in feet, and discharge, in cubic feet per second, at indicated time, 1957 Continued
Hour
J0n. 31
6 a.m....8. _____12 m ....
6. __ ....10..--.-.12 p.m--.
Feb. 1
6. ..._..-12 m .... 1 p.m____
Gage height
3.843.864.004.014.144.935.10
5.245.605.60 5.67
Dis charge
970980
1,0501,0601,1201,5401,640
1,7101,9201,920 1,960
Hour
Feb. 1-Con.
3... __ ...6 .........9 __ .....
Feb. 2
6 ..__._...12 m __ ..
12 p.m....
Gage height
5.956.457.236.846.15
5.555.124.483.963.60
Dis charge
2,1302,4803,1202,7802,260
1,8901,6501,2901,030
860
Hour
Feb. 3
12 m .. ...
12 p.m....
Feb. 4
12 m __ -.12 p.m....
Feb. 5
12 m ..--.12 p.m....
Gage height
3.293.082.892.70
2.452.28
2.152.05
Dis charge
724643578513
428370
326292
95. WOLF RIVER NEAR BYRDSTOWN, TENN.
Location. Lat 36°33'40", long 85°04'20", on right bank a quarter of a mile upstream from new bridge on county road, half a mile upstream from Widow Creek, 3 miles east of Byrdstown, Pickett County, and 5 miles upstream from Lick Creek.
Drainage area. 105 sq mi.Gage-height record. Water-stage recorder graph except 8 a.m. to 9 p.m. Feb. 19 for
which graph was constructed based on bi-hourly radio gage readings. Datum of gage is 707.54 ft above mean sea level, Sandy Hook datum.
Discharge record. Stage-discharge relation defined by current-meter measurements below 7,300 cfs and extended above on basis of velocity-area study.
Maxima. January-February 1957: Discharge, 22,600 cfs 1 p.m. January 29 (gage height, 10.84 ft).
1943 to December 1956: Discharge, 14,100 cfs Mar. 22, 1955 (gage height, 9.06 ft).Remarks. Some regulation at low flow caused by small mills above station.
Mean discharge, in cubic feet per second, 1957
Day
I-....2__...3 _____4 _____5 __ .6_.._.7_.___8 __ .9. ....10.. ._ 11.--.
January
86 74 66 83
225 200 172 144 927
1,380 644
Monthly mean dis Runoff, in inches
February
2,130 1,530
754 494 390 365 469 754 782
1,290 768
Day
12.....1 914 .....15-____16 .....17 .....18 __ .199n21 .....22____.
January
385 270 205 172 144 119 105
89 84
110 590
charge, in cubic feet per secc
February
488 346 264 215 195 172 156
1,110 960 554 385
Day
23 .... 24. ... 25___-26 .... 27 ___28 .... 29 ....30. ...31--..
January
1,950 632 395 270 426
3,410 11,0002,0401,220
891 9.78
February
284 238 210 202 200 188
568 5.63

FLOODS OF JANUARY-FEBRUARY 1957 IN KENTUCKY
Gage height, in feet, and discharge, in cubic feet per second, at indicated time, 1957
A129
Hour
Jan. 26
12 p.m___
Jan. 27
6 a.m____
12 p.m...
Jan. 28
6 a.m.... 8 ........9____ __ .12 m __ .
12 p.m...
Jan. 29
1 a.m__._ 3._......6--------8-_._ ....10--.---.12 m ....
2. ___....
Gage height
2.58
2.58 2.863.423.65
3.92 4.054.155.907.516.46
6.38 6.407 "in8.609.80
10.6510.84
9.50
Dis charge
235
235 332632775
976 1,0801,1803,3107,2504,420
4,250 4,2907 9 9(1
11,00016,700
22,60015,200
Hour
Jan. 29-Con.
7... __ ...12 p.m___.
Jan. 30
12 m .....
12 p.m....
Jan. 31
6-_--_- ...10_-----._12 m .._..
8-.--. __ .12 p.m....
Feb. 1
12 m .....
6.... _____8.. ____ .
Gage height
9.398.806.42
5.294.724.324.07
3.994.054.144.274.234.304.50
4.704.925.005.565.61
Dis charge
14,70011,9004,330
2,3801,7401,3401,100
1,0301,0801,1701,2901,2501,3201,520
1,7201,9502,0402,7502,830
Hour
Feb. 1-Con.
Feb. 2
8 __ ______12 m _____
12 p.m____
Feb. 3
12 m _____12 p.m_._.
Feb. 4
12 m _....12 p.m....
Feb. 5
6 _________12 p.m....
Gage height
5.615.41
5.004.62 .4.404.123.92
3.573.36
3.173.01
2.962.953.013.00
Dis charge
2,8302,540
2,0401,6401,4201,150
976
722596
488405
380375405400
96. DALE HOLLOW RESERVOIR NEAR CELINA, TENN.
Location. Lat 36°32'19", long 85°27'05", at Dale Hollow Dam on Obey River, 3 miles east of Celina, Clay County, Term., and 7.3 miles upstream from mouth.
Drainage area. 935 sq mi.Gage-height record. Water-stage recorder graph. Datum of gage is at mean sea level.
Sandy Hook datum.Maxima.-^January-February 1957: Contents at 12 p.m., 677,800 cfs-days Feb. 10, 11
(elevation, 650.68 ft).1943 to December 1956: Contents, 780,000 cfs-days Feb. 10, 1950 (elevation, 657.8 ft).
Remarks. Storage capacity, 860,000 cfs-days (elevation 663.0 ft) of which 428,000 cfs- days is controlled storage. Records furnished by Corps of Engineers.

A130 FLOODS OF 1957
Elevation, in feet, and contents, in cfs-days at 12 p.m. of indicated day, 1957
Day
!---_2____3---.4_.-_5.__.6_.__7__..8-.-_9-._-10 __11--.12 __13___14...15...16...
January
Elevation
638.45638.24638.00637.92638.00637.96637.88637.78638.18638.66638.66638.78638.88638.74638.52638.23
Contents
518,500516,000513,000512,100513,000512,500511,600510,400515,200521,000521,000522,500523,700522,000519,300515,800
February
Elevation
650.00650.48650.50650.40650.30650.20650.11650.16650.22650.68650.68650.53650.31650.03649.80649.46
Contents
668,400675,100675,400674,000672,600671,200669,900670,600671,500677,800677,800675,800672,700668,800665,700661,000
Day
17. __18...19...20-..21...22...23...24...25...26.. .27...28...29-.-30. _.31-.-
January
Elevation
637.88637.66637.62637.69637.64638.44639.26639.48639.62639.79640.14642.10647.30648.58649.02
Contents
511,600508,900508,400509,300508,700518,400528,400531,100532,800534,900539,200563,800631,700649,000655,000
February
Elevation
649.13648.86649.40649.50649.37649.31649.24649.40649.32649.21649.10648.97
Contents
656,500652,700660,100661,600659,700658,900658,000660,100659,100657,600656,100654,200
97. OBEY RIVER 8ELCW DALE HCLLOW DAM, TENN.
Location. Lat 36°32'12", long 85°27'22", on right bank, 1,200 ft downstream from DaleHollow Dam, 3 miles east of Celina, Clay County, 7.1 miles upstream from mouth, and24 miles downstream from Wolf River.
Drainage area. 935 sq mi. Gage-height record. Water-stage recorder graph except 1 p.m. Jan. 29 to 11 a.m. Feb.
26 at auxiliary gage at station on Cumberland River Celina for which graph was drawnbased on bi-hourly radio gage readings. Datum of gage is 500.00 ft above mean sealevel, Sandy Hook datum.
Discharge record. Stage-discharge relation defined by current-meter measurements.Discharge computed by slope method.
Maxima. January-February 1957: Discharge, 6,160 cfs 9 a.m. Jan. 29; gage height,25.20 ft 7 p.m. Jan. 29 (backwater from Cumberland River).
1938^2, 1943 to December 1956: Discharge, 41,400 cfs Feb. 4, 1939, at site 5.2miles upstream, from rating curve extended above 20,000 cfs; gage height, 43.40 ftJan. 12, 1946 (backwater from Cumberland River).
Remarks. Flow completely regulated by Dale Hollow Reservoir since Aug. 30, 1943.
Mean discharge, in cubic feet per second, 1957
Day
1---.-2.---.3--...4.----5. __ .6.-^.-7.....8-.--_9__-_-10---- 11.---
January
2,490 2,980 3,290 2,700 1,450 2,440 2,560 2,390
0 1,140 3,290
Monthly mean dis Runoff, in inches
February
5,900 5,910 5,850 5,820 5,720 4,790 5,750 5,450 5,140 4,310 5,830
Day
121314-...-15..--.16...._17 __ _18. __ .199n21.....22---..
January
744 470
3,620 3,700 3,870 4,690 3,400
833 0
1,400 0
February
5,810 5,830 5,800 5,860 5,870 5,840 5,120 4,160 5,940 5,830 3,360
Day
23 .... 24-... 25.--- 26. ... 27.... 28.-.. 29.--- 30--.. 31 __ _
charge, in cubic feet per second.. ............
January
3,000 1,610 1,530
0 0
1,060 2,320
536 4,070
1,987 2.45
February
3,220 0
2,990 3,520 3,500 3,390
4,875 5.39

FLOODS OF JANUARY-FEBRUARY 1957 IN KENTUCKY
Gage-height, in feet, and discharge, in cubic feet per second, at indicated time, 1957
A131
Hour
Jan. 28
12 p.m._-
Jan. 29*
6 a.m....9.. __ ...9:30 .....11 __ . ...12 m .... 2 p.m____ 3-... ....4 __ __ _7---. __ .8..... ...12 p.m...
Jan. 30*
6 a.m.... 10.......10:30 ....12 m __ .
Jan. 31*
6:30 a.m . 8. ___ ..10-------12 m ....
Feb. 4*
Feb. 5*
6 a.m...12 m ..-6 p.m... ll_._.-_
2.......3_._.___5. __ .-6. __ ...8-___.._12 m .--
Gage height
10.55
16.5021.9020.4821.6022.00 22.70 24.5024.8525.2023.2022.23
19.65 17.541 Q d.n16.4613.6911.40
9.82 15.0315.6316.3616.3416.42
16.40
16.3716.3916.4116.40L£t ,£t\J
9 7^
9.609 on
15.3015.8716.1716.30
Dis charge
315
2,3206,1601,8501,520
991 756
5,530.5,5205,710
00
0 0
3,7801 Q9
1,130576
284 4,6605,110^ 77f>
5,7305,760
5,750
5,7505,7705,8005,790
jU 1 U
000
5,0305,5105,7005,780^ 79n
Hour
Feb. 6* Con
12 p.m.__.
Feb. 7*
12 m .....
Feb. 8*
12 m ---..
11_____ __12 p.m....
Feb. 9*
2 a.m__.._3---.-----4:30 .. __6.........7. ........9-----....12 m .....
12 p.m....
Feb. 10*
2.. _______6. ____ ..7. _.__....8 _________10--__---_12 m _____
? -?n
4...... __5__. ____6___-__._-12 m _____
Feb 17*
Gage height
16.30
16.3316.3616.3816.42
16.4216.4916.6210.4810.44
10.0215.2516.2013.8015.9516.5216.7016.7416.75
11.0610.7610.2415.1016.1416.6416.8117.0417.12
17.1015.6216.5016.8416.9416.9016.7916.64
16.55
Dis
charge
5,720
5,7505,7505,7605,800
5,8105,8805 Q ^n1,0901,170
9514,9005,6803,4305,3205,8305,9105,8405,730
225209161
4,4805,3705,7305,8005,8305,910
5,9804,4405,3405,7105,8105,8905,8905,820
5,850
Hour
Feb. 18*
12 m ._ _._8:30 p.m ._ 9 __ _..._10 ___ ...11. .---._.
Feb. 19*
6 __ ___ .8... ___ .10--------12 m __ .
12 p.m....
Feb. 20*
8. ____ .12 m -----
Feb. 21*
12 m -----
12 p.m..-.
Feb. 22*
2-.-------5 __ _____7 __ _____9. __ _____10-_------11--------5 p.m__-__6 __ . __ .8. _____ .9. _____ .10-_------11 ____ ..12 p.m....
Feb. 23*
6 ____ ___7 ___ .---
Gage height
16.5216.5216.52 12.7710.08
9.929.58
9.059 10
1^19
16.5417.0917.8018.00
17.9917.9417.7017.3417.14
17.0016.9016.8216.77
11.1610.8010.0515.3716.2715.9015.8215.8215.9315.9412.1510.1810.149.80
9.1512.3614.80
Dis charge
5,8305,8305,830 2,640
0365133
81162
4,6905,6405,8305,9405,950
5,9706,1005,9905,8605,840
5,8305,8105,8005,790
0199
04,8705,6205,2105,1105,0905,2005,2101,800
0250
0
02,7104,590

A132 FLOODS OF 1957
Gage height, in feet, and discharge, in cubic feet per second, at indicated time, 1957 Continued
Hour
Feb.23*-Con.
12 m ....
Gage height
15.8315.62
Dis
charge
5,4405,100
Hour
Feb. 23* Con.
10--_--_--
Gage height
15.759.87
Dis charge
5,1400
Hour
Feb. 23*-Con.
12 p.m__ _
Gage height
9.849.50
Dis charge
2390
*Flow affected by regulation; daily means cannot be computed exactly from data shown.
98. CUMBERLAND RIVER AT CELINA, TENN.
Location. Lat 36°33'20", long 85°30'47", on right pier of bridge on State Highway 52 at Celina, Clay County, 600 ft downstream from Obey River, and at mile 380.8.
Drainage area. 7,320 sq mi, approximately.Gage-height record. Water-stage recorder graph except 1 p.m. Jan. 29 to 11 a.m. Feb.
26 for which graph was drawn based on bi-hourly radio gage readings. Datum of gage is 488.97 ft above mean sea level, datum of 1929, supplementary adjustment of 1936.
Discharge record. Stage-discharge relation defined by current-meter measurements. Discharges at all stages affected by rate of change in stage.
Maxima. January-February 1957; Discharge, 66,500 cfs 9:30 a.m. Jan. 29; gage height, 34.10 ft 6 p.m. Jan. 29.
1922 to December 1956: Discharge, 145,000 cfs Dec. 29, 1926; gage height, 57.25 ft Dec. 29, 1926, from graph based on gage readings.
Maximum stage known, 59.2 ft in March 1826, from profile by Corps of Engineers. A flood in 1793 may have exceeded the one in March 1826.
Remarks. Flow regulated by Lake Cumberland and Dale Hollow Reservoirs.
Mean discharge, in cubic feet per second, 1957
Day
1-----2. ....3_.___4__ ...5.....6. __ .7. __ .8_ ....9 __ ..10 __ .11--.-
January
12,500 16,400 20,700 19,700 17,000 17,000 13,400 14,500 18,900 18,900 23,400
February
36,800 39,100 36,600 34,300 33,500 32,700 33,400 33,400 34,300 35,600 36,000
Day
12. __ .IS.....14 __ .15 ___ .16 .....17- ....18. __ _19---..20 __ .21. ....22 .....
January
23,300 17,100 14,000 21,800 24,100 26,800 26,300 24,200 18,000 16,200 24,300
Monthly mean discharge, in cubic feet per seco
February
34,600 34,800 34,600 34,400 34,300 34,200 33,900 37,600 39,300 36,500 34,100
Day
23_--_-24. __ .25 __ .26. ....27. __ .28_- ...29.-... 30---..31_-__.
January
39,700 28,400 23,300 18,000 18,800 28,700 58,600 41,00033,300
23,170
February
32,500 29,800 31,300 32,200 32,600 32,200
34,450

FLOODS OF JANUARY-FEBRUARY 1957 IN KENTUCKY
Gage height, in feet, and discharge, in cubic feet per second, at indicated time, 1957
A133
Hour
Jan. 26*
Jan. 27*
6 a.m___-10.__ . .12 m _...
9_... .
Jan. 28*
8 a.m....1 p.m____2 __ . __5:30 -. _7_ ......9-... __12 p.m__.
Jan. 29*
6 a.m_-__9:3012 m ....5 p.m_-_-6-.---.-.8------_.12 p.m__.
Jan. 30*
10_______ll_-_---_
Gage height
11.88
12.8613.6013.7713.9014.0914.47
16.0018.8619.0219.3019.9020.0020.92
26.1030.4432.2534.0534.1034.0032.80
Qn QA
28.1029.00
Dis charge
15,200
18,00019,10018,90019,20020,10021,100
25,10032,00030,50032,10031,40032,70036,800
56,20066,50064,20061,70061,80058,90054,800
47,100
42,800
Hour
Jan. 30* Con
12 m .. _.
6----.---12 p.m....
Jan. 31*
7 a.m_____9__-----_-12 m _____
12 p.m____
Feb. 1*
12 m -----
12 p.m....
Feb. 5*
12 p.m....
Feb. 6*
2 a.m_____4 __ ______6-________8. __ . ___12 m _____6 p.m.--..12 p.m____
Feb. 7*
Gage height
26.9025.0023.7021.60
20.0020.6020.8020.9021.10
21.3021.7022.9023.60
20.90
20.1019.7020.0020.4020.6020.8020.80
20.80
Dis charge
32,30036,60035,40032,700
32,40034,10033,30033,50033,900
34,30036,50038,90039,200
33,500
30,40031,00032,90033,30032,90033,30033,300
33,300
Hour
Feb. 7* Con.
12 m -----
Feb. 8*
12 m -----
10 __ __ .12 p.m____
Feb. 9*
4 __ -. __8---. __ _12 m --.__
4 ________6_________8-------_.12 m .__-
Feb. 11*
4-----. .-6-----_-__
12 p.m .-
Gage height
20.9020.90
20.9021.1020.3019.92
19.7020.5021.1021.509 1 on
21.2020.8020.6021.4022 1022.50o o en
22.4022.4021.8021.60
Dis charge
33,50033,500
33,50033,90029,80030,400
32,50034,40034,90034,80035,400
32,40031,90034,40036,600 37 Qnn
36,80037,100
37,10036,60036,60035,40035,000
* Affected by rate of change in stage; daily means cannot be computed exactly from data shown.

A134 FLOODS OF 1957
TENNESSEE RIVER BASIN
99. LITTLE PIGEON RIVER ABOVE WEST FORK LITTLE PIGEON RIVER AT SEVIERVILLE, TENN.
[Crest-stage station]
Location. Lat 35°52'12", long 83°34'04", on right bank at State Highway 66 bridge, inSevierville, Sevier County, 150 ft upstream from West Fork, and 4g- miles downstreamfrom East Fork.
Drainage area. 201 sq mi (determined by Tennessee Valley Authority from 7^-minuteplanimetric maps, scale, 1:24,000).
Gage-height record. Crest stages only.Discharge record. Peak discharges from rating curve extended above 11,700 cfs. Maxima. January-February 1957: Discharge, 12,800 cfs Jan. 31 (gage height, 15.59 ft).
February 1954 to December 1956: Discharge, 10,800 cfs Apr. 16, 1956 (gage height,13.76 ft).
100. WEST FORK LITTLE PIGEON RIVER NEAR PIGEON FORGE, TENN.
[Crest-stage station]
Location. Lat 35°48'21", long 83°34'28",on left bank at old State Highway 71 bridge, 1.4miles upstream from Waldon Creek, 1.6 miles northwest of Pigeon Forge, SevierCounty, and 9 miles upstream from mouth.
Drainage area. 76.2 sq mi (determined by Tennessee Valley Authority from 7^-minuteplanimetric maps, scale, 1:24,000).
Gage-height record. Crest stages only.Discharge record. Peak discharges from rating curve extended above 4,900 cfs. Maxima. January-February 1957: Discharge, 6,400 cfs Jan. 31 (gage height, 10.98 ft).
February 1946 to July 1949, February 1954 to December 1956: Discharge, 5,640 cfsJan. 20, 1947 (gage height, 10.30 ft).
101. LITTLE PIGEON RIVER AT SEVIERVILLE, TENN.
Location. Lat 35°52'34", long 83°34'36", onleft bank at Eckel farmhouse, 0.5 mile down stream from city limits of Sevierville, Sevier County, and 0.5 mile downstream from West Fork Little Pigeon River.
Drainage area. 353 sq mi.Gage-height record. Water-stage recorder graph. Datum of gage is 881.44 ft above
mean sea level, datum of 1929, supplementary adjustment of 1936.Discharge record. Stage-discharge relation defined by current-meter measurements
below 20,000 cfs.Maxima. January-February 1957: Discharge, 28,300 cfs 12:30 a.m. Feb. 1 (gage-height,
14.71 ft).1920 to December 1956: Discharge, 32,000 cfs June 29, 1928 (gage height, 15.4 ft). Flood of Feb. 25, 1875 reached a stage of about 18 ft (discharge, about 55,000 cfs)
and the floods of 1896 and 1867, reached stages of about 16.8 and 16.5 ft, respectively, from reports by Tennessee Valley Authority.
Remarks. Some regulation at low flow caused by powerplants on forks.

FLOODS OF JANU
Mean disch
Day January
l-_ __2 .....3.. ...4 .....5 .....6. ....7_____8. ....9_.._.10 __ .11. ...
280 248 215 240 396 402 385 336 320 402 440
Monthly mean dis Runoff, in inches
February
18,700 8,000 3,060 3,590 4,220 2,900 2,670 4,130 4,600 4,370 2,940
Da;
12.. 13.. 14.. 15.. 16.. 17_. 18.. 19.. 20.. 21_. 22..
charge, in cubic
Gage height, in feet, and dis
Hour
Jan. 26
12 p.m...
Jan. 27
5 a.m.... 6........12 m .... 6 p.m.... 8____ __ .10:30 -._. 12 p.m...
Jan. 28
2 a.m.... 6_ ____ .8... __ _10-.. __ .2 p.m.... 6....._..12 p.m...
Jan. 29
6 a.m.... 12 m .... 2 p.m.... 6-.-.....12 p.m...
Jan. 30
1:30 a.m.
Gage height
1.68
1.66 1.69 3.90 5.59 5.69 5.65 6.23
7.00 7.80 8.05 9.20 8.28 7.29 5.54
4.48 3.82 3.72 5.10 7.28
7.52
Dis charge
, 429
418 434
2,130 3,490 3,600 3,560 4,190
5,040 5,960 6,260 7,740 6,540 5,360 3,430
2,310 1,660 1,570 2,950 5,350
5,620
H
Jan. 3
4 a.m 12 m 6 p.m 11...12 p.]
Jan.
2 a.m 6--..12 m 4 p.m 6.--.8--..9-._.12 p.]
Feb
12:30 6_._.12 m 2 p.ir 8.-_.11...12 p.]
Feb
6 a.m 12 m 6 p.m 12 p.]
\RY- FEBRUARY 1957 IN KENTUCKY A13!
urge, in cubic feet per second, 1957
' January
358 325 290 266 258 223 181 178 188 188 195
February
1,790 1,320 1,040
860 793 660 595 628 702 588 543
feet per second
Day January
23 .... 24 .... 25 .... 26 ....27 .... 28. ...29
1,240 663 495 451
2,040 5,670 2 760
30-_-_ 3,86031 __ 14,600
1,229 4.01
February
500 470 454 470 488 765
2,5667.57
:harge, in cubic feet per second, at indicated time, 1957
aur
) Con.
n____
31
n_-__
1
a.m -
n____
2
n_-__
Gage height
7.34 5.85 4.85 4.42 4.45
4.70 7.54
11.85 13.98 13.96 13.68 13.74 14.66
14.71 13.30 11.66 11.57 11.91 12.38 12.30
10.20 7.80 6.40 5.67
Dis charge
5,410 3,790 2,680 2,250 2,280
2,530 5,650
13,800 25,000 24,900 23,700 23,900 28,100
28,300 22,000 14,600 14,200 15,700 17,800 17,400
10,000 6,440 4,820 4,020
Hour
Feb. 3
12 m -----
12 p.m.-..
Feb. 4
8 ______ .11 ___ --.
6 ______ .7. ___ ...10. -....--12 p.m....
Feb. 5
11:30 _..--1:30 __ ..6.-------.8. _____ .12 p.m..--
Feb. 6
12 m __ .
10 _____ .12 p.m..-.
Gage height
5.01 4.61 4.38 4.10
3.82 3.89 4.61 5.71 6.65 6.85 7.00 6.90
6.30 5.46 6.22 5.33 5.06 5.04
4.80 4.50 4.23 4.26 4.39
Dis charge
3.350 2,950 2,720 2,440
2,160 2,230 2,950 4,060 5,100 5,320 5,480 5,370
4,710 3,800 4,620 3,670 3,400 3,380
3,140 2,840 2,570 2,600 2,730

A136 FLOODS OF 1957
102. SOUTH FORK HOLSTON RIVER AT RIVERSIDE, NEAR CHILHOWIE, VA.
Location. Lat 36°45'37", long 81°37'52", on right bank 400 ft upstream from highway bridge at Riverside, Smyth County, 900 ft upstream from Spring Branch, 3.2 miles downstream from Redstone Branch, and 4 miles southeast of Chilhowie.
Drainage area. 76.1 sq mi.Gage-height record. Water-stage recorder graph. Datum of gage is 2,106.77 ft above
mean sea level, datum of 1929, supplementary adjustment of 1936.Discharge record. Stage-discharge relation defined by current-meter measurements.Maxima. January-February 1957: Discharge, 3,800 cfs 10 p.m. Jan. 29 (gage height,
8.32 ft).1920-31, 1942 to December 1956: Discharge, 6,000 cfs June 12, 1923 (gage height,
9.0 ft, from graph based on gage readings, at site 400 ft downstream).
Mem discharge, in cubic feet per second, 1957
Day
1. __ .2_____3-_--.4 ___ .5. __ .6. __ .7_____8. __ .9 __ ..10 __ . 11.-..
January
79 68 63 64 77 80 88 86
238 601 476
Monthly mean dis Runoff, irj inches
February
1,770 1,070
657 511 450 434 777
1,200 1,450 1,420
875
Day
12_____13. ....14 ___ .15 ___16. __ .17._. _.18--..-1 Q
20 __ -.21 .....22____.
January
317 230 176 145 122 106
88 84 79 79 77
charge, in cubic feet per secc
February
525 382 295 243 215 187 162 173 187 176 162
Day
23-....24 __ .25 __ .26 __ .27 ___ .28 ___ .29.---.30 ___ .31 __ ..
January
134 179 163 142 182 794
2,5301,9701,340
350 5.30
February
146 134 127 149 170 187
508 6.94
Gage height, in feet, and discharge,in cubic feet per second, at indicated time, 1957
Hour
Jan. 26
Jan. 28
4 a.m.... 8_-------12 m __ -
8_ __ --.-
Jan. 29
4 a.m.-.. 8 __ ....12 m ....
8 ._...___
Gage height
2 41
2.61 2.819 n 1^3 705.506.26
6.22 6.156.026.808.00
Dis charge
299
3564.1 Q
4Q1
6961,6002,110
2,110 2,0601 Q7n2 con
3,510
Hour
Jan. 29 Con.
12 p.m....
Jan. 30
8 ___ ___.12 m _____
8 _____ ._12 p.m....
Jan. 31
8 __ .....12 m __._.
Gage height
8.328.1?
7.196.265.635.254.734.50
4.364.344 795.20
Dis charge
3,8003,660
2,8302,1401,7401,5101,2201,100
1,0301,0201,2401,480
Hour
Jan. 31 Con.
12 p.m....
Feb. 1
8.. __ ---.12 m ...-.
8 12 p.m_-_-
Feb. 2
8 __ __ ...12 m -----
Gage height
5.616.08
6.156.005.685.425.285.05
4.824.634.434.24
Dis charge
1,7302,020
2,0601,9601,7701,6101,5301,390
1,2601,1601,060
970

FLOODS OF JANUA
Gage height, in feet, and discharg
Hour
Feb. 2 Con.
8 p.m.... 12 p.m__-
Feb. 3
6 a.m____ 12 m __ . 6 p.m____
Gage height
4.12 3.86
3.64 3.52 3.38
Dis charge
910 789
701 653 597
Feb.
12 p
F
6 a.12 n 6 p. 12 p
"Y-FEBRUARY 1957 IN KENTUCKY A137
t, in cubic feet per second, at indicated time, 1957 Continued
3our
3-Con.
.m____
:b. 4
.m____
Gage height
3.31
3.25 3.15 3.09 3.03
Dis charge
569
545 505 481 457
Hour
Feb. 5
12 m -_--.
12 p.m__._
Gage height
2.98 3.02 3.04 3.00
Dis charge
438 453 461 445
103. BEAVERDAM CREEK AT DAMASCUS, VA.
Location. Lat 36°37'40", longCyanamid Co., at Damascus
Drainage area. 56.0 sq mi. Gage-height record. r-Water-st;
mean sea level, datum of 192 Discharge record. Stage -disci arg'
below 2,600 cfs. Maxima. January-February l-£ 57
5.75ft).1947 to December 1956: Di scharg
51°47'28", on right bank in pumphouse of American Washington County, 0.65 mile upstream from mouth.
ge recorder graph.- Datum of gage is 1,946.66 ft above , supplementary adjustment of 1936.
e relation defined by current-meter measurements
: Discharge, 4,200 cfs 8 p.m. Jan. 29 (gage height,
e, 5,280 cfs Mar. 18, 1955 (gage height, 5.75 ft).
Mean dis harge, in cubic feet per second, 1957
Day
1. __ .2. ___3 _____4. __5. __6_____7_____8 _____9.....10 ____ ll--._
January
76 64 55 59
126 142 145 130 269 555 427
Monthly -mean dis Runoff, in inches
February
2,060 1,270
610 661 654 555 654
1,070 1,150 1,530
818
I
12 13 14 15 16 17 18 19 20 21 22
charge, in cub
ay
-----
-----
January
267 185 145 117 108
89 75 70 61 67 69
Lc feet per secc
February
435 294 219 178 158 133- 114 121 121 104
97
Day
23 __24 ____ 25 __ 26 ____ 27. ___ 28 ____ 29 ___30. __ 31 ___
January
204 225 180 158 198
1,260 3,4002,060 1,390
399 8.21
February
93 89 85 91 87
130
----------
485 9.02

A138 FLOODS OF 1957
Gage height, in feet, and discharge, in cubic feet per second, at indicated time, 1957
Hour
Jan. 26
12 p.m-_.
Jan. 27
6 a.m.__.12 m ....
Jan. 28
2 a.m-__.4 _..___'..6. __ ....8. .......10 ____ .12 m __ . 2 p.m.... 4. .......6........8 __..__..10 __ ....12 p.m__-
Jan. 29
2 a.m.... 4. ____ .6 ........8-... ....10 __ ...12 m --.-
Gage height
1.13
1.111.251.501.80
1.942.072.222.422.672.99 3.30 3.754.184.524.724.80
5.05 5.185.185.104.954.75
Dis charge
142
138172240340
391443503584700888
1,110 1,5302,0802,5302,7902,890
3,220 3,3903 3Qfl
3,2803,0802,820
Hour
Jan. 21 Con,
4 __ ... ...6 .___...._8. ____ ..10-. ___ -
Jan. 30
8 __ ......12 m _-..-
8 ..__.._..
Jan. 31
8 __.__..__12 m .....
8 .._..__..12 p.m---.
Feb. 1
8. .__.__..12 m .....
8 ____ ...
Gage height
4.714.955.655.755.665.61
4.804.374.063 7/1
9 37
3 1 *\
3.002.983.303 RA.
4.204.40
4.454 3fi4.189 OR
3.90
Dis charge
2,7703,0804,0504,2004,0603,990
2,8902,3301,9301,5201,170
QQ^
895882
1,1101,6402,1102,370
2,4402 39ft2,0801,8201,720
Hour
Feb. 1 Con.
12 p.m....
Feb. 2
8 ____ ...12 m .....
8 __ .---..12 p.m....
Feb. 3
12 m ._ ...
12 p.m....
Feb. 4
12 m -----
12 p.m....
Feb. 5
12 m -----
Gage height
3.82
3.753.603.403.233.032.84
2.602.452.342.36
2.462.652.762.76
2.682.612.572.47
Dis charge
1,620
1,5301,7301,1901,050
914794
665598551459
602690748748
705670563603
104. SOUTH FORK HOLSTON RIVER AT VESTAL, VA.
Location. Lat 36°39'06", long 81°50'39", on right bank 500 ft upstream from bridge on U.S. Highway 58 at Vestal, Washington County, 0.7 mile downstream from Laurel Creek, 3.2 miles northwest of Damascus, and 4.9 miles upstream from Middle Fork Holston River.
Drainage area. 301 sq mi.Gage-height record. Water-stage recorder graph. Datum of gage is 1,792.30 ft above
mean sea level, datum of 1929, supplementary adjustment of 1936.Discharge record. Stage-discharge relation defined by current-meter measurements
below 10,000 cfs and by contracted-opening measurement at 15,100 cfs.Maxima. January-February 1957: Discharge, 15,100 cfs 8 p.m. Jan. 29 (gage height,
15.35 ft).1931 to December 1956: Discharge, 11,400 cfs Mar. 18, 1955 (gage height, 13.73 ft).

FLOODS OF JAF-JARY-ITEBRUARY 1957 IN KENTUCKY A139
Mean dis
Day January
1__ ... 2 .....3 .__._4 .....5.. ...6-. ...7_____8_. ...9__.__10 _.._ 11. ...
305 275 276 291 462 466 490 454 965
2,400 1,900
Monthly mean dis Runoff, in inches
February
6,810 4,290 2,800 2,720 2,600 2,310 3,210 4,560 4,560 5,360 3,430
charge, in
D
ia1314151617. 1819. 202122
Gage height, in feet, and di
Hour
Jan. 26
Jan. 27
6 a.m____ 12 m __ .6 p.m __ 12 p.m___
Jan. 28
2 a.m.._. '4. __ --__6 __ -.__8 ___ ...10 __ ....12 m __ . 2 p.m_.._4 ___ ....6 __ ....8 ___ ____10 ____.._12 p.m...
Jan. 29
1 a.m____ 2__._____3_. ___ .4 __..__._5__ _._...6 __._..__7____ __ _
Gage height
4.10
4.08 4.43 5.13 5.68
5.95 6.20 6.47 6.79 7.18 7.60 8.30 9.45
11.10 12.12 12.45
.12.62
12.67 12.75 12.82 12.79 12.68 12.62 12.48
Dis charge
550
542 725
1,110 1,480
1,720 1,950 2,190 2,480 2,830 3,230 3,960 5,430 7,760 9,390 9,920
10,200
10,300 10,400 10,500 10,500 10,300 10,200
9.970
Jan.
8 a9101112 n
lp.23456789101112 p
Jai
2 a. 4681012 n2 P.46810_. 12 p
barge
ay
....
in cubic feet per second, 1957
January
1,180 880 700 565 498 422 363 335 325 320 320
February
2,180 1,500 1,180
940 825 728 660 682 682 620 600
c feet per second
Day
23 .... 24 .... 25 .... 26 ___ 27 ___ 28 ___ 29 ....30 ....31 ....
January
690 775 700 600 848
4,740 11,200
7,3905,060
1,490 5.71
February
560 540 520 540 560 655
2,022 7.00
scharge, in cubic feet per second, at indicated time, 1957
-lour
29 Con.
,m__
. 30
,m____
Gage height
12.35 12.17 11.95 11.82 11.91 12.05 12.35 12.80 13.25 13.90 14.55 15.05 15.35 15.25 15.00 14.65 14,32
13.65 13.00 12.28 11.65 10.82 10.24
9.70 9.28 8.93 8.63 8.42 8.27
Dis charge
9,760 9,470 9,120 8,910 9,060 9,280 9,760
10,500 11,200 12,400 13,600 14,500 15,100 14,900 14,400 13,800 13,200
12,000 10,800 9,650 9,640 7,350 6,540 5,780 5,190 4,730 4,360 4,100 3,930
Hour
Jan. 31
4 a.m____ 8 ........12 m .... 4 p.m____ 8 _...___.12 p.m ...
Feb. 1
4 a.m.... 8 ____.__.12 m .... 4 p.m___. 8 ___._...12 p.m._.
Feb. 2
6 a.m____ 12 m __ . 6 p.m____ 12 p.m__.
Feb. 3
6 a.m__,_ 12 m ....6 p.m___. 12 p.m_._
Feb. 4
6 a.m____
Gage height
8.05 8.13 8.88 9.67
10.35 11.12
11.27 11.00 10.45
9.90 9.67 9.40
9.00 8.57 8.10 7.68
7.30 7.08 6.94 6.79
6.96
Dis charge
3,680 3,770 4,660 5,740 6,690 7,790
8,030 7,600 6,830 6,060 5,740 5,360
4,800 4,280 3,740 3,310
2,940 2,740 2,620 2,480
2,630

A140 FLOODS OF 1957
Gage height, in feet, and discharge, in cubic feet per second, at indicated time, 1957 Continued
Hour
Feb. 4 Con,
12 m --__
12 p.m___
Gage height
7.097.217.10
Dis charge
2,6302,8602,760
Hour
Feb. 5
6 a.m_____12 m _____
Gage height
6.986.89
Dis charge
2,6502,570
Hour
Feb. 5 Con.
12 p.m__.
Gage height
6.896.79
Dis charge
2,5702,480
105. MIDDLE FORK HOLSTON RIVER AT GROSECLOSE, VA
Location. Lat 36°53'19", long 81°20'51", on left bank at downstream side of highwaybridge in village of Groseclose, Smyth County, 0.2 mile upstream from Rocky SpringBranch, and 10 miles northeast of Marion.,
Drainage area. 7.39 sq mi. Gage-height record. Water-stage recorder graph. Datum of gage is 2,442.86 ft above
mean sea level, datum of 1929, supplementary adjustment of 1936. Discharge record. Stage-discharge relation defined by current-meter measurements
below 300 cfs and by slope-area measurement at 819 cfs.Maxima. January-February 1957: Discharge, 309cfs 6 p.m. Jan.29(gage height, 5.00 ft).
1947 to December 1956: Discharge, 813 cfs July 6,1953 (gage height, 7.42 ft).
Mean discharge, in cubic feet per second, 1957
Day
1_ __ _2__._.3. ____4 _____5_____6. __ .7. __ _8. ____
10 __ ll-___
January
6.6 6.0 5.6 6.0 6.8 6.2 6.6 6.2
34 42 24
Monthly mean dis Runoff, in inches
February
118 60 45 40 43 44 72
105 162 106
62
charge, in
Day
12. ____13.- ___14_____15..---16 _____17 _____18 _____1920.- ___21.. __22 _____
cubic fee
January
17 12 11 9.8 9.2 8.3 7.7 7.1 7.4 9.5 9.8
t per seco
February
42 34 30 25 23 20 18 26 21 19 17
nd
Day
23 ____ 24.... 25 __ 26_-._ 27 __ 28. __ 29 __30. __31. __
January
15 10 10 10 16 53
181 90
132
25.0 3.90
February
16 15 15 20 19 31
44.6 6.29

FLOODS OF JANUARY-FEBRUARY 1957 IN KENTUCKY A141
Gage height, in feet, and discharge, in cubic feet per second, at indicated time, 1957
Hour
Jan. 26
Jan. 27
8. _______12 m __ _
8__ ___ _
Jan. 28
4 ___ __6 __ __8 ________10 _______12 m ____
4__ ______6 ________8__ ______10_ ______12 p.m___
Jan. 29
Gage height
1.93
1.932.032.222.232.252.28
2.352.502.542.622.662.672.803.083.153.203.153.12
3 1 5
Dis charge
9.5
9.51220202122
263335394242517379837977
79
Hour
Jan. 29 Con.
3 __ ______4... ______5 _________6 _________7______ __8 _________9-__--____10. __ .___11__ __ __12 m _____
2 _________Q
4____. __ .5 _________6 __ __ ____?____.. __8 _________9-.__----_10 ________11 __ __ __
Jan. 30
8 _________12 m _____
Gageheight
3.133.223.393.453.603.803.873.873.813.773.884.164.354.704.854.985.004.904.704.524.334.154.02
3.613.343.14
Dis charge
7785
101107123145153153146142154187213264286306309294264237210186169
1249678
Hour
Jan. 30 Con
8 __ _____12 p.m___
Jan. 31
2 a.m____4-__-_---6 ____ __8 ________10.. _____12 m __..
4 __ _- __6 ________8 ________10 _______12 p.m___
Feb. 1
8 ________12 m ____4 p.m____ 8 ________12 p.m___
Gage height
3.002.892.90
2.953.013.033.303.764.134.063.813.774.104.294.12
3.803.583.503.39 3.363.16
Dis charge
675859
63686992
141183174146142179205182
145121112101 9880
106. MIDDLE FORK HOLSTON RIVER AT SEVENMILE FORD, VA.
Location. Lat 36°48'26", long 81°37'20" J on right bank at downstream side of bridge onU.S. Highway 11 at Sevenmile Ford, Smyth County, 0.3 mile upstream from MeadeCreek, and 3.3 miles downstream from Walker Creek.
Drainage area. 132 sq mi. Gage-height record. Water-stage recorder graph. Datum of gage is 1,960.00 ft above
mean sea level, datum of 1929, supplementary adjustment of 1936.Discharge record. Stage-discharge relation defined by current-meter measurements. Maxima. January-February 1957: Discharge, 7,680 cfs 8 p.m. Jan. 29 (gage height,
10.75 ft).1942 to December 1956: Discharge, 6,570 cfs Aug. 4, 1947 (gage height, 9.86 ft).
690-137 O - 64 - 10

A142 FLOODS OF 1957
Mean discharge, in cubic feet per second, 1957
Day
1__ __2__ ___3 _____4__-._5 _____6 __ _.7 _____8 _____9 _____10_-._ 11 ___
January
98 86 78 84
121 133 145 142
1,710 1,460
735
Monthly mean dis Runoff, in inches
February
. 2,970 1,480
912 828 845
1,010 1,540 2,130 3,370 2,360 1,190
Day
12 _____13 _____14 __ __1 ^16 _____17 _____18 _____1 0
2021 _____22 _____
January
455 325 243 189 162 136 118 108 102 112 115
charge, in cubic feet per seco
February
735 545 435 350 311 262 230 306 450 350 293
Day
23 ____ 24 ____ 25____26 ____27 ____28 ____ 29 ___30 __ _ 31 __ .
January
350 325 238 194 391
1,860 5,020 2,600 4,100
708 6.18
February
252 222 207 226 222 316
870 6.86
Gage height, in feet, and discharge, in cubic feet per second, at indicated time, 1957
Hour
Jan. 26
12 p.m__.
Jan. 27
6 a.m____ 12 m ____ 6 p.m____ 12 p.m___
Jan. 28
2 a.m __ _4 _____ _6____ __ _8__._ __ _10 __ ___12 m ____ 2 p.m.... ,4 ...___..6__ ______8 ________10 __ __ .12 p.m___
Jan. 29
2 a.m____ 4 __ _ __ _6 ___ __8 ________10 _______12 m .___ 2 p.m____ 4__. _____
Gage height
2.78
2.77 3.08 3.63 4.00
4.14 4.38 4.60 4.95 5.30 5.58 5.86 6.29 6.69 7.00 7.14 7.06
6.89. 6.84 7.02 7.49 7.98 8.55 9.19 9.85
Dis charge
185
181 311 586 790
867 999
1,130 1,340 1,560 1,760 1,950 2,280 2,620 2,900 3,040 2,960
2,800 2,760 2,920 3,480 4,150 4,920 5,690 6.500
Hour
Jan. 29 Con.
8 _________10 ________12 p.m____
Jan. 30
2 a.m __ __4 _________6 __ ______8 _________10 ___ ___12 m _____
4___ __ __6__ ___ __8 _________10__ ______12 p.m____
Jan. 31
2 a.m _____4 _________6 __ ______8 _________10 __ _____12 m _____
4 _________6... ______810. ________12 o.m__._
Gage height
10.48 10.75 10.50
9.70
8.83 7.98 7.28 6.75 6.30 5.97 5.66 5.44 5.25 5.06 4.95 4.89
4.86 4.86 4.91 5.30 6.06 7.03 7.69 7.95 7.94 7.91 7.90 7.94
Dis charge
7,320 7,680 7,350 6,310
5,260 4,150 3,210 2,680 2,290 2,030 1,810 1,660 1,520 1,410 1,340 1,300
1,290 1,290 1,320 1,560 2,100 2,930 3,750 4,110 4,100 4,050 4,040 4.100
Hour
Feb. 1
2 a.m_ .4 _________6 __ __ ...8 _________10 ________12 m _____
4_ _____ .6 __ . ___ _8 _________10 ___ ___12 p.m__._
Feb. 2
12 m _____
12 p.m____
Feb. 3
12 m _____
12 p.m. _ _
Feb. 4
12 m _. __
12 p.m. _ _
Gage height
7.92 7.72 7.41 7.11 6.83 6.61 6.46 6.36 6.31 6.25 6.13 6.00
5.53 5.09 4.75 4.48
4.27 4.20 4.12 4.11
4.13 4.10 4.03 3.93
Dis charge
4,070 3,790 3,370 3,010 2,750 2,550 2,420 2,340 2,300 2,250 2,150 2,050
1,720 1,420 1,220 1,060
938 900 856 850
862 845 806 752

FLOODS OF JANUARY-FEBRUARY 1957 IN KENTUCKY A143
Goge height, in feet, and discharge, in cubic feet per second, at indicated time, 1957 Continued
Hour
Feb. 5
6 a.m___-12 m __
Gage height
3.864.01
Dis charge
713796
Hour
Feb. 5 Con.
Gage height
4.29
Dis charge
950
Hour
Feb. 5 Con.
12 p.m....
Gage height
4.54
Dis charge
1,090
107. SOUTH HOLSTON LAKE NEAR BRISTOL, VA.-TENN.
Location. Lat 36°31'15", long 82°05'11", 470 ft upstream from South Holston Dam onSouth Fork Holston River in Sullivan County, Tenn., 7.0 miles southeast of Bristol,Virginia-Tennessee, and at mile 49.8.
Drainage area. 703 sq mi. Gage-height record. Water-stage recorder. Datum of gage is at mean sea level, datum
of 1929, supplementary adjustment of 1936. Maxima. January-February 1957: Contents at 12 p.m., 300,800 cfs-days Feb. ll(eleva-
tion, 1,723.36 ft).1950 to December 1956: Contents, 293,800 cfs-days, Apr. 14,1952(elev., 1,721.40 ft).
Remarks. Storage capacity, 375,100 cfs-days (elevation, 1,742.00 ft) of which 315,200cfs-days is controlled storage. Records furnished by Tennessee Valley Authority.
Elevation, in feet, and contents, in cfs-days at 12 p.m. of indicated day, 1957
Day
1 __2 ....3--..4 __5 __6. __7 __8....9 ....10 __11 ...12...1 3i. O _ . _
14___15 ...16 ...
January
Elevation
1,672.541,672.351,672.211,672.511,672.911,673.351,673.741,673.871,674.941,677.331,678.671,679.651,680.321,680.371,680.391,680.17
Contents
155,000154,500154,200154,900155,800156,800157,600157,900160,300165,800169,000171,3001 79 QftftJ. i £t f 3UU
173,000173,000172,500
February
Elevation
1,708.161,710.451,711.391,712.171,712.741,713.231,714.711,716.981,719.601,722.451,723.361,722.431 79 1 911, I £i L ,£i L
1 719.761,718.211,716.63
Contents
249,600256,800259,900262,400264,300265,900270,800278,400287,500297,500300,800297,5009QQ inn£ OO, 1.UU
288,000282,600277,200
Day
17__.18__.19...20--.21-.-22...23...24...25.--26--.27-._28-..9Q£ 3 _ .
30-._31O J. _ _
January
Elevation
1,679.771,679.281,679.101,679.371,679.161,679.331,679.431,679.511,679.571,679.771,680.681,684.851,693.601,699.671,703.62
Contents
171,600170,400170,000170,600170,100170,500170,800171,000171,100171,600173,700184,000206,900224,000235,600
February
Elevation
1,715.081,713.471,712.021,711.111,710.601,710.031,709.611,709.561,709.451,709.311,709.481,709.85
Contents
272,000266,700261,900259,000257,300255,500254,200254,000253,600253,200253,700254,900

A144 FLOODS OF 1957
108. SOUTH FORK HOLSTON RIVER BELOW SOUTH HOLSTON DAM, TENN.
Location. Lat 36°31'25", long 82°05'50", on right bank 1,900 ft downstream from South Holston Dam Powerhouse, 1.0 mile upstream from bridge at Bristol waterworks, 1.0 mile upstream from Thomas Creek, 6.7 miles southeast of. Bristol, Sullivan County, and at mile 49.4.
Drainage area. 703-sq mi.Gage-height record. Water-stage recorder graph. Datum of gage is 1,450.00 ft above
mean sea level, datum of 1929, supplementary adjustment of 1936.Discharge record. Stage-discharge relation defined by current-meter measurements.Maxima. January-February 1957: Discharge, 8,270 cfs 4:10 p.m. Feb. 12 (gage height,
40.45 ft).1951 to December 1956: Discharge, 3,360 cfs Sept. 13, 1953 (gage height, 37.70 ft). Maximum stage known since at least 1791, about 55 ft in March 1867, from profile
by Tennessee Valley Authority.Remarks. Flow regulated by South Holston Lake.
Mean discharge, in cubic feet per second, 1957
Day
!---.-2----.3---._4-.._.5--..-6----.7__._.8.. ...9.. ...10-___ ll_--_
January
136 927 870
8.9 8.9 8.5 8.9
621 13 43
446
February
2,690 2,530 3,160 3,510 3,490 3,490 3,390 3,300 3,290 3,150 3,800
Day
1 9
1 3
14-.--.15 __ .16 .....17 .....18.- ...199n21 .....22. ....
January
9.3 8.9
1,320 1,060 1,650 1,830 1,910 1,070
10 1,380
357
Monthly mean discharge, in cubic feet per seco
February
7,990 7,780 7,880 7,800 7,530 7,120 7,070 6,690 4,920 3,450 3,490
Day
23---.24-.-.25 .... 26 .... 27.... 28 .... 29 . 30 .... 31.-.-
January
1,290 1.440 1,230
762 59 50 51 31
958
631
February
2,890 1,500 1,770 1,830
771 681
4,177
Gage height, in feet, and discharge, in cubic, feet per second, at indicated time 1957
Hour
Jan. 30
12 p.m...
9--____._10.......12 m -...12:30 p.m1. --_..-.2 __ -.-.3:30--...4:30-...-5. . ......12 p.m...
Gage height
32.71
32.7532.8332.9832.9936.8536.0533.5333.0237.0037.0537.02
Dis charge
13
15213537
2,3001,450
12840
2,4802,5402.500
Hour
Feb. 1*
7:30 -.-..-8---.--._-9:30 _._...10.. ......
3 __ .....4... __ ...8 __ ......
Feb. 2*
10.. ......
Gage height
37.0037.0137.2437.2537.4337.4735.4737.2937.3037.25
37.2537.23
Dis charge
2,4802,4902,7802,8003,0403,090
9672,8502,8602,800
2,8002.770
Hour
Feb. 2* Con.
12 m .--.
2 __ .- ...3 ___ ...6. .--._.-
Feb. 3*
12:30 p.m2 __ .. ..3 _.....__4. __ .--.
Gage height
33.6033.0032.8337.1037.4637.5237.52
37.5137.5237.6837.5234.77
Dis charge
1453821
2,6003,0803,1603,160
3,1503,1603,3903,160
565

FLOODS OF JANUARY-FEBRUARY 1957 IN KENTUCKY A145
Gage height, in feet, and discharge, in cubic feet per second, at indicated time, 1957 Continued
Hour
Feb. 3-Con.
7.... __8--------
6 a.m....12 m ....6 p.m_-_-
Feb. 5
Feb. 6
Feb. 7*
4 __ __ .12 m .._. 6 p.m_--_ 12 p.m.-.
Feb. 8*
2:30 a.m _3. __ ...3:30.....4-------.4-9O
5--------6 __ ....
12 p.m-.-
Feb. 9*
5.- __ ...
Feb. 10*
6 a.m_-_- 5 p.m....
9:30 _---.10... __ .12 p.m__-
Gage height
07 co
97 19
37.6837.75
37.7637.7737.7837.76
37.7537.75
37.7537.75
37.7537.6637.65 37.68 37.66
37.6636.0537.5037.6836.6537.6237.65
37.6407 c c
37.6537.5537.55
37.5037.50 o «7 en
37.6037.5037.45
Dis charge
3,1603,1603,3903,490
3,5003,5103,5303,500
3,4903,490
3,4903,490
3,4903,3603,350 3,390 3,360
3,3601,4503,1403,3902,0703,3003,350
3,3303 3509 9 in3,2103,210
3,1403,140 30 on
3,2803,1403,070
Hour
Feb. 11
89...- ___9:30 ------11--------12 p.m.---
Feb. 12*
2:30 ------3... ______4.... __ ..8--.. __ .-12 m ._..-
1:30... __2. .._....-2:30 ------3:30 ___ _3:45 ------4:10. _____4:30. -----4:45------5------.-.12 p.m--_-
Feb. 13*
8:30 a.m __9- ___ ...12:30 p.m .12:45 __ .-!____-___.5. __ .- __5:15------
9---------
Feb. 14*
8---. __ .8:30 .-.-..10 __ -.--.10:30 __ .-12 m -----12 p.m.-_-
Feb. 15*
6 a.m....
12 p.m-.-
Gage height
37.4637.5039.0039.0039.8539.8440.33
40.3439.5040.2440.3240.2840.2840.3040.1440.1440.2740.3140.14
40.2440.4240.2540.24
40.2240.0840.1240.4040.1340.1040.2740.2740.2340.24
40.2640.3240.2040.1440.3040.2440.22
40.20 40 2240.20
Dis charge
3,0803,1405,6405,6407,1207,1008,030
8,0506,4907,8608,0107,9307,9307,9707,6707,6707,9107,9907,6708 n 7n
7,8608,2107,8807,860
7,8207,5507,6308,1707,6507,5907,9107,9107,8407 ocn
7,8908,0107,7807,6707,9707,8607,820
7,780 7 Q*?n7,780
Hour
Feb. 16*
1:30 ------
12 p.m.___
Feb. 17
12 m -----
12 p.m---.
Feb. 18
12 p.m.---
Feb. 19*
12 m -----1 :15 p.m __1:30 ___ .2:30 ------3... __ ...6---------12 p.m____
Feb. 20*
11:45----.12 m -----
1:45 __ ...2 '30
Feb. 21*
12 m --._.
12 p.m....
Feb. 22
6 a.m.-...12 p.m....
Feb. 23*
10-. __ --.10:30 __ -1:30 p.m __ 2 __ -----12 p.m_-_.
Gage height
40.2040.2539.9039.8839.86
39.8539.8739.8339.82
39.82
39.7939.8039.8239.3439.2839.3739.3939.36
39.4039.4238.72
38.5497 11
37 5397 19
37.5337. 5137.57
37.5837.58
37.5737.5736.9036.89 36.8136.79
Dis charge
7,7807,8807,2107,1707,140
7,1207,1607,0807,070
7,070
7,0107,0307,0706,2206,1206,2706,3006,250
6,3206,3505,190
4,9003,4503 4209 490
3,4203,4803,480
3,4903,490
3,4803,4802,5802,570 2,4602,440
*Flow affected by regulation; daily means cannot be computed exactly from data shown.

A146 FLOODS OF 1957
109. BEAVER CREEK NEAR WALLACE, VA.
Location. Lat 36°38'25", long 82°06'42", on left bank 0.4 mile upstream from ClearCreek, 1.3 miles southeast of Wallace, Washington County, and 3.8 miles northeast ofBristol.
Drainage area. 13.7 sq mi. Gage-height record. Water-stage recorder graph. Datum of gage is 1,808.93 ft above
mean sea level, datum of 1929, supplementary adjustment of 1936.Discharge record. Stage-discharge relation defined by current-meter measurements.Maxima. January-February 1957: Discharge, 278 cfs 4 p.m. Jan. 29 (gage height, 4.48ft).
1945 to December 1956: Discharge, 383 cfs July 15,1948 (gage height, 5.94 ft), fromrating curve extended above 230 cfs on basis of velocity-area studies.
Mean discharge, in cubic feet per second, 1957
Day
1__ __2-.__-3 .....4_____5 ___..6 _____7___ .8 ___ _9 .....10_._.11 ....
January
11 10 10 10 12 11 11 11 23 32 24
Monthly mean dis Runoff, in inches
February
232 175 120 119 102 92
163 178 168 173 112
Day
12 .....13 .....14 _..__15__ ...16 .....17_.-___18 _..__199f>
21 .....22_. ...
January
22 20 18 17 17 15 14 14 13 13 13
charge, in cubic feet per secc
February
84 72 62 56 52 46 44 49 40 37 34
Day
23_.__.24 .....25.. ...26 _____27 _.._.28 _____29 _____in31 _____
January
20 15 15 14 25 97
226 161 214
36.4 3.07
February
31 30 28 28 26 39
85.4 6.49
Gage height, in feet, and discharge, in cubic feet per second, at indicated time, 1957
Hour
Jan. 26
12 p.m___
Jan. 27
12 m __ _ 6 p.m-___
Jan. 28
4____ __ .6-___ ___8 ..._....10 .....__12 m ....
4 ........
Gage height
1.65
1.661.92 2.01 1.94
1.962.062.112.162.202.232.603.90
Dis charge
14
1429 35 30
32384144464870
168
Hour
Jan. 28 Con.
8 _...._...10 ........12 p.m___.
Jan. 29
46 .........8 .........10 ........12 m __ ...2 p.m...-.4_ ___ --.6________8_. _..__._10 ........12 n.m_--_
Gage height
4.234.103.953.75
3.984.274.094.104 OR
4 3^
4.444.484.404.254.134.01
Dis charge
217195174146
170224133195999
. 240259278268250236221
Hour
Jan. 30
8--------12 m ....4 p.m_-_. 8 __.__._.12 p.m...
Jan. 31
2 a.m____4 ___ ...6. ___ ...8 ........10 ___ ...12 m ____
4 ____ ._6 __ __.__8 ........
Gage height
3.803.573.363.19 3.053.14
3.223.303.433.884.184.364.264.084.114.23
Dis charge
198175154137 123132
140148161206242263251230233248

FLOODS OF JANUARY-FEBRUARY 1957 IN KENTUCKY A147
Gage height, in feet, and discharge, in cubic feet per second, at indicated time, 1957 Continued
Hour
Jan. 31
12 p.m__.
Feb. 1
4 a.m____ 8 _____ .12 m __ .
8 _____ .12 p.m___
Gage height
4.294.25
4.16 4.084.014.054.184.03
Dis charge
255250
239 230221226242224
Hour
Feb. 2
12 m _____
12 p.m____
Feb. 3
12 m ._---
12 p.m....
Gage height
3.783.553.353.14
2.972.943.102.95
Dis charge
196173153132
j.16113128114
Hour
Feb. 4
12 m --._6 p.m____12 p.m...
Feb. 5
12 m ---.6 p.m....12 p.m...
Gage height
3.282.952.882.80
2.702.762.982.78
Dis charge
146114108102
9499
116100
110. WATAUGA RIVER NEAR SUGAR GROVE, N. C.
Location. Lat 36°14'18", long 81°49'22", on right bank 300 ft downstream from CoveCreek and 2.3 miles southwest of Sugar Grove, Watauga County.
Drainage area. 90.8 sq mi. Gage-height record. Water stage recorder graph. Datum of gage is 2,607.84 ft above
mean sea level, datum of 1929, supplementary adjustment of 1936. Discharge record. Stage-discharge relation defined by current-meter measurements
below 2,100 cfs and by slope-area measurement at 50,800 cfs. Maxima. January-February 1957: Discharge, 2,200 cfs 10:30 p.m. Jan. 31 (gage height,
6.45 ft).1940 to December 1956: Discharge, 50,800 cfs Aug. 13, 1940 (gage height, 29.6 ft).
Mean discharge, in cubic feet per second, 1957
Day
1 __ ._2_._._3. __ _4__.__5__.._6__.__7_____8-._._9----.10 __ _ 11--..
January
99 80 85 95
128 108 106
95 104 126 119
Monthly mean dis Runoff, in inches
February
1,480 926 568 505 463 502 474 470 877 805 568
Day
12 _____13. ____14__ __15.. __16-. __17.. __18-. __1920_-._.21.. __22_..._
January
112 106
95 88 82 75 70 75 90 80
107
charge, in cubic feet per secc
February
407 329 275 234 214 186 171 188 188 156 144
Day
23. ___24_____25. __26.. ___27.....28. ....29.. ___ 30_____31.. __
January
338 196 161 142 168 510
1,030 713
1,250
214 2.72
February
137 130 135 959 516 666
___.__,__,__,__
453 5.19

A148 FLOODS OF 1957
111. WATAUGA LAKE NEAR ELIZABETHTON, TENN.
Location. Lat 36°19'20", long 82°07'06", at Watauga Dam on Watauga River, 5 miles east of Elizabethton, Carter County, Term., and at mile 36.7.
Drainage area. 468 sq mi.Gage-height record. Water-stage recorder graph. Datum of gage is at mean sea level,
datum of 1929, supplementary adjustment of 1936.Maxima. January-February 1957: Contents at 12 p.m.,249,800 cfs-days Feb. 28 (eleva
tion, 1,946.96 ft).1948 to December 1956: Contents, 285,900 cfs-days June 24, 1950 (elevation, 1,958.58
ft).Remarks. Storage capacity, 342,200 cfs-days (elevation, 1,975.00 ft) of which 316,200
cfs-days is controlled storage. Records furnished by Tennessee Valley Authority.
Elevation, in feet, and contents, in cfs-days at 12 p.m. of indicated day, 1957
Day
1-...2....3. __4____5____6 __ .7 __ .8 __ .9 __ i10 __11. .J12_._1 Q14 __ 15...16...
January
Elevation
1,910.011,909.611,909.421,909.611,909.911,910.221,910.541,910.621,911.001,911.481,911.801,912.121,912.401 Q1 9 R7
1 Q1 9 Aft
1,911.94
Contents
153,500152,600152,200152,600153,200154,000154,700154,900155,700156,800156,600158,3001 RR Qnn1 RQ ^nni co i nn
157,900
February
Elevation
1,925.581,927.921,929.201,930.501,931.701,932.991,934.191,935.601,937.871,939.861,940.911,941.68i QA9 9 R
1 Qd.9 RQ
1 1 CkA Q D Q
1,943.43
Contents
190,900196,900200,300203,700206,900210,300213,600217,400223,700229,300232,200234,400236,100oQ7 Qnn
238,500239,500
Day
17 ...18 ...19___20._.21. ..22 ...23 ...24 ...25.--26.-.27...28 ...9Q
Qn91
January
Elevation
1,911.111,910.261,909.811,909.991,909.651,909.871,910.101,909.901,909.801,909.911,910.441,913.081,916.781 Q1 Q n R
1 Q99 nR
Contents
156,000154,000153,000153,400152,700153,200153,700153,200153,000153,200154,400160,500169,200174,700182,000
February
Elevation
1,943.721,943.981,944.211,944.391,944.561,944.631,944.831,945.061,945.281,945.921,946.411,946.96
Contents
240,300241,100241,700242,300242,800243,000243,600244,200244,900246,800248,200249,800
112. WATAUGA RIVER BELOW WILBUR DAM, TENN.
Location. Lat 36°20'39", long 82°07'46", 1,800 ft downstream from Wilbur Dam, 0.7mile downstream from Big Laurel Branch, 2.7 miles downstream from Watauga Dam,and 5 miles east of Elizabethton, Carter County.
Drainage area. 471 sq mi. Gage-height record. Water-stage recorder graph. Datum of gage is 1,550.00 ft above
mean sea level, datum of 1929, supplementary adjustment of 1936.Discharge record. Stage-discharge relation defined by current-meter measurements. Maxima. January-February 1957: Discharge, 2,890 cfs 7:30 p.m. Jan. 3 (gage height,
35.38 ft).1902-8, 1948 to December 1956: Discharge, 21,500 cfs Jan. 22, 1906 (gage height,
13.6 ft, at site 2 miles downstream at different datum), from rating curve extendedabove 2,500 cfs.
The flood of Aug. 13, 1940 (discharge, 71,500 cfs at former gaging station at Butler,drainage area, 427 sq mi) is believed to have exceeded all other known floods, includingthat of March 1867, from profile and report of Tennessee Valley Authority.
Remarks. Flow completely regulated by Watauga Lake.

FLOODS OF JANUARY-FEBRUARY 1957 IN KENTUCKY
Mean discharge, in cubic feet per second, 1957
A 149
Day
l---_.2. ....3---_.45 ____ .6----.7.....8_. ...g10.___ 11. __
January
89 970 706
79 58 57 56
384 54 52
292
February
162 140 46 46 44
150 47 69
125 133 513
Day
12.. __13 _____14__ __15_____16_____17 __ ..18 _____1920_____21 __ __22_____
January
51 51
320 594
1,720 2,150 2,260 1,390
60 1,190
60
Monthly mean discharge, in cubic feet per secc
February
87 60 58 57 57 56 58
163 306 248 229
Day
23 _____24.. __25__.._26.. ___27___-.28..--.29-.---30___._31_____
January
562 1,010
848 416
53 150 146 166 118
520
February
58 58 57 57 56 54
114
113. DOE RIVER AT ELIZABETHTON, TENN.
Location. Lat 36°20'40", long 82 0 12'37", on left bank 1,500 ft upstream from bridge onState Highway 91 at Elizabethton, Carter County, and 1 mile upstream from mouth.
Drainage area. 137 sq mi. Gage-height record. Water-stage recorder graph. Datum of gage is 1,524.73 ft above
mean sea level, datum of 1929, supplementary adjustment of 1936. Discharge record. Stage-discharge relation defined by current-meter measurements
below 4,000 cfs and by slope-area measurement at 6,350 cfs. Maxima. January-February 1957: Discharge, 4,990 cfs 12:30 a.m. Feb. 1, (gage height,
5.65 ft).1911-16, 1920-31, 1932 to December 1956: Discharge, 7,300 cfs July 30, 1940 (gage
height, 6.75 ft).Flood of May 21, 1901, reached a stage of 10.5 ft (discharge, 39,000 cfs) from report
by Tennessee Valley Authority.
Mean discharge, in cubic feet per second, 1957
Day
I-.-..2_____34----.56__-_-7__.._8 __ ..Q
10....
11..-.
January
159 134 109 149 284 271 255 225 243 284 284
Monthly mean dis Runoff, in inches
February
3,300 2,220 1,210 1,190 1,280 1,200 1,110 1,160 1,690 2,060 1,340
Day
12.....13_____14.---.15.. __16.-.-.17.....18--.__19--.-.9 n21...._22.. ___
January
258 234 207 184 179 149 109 129 149 165 157
charge, in cubic feet per secc
February
862 670 540 458 426 363 331 343 331 287 271
Day
23.. __24.. __25....-26.. __27. _.__28.. __29-__-.30. _ __ 31 _____
January
301 237 213 210 324
1,870 2,7602,110 2,330
473 3.98
February
258 249 243 290 274 335
----------
868 6.59

A150 FLOODS OF 1957
Gage height, in feet, and discharge, in cubic feet per second, at indicated time, 1957
Hour
Jan. 26
12 p.m...
Jan. 27
6 a.m.... 12 m --.- 6 p.m.... 12 p.m...
Jan. 28
6 a.m___-12 m .... 2 p.m.__- 4 ___ ...6. _____12 p.m...
Jan. 29
2 a.m.__. 6 __ __ .12 m --.- 2 p.m____ 4___...__8 __ __ .10:30 .... 12 p.m-_-
Jan. 30
6 a.m___-12 m .... 6 p.m.... 12 p.m...
Jan. 31
5 a.m.... 12 m .... 6 p.m.__.
Gage heignt
1.23
1.23 1.33 1.85 2.43
3.03 3.89 4.10 4.15 4.13 4.79
4.80 4.47 3.86 3.73 3.80 4.88 5,26 5.17
4.30 3.73 3.35 3.15
3.17 3.78 4.50
Dis charge
199
199 228 418 702
1,070 2,020 2,290 2,350 2,320 3,280
3,300 2,710 2,000 1,730 1,810 3,450 4,210 4,030
2,520 1,790 1,440 1,360
1,370 1,910 2,840
Hour
Jan. 31 Con.
Feb. 1
12:30 a.m.. 6 __ ......12 m .---..
8 __ __ ...10 __ ___ .12 p.m--__.
Feb. 2
12 m __ ..
12 p.m.....
Feb. 3
12 m __--._
12 p.m--._-
Feb. 4
Q
12 p.m___._
Feb. 5
6__. __ ...-8 __ .......9. -----_--.
Gage height
5.63
5.65 5.00 4.40 4.20 4.60 4.83 4.88
4.46 4.00 3.60 3.33
3.08 2.94 2.87 2.75
2.68 3.10 3.26 3.25
3.09 2.94 2.95 3.04 3.00 3.01
Dis charge
4,950
4,990 3,690 2,630 2,380 2,930 3,360 3,450
2,760 2,100 1,630 1,360
1,310 1,190 1,130 1,040
987 1,300 1,390 1,380
1,320 1,190 1,190 1,270 1,240 1,250
Hour
Feb. 6
12 m .....
12 p.m....
Feb. 7
6 a.m__._.2 p.m_--_-8 ___ __ .10 ___ ...12 p.m....
Feb. 8
6 a.m____.12 m -.__.6 p.m.___.12 p.m....
Feb. 9
10--------4 p.m____-12 p.m___.
Feb. 10
2 a.m--__-8:30 ------6 p.m___-.12 p.m....
Feb. 11
6 a.m_____12 m --__-6 p.m___._12 p.m....
Gage height
2.90 3.04 2.95 2.91
2.87 2.75 2.86 2.98 2.98
2.86 2.82 3.01 3.00
3.46 3.75 3.69 3.41
3.34 4.38 3.87 3.08
3.33 3.10 2.90 2.75
Dis charge
1,150 1,270 1,190 1,160
1,120 1,030 1,110 1,210 1,210
1,110 1,070 1,230 1,220
1,600 1,930 1,860 1,540
1,480 2,630 2,170 1,280
1,620 1,390 1,190 1,040

FLOODS OF JANUARY-FEBRUARY 1957 IN KENTUCKY A151
114. WATAUGA RIVER AT ELIZABETHTON, TENN.
Location. Lat 36°21'21",long 82°13'26",on left bank 25 ft upstream from bridge on U.S. Highway 19E at Elizabethton, Carter County, 0.6 mile downstream from Doe River, and at mile 25.9.
Drainage area. 692 sq mi.Gage-height record. Water-stage recorder graph. Datum of gage is 1,486.23 ft above
mean sea level, datum of 1929, supplementary adjustment of 1936.Discharge record. Stage-discharge relation defined by current-meter measurements.Maxima. January-February 1957; Discharge, 8,000 cfs 5 a.m. Jan. 29 (gage height,
8.61 ft).1925-^9, 1953 to December 1956: Discharge, 75,100 cfs Aug. 14, 1940 (gage height,
20.87 ft), from rating curve extended above 29,000 cfs on basis of contracted-opening measurement of peak flow.
Maximum stage known, about 21 ft in May 1901 (discharge, 75,900 cfs), from high- water profile by Tennessee Valley Authority. Floods of 1886 and 1902 each reached a stage of about 19 ft and the flood of 1867 reached a stage of about 18 ft, from report by Tennessee Valley Authority.
Remarks. Flow partly regulated by Watauga Lake, 10 miles upstream.
Mean discharge, in cubic feet per second, 1957
Day
I.....2 __ ._3---..4_____5 _____6--__-7_____8_. ___9__ ___10-__- 11---.
January
287 1,140
917 290 480 460 435 712 518 716 907
February
5,680 3,910 2,050 2,090 2,230 2,230 1,980 2,260 3,500 3,730 2,800
Day
12_.___13 __ _14 _____15_____16 _____17. __ .18. __ _19_____">f\
21. ____22. ____
January
524 465 620 902
1,800 2,550 2,500 1,640
363 1,400 287'
Monthly mean discharge, in cubic feet per seco
February
1,580 1,170
939 779 709 608 553 670 788 675 634
Day
23 ___. 24. __ 25 ____ 26 __ 27 ____ 28 ____ 29---.30 ____ 31
nd____ __ -------
January
912 1,430 1,180
718 552
3,730 5,6203,9503,860
1,350
February
430 406 397 440 425 518
1,578
Gage height, in feet, and discharge, in cubic feet per second, at indicated time, 1957
Hour
Jan. 26
12 p.m...
Jan. 27*
12 m ---. 6 p.m___. 12 p.m...
Jan. 28*
Gage height
2.97
2.73 2.70 2.83 3.32 4.14
4.92
Dis charge
465
352 339 397 674
1,330
2.070
Hour
Jan. 28*-Con.
12 m __ ..
8... ______
Jan. 29*
4. ________5. ___ ___
Gage height
6.30 6.96 7.20 8.19 8.00 8.28
8.30 8.28 8.12 8.16
Dis charge
3,670 4,640 5,020 7,020 6,600 7,220
7,260 7,220 6,860 8.000
Hour
Jan. 29*-Con.
10 ________
6 _________10.--. __ _11 ________12 p.m_.__
Jan. 30*
9. --------
Gage height
7.65 7.00 6.42 7.17 8.02 8.06 8.01
7.10 7.67 6.46
Dis charge
5,860 4,700 3,840 4,970 6,640 6,730 6,620
4,860 5,900 3,890

A152 FLOODS OF 1957
Gage height, in feet, and discharge, in cubic feet per second, at .indicated time, 1957 Continued
Hour
Jan. 30* Con
12 m ....
q
Jan. 31*
5 a.m.... 8 __ _ ...12 m ....
8. __ ....9. ._..._.
Feb. 1*
10-.. ....11------.12 m ....
3 ._...._5.. ._..._6-.--.--.7...-..-.8.... __ .11------.
12 m ..._ 1 p.m.... 2-.-._ _.3---. __ .6__ __ ..
6 p.m.... 12 p.m.._
Gage height
6.776.225.58R 39
5 9 9
5.22 5.426.007.058.278.158 43
8.467.347.907.526.966.866.867 34
7.247 94
7.427.42
7 346.35 7.09 6.506.171 7R5 34
5.034.70 4.65
Dis charge
4 34n3 5702,7802,4902,380
2,380 2,6003,2804,7807 i an6,9307,570
7,6405,2706,3805,6004,6404,4804,480^ 97n5,0905,0905,4205,420
^ 97n3,740 4,840 3,9503,5002.9902,510
2,1801,850 1,800
Hour
Feb. 4*
12 m .....
6. __ __
Feb. 5
12 m ._---
8. __ ___..10 __ _____
Feb. 6*
10 __ __ __12 m __--.
3 _____ ._6 _____ ..
Feb. 7
11________
6.. ___ ..10. ___ ..
Feb. 8*
12 m ..-.-4 p.m___._5___,_____7. .__..-. _
Feb. 9*
Gage height
4.604.885.105.28£> 39
5 39
5.185.004.925.005.055.05
4.955.046.125.505.114.984.88
4.804.794.714.815.005 04
5.004.955.105.505.305.27
5.53
Dis charge
1,7602,0302,2502.4502,4902 AQf\
2,3402,1502,0702,1502,2002,200
2,1002,1903,4402,6902,2602,1302,030
1,9501,9401,8601,9602,1502,190
2,1502,1002,2502,6902,4702,440
2,720
Hour
Feb. 9* Con
9_. _______10.- __ --.11.. ___ .12 m _....
12 p.m....
Feb. 10*
6... __ _-.8___-----_10. ___ .._11. -------
3___ __ ---6.--- __ --12 p.m....
Feb. 11*
6 a.m...-.9..- __ ...10 ___ ___11. _ __ -.-12 m _____
2_. _______3. __ __ .4. .----__-6_. -------8..- __ ___10.. __ -._12 p.m....
Feb. 12*
10__------11. -------12 m ._._.
6___.__ __12 p.m-_--
Gage height
6.076.407.186.826.586.295.82
5.706.356.676.797.526.756.486.265.83
5.465.326.456.005.506.356.886.506.025.504.944.794.70
4.524 424.674.554.374.264.15
Dis charge
3,3703,8104,9904,4204,0603,6603,060
2,9203,7404,2004,3805,6004,3203,9203,6203,080
2,6502,4903,8803,2802,6903,7404,5103,9503,3102,6902,0901,9401,850
1,6801,5801 09 f\
1,7101,5401,4401,340
*Flow affected by regulation; daily means cannot be computed exactly from data shown.

FLOODS OF JANUARY-FEBRUARY 1957 IN KENTUCKY
115. BOONE LAKE AT SPURGEON, TENN.
A153
Location. Lat 36°26'26", long 82°26'16", at Boone Dam on South Fork~Holston River in Sullivan County, Tenn., 0.7 mile northeast of Spurgeon, Washington County, Tenn., 1.3 miles downstream from Watauga River, and at mile 18.6.
Drainage area. 1,840 sq mi.Gage-height record. Water-stage recorder. Datum of gage is at mean sea level, datum
of 1929, supplementary adjustment of 1936.Maxima. January-February 1957: Contents at 12 p.m., 70,800 cf s-days Feb. 1 (elev.,
1,370.36 ft).1952 to December 1956: Contents, 98,100 cfs-days June 10, 1953 (elev., 1,384.52 ft).
Remarks. Storage capacity, 99,200 cfs-days (elevation, 1,385.0 ft) of which 75,700 cfs- days is controlled storage. Records furnished by Tennessee Valley Authority.
Elevation, in feet, and contents, in cfs-days at 12 p.m. of indicated day, 1957
Day
!_---2____3--..4---.5_._-6_.._7 __8 __9-..-10...11-.-12_-_13_-_14 __15 ...16.. .
January
Elevation
1,358.301,357.661,357.251,356.991,357.331,357.601,357.671,358.111,359.201,359.951,359.341,358.391,358.661,358.111,357.851,355.82
Contents
52,60051,80051,30050,90051,40051,70051,80052,40053,90054,90054,00052,80053,10052,40052,10049,400
February
Elevation
1,370.361,369.321,366.641,367.551,366.641,365.691,365.811,366.261,365.481,365.151,362.691,361.801,363.501,365.021,366.121,366.65
Contents
70,80069,10064,70066,20064,70063,30063,40064,20062,90062,40058,80057,50060,00062,20063,90064,800
Day
17-.-18 __19 ...n.__21 ...22 ...23 ...24...25...26...27--.28 ...29...30 ...31. __
January
Elevation
1,354.701,353.601,353.081,353.451,352.761,353.081,352.751,352.691,353.101,353.821,354.921,361.081,367.861,366.831,368.08
Contents
48,00046,70046,10046,50045,70046,10045,70045,60046,10047,00048,30056,50066,70065,00067,000
February
Elevation
1,366.771,366.841,366.801,367.551,367.311,366.951,367.451,368.691,369.371,369.241,369.001,369.62
Contents
65,00065,10065,00066,20065,80065,20066,00068,00069,10068,90068,50069,600
116. FORT PATRICK HENRY LAKE NEAR KINGSPORT, TENN.
Location. Lat 36°29'53", long 82°30'32", at Fork Patrick Henry Dam on South Fork Holston River, 0.2 mile upstream from bridge on U.S. Highway 23, 4.5 miles southeast of Kingsport, Sullivan County, Tenn., and at mile 8.2.
Drainage area. 1,903 sq mi.Gage-height record. Water -stage recorder graph. Datum of gage is at mean sea level,
datum of 1929, supplementary adjustment of 1936.Maxima. January-February 1957: Contents at 12 p.m., 13,400 cfs-days Jan. 16 (elev.,
1,262.42 ft).1953 to December 1956: Contents, 14,000 cfs-days Feb. 11,1954 (elev., 1,263.80 ft).
Remarks. Storage capacity, 13,700 cfs-days (elevation, 1,263.00 ft) of which 2,200 cfs- days is controlled storage. Records furnished by Tennessee Valley Authority.

A154 FLOODS OF 1957
Elevation, in feet, and contents, in cfs-days at 12 p.m. of indicated day, 1957
Day
!-___2_.__3____4....5___.6 __7____8 __9 ....10 ...11 ...12 ...13 ...14 ...15 ...16...
January
Elevation
1,259.361,259.801,260.851,261.001,260.751,260.281,260.461,259.911,259.971,259.751,258.921,258.631,258.721 9-^Q MJL t £i oy .01 1,260.421,262.42
Contents
12,10012,30012,700
.12,80012,70012,50012,50012,30012,30012,20011,90011,80011,80012,10012,50013,400
February
Elevation
1,261.561,261.591,280.541,259.791,259.841,259.011,259.601,259.461,258.461,258.591,259.071,259.331,259.451 2 58 491 9 ^R A. <\JL t £* OO.*± J
1,258.50
Contents
13,00013,00012,60012,20012,30011,90012,20012,10011,70011,70011,90012,00012,10011,70011,70011,700
Day
17...18...19...20.. .21 ...22 ...23...24 __25 ...26 ...27 ...28-_.29 ...30-11O J. _ _ .
January
Elevation
1,261.751,259.661,259.071,258.381,259.141,258.931,259.901,260.091,261.491,261.651,261.151,260.501,260.901,260.371,260.75
Contents
13,10012,20011,90011,60012,00011,90012,30012,40013,00013,10012,80012,60012,70012,50012,700
February
31evation
1,258.831,258.651,258.721,259.501,258.551,259.701,259.511,260.061,260.031,259.361,259.46,1,260.44
Contents
11,80011,80011,80012,10011,70012,20012,10012,40012,40012,10012,10012,500
317. SOUTH FORK HOLSTON RIVER AT KINGSPORT, TENN.
Location. Lat 36°31'51", long 82°33'29", on left bank 1,000 ft downstream from new bridge on State Highway 81, 1? miles upstream from Reedy Creek, and 3-3/4 miles upstream from confluence with North Fork Holston River.
Drainage area. 1,935 sq mi.Gage-height record. Water-stage recorder graph. Datum of gage is 1,175.84 ft above
mean sea level, datum of 1929, supplementary adjustment of 1936.Discharge record. Stage-discharge relation defined by current-meter measurements.Maxima. January-February 1957: Discharge, 15,800 cfs 4 5 a.m. Feb. 10 (gage height,
6.67 ft).1925 to December 1956: Discharge, 68,800 cfs Aug. 14, 1940 (gage height, 18.80 ft,
at site 2 miles upstream at datum 8.47 ft higher).Flood of May 1901 reached a stage of about 23 ft, original site and datum (discharge,
110,000 cfs), the flood of March 1867 was about 0.5 ft lower and the flood of March 1791 was about 3 ft lower than the flood of May 1901, from reports by Tennessee Val ley Authority.
Remarks. Flow regulated by South Holston, Watauga, Boone, and Fort Patrick Henry Lakes. 'Some diversion upstream by city of Kingsport, Tennessee Eastman Corpora tion, and Holston Ordnance Works.

FLOODS OF JANUARY-FEBRUARY 1957 IN KENTUCKY
Mean discharge, in cubic feet per second, 1957
A155
Day
1__ __2 _.._.3 .....4_.___5.-...6 .....7.....8 __ .9--___10 __ .11 __ _
January
704 2,820 2,060 1,300
720 736 710
1,190 968
1,320 3,330
February
14,300 15,200 15,200
9,240 10,100 12,100 9,180 9,450
15,600 15,200 14,300
Day
12.....13 __ .14 .....15 .....16----.17 __ .18 .....19 .....20 .....21_____22__.._
January
2,720 818
2,270 2,570 4,720 6,500 6,750 4,240 1,220 3,260 1,180
Monthly mean discharge, in cubic feet per seco
February
14,100 9,120 8,910 8,700 9,000 9,030 9,030 9,060 6,440 5,840 5,080
Day
23 .... 24 __ 25 .... 26 ___ 27_ ... 28. ... 29_ ...30....31. ...
nd
January
2,520 3,130 1,870 1,300
894 2,360 5,030
12,60010,200
2,968
February
3,870 870
1,800 3,590 2,740 1,390
-----------
8,873
Gage height, in feet, and discharge, in cubic feet per second, at indicated time, 1957
Hour
Jan. 28
12 p.m....
2 a.m_.._.3_. __ ....467..... __ .89_. __.-._.10 __ __ .12 m __ .
5:30 ___ .9___- __ ..11... __ ..12 p.m....
Jan. 30*
1 a.m..... 3 __ __ .9___. __ ..10 ____ ..
11:30 __ .12 p.m....
Jan. 31*
3 ______ .4 _____ ..
Gage height
1.70
1.211.741.552.572.813.373.154.783 O 0
^ ^
4.754.753.205.00
5.84 5.965.966.046.036.015.60
4 504.014.41
Dis charge
1,690
1,0401,750.1,4703,2203,6804,9104,4108,6404,8104,8608,5508,5504,5209,300
12,100 12,50012,50012,90012,8001 9 7nn11,200
7,8006,4707.530
Hour
Jan. 31* Con
6 __ __ ...7... __ ...8 ..__.._._9 .........11 ___ ...
2 .__._.._.6. ._____..12 p.m....
Feb. 1
10 ___ ...
4. ___ ...6. ._._.._.
Feb. 2
7 a.m.....10 __._....12 m .....
12 p.m....
Feb. 3
12 m .....
12 n.m. ...
Gage height
4.424.564.404.584.684.765.916.046.046.08
6.156.196.516.536.596.57
6.526.506.596 596.58
6.576.586.566.12
Dis charge
7,5607,9807,5008,0408,3408,580
12,30012,90012,90013,000
13,30013,50015,00015,00015,40015,200
15,00014,90015,40015,40015,300
15,20015,30015,20013.200
Hour
Feb. 4
2 a.m.....4 .........10 ____ ..12 m . ....2 p.m.....6..... __ .12 p.m....
Feb. 5*
1:30 a.m..3 ______ .5___ __ ..7... __ ..2 p.m.....4___- __ _.5 ..._.__..8 __ ___ _9__ ..-_--.12 p.m_-__
Feb. 6*
12 m . __ _
4 .._.._.._12 p.m....
Feb. 7
12 m .....6 D.m_._-_
Gage height
5.024.934.914.804.854.964.96
2.524.424.584.654.706.096.286.386.486.48
6.496.494.994.954.93
4.935.004.98
Dis charge
9,3609,0909,0308,7008,8509,1809,180
3,1307,5608,0408,2508,400
13,10013,90014,40014,80014,800
14,90014,9009,2709,1509,090
9,0909,3009,240
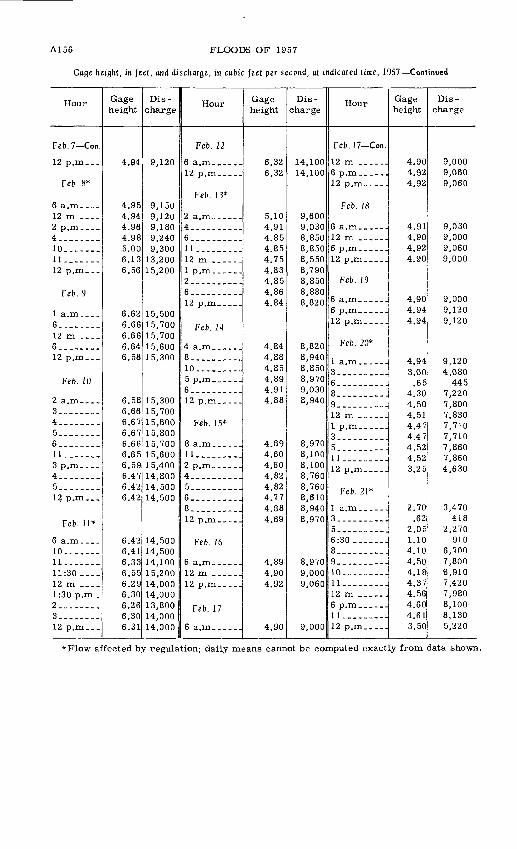
A156 FLOODS OF 1957
Gage height, in feet, and discharge, in cubic feet per second, at indicated time, 1957 Continued
Hour
Feb. 7 Con.
12 p.m...
Feb. 8*
6 a.m--_- 12 m ---.
4__ __ ..10. ___ .ll--._---12 p.m_--
Feb. 9
6. __ __12 m __ 6._ _..._.12 p.m...
Feb. 10
2 a.m __ .3____ __ .4 _____ .5. ....._.6.-__----ll._-.---
4. ....-._5.. ___ .12 p.m...
Feb. 11*
10.._.-__ll--_--_-11:30 _.._12 m __.-
2........312 p.m---
Gage height
4.94
4.95 4.944 964.985.006.136.56
.04
6.666.66 6.646.58
6.586.666.676.676.666.656.596.476.426.42
6.426.416.336.556296.306.266.306.31
Dis charge
9,120
9,150 9,1209,1809,2409,300
13,20015,200
15,500 15,70015,700 15,60015,300
15,30015,70015,80015,80015,70015,60015,40014,80014,50014,500
14,50014,100
14,00014,00013,800
14,000
Hour
Feb. 12
6 a.m___.._
Feb. 13*
2 a.m......4.. __ __ .6..........ll---...--_12 m ___ _
2...... __ .6-... ......12 p.m.....
Feb. 14
4 a.m___.._8.. ....--._10. ___ .._5 p.m___--_6 __ __ ...12 p.m..-.-
Feb. 15*
8 a.m_.-._.11... _..--.
4____ __ ..5. __ __ ...6 __ ___ .8 __ ___ .12 p.m--_--|
Feb. 16
12 m ___ .
Feb. 17
Gage height
6.326.32
5.104.914.854.854.754.834.854.864.84
4.844.884.854.894.914.88
4.894.604.604.824.824.774.884.89
4.894 904.92
4.90
Dis charge
14,10014,100
9,6009,0308,8508,8508,5508,7908,8508,8808,820
8,8208,9408,8508,9709,0308,940
8,9708,1008,1008,7608,7608,6108,9408,970
8,9709,0009,060
9,000
Hour
Feb. 17 Con.
12 m ---...
12 p.m.....
Feb. 18
12 m _--_-.,
12 p.m-__-J
Feb. 19
6 a.m__._.^
12 p.m_--_.
Feb. 20*
9---_-_-_^
1 p.m.--.-. 3
5 1
11.-------J
Feb. 21*
q
5.. __ ____6:30 _______|8.-.......H9 __ . j10-_.-----.ll._. ---_-.12 m -_---J
ll______-_.12 p.m.....
Gage height
4.904.924.92
4.914.904.924.90
4.904.944.94
3.00K ^
4.304.50
4.474.47
O ,£A U
2.70.62
2.051.104.104.504.184.374.564.604.613.50
Dis charge
9,0009,0609,060
9,0309,0009,0609,000
9,0009,1209,120
9 1 on
4,080445
7,220 7,800
7,710
7 O£n
4,630
3,470418
2,270910
6,7007,8006,9107,4207,9808,1008,1305,220
*Flow affected by regulation; daily means cannot be computed exactly from data shown.

FLOODS OF JANUARY-FEBRUARY 1957 IN KENTUCKY A157
118. NORTH FORK HOLSTON RIVER NEAR SALTVILLE, VA.
Location. Lat 36°53'48", long 81°44'47", on right bank 0.5 mile upstream from Cedar Branch bridge, 1.5 miles northeast of Saltville, Smyth County, and 7.8 miles down stream from Laurel Creek.
Drainage area. 222 sq mi.Gage-height record. Water-stage recorder graph. Datum of gage is 1,703.53 ft above
mean sea level, datum of 1929, supplementary adjustment of 1936.Discharge record. Stage-discharge relation defined by current-meter measurements
to 7,200 cfs and by slope-area measurement at 16,500 cfs.Maxima. January-February 1957: Discharge, 16,500 cfs 9 p.m. Jan. 29 (gage height,
13.20 ft).1907-8, 1920 to December 1956: Discharge, 13,100 cfs Feb. 18, 1944 (gage height,
10.75 ft).
Mean discharge, in cubic feet per second, 1957
Day
1 _____2_____3 _____4 __ _5. __ _6 _____7. __8_____9 _____10. ___ 11___-
January
213 181 138 174 228 292 304 284
1,820 3,340 1,500
Monthly mean dis Runoff, in inches
February
5,580 3,300 1,760 1,310 1,370 2,000 1,950 2,970 5,290 3,730 2,280
Day
12____.1 ^14 _____15 _____16 _____17__ __18 _____19 _____20_____21 _____22_____
January
1,320 1,020
488 376 322 260 220 210 200 206 228
charge, in cubic feet per seco
February
1,320 980 735 578 485 415 365 435
1,160 840 644
Day
23 ___ .9A
25.....26 __ .27 __ .28 __ . 29 __ .30 ___ .31 ___ .
nd __________ .
January
635 770 565 440 483
2,890 10,300
7,1904,220
1,317 6.84
February
506 430 387 382 387 410
1,500 7.04
Gage height, in feet, and discharge, in cubic feet per second, at indicated time, 1957
Hour
Jan. 26
12 p.m_._
Jan. 27
6 a.m____ 12 m ____ 6 p.m __ 12 p.m___
Jan. 28
4 a.m____ 8__ __ _-.12 m __ _ 4 p.m.... 8__ ___ _12 p.m___
Gage height
1.80
1.77 1.84 2.09 2.42
2.80 3.46. 4.37 5.38 6.30 6.87
Dis charge
390
376 410 558 784
1,050 1,600 2,580 3,830 5,030 5,770
Hour
Jan. 29
2___ __ __3 _________4___ __ __5 _________6 __ _ _____7 __ __ ____8 _________9 _________10 ________11 ________12 m __ __
2_ __ ____3 _________45 _________
Gage height
6.90 6.92 6.92 6.92 6.93 6.99 7.15 7.42 7.70 8.08 8.60 9.25 9.85
.10.52 11.05 11.65 12.10
Dis charge
5,810 5,840 5,840 5,840 5,850 5,930 6,140 6,490 6,880 7,420 8,200 9,200
10,200 11,300 12,200 13,400 14,300
Hour
Jan. 29 Con.
7 __ _. __ _.8 ______ ..9-________.10 __ __ .11_____ __ .12 p.m.....
Jan. 30
4 ______ -.6 ______ _.8 __ ___ _.|10_. __ __J12 m _ __ _J
Gage height
12.52 12.90 13.15 13.20 13.15 12.90 12.63
11.90 10.95 9.80 8.65 7.60 6.90 6.27
Dis charge
15,100 15,900 16,400 16,500 16,400 15,900 15,400
13,900 12,000 10,100 8,280 6,740 5,810 4,990
690-137 O - 64 - 11

A158 FLOODS OF 1957
Gage height, in feet, and discharge, in cubic feet per second, at indicated time, 1957 Continued
Hour
Jan. 30 Con,.
6 __ ....8 ........10.......
Jan. 31
8 __ ....12 m ....
8 ___..___
Feb. 1
Gage height
5.825.455.184.974.78
4.534.674.936.487.207.57
7.60
Dis charge
4,4103,9203,5703,3003,070
2,7702,9303,2505,2606,2006,700
6,740
Hour
Feb. 1 Con.
12 m ......
8 ______ .
Feb. 2
12 m _.....
Feb. 3
12 m .. __ .
Gage height
7.356.716.145.855.72
5.464.954.474.08
3.773.573.42
Dis charge
6,4005,5604,8204,4404,280
3,9403,2802,6902,260
1,9201,7101,570
Hour
Feb. 3 Con.
12 p.m...-.
Feb. 4
12 m _..._.
Feb. 5
12 m .. __ .
12 p.m.....
Gage height
3.30
3.223.133.022.91
2.832.993.373.82
Dis charge
1,460
1,3901,3101,2201,180
1,1201,2501,5201,970
119 NORTH FORK HOLSTON RIVER AT HOLSTON, VA.
Location. Lat 36°46'29", long 82°04'22", on left bank at downstream side of bridge on U.S. Highway 19, 100 ft downstream from Greendale Creek, 0.4 mile upstream from Garrett Creek, 0.5 mile east of Holston, Washington County, and 0.6 mile upstream from Little Moccasin Creek.
Drainage area. 402 sq mi.Gage-height record. Water-stage recorder graph. Datum of gage is 1,437.11 ft above
mean sea level, datum of 1929, supplementary adjustment of 1936.Discharge record. Stage-discharge relation defined by current-meter measurements
below 12,000 cfs and by slope-area measurement at 24,200 cfs.Maxima. January-February 1957: Discharge, 24,300 cfs 12 p.m. Jan. 29 (gage height,
16.50 ft).1951 to December 1956: Discharge, 12,800 cfs Apr. 16, 1956 (gage height, 12.93 ft).
Mean discharge, in cubic feet per second, 1957
Day
1 .....2__ ...3._...4 ___ _5.. ...6__ ...7 __ .8 __ .9.....10. ... 11.-..
January
368 328 261 288 400 498 528 504
1,880 5,220 2,640
Monthly mean dis Runoff, in inches
February
10,600 6,040 3,220 2,600 2,520 3,400 3,950 5,080 8,600 7,000 3,960
Day
12 _____13.-...14 _____15 __ -.16 _____17 _____18 _____1 Q
20 _____21-. __22 __ .
January
1,620 1,140
875 665 552 440 330 300 342 364 396
charge, in cubic feet per seco
February
2,340 1,660 1,260 1,000
880 742 654 880
1,740 1,300 1,000
Day
23 __ .24 __ .25..-..26 ___ .27 ___ .28 ___ .29_--_.30.---. 31 ___ .
nd _______ .-.--.
January
1,120 1,280
945 770
1,010 5,000
15,90014,100
7,020
2,164 6.20
February
852 742 688 660 649 742
----------
2,570 6.91

FLOODS OF JANUARY-FEBRUARY 1957 IN KENTUCKY
Gage height, in feet, and discharge, in cubic feet per second, at indicated time, 1957
A159
Hour
Jan. 26
12 p.m___
Jan. 27
12 m __ .
Jan. 28
8 ______12 m __ _
8 __ __
Jan 78
4__-_ ___.6 ..._..__8. ____._.10-------12 m ....2 p.m_-__ 4---.. ...6 __ ....8 ...._.._10 __ ....
Gage height
3.45
3.443.854.364,65
5.356.457.58 9 47
10.2610.56
10.8111.1011.5012.0012.5513.1913.88 14.6515.4515.98.16.4216.50
Dis charge
665
658945
1,3301,560
2,1203,0404,300 6,9608,3208,920
9,42010,00010,90012,00013,30014,90016,700 18,80021,20099 7nn24,10024,300
Hour
Jan. 30
4. ______ .6. ___ __ .8 ______ .10 ___ .._.12 m ___ .
4 ______ .6. __ _. __ .8 ______ .10 __ __ __ .
Jan. 31
46. ___ __ _8 __________10 __ __ __ _12 m _._.._
4. ..._...__6-. __ .. ...8 .______...10- -_-. ___12 p.m.____
Feb. 1
8 _______
Gage height
16.3015.8715.1014.1513.1212.1711.5010.8910.30
9.789.328.95
8.448.137.967.998.268.889.70
10.3610.6510.8111.1311.54
12.1811.93
Dis charge
23,70022,40020,10017,40014,70012V40010,9009,5808,4007,4406,7306,180
5,4204,9804,7504,7905,1606,0707,3008,5209,1009,420
10,10011,000
12,40011,800
Hour
Feb.l-Con.
12 m .....
8 ..__..__.12 p.m____
Feb. 2
12 m .....
12 p.m____
Feb. 3
12 m .....
Feb. 4
12 m _____
12 p.m....
Feb. 5
12 m __-_-
12 p.m.-__
Gage height
11.5311.0710.6010.25
9.508.858.087.45
6.856.506.316.15
6.105.955.835.65
5.465.606.176.63
Dis charge
11,0009,9509,0008,300
7,0006,0204,9104,140
3,4603,0802,9102,760
2,7202,6002,5002,360
2,2102,3202,7703,210
120. BIG MOCCASIN CREEK NEAR GATE CITY, VA.
Location. Lat 36°38'47", long 82°33'12", on left bank at downstream side of bridge on State Highway 71, 0.2 mile downstream from Franklin Branch, 1.6 miles upstream Little Moccasin Creek, and 1.6 miles east of Gate City Scott County.
Drainage area. 79.6 sq mi.Gage-height record. Water-stage recorder graph. Datum of gage is 1,267.64 ft above
mean sea level, datum of 1929, supplementary adjustment of 1936.Discharge record. Stage-discharge relation defined by current-meter measurements.Maxima. January-February 1957: Discharge, 3,340 cfs 10 p.m. Jan. 29 (gage height,
8.36 ft).1952 to December 1956: Discharge, 3,110 cfs Apr. 16, 1956 (gage height, 7.95 ft).

A160 FLOODS OF 1957
Mean discharge, in cubic feet per second, 1957
Day
l-.._.2----.3__ ...4.....5--.-.6_____7.. ...8.. ...9.. __10. ... 11---.
January
70 62 52 49 80 88 83 80
328 810 508
Monthly mean di. Runoff, in inches
February
2,390 1,680
774 502 412 525 742
1,080 1,000 1,400
930
Day
12 __ .13 .....14 .....15 .....16.....17 __ ..18._.__19---..20 __ ..21 __ .22.....
January
275 200 157 129 113 97 76 65 60 65 78
scharge, in cubic feet per secc
February
490 342 262 212 182 155 135 159 312 225 188
Day
23.... 24 __ .25 .... 26 .... 27 .... 28 .... 29.... 30 .... 31_...
January
179 195 137 121 217
1,380 2,850 2,160 1,620
399 5.78
February
164 142 131 131 129 230
537 7.03
Gage height, in feet, and discharge, in cubic feet per second, at indicated time, 1957
Hour
Jan. 26
12 p.m...
Jan. 27
12 m __ _
12 p.m_._
Jan. 28
2 a.m.... 4........6.. __ ._8 ........10 ___ ._12 m ....
4 .____._.6 ........8 ___ .__10 .......12 p.m...
Jan. 29
4 a.m.... 8 ........12 m ....
8 ........10 .......
Gage height
2.00
2.002.302.853.17
3.35 3.553.854.184.504.705.706.327.027.027.257.34
7.42 7.457.407.928.308.36
Dis charge
113
113177315411
472 542650782910
1,0001,5201,8902,3602,3602,5202,590
2,640 2,6602,6302,9903,2903,340
Hour
Jan. 29 Con.
Jan. 30
8 _____ ..12 m ___
8. ........
Jan. 31
4 __ ......6...... ...8 .._..._._10 __.._.._12 m _____
4_________6______ __8 __ .....10 _.___.._
Feb. 1
4 3, HI
8. ........12 m . __ .
Gage height
8.17
7.817.476.756.005.384.96
4.854.784.905.105.605.936.076.326.526.706.957.20
7.377.157.116.90
Dis charge
3,190
2,9202,6802,1801,7001,3401,130
1,0801,0401,1001,2501,4601,6601,7401,8901,8902,1402,3202,490
2,6102,4602,4302,280
Hour
Feb. 1 Con.
Feb. 2
8-...-----.12 m .-.-..
8 __ .. __ .
Feb. 3
12 m _-__..
12 p.m.__-.
Feb. 4
12 m __ ..
Feb. 5
12 m __ ..
Gage height
6.856.77
6.606.466.105.585.154.80
4.394.103.873.70
3.553.433.303.21
3.153.103.153.35
Dis charge
2,2402,190
2,0701,9801,7601,4501,2201,050
866750658595
542500455424
405390405472

FLOODS OF JANUARY-FEBRUARY 1957 IN KENTUCKY A161
121. NORTH FORK HOUSTON RIVER NEAR GATE CITY, VA.
Location. Lat 36°36'31", long 82°34'05", on left bank - 100 ft upstream from bridge on U.S. Highway 23,1.6 miles downstream from Big Moccasin Creek and 2.1 miles south east of Gate City, Scott County.
Drainage area. 672 sq mi.Gage-height record. Water -stage recorder graph except Jan. 14 23, 26. Datum of gage
is 1,197.56 ft above mean sea level, datum of 1929, supplementary adjustment of 1936.Discharge record. Stage-discharge relation defined by current-meter measurements.
Discharge for periods of no gage-height record estimated on basis of records for nearby streams.
Mnxima. January-February 1957: Discharge, 28,700 cfs 12 m Jan. 30 (gage.height, 16.73 ft).
1931 to December 1956: Discharge, 23,700 cfs Aug. 14,1940 (gage height, 14.75 ft).
Mean discharge, in cubic feet per second, 1957
Day
1 __ .2 __ _3 ___45___._6__ __7 ___8_____9--__.10---. 11 __ .
January
666 592 509 454 598 805'
875 875
1,900 7,900 6,260
Monthly mean dis Runoff, in inches
February
19,500 14,400
7,460 4,980 4,110 5,300 7,090
10,300 10,800 13,600
9,160
Day
1 9
13 _____14----.15 _____16____.17 _____18 _____1 Q
20_. ___21__._.22 _____
January
3,000 2,020 1,490 1,170
945 745 600 580 685 740 770
charge, in cubic feet per seco
February
4,740 3,120 2,360 1,860 1,520 1,340 1,130 1,130 2,020 2,410 1,810
Day
23 __ .24 __ .25 __ .26 __ .27 ___ .28_.._.29---..30.-...31 ___ .
January
1,210 1,970 1,610 1,350 1,690 7,250
20,60026,20014,000
3,550 6.09
February
1,470 1,250 1,130 1,050 1,020 1,290
4,905 7.60
Gage height, in feet, and discharge, in cubic feet per second, at indicated time, 1957
Hour
Jan. 26
12 p.m...
Jan. 27
6 a.m____ 12 m ___. 6 p.m.... 12 p.m...
Jan. 28
4 ________6-_._ __ _8 ________10 ____ .
Gage height
3.50
3.50 3.65 4.25 4.90
5.17 5.47 5.74 6.03 6.34
Dis charge
1,290
1,290 1,420 2,020 2,760
3,080 3,460 3,840 4,290 4,810
Hour
Jan. 28 Con.
12 m _.._..
4 __ __.__.6 _______ .8... -...__.10 ______ .
Jan. 29
4_. __ ___ H6. ______ .8.. __.____-10 ____ __ .12 m ___ j
Gage height
6.68 7.10 8.05 9.20
10.30 11.05 11.77
12.27 12.57 12.73 12.78 12.80 13.10
Dis charge
5,440 6,260 8,220
10,600 12,900 14,600 16,200
17,400 18,200 18,600 18,700 18,700 19,400
Hour
Jan. 29 Con.
4____. __ _6 __ ______8_____ __ _10__ ___ .12 p.m....
Jan. 30
46 _________8 ___ ____10_.__ __ _12 m .____2 p.m_____
Gage height
13.57 14.03 14.55 14.90 15.33 15.68
15.93 16.10 16.30 16.50 16.65 16.73 16.63
Dis charge
20,600 21,800 23,100 24,000 25,100 26,000
26,600 27,100 27,600 28,100 28,500 28,700 28,400

A162 FLOODS OF 1957
Gage height, in feet, and discharge, in cubic feet per second, at indicated time, 1957 Continued
Hour
Jan. 30 Con.
6.. ___ .8. .-.-__.10--- __ -12 p.m...
]an. 31
2 a.m....4 .__..._.6 ______8__ .-_..-10 _.__...12 m ....
4. ._--..-6.. ___ .8____ __ .10... __ .12 p.m...
Gageheight
16.3015.8015.1014.0012.85
11.7010.8010.229.889.88
10.0410.2510.5010.8011.1811.6812.09
Dis charge
27,60026,30024,50021,70018,800
16,10014,00012,80012,10012,10012,40012,80013,40014,00014,90016,00017,000
i
Hour
Feb. 1
8-_-..___-12 m --...
8-._. __ ..12 p.m....
Feb. 2
8 ______12 m .....
6_. __--...8... __ ...10_. ______12 p.m....
i
Gage height
12.8813.2313.4213.4013.2312.90
12.3811.6410.9010.209.859.589.309.03
Dis charge
18,90019,80020,20020,20019,80019,000
17,70015,90014,20012,70012,00011,40010,80010,300
Hour
Feb. 3
12 m .....
12 p.m....
. Feb. 4
12 m ._ __
12 p.m__._
Feb. 5
12 m ._--.
12 p.m-__-
Gage height
8.247.567.076.74
6.546.426.326.14
5 975.795 79
5.93
Dis charge
8,6107,1906,2005,560
5,1804,9604,7804,470
4,2209 QQn3,9004,180
122. HOLSTON RIVER AT SURGOINSVILLE, TENN.
Location. Lat 36°28'19", long 82°50'50", on right bank, 1,500ft upstream fromSurgoins-ville Creek and county bridge at Surgoinsville, Hawkins County, 9.8 miles upstreamfrom Big Creek, and at mile 118.4. Records include flow of Surgoinsville Creek.
Drainage area. 2,874 sq mi, includes that of Surgoinsville Creek. Gage-height record. Water-stage recorder graph. Datum of gage is 1,088.46 ft above
mean sea level, datum of 1929, supplementary adjustment of 1936.Discharge record. Stage-discharge relation defined by current-meter measurements. Maxima. January-February 1957: Discharge, 45,100 cfs 3 5 p.m. Jan. 30 (gage height,
14.32 ft).1940 to December 1956: Discharge, 59,600 cfs Feb. 18, 1944 (gage height, 17.48 ft). Floods of 1867 and 1901 reached stages of about 31 ft and 28 ft, respectively, from
profile by Tennessee Valley Authority. Flood of 1867 exceeded all other known floods,including that of 1791.
Remarks. Flow partly regulated by South Holston, Watauga, Boone, and Fort PatrickHenry Lakes.

FLOODS OF JANUARY-FEBRUARY 1957 IN KENTUCKY
Mean discharge, in cubic feet per second, 1957
A163
Day
12 _____3 _____4 _____5.. ___6 _____7__ ___8__ ___9 _____10. __11 ____
January
1,300 2,940 2,570 1,950 1,690 1,580 1,690 1,870 3,260 7,330
11,400
February
38,100 36,700 25,600 17,400 14,500 19,200 16,700 21,800 25,100 31,400 26,100
Day
12 _____13 _____14 _____15 _____16 _____17 _____18 _____19 _____20 _____21 _____22 _____
January
7,520 4,460 3,940 4,010 4,980 8,240 8,210 5,910 3,830 2,790 3,640
Monthly mean discharge, in cubic feet per secc
February
20,400 14,900 12,300 11,500 11,200 11,000 10,700 10,700
9,280 8,860 7,710
Day
23 ____ 24 ____ 25 __ 26 ____ 27 ____ 28 ____ 29 ____ an31 __._
January
3,240 5,480 4,540 3,770 3,070
10,000 26,700 42,80033,400
7,358
February
6,820 3,900 3,020 4,150 4,980 3,870
-----------
15,280
Gage height, in feet, and discharge, in cubic feet per second, at indicated time, 1957
Hour
Jan. 27
Jan. 28
6 ________8 ________11 __ __ _
6 __ . __ .9____ __ _12 p.m___
Jan. 29
12 m ____
?_.__ __ .9 __ _____12 p.m.__
Jan. 30
6__ ___ .12 m ____
5 ___ ____8 __ __10 _______12 D.m___
Gage height
3.54
3 73
4.525.044.86R on6.707.257.88
9.0010.4012.1012.1512.2112.57
13.0413.301 A O C
14.30U 39
14.3214.3014.2414.13
Dis charge
4,660
5,1407,2208,6608,160
11,10013,50015,30017,300
21,10026,200oq Af\r\
33,70033,90035,600
39,20040,40044,800AC. r\C\C\
AC. 1 r\C\
45,100AC. r\c\n44,70044.200
Hour
Jan. 31
3 a.m_--_-6. ________9 ____ __12 m ---._
4 _________6 __ _____9 _________
Feb. 1
12 m _____
6 __ _ __ .8 __ ______g10 ____ __12 p.m____
Feb. 2
12 m _____
12 p.m....
Feb. 3
12 m _____6 D.m_-.__
Gage height
13.7012.8011.4510.74m 3310.3110.5811.2211.68
12.3312.831 3 (13
13.4013.541 3 R7
13.5713.52
13.2112.6611.8010.91
10.309.829.45
Dis charge
42,20038,10032,20029,10027,40027,30028,40031,10033,200
36,00038,20039,10040,80041,50041,60041,60041,400
39,90037,50033,700OQ ar\r\
27,200
25,30023.800
Hour
Feb. 3 Con.
12 p.m-__-
Ffh d
6 ___ ___ -__
9 __ __ _..12 m _____
12 p.m____
Feb. 5
7 __ __-._.8 ____ -._12 m _--._
9 __ ------12 p.m.-__
Feb. 6
6 __ __ -__12 m _____
4 ____ _.-6__ 9 __ -_ __ -10-.- __ _12 p.m_-_.
Gage height
9.15
9.008.317.587.367.157.10
7.006.406.426.766.827.378.09
8.348.458.588.668.638.237.507.427.37
Dis charge
22,600
22,00019,40016,70016,00015,20015,100
14,70012,70012,80013,90014,10016,00018,600
19,50019,90020,40020,70020,60019,10016,50016,20016,000

A164 FLOODS OF 1957
Gage height, in feet, and discharge, in cubic feet per second, at indicated time, 1957 Continued
Hour
Feb. 7
12 m .___
Feb. 8
12 m __
12 p.m.--
Feb. 9
6 ....____9____ __ .12 m ____
Feb. 10
9 ________10_.__ __12 m __ . 6 p.m_.__ 12 p.m-.-
Feb. 11
12 m ....
6 a.m____ 12 m _ __
Feb. 13
10 __ __12 m __
12 p.m...
Feb. 14
Gage height
7.297 "39
7.798.44
8.979.178.978.80
8.789.579.949.99
10.0010.50
11.2911.5111.5511.55 11.43 11.00
10.429 QQ
9.579.14
8.82 8.548.368.19
8.096.836.636.456.39
6.32
Dis charge
15,70015,80017,5001 Q onn
21,90022,70021,90021,200
21,10024,30025,70025,90026,00028,100
31,50032,40032,60032,600 32,100 30,200
27,700o CL nnn
24,30022,500
21,300 20,20019,60018,900
18,60014,20013,5001 9 onn12,700
12,500
Hour
Feb.l4-Con.
12 m .....
12 p.m....
Feb. 15
12 m _____
6. ___ __8. ___ ...
Feb. 16
8. ________12 m _____
12 p.m....
Feb. 17
12 m .....12 p.m. __
Feb. 18
12 p.m. __
Feb. 19
12 p.m....
Feb. 20*
8. ________12 m _____
4 _________5 __ _..___
Feb. 21*
3 _________10._ ______11:30 _____
Gage height
6.286 196.17
6.156.106.005.785.775.87
5.955.955.93^ 015.88
5.845.79
5.78^ 7*3
5.72
5.725.795.85
5.885.133.47^ 9 ^
5.495.595.73
5.775.723.693.50
Dis charge
12,40012,10012,000
11,90011,80011,50010,80010,80011,100
11,30011,30011,20011,20011,100
11,00010,800
10,80010,60010,600
10,60010,80011,000
11,1008,9104,4809,2509,940
10,20010,600
10,80010,600
5,0404,560
Hour
Feb.21*-Con.
5.--------.7__. _______
Feb. 22*
8__. __ ....11:30 ______
5--__--_--_8. ___ ....10 ___ __
Feb. 23*
6-__---___-9_._
5:30 __ .---11_. __ ....12 p.m.....
Feb. 24*
2:30 a.m ...6 _______10 _________
2__--_-_--_4 __ ___ ..6 ______ ..8. ___ ____10.. ____12 p.m_-.__
Feb. 25*
4___-_. __6 __ __ __8 ____ ____10---------
6 - _. __8 __ _______10__ ___ -.12 p.m...-.
Gage height
5.385.725.815.80
5.744.053.254.204.335.355.535.56
5.544.633.482.835.204.084.12
4.723.872.802.532.532.642.642.672.632.65
2.632.652.602.602.532.383.433.693.533.16
Dis charge
9,62010,60010,90010,900
10,7005,9703,9406,3606,7109,540
10,10010,100
10,1007,5204,5102,9809,1106,0506,150
7,7705,5002,9202,3602,3602,5802,5802,6502,5602,600
2,5602,6002,5002,5002,3602,0604,3805,0404,6403,720
* Affected by regulation; daily means cannot be computed exactly from data shown.

FLOODS OF JANUARY-FEBRUARY 1957 IN KENTUCKY A165
123. BIG CREEK NEAR ROGERSVILLE, TENN.
[Crest-stage station]
Location. Lat 36°25'34", long 82°57'07", on left bank 300 ft upstream from county high way bridge, 2.0 miles upstream from mouth, and 3.0 miles northeast of Rogersville, Hawkins County.
Drainage area. 47.3 sq mi (.measured by Tennessee Valley Authority on 1\ -minute planimetric maps, scale, 1:!!4,000).
Gage-height record. Crest stages only.Discharge record. Peak disc larges from rating curve extended above 2,000 cfs.Maxima. January-February 1957; Discharge, 3,180 cfs Jan. 31 (gage height, 6.73 ft).
April 1941 to June 1949, December 1954 to December 1956: Discharge, 3,060 cfs Jan. 20, 1947 (gage height, 6.59 ft).
124. CHEROKEE LAKE NEAR JEFFERSON CITY, TENN.
Location. Lat 36°10'00", long 83°29'55", at Cherokee Dam on Holston River, 0.3 mile upstream bridge on State Highway 92,2.7 miles upstream from Mill Spring Creek, 2.8 miles north of Jefferson City, Jefferson County, Tenn., and at mile 52.3.
Drainage area. 3,429 sq mi.Gage-height record. Water-stage recorder graph. Datum of gage is at mean sea level,
datum of 1929, supplementary adjustment of 1936.Maxima. January-February 1.957: Contents at 12 p.m., 363,100 cfs-days Feb. 11 (eleva
tion, 1,039.93 ft).1941 to December 1956: Contents, 779,400 cfs-days May 11,1944 (elevation, 1,074.37
ft).Remarks. Storage capacity, 789,200 cfs-days (elevation, 1,075.0 ft) of which 742,700
cfs-days is controlled storage. Records furnished by Tennessee Valley Authority.
Elevation, in feet, ani contents, in cfs-days at 12 p.m. of indicated day, 1957
Day
l--_-2____3 ___4 ___5 __6 __ .7....8 ....9 ....10 ...11--.12 ...13 ...14 __15.. .16...
January
Elevation
1,007.731,005.601,003.861,002.391,002.541,003.171,002.701,000.99
999.92999.57
1,000.681,001.051,001.401,001.001,000.41
998.82
Contents
144,400134,400126,500120,100120,800123,500121,400114,200109,800108,400112,900114,400115,900114,200111,800105,400
February
Eleve.tion
1,OJ!2.901,0^16.181,0-37.301,036.881,036.151,036.161,035.941,036.431,037.34I,0il9.171,039.931,0:19.681,039.001,038.061,0:17.181,0:16.42
Contents
302,900330,000339,700336,000329,800329,900328,000332,200340,000356,200363,100360,800354,700346,300338,600332,100
Day
17 ...18 ...19 ...20 ...21 ...22 ...23 ...24...25 ...26.--27 ...28..-29 ...3fiOU
31O ±
January
Elevation
997.60996.56995.41996.41995.44996.18996.27996.59998.28999.53
1,001.021,005.861,014.301,022.461,028.55
Contents
100,60096,70092,40096,10092,50095,20095,60096,800
103,300108,200114,300135,600178,300227,100269,400
February
Elevation
1,035.651,034.841,034.221,033.991,033.831,033.731,034.321,034.691,034.791,034.721,035.271,035.83
Contents
325,500318,700313,600311,700310,300309,600314,400317,500318,300317,800322,300327,100

A166 FLOODS OF 1957
125. HOLSTON RIVER NEAR JEFFERSON CITY, TENN.
Location. Lat 36°10'03", long 83°30'10", on left bank 250 ft upstream from bridge onState Highway 92, 0.2 mile downstream fromCherokee Dam, 2.5 miles upstream fromMill Spring Creek, and 3 miles north of Jefferson City, Jefferson County.
Drainage area. 3,429 sq mi. Gage-height record. Water-stage recorder graph. Datura of gage is 900.00 ft above
mean sea level, datum of 1929, supplementary adjustment of 1936.Discharge record. Stage-discharge relation defined by current-meter measurements. Maxima. January-February 1957: Discharge, 25,900 cfs 5:30 p.ra. Feb. 11 (gage height,
32.19 ft).1936 to December 1956: Discharge, 58,700 cfs Aug. 15, 1940 (gage height, 41.82 ft). Floods of 1867 and 1901 reached stages of about 60 ft and 53 ft, respectively, from
profile by Tennessee Valley Authority. Flood of 1867 exceeded all other known floods,including that of 1791.
Remarks. Flow regulated by South Holston, Watauga, Boone, Fort Patrick Henry, andCherokee Lakes.
Mean discharge, in cubic feet per second, 1957
Day
!..__.2 ___ .3_. ...4_-.-_5_--_.6_.___7_____8.. __9 __ ..10---. 11-...
January
9,670 11,400 10,900 10,100 2,860
71 4,200 9,370 7,860 9,460 8,120
February
17,800 19,000 20,900 25,700 23,700 22,200 22,100 22,100 22,000 22,300 24,000
Day
12 ___ .13. __ .14---.-.15-.---.16--.--.17......18 ___ .1920 __ ...21 ___ .22_. __ .
January
7,580 5,390 5,910 6,790
10,300 11,900 11,900 11,900 2,070 6,550 1,840
Monthly mean discharge, in cubic feet per seco
February
25,800 24,400 22,400 20,900 19,000 18,900 18,900 17,600 14,200 11,500 9,990
Day
23.....24.....25____.26.....27.....28. __ .29.-...SO.....31 __ .
January
3,540 3,680
65 62 65 80 96
112 5,840
5,796
February
3,680 3,490 3,230 4,980 1,600 1,170
16,560
Gage height, in feet, and discharge, in cubic feet per second, at indicated time, 1957
Hour
Jan. 30
Jan. 31*
6 a.m.... 12 m ....
^ -°.fi
4.. __..._5.. ---..-6____ __ .7____ ...9:30. ....
Gage height
20.48
20.50 20.5226.6821.60
9 7 fin28.6228.7828.8128.80
Dis charge
112
120 128
10,500Qon
18511,30015,60016,00016,10016.000
Hour
Jmi.31*-Con.
Feb. 1
8 ______ .10. _____ .11. __ .....6 p.ra......12 p.m.....
Feb. 2
6 a.m______
Gage height
90 no
28.95
28.9528.9529.6529.7029.7329.80
29.83
Dis charge
16,40016,500
16,50016,50018,40018,60018,60018,800
18.900
Hour
Feb. 2 Con.
12 p.m--_.
Feb. 3*
9 ______ .
2_. _-_..._3 __ ___ .4:30 .. __5_. __ -_._7:30 ___..-8 __ ___ _
Gage height
29.8829.90
29.9229.8029.7730.5030.8030.8531.0331.0731.85
Dis charge
19,10019,100
19,20018,80018,80020,80021,70021,80022,40022,50024,800

FLOODS OF JA STUARY-FEBRUARY 1957 IN KENTUCKY A167
Gage height, in feet, and discharge, in cubic feet per second, at indicated time, 1957 Continued
Hour
Feb. 3-Con.
11 __ __ ..12 p.m....
Feb. 4
12 m .....
12 p.m....
Feb. 5
10. _---..-11. __ __ _.
.12 m .....
12 p.m..--
Feb.6
6... ___ .
Feb. 7
Feb. 8
Feb. 10
6 _____ _.8 ______ .12 m __ _.
Feb. 11
Gage height
32.0832.1232.13
32.1432.1232.11QO i o
32.1231.4031.1031.0831.0631.02
30.9830.963.0.9430.94
30.9330.94
30.9230.92
30.9130.91^n Q9
30.9530.9531.0031.0231.08
.31.09
Dis charge
25,50025,70025,700
25,70025,70025,6009 ^ 7nn
25,70023,50022,60022,50022,50022,400
22,20022,20022,10022,100
22,10022,100
22,10022,100
22,00022,00022,100
22,20022,20022,30022,40022,500
22,600
Hour
Feb. 11 Con.
2.........3... __ ...4. ____ ._5:30 ___ .8. ____ ..
Feb. 12
6 a.m. __12 p.m. __
Feb. 13
Q
4 ____ __6. ..._._..
Feb. 14
12 m __ .
Feb. 15
2 __ .....3 ______5. __ .....
Feb. 16
12 m _____
Feb. 17
12 m .. __
Feb. 18
12 m .....
Gage height
31.1032.0032.1332.1632.1932.1832.18
32.1832.17
32.1432.1131.1631.1031.0831.07
31.0631.0531.02
31.0131.0030.0529.9329.9029.90
29.9029.839Q RA.
29.8390 a^29.839Q 89
29.8229.82
Dis charge
22,60025,30025,70025,80025,90025,80025,800
25,80025,800
25,70025,60022,80022,60022,50022,500
22,50099 -inn22,400
22,30022,30019,50019,20019.10019,100
19,10018,90019,000
18,90018,90018,90018,900
18,90018,900
Hour
Feb. 13-Con
12 p.m....
Feb. 19*
3:30 a.m ..4.........4:30 ------6 __ . __ .7..-.. __ .8 __ . __ .11... _____12 m . __ .12 p.m....
Feb. 20*
2__. ______3_._ -._.__6 _________7..... ____9:30 .----.11.. ------
23.. ____ .5:30 ___ .8. __ .....9 ______ .10.. ___ .11.. ___ -12 p.m.--.
6_.___ __ _7. ........9 ___ ____10. __ .___11:30 _____12 m ---._
2. ........3 _________5:30 ._ __ .6 __ ___ .7:30 ______8... __ "...9-_-___.__10:30 _-..-ll__-__.__
Gage height
29.82
29.8027.4927.8427.8126.0229.2029.4429.7329.73
. 29.6826.4025,9825.9427.3029.4228.9228.8827.5227.3327.3429.6928.9328.9024.5023.88
23.6625.4627.2029.3329.0229.0229.4229.5027.5027.3827.4028,4029.5029.0027.4027.3025.8023.70
Dis charge
18,900
18,80012,60013,50013,4008,900
17,20017,80018,60018,600
18,5009,8108,8008,710
12,10017,80016,40016,30012,60012,10012,20018,50016,40016,300
5,5004,270
3,8707,600
11,80017,50016,70016,70017,80018,00012,60012,30012,30015,00018,00016,60012,30012,1008,3803,940
^Flow affected by regulation; daily means cannot be computed exactly from data shown.

A168 FLOODS OF 1957
126. LITTLE RIVER NEAR MARYVILLE, TENN.
Location. Lat 35°47'10", long 83°53'04", on right bank on downstream side of bridge on U.S. Highway 411, 0.8 mile downstream from Crooked Creek, 5.0 miles east of Mary- ville, Blout County, and at mile 17.3.
Drainage area. 269 sq mi.Gage-height record. Water-stage recorder graph. Datum of gage is 850.00 ft above
mean sea level, datum of 1929, supplementary adjustment of 1936.Discharge record. Stage-discharge relation defined by current-meter measurements.Maxima. January-February 1957: Discharge, 12,600 cfs 1:30 a.m. Feb. 1 (gage height,
21.18 ft).1951 to December 1956: Discharge, 13,300 cfs Jan. 16, 1954 (gage height, 18.44 ft). Floods of March 1875 and April 1920 reached stages of 31.0 and 24.1 ft, respectively.
Flood of Mar. 29,1951, reached a stage of 21.05 ft (discharge, 19,200 cfs) from flood- marks.
Mean discharge, in cubic feet per second, 1957
Day
1----.2.....3. ___4.. __56_____7_____8 _____9____.10. ___ 11---.
January
295 255 229 241 423 404 398 362 339 362 344
Monthly mean dig Runoff, in inches
February
13,500 7,130 3,130 3,370 3,840 2,900 2,850 3,680 3,640 3,410 2,540
Day
12 ______13_ __ .14., __15 ______16 ___ _17 ______18. _____19. __ __20______21 __ __22.__.__
January
312 295 275 255 250 221 184 177 202 198 198
.charge, in cubic feet per seco
February
1,720 1,310 1,050
866 826 682 594 714 802 650 578
Day
23. __ 24 ___25 ____ 26. __ 27. __ 28_... 29 ___30 ____ 31 ____
January
1,210 816 629 559
1,870 4,520 2,5903,570
10,600
1,051 4.50
February
528 486 458 507 514 842
2,254 8.73
Gage height, in feet, and discharge, in cubic feet per second, at indicated time, 1957
Hour
Jan. 26
12 p.m....
Jan. 27
7 __ ......12 m ___ .5 p.m..___ 7.. ___ ..11. ___ ..12 p.m___.
Jan. 28
3 a.m____-
Gage height
8.05
8.05 8.11 9.60
11.02 11.18 11.12 11.14
11.23
Dis charge
510
510 552
1,790 3,170 3,330 3,270 3,290
3.380
Hour
Jan. 28 Con.
11 ____ _12:30 p.m __ 2____ ..__.-6... __ __ .
Jan. 29
8 .______.__
7 __ _______
Gage height
13.02 13.20 13.26 13.15 12.65 11.30
10.50 10.15
9.75 10.40 11.84
Dis charge
5,320 5,540 5,610 5,480 4,920 3,450
2,650 2,300 1,920 2,550 4,020
Hour
Jan. 30
2 a.m____-3:30 ______5.. __ -.._8 ___ --.-12 m ._-..
9.-... __ -12 p.m....
Jan. 31
2...... __6--._._--_12 m . __ _
Gage height
12.39 12.47 12.39 11.90 11.35 10.70 10.53 10.40
10.39 10.42 11.50 17.60
Dis charge
4,630 4,720 4,630 4,090 3,500 2,850 2,680 2,550
2,540 2,570 3,650
11.200

FLOODS OF JANUARY-FEBRUARY 1957 IN KENTUCKY A169
G<jge height, in feet, and discharge, in cubic feet per second, at indicated time, 1957 Continued
Hour
Jan. 31 Con.
4 p.m__.__ 5_. _______6__._ __ _.9 _________12 p.m__._
Feb. 1
1:30 a.m ..3 _________6_..___ __ _12 m _____
8 ______ .11:30 _-_..12 p.m.__.
Gage height
20.45 20.5520.4519.9520.85
21.1821.0319.8217.7017.3817.7018.1518.00
Dis charge
- 17,300 17,60017,30015,90018,500
19,60019,10015,50011,30010,80011,30012,00011,800
Hour
Feb. 2
6 £i.m_____ 12 m _____
*eb. 3
12 m _____
9 _________
Feb. 4
3 a.m __ ._
C hGage
height
16.3014.0012.5511.72
11.10 10.8010.7010.8610.66
10.55
Dis charge
9,3906,5004,8003,890
3,250 2,9502,8503,0102,810
2,700
Hour
Feb. 4 Con.
12 m _____
9 ___ __12 p.m____
Feb. 5
10:30 __ .-
2 _____ -.4 ______ .7___. ___ _10:30 _.---12 p.m___.
Gage height
10.5010.8811.9012.0812.10
11.6711.3311.8711.6811.6611.5211.6711.59
Dis charge
2,6503,0304,0904,2904,310
3,8403,4804,0603,8503,8303,6703,8403,750
127. TELLICO RIVER AT TELLICO PLAINS, TENN.
Location. Lat 35°21'42", long 84°16'44", on right bank 200 ft upstream from bridge on Tellico Plains-Rafter road, 0.4 mile downstream from Laurel Creek, 0.8 mile east of Tellico Plains, Mpnroe County, and at mile 28.2.
Drainage area. 118 sq mi.Gage-height record. Water-stage recorder graph except 10 p.m. Jan. 31 to 12m. Feb. 1
for which graph was dravm on basis of adjacent graph. Ice affected gage-height records on Jan. 19. Datum of gage is 846.64 ft above mean sea level, datum of 1929, supplementary adjustment of 1936.
Discharge record. Stage-discharge relation defined by current-meter measurements below 9,600 cfs.
Maxima. January-February L957: Discharge, 17,500 cfs 8 p.m. Jan. 31 (gage height, 13.60 ft).
1925 to December 1956: Discharge, 15,100 cfs Mar. 29,1951 (gage height, 12.82 ft). Flood of May 1840 reached a stage of about 15 ft (discharge, 21,500 cfs) from re
ports from Tennessee Valley Authority.

A170 FLOODS OF 1957
Mean discharge, in cubic feet per second, 1957
Day
l--_-_2.__._3 __ .4_____5 ___ .6-____7.....8_._._9__.._10 ....11....
January
161 145 142 147 282 212 236 209 197 221 197
Monthly mean di Runoff, in inches
February
4,820 2,420 1,510 2,040 1,680 1,450 1,660 1,200 1,090 1,070
880
Day
12__._.1 314 .....15_.___16. ....17.....18_. ...1920 .....21__...22.. ...
January
183 174 164 155 155 131 128 136 142 128 142
scharge, in cubic feet per secc
February
695 595 520 466 484 408 375 439 452 396 359
Day
23 __ . 24 __ . 25..... 26 ___ . 27 ___ . 28 __ . 29.....30 __ .31.....
January
1,040 460 380 340
1,110 976
1,3001,3206,690
561 5.48
February
328 310 296 351 396 516
972 8.57
Gage height, in feet, and discharge, in cubic feet per second, at indicated time, 1957
Hour
Jan. 26
12 p.m__.
Jan. 27
8__ ......10 __ ....12 m .._-
4.. ......6. _-_-._.12 p.m...
Jan. 28
6__ __ ..9_._. __ .12 m __ .5 p.m.... 6.. _----.11. _--._.12 p.m...
Jan. 29
4_. __ ...6__ ......12 m __ .2 p.m.... 6...--...8.... ....9...-_...12 p.m...
Gage height
2.17
2.162.403.605.005.514.954.654 03
3.833.673.503.373.20 3.213.553.80
4.003.703.603 47
3.43 4.505.525.655.10
Dis charge
332
39 5
4201,0201,8002,1001,7701,6001,260
1,1501,060
970OQQ
805 810998
1,140
1,2401,0801,020
Q^d
932 1,5202,1102,1801,860
Hour
Jan. 30
12 m --._..
12 p.m.. ...
Jan. 31
4. ______ .6. __ ......8... ____ .10. _____ .
1:30 ____ .2. .........6 ___ .....8. ______ .10 ______ .
Feb. 1
12 m .__._.
6.... __ ..7... .......
Feb. 2
12 m .. __ .
12 p.m._...
Gage height
4.474.063.723.52
3.523.804.807.408.85
11.0511.1010.8510.6013.6011.2010.20
8.357.887.878.959.158.03
6.765.785.054.50
Dis charge
1,5001,2801,090
981
9811,1401,6803,3605,0909,8409,9809,3008,650
17,50010,300
7 73fl
4,3403,8003,7905,2505,5903,960
2,8802,2601,8201,500
Hour
Feb. 3
6 a.m..--.8. ........10. __..-..12 m ._--.
4 ___ ____6.. __ ....8 ._._.._._10______-.12 p.m....
Feb. 4
1 a.m.....4 .........8. ______ __12 m -----4 p.m____.6 .........12 p.m.__.
Feb. 5
10 __ ....1 p.m.....3.........6 __ ......9 __ ......11... __ _12 p.m....
Gage height
4.234.164.134.314.865.004.734.704.675.09
5.355.004.805.286.116.005.48
4.934.664.654.714.524.694.614.61
Dis charge
1,3401,3001,2801,3801,7101,8001,6301,6201,6001,850
2,0001,8001,6801,9602,4602,4002,080
1,7501,5901,5801,6201,5101,6101,5601,560

FLOODS OF JANUARY- FEBRUARY 1957 IN KENTUCKY A171
128. CLINCH RIVER AT CEDAR BLUFF, VA.
[Gaging station discontinued in 1946]
Location. Lat 37°05'20", long 81°46", at highway bridge at mouth of Indian Creek intown of Cedar Bluff, Tazewell County, 400 ft upstream from Middle Creek, and 1.1miles east of Ricblands.
Drainage area. 125 sq mi, includes that of Indian Creek. Gage -height record. Floodmarks only. Altitude of gage is 1,940 ft (from topographic
map). Discharge record. Stage -discharge relation defined by current -meter measurements
below 800 cfs and extended above by logarithmic plotting. Maxima. January 1957; Gage height, 14.41 ft Jan. 29.
1944 to September 1946: Discharge, 4,800 cfs about 6 a.m. Jan. 8, 1946 (gage height,7.4 ft, from floodmark).
Flood in 1901 reached a stage of about 16 ft from floodmark in old mill.
129. CLINCH RIVER AT RICHLANDS, VA.
Location. Lat 37°05'10", long 81°46'52", on right bank 1 mile southeast of Richlands, Tazewell County, 1.6 miles downstream from Middle Creek, and 2.2 miles upstream from Big Creek.
Drainage area. 139 sq mi.Gage-height record. Water-stage recorder graph except Jan. 1 6, Jan. 29 to Feb. 1 and
Feb.-12-21. A stage graph was drawn for period Jan. 29 to Feb. 1 on basis of crest stage from floodmark and records for nearby stations. Datum of gage is 1,923.99 ft above mean sea level, datum of 1929, supplementary adjustment of 1936.
Discharge record. Stage-discharge relation defined by current-meter measurements below 4,800 cfs and by contracted-opening measurement at 9,650 cfs. Discharge for periods Jan. 1 6 and Feb. 12-21 estimated on basis of records for nearby station.
Maxima. January-February 1957: Discharge, 9,640 cfs 6 p.m. Jan. 29 (gage height, 19.3 ft, from floodmark in gage house).
1946 to December 1956: Discharge, 5,080 cfs May 19, 1953 (gage height, 13.23 ft).
Mean discharge, in cubic feet per second, 1957
Day
1.-..-2_____3.....4.....5_.._.6.....7_..._8.. __9.-.-.10....ll--_.
January
140 120 110 120 160 210 211 189 901
1,550 832
Monthly mean dL Runoff, in inches
February
2,660 2,170
' 1,190 . 771
608 582 630
1,270 2,360 2,320 1,430
Day
12......13......14......15 ___ ..16 __ ..17 __ ..18 ___ .19 __ ..20.----.21......22______
January
516 366 279 231 190 170 155 140 135 159 169
scharge, in cubic feet per seco
February
1,0001 600 450 380 320 290 250 600
1,200 700 502
Day
23 __ .24.....25_-__.26 __ .27...-.28 __ .29 ___ .30. __ .31.....
January
502 461 340 270 392
2,110 7,0005,1602,150
821 6.81
February
407 340 303 303 279 407
869 6.51

A172 FLOODS OF 1957
Gage height, in feet, and discharge, in cubic feet per second, at indicated time, 1957
Hour
Jan. 26
12 p.m...
Jan. 27
12 m __ .
12 p.m...
Jan. 28
4---. __ .6____ __ .8-.._ __10. ______12 m _-._ 2 p.m____ 4_. _.--._6--__-.__8 _____ _10 __ ....12 p.m...
Jan. 29
2 a.m____ 4. --__-._6____.___8-.-. __ _10-.__-._12 m ....
Gage height
2.03
2.182.642.933.46
4.084.725.205.696.417.41 8.46 9.209.499.509.469.27
9.60 10.4011.7013.3015.5417.4
Dis charge
243
275391469618
8081,0401,2301,4301,7302,180 2,660 3,0003,1403,1503,1303,040
3,200 3,6004,2805,2406,7808,120
Hour
Jan. 29 Con.
4------.--.6-._. ...._.8-._.......10. _____ .12 p.m.....
Jan. 30
8. ___ ....12 m ___ .
8... .......
Jan. 31
8.. __ ....12 m ......
8. ___ __ .12 p.m.....
Feb. 1
8... .......12 m ......
8. ____ ...
Gage height
18.519.119.319.218.818.2
16.614.912.810.8
9-.0
7.4
6.66.77.27.97.98.1
8.68.88.58.288.28
Dis charge
9,0009,4809,6409,5609,2408,760
7,5206,3304,9303,8002,9002,180
1,8201,8602,0902,4002,4002,500
2,7202,8102,6802,5802,580
Hour
Feb.l Con.
12 p.m....
Feb. 2
8 ____ ...12 m .....
8 ____ ...12 p.m....
Feb. 3
6 a.m.....12 m __-._
12 p.m....
Feb. 4
12 m .. ...
12 p.m....
Feb. 5
6 a.m.....12 m ..._.
12 p.m....
Gage height
8.39
8.418.037.386.856.436.00
5.435.054.724.47
4.163.943.713.53
3.373.443.433.40
Dis charge
2,630
2,6302,4602,1701,9301,7401,550
1,3201,1701,040
944
836762693639
592612609600
130. LITTLE RIVER AT WARDELL, VA.
[Gaging station discontinued in 1952]
Location. Lat 37Q02'16", long 81°47'52", on right bank 50 ft upstream from KatiesBranch, 0.5 mile downstream from Indian Creek, 0.5 mile northwest of Wardell,Tazewell County, and 16.0 miles upstream from mouth.
Drainage area. 103 sq mi. Gage-height record. Floodmarks only. Datum of gage is 2,033.01 ft above mean sea
level, datum of 1929, supplementary adjustment of 1936. Discharge record. Stage-discharge relation defined by current-meter measurements
below 960 cfs and by slope-area measurements of 1,840 cfs. Maxima. January 1957: Gage height, 14.34 ft Jan. 29.
1949 to September 1952: Discharge, 1,830 cfs at 7 a.m. Feb. 2, 1950 (gage height,8.05 ft).

FLOODS OF JANUARY-FEBRUARY 1957 IN KENTUCKY A173
131. CEDAR CREEK NEAR LEBANON, VA.
Location. Lat 36°54'29", long 82°02'20", on right bank 800 ft upstream from RoaringSpring Creek, 1.9 miles upstream from Little Cedar Creek, and 2.3 miles east ofLebanon, Russell County.
Drainage area. 51.5 sq mi. Gage-height record. Water-stage recorder graph. Stage outside of gage well was up to
0.6 ft higher than recorded. Datum of gage is 1,928.96 ft above mean sea level(Tennessee Valley Authority bench mark).
Discharge record. Stage-discharge relation defined by current-meter measurementsbelow 2,300 cfs and by contracted-opening measurement at 2,710 cfs.
Maxima. January-February 1957: Discharge, 2,740 cfs 4 p.m. Jan. 29 (gage height,4.48ft in gage well, 4.7 ft outside).
1952 to December 1956: Discharge, 2,650 cfs Mar. 16, 1955 (gage height, 4.27 ft).
Mean discharge, in cubic feet per second, 1957
Day
!__-._2_..__3 _____4 __ .5_____6 _____7_____8 __ ._9 __ ._10.-..11 __ .
January
39 32 29 30 46 53 51 48
317 580 292
Monthly mean di Runoff, in inches
February
1,550 895 412 284 327 345 557 714
1,060 1,490
580
Day
12......13 __ __J14_____.|15_____J16 __ ...17_____.18 ___ j19 ___ .20 __ J21......22.. __ .
January
172 115
86 65 58 46 39 34 34 41 44
scharge, in cubic feet per secc
February
300 208 166 130 110
96 86
244 252 172 140
Day
23 __ .24.....25 __ .26____.27 ___ .28 __ .29 __ .30 __ .31 ___ .
January
150 103
78 65
149 1,010 2,2301,2201,390
279 6.25
February
120 103
89 89 86
119
383 7.75
Gage height, in feet, and discharge, in cubic feet per second, at indicated time, 1957
Hour
Jan. 26
12 p.m___
Jan. 27
6 a.m____ 12 m __ . 6 p.m____ 12 p.m__.
Jan. 28
2 a.m____ 4________6____ ____8 _____ _10. ___ .12 m ....
Gage height
1.84
1.84 1.98 2.25 2.28
2.36 2.55 2.73 2.79 2.88 2.95
Dis charge
61
61 103 260 284
354 530 726 798 922
1,020
Hour
Jan. 28 Con.
4______ __6. ___ . ___8. __ _____10________12 p.m. ___
Jan. 29
4. ________6_ ________8-__._ __ .10 ________12 m _____2 p.m_.___4-.--. __ .
Gage height
3.03 3.16 3.30 3.26 3.13 3.06
3.05 3.13 3.39 3.69 3.80 4.30 4.44 4.48
Dis charge
1,140 1,360 1,630 1,550 1,300 1,190
1,170 1,300 1,810 2,290 2,390 2,650 2,720 2,740
Hour
Jan. 29 Con.
8 __ __ ....10 _.___.12 p.m.....
Jan. 30
8__. ____ .12 m __.._.
8 __ ____ .12 p.m-_._.
Jan. 31
4 a.m_____.
Gage height
4.45 4.32 4.10 3.78
3.44 3.15 2.91 2.85 2.71 2.68
2.68
Dis charge
2,720 2,660 2,550 2,370
1,920 1,340
964 880 702 668
668
690-137 O - 64 - 12

A174 FLOODS OF 1957
Gage height, in feet, and discharge, in cubic feet per second, at indicated time, 1957-Continued
Hour
Jan. 31 Con.
12 m _____
8 ___ . __12 p.m-___
Feb. 1
Gage height
2.883.383.313.453.62
3.44
Dis charge
9221,7901,6501,9402,220
1,920
Hour
FebJ-Con.
8 a.m__-___12 m __ ...
8__ _.__._..12 p.m.....
Feb. 2
Gage height
3.199 r>93.003.403.30
2.95
Dis charge
1,4101,1201,0901,8301,630
1,020
Hour
Feb. 2 Con.
12 m _.-._
12 p.m____
Feb. 3
12 m _--._
12 p.m-_--
Gage height
2.822.672.52
2.472.422.372.35
Dis charge
838657500
453408363345
132. CLINCH RIVER AT CLEVELAND, VA.
Location. Lat 36°56'41", long 82°09'18", on right bank 500 ft upstream from highwaybridge at Cleveland, Russell County, 0.5 mile downstream from Muddy Hollow, 2.3miles downstream from Weaver Creek, and 4.4 miles downstream from ThompsonCreek.
Drainage area. 528 sq mi. Gage-height record. Water-stage recorder graph. Datum of gage is 1,500.24 ft above
mean sea level, datum of 1929, supplementary adjustment of 1936. Discharge record. Stage-discharge relation defined by current-meter measurements
below 13,000 cfs and by contracted-opening measurement at 31,000 cfs. Maxima. January-February 1957: Discharge, 31,000 cfs 1 a.m. Jan. 30 (gage height,
24.40 ft).1920 to December 1956: Discharge, 26,500 cfs Dec. 22, 1926 (gage height,23.0 ft, at
site 500 ft downstream at different datum).
Mean discharge, in cubic feet per second, 1957
Day
!--___2__ __3__ __4__.._5. __ .6____.7_ ___8 _____9_____10____11 ____
January
440 399 325 338 436 640 665 615
1,290 5,200 3,600
Monthly mean dis Runoff, in inches
February
11,300 9,130 5,120 3,190 2,480 2,470 2,710 3,800 7,600 8,800 6,170
Day
1 9
1 S
14______15 ___ .16 ___ .17 __ ...18 ___ .1 Q
20.. __ .21__.___22 ___ .
January
2,040 1,430 1,100
860 740 605 488 480 470 468 500
scharge, in cubic feet per secc
February
3,400 2,390 1,800. 1,490 1,280 1,130
980 1,860 4,600 2,790 2,010
Day
OQ
24.....25-.__.26.....27____.28____.29 ___ .30 __ . 31____.
January
1,190 1,700 1,280 1,010 1,080 5,370
20,10022,200
8,740
2,768 6.04
February
1,590 1,340 1,220 1,130 1,100 1,190
----------
3,360 6.62

FLOODS OF JANUARY-FEBRUARY 1957 IN KENTUCKY
Gage height, in feet, and discharge, in cubic feet per second, at indicated time, 1957
A175
Hour
Jan. 26
12 p.m...
Jan. 27
6 a.m.... 12 m .... 6 p.m.... 12 p.m...
Jan. 28
2 a.m.... 4.-.- __ .6 ______8 .._...__10 _____12 m __ . 2 p.m.... 4__ .__...6 ______8 _....._.10 ......_12 p.m...
Jan. 29
2 a.m.... 4__---._-6. __ ....8 ______10 _......12 m __ 2 p.m.... 4 __ . __ .6 __ ....8 ________10 _______
Gage height
3.58
3.51 3.63 4.14 4.76
5.23 5.66 6.30 6.95 7.54 8.15 9.00
10.10 11.30 12.35 13.00 13.50
13.74 14.13 14.90 16.10 17.30 18.80 20.30 21.60 22.70 23.40 24.05
Dis charge
908
866 938
1,240 1,630
1,960 2,280 2,790 3,360 3,940 4,550 5,400 6,610 7,960 9,260
10,100 10,800
11,100 11,700 12,800 14,800 16,800 19,500 22,300 24,900 27,200 28,800 30,200
Hour
Jan. 29 Con
12 p.m....
Jan. 30
2. ________4.. __ -_.-6. ________8. ________10 ________12 m -. ___
46 _________8 _________10___ __ .12 p.m....
Jan. 31
4... __ ...6... __ ...8_. _______10 ________12 m _---.
4.- __ . ___6_ __ ....810 ___ ...12 p.m....
Feb. 1
8. __ . __ .
Gage height
24.35
24.40 24.29 23.90 23.30 22.60 21.65 20.60 19.50 18.20 16.80 15.45 14.30 13.40
12.65 12.03 11.56 11.25 11.13 11.29 11.62 11.85 11.95 12.14 12.50 13.05
13.95 14.11
Dis charge
30,900
31,000 30,700 29,900 28,600 27,000 25,000 22,900 20,800 18,500 16,000 13,700 12,000 10,700
9,640 8,840 8,270 7,900 7,760 7,950 8,340 8,620 8,740 8,980 9,450
10,200
11,400 11,700
Hour
Feb. 1 Con.
12 m __ __ .
8. ______ .12 p.m.___J
Feb. 2
8 __ ____ .12 m __ ...
8..----.--.12 p.m.....
Feb. 3
12 m _____J
12 p.m.....
Feb. 4
12 m ._-__.
12 p.m____.
Feb. 5
12 m .. __ .
Gage height
14.07 13.75 13.61 13.66
13.29 12.84 12.34 11.75 11.06 10.34
9.31 8.54 8.04 7.48
7.08 6.71 6.40 6.11
5.82 5.79 5.99 6.02
Dis
charge
11,600 11,200 11,000 11,000
10,500 9,890 9,240 8,500 7,670 6,870
5,740 4,940 4,440 3,880
3,480 3,140 2,870 2,640
2,410 2,380 2,540 2,560

A176 FLOODS OF 1957
133. GUEST RIVER AT COEBURN, VA.
Location. Lat 36°55'45", long 82°27'23", on right bank at downstream side of bridge on State Highway 72, 1.0 mile southeast of Coeburn, Wise County, 1.4 miles upstream from Jaybird Branch, 1.8 miles downstream from Pine Camp Creek, and 6 miles up stream from mouth.
Drainage area. 87.3 sq mi.Gage-height record. Water-stage recorder graph except for Jan. 29 (6 p.m.) to Feb. 1
(8 p.m.) and Feb. 21 28. Graph was drawn for Jan. 29 to Feb. 1 on basis of flood crest, shape of recorder trace, and records for nearby streams. Datum of gage is 1,925.00 ft above mean sea level (Interstate Railway bench mark).
Discharge record. Stage-discharge- relation defined by current-meter measurements below 3,500 cfs and by slope-area measurement at 5,900 cfs. Discharge for period of no gage-height record estimated on basis of records for nearby stations.
Maxima. January-February 1957: Discharge, 6,360 cfs 12 p.m. Jan. 29 (gage height, 14.20 ft, from floodmarks).
1949 to December 1956: Discharge, 4,020 cfs Apr, 16, 1956 (gage height, 10.83 ft).
Mean discharge, in cubic feet per second, 1957
Day
I.....2 .....3_____4_____5.....6 __ .7__._.8 _____9 _____10 ____ 11 ....
January
90 83 78 78 80 90
103 101 211 895 685
Monthly mean di Runoff, in inches
February
1,500 1,520
688 398 295 288 292 400 895
1,240 790
Day
12 __ ...1 Q
14 ___ .15......16 __ ...17. __ ..18 ___ .19 ___ .20 ___ .21__ __ .22 ___ .
January
335 225 167 132 118 103 100
90 85 92
101
scharge, in cubic feet per secc
February
415 278 216 179 163 147 134 303 . 565 370 250
Day
23__._. 24 __ . 25 __ . 26 ___ . 27____. 28 ___ . 29 ___ .30--._.31.....
January
618 505 285 201 220
1,120 4,0003,2801,270
501 6.62
February
220 190 170 160 150 180
443 5.28
Gage height, in feet, and discharge, in cubic feet per second, at indicated time, 1957
Hour
Jan. 26
12 p.m___.
Jan. 27
6 a.m.... 12 m .... 6 p.m____ 12 p.m...
Jan. 28
2 a.m.... 4 ________
Gage height
2.69
2.67 2.84 3.15 3.38
3.54 3.70
Dis charge
175
172 201 260 315
355 400
Hour
Jan. 28 Con.
8. ______ .10. ____ ..12 m __._..
4____._ __ .6 __ ____ .8 _______ .10 __ ___ .12 p.m. __ .
Jan. 29
4 a.m_____
Gage height
3.93 4.29 4.66 5.31 6.05 6.83 7.50 7.93 8.25 8.44
8.69
Dis charge
469 577 706 934
1,220 1,530 1,810 2,020 2,180 2,280
2.430
Hour
Jan. 29 Con.
12 m . __ .
8..........12 p.m.....
Jan. 30
8-._ __ ....12 m .____.
8 __ __ ....
Gage height
9.30 10.80 12.10 13.50 14.20
12.90 10.60
9.20 8.30 7.40
Dis charge
2,810 3,860 4,770 5,800 6,360
5,330 3,720 2,740 2,210 1,760

FLOODS OF JANUARY-FEBRUARY 1957 IN KENTUCKY A177
Gage height, in feet, and discharge, in cubic feet per second, at indicated time, 1957 Continued
Hour
Jan. 30 Con.
12 p.m....
Jan. 31
8 _________12 m _. _._
8 __ _____12 p.m--_-
Feb. 1
8 ______ .12 m __ __
Gage height
6.80
6.356.105.905.906.206.50
6.806.806.706.60
Dis charge
1,520
1,3401,2401,1601,1601,2801,400
1,5201,5201,4801,440
Hour
Feb. 1 Con.
12 p.m__.__
Feb. 2
8_ ___ ____12 m ---._-
8.. __ ____12 p.m_--._
Feb. 3
12 m ------
Gage height
6.707.29
7.537.406.976.475.955.49
4.894.504.25
Dis
charge
1,4801,720
1,8201,7601,5901,3901,1801,000
786650565
Hour
Feb. 3 Con.
12 p.m.....
Feb. 4
12 m ______
12 p.m.....
Feb. 5
12 m ..---.
12 p.m____.
Gage height
4.03
3.833.683.523.38
3.273.283.303.32
Dis charge
499
439394350315
288290295300
134. STONY CREEK AT FORT BLACKMORE, VA.
[Crest-stage stations; gaging station discontinued 1952]
Location. Lat 36°46'30", long 82°'34'50", at Fort Blackmore, Scott County, 2,000 ft up stream from mouth, and 9.5 miles north of Gate City.
Drainage area. 41.4 sq mi.Gage-height record. Crest stages only. Datum of gage is 1,270.17 ft above mean sea
level, datum of 1929, supplementary adjustment of 1936.Discharge record. Stage-discharge relation defined by current-meter measurements
below 1,200 cfs and extended above by logarithmic plotting.Maxima. January 1957; Discharge, 2,220 cfs Jan. 29 (gaging height, 6.12 ft).
1949 to December 1956: Discharge, 2,550 cfs Apr. 16, 1956, (gage height, 6.55 ft). Flood of Jan. 28, 1918, reached a stage of about 9 ft (discharge, 12,000 cfs) and flood
of Feb. 14, 1948, was lower than that of 1918 by 1.3 to 2.0 ft at points 1 to 4 miles up stream, from Tennessee Valley Authority, Division of Water Control Planning Report No. 0-5981.
135. COPPER CREEK NEAR GATE CITY, VA.
Location. Lat 36°40'26", long 82°33'57", at highway bridge, 0.2 mile upstream from Plank Camp Creek, 1.1 miles downstream from Obeys Creek, and 2.6 miles northeast of Gate City, Scott County.
Drainage area. 106 sq mi.Gage-height record. Water-stage recorder graph except Feb. 10 28. Altitude of gage
is 1,290 ft (from topographic map).Discharge record. Stage-discharge relation defined by current-meter measurements.
Discharge for period of no gage-height record estimated on basis of records for near by stations.
Maxima. January-February 1957: Discharge, 3,200 cfs 4 a.m. Jan. 30 (gage height, 9.98 ft).
1947 to December 1956: Discharge, 6,800 cfs Jan. 30, 1950 (gage height, 13.0 ft from graph based on gage readings).

A178 FLOODS OF 1957
Mean discharge, in cubic feet per second, 1957
Day
!--___2 _____3_____4 __ .5__._.6 _____?_____8_____9 _____10 __ ll_-_-
January
105 98 84 69
107 115 107
93 390 910 585
Monthly mean dis Runoff, in inches
February
2,690 1,910
956 704 609 772 810
1,040 1,160 1,500 1,100
Day .
12-. __1 T14 _____15 _____16-. __17 _____18-. __19 __ ..9(1
21 _____22--__-
January
305 225 175 142 126 115 112 104
96 102 113
scharge, in cubic feet per seco
February
600 450 350 300 240 210 200 210 400 300 250
Day
23 ____ 24-.-. 25____ 26..-. 27 ____ 28.... 29....30 __._ 31 __ .
January
261 261 186 157 254
1,580 2,960 .2,280 1,860
454 4.93
February
230 210 200 190 200 300
---_.__-.
646 6.34
Gage height, in feet, and discharge, in cubic feet per second, at indicated time, 1957
Hour
Jan. 26
12 p.m_._
Jan. 27
8__.__-__12 m _.-- 4 p.m_--_ 8__ __ .-12 p.m__.
Jan. 28
2 a.m____ 4_______-6__ ______8__ ___ .10. __ __ _12 m ___ 2 p.m_--_4 __ ____6-___ __ .8 ___ __10_____._12 p.m...
Jan. 29
4 a.m___. 8__ ___ _12 m ____ 4 p.m.... 8 __ _ __ .12 p.m___
Gage height
3.15
3.13 3.17 3.67 4.08 4.35 4.78
5.20 5.66 6.12 6.60 6.87 7.22 7.75 8.85 9.30 9.62 9.69 9.65
9.66 9.64 9.48 9.79 9.92 9.92
Dis charge
144
140 147 239 321 375 480
585 700 815 935
1,010 1,150 1,430 2,260 2,620 2,880 2,940 2,900
2,910 2,900 2,760 3,030 3,150 3,150
Hour
Jan. 30
4. __ _____6. __ ---...8 _______ .10 ___ ____12 m _-. __
4.- ___ ...6__. _______8-_.._ __ _10 __ ___ .
Jan. 31
46_ ____ ...8__ _____ _10 __ ___ .12 m __ __ _
4. ___ __ _6_ ___ __8__ ___ ___10-. __ _ __
Feb. 1
8 __ ___ .12 m __ __ _
Gage height
9.96 9.98 9.88 9.63 9.25 8.8'/ 8.53 8.21 7.93 7.69 7.50 7.34
7.23 7.16 7.19 7.45 7.94 8.37 8.60 8.74 8.93 9.28 9.65 9.89
9.72 9.55 9.39 9.07
Dis charge
3,180 3,200 3,110 2,890 2,580 2,280 2,000 1,750 1,540 1,390 1,290 1,210
1,160 1,120 1,140 1,260 1,550 1,880 2,060 2,170 2,320 2,600 2,900 3,120
2,970 2,820 2,690 2,440
Hour
Feb. 1 Con.
12 p.m...-.
Feb. 2
12 m __ ..
Feb. 3
12 m ._ __ .
12 p.m.___.
Feb. 4
12 m ..___.
Feb. 5
12 m ----_.
Gage height
9.09 9.01
8.88 8.58 7.86 7.35
6.91 6.58 6.30 6.09
5.80 5.66 5.52 5.35
5.19 5.13 5.30 5.78
Dis charge
2,450 2,390
2,280 2,040 1,500 1,220
1,020 930 860 808
735 700 665 622
582 568 610 730

FLOODS OF JANUARY-FEBRUARY 1957 IN KENTUCKY A179
136. CLINCH RIVER AT SPEERS FERRY, VA.
Location. Lat 36°38'55", long 82°45'02", on right bank 100 ft downstream from bridgeon U.S. Highway 58, 0.5 mile downstream from Copper Creek, 0.8 mile northwest ofSpeers Ferry, Scott County, and 1.8 miles downstream from Clinchport.
Drainage area. 1,126 sq mi. Gage-height record. Water-stage recorder graph. Datum of gage is 1,196.52 ft above
mean sea level, datum of 1929, supplementary adjustment of 1936.Discharge record. Stage-discharge relation defined by current-meter measurements. Maxima. January-February 1957; Discharge, 45,300 cfs 3 p.m. Jan. 30 (gage height,
28.92 ft).1920 to December 1956: Discharge, 37,200 cfs Feb. 3, 1923 (gage height, 25.85 ft). 1895 to December 1956: Discharge, about 42,000 cfs Feb. 28,1902 (gage height, 26.6
ft, observed by U.S. Weather Bureau, site 400 ft downstream and at datum about 1 fthigher).
Flood in February 1862 reached a stage of 33 ft, from information furnished byTennessee Valley Authority.
Mean discharge, in cubic feet per second, 1957
Day
!-_-_-2_____3_.___4__ __5 _____6_-__-7_.___8 _____9 __ .10 ____ 11_.__
January
940 828 720 720 910
1,080 1,260 1,220 2,540 7,280 9,080
Monthly mean di Runoff, in inches
February
23,200 22,300 12,800 7,420 5,400 5,600 6,320 8,600
11,900 17,700 14,600
Day
12.. __ .13_____.14 ___ .15 ___ .16 ___ .17______18 ___ _19 ___ .9n21______22.. __ .
January
5,240 3,320 2,450 1,930 1,620 1,420 1,140
882 910
1,000 1,020
scharge, in cubic feet per seco
February
8,120 5,120 3,870 3,100 2,700 2,350 1,980 1,980 5,720 5,840 3,870
Day
23 __ .24 __ .25-_...26 ___ . 27 __ ..28... .. 29.-.-.30 __ .31 __ .
nd __ __ __ ___ .
January
3,360 4,460 3,320 2,460 2,450 9,600
26,50042,500 29,300
5,531 5.66
February
3,000 2,500 2,200 2,060 1,980 2,160
----------
6,940 6.42
Gage height, in feet, and discharge, in cubic feet per second, at indicated time, 1957
Hour
Jan. 27
8____ _____
8 _________12 p.m-___
Jan. 28
4_________6 _________8 _________
Gage height
5.00 4.96 5.12 5.54 5.87 6.15
6.44 6.90 7.57 8.30
Dis charge
2,100 2,070 2,220 2,640 2,970 3,260
3,580 4,090 4,840 5.720
Hour
Jan. 28 Con.
12 m ------
4__ __ ____.6. ______ J8_ ______ .10_._ __ ...
Jan. 29
8_ _________
Gage height
9.10 10.00 11.20 13.00 15.00 16.35 17.25 18.00
18.89 19.51
Dis charge
6,680 7,760 9,200
11,600 14,600 16,900 18,600 20,000
21,800 23,100
Hour
Jan. 29 Con.
8 ______ ..12 p.m____.
Jan. 30
4___._ __ _.6 __ ___ _.8 __ ____ .10 ______ .12 m _ __ .
Gage height
20.55 21.90 23.55 25.20
25.95 26.60 27.25 27.87 28.35 28.73
Dis charge
25,300 28,400 32,200 36,100
37,900 39,500 41,100 42,700 43,900 44,800

A180 FLOODS OF 1957
Gage height, in feet, and discharge, in cubic feet per second, at indicated time, 1957-Continued
Hour
Jan. 30 Con.
3 ______4__ _______6 _____ ..8 __ _____10 ________12 p.m....
Jan. 31
4 a.m____.8__ _______12 m _____
8 _____ ..
Feb. 1
8 ______ .
Gage height
28.9028.9228.8828.6628.3327.8027.10
25.4023.5521.8820.4519.3018.85
19.1019.45
Dis charge
45,20045,50045,20044,60043,80042,50040,800
36,60032,10028,30025,10022,600? 1 7nn
22,20022,900
Hour
Feb. 1 Con.
12 m .. ___
8 ____ __12 p.m. __
Feb. 2
4___ -.---.6_.--__--_8__. __ __10 ________12 m .....
4--.......6--.-- __ .
10. --._-.-
Gage height
19.5319.6220.1020.38
20.4220.3420.1819.8719.6219.3519.0518.7018.2517.76172516.69
Dis charge
23,10023,30024,30024,900
25,00024,80024,50023,80023,30022,70022,10021,40020,50019,50018,60017,500
Hour
Feb. 3
8 __ ______12 m ._.--
8 ____ ...12 p.m_._.
Feb. 4
12 m -.-._
Feb. 5
6 a.m_.___12 m ...--6 p.m_--_-
Gage height
15.6214.5713.6012.7011.9211.24
10.39
.DO
8.167.907.857.92
Dis charge
15,70013,90012,40011,20010,100
9,250
8 t> Ort
.U«5U
5,5505,2405,1805,260
137. NORTH FORK CLINCH RIVER AT DUFFIELD, VA.
Location. Lat 36°42'40", long 82°47'45", on right bank at upstream side of bridge on U.S. Highways 58 and 421, 0.2 mile downstream from Spurlock Branch, 0.5 mile south of Duffield, Scott County, and 1.6 miles upstream from Harris Branch.
Drainage area. 23.1 sq mi.Gage-height record. Water-stage recorder graph. Datum of gage is 1,814.15 ft above
mean sea level, datum of 1929, supplementary adjustment of 1936.Discharge record. Stage-discharge relation defined by current-meter measurements.Maxima. January-February 1957; Discharge, 789 cfs 6 p.m. Jan. 28 (gage height, 7.34
ft).195^ to December 1956: Discharge, 800 cfs Apr. 15,1956 (gage height, 7.40 ft).

FLOODS OF JANUARY-FEBRUARY 1957 IN KENTUCKY
Mean discharge, in cubic feet per second, 1957
A181
Day
1_. __23_. ...456-___78_-__9-___10 _11 ....
January
22 19 16 18 28 32 34 31
197 362 193
Monthly mean di Runoff, in inches
February
590 425 216 136 116 123 252 290 372 455 245
Day
12.. __ .13-. __ .14 ___ .15.. __ .16-. __ .17_. __ .18.. __1920_...21 ......22 ......
January
107 72 55 46 40 32 28 25 23 25 28
scharge, in cubic feet per seco
February
140 93 73 60 54 47 42 51 63 .60 ' 55
Day
23-_._.24_. ...25.--..26-....27 __ .28..-..29 ___ .3f>31 __ .
January
208 111
78 60 80
574 723 472 504
137 6.84
February
49 45 43 42 40 46
151 6.81
Gage height, in feet, and discharge, in cubic feet per second, at indicated time, 1957
Hour
Jan. 26
12 p.m____
Jan. 27
12 m _ ..
12 p.m....
Jan. 28
1 a.m2. _.._____3 ___ ....45 _._.__.__678 __ _____9_-._10... __ ..11__ ___ -_12 m __ ..
23 ___..._._4567_ __8. ________9 ....___._10 __ .....11... __ ._12 p.m....
Gage height
2.15
2.142.432.642.91
3.203.704.254.634.895.115.345.545.685.795.916.086.266.707.227.287.327.347.327.257.187.087.016.94
Dis charge
54
537898
126
160230312370408442476506527544562587616686769779786789786774763747736724
Hour
Jan. 29
46810 ______ .12 m _ __ _.
4 __ ____ .6___ __ _..810.- ____ .12 p.m____.
Jan. 30
8. __ .. __ _12 m ......
8--.--. __ .12 o m
Jan. 31
812 m ______
8 __________12 p.m.....
Feb. 1
8
Gage height
6.916.866.776.676.526.747.087.227.247.177.076.91
6.445.855.164.574.244.17
4.284.956.406.096.156.35
6.236.05
Dis charge
720712697681657692747769772761745720
644552449360311300
317418638588598630
611582
Hour
Feb. 1-Con.
12 m . ....4 p.m. _.8 __ _- ....12 p.m....
Feb. 2
8-___ ___-12 m ._._-
8___. __..12 p.m____
Feb. 3
6 a m_-___12 m . __ .
12 p.m--_-
Feb. 4
6 a.m_____12 m __-..
12 p.m._--
Feb. 5
6 a.m_-__-12 m _ __ _
12 p.m____
Gage height
5.705.746.486.38
5.915.404.824.454.204.00
3.753.633.403.25
3.102.972.902.79
2.762.822.842.90
Dis charge
530536651635
562485398342305275
238220186166
148133125113
110116118125

A182 FLOODS OF 1957
138. CLINCH RIVER ABOVE TAZEWELL, TENN.
Location. Lat 36°25'30",long 83°23'54",on right bank 0.4 mile upstream from GrissomIsland, 4.6 miles downstream from Big War Creek, 10 miles east of Tazewell,Claiborne County, and at mile 159.8.
Drainage area. 1,474 sq mi. At site used 1919 27, 1,548 sq mi. Gage-height record. 'Water-stage recorder graph. Datum of gage is 1,060.7 ft above
mean sea level, datum of 1929, supplementary adjustment of 1936. Discharge record. Stage-discharge relation defined by current-meter measurement
below 43,000 cfs. Maxima. January-February 1957: Discharge, 51,100 cfs 4:30 a.m. Jan. 31 (gage height,
21.00 ft).1918 to December 1956; Discharge, 39,700 cfs Feb. 4, 1923 (gage height, 20.3 ft, at
site 23 miles downstream at datum 102.7 ft lower).Flood of February 1862 reached a stage of about 24 ft, from information by local
resident (discharge, 66,000 cfs), from report by Tennessee Valley Authority.
Mean discharge, in cubic feet per second, 1957
Day
!.----2_____3.....4 ___ .5. __ .6. __ .7_____8. __ .9_ ....10 .... ll---_
January
1,350 1,190 1,060
994 1,510 1,660 1,650 1,730 2,620 6,500
11,000
Monthly mean dis Runoff, in inches
February
34,000 31,400 21,900 12,300 8,170 7,080 7,510
10,700 12,100 18,500 21,000
Day
12._.._.13 __ ...14 ___ .15 ___ _16 ___ .17......18... ...19.. ....20-...--21_._.._22____._
January
8,850 5,220 3,560 2,680 2,180 1,840 1,550 1,290 1,090 1,130 1,240
>charge, in cubic feet per seco
February
14,000 8,280 5,800 4,450 3,640 3,100 2,680 2,360 3,660 7,580 5,770
Day
23.....24-.__-25.....26.....27.....28.....29.. ...30-....31.. __
January
2,260 5,600 4,910 3,600 3,460 9,470
29,40042,70047,300
6,793 5.31
February
4,120 3,330 2,860 2,600 2,490 2,550
9,426 6.66
Gage height, in feet, and discharge, in cubic feet per second, at indicated time, 1957
Hour
Jan. 26
12 p.m...
Jan. 27
6 a.m___.ll---.___
12 p.m___
Jan. 28
2 ,a.m.___6 __ ....12 m ....
Gage height
3/84
3.773.704.425.17
5.406.207.30
Dis charge
3,050
2,9502,8503,8905,070
5,4406,8108,850
Hour
Jan. 28 Con.
8 ____ ....12 p.m.....
Jan. 29
9 ......... .12 p.m.....
Jan. 30
Gage height
7.909.30
11.30
13.5017.0017.5317.68
17,90
Dis charge
10,00013,00017,900
24,10035,50037,40037,900
38,700
Hour
Jan. 30 Con.
Jan. 31
8. _____ ..12 m . __ ..
12 p.m.....
Feb. 1
Gage height
19,7520.78
21.0020.8820.5219.4017.95
16.98
Dis charge
45,90050,200
51,10050,60049,10044,50038,900
35,400

FLOODS OF JANUARY-FEBRUARY 1957 IN KENTUCKY A183
Gage height, in feet, and discharge, in cubic feet per second, at indicated time, 1957 Continued
Hour
Feb. 1 Con.
12 m .....
12 p.m....
Feb. 2
6 a.m.....12 m __ ._
Gage height
16.1515.9216.40
16.2015.90
Dis charge
32,60031,80033,500
32,80031,800
Hour
Feb. 2 Con.
12 p.m.....
Feb. 3
6 a.m......
Gage height
15.4414.69
13.8011.7010.55
Dis charge
30,20027,800
25,00018,90016,000
Hour
Feb. 4
12 p.m.....
Feb. 5
12 p.m.....
Gage height
9.608.167.68
79^
6.586.38
Dis charge
13,70010,6009,600
8,7207,4907,130
139, POWELL RIVER AT BIG STONE GAP, VA.
Location. Lat 36°52'08", long 82°46'32", on right bank 10 ft upstream from bridge onU.S. Highway 23 at Big Stone Gap, Wise County, 1 mile upstream from South ForkPowell River and 2.5 miles downstream from Pigeons Creek.
Drainage area. 112 sq mi. Gage-height record. Water-stage recorder graph. Datum of gage is 1,459.07 ft above
mean sea level, datum of 1929, supplementary adjustment of 1936. Discharge record. Stage-discharge relation defined by current-meter measurements
below 2,800 cfs and by slope-area measurement at 11,000 cfs. Maxima. January-February 1957; Discharge, 11,000 cfs 3 p.m. Jan. 29 (gage height,
9.67 ft).1944 to December 1956: Discharge, 16,500 cfs Jan. 7, 1946 (gage height, 9.8 ft, from
f loodmark).
Mean discharge, in cubic feet per second, 1957
Day January
1 ___ 1152..... 1053----. 954..... 1025..... 1366-..._ 1507 __ . 1618----. 1479 QQQ
10. __ 1,160 11---. 696
Monthly mean dL Runoff, in inches
February
2,180 1,880
933 636 520 460 485 636
1,080 1,540
936
Day
12......13 ___ .14 ___ .15__-__.16 __ ..17 __ __18 __ .._19----.-2021-...._22--. __
January
415 304 234 192 169 133 123 110 105 115 125
scharge, in cubic feet per secc
February
600 450 364 300 262 228 203 376 600 470 376
Day
23. __ .24 ___ .25 ___ .26...-. 27 __ .28 __ .29 __ .30--.-_ 31 _____
January
1,030 595 384 280 308
1,750 6,3302,340 1,300
632 6.50
February
320 280 254 237 221 231
-----------
609 5.66

A184 FLOODS OP 1957
Gage height, in feet, and discharge, in cubic feet per second, at indicated time, 1957
Hour
Jan. 26
12 p.m...
Jan. 27
4 a.m____8 __ ....12 m .___
8 ______12 p.m...
Jan. 28
2 a.m....4... __ _.6 ______8 _____ .10 __ . __12 m ....
4 _____ .6 _____ .8 __ __ .10. __ __12 p.m...
Jan. 29
2 a.m.__-4._ ___ .6 _____ .
Gage height
1.81
1.801.901.992.052.082.15
2.292.382.512.202.983.564.254.855.285.375.235.04
5.025.145.36
Dis charge
247
243280316340352380
445490555400836
1,3002,0202,7903,3903,5203,3203,060
3,0303,2003,500
Hour
Jan.29-Con.
10 ______12 m .....^
3__ __ ....4 ______ _,6 ______ .
8 _______10 ______ .12 p.m.....
Jan. 30
8. ______ 112 m ___ .
8 ______ .
Jan. 31
12 m ___ .
12 p.m.....
Feb. 1
12 m ___ .
Gage height
5.946.938.589.509.679.548.637.526.796.18
5.294 R C>
4.243.959 71
3.52
3.393 463.534.07
4.404.23
Dis charge
4,3205,8908,900
10,70011,00010,8009,0006,9405,6604,690
3,4102,5102,0101,7001,4501,270
1,1501,2101,2801,830
2,2002,000
Hour
Feb. 1 Con.
12 p.m....
Feb. 2
12 m .....
Feb. 3
12 m _ ....
Feb. 4
12 m . __ _
Feb. 5
12 m .....
Gage height
4.414.87
4.474.033.713.46
3.253.132.982.86
2.752.662.572.49
2.452.452.422.38
Dis charge
2,2102,820
2,2801,7801,4501,210
1,040944836756
690636585545
525525510490
140. SOUTH FORK POWELL RIVER AT BIG STONE GAP, VA.
[Crest-stage gage; gaging station discontinued 1947]
Location. Lat 36°51'54", long 82°46'16", at bridge on U.S. Highway 23 in town of Big Stone Gap, Wise County, 1.6 miles upstream from Powell River and 1.9 miles down stream from Butcher Creek.
Drainage area. 40 sq mi.Gage-height record. Crest stage only. Altitude of gage is 1,470 ft (from topographic
map).Discharge record. Stage-discharge relation defined by current-meter measurements
below 2,500 cfs.Maxima. January 1957: Discharge, 3,550 cfs Jan. 29 (gage height, 8.62 ft).
1944-47,1951 to December 1956: Discharge, 3,100 cfs Jan. 7,1946 (gage height, 8.0 ft, from floodmark).

FLOODS OF JANUARY-FEBRUARY 1957 IN KENTUCKY A185
141. NORTH FORK POWELL RIVER AT PENNINGTON GAP, VA.
[Crest-stage station; gaging station discontinued 1951]
Location. Lat 36°46'26", long 83°01'59", at highway bridge 0.8 mile north of town of Pennington Gap, Lee County, 1.3 miles downstream from Straight Creek, and 4.5 miles upstream from Powell River.
Drainage area. 70 sq mi.Gage-height record. Crest stage only. Altitude of gage is 1,365 ft (by barometer).Discharge record. Stage-discharge relation defined by current-meter measurements
below 2,300 cfs and by slope-area measurements at 4,500 and 9,700 cfs.Maxima. January 1957: Discharge, 4,430 cfs Jan. 29 (gage height, 8.70 ft).
1944 to December 1956: Discharge, 9,700 cfs Jan. 7, 1946 (gage height, 12.1 ft).
142. POWELL RIVER NEAR JONESVILLE, VA.
Location. Lat 36°39'42", long 83°05'42", on right bank 35 ft downstream from highwaybridge 2 miles southeast of Jonesville, Lee County, and 10 miles upstream from WallenCreek.
Drainage area. 319 sq mi. Gage-height record. Water-stage recorder graph. Datum of gage is 1,259.08 ft above
mean sea level, datum of 1929, supplementary adjustment of 1936.Discharge record. Stage-discharge relation defined by current-meter measurements. Maxima. January-February 1957: Discharge, 19,800 cfs 2 a.m. Jan. 30 (gage height,
26.87 ft).1931 to December 1956: Discharge, 30,000 cfs Jan. 8,1946 (gage height, 30.8 ft).
Mean discharge, in cubic feet per second, 1957
Day
!---_-23 _____4__._.5 __ _6__-__7__.__8----.9__ ___10____ 11. __
January
280 242 198 204 308 354 371 364
1,240 4,170 2,800
Monthly mean dL Runoff, in inches
February
6,540 6,310 2,970 1,780 1,320 1,230 1,560 2,290 3,260 5,020 3,520
Day
12__ __ .i ?
14_____.15. __ .16 ___ .17_____.18 ___ .19 ___ .9(1
21 ___ .22_____.
January
1,350 898 670 540 460 382 285 240 240 270 304
scharge, in cubic feet per secc
February
1,800 1,230 1,010
765 648 560 488 540
1,320 1,140
870
Day
23-.--.94
25-___.26. __ .27 ___ .28. __ .29 __ . 30 ___ .31__--.
>nd
January
2,070 ' 1,860
1,090 765 775
5,030 13,200 11,6004,360
1,836 6.64
February
715 602 560 520 520 520
1,772 5.78

A186 FLOODS OF 1957
Gage height, in feet, and discharge, in cubic feet per second, at indicated time, 1957
Hour
Jan, 26
12 p.m____.
Jan. 27
6 a.m_____12 m ___
12 p.m____.
Jan. 28
2 _____ ...3 _____ ...4.5___ ______678 __ __ __ .9__-_- __ _10 ______ .11. __ ____.12 m ______
2 _____ ...3 ______ .4_____.___.56 ______ .7_ ___ __ .8 ______ .9 ______ .10. ___ __.11. __ ____.12 p.m____.
Jan. 29
Gage height
3.29
3.223.253.704.35
4.664.815.045.305.625.956.306.657.037.287.788.259.30
10.0011.0512.3013.7215.1016.1517.0017.9018.5018.9519.35
19.70
Dis charge
666
634648870
1,230
1,4201,5101,6401,8001,9902,1902,4202,6402,8903,0503,3803,6804,3604,8205,5006,3207,2708,2408,9809,570
10,20010,60011,00011,300
11,700
Hour
Jan. 29 Con.
6__ __ ___ j8_ ______10________^12 m -. __
4___ __ __]6. __ __ __ .8 ______ .
Jan. 30
4 ______ .6. ___ __ .8_ ______ .10 ______ .12 m ___ .
4_._______,6. __ __ __ .8 ______ .10 __ __ __ .
Jan. 31
8 ______ .12 m ___ .
8 ______ .12 p.m____.
Feb. 1
Gageheight
19.761 Q C7
19.2519.0018.9819.6020.9522.7524.45
. 25.7226.55
26.8726.4025.009^ f)f)
20.4518.0015.3013.5012.1011.0510.209.45
8.538.208.779.70
10.4211.08
12.00
Dis charge
11,70011,50011,20011,00011,00011,60013,00015,00016,90018,50019,500
19,80019,30017,60015,300
.12,50010,3008,3807 1 9f>
6,1805,5004 Q^f)
4,460
3,8603,6504,0204,6205,0905,520
6,120
Hour
Feb. 1 Con.
12 m -_-._
8 ___ __12 p.m_.__
Feb. 2
8 _ _.....12 m _____
8__. -__-._
Feb. 3
8_ ___-__-.12 m _ __ _
8 __ ___ _
Feb. 4
12 m . ____
Feb. 5
12 m _ _ _
12 p.m____
Gage height
12.8313.0912.9012.8413.32
13.8713.8712.9511.5510.209.08
8.207.506.956.546.235.95
5.535.214.964.73
4.524.454.454.45
Dis charge
6,6606,8306,7006,6706,990
7,3807,3806,7405,8304,9504,220
3,6503,2002,8402,5702,3702,190
1,9401,7501,6001,460
1,3301,2901,2901,290

FLOODS OF JANUARY-FEBRUARY 1957 IN KENTUCKY A187
143. POWELL RIVER NEAR ARTHUR, TENN.
Location. Lat 36°32'30", long 83°37'49", on left bank 500 ft upstream from bridge on U.S. Highway 25 E, 2.3 miles east of Arthur, Claiborne County, and 2.4 miles down stream from Indian Creek.
Drainage area. 685 sq mi.Gage-height record. Water-stage recorder graph. Datum of gage is 1,045.84 ft above
mean sea level (Tennessee River Survey datum).Discharge record. Stage-discharge relation defined by current-meter measurements
below 23,000 cfs.Maxima. January-February 1957: Discharge, 23,500 cfs 5 a.m. Jan. 30 (gage height,
22.07 ft).1919 to December 1956: Discharge, 33,000 cfs Jan. 9, 1946 (gage height, 27.15 ft,
from floodmark) from rating curve extended above 23,000 cfs by indirect measure ment at 32,000 cfs.
Maximum stage known, about 27.5 ft in March 1826 (discharge, 34,000 cfs). The flood of Jan. 29, 1918, reached a stage of about 27.2 ft (discharge, 33,000 cfs)
from reports of Tennessee Valley Authority.
Mean discharge, in cubic feet per second, 1957
Day
I......2 __ ...3......4......5----..6---...7......8__ __ .9 ....10-....11__...
January
505 430 378 360 722 824 746 680
1,040 3,790 6,290
February
12,600 14,500 11,100 6,060 4,080 3,280 3,310 4,990 5,530 7,100 8,610
Day
12......13......14.. __ .15______16-----.17. _ __ .18. _____199D
21 ______22---.. _
January
4,760 2,600 1,780 1,330 1,030
842 692 554 488 456 483
Monthly mean discharge, in cubic feet per secc Runoff, in inches __--__---_---_-__-_-__----.
February
6,340 3,880 2,780 2,140 1,780 1,540 1,360 1,350 1,670 2,260 2,010
Day
23_____24. __ .25--...26 ___ .27_____28____.29____.30--.--31---..
January
1,230 2,900 2,960 1,870 1,680 5,800
15,80023,10019,500
3,407 5.73
February
1,690 1,460 1,330 1,260 1,250 1,340
4,164 6.33
Gage height, in feet, and discharge, in cubic feet per second, at indicated time, 1957
Hour
Jan. 26
12 p.m...
Jan. 27
6 a.m____ 12 m __ 6 p.m.... 12 p.m.__
Jan. 28
6 a.m____ 12 m __ .
Gage height
3.20
3.07 3.05 3.52 3.95
5.75 7.40
Dis charge
1,610
1,520 1,500 1,830 2,180
3,680 5.160
Hour
Jan. 28 Con.
12 p.m.....
Jan. 29
12 m .. __ J
12 p.m.....
Jan. 30
2 a.m..___.
Gage height
10.45 12.85
14.50 16.35 19.60 21.67
21.94
Dis charge
8,050 10,500
12,400 14,800 19,500 22,800
23.300
Hour
Jan. 30 Con.
8 ______ .12 m -----
8 ______ .12 p.m_.__
Jan. 31
6 __ _-_.-.12 m _____
12 p.m....
Gage height
22.07 21.98 21.78 21.64 21.68 21.85
21.91 21.72 20.27 17.53 15.20
Dis charge
23,500 23,400 23,000 22,800 22,900 23,100
23,200 22,900 20,500 16,400 13,300

A188 FLOODS OF 1957
Gage height, in feet, and discharge, in cubic feet per second, at indicated time, 1957 Continued
Hour
Feb. 1
10. __ ...
6_. ___ .12 p.m__.
Feb. 2
4 a.m____8 __ __ .
Gage height
14.2114.03142114.8416.05
16.4416.50
Dis charge
12,10011,80012,10012,80014,400
14,90015,000
Hour
Feb. 2-Con.
12 m .....
Feb. 3
6 a.m__.__12 m .....
Gage height
16.3815.901 5 34
14.6613.5411.9710.48
Dis charge
14,80014,20013,400
12,60011,3009,5708,080
Hour
Feb. 4
12 m .. __
12 p.m..,.
Feb. 5
12 m ---_.
12 p.m....
Gage height
9.108.187.506.96
R ^A
6.155.855.60
Dis charge
6,7005,8605,2504,760
4,3904,0403,7603,540
144. NORRIS LAKE NEAR MORRIS, TENN.
Location. Lat 36°13'29",long 84°05'29",at NorrisDam on Clinch River, 2|miles north west of Norris, Anderson County, Tenn., and at mile 79.8.
Drainage area. 2,912 sq mi.Gage-height record. Water-stage recorder graph. Datum of gage is at mean sea level,
adjustment of 1921, and 0.11 ft above mean sea level, datum of 1929, supplementary adjustment of 1936. Elevations given herein are referred to adjustment of 1912.
Maxima. January-February 1957: Contents at 12 p.m., 756,400 cfs-days Feb. 4 (elev., 1,031.10 ft).
Remarks. Storage capacity, 1,294,200 cfs-days (elev., 1,034.0 ft) of which 1,150,000 cfs-days is controlled storage. Records furnished by Tennessee Valley Authority.
Elevation, in feet, and contents, in cfs-days at 12 p.m. of indicated day 1957
Day
!__-.2....3. ...4____5....6 ....7....8-..-9 -.10...11...12...
14...15...16 ...
January
Elevation
966.97966.40965.77965.28965.25965.65965.72965.35965.19965.66967.09968.17968.51968.53968.40968.05
Contents
369,300364,700359,600355,700355,400358,700359,200356,200355,000358,800370,300379,600382,500382,700381,600378,600
February
Elevation
996.18999.99
1,001.961,002.211,001.771,001.171,000.611,000.451,000.471,001.281,002.061,001.981,001.181,000.07
998.83997.40
Contents
675,900725,900752,900756,400750,300742,000734,300732,100732,400743,500754,300753,200742 100707 ClC\C\
710,700691,900
Day
17...18...19 ...20...21 ...22 ...23 ...24.. .25...26 ...27 ...28...29?n31...
January
Elevation
967.48966.93966.27965.60964.98964.84964.87965.49966.23966.77967.49971.40Q7H 91
984.88991.45
Contents
373,700369,000363,700358,300353,300352,100352,400357,400363,300367,700373,800408,000472,000541,700617,100
February
Elevation
996.07994.82993.65992.50991.71990.95990.16989.50988.90988.43988.12987.90
Contents
674,500658,700644,000629,800620,200611,200601,800594,200587,200581,800578,200575,600

FLOODS OF JANUARY-FEBRUARY 1957 IN KENTUCKY A189
145. CLINCH RIVER BELOW NORRIS DAM, TENN.
Location. Lat 36°12'56", long 84°04'56", 0.5 mile upstream from Clear Creek, 1.0 mile downstream from Norris Dam, 1.5 miles north of Norris, Anderson County, and at mile 78.8.
. Drainage area. 2,913 sq mi. At site used 1904 27, 3,056 sq mi.Gage-height record. Water-stage recorder graph. Datum of gage is 819.11 ft above
mean sea level, datum of 1929, supplementary adjustment of 1936.Discharge record. Stage-discharge relation defined by current-meter measurements.Maxima. January-February 1957: Discharge, 26,600 cfsl 11 a.m. Feb. 12 (gage height,
11.65 ft).1903 to December 1956: Discharge, 87,000 cfs Mar. 5, 1917 (gage height, 38.5 ft,
from graph based on gage readings, at site 19.6 miles downstream at railroad bridge at Clinton, at datum 42.49 ft lower), from rating curve extended above 62,000 cfs.
Flood of Mar. 11, 1826, reached a stage of 43.5 ft (discharge, 130,000 cfs) at rail road bridge at Clinton, from reports' by Tennessee Valley Authority. Flood of March 31,1886, reached a stage of 41.3 ft, revised, (discharge, 113,000 cfs) at railroad bridge at Clinton. Flood of Feb. 24, 1862, equalled that of Mar. 31, 1886, from reports by Tennessee Valley Authority.
Remarks. Flow regulated by Norris Lake.
Mean discharge, in cubic feet per second, 1957
Day
!__-__2 __ .3__.__4__ __5 ___6 _____7 _____8 _____9 _____10 ____ 11____
January
6,760 S,810 6,890 6,920 3,840
219 2,650 6,120 5,630 5,640
5,670
February
8,680 8,850
11,700 20,100 21,800 21,800 21,800 21,800 21,900 21,900 23,900
Day
12__ __13_____14 _____15 _____16__ __17 _____18 _____19 _____20 _____21 ____22 __ _
January
5,990 6,330 6,300 6,360 6,790 7,890 7,860 7,830 7,830 7,500 4,410
Monthly mean discharge, in cubic feet per seco
February
26,600 26,500 26,400 26,300 26,200 24,100 21,400 21,300 21,200 21,100 19,300
Day
23 __ .24 __ .25 __ .26_.__.27 ___ .28 ___ .29 ___ .30 __ .31. __ .
January
4,780 3,720 3,280 2,040 2,640
97 110
2,3006,890
5,100
February
16,900 14,700 12,700 10,800
8,590 8,590
19,180
Gage height, in feet, and discharge, in cubic feet per second, at indicated time, 1957
Hour
Jan. 29
12 p.m___
Jan. 30*
2 ________
7 ________8 ________12 p.m_._
Gage height
1.32
1.31 1.303.503. -583.575.055.06
Dis charge
110
103Q7
3,4103,5803,5607,0207,050
Hour
Jan. 31
12 m _____
Feb. 1*
2 _________12 m _____
Gage height
5.004.94
4.95- 5.65
5.675.70
Dis charge
6,8906,730
6,7608,6808,7308,820
Hour
Feb. 2
12 m __ __
Feb. 3*
2 __________6 __ . ___ .8 __________
Gage height
5.715.72
5.74. 7.08
7.158.45
Dis charge
8,8508,880
8,94013,00013,20017,200
690-137 O - 64 - 13

A190 FLOODS OF 1957
Gage height, in feet, and discharge, in cubic feet per second, at indicated time, 1957 Continued
Hour
Feb.3*-Con.
10 p.m_-_-12 p.m-__-
Feb. 4*
6:30 a.m -_7:30 __ ..8... ___ .9 __ __ .
3:30. _____5_________6_________8___ ____12 p.m_-_-
Feb. 5
12 m _-_-.12 p.m-__-
Ffb. 6
12 m _____12 p.m____
Feb. 7
12 m _____12 p.m____
Feb. 8
12 m _____12 p.m____
10 a.m____ 12 p.m____
Feb. 10
12 p.m____
Gage height
8.538.54
8.559.809.159.82
10.038.589.609.90
10.0010.02
10.0110.00
10.009.98
10.0010.00
10.0210.00
10.04 10.04
10.05
Dis charge
17,50017,500
17,50021,2001 Q *?nfi21,30021,90017,50020,60021,50021,80021,900
21,80021,800
21,80021,700
21,80021,800
21,90021,800
21,900 21,900
21,900
Hour
Feb. 11*
2---.______3 __ _ ___ _4__________6___.______12 p.m. __ _
Feb. 12
11---------12 m --___.12 p.m_-__-
Feb. 13
12 p.m_--_-
Feb. 14
12 p.m___._
Feb. 15
12 p.m_--_-
Feb. 16
12 m ______
Feb. 17*
2---_._____4________._6-_________12 p.m.....
Feb. 18
12 m ------12 p.m.----
Gage height
10.0211.3511.5011.5711.6211.63
11.6511.6511.6411.63
11.59
11.58
11.52
11.5011.48
11.4610.159.939.909.87
9.859.83
Dis charge
21,90025,70026,20026,40026,50026,500
26,60026,60026,60026,500
26,400
26,400
26,200
26,20026,100
26,00022,20021,60021,50021,400
21,40021,300
Hour
Feb. 19
Feb. 20
12 p.m_--_
Feb. 21
2___._____.3 __ --.._.6_________J
4__ _._____.6. ___ __ J
Feb. 24*
12 m _.___.
12 p.m____.
Feb. 25
Gage height
9.82
9.76
9 7R
9.758.558.428.378.35
8.358.258.35S IR
8.327.107.007.00
7.00
Dis charge
21,300
21,100
21,100
21,10017,50017,10017,00016,900
16,90016,60016,90016,900
16,80013,00012,70012,700
12,700
* Affected by regulation; daily means cannot be computed exactly from data shown.

FLOODS OF JANUARY-FEBRUARY 1957 IN KENTUCKY A191
146. COAL CREEK AT LAKE CITY, TENN.
[Crest-stage station]
Location. Lat 36°13'14", long 84°09'27", on right bank at U.S. Highway 25W bridge at Lake City, Anderson County, 0.1 mile upstream from Right Fork, and 0.1 mile down stream from Louisville and Nashville Railroad bridge.
Drainage area. 24.5 sq mi (measured by Tennessee Valley Authority on 7^-minute pla- nimetric maps, scale, 1:24,000).
Gage-height record. Crest stages only.Discharge record. Peak discharges from rating curve defined by current-meter meas
urements to 3,600 cfs.Maxima. January-February 1957: Discharge, 2,580 cfs Jan. 31 (gage height, 12.02 ft).
June 1932 to April 1934, May 1954 to December 1956: Discharge, 3,400 cfs Mar. 19, 1933 (gage height, 13.0 ft).
The Tennessee Valley Authority estimated a discharge of 8,400 cfs for the flood of Mar. 23, 1929.
147. BUFFALO CREEK AT MORRIS, TENN.
[Crest-stage station]
Location. Lat 36°11'05", long 84°03'41", on right bank at culvert on State Highway 71 (Norris Freeway), 1.0 mile southeast of Norris, Anderson County.
Drainage area. 9.45 sq mi (measured by Tennessee Valley Authority on 7j-minute pla- nimetric maps, scale, 1:24,000).
Gage-height record. Crest stages only.Discharge record. Peak discharges from rating curve extended above 610 cfs.Maxima. January-February 1957; Discharge, 1,130 cfs Jan. 31, (gage height, 9.03 ft).
August 1947 to January 1951, May 1954 to December 1956: Discharge, 757 cfs Feb. 13, 1948 (gage height, 7.91 ft).
148. TENNESSEE RIVER AT CHATTANOOGA, TENN.
Location. Lat 35°05'12", long 85°16'43", on right bank at Rivermont Golf and Country Club, half a mile downstream from South Chickamauga Creek, 3 miles downstream from Chickamauga Dam, 3^ mile upstream from Walnut Street Bridge in Chattanooga, Hamilton County, and at mile 467.6.
Drainage area. 21,400 sq mi, approximately.Gage-height record. Water-stage recorder graph. Datum of gage is 621.12 ft above
mean sea level, datum of 1929, supplementary adjustment of 1936.Discharge record. Stage-discharge relation defined by current-meter measurements.Maxima. January-February 1957: Discharge, 208,000 cfs Feb. 2; gage height, 34.22 ft
(32.24 at Walnut Street) Feb. 2.1874 to December 1956: Discharge, 410,000 cfs (gage height, 53.8ft, at Walnut Street).
Stage known, 57.9 ft, at Walnut Street, Mar. 11, 1867 (discharge about 459,000 cfs).

A192 FLOODS OF 1957
Mean discharge, in cubic feet per second, 1957
Day
1--..-2_.__.3__ __4_-__.5.....6.. ...7.....8.....9 _____10 __._ ll.__.
January
44,300 44,700 44,900 43,300 31,000 29,500 28,900 34,900 38,400 37,100 31,800
February
191,000 202,000 199,000 192,000 192,000 183,000 177,000 175,000 17R.OOO 176,000 171,000
Day
12 __ _.13.._._.14 ___ .15. __ ..16 ___ .17. __ .^18__ __ J19. __ .20 ___ .21 ___ .22.__-_.
January
31,100 28,200 27,800 35,400 41,700 43,300 38,700 33,900 29,700 21,800 28,400
Monthly mean discharge, in cubic feet per secc
February
155,000 141,000 128,000 124,000 118,000 115,000 107,000 103,000 100,000
93,500 86,600
Day
23...-.24 ___ .25 ___ . 26 __ .27 __ _28 __ .29__.__30 _____31____.
January
29,100 44,000 44,400 30,000 32,400 56,000
111,000123,000 138,000
44,410
February
83,400 68,400 59,000 63,100 67,600 68,900
----------
132,800

A193
INDEX
Page A
Acknowledgments __________________ A5Antecedent conditions ______________ 1
Barren River _____________________ 38Barren River at Bowling Green, Ky__ 104 Barren River basin ________________ 13Barren River near Pageville, Ky____ 102Bear Branch near Noble, Ky ________ 75Beaver Creek near Wallace, Va_____ 146Beaver dam Creek at Damascus, Va__ 137 Big Creek near Rogersville, Tenn___ 165 Big Moccasin Creek near Gate City,
Va________________________ 159Big Sandy River ___________ 3, 5, 8, 9, 38Big Sandy River at Louisa, Ky ______ 69Big Sandy River basin_________ 1, 8, 9, 51Blaine Creek at Yatesville, Ky ______ 71Bluestone River near Pipestem,
W. Va_____________________ 44Bluestone River near Spanishburg,
W. Va______________________ 42Boone Lake at Spurgeon, Tenn ______ 153Buck Creek near Shopville, Ky ______ 119Buffalo Creek at Norris, Tenn ______ 191
Camp Creek near Camp Creek,W. Va _______________ 43
Cane Branch near Parkers Lake, Ky_ 117 Cedar Creek near Lebanon, Va______ 173Cherokee Lake near Jefferson City,
Tenn________________________ 165Clear Fork near Robbins, Tenn _____ 121Clinch River _____________________ 3, 18Clinch River above Tazewell, Tenn__ 182 Clinch River at Cedar Bluff, Va_____ 171Clinch River at Cleveland, Va _______ 174Clinch River at Richlands, Va_______ 171Clinch River at Speers Ferry, Va ___ 179 Clinch River basin_________________ 18Clinch River below Norris Dam,
Tenn._______________________ 189Clover Fork ______________________ 15Coal Creek at Lake City, Tenn ______ 191Copper Creek near G?te City, Va____ 177Cumberland River __ 5, 15, 16, 17, 18, 22, 38 Cumberland River at Barbourville,
Ky_________________--_-. 111Cumberland River at Celina, Tenn___ 132
Page Cumberland River at Cumberland
Falls, Ky______________ 113 Cumberland River at Pineville,
Ky________________.____. 109Cumberland River at Williamsburg,
Ky _______ ____________ 112 Cumberland River basin ___ 1, 14, 17, 105 Cumberland River near Harlan, Ky_ 106 Cumberland River near Pineville,
Ky____________________ 109Cumberland River near Rowena,
Ky_______________________ 125
D
Dale Hollow Reservoir near Celina,Tenn_________________ 129
Damage figures for the upperTennessee River basin.______ 23
Death toll in Kentucky ____________ 7Dewey Reservoir near Van Lear,
Ky_________________. 61Discharge hydrograph ______._._ 11, 14, 18Dix River near Danville, Ky _______ 91Doe River at Elizabethton, Tenn ___ 149 Drakes Creek near Alvaton, Ky____ 103Duck River ______________________ 19
E
East Fork Obey River near Jamestown, Tenn_____
Elk River ________________Elk River at Sutton, W. Va . Explanation of data ________
Flood damage..._________________Flood discharges, determination ... Flood frequencies ________________Flood losses in the Green River
basin __________i__________.Flood losses in the Kentucky River
basin ______________________Flood losses in the Licking River
basin ______________________Floods ________-____._---___-___Floods, general description _______Fort Patrick Henry Lake near
Kingsport, Tenn.____________G
Goose Creek at Manchester, Ky____
125194726
192538
20
20
2055
153
83

A194 INDEX
Page Green River.______________________ 38Green River at Greensburg, Ky______ 99Green River at Munfordville, Ky_.___ 101 Green River basin ___________ 3,13,22,97Green River near McKinney, Ky _____ 98Green River near Mount Salem, Ky___ 99 Guest River at Coeburn, Va _________ 176Guyandot River at Branchland, W. Va _ 50 Guyandot River at Man, W. Va _______ 49Guyandot River basin_______________ 49
H
Helton Branch at Greenwood, Ky_____ 118Herrington Lake near Burgin, Ky____ 91Holston River _____________________ 3Holston River at Surgoinsville, Tenn _ 162Holston River basin ________________ 18Holston River near Jefferson City,
Tenn ________________________ 166
I
Introduction __ Isohyetal map
Johns Creek near Meta, Ky.___. Johns Creek near Van Lear, Ky .
K
Kanawha River basin _______________ 40Kentucky River.-_--___--- 3, 5, 12, 38,39 Kentucky River at lock 2, at Lockport,
Ky__________________________ 95Kentucky River at lock 4, at
Frankfort, Ky _____ --__----_ 93 Kentucky River at lock 6, near
Salvisa, Ky._____________ 92 Kentucky River at lock 8, near Camp
Nelson, Ky_---___---__------- 89Kentucky River at lock 10, near
Winchester,-Ky__.__-------- 88Kentucky River at lock 14, at
Heidleberg, Ky _______________Kentucky River basin ________ 1, 10,22, 73
Lake Cumberland__________________ 17Lake Cumberland near Jamestown,
Ky______________________ 124Laurel River__________________ 3,14,17Laurel River at Corbin, Ky-____.___ 115Levisa Fork _________.______--_. 3,8,9Levisa Fork at Fishtrap, Ky ________ 53Levisa Fork at Paintsville, Ky ______ 64Levisa Fork at Pikeville, Ky.-___--_ 58 Levisa Fork at Prestonsburg, Ky____ 59Levisa Fork near Grundy, Va _______ 52
PageLicking River basin______..-- 10,22,73 Licking River near Salyersville,
Ky ............___-___--- 73Little Pigeon River ____.__-_-__-_-. 19Little Pigeon River above West Fork
Little Pigeon River at Sevier- ville, Term..._____._--_--. 134
Little Pigeon River at Sevierville,Tenn.__ __-_.-_ 134
Little River at Wardell, Va_ __ __ __ 172Little River near Maryville, Tenn _.. 168 Little Sandy River basin._________ 10, 71Little Sandy River near Grayson, Ky _ 71
M
McGills Creek near McKinney, Ky .._ 97 Middle Fork Holston River at
Groseclose, Va_____---------- 140Middle -Fork Holston River at
Sevenmile Ford, Va________.-. 141Middle Fork Kentucky River ... 3, 5,10 Middle Fork Kentucky River at
Buckhorn, Ky _______.--_--. 80Middle Fork Kentucky River at
Tallega, Ky_._____-.----.-_- 81 Middle Fork Kentucky River basin.__ 13 Middle Fork Kentucky River near
Hyden, Ky__________________ 79
N
New River at Glenlyn, Va___ ______ 42New River at New River, Tenn ______ 119Norris Lake near Norris, Tenn _____ 188North Fork Clinch River at Duffield,
Va.__-._____.__________ 180North Fork Holston River at Holston,
Va_-__._______________ 158 North Fork Holston River, near Gate
City,Va ______._____._.__... 161North Fork Holston River near
Saltville, Va __________.__ 157 North Fork Kentucky River .._-- 3, 10, 11 North Fork Kentucky River at
Hazard, Ky _____________-_-.. 74North Fork Kentucky River at
Jackson, Ky_________________. 78North Fork Kentucky River at
Whitesburg, Ky._______________ 73North Fork Kentucky River near
Airedale, Ky _________________ 79North Fork Powell River at
Pennington Gap, Va .--_-----__ 185
O
Obey River below Dale Hollow Dam,Tenn--------_----_-_--__.__ 130
Ohio River------_-______---_--_-_- 22

INDEX A195
Page
Paint Creek at Staffordsville. Ky.-___ 62Panther Creek near Panther, W.Va___ 66Piney Creek at Raleigh, W.Va _-.---. 45Pitman Creek at Somerset, Ky._---__ 123 Poor Fork__--_--------__---._- 3,14,15Poor Fork at Cumberland, Ky _______ 105Potcamp Creek near Pound, Va ______ 56Pound River ____--___-_-__-____-_-_ 10Pound River at Pound, Va __._____.._ 56Pound River near Haysi, Va .--___-_. 56Powell River at Big Stone Gap,Va.___ 183Powell River near Arthur, Term _____ 187Powell River near Jonesville, Va ____ 185Prater Creek at Vansant, Va ___.---_ 51
R
Rainfall___________________________ 5Recurrence interval________________ 39Red Bird River near Big Creek, Ky ._ 83Red River _________________________ 38Red River at Clay City, Ky _____.-__. 87Red River near Hazel Green, Ky _____ 86Rockcastle River ___________________ 17Rockcastle River at Billows, Ky.---_ 117Rolling Fork near Lebanon, Ky______. 97Russell Creek near Columbia, Ky ___. 100Russell Fork -_---_--___-_--______- 8Russell Fork at Elkhorn City, Ky _-_. 58Russell Fork at Haysi, Va_--___-____ 55
Saline River basin__________________ 22Salt River basin_--____--______-__- 13, 95Salt River near Harrodsburg, Ky_--_- 95 Salt River near Van Buren, Ky_______ 96South Fork Cumberland River ._--_-_ 17 South Fork Cumberland River near
Stearns, Ky-_--------_--___-_- 122South Fork Holston River at Kings-
port, Tenn-_-_--__--_____--_-_ 154South Fork Holston River at River
side, near Chilhowie, Va _______ 136South Fork Holston River at Vestal,Va_ 138 South Fork Holston River below South
Holston Dam, Tenn _______________ 144South Fork Kentucky River __________ 3, 10South Fork Kentucky River at
Booneville, Ky _-_-_-______-.__ 83South Fork Kentucky River near
Oneida, Ky.-_--_--__-____-_-__ 83 South Fork Little Barren River at
Edmonton, Ky.--_________-._-_ 101South Fork Powell River at Big Stone
Gap, Va____--_.--._______ 184
Page South Holston Lake near Bristol,
Va.-Tenn______________ 143 Stages and discharges at stream-
gaging stations _______________ 26Stillwater Creek at Stillwater, Ky __ 87 Stony Creek at Fort Blacknxore, Va_. 177 Straight Creek at Jensen, Ky _______ 109Summary of flood stages and
discharges __________________ 27
Tellico River _______---__-___.____ 18Tellico River at Tellico Plains,
Term...__.___-----__----- 169Temperatures --_--__-------__---_ 1Tennessee River ______________ 5,18,19Tennessee River at Chattanooga,
Tenn_________--.--.__._-_. 191Tennessee River basin_._____- 1,18,134Troublesome Creek at Noble, Ky ____ 76Tug Fork at Litwar, W.Va _.---__-. 65 Tug Fork near Kermit, W.Va.--__-. 68 Tygarts Creek-_--._-------------- 38Tygarts Creek basin__---__----__. 10, 72Tygarts Creek near Greenup, Ky ____ 72
U
Upper Cumberland River. Upper Licking River ____.
W
Wabash River basin -_____-__-._-Walker Creek at Bane, Va_ _______Watauga Lake near Elizabethton,
Term __ _______---_---_----Watauga River at Elizabethton,
Tenn... --_..._-_----_-._-_ Watauga River below Wilbur Dam,
Watauga River near Sugar Grove,N.C -._ __ __ __ -------- __ ..
West Bays Fork at Scott sville, Ky __. West Fork Little Pigeon River near
Pigeon Forge, Term __________West Fork Obey River near Alpine,
Tenn___ ________--____-.____.Wolf Creek near Narrows, Va .____.Wolf River... ______ ----_-..___.Wolf River near Byrdstown, Tenn ... Wood Creek near London, Ky -...__.
Yellow Creek near Middlesboro, Ky....._________...______
338
2240
148
151
148
147103
134
1274118
128116
107
U. S. GOVERNMENT PRINTING OFFICE : 1964 O - 690-137