how new yorkers perceive their parks - columbia university
TRANSCRIPT

EXECUTIVE SUMMARY
The purpose of this study is briefly to describe and analyze the views of people who use the parks in New York City and to raise public awareness about the views and levels of satisfaction of park users. The study is based on a stratified random sample of 1,086 people recreating in 19 parks in all five boroughs of New York City from July 21 to August 5, 1997.
•
In the survey conducted for this report, approximately 66% termed parks very important, while only 3.2% stated that parks were not important.
•
The importance of parks cuts across income lines. About two-thirds of our respondents in parks surrounded by low income census tracts considered parks very important. A nearly identical percentage of people said the same thing in parks in areas of the city that are not poor.
•
Nearly one-third (30.9%) of our respondents visited the park every day and nearly 60% (58.9%) visited the park more than once a week. One third of those we surveyed (33.9%) visited other parks at least once a week. On the other hand, about a quarter (23.2%) never went to any park other than the one they were in at the time of the interview.
•
Over 75% of park users rated the quality of the park that they were visiting as either good or excellent.
•
Most park users were reasonably satisfied with the parks; the most common response to our question asking respondents to rate the park they were visiting was good (50%).
•
Central Park received the highest rating of any park. No one rated it poor, and half of those interviewed in the park gave it a rating of excellent. Only one other park (Clove Lakes in Staten Island) was rated excellent by a majority of its visitors.
•
Alley Pond (Queens), Central, Clove Lakes, Prospect and Marine Parks (Brooklyn) were judged excellent or good by over 85% of the customers we surveyed. Eighteen of the nineteen parks in which we conducted interviews were perceived positively by users. This included 14 parks viewed positively by 70 percent or more of those interviewed.
•
Only Jackie Robinson Park in Manhattan was perceived negatively by a majority of the respondents interviewed.
•
Park users are satisfied with their parks in both high and low income neighborhoods. In parks located in lower income census tracts, 71% rated their
parks as good or excellent. While this is slightly lower than the 79% positive rating given in higher income parks, the degree to which this positive rating of parks is universal throughout the city is an important finding of this study.
•
Cleanliness and safety were the most important factors to park users, rated very important by approximately 90% of all those interviewed.
•
The repair of facilities, bathrooms and drinking water fountains were also considered very important by three quarters of those interviewed.
•
Parks such as Central and Clove Lake parks elicited only minor expressions of concern from park users. In contrast, a significant number of people in East River, Ft. Tryon and Morningside parks cited the presence of drug users and dealers as the aspect of the park that they most disliked.
•
While 62% of those questioned were unwilling to contribute time to improve the park, over a third were willing to volunteer 2 hours per month. Approximately 6.6% of those interviewed said they were willing to contribute 7 or more hours to the park.
•

The most frequent activities undertaken by park users included:
Sit/read/sun/watch (22%), Walking and observing (22%), Getting together with friends and family (17%), Using a playground (13%), Playing ball (12%), Jogging (11%) and Riding a bike (7%).
Interviews were conducted in the parks by 60 enrollees in the Parks Council's Urban Conservation Corps Program. Interviewers were trained by a team of Columbia University faculty and graduate students in three sessions held at the School of International and Public Affairs. Interviewer staff in the field were supervised by Americorps Interns employed by the Parks Council.
1.0 STUDY OBJECTIVES AND METHODOLOGY
1.1 Objectives
The purpose of this study is briefly to describe and analyze the views of people who use the parks in New York City and to raise public awareness about the views and levels of satisfaction of park users. The study is based on a stratified random sample of 1,086 people recreating in 19 parks in all five boroughs of New York City from July 21 to August 5, 1997 (see Exhibit One for a list of the parks surveyed). In our view, the bottom line for many services delivered by government is the level of satisfaction that people have with that service. Our principal objective was to determine current levels of satisfaction and identify the factors that contribute to varied levels of perceived quality. In addition, we analyzed customer aspirations for the city's parks.
1.2 Survey Methodology
The analysis in Appendix B demonstrates that, on multiple criteria, the individuals and regions sampled are representative of the City. As such, we can comfortably accept the conclusions of this study as representing the true population of parks users.
The initial stage of our sampling process used a method called stratified sampling. A stratified sample dissects the population into distinct categories, or strata, and then selects a minimum number of representatives from each strata. In making our selections, we wanted an accurate cross-section of parks to be represented.
There were several possible factors which we could use to make our cross-section. For example, would the cross-section be based on income, on geography, or on racial composition? In order to represent adequately New York City, our sample of parks was constructed to be representative according to all three of these cross-sections. In our sample design, each of New York City's five boroughs was considered a stratum. We then selected parks from each borough, ensuring that they were not concentrated in just one section of the borough. Another

element which we factored into the geographic selection of parks was the size of the parks themselves. We sought to select a variety of parks, with small, medium, and large parks all represented in our sample. We also selected parks from neighborhoods with a range of income levels.
Interviews were conducted in the parks by 60 enrollees in the Parks Council's Urban Conservation Corps Program. Interviewers were trained by a team of Columbia University faculty and graduate students in three sessions held at the School of International and Public Affairs. Interviewer staff in the field were supervised by Americorps Interns employed by the Parks Council.
Exhibit One: The Surveyed Parks
The Parks
Name of Park Borough Location
1. Alley Pond Queens Union Tpke., Cloverdale, Winchester & Spring Blvd., 76th & 73rd Ave., 230th & 233rd. St., Cross Island Pkway.
2. Central Park Manhattan Central Park South & West, W110th St. & 5th. Ave.
3. Clove Lakes Staten Island Clove Road, Victory Blvd., Slosson Ave.,
4. Crotona Park Bronx Crotona Park North, East & South & Fulton Ave.
5. East River Park Manhattan FDR Drive, Montgomery & East River
6. Flushing Meadows/Corona Park
Queens Grand Central Pkway, Van Wyck Expway.
7. Fort Tryon Park Manhattan Henry Hudson Pkway, Riverside Dr., Broadway, Bennett Ave. & W190th St.
8. Greenbelt Staten Island Victory Blvd., Great Kills Pkway, Richmond Pkway, Rockland Ave.
9. Jackie Robinson Park Manhattan Edgecombe & Bradhurst Ave., E145th & E155th St.
10. Marine Park Brooklyn Avenue U, Stuart, Fillmore & 33rd

St.
11. Morningside Park Manhattan W110th & W123rd St., Morningside Dr., Morningside & Manhattan Ave.
12. Owls Head/Shore Road Park Brooklyn Leif Erikson Dr., Shore Road, 71st St., Colonial Rd. & Wakeman Place
13. Pelham Bay Park Bronx Hutchinson River Pkway, Middleton Rd. & I95. Eastchester Bay
14. Prospect Park Brooklyn Parkside, Ocean, Flatbush & 9th Ave., 15th St.
15. Riverside Park Manhattan W72nd & W158th St., Riverside Dr.
16. Springfield Park Queens 145th. Rd., 184th. St., 147th. Ave., Springfield Blvd.
17. St. Mary's Park Bronx St. Mary's & 149th St, Jackson & St. Anns Ave.
18. Sunset Park Brooklyn 5th & 7th Ave, 41st & 44th St.
19. Van Cortlandt Park Bronx Broadway, Parkway, City Line & Jerome Ave.
2.0 PARKS OVERVIEW
2.1 Parks Mission and History
The principal mission of the New York City Department of Parks and Recreation (DPR) is to assure that the parks, beaches, playgrounds, stadia, marinas, recreation facilities, gardens, malls, squares and public spaces are clean, safe and attractive for the heath and enjoyment of the people. This mission is strongly supported by the citizenry of New York City. A solid majority of New Yorkers - 62%, according to a 1994 Commonwealth Fund survey - believe that this mission is so important that parks are as essential a public service as police protection, fire protection, and sanitation. Furthermore, an overwhelming majority of New Yorkers believe that parks make New York a more liveable city and that safe open spaces in which children can play are essential to child development. Stakeholder groups such as the Parks Council, many friends of parks groups throughout the city, The Commonwealth Fund, and Citizens Budget Commission have also supported the overall mission of the Department of Parks and Recreation.
The first major expansion of public park space came in the late nineteenth century when Frederick Law Olmsted and Calvert Vaux designed Central Park (1858) and

Prospect Park (1865, in the then separate city of Brooklyn), Olmstead designed Riverside Park (1872), and the city acquired 3,495 acres of park land including St. Mary's, Claremont, Crotona, Bronx, Van Cortlandt and Pelham Bay Parks. In the early twentieth century, acquisition of new park land slowed. Instead, the Department of Parks concentrated on adding playgrounds and recreational opportunities for children. During the rule of Tammany Hall during the 1920s, the condition and upkeep of public parks and recreational facilities decreased dramatically. This trend was reversed by Robert Moses who served as Parks Commissioner from 1934 to 1960. During Moses' regime park space more than doubled, beaches were renovated and re-constructed, and hundreds of recreational facilities were built. This expansion continued for a decade after Moses' tenure. This expansionary trend ended with New York's fiscal crisis during the 1970s when the city transferred property to the federal government. From the 1970s to the 1990s DPR concentrated on maintaining the parks and recreational facilities that already exist. Under the leadership of Parks Commissioner Henry Stern, acquisition of parks space has quietly resumed. During 1994, the city acquired 527 acres of park land.(1) In recent years, the DPR has continued to operate under tight financial constraints. Capital and operating expenditure levels have remained generally flat; in 1996, the DPR spent $86 million on capital projects and $145 million on operations, compared with $95 million and $132 million respectively in 1992(2).
2.3 Physical Assets
The New York City Parks system consists of more than 27,000 acres of park land and other properties. Parks account for almost 20,000 acres, while non-park properties make up the remainder.(3) Nonpark properties include playgrounds; expressway and parkway land; malls, strips, and plots; circles, squares, and triangles; and miscellaneous other properties.
New York runs 479 parks, but five of its best known parks (Central Park in Manhattan, Flushing Meadows-Corona in Queens, Prospect Park in Brooklyn, Van Cortlandt-Pelham Bay in the Bronx, and the Greenbelt in Staten Island) make up more than 40% of all the acreage. In addition to these parks, there are 34 parks above 100 acres each. These parks account for 8,385 acres (approximately 43% of all park land). Thus, thirty-nine large parks account for approximately 84% of park land. The 41 medium-sized parks (20-100 acres) and 399 small parks (under 20 acres) account for the remaining 16% (3,072 acres). Park facilities include 623 ball fields, 541 tennis courts, 33 outdoor swimming pools, 10 indoor swimming pools, 31 recreation and senior centers, 14 miles of beaches, 13 golf courses, 6 ice rinks, 4 major stadiums, and 5 zoos.(4)
Compared to other major U.S. cities, New York maintains an expansive park system. A 1991 study by the Citizens Budget Commission included a survey of 14 major U.S. cities. Among these cities, only Phoenix possessed more park land acreage, and New York devoted the highest share of its total land (13.5%) to

parks. However, New York is more densely populated than other cities. So, New Yorkers must share comparatively less park land than residents of most other cities. Among the cities included in the survey, only Chicago lagged behind New York in park acreage per 10,000 citizens. New Yorkers have 36 park acres per 10,000 residents, while the average among the 14 cities surveyed was 96.7 acres per 10,000. The median was 65.5 acres per 10,000.
3.0 CUSTOMER VIEWS OF PARKS
3.1 Public Satisfaction
While parks operating expenditures are comparatively lower than other major cities and have decreased in real terms since 1965, the public is generally satisfied with the quality of New York City parks. In the survey conducted for this report, nearly 76% of park users rated the quality of the park that they were visiting as either good or excellent. (See Appendix A for the English version of the survey instrument used in this report.). A 1994 Commonwealth Fund survey of a random sample of New York City residents found that 52% of New Yorkers give a positive rating to park maintenance. Another 44% in 1994 believed that parks and playgrounds had improved over the previous five years.(5) In general, all of the surveys of parks users that we reviewed for this project produced results similar to our study: a high level of satisfaction with parks, concerns about cleanliness and security, and a high value placed on parks as a source of relaxation from the city's frenetic pace.
Most park users were reasonably satisfied with the parks, as Exhibit Two indicates. The most common response to our question asking respondents to rate the park they were visiting was good (50%). Our survey respondents were all park users. Possibly, those most dissatisfied with the parks do not visit them. On the other hand, those people who visit and experience the parks are in the best position to assess their actual quality. The park-by-park breakdown on this question in Exhibit Three indicates significant variation in response. Central Park received the highest rating of any park. No one rated it poor, and half of those interviewed in the park gave it a rating of excellent. Only one other park, Clove Lake in Staten Island, was rated excellent by a majority of its visitors.
If we combine ratings and use good and excellent as positive ratings and fair and poor as negative ratings, we found that eighteen of the nineteen parks in which we conducted interviews were perceived positively by users (See Exhibit Four). This included 14 parks viewed positive
by 70 percent or more of those interviewed. Alley Pond, Central, Clove Lakes, Prospect and Marine Parks were judged excellent or good by over

85% of the customers we surveyed. Only Jackie Robinson Park was perceived negatively by a majority of the respondents interviewed.
N= 1,086
Park users are satisfied with their parks in both high and low income neighborhoods. In parks abutting lower income census tracts, 71% rated their parks good or excellent. While this is slightly lower than the 79% positive rating given in higher income parks, we were surprised by the consistency of these positive ratings of parks throughout the city.
Exhibit Three: Park Ratings by Individual Park
Quality of This Park's Facilities
Excellent Good Fair Poor
Alley Pond 33% 54% 13% 0%
Central 50% 46% 2% 0%
Clove Lakes 51% 38% 9% 2%
Crotona 18% 56% 18% 7%
East River 37% 38% 13% 12%

Flushing Meadows Corona 5% 56% 19% 15%
Fort Tryon 30% 52% 15% 3%
Greenbelt 35% 39% 15% 10%
Jackie Robinson 6% 38% 42% 15%
Marine 39% 52% 6% 0%
Morningside 17% 42% 32% 8%
Owls Head/Shore Road 14% 60% 22% 3%
Pelham Bay 25% 51% 19% 6%
Prospect 29% 58% 14% 0%
Riverside 28% 37% 25% 5%
Springfield 7% 56% 34% 4%
St. Mary's 28% 55% 10% 7%
Sunset 18% 59% 20% 2%
Van Cortlandt 26% 56% 12% 6%
Total 26% 50% 18% 5%
N= 1,074
Exhibit Four: Quality of This Park's Facilities
Quality of This Park's Facilities
Positive Negative
Alley Pond 87% 13%
Central 98% 2%
Clove Lakes 89% 11%
Crotona 75% 25%
East River 75% 25%
Flushing Meadows
64% 36%

Corona
Fort Tryon 82% 18%
Greenbelt 75% 25%
Jackie Robinson
44% 56%
Marine 94% 6%
Morningside 59% 41%
Owls Head/Shore Road
74% 26%
Pelham Bay 76% 24%
Prospect 86% 24%
Riverside 68% 32%
Springfield 63% 37%
St. Mary's 83% 17%
Sunset 79% 21%
Van Cortlandt
82% 18%
Total 76% 24%
N=1,074
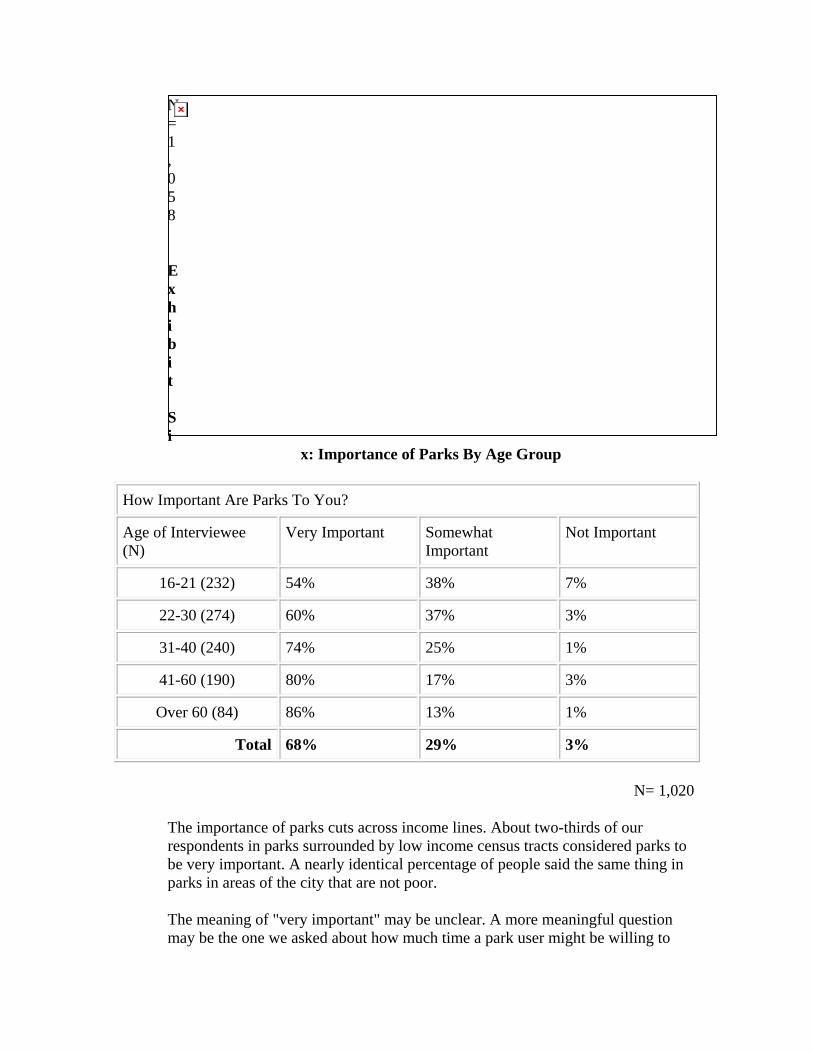
We also sought to measure the importance of parks to users and the intensity of citizen interest. Exhibit Five reports responses to the question: How important are parks to you? Approximately 66% termed parks as very important, only 3.2% stated that parks were not important. Interestingly, we found that parks were considered more important by older respondents than by younger respondents.. Exhibit Six shows the importance of parks categorized by the age of our interviewees. Over 85% of our respondents over 60 stated that parks were very important to them. This contrasts with 54% of those under 21 responding that parks were very important.
.
N=1,058
Exhibit Si
x: Importance of Parks By Age Group
How Important Are Parks To You?
Age of Interviewee (N)
Very Important Somewhat Important
Not Important
16-21 (232) 54% 38% 7%
22-30 (274) 60% 37% 3%
31-40 (240) 74% 25% 1%
41-60 (190) 80% 17% 3%
Over 60 (84) 86% 13% 1%
Total 68% 29% 3%
N= 1,020
The importance of parks cuts across income lines. About two-thirds of our respondents in parks surrounded by low income census tracts considered parks to be very important. A nearly identical percentage of people said the same thing in parks in areas of the city that are not poor.
The meaning of "very important" may be unclear. A more meaningful question may be the one we asked about how much time a park user might be willing to

volunteer to help improve the park. This requires a respondent to think of their own schedule and envision a commitment of time and work. Exhibit Seven reports the data drawn from this question. While 62% of those questioned were unwilling to contribute time to improve the park, over a third were willing to volunteer 2 hours per month. Approximately 6.6% of those interviewed said they were willing to contribute 7 or more hours to the park.
In our view, these results are evidence of an extraordinary level of support for parks. Of those respondents who perceived the parks to be very important, 47% were willing (and 49% were unwilling) to contribute time to their park. This result is confirmed by the 1994 Commonwealth Fund random sample survey of New York City where 43% of those surveyed were or would consider joining a park support organization.
N= 1,086
3.2 Dimensions of Quality
To understand the factors that contribute to perceptions of park quality, our interviewers asked park users to rate the importance of six factors related to parks quality and were encouraged to mention other factors as well. Exhibit Eight provides the data drawn from that set of questions. Cleanliness and safety were the most important factors, rated very important by approximately 90% of all those interviewed. The repair of facilities, bathrooms and drinking water were also considered very important by three quarters of those interviewed. Very few additional factors were mentioned, and those that were tended to be closely related to the factors enumerated above.
Exhibit Eight: How Important Are The Following Factors to Park Quality?

% who answered very
important
N=1,086
Another way of gauging perceptions of quality is to ask park users what they think should be done to improve the park. We asked an open-ended question on this issue and recorded the data reported in Exhibit Nine. The detailed park-by-park responses are presented in Appendix C. The data provide confirmation of the overriding importance of cleanliness and security as the key concerns of park users. Of those responding to this open-ended question, 31.9% sought enhanced park cleanliness. Perhaps in response to the city's declining crime rate, only 15.3% sought improved security. Other key areas cited for improvement included: play equipment, facilities (11.3%), restrooms, water fountains (6.2%), landscaping (5.7%),
general maintenance (5.2%) and recreation programming (4%).
As Exhibit Eleven indicates, these concerns varied by park. (See Appendix C for a detailed breakdown of park specific likes, dislikes and improvement needs.) Although there were negative perceptions of parks such as Central Park in Manhattan and Marine Park in Brooklyn, they elicited only minor expressions of concern from park users. Visitors to Staten Island's Greenbelt took the very un-New York perspective that there was little to dislike about the park and nothing really needed significant improvement. In contrast, significant numbers of users in East River, Ft. Tryon and Morningside parks cited the presence of drug users and dealers as the aspect of the park they most disliked.

While each park is a unique public space, parks in all neighborhoods are valued by their users for similar things. At all 19 parks surveyed, significant numbers (more than 10%) of respondents noted that open space was what they most liked about their park. Sports facilities were highly valued at 15 parks. Park users also shared dislikes: in 17 parks, trash was mentioned by significant numbers of people as the park feature they most disliked.
Exhibit Nine: Parks Quality Factors Considered Most Important
QUALITY DIMENSION
VERY IMPORTANT
SOMEWHAT IMPORTANT
NOT IMPORTANT
DON'T KNOW/
NO RESPONSE
CLEANLINESS 91.5% 6.4% 0.9% 1.2%
SAFETY 90.0 8.2 0.8 1.0
CLEAN/OPEN BATHROOMS
78.3 16.7 3.9 1.2
WORKING DRINKING FOUNTAINS
75.1 17.3 5.4 2.1
FACILITIES IN GOOD CONDITION
74.1 20.6 3.2 2.0
YOUTH PROGRAMS
68.0 23.9 6.4 1.7
N = 1,086
Exhibit Ten: What Improvements Would You Like To See In Your Park?
N=822
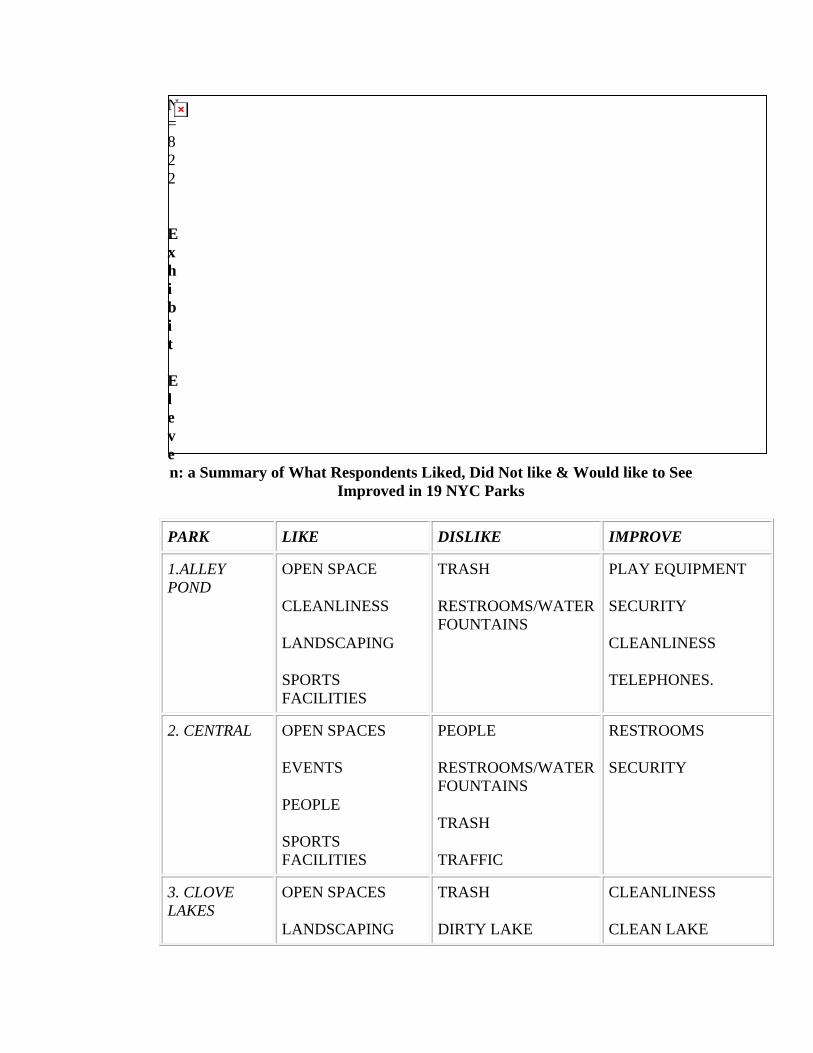
Exhibit Eleven: a Summary of What Respondents Liked, Did Not like & Would like to See
Improved in 19 NYC Parks
PARK LIKE DISLIKE IMPROVE
1.ALLEY POND
OPEN SPACE
CLEANLINESS
LANDSCAPING
SPORTS FACILITIES
TRASH
RESTROOMS/WATER FOUNTAINS
PLAY EQUIPMENT
SECURITY
CLEANLINESS
TELEPHONES.
2. CENTRAL OPEN SPACES
EVENTS
PEOPLE
SPORTS FACILITIES
PEOPLE
RESTROOMS/WATER FOUNTAINS
TRASH
TRAFFIC
RESTROOMS
SECURITY
3. CLOVE LAKES
OPEN SPACES
LANDSCAPING
TRASH
DIRTY LAKE
CLEANLINESS
CLEAN LAKE

4.CROTONA SPORTS FACILITIES
OPEN SPACES
TRASH
DIRTY LAKE
SECURITY
CLEANLINESS
SECURITY
CLEAN THE LAKE
5. EAST RIVER
OPEN SPACES
SPORTS FACILITIES
PEOPLE
LANDSCAPING
PEOPLE
DRUG USERS
RESTROOM/WATER FOUNTAINS
HOMELESS PEOPLE
SECURITY
CLEANLINESS
LANDSCAPING
RESTROOMS/WATER FOUNTAINS
6. FLUSHING
MEADOW
OPEN SPACES
SPORTS FACILITIES
LANDSCAPING
TRASH CLEANLINESS
7. FT. TRYON OPEN SPACE
SPORTS FACILITIES
LANDSCAPING
PEOPLE
DRUG USERS
TRASH
SECURITY
CLEANLINESS
PROGRAMMING
8. GREENBELT
OPEN SPACE
LAKE
NOTHING MENTIONED BY MORE THAN 12%
NOTHING MENTIONED BY MORE THAN 13%
9. JACKIE ROBINSON
SPORTS FACILITIES
OPEN SPACE
PEOPLE
TRASH
INSECTS/RODENTS
CLEANLINESS
SECURITY
10. MARINE PEOPLE
OPEN SPACE
SPORTS FACILITIES
RESTROOMS/WATER FOUNTAINS
TRASH
DOG CONTROL
PLAY EQUIPMENT CLEANLINESS
RESTROOMS/WATER FOUNTAINS

BROKEN FACILITIES DOG CONTROL
SECURITY
11. MORNING- SIDE
OPEN SPACE
SPORTS FACILITIES
LANDSCAPING
TRASH
DRUG USERS
SECURITY
SECURITY
CLEANLINESS
MAINTENANCE
12. OWLS HEAD
SPORTS FACILITIES
OPEN SPACE
CLEANLINESS
TRASH CLEANLINESS
PLAY EQUIPMENT
SECURITY
PARK LIKE DISLIKE IMPROVE
13. PELHAM BAY
OPEN SPACES
SPORTS FACILITIES
TRASH
BROKEN FACILITIES
CLEANLINESS
PLAY EQUIPMENT
RESTROOMS/WATER FOUNTAINS
14. PROSPECT
OPEN SPACE
LANDSCAPING
TRASH
SECURITY
CLEANLINESS
SECURITY
15. RIVERSIDE
SPORTS FACILITIES
OPEN SPACE
LANDSCAPING
PEOPLE
TRASH
PEOPLE
CLEANLINESS
SECURITY
PLAY EQUIPMENT
16. SPRINGFIELD
OPEN SPACES
LANDSCAPING
TRASH
LANDSCAPING
DIRTY LAKE
RESTROOMS/WATER
CLEANLINESS
PLAY EQUIPMENT
LANDSCAPING

FOUNTAINS
17. ST. MARY'S
OPEN SPACES
SPORTS FACILITIES
LANDSCAPING
TRASH
BROKEN FACILITIES
SECURITY
CLEANLINESS
SECURITY
PLAY EQUIPMENT
18. SUNSET SPORTS FACILITIES
OPEN SPACE
POOL/SPRINKLERS
LANDSCAPING
TRASH CLEANLINESS
SECURITY
PLAY EQUIPMENT
19. VAN CORTLANDT
OPEN SPACES
SPORTS FACILITIES
LANDSCAPING
TRASH
LANDSCAPING
BROKEN FACILITIES
CLEANLINESS
PLAY EQUIPMENT
MAINTENANCE LANDSCAPING
3.3 Park Utilization
There is no regular study of park utilization in New York City, although a number of studies have attempted estimates. A 1991 study by the Citizens Budget Commission reported a number of utilization estimates based on a variety of previous studies.(6) In addition, an excellent study of Riverside Park by Ukeles and Associates estimated the use of that park. Exhibit Twelve reports these utilization estimates.
Another way to look at park utilization is to see how often park goers use the parks. Exhibit Thirteen presents data on the frequency of park visits. Nearly one-third (30.9%) of our respondents visited the park every day. Since we conducted our survey on week days during the summer, we make the assumption that people were referring to warmer weather months in their response. Nearly 60% (58.9%) visited the park more than once a week. New Yorkers are both turf-oriented and cosmopolitan. One third of those we surveyed (33.9%) visited other parks at least once a week. On the other hand, about a quarter (23.2%) never went to any park other than the one they were in at the time of the interview.
Exhibit Twelve:
Park Utilization Estimates
Park Name Use Estimate Source Year CENTRAL PARK 14,200,000
(by 3,000,000 users)
WILLIAM KORNBLUM AND TERRY WILLIAMS
1982
VAN CORTLANDT PARK
763,000 ROLF MEYERSOHN 1986
PELHAM BAY 1,000,000 ROLF MEYERSOHN 1987 PROSPECT PARK 4,370,000 ROLF MEYERSOHN 1987 RIVERSIDE PARK 2,865,000 UKELES AND ASSOCIATES 1991
In our view, this utilization pattern is extraordinary. One way to think about this data is the following: The next time you visit a park during a week day look around and realize that one out of every three people you see will be back tomorrow and nearly 60% will be back at least one more time during the week. No other data perhaps points out the central role that parks play in the daily lives of many New Yorkers.
Exhibit Thirteen: Frequency Of Parks Use
FREQUENCY OF USE THIS PARK OTHER PARKS
EVERY DAY 30.9% 6.7%
SEVERAL TIMES A WEEK
28.0 14.3
ONCE A WEEK 18.1 14.3
OCCASIONALLY 21.9 41.1
NEVER NA 23.2
NO RESPONSE 1.1 1.8
N=1,086
Many of the studies of parks use asked questions about the type of activities that people pursue in parks. Our results are consistent with earlier studies by Ukeles and Associates and Meyersohn et. al. Exhibit Fourteen presents the responses to our survey question: What did you come to the park to do today? While many people came to do more than one thing, the pattern of response is clear: Most people come to the park to relax.

The activities cited most frequently included:
Sit/read/sun/watch (22%);
Walking and observing (22%);and;
Getting together with friends and family (17%).
A significant number are involved in active play. This included the following activities:
o Using a playground (13%) o Playing ball (12%) o Jogging (11%) o Riding a bike (7%)
Exhibit Fourteen: What Did You Come To The Park To Do Today?
N=1,085
4.0 CONCLUSION
The data presented here provides a clear picture of a public satisfied with the quality of their parks, but desiring improvements as well. There is room for improvement and there are differences in perceived quality across the city. Given the size, complexity and expense of New York's park system, we are impressed with the generally positive assessments of the system. The city government can take justifiable pride in these positive assessments, while working to bring additional improvements to the parks.
To us, the most striking finding is how frequently New Yorkers use and enjoy their parks. Over 30% of the people we interviewed in the city's parks are there every day and nearly 60% visit the park at least twice a week. As

parents, we know that our children and all of their friends visit parks every day. Without a well functioning park system the city would be virtually uninhabitable. This survey tells us that for many, if not most, of the city residents who rely on the park system, that system is an essential city service. It is a piece of vital urban infrastructure as important as those that deliver our other necessities, such as water supply and trash removal.
Parks tend to be undervalued in political and academic discourse as no more than responsible public indulgence. For the people who use the parks that could not be further from the truth. These are places where our citizens pause, reflect and relax. These are places where our children run, jump, bike and skate. They are places where our families and friends discover themselves and, as such, are at the heart of what makes New York City a great urban center with a very bright future.
Appendix A: Survey Instrument
PARKS INTERVIEW QUESTIONNAIRE
1.. NAME OF INTERVIEWER:_____________________2. NAME OF PARK: ____________________
3. SECTION OF PARK: PLAYGROUND ____ MEADOW___ BALLFIELD___ OTHER __________
4. DATE OF INTERVIEW__________________ 5. TIME _____________
6. CHARACTERISTICS OF THE PERSON YOU ARE INTERVIEWING:
A. GENDER: MALE _____ FEMALE ______
B. AGE: 16-21___ 22-30_____ 31-40_____ 41-60_____ OVER 60____
C. WHERE DO YOU LIVE: NEW YORK CITY?
YES____ IF YES: WHAT BOROUGH
BRKLYN ___ BRONX___ MAN___ QUEENS___ SI____
NO ____ IF NO: WHERE?
NYC SUBURBS___ OTHER USA ____ OUTSIDE USA_____
7. HOW OFTEN DO YOU GO TO THIS PARK?
EVERY DAY____ SEVERAL TIMES A WEEK ____

ABOUT ONCE A WEEK ____ OCCASIONALLY____
8. HOW OFTEN DO YOU GO TO OTHER PARKS?
EVERY DAY____ SEVERAL TIMES A WEEK____
ABOUT ONCE A WEEK____ OCCASIONALLY____ NEVER____
9. WHAT DID YOU COME TO THIS PARK TO DO TODAY?
USE PLAYGROUND ____ PLAY TENNIS ___
PLAY BALL ___ BIKE ___
JOG ___ ROLLERBLADE___
BE WITH FRIENDS/FAMILY___ WALK___
PICNIC___ SIT/READ/SUN/WATCH___
OTHER_______________________
10. HOW DO YOU RATE THE QUALITY OF THIS PARK'S FACILITIES FOR WHAT YOU ARE DOING HERE TODAY?
EXCELLENT___ GOOD___ FAIR___ POOR___
11. THINKING ABOUT THIS PARK, WHAT DO YOU LIKE THE MOST ABOUT IT?
12. WHAT DO YOU LIKE THE LEAST ABOUT IT?
13. WHAT SHOULD BE DONE TO IMPROVE THIS PARK?
14. WOULD YOU BE WILLING TO CONTRIBUTE YOUR TIME TO HELPING TO IMPROVE THIS PARK?

YES ____ NO____
(IF YES, ASK THE QUESTION BELOW)
HOW MUCH TIME WOULD YOU BE WILLING TO CONTRIBUTE?
2 HRS PER MONTH____ 3-6 HRS PER MONTH____ 7 OR MORE____
15. I AM GOING TO SHOW YOU SEVERAL FACTORS RELATING TO PARKS QUALITY. PLEASE TELL ME HOW IMPORTANT THESE ARE TO YOU.
FACTOR VERY SOMEWHAT NOT IMPORTANT IMPORTANT IMPORTANT
A. CLEANLINESS
B. SAFETY
C. PLAYGROUND AND SPORTS FACILITIES IN GOOD CONDITION
D. BATHROOMS OPEN AND CLEAN
E. WORKING DRINKING FOUNTAIN
F. PROGRAMS FOR YOUNG PEOPLE
G. OTHER FACTOR:
H.
I.
16. HOW IMPORTANT ARE PARKS TO YOU?
VERY IMPORTANT____ SOMEWHAT IMPORTANT____ NOT IMPORTANT___
17. ARE THERE ANY OTHER COMMENTS YOU WOULD LIKE TO MAKE?
Appendix B: Representativeness of Sample

To more fully understand the public's use of and views about New York City's parks, we conducted a survey of over 1000 parks users. The results of this survey form the foundation for our analysis and lead to the conclusions we have reached in this report. Since the survey plays such an important role, it is important to demonstrate that the sample of respondents we are relying on is actually representative of New York City. This section discusses the survey's representativeness by detailing the statistical methods used to select the sample, and by comparing the sample to data about New York City as a whole.
The survey was conducted in 19 of the 479 parks that comprise the City's parks system. In each of these 19 parks, we surveyed approximately 50 individuals. Respondents were at least 16 years of age or older, and were approached in one of the 19 parks. The more than 1000 people who responded to our surveys are meant to represent the entire population of New York City parks users. The following analysis indicates that, on multiple criteria, the individuals and regions sampled are representative of the City. As such, we can comfortably accept the conclusions of this study as representing the true population of parks users.
A totally random selection process would be the ideal way to select respondents for this study. A random selection process is the foundation for the use of inferential statistics--of taking a sample and using it to say something meaningful about the population. Yet such a random process requires that we first obtain a comprehensive list of all parks users, an impossible task since it is a constantly changing census created daily by tens of thousands of individual choices.
Therefore, we had to use other statistical techniques to arrive at a sample which is still representative of the greater population. Although these techniques do not consistently use random sampling, they nonetheless result in a sample upon which it is valid to employ inferential techniques.
We used three criteria to judge the representativeness of our sample: geographic diversity of the parks selected, average income levels of the neighborhoods surrounding the selected parks, and the racial distribution of these neighborhoods.
o
The geographic diversity of the parks system was built in to the selection process. We included parks from each of the five boroughs of New York City. Within each borough, we were careful not to concentrate the selected parks in one area at the exclusion of other areas, seeking as representative a coverage of the neighborhoods of the borough as possible.

The variety of neighborhoods' income levels and racial compositions included in our sample follows from the geographic diversity we accomplished. New York is a city of different groups spread throughout many communities. By casting our net as wide as possible, we sought to include a representative cross-section of the metropolis as a whole.
The initial stage of our sampling process is called stratified sampling. A stratified sample dissects the population into distinct categories, or strata, and then selects a minimum number of representatives from each strata. The advantage of a stratified sample is that it assures a minimum representation from each segment of the population. If we were to use simple random sampling instead, the random selection of individuals might not give us enough respondents from any one strata. Without enough respondents from a certain strata, we would not be able to interpret the results and achieve a meaningful analysis of our survey. The stratified sampling process assured that we would have enough respondents from each strata.
In making our selections, we wanted to achieve a representative cross-section of city parks. There were several possible factors to use to make our cross-section accurate. For example, the cross-section could be based on income, on geography, or on racial composition. To best represent New York City, our sample of parks was constructed to be as representative as possible on all three of these cross-sections.
The geographic cross-section was the easiest to approximate. Each of New York City's five boroughs is considered a stratum. We then selected parks from each borough, ensuring that they were not concentrated in just one section of the borough. Another element which factored into the geographic selection of parks was the size of the parks themselves. We sought to select a variety of park sizes, with small, medium, and large parks all represented in our sample.
The geographic distribution of parks helped ensure a representative sample according to the other two factors as well. In a city with such a wide range of income levels, the geographic spread of the parks naturally influenced the income spread in our sample. To verify the representativeness of our sample along income lines, we identified average per capita income as the category of interest. Within the income variable,

we then identified strata, or subcategories, based on levels of income. We wanted the parks in our sample to come from neighborhoods with a range of income levels, and we therefore identified strata according to very low, low, moderate, and middle to high income levels.
Based on available literature, these categories were given numeric ranges based on their distance from the median income level for New York City.(7)
People with incomes of less than half the regional median were considered very low income. Those with incomes between 50% and 80% of the regional median were classified as low income. Individuals with incomes between 80% and 120% of the regional median were considered as moderate income. Finally, those with incomes greater than 120% of the regional median were considered middle to high income individuals.
This categorization based on income was done at the park level, rather than at the individual level. Individual respondents to the survey were not asked about their income. Instead, each park was classified according to the income levels of the neighborhoods around the park. This method is not problematic when analyzing data about the parks themselves, but it would be incorrect to interpret the income data at the level of individual respondents. Altogether, the lower and low income categories combined have seven parks in the sample, while six parks are in the moderate income category, and six are in the middle to high income category.
We also wanted to ensure proper representation of New York City's many races and ethnic groups. Although not explicitly a "strata" in this survey, the consideration of this element falls most easily within the concept of a stratified sample. Just as it is important to have accurate income diversity, it is important that our sample have accurate racial diversity. Later, we will look more closely at the distribution of racial groups in our sample and compare it to the same distribution in the City overall. For now, it is enough to say that the neighborhoods around the selected parks should have roughly the same racial distribution as the City itself.
A stratified sample has additional advantageous aspects. A significant feature of a stratified sample is that we can sample from within the strata disproportionately. For example, we have surveyed from a variety of parks, ranging from very

small neighborhood parks to very large "flagship" parks such as Central Park in Manhattan and Prospect Park in Brooklyn. Despite the size differentials, in both acreage and in numbers of people using the parks, we interviewed approximately the same number of people for each park. Since we are using a stratified sample, this disproportionate representation does not create a problem. In fact, the numbers of people using the parks are not relevant to the sample size for each park. The sample size of approximately 50 is about the same for each park, so we can easily compare the results from any two parks and still have a statistically meaningful result.
A second method of sampling employed in this survey is called cluster sampling. In this approach, a target population is identified. Within that target, individual clusters are selected. And within each cluster, a random sample of respondents is surveyed. In our survey, the target populations are the strata of parks, while each park is essentially one cluster. For example, there are many parks in moderate income neighborhoods, but we could not survey users of all of them. Therefore, within the moderate income strata, we selected six parks in which we would focus our surveying resources. Finally, within the six moderate income parks selected, a random sample of approximately 50 park users was taken for each park. This clustering takes place in the context of a stratified sample, these 50 surveys represent not just the park that was selected. They also represent all the other moderate income parks, not just the parks we surveyed.
Each selected cluster represents others that were not selected, so an individual cluster should be as internally heterogeneous as possible. We wanted to be sure to sample a wide range of people within the cluster, because they will be speaking for all the other clusters (or parks) that were not included in the sample. We achieved this objective by taking a random sample of people within each park. The interviewers were trained in methods to achieve as random a sample as possible.
A negative aspect of the cluster sampling approach is that there is a loss of precision in the estimators. However, this loss in precision is offset by gains in the cost-effectiveness of the survey. It is much more economical to select a manageable number of parks and concentrate our efforts on those parks than it is to attempt to survey each and every park in New York City. The advantage of cluster sampling is that the surveying process costs less, both in terms of time and of

money, while still providing the basis for a meaningful analysis.
While this economical approach is useful, it is advantageous to include as many clusters as possible in the sample. The more clusters we include, the more precise our estimates become. There is a limit to the number of clusters to include, as the total sample size is already determined. Therefore, we set the number of surveys per park at approximately 50, a number that balances the need for precision with the need for economy. In reality, the number of surveys per park that we used ranged from 52 to 66. With at least 50 surveys for each park, we are able to look at each park individually and discuss the results for that park with an acceptable degree of statistical certainty. If we had decreased the number of surveys per park in order to increase the number of parks in our sample, it would have become difficult to statistically analyze the survey results on a park by park basis. Together, the combination of stratified sampling and cluster sampling gave us maximum precision while keeping the study economically feasible.
With this explanation of the stratified and cluster sampling approaches we have used in the survey, it is finally time to answer the most important question of all: is our sample representative of New York City and its parks? We are primarily focused on specifically three criteria: income, geography, and race. On geographic diversity, the 19 parks we surveyed represent all five of New York's boroughs. The park sizes range from just a few acres to Pelham Bay Park, with 2,764 acres. Some parks are located in the heart of a neighborhood, while others stretch out in a thin line along the waterfront. Overall, the geographic diversity of the parks in our sample encompass a broad range of park types, assuring a representative sample along this first line of analysis.
For the two other categories of interest, racial distribution and income levels, we had to consider more detailed numerical data. The analysis begins by looking at each park as an individual unit. We then identified the "catchment area" of the park--the area surrounding the park in which the bulk of the park's users live. With an appropriately-defined catchment area, we could then determine the composition of the catchment area for each park. The New York City Department of City Planning defines a park's catchment area as the census tracts predominantly contained within a one-half mile radius beyond the park's perimeter. We adopted the same definition
of a catchment area for this study, and then obtained the appropriate data from the 1990 U.S. census (the most recent census currently on record).
In the second category, racial distribution, our sample demonstrates a remarkably well-balanced representation of the City. According to the 1990 census, New York's population was 52.3% white, 28.8% black, 0.3% American Indian, Eskimo, or Aleut, 7.0% Pacific Islander, and 11.6% other. The representation in our sample never strays more than one or two percentage points away from these targets. Overall, the neighborhoods that make up our sample are 54.4% white, 27.3% black, 0.3% American Indian, Eskimo, or Aleut, 5.4% Pacific Islander, and 12.7% other.
The only concern for the representativeness of our sample arises when we look at the income data for neighborhoods surrounding the selected parks. The New York City average per capita income was $16,281.00 in 1989, based on 1990 census data. However, the catchment areas surrounding the parks in our survey have an average per capita income of $21,495.41, a number that is 32% higher than the actual City average. However, looking at neighborhood income levels for all of New York City reveals that by far the highest income neighborhoods are included within the catchment area of Central Park. If we exclude Central Park from the calculations, then our sample's average per capita income falls to $16,397.54, less than one percent higher than the actual City average. (The average per capita income of the neighborhoods surrounding Central Park is $41,701.66, even including the low income neighborhoods at its Northern borders. This strongly indicates that Central Park is an anomaly in the City's parks system.)
If we exclude Central Park and then reconsider the other criteria, our sample remains representative. The racial distribution changes only slightly: the percentage of whites in the sample falls to just below the City average, the percentage of blacks rises to just above the City average, and the representation of other races rises marginally. Although the proportions change, they are generally within two percentage points of the actual City average.
Thus, it is not unreasonable to exclude Central Park from our analysis. On the basis of racial composition, it makes only a minor difference in the weightings of different populations,

while on the basis of per capita income, it brings the sample much closer in line with the actual City average. Furthermore, it is not unreasonable to see Central Park as a park unlike any other in New York. It is the most prominent of all of the City's parks, with a catchment area that conceivably reaches around the world. Because our survey is divided into strata and clusters of individual parks, it is feasible to exclude Central Park for analysis of the parks system overall. At the same time, we can still use the data to discuss Central Park by itself and to compare it to other parks in the system as well.
It is also important to consider the several possible sources of bias in our data. While the survey was performed with great attention to detail and concern for accuracy, we should be aware of the limitations that necessarily exist in any survey conducted with a finite amount of resources.
First, the primary basis for determining the representativeness of our sample has been a comparison of the parks in our sample to the population of New York City. To the extent that all parks users are New York City residents, and to the extent that all residents are potential parks users, this basis is justified. We recognize that patrons of the City's parks do come from around the world, not just from around the block. Our study indicates, however, that the overwhelming majority of parks users are New Yorkers. Thus, a sample of parks that accurately represents New York City arguably also represents the New York City parks system.
A second concern is the inability to precisely define the catchment area of a given park. The Department of City Planning's starting point for defining a park's catchment area, the mile radius around the park's perimeter, corresponds roughly to a walk of 10 or 15 minutes. In some cases, people will walk much farther than that to reach a park, and in other cases geographic barriers may make it impossible to reach a park from a certain direction. Where possible, the catchment areas have been modified to reflect these realities, but they remain only estimates of the true catchment areas.
A third issue arises from the process of selecting respondents in a given park. The interviewers were trained specifically for this survey, and were instructed on appropriate selection techniques to yield a representative sample of park users. For example, they were told to interview only every third person eligible for the survey, and they were advised to interview not
just those park users who were easily accessible (sitting on park benches or in meadows), but also to seek more active users (in-line skaters and bicycle riders, for example, who had stopped for a quick break.) These techniques helped ensure a more representative sample, but the sampling process remained susceptible to inherent biases such as the interviewer's selections, the time and day of the survey, and the willingness of selected individuals to answer the survey questions.
Overall, it is important to recognize these potential weaknesses, but they do not invalidate our findings. Great care has been taken to ensure that the sample of parks is representative, such that these minor drawbacks should not detract from the overall usefulness of the results. Therefore, on the basis of these findings, we accept our sample as representative, and are comfortable using the data to describe the current status of New York City's parks system.
Appendix C Park by Park Analysis(8)
1. 0Interview with Ian Shapiro, Chief of Staff, DPR 9/19/96
2. Comptroller's Reports for FY 1992, p.98 &156, and FY 1996, p.96 & 150.
3. 0Charles Brecher and Dean Michael Mead, Managing the Department of Parks and Recreation in a Period of Fiscal Stress, Citizens Budget Commission, 1991.
4. 0 Ibid.
5. 0New Yorkers Say that Upgrading Parks is Essential to the Quality of Life." The Commonwealth Fund, January, 1994.
6. 0 Charles Brecher and Dean Michael Mead, Managing the Department of Parks and Recreation in a Period of Fiscal Stress, Citizens Budget Commission, New York. 1991.
7.
0 Dowell Myers, Analysis with Local Census Data: Portraits of Change. (New York: Academic Press, Inc.) 1992.
8. In this section "Misc. Other", while sometimes a large category, is made up of numerous different responses given by less then five respondents.

"People" is a category that includes complaints of overcrowding, harassment and other anti-social behavior.
Back to Personal Homepage
SIPA Directory
Columbia University Home Page SIPA Web Manager