how mining works - new.smebook.com
TRANSCRIPT

HOW MINING WORKS
BY W. SCOTT DUNBAR
PUBLISHED BY THE
SOCIETY FOR MINING, METALLURGY & EXPLORATION
!SME_HowMiningWorks_TitlePg_F2.indd 1 10/22/15 7:02 AM

Society for Mining, Metallurgy & Exploration (SME)12999 E. Adam Aircraft CircleEnglewood, Colorado, USA 80112(303) 948‑4200 / (800) 763‑3132www.smenet.org
SME advances the worldwide mining and minerals community through information exchange and professional development. SME is the world’s largest association of mining and minerals professionals.
Copyright © 2016 Society for Mining, Metallurgy & Exploration Inc.Electronic edition published 2106.
All Rights Reserved. Printed in the United States of America.
Information contained in this work has been obtained by SME from sources believed to be reliable. However, neither SME nor its authors and editors guarantee the accuracy or complete‑ness of any information published herein, and neither SME nor its authors and editors shall be responsible for any errors, omissions, or damages arising out of use of this information. This work is published with the understanding that SME and its authors and editors are supplying information but are not attempting to render engineering or other professional services. Any statement or views presented herein are those of individual authors and editors and are not necessarily those of SME. The mention of trade names for commercial products does not imply the approval or endorsement of SME.
No part of this publication may be reproduced, stored in a retrieval system, or transmitted in any form or by any means, electronic, mechanical, photocopying, recording, or otherwise, with‑out the prior written permission of the publisher.
ISBN 978‑0‑87335‑399‑1Ebook 978‑0‑87335‑411‑0
Library of Congress Cataloging-in-Publication DataDunbar, W. Scott, 1949‑ author. How mining works / by W. Scott Dunbar. pages cm Includes bibliographical references and index. ISBN 978‑0‑87335‑399‑1 (print) ‑‑ ISBN 978‑0‑87335‑411‑0 (ebook)1. Mines and mineral resources‑‑Popular works. 2. Mining engineering‑‑Popular works. 3. Mineral industries‑‑Popular works. I. Society for Mining, Metallurgy, and Exploration (U.S.) II. Title. TN147.D86 2015 622‑‑dc23 2015025722

iii
Contents
Preface . . . . . . . . . . . . . . . . . . . . . . . . . . . . . . . . . . . . . . . . . . . . . . . . . . . . . . . . . . . v
1 The Where, What, and How . . . . . . . . . . . . . . . . . . . . . . . . . . . . . . . . . . . . . . . . 1
The Structure of Planet Earth . . . . . . . . . . . . . . . . . . . . . . . . . . . . . . . . . . . . . . . . 1
Earth History . . . . . . . . . . . . . . . . . . . . . . . . . . . . . . . . . . . . . . . . . . . . . . . . . . . . 2
Definitions . . . . . . . . . . . . . . . . . . . . . . . . . . . . . . . . . . . . . . . . . . . . . . . . . . . . . . 3
Concentrations of Metals . . . . . . . . . . . . . . . . . . . . . . . . . . . . . . . . . . . . . . . . . . 13
Ore-Forming Processes . . . . . . . . . . . . . . . . . . . . . . . . . . . . . . . . . . . . . . . . . . . 15
Mine Exploration . . . . . . . . . . . . . . . . . . . . . . . . . . . . . . . . . . . . . . . . . . . . . . . . 26
2 Mining Methods . . . . . . . . . . . . . . . . . . . . . . . . . . . . . . . . . . . . . . . . . . . . . . . . 37
Surface Mining . . . . . . . . . . . . . . . . . . . . . . . . . . . . . . . . . . . . . . . . . . . . . . . . . . 37
Underground Mining . . . . . . . . . . . . . . . . . . . . . . . . . . . . . . . . . . . . . . . . . . . . . 43
Mining Operations and Equipment . . . . . . . . . . . . . . . . . . . . . . . . . . . . . . . . . . 53
3 Mineral Processing andMetalRefining . . . . . . . . . . . . . . . . . . . . . . . . . . . . . . . . . . . . . . . . . . . . . . 67
Comminution . . . . . . . . . . . . . . . . . . . . . . . . . . . . . . . . . . . . . . . . . . . . . . . . . . . 67
Flotation . . . . . . . . . . . . . . . . . . . . . . . . . . . . . . . . . . . . . . . . . . . . . . . . . . . . . . . 77
Smelting and Refining . . . . . . . . . . . . . . . . . . . . . . . . . . . . . . . . . . . . . . . . . . . . 84
Hydrometallurgy . . . . . . . . . . . . . . . . . . . . . . . . . . . . . . . . . . . . . . . . . . . . . . . . 89
Biohydrometallurgy . . . . . . . . . . . . . . . . . . . . . . . . . . . . . . . . . . . . . . . . . . . . . 103
Physical Separation Methods . . . . . . . . . . . . . . . . . . . . . . . . . . . . . . . . . . . . . . 106
4 Nonmetallic Minerals . . . . . . . . . . . . . . . . . . . . . . . . . . . . . . . . . . . . . . . . . . .113
Coal . . . . . . . . . . . . . . . . . . . . . . . . . . . . . . . . . . . . . . . . . . . . . . . . . . . . . . . . . 113
Diamonds . . . . . . . . . . . . . . . . . . . . . . . . . . . . . . . . . . . . . . . . . . . . . . . . . . . . 119
Aggregates . . . . . . . . . . . . . . . . . . . . . . . . . . . . . . . . . . . . . . . . . . . . . . . . . . . 124
5 Mine Waste Management . . . . . . . . . . . . . . . . . . . . . . . . . . . . . . . . . . . . . . .129
Mine Waste Streams and Disposal . . . . . . . . . . . . . . . . . . . . . . . . . . . . . . . . . 130
Mine Waste Treatment Methods . . . . . . . . . . . . . . . . . . . . . . . . . . . . . . . . . . . 144

iv
Contents
6 Mining, People, and the Environment . . . . . . . . . . . . . . . . . . . . . . . . . . . . .151
Human Resources . . . . . . . . . . . . . . . . . . . . . . . . . . . . . . . . . . . . . . . . . . . . . . 151
Safety . . . . . . . . . . . . . . . . . . . . . . . . . . . . . . . . . . . . . . . . . . . . . . . . . . . . . . . . 152
Health . . . . . . . . . . . . . . . . . . . . . . . . . . . . . . . . . . . . . . . . . . . . . . . . . . . . . . . 156
Mining and Communities . . . . . . . . . . . . . . . . . . . . . . . . . . . . . . . . . . . . . . . . 158
Sustainable Mining? . . . . . . . . . . . . . . . . . . . . . . . . . . . . . . . . . . . . . . . . . . . . . 160
7 Mining and Money . . . . . . . . . . . . . . . . . . . . . . . . . . . . . . . . . . . . . . . . . . . . .165
Mineral Products . . . . . . . . . . . . . . . . . . . . . . . . . . . . . . . . . . . . . . . . . . . . . . . 166
Metal Prices . . . . . . . . . . . . . . . . . . . . . . . . . . . . . . . . . . . . . . . . . . . . . . . . . . . 171
Resources and Reserves . . . . . . . . . . . . . . . . . . . . . . . . . . . . . . . . . . . . . . . . . 175
8 A Future of Mining . . . . . . . . . . . . . . . . . . . . . . . . . . . . . . . . . . . . . . . . . . . . .185
Drivers of Innovation in Mining . . . . . . . . . . . . . . . . . . . . . . . . . . . . . . . . . . . . 185
Paths for Innovation . . . . . . . . . . . . . . . . . . . . . . . . . . . . . . . . . . . . . . . . . . . . . 188
Biotechnology to the Rescue? . . . . . . . . . . . . . . . . . . . . . . . . . . . . . . . . . . . . . 191
Can the Industry “Grow Its Own”? . . . . . . . . . . . . . . . . . . . . . . . . . . . . . . . . . 195
In Extremis . . . . . . . . . . . . . . . . . . . . . . . . . . . . . . . . . . . . . . . . . . . . . . . . . . . . 198
Appendix A: All the Chemistry You Need to Know . . . . . . . . . . . . . . . . . . . . .201
Atoms and Ions . . . . . . . . . . . . . . . . . . . . . . . . . . . . . . . . . . . . . . . . . . . . . . . . 201
Oxidation and Reduction . . . . . . . . . . . . . . . . . . . . . . . . . . . . . . . . . . . . . . . . . 203
The Main Message . . . . . . . . . . . . . . . . . . . . . . . . . . . . . . . . . . . . . . . . . . . . . 204
Kitchen Chemistry . . . . . . . . . . . . . . . . . . . . . . . . . . . . . . . . . . . . . . . . . . . . . . 205
Acid and Alkali Solutions . . . . . . . . . . . . . . . . . . . . . . . . . . . . . . . . . . . . . . . . . 206
Index . . . . . . . . . . . . . . . . . . . . . . . . . . . . . . . . . . . . . . . . . . . . . . . . . . . . . . . . . . .207

v
Preface
Mining is interesting. It is a collection of processes that increase the very low con‑centrations of minerals and metals in the earth to levels that can be used in every‑day life. In most cases, the increase in concentration is several orders of magnitude. The fact that it is physically, chemically, and economically feasible to do this is quite amazing. For some metals, the concentration process is like combing through a field of haystacks to find one needle every day for 10 years or more.
What is also interesting about mining is the different kinds of professionals required to make it happen: geologists, almost every kind of engineer or scientist, investment bankers, accountants, economists, health and safety specialists, community relations experts, and others. Furthermore, mining has economic effects at both global and local scales.
The intent of this book is to provide an understanding of the collection of pro‑cesses, but to do so in a manner that makes the reader want to know more. The only requirement is an interest in science and technology. Very large and very small numbers are used to describe concepts. Some high school chemistry is used to describe processes, but it is not essential for understanding. Appendix A describes all the chemical concepts used.
The book consists of eight chapters. Chapter 1 provides an explanation of how mineral deposits are formed and how they are found. Chapter 2 describes min‑ing methods, the systems and machines used to extract rock containing minerals of interest (called ore) from the earth. Chapter 3 describes a few of the methods used to process the ore and produce metals. Much of mining refers to the produc‑tion of metals, but nonmetallic minerals are a huge part of the industry. Chapter 4 discusses the particular examples of coal, diamonds, and gravel (aggregates). In addition to minerals and metals, mining and processing ore produce large amounts of waste products that must be managed, often for an indefinite period. The sci‑ence and technologies applied to this important part of mining are the topics of Chapter 5. Mining also involves people, the communities in which they live, and the government of the country in which the mine is located. As described in Chapter 6, the related issues are important, interesting, and sometimes challenging.
vi
Preface
Chapter 7 describes the mechanisms for establishing prices of metals and miner‑als and discusses the legal definition of ore. Finally, Chapter 8 presents some ideas about mining in the future.
The majority of the images in the book were generously provided by many compa‑nies and individuals. Pictures in a book like this are worth far more than a thousand words, and the attributions under the figures do not begin to express my gratitude and appreciation. Many thanks are extended to those who helped illustrate the many topics. My colleagues Jocelyn Fraser, Mike Hitch, Bern Klein, Rick Lawrence, Allan Moss, and Dirk van Zyl helped with advice and ideas on content, but, of course, any errors are solely my responsibility.
I was encouraged to write this book by Jane Olivier, the books manager at SME, and I am so glad she asked. Diane Serafin edited the manuscript and kept me orga‑nized and her head cool despite delays and some software glitches.
The origins of this book lie with Steve Ralbovsky, a former partner at PricewaterhouseCoopers in Phoenix, Arizona, who in 1999 asked me to develop presentations that would explain mining to non‑miners attending the PWC Annual School of Mines. For several years Steve twisted the dials and knobs to set the tone and level of the content. The presentations were mostly pictures, but over time I inserted many hidden slides with notes and explanations of the pictures. This was the starting point for this book. Thank you, Steve; it was fun.
In 2007, Simon Houlding of Edumine in Vancouver asked me to make a webcast from the slides, forcing me to learn to speak into a microphone and look into a camera at the same time, pretending that an audience was there. Simon then asked for an online course and quizzes. The information on the hidden slides helped, but good questions that don’t frighten the learner are hard to compose. The staff at Edumine also encouraged me to keep the material up to date and to do a Spanish version of the webcast (No puedo. Si, se puede.) Challenges are good. Thank you Simon, Jennifer, Mariana, and Sandra.
Finally, thanks go to my wife Petra, who provided honest feedback, and to my sons and daughters for their comments, ideas, and inspiration.
1
1CHAPTER
The Where, What, and How
Have you ever wondered why mines are located where they are?
The ore deposits where mines are situated were formed millions of years ago in particular places by a number of different processes. Most of these pro-cesses continue to occur in the earth, but it can take millions of years for an ore deposit to form.
The material in this chapter will enable you to understand where and how ore deposits form and how geologists go about finding them. It will also define some common terms and concepts used in geology, mining, and mineral processing.
Let’s start with what planet Earth looks like. It is the source of all the things we mine.
THE STRUCTURE OF PLANET EARTH
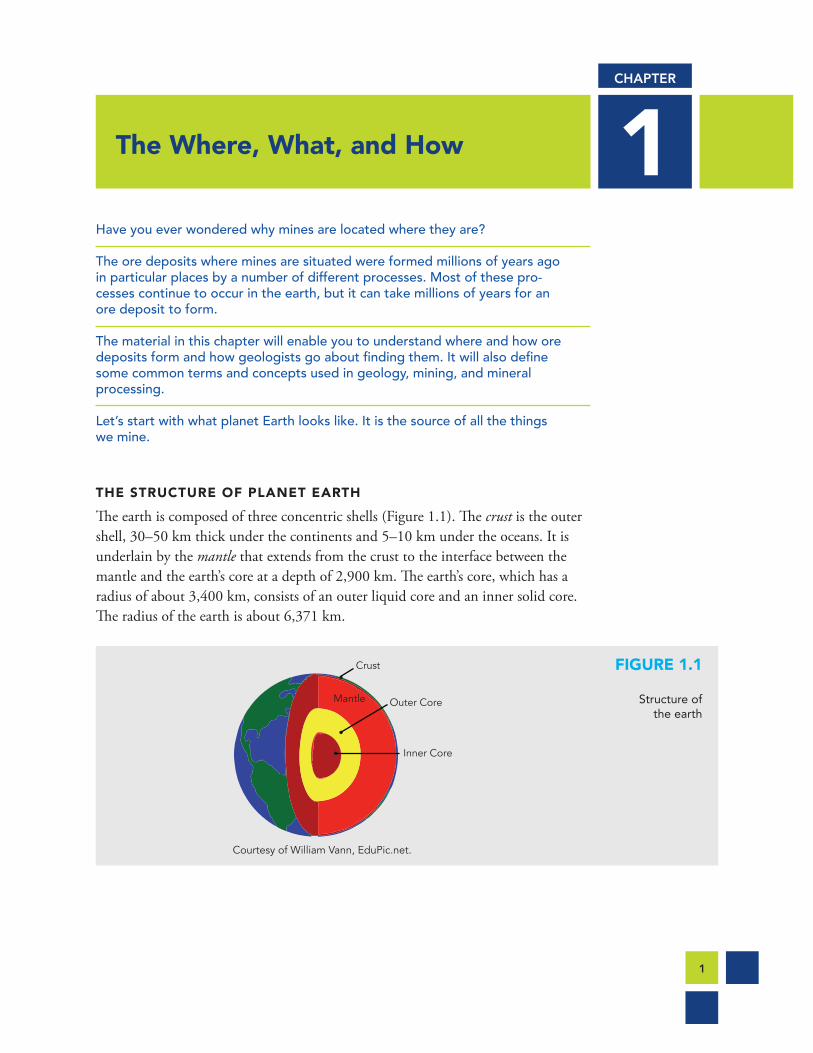
The earth is composed of three concentric shells (Figure 1.1). The crust is the outer shell, 30–50 km thick under the continents and 5–10 km under the oceans. It is underlain by the mantle that extends from the crust to the interface between the mantle and the earth’s core at a depth of 2,900 km. The earth’s core, which has a radius of about 3,400 km, consists of an outer liquid core and an inner solid core. The radius of the earth is about 6,371 km.
Crust
Mantle
Inner Core
Outer Core
Courtesy of William Vann, EduPic.net.
FIGURE 1.1
Structure of the earth

2
Chapter 1
The most interesting aspect of the geological processes involved in forming ore deposits is their scale, both in space and time. The formation of an ore deposit is essentially a concentration process that occurs within the crust and, in some cases, the upper mantle. However, these processes are fueled by heat generated deep within the earth’s core and, in this sense, they are planetary in scale. The result is higher than average concentrations of minerals and metals at depths that are relatively shallow. The earth is a big planet. We have mined only as deep as 3–4 km, barely a pinprick.
EARTH HISTORY
The earth is very old—about 4.6 billion years old. Table 1.1 shows Earth’s history from the time it formed until the present. There are names for particular eons, eras, and periods of Earth’s history. The origins of these names is often interesting. For example, the Ordovician period was named after a Celtic tribe called the Ordovices in order to resolve a dispute between geologists who were assigning ages to rock formations in northern Wales as either Cambrian, an earlier period, or Silurian, a later period.
The nickel deposits near Sudbury, Ontario, are believed to have been formed about 2 billion years ago or 2,000 MYBP (million years before present). Oil deposits in western North America formed between 360 and 400 MYBP, coal deposits formed
TABLE 1.1 Earth’s history
Eon Era Period MYBP* Major Events
Phanerozoic
CenozoicQuaternary 0–1.6 Mastodons and humanoids
Tertiary 1.6–66 Dinosaur extinction 66 MYBP
Mesozoic
Cretaceous 66–144 Ore deposits in western North America and South America
Jurassic 144–208 Coal deposits in British Columbia and western United States
Triassic 208–245 Dinosaurs appeared 230 MYBP
Paleozoic
Permian 245–286
Pennsylvanian 286–320 Coal deposits in eastern United States
Mississippian 320–360
Devonian 360–408 Oil deposits form in western North America
Silurian 408–438
Ordovician 438–505 Trilobites appeared 500 MYBP
Cambrian 505–543
Proterozoic 543–2,500 Sudbury (Ontario) nickel deposits
Archean 2,500–4,600
*MYBP = million years before present.

3
The Where, What, and How
between 150 and 200 MYBP, and several metallic ore deposits in North and South America were formed between 60 and 150 MYBP. Dinosaurs appeared about 230 MYBP and their extinction occurred about 66 MYBP, possibly due to the effects of a large meteor striking the earth. The evolution of humans is believed to have begun about 1.6 MYBP.
From Table 1.1 it is evident that geological processes are slow and span hundreds of millions of years. The processes of metal concentration are equally slow and might occur over a few hundred thousand to million years. An equally important concept is that the geological processes that occurred millions of years ago can also occur in the present. Hence the expression:
The present is the key to the past.
What this means is that the geological processes seen today likely occurred in the past. The climate might have been different, but the earth continued to do what it has always done. Consistency of geological processes over time is a useful concept in mine exploration.
DEFINITIONS
Keep thinking about big spatial scale and very long times as you read through these definitions of terms that will be used often in this book.
Chemical ElementsChemical elements are a pure substance consisting of one type of atom. They are the building blocks of matter. Some examples are given here:
Al – aluminum Mo – molybdenum Ag – silver O – oxygen Au – gold Pb – lead Cu – copper S – sulfur Fe – iron Si – silicon H – hydrogen Zn – zinc
Some of the symbols are simply the first letter of the name of the element. Others are derived from the Latin word for the element: Argentum, Aurum, Cuprum, Ferrum, Plumbum.
Figure 1.2 shows samples of particular elements. Native elements are those found in nature, but these are relatively rare and they are not pure. Elements of economic interest are often combined with other elements.

4
Chapter 1
CompoundsElements combine to form compounds. A compound contains at least two different elements. Some examples are given in Table 1.2. The numerical subscripts in the chemical formulas denote the number of atoms in the compound. If there is no subscript, then only one atom is present.
MineralsThe definition of a mineral is
A solid, naturally occurring, inorganic compound having a definite chemical composition (of elements) that may vary within limits.
FIGURE 1.2 Samples of copper, silicon, and gold
Native copper nugget about 2.5 × 3.5 cm in size. Copper was the first element used by humans. It is combined with tin to form bronze and with zinc to form brass. Copper is the second best conductor of electricity, but it does corrode if exposed to moisture. (The best conductor is silver.)
Pure silicon. Silicon is one of the most abundant elements in the earth. It combines with oxygen to form quartz, a component of sand that is used to make glass. Since the mid-20th century silicon has been used in electronic devices.
Pure gold leaf about 1 cm long. Gold is very rare, which makes it valuable. It is also inert and malleable, which makes it useful for jewelry. Gold is the third best conductor of electricity behind silver and copper, but its inertness makes it useful in applications where corrosion would cause a problem.
Photos courtesy of Images-of-Elements.com 2014, CC BY 3.0.
TABLE 1.2 Examples of compounds
CompoundChemical Formula
Salt: sodium (Na) and chlorine (Cl) NaCl
Silver chloride: silver and chlorine AgCl2
Vinegar (acetic acid): a bitter combination of carbon (C), oxygen, and hydrogen CH3CO2H
Sulfuric acid: 2 hydrogen, 1 sulfur, and 4 oxygen atoms H2SO4
Copper sulfate: 1 copper, 1 sulfur, and 4 oxygen atoms CuSO4

5
The Where, What, and How
Some examples of minerals are shown in Figure 1.3.
The following list describes other minerals of interest:
• Hematite (Fe2O3), an iron oxide, is the main source of iron. Hematite usually precipitates from standing water collecting in layers. It is typically dark colored, but weathering processes can cause it to become hydrated to form an iron hydroxide, essentially rust, that is responsible for the red color of many soils.
• Sphalerite (ZnS), which is zinc sulfide, and galena (PbS), which is lead sul-fide, usually occur together in lead-zinc or lead-zinc-silver deposits.
• Pyrrhotite (Fe1–xS, where 0 ≤ x ≤ 0.2) is a magnetic iron sulfide with a strange chemical formula that seems to suggest partial atoms. However, this is merely
ARE YOU A BIT CONFUSED? WHAT IS A MOLECULE?A molecule is formed when two or more atoms join together chemically. Compounds form when two or more different atoms join together. All compounds are molecules, but not all molecules are compounds. Molecular hydrogen (H2), molecular oxygen (O2), and molecular nitrogen (N2) are not compounds because each is composed of a single element. Water (H2O), carbon dioxide (CO2), and methane (CH4) are compounds because each is made from more than one element.
Rose quartz, SiO2. The color, which may vary from pale pink to rose red, is due to trace amounts of metals such as iron, titanium, or aluminum. The color may be changed by irradiating the crystal with ionizing radiation. (Photo courtesy of Wikimedia Commons.)
FIGURE 1.3
Hand-size samples
of minerals
Pyrite, FeS2, is an iron sulfide sometimes known as “fool’s gold” because it develops a sheen on its surface that looks like gold. The giveaway is the cubic crystals. Pyrite is the most common sulfide mineral. (Photo courtesy of Jonathan Zander 2007, CC BY-SA 3.0.)
Chalcopyrite, CuFeS2. Except for the beak and eyes, this carving of an owl is made of chalcopyrite, a common copper sulfide found in most copper mines. The owl is about 6 cm high and is standing on quartz crystals. (Photo courtesy of Adrian Pingstone 2004, CC BY-SA 3.0.)

6
Chapter 1
a convenient way to show a variable amount of iron. The end member of the series troilite FeS (x = 0) is nonmagnetic.
• The feldspar minerals—KAlSi3O8, NaAlSi3O8, CaAl2Si2O8—are silicates that comprise 60% of the earth’s crust, a feature that distinguishes the crust from the mantle, which has fewer silicate minerals.
RockA rock is a solid assemblage of minerals. A soil is also an assemblage of minerals but it is not solid. Soils are produced by weathering of rock, a part of the rock cycle that will be discussed later. There are many types of rocks, which will also be discussed later in context.
Ore DepositAn ore deposit is a solid, naturally occurring mineral concentration useable as mined or from which one or more valuable constituents may be economically recovered.
The implications are that current technology and economic conditions make economic recovery possible. However, time is an important consideration. Technology can
MORE ABOUT MINERALSThe definition of minerals earlier in this chapter excludes substances formed by biogeochemical processes. However, there is a close link between the metabolic activities of microorganisms and mineral formation. In fact, microorganisms are capable of forming minerals and particular crystal structures that cannot be formed inorganically. Based on this, Skinner (2005) made the following expanded definition of a mineral:
An element or compound, amorphous or crystalline, formed through biogeochemical processes
where the prefix bio reflects the role of living systems in mineral formation. Skinner views all solids as potential minerals.
Minerals have been traditionally classified according to their chemical and crystal structure. For example, there are the silicates and the sulfides, the cubic and tetragonal crystal shapes, and so forth. This is a static classification system. Robert Hazen and John Ferry (2010) have shown that minerals evolved in a series of three eras beginning with an initial era of planetary accretion more than 4,550 MYBP when there were only about 60 minerals; through a second era of crust and mantle reworking to 2,500 MYBP, after which there were 1,500 minerals; and then into the current era in which living systems catalyze many mineral-forming reactions, resulting in the almost 4,400 mineral species known today. It is a very dynamic system that is ongoing.

7
The Where, What, and How
turn an uneconomic deposit into an economic one. However, it can take some time for technology to develop into a practical form. Also, it is long-term economic conditions that govern whether a mine goes into operation and stays in operation. Short-term economic disruptions, such as the crisis in 2008, do not have much effect on mining operations.
This is not a legal definition of ore. The legal definition involves the issue of having the technical and legal ability to extract something of value from it. That aspect, and particularly the issue of how an ore deposit is reported to shareholders of a publicly traded mining company, are discussed in Chapter 7.
Base Metal and Precious MetalA base metal is a metal basic to industry and society such as iron, copper, lead, zinc, and aluminum. A precious metal is a rare, naturally occurring metallic element of high economic value such as gold and silver and the platinum group metals: pal-ladium, rhodium, iridium, osmium, and ruthenium.
What Is Ore Grade?
Ore grade is the concentration of economic mineral or metal in an ore deposit. A fundamental unit used in defining grade is tonnage. The definition of one ton has changed over the years but can be summarized as follows:
• One US ton (1 ton) is 2,000 lb; also called a short ton.• One UK or Imperial ton is 2,240 lb; also called a long ton—obsolete since
about 1965 when the United Kingdom adopted the metric system.• One metric ton (1 t) is 1,000 kg. The term tonne is still used in many
countries.
Given that 1 kg is about 2.2 lb, 1,000 kg or 1 t is about 2,200 lb, or about 1.1 times the mass of 1 US ton. (It is close to the mass of the Imperial ton, but there’s no need to be confused with an obsolete unit.)
The grade of a base metal deposit is expressed as a mass percentage. For example, a fairly rich copper deposit might have a grade of 0.4%. This means there are 0.004 × 1,000 kg = 4 kg of copper in each metric ton of ore. Alternatively there are 0.004 × 2,000 = 8 lb of copper in each US ton of ore. This all works out as shown in the following equation—watch the units (remembering that “t” is the metric ton and “ton” refers to the US ton):
..
.44 2 2
1 1 18 8 8kg/t t
kg lb/kg t ton/t
lb lb/ton#
#= = =

8
Chapter 1
The grade of a precious metal deposit is expressed in grams per metric ton or troy ounces per ton, where the common abbreviations are g/t and oz/ton, respectively. The ounces are troy ounces where 1 oz = 1.097 ounces avoirdupois = 31.1 g. For example, the gold grade at the Eskay Creek mine in British Columbia was about 0.96 oz/ton or 29.856 g/t, which is a very rich ore. A more typical gold grade is 1–4 g/t for open pit mines, 4–6 g/t for marginal underground mines, and 8–10 g/t for high-quality underground mines.
Because there are 1,000 kg in a metric ton and 1,000 g in a kilogram, there are 1 million grams in a metric ton. Thus, if gold grade is given in grams per metric ton, then it is in parts per million (e.g., 6 g/t is 6 ppm).
To convert a weight percentage to parts per million, multiply the percentage by 10,000, that is, 10,000 ppm = 1%. Thus 0.4% is 0.4 × 10,000 = 4,000 ppm. Conversion of base metal grades to parts per million is not commonly done, but it serves to show the large difference—three orders of magnitude—between typical gold grades and typical base metal grades.
TROY OUNCESThe origin of the word troy comes from the city of Troyes in France, an important trading city in the Middle Ages. A troy ounce is about 10% larger than the avoirdupois ounce used to measure the weight of things like the weight of the human body or food items. However, if you consider your body precious, start measuring its weight in troy ounces, convert those troy ounces to troy pounds, where 12 troy ounces equals one troy pound, and you can fool yourself into thinking that dieting is unnecessary.
HOW BIG IS 1 METRIC TON OF ROCK?One cubic meter (m3) of solid rock weighs between 2.5 and 3 t. This is the density of rock. Assume the density is 2.6 metric tons per cubic meter or 2.6 t/m3. Invert this to get 1/2.6 = 0.385 m3/t. This means that 1 t of rock occupies a volume of 0.385 m3. This volume could be any shape. If it’s a cube, then one side of the cube is 0.3851/3 = 0.73 m or 73 cm. Such a cube is shown to the left.
If the volume is a sphere, then because the volume of a sphere of radius r is given by 4pr3/3, the radius of the sphere can be computed as (3 × 0.385/4p)1/3 = 0.45 m or 45 cm. Its diameter is 90 cm. Such a sphere is shown to the left.
You can extend a measuring tape to these dimensions to get an idea of how big these volumes are.
73 cm
73 cm
90 cm

9
The Where, What, and How
Diamond mine grades are measured in carats per metric ton (carat/t). Since 1 carat = 0.2 g, a diamond grade of 4 carats/t = 4 × 0.2 = 0.8 g/t or 0.8 ppm.
Rocks and the Rock CycleThere are many physical and chemical cycles that occur in the earth (e.g., hydro-logic cycle, carbon cycle). A rock cycle is illustrated in Figure 1.4.
Three types of rock are shown in the rock cycle: igneous, sedimentary, and meta-morphic. Igneous rocks are formed when rock melts at temperatures between 600 and 1,200°C. The melt is called magma if it stays within the earth; if it exits the earth, as in a volcano eruption, it is called lava. Melted rock is light and will flow toward the surface where, if it solidifies within the earth, it is called an intrusive igneous rock (or simply an intrusion). If it exits the earth, it solidifies very quickly and is called an extrusive igneous rock.
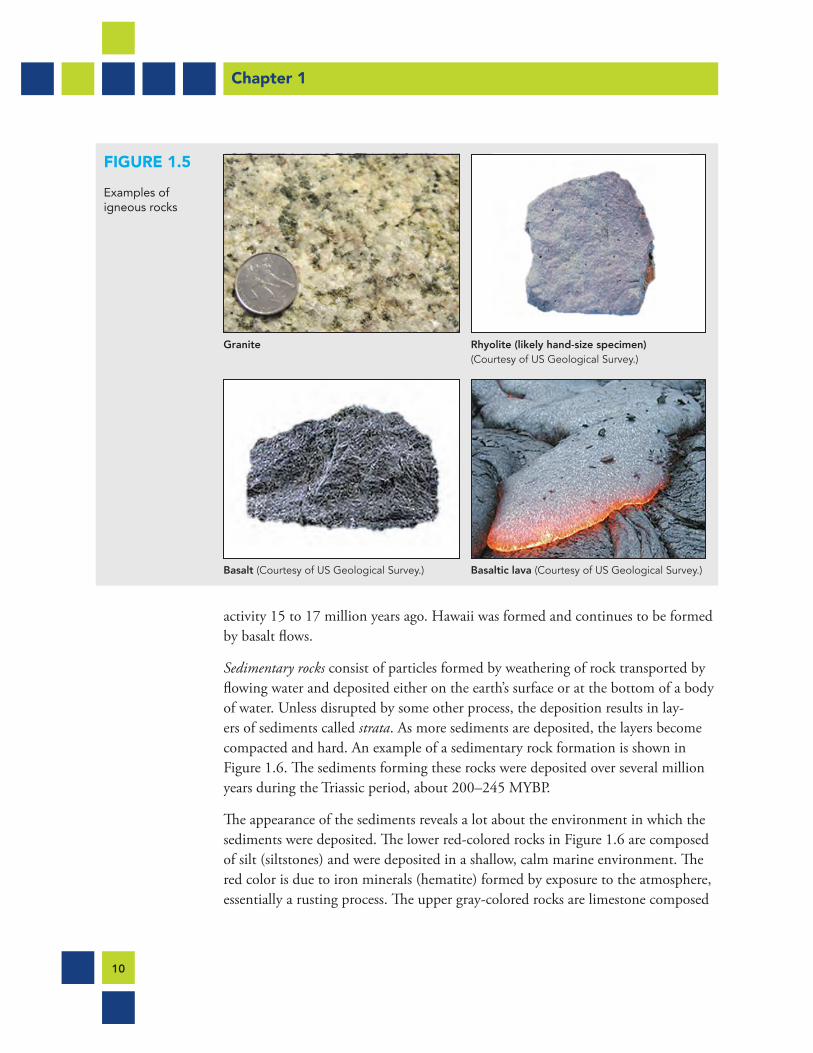
Figure 1.5 shows some examples of igneous rocks. The magma that formed the granite cooled slowly, allowing the large crystals to form. Figure 1.5 also shows rhyolite, which formed by fast cooling of lava from a volcano, resulting in small crystals. Both rocks have about the same chemical composition. Figure 1.5 includes a sample of basalt, a volcanic rock that contains less than 50% silica and a lot of heavy dark minerals that contain iron and magnesium. While granite is the most common rock in the continental crust, basalt is the most common rock in the oce-anic crust. Figure 1.5 also shows basaltic lava that, because of its low silica content, flows very easily. The Columbia plateau in southern Washington state and adjacent Oregon and Idaho is a large (163,000 km2) “flood basalt” formed during volcanic
Magma
Uplift
Intrusion
MetamorphicRocks
Burial
Molten Rock and Heat from Deep Crust and Mantle
Extrusive Igneous Rocks
Intrusive Igneous Rocks
Erosion and Transport
Sedimentary Rocks
Deposition and Compaction
FIGURE 1.4
Rock cycle showing the
transformations between the
three rock types: igneous,
sedimentary, and
metamorphic
10
Chapter 1
activity 15 to 17 million years ago. Hawaii was formed and continues to be formed by basalt flows.
Sedimentary rocks consist of particles formed by weathering of rock transported by flowing water and deposited either on the earth’s surface or at the bottom of a body of water. Unless disrupted by some other process, the deposition results in lay-ers of sediments called strata. As more sediments are deposited, the layers become compacted and hard. An example of a sedimentary rock formation is shown in Figure 1.6. The sediments forming these rocks were deposited over several million years during the Triassic period, about 200–245 MYBP.
The appearance of the sediments reveals a lot about the environment in which the sediments were deposited. The lower red-colored rocks in Figure 1.6 are composed of silt (siltstones) and were deposited in a shallow, calm marine environment. The red color is due to iron minerals (hematite) formed by exposure to the atmosphere, essentially a rusting process. The upper gray-colored rocks are limestone composed
FIGURE 1.5 Examples of igneous rocks
Granite
Basalt (Courtesy of US Geological Survey.)
Rhyolite (likely hand-size specimen) (Courtesy of US Geological Survey.)
Basaltic lava (Courtesy of US Geological Survey.)

11
The Where, What, and How
of the skeletal remains of marine organisms. These sediments were deposited in deeper water where the iron present was not exposed to the atmosphere.
Over time, igneous and sedimentary rocks may become buried and subjected to high pressures and temperatures, which cause physical and chemical transforma-tions but do not melt the rock. The result is a metamorphic rock. The variety of sources combined with the large possible range of temperatures and pressures gives rise to a wide variety of chemical and crystal textures of metamorphic rocks. Two examples are shown in Figure 1.7.
Metamorphic rocks comprise about 85% of the earth’s crust, and it is estimated that about 10% of the earth’s crust is composed of sedimentary rocks. These sedi-mentary rocks must exist at or near the surface of the earth because at depth they would be exposed to high pressure and temperatures and become metamorphosed or melt to become igneous rocks.
Courtesy of Mark A. Wilson via Wikipedia.
FIGURE 1.6
Part of the Virgin Formation, a sequence
of sedimentary rocks in southwestern Utah
formed during the Triassic period, about
200–245 MYBP
Quartzite—originally sandstone (Photo courtesy of Siim Sepp 2005, CC BY-SA 3.0.)
Gneiss—originally igneous or sedimentary. The bands are caused by high shear forces that cause the rock to behave like plastic. (Photo courtesy of Siim Sepp 2005, CC BY-SA 3.0.)
FIGURE 1.7
Two examples of metamorphic
rocks

12
Chapter 1
As may be seen in Figure 1.4, the rock cycle actually consists of a number of sub-cycles. Rocks are continually transforming from one type to another over millions of years. Although the source of heat is deep within the earth (due to heat generated by radioactive decay), most of the processes shown in the rock cycle occur at depths less than 20 km.
Faults, Fractures, and FoldsThe earth’s crust is subjected to very large forces that lead to ruptures called faults and numerous fractures. There are several well-known faults, such as the San Andreas fault in California where two large plates of the earth’s crust slide past one another and cause earthquakes. The Rocky Mountains in Canada were formed by thrusting of sedimentary rocks from the west to the east. Mount Rundle, one mountain in the Canadian Rockies, is shown in Figure 1.8. The uplifted layers can be seen on the left, the east side. The layers have been thrust from west to east along a subhorizontal fault over existing rocks, a process that has resulted in older sedi-mentary rocks being placed on top of younger ones, the reverse of what happens when sedimentary rocks are formed.
Fractures (“mini-faults”) also result from the large forces imposed on rocks. Fluids with mineral solutions percolate through these fractures and deposit minerals or metals in the fractures, forming veins. An example of small veins containing visible gold is shown in Figure 1.9. (Visible gold is actually a rare occurrence.)
Stresses combined with temperatures and pore water pressure can soften rocks so that they bend easily or actually flow. Layers of sedimentary rocks that were origi-nally horizontal can become folded, as shown in Figure 1.10. Folds are easily seen
FIGURE 1.8 View looking south of Mount Rundle (Banff, Alberta), formed by a series of thrust faults
Directionof Thrust
Adapted from Antony Stanley 2006, CC BY-SA 2.0.

13
The Where, What, and How
in sedimentary rocks, but they also occur in metamorphic rocks and also form in igneous rocks subjected to stresses in the later stages of magma cooling.
CONCENTRATIONS OF METALS
Geochemical models can be used to estimate the average concentrations of met-als in the crust of the earth. The details of these models are complex. However, the main observation is that the typical grade of an ore deposit is larger, sometimes much larger, than the average concentration of the metal in the earth’s crust.
Courtesy of Pretium Resources.
FIGURE 1.9
Gold veins at Brucejack property,
northwestern British Columbia
Courtesy of Alberta Geological Survey.
FIGURE 1.10
Folded sedimentary rocks
at Mount Head in the Canadian
Rockies

14
Chapter 1
For example,
The grade of a typical gold deposit is of the order of thousands of times greater than the average concentration of gold in the earth’s crust.
In contrast, the grade of an iron deposit is only 10 times greater than the average concentration of iron in the earth’s crust.
These relationships are illustrated for different elements in Figure 1.11. Note the logarithmic scale where one major division denotes an order-of-magnitude differ-ence (e.g., from 101 = 10 to 102 = 100). This scale is used because of the large range of concentrations.
FIGURE 1.11 Comparison of average metal grade (abundance) in the crust with average ore grade
Oxy
gen
Silic
on
Alu
min
um
Iron
Nic
kel
Zinc
Copp
er
Lead
Ura
nium
Mol
ybde
num
Silv
er
Gol
d10
–3
10–2
10–1
100
101
102
103
104
105
106
Part
s pe
r M
illio
n
Increment Required for Ore Crustal Abundance
The abundances of oxygen and silicon are shown for comparison:
Silicon ~300,000 ppm, Oxygen ~500,000 ppm
These two elements occur as components of minerals; that is, they are bound chemically to other elements.
The concentrations of metals in ore deposits depend on the current price of the metal because ore is what can be mined under current economic conditions. Thus, as the price goes up, the concentration of metal required to make rock an ore deposit goes down. However, relative to the concentrations in the earth’s crust, the changes are not significant.

207
Index
Note: f. indicates figure; t. indicates table
Aacid, in rivers, 142acid rock drainage (ARD), 141–143, 143f.acid solutions, 206acquisition, of mining companies, 26activated carbon, 98–102aerobic processes, of waste treatment, 149aggregates
business of, 125–126origin and occurrence, 124processing, 125, 125f.uses for, 124, 124t.
alkali solutions, 206anaerobic processes, of waste treatment, 149anomalies, 29, 30f.aquifers, 62ash, 114asthenosphere, 18at-mine return (AMR), 168atomic weight, 81atoms, 201–203, 201f.aurocyanide
and carbon adsorption, 98–102as by-product of gold ore processing,
96–98Australian Academy of Science, 187automation, of the mining cycle, 189, 190f.
Bbacteria
Delftia acidovorans, 193methanogens, 194oxidation by, 103–106Ralstonia metallidurans, 192, 192f., 193f.
sulfate-reducing bacteria (SRB), 147–148, 147f., 193
basalt, 9, 10f.basaltic lava, 9–10, 10f.base metals
defined, 7separation of from precious metals, 83
benches, pit slope, 39, 39f., 40f.biohydrometallurgy, 103–106biomining, 105, 106f.“bio-ore,” 194biotechnology, 191–196, 197f.black smokers, 21blasting, 55–56, 55f., 56f., 65f.blister copper, 85block caving, 50–52, 51f., 52t.block models, 34–35, 35f., 180f.Blusson, Stewart, on finding diamonds in the
Canadian Arctic, 121British Columbia, Canada, copper-gold
occurrences and mines map, 27f.by-products, 169–170
CCanadian Securities Administrators, 181capital productivity, 188–190carbon adsorption
vs. absorption, 100carbon in pulp (CIP) process, 99,
100–101, 101f.carbon-in-column method, 99–100carbon-in-leach (CIL) process, 99, 100processes, 98–99, 99f.
cave front, 51

208
Index
centrifugal concentrators, 108, 108f.chalcopyrite, 5f.chemical elements
defined, 2examples of, 4f.
Chicago Mercantile Exchange (CME) Group, 174–175
classification (separation process), 74clays, 113cleaner cells, 79coal
formation of, 113–115, 114f.industry characteristics, 115processing, 115–119, 116f.rank, 113, 115f.as rock vs. mineral, 116run-of-mine (ROM), 116–117washing, 116
Code for Reporting of Mineral Resources and Ore Reserves (JORC), 183
collectors (flotation chemical), 77, 78, 79comminution
crushing, 69–71, 122–123cyclones (hydrocyclones), 74–75, 75f.defined, 67grinding, 71–74grinding circuits, 75–76, 76f.physics of, 72
commodities, 165, 165f.commodity exchanges, 171, 174–175communities
health in, 156–158and mining, 158–160
compoundsdefined, 4examples of, 4t.
concentrates, 78, 78f.See also copper concentrates; sulfide
concentratesconcentration
calculating concentration factor (CF), 80–81, 80f.
relationship to ore grade, 13–15, 14f.concentrators, 68f., 108–109, 108f., 109f.
contact metamorphism, 24continental boundaries, 22, 22f.Cooney, James, on social license to operate
(SLO), 158copper
example of, 4f.plating experiments, 205–206, 205f.prices, 175, 175f.
copper concentratesbio-heap leaching, 106refining, 86–88, 88f.smelting, 85–86, 86f.solvent extraction and electrowinning (SX/
EW), 91–94, 92f., 93f., 95f.co-products, 169–170core, earth, 1corporate social responsibility (CSR), 156,
159costs, reduction of, 189cratons, 119crosscuts, 50crushers
cone, 70–71, 70f.gyratory, 69–70, 69f.high-pressure grinding rolls (HPGR),
122–123, 122f.jaw, 70, 70f.
crust, earth, 1, 18–22cut-and-fill mining, 46, 47f.cutoff grade, 179–180, 180f.cyclones (hydrocyclones), 74–75, 75f.
Ddams, tailings
centerline construction, 134–135, 134f.downstream construction, 134, 134f.history of, 136upstream construction, 133–134, 133f.
Delftia acidovorans, 193delivery contracts, 167dense media separation (DMS), 118, 118f.developing countries, and mining, 157–160dewatering, 61–62, 63f.

209
Index
diamondsage-dating, 120Canadian Arctic deposits, 120–121formation of, 119–120, 120f.processing, 122–124
dilution, 62, 64, 64f., 65f.dirigibles, 65, 66f.disclosure, 181–183disseminated deposits, 17Dobbs, Richard, on resource curse, 160dose, defined, 157drilling
cost considerations, 33–34diamond core, 31, 32f., 33equipment, 32f., 54–55, 54f., 55f.goal of, 34reverse circulation, 33, 33f.
dry stack, tailings, 137, 138f.Dupont equation, 188
Eearth
history of, 2–3, 2t.plate tectonics, 18–22structure of, 1–2, 1f.
economic analysis, 182–183, 182f.economic conditions, effect of on mining
operations, 6–7electrolysis, 204electrons, 201–203, 201f., 202f.electrorefining, as different from electrowin-
ning, 92–93electrowinning, 89, 94, 101–102, 101f.,
166–167See also solvent extraction and electrowin-
ning (SX/EW)elements, 2, 4f.Elsner reaction, 90emergence, 196employees
health of, 156and safety behavior, 154–155
engineering, and pit slope stability, 39–40engineers, 152
environmental engineers, 129epithermal deposits, 17Equator Principles, 158equipment
autonomous haul trucks, 189, 190f.centrifugal concentrators, 108, 108f.concentrators, 68f.crushers, 69–71, 69f., 70f.cyclones (hydrocyclones), 74–75, 75f.dense media separation (DMS) machines,
118, 118f.drills, 32f., 54–55, 54f., 55f.filter press, 137, 138f.high-pressure grinding rolls (HPGR),
122–123, 122f.high-tensile steel mesh, 60, 60f.load-haul-dump (LHD) machines, 47,
58–59, 58f., 59f., 60, 65–66magnetic separators, 109–110, 110f.oxygen flash furnace, 85f.rock bolts, 61, 61f.rotary breakers, 117, 117f.screens, 117, 118f.shaking tables, 106–107, 107f.shearers, 50, 50f.sluice boxes, 107, 107f.spiral concentrators, 108–109, 109f.X-ray separators, 123–124, 123f.
evaporite deposits, 24experiments, copper plating,
205–206, 205f.exploration
drilling, 31, 32f., 33–35, 33f., 34f.expenditures vs. discoveries, 186–187,
186f.geochemical surveys, 31, 31f.geological mapping, 28–29geophysical surveys, 29–30, 29f., 30f.and reserve ratios, 179role of in mining, 26–28satellite imaging, 28, 28f.See also reserves; resources
external dilution, 64, 64f.extrusive igneous rocks, 9

210
Index
Ffaults, 12, 12f.feasibility studies, 181–182feldspars, 6, 17, 113Ferry, John, and mineral classification, 6filter cakes, tailings, 137filters, tailings, 131–132Fipke, Charles, on finding diamonds in the
Canadian Arctic, 121Fire into Ice: Charles Fipke and the Great
Diamond Hunt (Frolick), 121flocculants, 110flotation
cells, 79, 80f.circuits, 78–81, 79f.of coal, 118–119and grade recovery, 84mineral separation in, 81–83process, 77–78, 77f.
folds, 12–13, 13f.fractures, 12freeboard, 132f., 133Frolick, Vernon (Fire into Ice), 121froth flotation. See flotationfrother, 77
Ggangue, 67, 69f.geochemical surveys, 30, 31f.geological mapping, 28–29geological processes, slowness of, 2geophysical surveys, 29–30, 29f., 30f.geotechnical engineers, 129glacial till, 121, 121f.gneiss, 11f.gold
alternatives to cyanide leaching, 102–103aurocyanide and carbon adsorption,
98–102and bacterial growth, 192biooxidation, 105carbon stripping and electrowinning,
101–102, 101f., 102f.cyanide leaching, 96–97example of, 4f.
Merrill-Crowe process, 97–98, 97f.prices, 173–174, 173f.smelting, 102, 103f.and termite mounds, 193
gossan deposit, 26Gowan, Mike, on co-disposal, 146grade. See ore gradegranite, 9, 10f.gravel pits, 126greenhouse gas (GHG) emissions, 161, 161f.grinding
autogenous (AG), 71–73ball mill, 73–74, 74f.circuits, 75–76, 76f.semiautogenous (SAG), 71–73, 73f.
Hhazard, defined, 153Hazen, Robert, and mineral classification, 6health
community, 156–158occupational, 156personal, 156See also safety
Horn, Robert, on exploration challenges, 35human resources, 151–152hydraulic fill, 46hydrometallurgy
defined, 89–90leaching, 90–91
hydrothermal metamorphism, 24hydrothermal systems, 17hydrothermal vents, 20f., 21hyperaccumulators, 194–195
Iigneous rocks
defined, 9–10examples of, 10f.igneous-hydrothermal ore deposits,
16–17, 16f.indicator minerals, 121industrial minerals, 113Industry Guide 7 (U.S. Securities & Exchange
Commission), 183

211
Index
inertinite, 115insect swarms, as model for biotechnology,
196intergenerational equity, 161internal dilution, 64, 64f.internal erosion, 132intrusive igneous rocks, 9ions, 201–203, 202f., 203f.“iron hat” deposits, 26island arcs, 18f., 19, 22, 22f.
JJoint Ore Reserves Committee of the
Australasian Institute of Mining and Metallurgy (JORC), 176, 183
joint products, 169–170JORC diagram, 176
KKessler, Stephen, on deposit discovery rates,
187“Kilobots,” 196, 197f.kimberlite pipes, 119–120
See also diamonds
Llaterites, 26lava, 9leachate, 91leaching
alternatives to cyanide, 102–103bio-heap, 106biohydrometallurgy, 103–106carbon adsorption processes, 98–102cyanide, 96–103Merrill-Crowe process, 97–98, 97f.in pads, 90–91, 91f.pressure, 94–96reactions, 90in-situ, 90–91solvent extraction and electrowinning
(SX/EW), 91–94lifts, 90liptinite, 115lithosphere, 18
lixiviant, 91London Bullion Market Association
(LBMA), 172–173London Metal Exchange (LME), 174–175London Platinum and Palladium Market
(LPPM), 172–173longhole stoping, 48longwall mining, 49–50, 50f.
Mmacerals, 114magma
defined, 9and ore deposit formation, 16–17, 16f.
magnetic separators, 109–110, 110f.management, 152mantle, earth, 1, 119massive sulfide deposits
formation of, 17volcanic (VMS), 21, 21t.
matte, 85metal equivalents, 170–171metal streaming, 183metals
calculating deposit grade, 7–9concentration of, 13–15defined, 7and microorganisms, 191–194noble, 204and plants, 194–195, 195f.prices, 171–175refining, 86–89separation of, 83solubility of, 204
metamorphic rocksdefined, 11examples of, 11f.metamorphic deposits, 24, 25f.
methanogens, 194microorganisms, 191–194mid-ocean ridges, 18f., 19–21, 20f.mine planning, use of block models in,
34–35, 35f., 180f.mine waste
acid rock drainage (ARD), 141–143calculating how many tons, 141

212
Index
co-disposal, 146–147, 146f.health effects of, 157management of, 129passive treatment systems, 148–149pit disposal, 145reclamation, 144–145sequestration, 145–146streams of, 130tailings, 130–139treatment methods, 144–149waste rock, 139–141wastewater, 141, 147–149
mineral productsby-products, 169–170co-products, 169–170examples of, 165f.and metal equivalents, 170–171product streams, 166–167and refinery contracts, 167–168, 168f.and smelter contracts, 166, 167–168,
167f.supply system, 166f.
mineralscalculating deposit grade, 7–9classification of, 6defined, 4deposit discovery rates, 186–187descriptions of, 5–6examples of, 5f.indicator, 121industrial, 113separation of by flotation, 81–83separation of by physical methods,
106–111Skinner’s expanded definition, 6, 116See also mineral products
mining cycleblasting, 55–56drilling, 54–55load-haul-dump (LHD), 58–59, 65–66stages of, 53–54, 53f.support installation, 59–61ventilation and refrigeration, 56–57
mining industryasset reduction in, 190and biotechnology, 191–196
cost reduction in, 189deposit discovery rates, 186–187future of, 197f., 198innovation in, 185paths for innovation in, 188–190and sustainability, 160–161, 186
Minto Deposit, resource classification example, 177, 178f.
“modifying factors,” 176, 176f.molecules, defined, 5molybdenite, 82muck, 48
NNational Instrument 43-101 (NI 43-101),
181, 183native elements, 2net smelter return (NSR), 168noble metals, 204nonmetallic minerals, 113North America, subduction zones in, 23f.
Ooccupational health, 156open pit mining
pit slopes, 38–40, 38f., 39f., 40f., 41pushbacks, 40–41, 40f., 42f.strip ratios, 42–43, 42t.typical configuration, 37–38, 37f., 38f.
operating productivity, 188–190operations
blasting, 55–56dewatering, 61–62drilling, 54–55grade control, 62, 64load-haul-dump (LHD), 58–59, 65–66support installation, 59–61, 63ventilation and refrigeration, 56–57
ore, legal definition, 7, 175ore deposits
correlation with volcanic activity, 15, 15f., 16f.
defined, 6–7formation of, 2, 15, 19igneous-hydrothermal, 16–17, 16f.massive sulfide, 17

213
Index
metamorphic, 24, 25f.oxide, 25–26, 25f.sedimentary, 23–24See also concentration; ore grade
ore gradecalculating, 7–9control, 62, 64cutoff grade, 179–180, 180f.defined, 7flotation recovery and, 84relationship to concentration, 13–15, 14f.
ore-body models, 34–35, 34f.overflow, 75oxidation, 25–26, 25f., 203–204, 203t.
by bacteria, 103–106oxygen flash furnace, 85f.
Ppanel caving, 52panels, 49, 52paradox of plenty, 159–160partial melt, 17paste, tailings, 137, 137f.paste backfill, 46percentage paid, 168pH scale, 206, 206t.phytomining, 194–195, 195f.phytoremediation, 194–195, 195f.pillars, 48, 49, 49f.pit slopes, 38–40, 38f., 39f., 40f., 41placer deposits, 23, 24f.plants, metals in, 194–195plate tectonics, 19plates
boundary types, 18f., 19–22movement of, 18–19
precious metalsdefined, 7separation of from base metals, 83
preconcentration, 189–190prefeasibility studies, 181pregnant leach solution, 91prices/pricing
commodity exchange, 171, 174–175copper, 175, 175f.
gold, 173–174, 173f.independent, 171, 172–174negotiated, 171producer, 171
processingaggregates, 125coal, 115–119comminution, 67–76diamond ore, 122–124flotation, 77–84gold ore, 96–103guiding principle, 76, 79, 102
production level, 50pushbacks, 40–41, 42f.pyrite, 5f., 82, 83f.
Qqualified person (QP), 181quarries, 126quartz, rose, 5f.quartzite, 11f.
RRalstonia metallidurans, 192, 192f., 193f.reclamation, 144–145, 144f.reduction, 203refinery contracts, 167, 168–169, 168frefining
of copper concentrates, 86–88, 88f.by electrolysis, 204of lead concentrates, 88of lead-zinc concentrates, 89of nickel sulfide concentrates, 89of zinc concentrates, 88–89
refrigeration, 57reporting standards, 181–183reserve ratios, 178–179, 179t.reserves
classification of, 176–177defined, 175–176reporting standards, 181–183See also exploration
residence time, 76, 80resource curse, 159–160

214
Index
resourcesclassification of, 176–177defined, 175in difficult places, 188, 188f.Minto Deposit classification example,
177, 178f.reporting standards, 181–183See also exploration
rhyolite, 9, 10f.Richards, J. P., on deposit discovery rates, 187rift zones, 18f., 19risk, 153risk management, 153–154, 153f.rock bolts, 61, 61f.rock cycle, 9–12, 9f.rock(s), defined, 6room-and-pillar mining, 49, 49f.rose quartz, 5f.rougher cells, 79
Ssafety, 152–155
See also healthsafety culture, 154–155SAMREC Code, 183sand and gravel. See aggregatessatellite imaging, 28, 28f.scavenger cells, 79sedimentary rocks
defined, 10–11examples of, 11f.sedimentary ore deposits, 23–24
sequestration, of acid-generating waste, 145–146, 146f.
shaking tables, 106–107, 107f.shared value opportunities (SVO), 159shields, 49shotcrete, 61, 62f.shrinkage stoping, 48silicon, 4f.Skinner, H.C.W., expanded definition of
minerals by, 6, 116slag, 85, 86sluice boxes, 107, 107f.smelter contracts, 166, 167–168, 167f.
smeltingchemical reactions in copper smelting, 87of copper concentrates, 85–86, 86f.gold, 102, 103f.of lead concentrates, 88of lead-zinc concentrates, 89of nickel sulfide concentrates, 89of zinc concentrates, 88–89
soap, 79social license to operate (SLO), 158–159soil(s), defined, 6solvent extraction and electrowinning (SX/
EW), 91–94, 92f., 93f., 95f.spalling, 60spiral concentrators, 108–109, 109f.split-off point, 169stockpiles, 71, 71f.stoping, 48, 48f.strata, 10Stratum International, mining professional
survey, 152strip ratios, 42–43, 42t.subduction zones, 18f., 22, 22f., 23f.sulfate-reducing bacteria (SRB), 147–148,
147f., 193sulfide concentrates
biohydrometallurgy, 103–106, 105f.mineral recovery from slurry, 84, 84f.pressure leaching, 94–96, 95f.smelting, 84–86use of flotation to separate, 77–78
sulfuric acid, 85–86surface mining. See open pit miningsustainable development, 160–161sustainable mining, 160–161, 186SX/EW. See solvent extraction and electro-
winning (SX/EW)
Ttailings
dams, 131, 133–135, 133f., 134f., 136defined, 38, 129, 130example of, 129f.forms of, 131, 131t.impoundment, 131, 132f.

215
Index
impoundment water balance, 135, 135f.pit disposal, 145, 145f.pond, 133thickened, paste, and filtered disposal,
135, 137, 137f., 138f., 139wet disposal, 131–133, 132f.
technical reports, 181–183termites, and gold, 193thickeners and clarifiers, 110–111, 110f.,
111f.timber supports, 63ton/tonne
defined, 7size of one metric ton, 8
toxicity, 157treatment and refining charges (TC/RC), 168troy ounces, 8
Uundercut, 50underflow, 75underground mining
block caving, 50–52, 51f., 52t.comparison of methods, 52–53, 53t.cut-and-fill, 46, 47f.and exploration, 44–45longwall, 49–50, 50f.narrow vein mining, 47, 47f.resources, 52room-and-pillar, 49, 49f.shaft construction, 45–46, 46f.stoping, 48, 48f.
support installation, 59–61, 63terminology, 44t., 45f.typical configuration, 43–44, 43f.
VVALMIN Code, 183valuation, of by-products and co-products,
169–170, 170f.veins, 13f.ventilation, 56–57, 57f.vertical crater retreat (VCR), 48vitrinite, 114–115, 115f.volcanic massive sulfide (VMS) deposits, 21,
21t.volcanos
map of active, 15f.and ore deposit formation, 15–17, 16f.
Wwaste rock/waste dump, 37, 139,
140f., 141pit disposal, 145, 145f.See also strip ratios
wastewater, 141, 147–149wetlands, 148–149, 148f.workforce, 151–152
XX-ray fluorescence, 123–124, 123f.
Zzinc, 98


