how is the indian it-bpo industry facing the...
TRANSCRIPT

HOW IS THE IN D IAN IT-B PO IN DU S TR Y FAC IN G THE C U R R E N T G LOB AL U N C E R TA IN TIE S ?
A N AS S C OM U pdate
G anes h N atara jan

Positive growth in FY08 under clouds of uncertainty
2
FY04 FY05 FY06 FY07 FY08
21.6
28.5
37.4
48.1
64.03.6%4.1%
4.7%5.2% 5.5%
32%
31%
29%
28%*
US$ billion, percentage
Indian IT-BPO SectorRevenue Aggregate and Share of GDP
ExportsDomesticPercentage of GDP
• Sustained export growth – revalidates strong fundamentals
• Revenue aggregate as a percentage of GDP continues to rise
Source: NASSCOM
* Domestic Revenue Adjusted for Currency

0.5
4.9
8.4
18.0
0.5
6.4
10.9
23.1
Hardware
Product Dev and Engg Services
BPO
IT Services
FY2008FY2007
All segments grew well in FY 08
3
100% = US$ 64 billion
DomesticMarket
Exports 62-66%
34-38%
*Includes product development and engineering ** Negligible
12%
18%
70%
40%
27.5%
32%
28%
Sourcing model
BPO
IT*
Global CaptivesGlobal Providers
Indian Providers
**
29%
30%
28%
Source: NASSCOM Source: NASSCOM
YOY growth

• Banking, Financial Services, Insurance and Hi-tech / Telecom account for nearly 60% of Indian IT-BPO exports
• Manufacturing and retail are other large sectors
• Airlines, media, healthcare and utilities are some emerging high-growth sectors
New verticals reduce dependency
4
FY2007
* Excludes hardware exports
Vertical market exposure for industry exports is well balanced across several mature and emerging sectors
BFSI40%
Hi-tech / Telecom19%
Manufacturing15%
Retail8%
Media, Publishing and Entertainment
3%
Construction and Utilities4%
Healthcare3%
Airlines and Transportation
3%Other
5%
Source: NASSCOM

Industry progressing to offer end to end service
5
CoveragePercentage of full service
Revenue Split by Service Offered
FY2008E
Export growth is also being supported by increasing breadth and maturity of the service portfolio.
44%
22%
3%
1%
8%
4%
18%
Customer Interaction & Support
Finance & Accounting
Human Resources Mgmt.Procurement Services
Knowledge Services
Other Horizontal
Services
Vertical-specific BPO Services
100% = US$ 10.3 billion
BPO EXAMPLE
25
15
15
14
11
42
34
35
48
22
82
76
73
100
42
Customer Interaction & Support
Finance & Accounting
Knowledge Services
Procurement Services
Human Resources Management
Best in class 2007 Median 2007 Median 2004
Source: NASSCOM Source: NASSCOM

61%
18%
12%
6%2%
Geographical spread diversified
6
US
UK
Continental Europe1
APAC2ROW100% = US$ 31.4 billion*
30%
US
UKContinental
Europe
APAC
43%
>55%
36%
Percentage
FY2007
CAGR FY2004-07FY2007FY2004
Indian IT-BPO Exports grew at a CAGR of 35% over FY2004-07
•Excludes hardware exports1 Top 3 countries include Germany (~2.5%), Netherlands (~2%), Switzerland (~1%) 2 Top 3 countries include Australia (~1.5%), Japan (~1.5%), and Singapore (~1.3%)
Europe, APAC and Middle East markets growing rapidly
Source: NASSCOM

But……
Will the meltdown in the financial markets and the slowdown in all sectors make all these projections irrelevant ?

Current Global Uncertainties
Signs of US Slowdown post sub-prime and wall
street crisis; impact on other economies
Economic instability
Oil crisis, food prices, inflation, unstable
currencies, volatility in stock markets etc.
Concerns over US election; forthcoming Indian
elections and the continuing decline of stock markets
Constraints within India on talent, infrastructure etc.
8

Tightening the belt
Wake up call 10 months ago when USD touched Rs. 39
Focus on productivity, efficiency, resource utilization
Wage moderation, reduced lateral hiring, reduced attrition
More efficient asset utilization – real estate, IT etc
Expansion into tier 2/3 cities
Domestic market and new markets
These improvements will have lasting impact over years!
9

Information Security & Risk Management
Standards
Physical security
Personnel security
• Compliance with global standards e.g., ISO 27001, CoBIT
• Contractual safeguards, robust BCP/DR planning
Network security
Laws
• Secure design, documentation & implementation of network e.g., firewall, antivirus encryption
• Isolation of sensitive areas• Access control systems e.g., CCTV
surveillance, security guards
• Background checks• Non-disclosure agreements
• Compliance with international laws• Strengthening of Indian legal system
• Maximum ISO 27001 certifications obtained globally
• Data Security Council of India formed
• Documented security policies covering use of information, mobile computing, user access
• Robust and uniform best practices
• National Skills registry (NSR) to facilitate personnel background checks
• Cyber security training and awareness
• Amendments to strengthen the IT Act 2000 and Indian Penal Code being enacted
Objectives Initiatives/Impact
The NASSCOM 4 E model for trusted sourcing – Engagement, Education, Enactment and Enforcement is being proliferated.
10
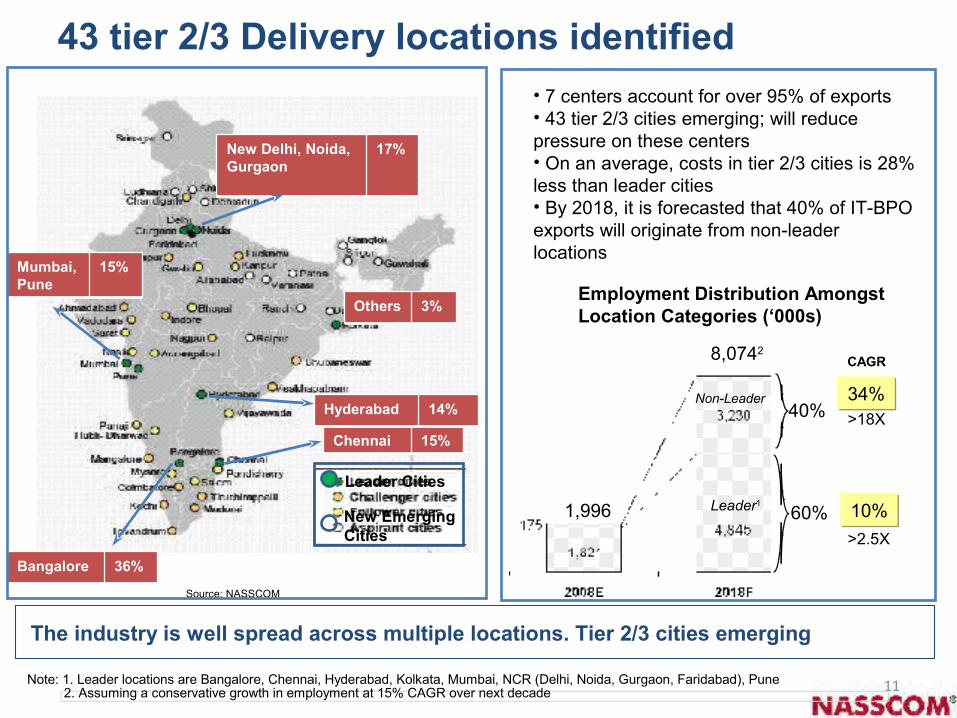
43 tier 2/3 Delivery locations identified
11
Bangalore 36%
Mumbai, Pune
15%
Chennai 15%
New Delhi, Noida, Gurgaon
17%
Hyderabad 14%
The industry is well spread across multiple locations. Tier 2/3 cities emerging
Others 3%
Source: NASSCOM
Leader Cities
New Emerging Cities
• 7 centers account for over 95% of exports• 43 tier 2/3 cities emerging; will reduce pressure on these centers• On an average, costs in tier 2/3 cities is 28% less than leader cities• By 2018, it is forecasted that 40% of IT-BPO exports will originate from non-leader locations
Employment Distribution Amongst Location Categories (‘000s)
1,996
8,0742
Non-Leader
Leader1
CAGR
40%
60%
34%
10%
>18X
>2.5X
Note: 1. Leader locations are Bangalore, Chennai, Hyderabad, Kolkata, Mumbai, NCR (Delhi, Noida, Gurgaon, Faridabad), Pune 2. Assuming a conservative growth in employment at 15% CAGR over next decade

Comprehensive Plan for making India’s large talent base “employable”
12
Recognizing this imperative, the industry is proactively working on several initiatives to strengthen India’s long-term cost advantage
Short Term
Medium Term
Long Term
• Enhance overall yield• Improve employability• Expand to tier 2
locations• Lower skill dependence
Objectives Initiatives
• Industry to enhance investments in training • Entry-level assessment for BPO and IT,
finishing schools : Through NAC, NAC-Tech• New locations identified; govt’s engaged
• Lower training investment
• Enhance specialist and project management expertise
• Add education capacity• Promote education
reform
• Faculty Development Program: to increase the suitability of teachers
• Facilitating industry access to specialist programs offered by independent agencies
• Expansion of higher-education infrastructure: government to set-up 20 new IIITs
• Program to increase PhDs in technology• NASSCOM VC fund focused on technology
innovation

Abundant Talent!347 higher education institutes
16,885 colleges with a total enrollment of over 9.9 million
Producing 495,000 technical graduates
Nearly 2.3 million other graduates
Over 300,000 post-graduates every year
INDIA – Differentiators!

Industry
Students
Major initiatives planned
Tier 1 Colleges
Tier 3 Colleges
Billable Resource for
industryTier 2
Colleges
1 week training
by Industry
Industry Recruitment
Finishing School / Training Institute
•Up gradation of college curricula• Conduct of Faculty Development Programs• Student Assessments to check efficacy of training
Shadowing
Large part of industry training taken care of by
colleges / FSCost for training to be borne by individuals
College takes care of a large part of training which was earlier done by the firms.
Conduct of NAC-Tech
14
Existing Colleges New Vehicles

Global Careers
Graduate / 12th Graders
Awareness
College Students
Employability
Career Seekers
Employment
Business Manager
VocationalCareer Path
MBACareer Path
- 100,000 students enrolling at Maharashtra Knowledge Corporation (MKCL) centres will go through awareness course for vocational skills in key services segments identified for the future
- 30,000 college students from 100 colleges will go through intensive training for skills in BPO< Retail and Healthcare with internships in industry..
VocationalTraining
Graduation
Mgmt.Education
New movement launched in Pune

Overcoming Talent Crunch : Supply will not be a constraint in future
16
Source : BCG
47Mn
19Mn 7
Mn
3Mn
5Mn3Mn
India
Bangladesh
PakistanIran
Brazil
Mexico
Philippines
5Mn
4MnVietnam
2Mn
Turkey
-10Mn
China
-6Mn
Russia
5Mn
Indonesia
1MnMalaysia
0Mn
Ireland
Israel0Mn
Iraq2Mn
-1Mn
CzechRepublic
4Mn
Egypt
-17MnUS *
-2 MnUK
-2 Mn
Italy
-3 Mn
France-9 Mn Japan
* -5.6 m in 2010
Global working age population 2020
With an increasing imbalance in the global workforce, India’s demographic advantage is likely to be a key driver of future growth

17
Looking forward…
Source: NASSCOM
US $ BillionsIndian IT-BPO Sector (excluding hardware)
13.011.78.2
50.0
40.3
31.4
FY07 FY08 FY09E
Domestic
Exports
28%
21-24%E
39.6 52.0 63.0
• YOY USD revenue growth of IT players for H1 09 has been 25%
• Value proposition continues to be strong
50.0

18
What will drive growth in the long term?
• Recognise need for transformation and change
• Keep cost pressures under control and ensure more supply sources to avoid unsustainable salary pressures In new segments.
• Increased domain expertise and focus on innovation will be the key to the success of India Inc in the new world order.
• Participation of all knowledge eco-system players in making this dream a reality
• Global talent shortage; pressure on resources in developed world can be addressed by India to minimise social unrest and negative fallouts of the digital divide.
