how do industry peers respond to control threats?faculty.london.edu/hservaes/ms2014.pdf · how do...
TRANSCRIPT

This article was downloaded by: [163.119.134.226] On: 24 February 2014, At: 03:44Publisher: Institute for Operations Research and the Management Sciences (INFORMS)INFORMS is located in Maryland, USA
Management Science
Publication details, including instructions for authors and subscription information:http://pubsonline.informs.org
How Do Industry Peers Respond to Control Threats?Henri Servaes, Ane Tamayo
To cite this article:Henri Servaes, Ane Tamayo (2014) How Do Industry Peers Respond to Control Threats?. Management Science 60(2):380-399.http://dx.doi.org/10.1287/mnsc.2013.1773
Full terms and conditions of use: http://pubsonline.informs.org/page/terms-and-conditions
This article may be used only for the purposes of research, teaching, and/or private study. Commercial useor systematic downloading (by robots or other automatic processes) is prohibited without explicit Publisherapproval. For more information, contact [email protected].
The Publisher does not warrant or guarantee the article’s accuracy, completeness, merchantability, fitnessfor a particular purpose, or non-infringement. Descriptions of, or references to, products or publications, orinclusion of an advertisement in this article, neither constitutes nor implies a guarantee, endorsement, orsupport of claims made of that product, publication, or service.
Copyright © 2014, INFORMS
Please scroll down for article—it is on subsequent pages
INFORMS is the largest professional society in the world for professionals in the fields of operations research, managementscience, and analytics.For more information on INFORMS, its publications, membership, or meetings visit http://www.informs.org

MANAGEMENT SCIENCEVol. 60, No. 2, February 2014, pp. 380–399ISSN 0025-1909 (print) � ISSN 1526-5501 (online) http://dx.doi.org/10.1287/mnsc.2013.1773
© 2014 INFORMS
How Do Industry Peers Respondto Control Threats?
Henri ServaesLondon Business School, London NW1 4SA, United Kingdom;
Centre for Economic Policy Research, London EC1V 3PZ, United Kingdom; andEuropean Corporate Governance Institute, 1180 Brussels, Belgium, [email protected]
Ane TamayoLondon School of Economics and Political Science, London WC2A 2AE, United Kingdom,
This paper studies how industry peers respond when another firm in the industry is the subject of a hostiletakeover attempt. The industry peers cut their capital spending, free cash flows, and cash holdings, and
increase their leverage and payouts to shareholders. They also adopt more takeover defenses. The stock pricereaction upon announcement of the takeover is positive and larger for peer firms with higher capital spendingand higher free cash flows. Before the takeover attempt, the peer firms borrow less and invest more thanpredicted. Both stock returns and performance improve after the takeover attempt. These results are consistentwith the argument that the control threat has important spillover effects for the other firms in the industry.
Keywords : hostile takeover; agency costs; investment decisions; capital structureHistory : Received September 23, 2009; accepted April 22, 2013, by Wei Xiong, finance. Published online in
Articles in Advance October 7, 2013.
1. IntroductionAccording to Jensen’s (1986, 1993) free cash flowhypothesis, managers often refuse to shed fundsthat they cannot invest profitably, thereby expand-ing the firm beyond its optimal size. Such non-value-maximizing activities are more likely when (i) firmshave the funds available to do so, (ii) they lackgood investment opportunities, and (iii) managers donot have the right incentives (in terms of owner-ship or compensation contracts) to disgorge the freecash flows. Takeover attempts, and hostile takeoverattempts in particular, can put a halt to this behav-ior and force firms to change their policies, either asan independent firm, or after the takeover has beencompleted. In fact, those firms that succeed in fendingoff a takeover often do so by cutting capital spendingand committing to such a policy by increasing debt(see Denis and Denis 1993, Hendershott 1996, Bergeret al. 1997, Safieddine and Titman 1999).
Jensen (1986, 1993) and Shleifer and Vishny (1988)noted that the free cash flow problem (large cashflows, combined with the lack of good investmentopportunities) is not specific to a particular firm, butgenerally affects an entire industry. If this is the case,then a takeover attempt for one firm in an indus-try could also affect the behavior of the other firms,because they may feel that if they do not change theirbehavior, they will be next.
In this paper, we investigate this argument empir-ically and contrast it with a number of alternative
hypotheses. We focus on two types of responses fromindustry peers. First, industry peers may change theirinvestment and financing policies to diminish the con-trol threat. For example, they may reduce their capitalspending and commit to such a policy by increas-ing leverage. Second, industry peers may increasetheir takeover defenses to (further) insulate them-selves from future takeover attempts.
We study these responses for a sample of peersof 202 firms that received hostile takeover bids from1983 to 2005. We focus on hostile takeover attemptsbecause such transactions are more likely to be of adisciplinary nature, but we also report the results fora sample of friendly transactions when we discussalternative hypotheses.1
We first study whether the peers change theirinvestment and financing policies over a period oftwo years after the control threat, and find that thisis the case. Industry peers cut their capital spendingrelative to assets by between 7% and 9%, on aver-age. They also increase their leverage relative to assetsby between 11% and 17%. We also find a decline incash balances and the level of free cash flows, and anincrease in payouts to shareholders. These results are
1 See Morck et al. (1988, 1989) for evidence indicating that hostiletakeovers are related to agency problems in the target firm and itsindustry, whereas friendly takeovers are more synergistic, and seeSchwert (2000) for evidence suggesting that hostile takeovers donot differ substantially from friendly takeovers.
380
Dow
nloa
ded
from
info
rms.
org
by [
163.
119.
134.
226]
on
24 F
ebru
ary
2014
, at 0
3:44
. Fo
r pe
rson
al u
se o
nly,
all
righ
ts r
eser
ved.

Servaes and Tamayo: How Do Industry Peers Respond to Control Threats?Management Science 60(2), pp. 380–399, © 2014 INFORMS 381
consistent with the view that the threat to the inde-pendence of one firm in an industry leads to a declinein agency costs among its peers. The peers cut capi-tal spending, reduce cash balances, and commit to apolicy of not overinvesting in the future by increasingleverage. Consistent with this view, we report thatthose firms with the largest levels of (over)investmentbefore the control threat experience the largest cuts ininvestment afterward.
We also study the peers’ adoption of takeoverdefenses and find a small increase, even after control-ling for the general rise in the adoption of takeoverdefenses in the economy over our sample period.Thus, whereas some actions taken by peers appear tobe in the interest of shareholders, thereby reducingagency costs, others may lead to further entrenchment.
Next, we examine the stock price reaction of theindustry peers when the control threat is announcedand find that it is also consistent with the industry-wide agency cost argument. For the average takeoverattempt, peers gain 0.50% on the announcement day.The stock price reaction is larger for firms with higherlevels of overinvestment and free cash flows beforethe control threat, which are likely to be the firms withthe largest agency costs.
Finally, we document improvements in long-termstock returns and valuations after the takeoverattempt, which indicates that, on balance, the changesmade by the peer firms are beneficial for shareholders.
We contrast our agency cost hypothesis with anumber of alternative interpretations. One possibil-ity is that the changes in financial and investmentpolicies are due to changes in industry structure, andwould have taken place even without the controlthreat (the industry evolution hypothesis). We providevarious pieces of evidence showing that this is notthe case. We show that our findings continue to holdwhen we control for changes in firm characteristicsover time. In addition, we demonstrate that the indus-try peers were investing more than predicted by anempirical model of optimal investment and borrow-ing less than predicted by an empirical model of opti-mal leverage in the years before the takeover attempt;thus, the peers did not act optimally in the years pre-ceding the takeover attempt.
Another possibility is that the bidder has discov-ered a better way of operating the target’s assets(the asset redeployment hypothesis). This informationbecomes public as a result of the takeover attempt,allowing the industry peers to change their operatingand financing policies in line with the target. The keydifference between this hypothesis and the agencycost hypothesis is that peers change their policies vol-untarily because it is better for their shareholders todo so, and not because they fear a takeover attemptthemselves. Since the asset redeployment hypothesisdoes not rely on the disciplinary role of takeovers,
the effects should be as pronounced for hostile as forfriendly acquisitions. We find that this is not the case:few of the changes in policies are statistically signifi-cant for peer firms in friendly acquisitions.
Finally, it is possible that the takeover attempt indi-cates that the assets in the industry are undervalued(undervaluation hypothesis). Although consistent withthe stock price reaction upon announcement of thetakeover attempt, this hypothesis cannot explain whyfirms would change their investment policies. In addi-tion, we report that our findings hold for firms withhigh valuations, suggesting that undervaluation is notthe primary explanation for our results.
In sum, our results show that peer firms respondto the control threat by cutting capital spending andincreasing leverage. These results are consistent withthe argument that the control threat leads to a reduc-tion in the agency costs of the peer firms in the indus-try. However, some firms also adopt more takeoverdefenses to protect themselves from hostile takeovers.
Our paper adds to the literature on the disci-plinary effect of takeovers. Whereas Denis and Denis(1993), Hendershott (1996), Berger et al. (1997), andSafieddine and Titman (1999) illustrate that firms fendoff takeover attempts through increases in leverageand cuts in inefficient investment, our evidence sug-gests that there are important spillover effects thatalso influence the targets’ peers. Our results may alsoexplain why some prior work (e.g., Healy et al. 1992,Servaes 1994) finds no or limited evidence of sub-optimal investment on the part of takeover targets,as these targets are often compared to other firms intheir industry. Our evidence indicates that inefficientinvestment may be an industry-wide phenomenon.
Our paper also complements prior studies focus-ing on the stock price response of peers, customers,and suppliers to horizontal takeover announcements(see Eckbo 1983, 1985; Stillman 1983; Fee and Thomas2004; Shahrur 2005). These papers examine whetherhorizontal acquisitions lead to increased marketpower and find that, in general, this is not the case.Instead, they argue that the acquisitions improveindustry efficiency, but they do not study changes inthe financial policies or takeover defenses of industrypeers. Our results suggest that at least some of theefficiency gains come from a reduction in the agencyproblems of the peers of the target firms. Our studyis also related to Song and Walkling (2000), who pro-vide evidence indicating that the stock price reac-tion for industry peers can be partly explained bythe increased probability that the peers themselveswill become takeover targets. Our evidence comple-ments their study as we document the actions taken
Dow
nloa
ded
from
info
rms.
org
by [
163.
119.
134.
226]
on
24 F
ebru
ary
2014
, at 0
3:44
. Fo
r pe
rson
al u
se o
nly,
all
righ
ts r
eser
ved.

Servaes and Tamayo: How Do Industry Peers Respond to Control Threats?382 Management Science 60(2), pp. 380–399, © 2014 INFORMS
by the peer firms to reduce the probability of beingtaken over.2
The remainder of this paper is organized as follows.We develop our hypotheses in §2. Section 3 containsour data collection procedure. Section 4 describesthe results. Section 5 discusses the evidence in lightof alternative explanations for our findings, and §6concludes.
2. Hypotheses DevelopmentManagerial discipline is an important motive fortakeovers (see, e.g., Morck et al. 1988, 1989; Kaplan1989; Martin and McConnell 1991; Denis and Serrano1996; Holmstrom and Kaplan 2001). Takeover tar-gets perform poorly, on average, before the acquisi-tions, and experience substantial managerial turnoverafter the acquisitions. Firms that successfully defeattakeover attempts often reduce investments andincrease the amount of debt outstanding (see Denisand Denis 1993, Hendershott 1996, Berger et al. 1997,Safieddine and Titman 1999). Much of this evidencesupports Jensen’s (1986, 1993) free cash flow view,which suggests that managers often refuse to shedfunds that they cannot invest profitably, expandingthe firm beyond its optimal size. The market forcorporate control limits this behavior, either becausefirms are taken over or because the takeover attemptforces firms to clean up their act if they wish toremain independent. Lambrecht and Myers (2007)propose a theory that formalizes Jensen’s (1986, 1993)arguments. In their model, managers in industrieswith declining demand wait too long to disinvestbecause their interests are not fully aligned with thoseof shareholders. Increased leverage leads to more effi-cient investment decisions because the debt servicereduces managers’ rents.3 Without sufficient leverage,hostile takeovers serve as a disciplining mechanism.
Jensen (1986, 1993) and Shleifer and Vishny (1988)note that the agency costs of free cash flow are not spe-cific to a particular firm, but generally affect an entireindustry. This is the case because large cash flowsand the lack of investment opportunities are industry-wide characteristics. The existing literature providessome evidence in support of this view. For instance,Morck et al. (1989), in their study of the effectivenessof different control mechanisms in Fortune 500 firms,
2 Song and Walkling (2000) study the first acquisition in an indus-try after a dormant period because they want to make sure thetakeover is a surprise. We do not find that our results depend onthe sequence of takeovers in an industry; although it is true thatsubsequent takeovers are perhaps less of a surprise, they may alsoreinforce the view that there is a systematic problem in the industry.It is likely that these effects offset each other.3 See also Grossman and Hart (1982), Stulz (1990), Zwiebel (1996),and Morellec (2004) for arguments that relate leverage to invest-ment efficiency.
find that the industry q ratio of firms that receivehostile takeovers is 19% lower than the industry q offirms without a control change. They conclude that“poor industry performance is prevalent among tar-gets of hostile takeovers” (Morck et al. 1989, p. 847).Along the same line, Shleifer and Vishny (1988, p. 11)argue that “hostile takeovers affect industries indecline or sharp change where managers fail toshrink operations rapidly enough or to make otheradjustments.” These papers, however, do not explorewhether the industry peers of takeover targets changetheir policies in response to takeover attempts. This isthe goal of our paper.
We focus on hostile takeovers because theoreticaland empirical work suggest that hostile takeovers aremore likely to be disciplinary than friendly takeovers(see, e.g., Morck et al. 1988, 1989; Lambrecht andMyers 2007). Schwert (2000), on the other hand,argues that hostility is more related to bargaining thanentrenchment. However, some of Schwert’s evidencedoes suggest that hostile targets perform worse andhave lower valuations than friendly targets (see alsoDong et al. 2006, for evidence that hostile targets havelower valuations than friendly targets).
We hypothesize that a hostile takeover attempt forone firm in an industry will also have repercussionsfor its peer firms. In particular, we expect peer firms totake actions to reduce agency costs and/or to protectthemselves from takeovers, because if they do nothing,they may be next. The peer response could consist of(i) changes in their investment and financing policiesand/or (ii) the adoption of takeover defenses.
Just like the takeover targets that succeed in fendingoff takeover bids, peers are likely to cut (inefficient)capital spending and commit themselves to such apolicy by increasing debt. In addition, peers are likelyto reduce their cash holdings and free cash flow, andincrease their payouts to shareholders. In fact, if firmsissue debt, while at the same time reducing invest-ments and cash balances, then they will be forced toincrease payouts to shareholders. If these changes arevalue increasing, we expect to find improvements instock returns and valuation metrics in the years afterthe control threat.
Another means through which the industry peerscan reduce the probability of being a takeover tar-get is to adopt takeover defenses, a response we alsoinvestigate. Note, however, that this may not alwaysbe possible, since adding defenses may require share-holder approval. Hence, managers who value remain-ing in control will likely need to make changes to theirfinancing and investment policies as well.
The agency cost hypothesis also has implicationsfor the stock price reaction of the targets’ peers atthe announcement of the control threat. We expecta positive share price response for the peer firms,which stems from two sources: either (i) the control
Dow
nloa
ded
from
info
rms.
org
by [
163.
119.
134.
226]
on
24 F
ebru
ary
2014
, at 0
3:44
. Fo
r pe
rson
al u
se o
nly,
all
righ
ts r
eser
ved.

Servaes and Tamayo: How Do Industry Peers Respond to Control Threats?Management Science 60(2), pp. 380–399, © 2014 INFORMS 383
threat forces other firms in the industry to curtailtheir non-value-maximizing behavior, and the marketanticipates these changes, or (ii) for those peers thatdo not respond, the likelihood of a future takeoverincreases, leading to a higher share price as well. Weexpect the reaction to be more positive for the peerswith the highest levels of (over)investment and freecash flow, since these are the firms with the highestlevels of non-value-maximizing behavior.
3. Data CollectionWe gather data from the Securities Data Corp (SDC)database on all takeover attempts for U.S. listed firmsduring the period 1983–2005 (n = 111777). Transac-tions are removed if the acquirer’s goal is to purchaseless than 50% of the shares of the target or if theacquirer already owns more than 50% of the sharesbefore the announcement date, because these trans-actions are less likely to be of a disciplinary nature(remaining n = 111175). We further remove transac-tions if they are not the first bid in an auction, where anauction is defined as either multiple takeover attemptsmade for the same firm within a one-year periodor exceeding a one-year period if the prior offer isnot withdrawn before the subsequent offer is made(remaining n = 91431). Bids for financial firms arealso removed from the sample because these firmsare regulated, and it is difficult to measure leverageand investment in the financial sector (remaining n =
71196). We then select only takeover attempts deemedhostile by SDC (remaining n= 355).4 We include bothsuccessful and failed bids in our sample—the ultimatesuccess of the initial bid should be irrelevant as longas the hostile takeover attempt indicates to other firmsin the industry that they need to take action or couldbe targeted next.5
The list of firms operating in the industry (the indus-try peers) is constructed from the Earnings Supple-ment of the Standard and Poor’s Industry Surveys.6
4 As we argued previously, we select hostile takeovers becausethey are more likely to be disciplinary in nature. This does notimply that all hostile takeovers are disciplinary, but the inclusionof nondisciplinary hostile takeovers will only add noise to ourdata, making it more difficult to detect changes in the behavior ofpeer firms. We have also verified the robustness of our inferencesto more restrictive definitions of hostility, in which we eliminatetwo sets of cases where hostility may be proxying for bargaining:(i) takeovers in which the bidder revises its initial bid and therevised bid is accepted; (ii) takeover attempts where the firm islater acquired by a white knight. Our results are generally strongerwhen these cases (n = 45) are eliminated (but the difference withrespect to the full sample is not statistically significant).5 We have also verified that there is no significant difference in theresponse of peers of targets involved in successful versus unsuc-cessful bids.6 We do not rely on CRSP or Compustat to construct a sampleof industry peers. Guenther and Rosman (1994) and Kahle and
This guide is published monthly and categorizes firmsinto industries using criteria similar to the ones usedby Compustat.7 We use the latest available Earn-ings Supplement before the takeover announcement toidentify industry peers. Because the supplement onlycovers larger firms, we cannot identify peers of smalltargets (remaining n= 202). If the bidder is in the tar-get’s industry, we do not include it in the pool of peers,because our focus is on firms not directly involvedin the transaction. Finally, we also remove peers thatreceive a takeover attempt themselves over the sub-sequent two years. Many of these firms are droppedfrom the databases as they are taken over, and it istherefore not possible to study the changes in theirbehavior.
Peers are included if they are listed on Compustatand have data available for at least one year before theannouncement of the takeover and one year after itscompletion or withdrawal. If multiple bids occur in anindustry in a particular year, the peer firms are onlyincluded once, and both targets are excluded from thelist of peers.
We identify 2,548 peers of 202 hostile takeover tar-gets. Panel A of Table 1 lists the takeovers attemptsby year. The number of hostile acquisition attemptsin the sample ranges from 0 in 1991, 1992, and 2005to 40 in 1988. Although hostile takeovers were morefrequent during the 1980s (see also Holmstrom andKaplan 2001), approximately 32% of our observationsoccur during the 1990s and 2000s. The strong declinein the number of hostile takeovers in our sample inthe early 1990s can be partially explained by the gen-eral decline in takeover activity. As takeover activitypicked up again in the second half of the decade, therewas a rise in hostile activity as well. However, theadoption of antitakeover laws at the state level andantitakeover charter amendments and other defensesat the firm level may have contributed to the overalldecline in the level of hostile takeovers.8
Walkling (1996) indicate that the CRSP Standard Industrial Classi-fication (SIC) codes are not very representative of the industries inwhich firms actually operate, which leads to less precise inferences.Compustat SIC codes appear to be more reliable. Unfortunately,firms change industries during their lives, and Compustat onlykeeps a record of the firms’ historical SIC codes starting in 1987.7 Conversations with Standard and Poor’s indicate that the firmsincluded in the Industry Surveys are generally the same as the oneslisted on the Compustat database at the time, except that somesmaller firms are not included in the Earnings Supplement. Theindustry definition broadly corresponds to three-digit SIC codes.8 In addition, the Supreme Court’s ruling in 1989 allowing TimeWarner’s directors to invoke the business judgment rule whenrejecting Paramount’s offer may have contributed to the decline inhostile takeovers over time. We have studied whether our findingsweaken after 1989 and find that the effects we documents are gener-ally smaller after 1989 than before 1989, but the differences betweenthe two periods are not statistically significant.
Dow
nloa
ded
from
info
rms.
org
by [
163.
119.
134.
226]
on
24 F
ebru
ary
2014
, at 0
3:44
. Fo
r pe
rson
al u
se o
nly,
all
righ
ts r
eser
ved.

Servaes and Tamayo: How Do Industry Peers Respond to Control Threats?384 Management Science 60(2), pp. 380–399, © 2014 INFORMS
Table 1 Description of the Sample
Panel A: Number of hostile takeovers by year
Year Number of acquisitions
1983 41984 91985 191986 311987 231988 401989 111990 41991 01992 01993 11994 21995 121996 141997 111998 61999 32000 22001 22002 42003 22004 22005 0Total 202
Panel B: Distribution of the sample in Fama–French48-industry categories
Broad industry category Number of acquisitions
Wholesale 21Food products 16Shipping containers 15Utilities 13Computer software 12Chemicals 10Automobiles and trucks 10Other 105
Notes. The data on hostile takeover attempts are obtainedfrom SDC. Firms are included if they meet the follow-ing criteria: (a) the acquisition is deemed hostile by SDC;(b) the acquirer’s goal is to purchase more than 50%of the shares of the company; (c) the acquirer ownsless than 50% of the shares of the company before theannouncement; (d) the company is included in the Earn-ings Supplement of the Standard and Poor’s Industry Sur-veys; (e) the company does not operate in the financialservices sector. Only the first acquisition attempt in anauction is included.
The number of peers ranges from 1 to 70. The aver-age number of peers is 14.61, with a median of 10(not reported in the table). Panel B of Table 1 containsthe broad industry categories (using the 48 Fama–French industries) of the firms in the seven industriesthat experience more than 10 hostile takeovers—the“other” category combines those industries with lessthan 10 hostile takeovers. The top three industries in
numbers are wholesale, food products, and shippingcontainers.9 Appendix A contains further details ofthe number of takeovers by year and industry for all48 Fama–French industries.
4. Results4.1. Changes in the Financing and
Investment PoliciesIn this section, we examine the changes in capitalexpenditures, cash holdings, free cash flows, lever-age, and payout ratios of the targets’ peers. Ratiosare averaged for the two years prior to the controlthreat and the two years after the completion of thetakeover or its withdrawal date. We employ two yearsof data because it may take time for firms to changetheir policies, but if two years of data are not avail-able, we employ one year only. To reduce the influ-ence of outlier observations, we winsorize ratios thatinvolve capital spending, cash, debt, and payout pol-icy at the 99th percentile (the 1st percentile is zero),whereas free cash flow ratios are winsorized at the 1stand 99th percentiles.
Table 2 contains the results. In panel A, we treateach industry peer as an individual observation, suchthat industries with more firms receive more weight.When computing the p-values of the t-tests (for themeans) we take into account the lack of independenceacross observations (if the peers respond to the sameevent, their actions are not independent). We are notaware of such a correction for sign tests (for medians);hence, those results should be interpreted cautiously.Finally, the number of observations varies slightly foreach variable because not all Compustat data itemsare available for each company. In column (i), wereport the mean and median levels of the variablesin the two years before the control threat, and in col-umn (ii) we report the changes in the two years afterthe control threat.
We start by examining capital spending, measuredas the ratio of capital expenditures to assets. Con-sistent with our predictions, the peers’ mean ratioof capital expenditures to assets declines by 0.53percentage points (p-value = 0000), and the mediandecline is 0.38 percentage points (p-value = 0000). Thechange does not appear dramatic, but it is large eco-nomically. A cut in capital expenditures by 0.53 per-centage points reflects a 7.2% decline in capital spend-ing relative to a pre-control threat level of 7.38%(0.53% divided by 7.38%). Another way of assessingthe economic importance is to compute how muchmore the peer firms would have invested if they had
9 Note that to identify the peer firms, we follow the EarningsSupplement of the S&P Industry Survey and further partition theindustries into narrower subcategories.
Dow
nloa
ded
from
info
rms.
org
by [
163.
119.
134.
226]
on
24 F
ebru
ary
2014
, at 0
3:44
. Fo
r pe
rson
al u
se o
nly,
all
righ
ts r
eser
ved.

Servaes and Tamayo: How Do Industry Peers Respond to Control Threats?Management Science 60(2), pp. 380–399, © 2014 INFORMS 385
Table 2 Changes in Financial Characteristics of the Peers of Firms Receiving a Hostile Takeover Bid
Level before Change after Adjusted change aftertakeover attempt takeover attempt takeover attempt
(i) (ii) (iii) N
Panel A: Individual firm observationsCapital expenditures over total assets 000738 −000053 (0.00) −000081 (0.00) 21492
000635 −000038 (0.00)Adjusted investment ratio 000579 −000049 (0.05) −000029 (0.06) 11432
000449 −000053 (0.00)Long-term debt over total assets 002034 000273 (0.00) 000224 (0.00) 21516
001968 000080 (0.00)Total debt over total assets 002452 000347 (0.00) 000266 (0.00) 21504
002428 000193 (0.00)Cash over total assets 000887 −000072 (0.00) −000039 (0.05) 21548
000470 −000034 (0.00)Free cash flow over total assets 000748 −000083 (0.00) −000095 (0.00) 21255
000764 −000040 (0.00)Dividends + repurchases/net income 006627 001219 (0.00) 000695 (0.00) 21021
005137 000360 (0.00)
Panel B: Data aggregated by control threatCapital expenditures over total assets 000811 −000076 (0.00) −000099 (0.00) 202
000682 −000056 (0.00)Adjusted investment ratio 000637 −000013 (0.79) — 189
000555 −000068 (0.02)Long-term debt over total assets 001967 000391 (0.00) 000358 (0.00) 202
001781 000113 (0.00)Total debt over total assets 002387 000447 (0.00) 000389 (0.00) 202
002229 000219 (0.00)Cash over total assets 000887 −000080 (0.00) −000053 (0.02) 202
000610 −000063 (0.00)Free cash flow over total assets 000753 −000092 (0.00) −000088 (0.00) 202
000791 −000056 (0.00)Dividends + repurchases/net income 006328 001382 (0.00) 000654 (0.07) 202
004061 000307 (0.00)
Notes. The peer firms are obtained from the Earnings Supplement of the Standard and Poor’s Industry Surveys. Means are listed in the first line. Medians arelisted in the second line. The means and medians are averaged over two years before and after the takeover attempt. A t-test is performed to compare means,taking into account the lack of independence of the observations. A sign test is performed to compare medians. The p-values of these tests are in parentheses.The adjusted change after takeover attempt (column (iii)) is computed as the coefficient on the After dummy variable in the following panel regression:
Ratio it = bXit + c After it + eit 1
where Ratioit is the ratio being studied for each firm i at time t , Xit is a vector of control variables, b is a vector of regression coefficients on the controlvariables, and Afterit is a dummy variable that takes on the value of 1 in the years after the completion or withdrawal of the hostile takeover and 0 otherwise,and c is the coefficient on the After dummy. We estimate the above model for the three years prior and three years after the takeover attempt. Standard errorsare clustered at the transaction level, and the associated p-values are reported in parentheses. Appendix B contains a list of the control variables employed.In panel A, we report results for individual observations. In panel B, we first average all observations by control threat before averaging across control threatsand before estimating the regressions.
maintained this ratio at the pre-control threat level;this amounts to $57.9 billion across all peers.
The above measure of investment relies only onregular capital expenditures. It does not includeacquisition spending or research and development(R&D). Furthermore, it does not take into account thatsome capital spending is necessary to replace existingassets or that firms may sell some equipment dur-ing the year. The adjusted investment ratio, proposedby Richardson (2006), takes these potential omissionsinto account. It is computed as (capital expenditures +
cash acquisitions + R&D expenditures − sale of property,plant, and equipment (PP&E) − depreciation)/assets. Ourresults using this variable, reported in the second rowof panel A of Table 2, are very similar: both the meanand median levels of investment decline over the twoyears after the announcement of a hostile takeoverattempt in the industry.
Next we study the peers’ debt levels. Grossmanand Hart (1982), Jensen (1986), and Lambrecht andMyers (2007), among others, argue that debt can limita firm’s ability to engage in non-value-maximizing
Dow
nloa
ded
from
info
rms.
org
by [
163.
119.
134.
226]
on
24 F
ebru
ary
2014
, at 0
3:44
. Fo
r pe
rson
al u
se o
nly,
all
righ
ts r
eser
ved.

Servaes and Tamayo: How Do Industry Peers Respond to Control Threats?386 Management Science 60(2), pp. 380–399, © 2014 INFORMS
activities. If the peers want to signal their commit-ment to cutting excess investment, we expect themto increase leverage. Consistent with this prediction,we find a significant increase in leverage. Peers havea mean ratio of long-term debt to total assets of20.34% in the two years prior to the control threat.In the two years after completion or withdrawal ofthe takeover, this ratio increases by 2.73 percent-age points, on average (p-value = 0000). Total debt(computed as long-term debt plus debt in currentliabilities) to assets also increases substantially, from24.52%, on average, to 27.99% (p-value = 0.00), anincrease in the ratio of over 14%. Summed across allfirms, this implies extra borrowing of $435 billion,compared to what it would have been had the ratioremained unchanged.
One concern with expressing debt as a fraction ofassets is that leverage will also appear to increaseas asset growth declines, which is likely given thedecline in investment. Indeed, we find that the growthrate in assets declines by 1.61 percentage points(p-value = 0000) after the control threat (untabulatedresults). Therefore, we also compute three other mea-sures of leverage. First, we compute the growth rate inthe level of total debt; this increases by 4.3 percentagepoints (p-value = 0000) after the control threat. Sec-ond, we compute the raw change in the level of debt;this increases from $1.19 billion for the average firmin the year before the control threat to $1.66 billiontwo years afterward. Third, we compute the ratio oflong-term debt issuance to assets (data on short-termdebt issuance are not available); this ratio increasesby 1.32 percentage points after the control threat, anincrease of almost 22% compare to the level of 6.09%in the two years before the control threat. This evi-dence indicates substantial extra borrowing.
Another way of committing to lower capital spend-ing is to reduce cash holdings, and we find evidenceof such a reduction for the target firms’ peers. Cashholdings decline by 0.72 percentage points as a frac-tion of assets, on average. In addition, we expectto see a decline in the level of free cash flow rel-ative to assets, and find that this is also the case.We measure the level of free cash flow as operat-ing income minus interest payments minus tax pay-ments minus dividend payments (Lehn and Poulsen1989), as a proxy for post-tax cash flow that is notdistributed to securityholders as either interest or div-idend payments. The level of free cash flow to assetsdeclines by 0.83 percentage points. Both the cash andfree cash flow declines are economically large: thepercentage decline in cash holdings is 8.1% (from apre-control threat level of 8.87%), and the percentagedecline in free cash flows is 11.1% (from a pre-controlthreat level of 7.48%). Both of these results support
the view that the peer firms reduce the funds avail-able for investment.10
If the peer firms cut capital expenditures and cashbalances, and increase leverage, it is likely that theyare increasing distributions to shareholders. To verifywhether this is the case, we add dividend payments toshare repurchases and divide this sum by net income,only for those observations for which net incomeexceeds zero.11 As reported in panel A of Table 2, thisratio increases after the control threat by more than12 percentage points, on average, whereas the medianincrease is 3.6 percentage points.12
One potential shortcoming of the above analysisis that we make no adjustments for changes in thefirm’s fundamentals over time. Thus, it is possiblethat the changes we document are not caused by thetakeover attempt, but rather by changes in firm char-acteristics. To investigate this possibility, we employa regression framework and estimate the followingpanel regression:
Ratioit = bXit + cAfterit + eit1 (1)
where Ratioit is the ratio being studied for each firm iat time t, Xit is a vector of control variables, b is avector of regression coefficients on the control vari-ables, Afterit is a dummy variable that takes on thevalue of 1 in the years after the completion or with-drawal of the hostile takeover and 0 otherwise, andc is the coefficient on the After dummy. We esti-mate the above model for the three years prior andthree years after the takeover attempt (using twoyears provides the same insights). The explanatoryvariables employed depend on the specific ratio beingstudied and are based on prior research (they arereported in Appendix B). The coefficient on After isreported in column (iii) of panel A of Table 2, togetherwith its p-value, based on standard errors clustered atthe transaction level. The findings of these analysesthat control for changes in firm characteristics con-firm our prior results: after a hostile takeover attempttakes place in an industry, peer firms cut investment,
10 The decline in the cash holdings of the peer firms in our samplealso leads to a decline in total assets. This will lead to a slightupward bias in any ratio that uses total assets as a deflator, andmay explain why we find an increase in leverage ratios of the firmsin our sample. We repeat all our tests using total assets minus cashas a deflator, and the economic and statistical significance of ourfindings is virtually unchanged.11 Net income is most often employed to scale payouts in the liter-ature (see, e.g., Dittmar 2000, Almeida et al. 2004, Billet and Xue2007). We continue to find evidence of a significant increase in pay-outs when we scale by total assets instead.12 There is virtually no change in these effects if we remove spe-cial dividends from the analysis. Median payout ratios increaseby 3.84 percentage points, and mean payout ratios increase by12.29 percentage points.
Dow
nloa
ded
from
info
rms.
org
by [
163.
119.
134.
226]
on
24 F
ebru
ary
2014
, at 0
3:44
. Fo
r pe
rson
al u
se o
nly,
all
righ
ts r
eser
ved.

Servaes and Tamayo: How Do Industry Peers Respond to Control Threats?Management Science 60(2), pp. 380–399, © 2014 INFORMS 387
cash holdings, and free cash flows, and commit to thisreduction in investment by increasing leverage andpayouts. Thus, changes in firm characteristics cannotexplain the changes we observe.13
In panel B of Table 2, we repeat the analyses ofpanel A, but we aggregate the data by control threatso that each control threat receives the same weight.Hence, we first compute the average of each ratiofor each control threat, before computing the aver-age across control threats. This approach also allowsus to compute test statistics for median changesthat are not affected by the lack of independenceof the observations. In general, the changes reportedin column (ii) of panel B are more substantial thanthose documented in panel A, and they continue tobe highly significant, both statistically and economi-cally. For example, the decline in capital spending of0.76 percentage points from a level of 8.11% beforethe control threat represents a cut in investmentof 9.4%.
When controlling for the changes in characteristicsof the peer firms, we employ a similar approach. Bycontrol threat, we first average all ratios and explana-tory variables for each of the three years beforeand after the threat. Then, we estimate the panelregressions.14 The findings, reported in column (iii) ofpanel B of Table 2, continue to hold.15
The fact that our findings strengthen in panel Bwhere each takeover attempt receives the sameweight indicates that peer firms are more affectedin concentrated industries, possibly because thetakeover threat is more severe when there are fewerpotential targets. We formally tests for such a relationand find that this is indeed the case: all the changesin financial and operating characteristics are signifi-cantly larger in more concentrated industries.
In sum, the findings in Table 2 indicate that thepeer firms reduce capital spending and funds under
13 Note that in the reported models we do not control for cash flowsin the investment regressions (see Fazzari et al. 1988), because cashflows could proxy for many factors: financial constraints, invest-ment opportunities, and the opportunity to overinvest. Given ourconcern that peer firms may overinvest free cash flows, we wouldremove this effect if cash flows are controlled for. Our findingsare very similar, however, if we control for free cash flow: capi-tal expenditures as a fraction of assets decline by 0.70 percentagepoints (p-value = 0000), after controlling for q and free cash flows.14 Note that we are unable to conduct this analysis for the adjustedinvestment ratio because the explanatory variables include yeardummies—averaging these across time is not meaningful.15 We have also repeated this analysis for dividends and repur-chases scaled by assets instead of net income. This ratio increasesby 0.43 percentage points (p-value = 0000) when we equally weightall peers, and by 0.54 percentage points (p-value = 0000) when wefirst average characteristics for each control threat before estimatingthe regression model.
Table 3 Cross-Sectional Analysis of Changes in Investment Policies
(i) (ii)
Intercept −000052 (0.00) 000013 (0.20)Industry adj. investment −005192 (0.00)Industry adj. investment if > 0 −007143 (0.00)Industry adj. investment if < 0 −001975 (0.00)N 2,466 2,466Adjusted R2 0.22 0.25
Notes. The dependent variable is the change in capital expenditures, com-puted as the difference between the ratio of capital expenditures to totalassets over the two years after the completion or withdrawal of the takeoverattempt and the same ratio over the two years before the announcementof the takeover attempt. The explanatory variable is industry adjusted-investment (and the split-up of this variable into its positive and negativeparts) computed over the two years before the announcement of the takeoverattempt. The p-values based on standard errors clustered at the transactionlevel are reported in parentheses.
managerial control, and commit to such a reductionin the future by increasing leverage.16
Next, we investigate whether the firms that expe-rience the largest reduction in capital spending sur-rounding the years of the control threats are the oneswith the largest levels of prior excess investment. Weestimate a regression of the change in investment afterthe control threat as a function of industry-adjustedinvestment before the control threat. The findings arereported in Table 3. We compute clustered standarderrors in the regressions to take into account the lackof independence of observations related to the samecontrol threat. Column (i) shows the basic regres-sion model. The coefficient on industry-adjusted cap-ital expenditures before the takeover is negative andhighly significant. This is consistent with our pre-diction: peer firms that (over)invest the most beforethe control threat cut investment the most after-ward. Of course, it is possible that capital spend-ing is just mean reverting and that firms that investa lot in one period invest less in the followingperiod and vice versa. To see whether this explana-tion is valid, we reestimate this model, but divideindustry-adjusted capital expenditures into its posi-tive and negative parts. The results are reported incolumn (ii). The coefficient on industry-adjusted cap-ital expenditures is −0.71 (p-value = 0000) when it ispositive, and only −0.20 (p-value = 0000) when it isnegative. The difference between the two coefficientsis highly significant. This result indicates that thechange in investment spending is not simply caused
16 We have also studied the level and the quality of the acquisitionsmade by the peer firms in our sample (using acquisition announce-ments from SDC). We do not find any significant differences in thelevel of acquisitions made by the peer firms or their announcementeffect before and after the hostile takeover attempt. Thus, the cutin investment that we document does not appear to extend itselfto acquisitions.
Dow
nloa
ded
from
info
rms.
org
by [
163.
119.
134.
226]
on
24 F
ebru
ary
2014
, at 0
3:44
. Fo
r pe
rson
al u
se o
nly,
all
righ
ts r
eser
ved.

Servaes and Tamayo: How Do Industry Peers Respond to Control Threats?388 Management Science 60(2), pp. 380–399, © 2014 INFORMS
by mean reversion, because it is much stronger forfirms with high levels of investment than for firmswith low levels of investment. We obtain very simi-lar results when we employ the adjusted investmentratio (instead of the ratio of capital expenditures toassets) or when we compute overinvestment as theresidual of a regression model of optimal investmentestimated for all firms on Compustat, except for oursample firms, using the explanatory variables detailedin Appendix B.
We also explore whether the peer firms that do notadjust their policies in response to the takeover threatbecome targets in hostile takeovers themselves. Wefocus on those peers that are the subject of a hostiletakeover attempt three to five years after the originaltakeover threat.17 This sample consists of 57 firms.We find little evidence that these peers change theirpolicies (not reported in a table); there is no signif-icant decline in capital spending and cash holdingsand no significant increase in long-term debt. We dofind that they increase short-term debt to finance anincrease in payouts, which leads to a decline in freecash flow. This evidence suggests that there is anincreased takeover threat for those firms that do notadjust their behavior sufficiently.
Altogether, the results of this section demonstratethat the target’s peers change their financing, invest-ment, and payout policies. Not only do we find thatthe peers reduce capital spending and free cash flows,but the reductions in capital spending come mostlyfrom firms that were overinvesting (relative to theirindustry) to begin with.
4.2. Adoption of Takeover DefensesThe evidence presented up to this point is consis-tent with the view that actions taken by the man-agers of the peer firms in response to the hostiletakeover threat are in the best interest of sharehold-ers and reduce the level of agency costs in the firm.However, some managers who value control may alsodecide to adopt takeover defenses instead of (or inaddition to) the activities we just documented. Suchactions would not reduce agency problems, but fur-ther entrench management. This is what we explorein this section.
To determine the extent to which firms insulatethemselves from takeover attempts, we employ thegovernance index (G-index) developed by Gomperset al. (2003) and the entrenchment index (E-index)developed by Bebchuk et al. (2009). These indicesare constructed from the database maintained by the
17 As we mentioned previously, we do not study the peers thatreceive a takeover attempt over the two year period after the orig-inal takeover threat because we have little or no post-threat dataavailable for most of these firms.
Investor Responsibility Research Center (IRRC). Thedatabase contains details on 24 corporate governanceprovisions for approximately 1,500 U.S. firms. TheG-index is constructed by adding one for every pro-vision that reduces shareholder rights, whereas theE-index is the sum of six of the key governance provi-sions (staggered boards, limits to shareholder by-lawamendments, supermajority requirements for merg-ers, supermajority requirements for charter amend-ments, poison pills, and golden parachutes). Althoughnot every provision is directly related to an increasein takeover defenses, many of them are; these indicesare therefore good measures of the obstacles facedby a firm interested in acquiring a company with-out the approval of target management (see Bebchucket al. 2009).18
Because data on the indices are available only forS&P 1500 companies and only every two or three yearsstarting in 1990, we are only able to study this issue fora subset of our sample. We gather data on the G- andE-indices in the last available year before the takeoverthreat and in the first available year after its comple-tion or withdrawal. We compute the change in the rawindices as well as the economy-adjusted indices, com-puted as the level of the index minus the average levelof all firms on the database. This adjustment controlsfor any time trends in the overall adoption of takeoverdefenses.
Table 4 contains the results. The unadjusted G-indexincreases by 0.34, on average, over the period of thecontrol threat, from 9.31 to 9.65. The median change iszero, but the G-index increases for 236 firms, whereasit decreases for only 65 firms. Thus, the sign test rejectsthe null that the median change in the G-index iszero. Studying the E-index yields similar insights: boththe mean and median E-index increase significantly.The results are also similar when we focus on theindices adjusted for economy-wide changes; in fact,the changes in the adjusted G-index are somewhatlarger.19 These changes suggest that peer companiesattempt to make it more difficult to be taken over.Note, however, that the increase in takeover defensesis relatively small economically, probably becauseincreasing takeover defenses often requires share-holder approval, which may be difficult to obtain.Thus, although managers wanting to remain in controlmay prefer insulating themselves from disciplinary
18 Several articles have studied the relationship between various ele-ments of the G-index and the incidence of, and returns associatedwith, takeovers and find a weak relation at best (see, e.g., Coreet al. 2006, Bates et al. 2008). However, these articles focus on alltakeover activity rather than disciplinary takeovers.19 We have also investigated whether the peer firms are more likelyto adopt a classified board, which is considered to be a particularlypowerful takeover defense (see, e.g., Bebchuk et al. 2009), but findno evidence that this is the case.
Dow
nloa
ded
from
info
rms.
org
by [
163.
119.
134.
226]
on
24 F
ebru
ary
2014
, at 0
3:44
. Fo
r pe
rson
al u
se o
nly,
all
righ
ts r
eser
ved.

Servaes and Tamayo: How Do Industry Peers Respond to Control Threats?Management Science 60(2), pp. 380–399, © 2014 INFORMS 389
Table 4 Adoption of Takeover Defenses by Peer Firms
Last available year Change after takeover Number Number Numberbefore the control threat attempt (p-value) increase unchanged decrease Total
G-index 9031 0.34 (0.00) 236 434 65 7359000 0.00 (0.00)
E-index 2001 0.20 (0.00) 161 538 36 7352000 0.00 (0.00)
Adjusted G-index 0014 0.54 (0.00) 479 0 256 7350006 0.52 (0.00)
Adjusted E-index −0005 0.17 (0.00) 402 0 333 735−0003 0.03 (0.00)
Notes. The G-index is based on Gompers et al. (2003), who gathered data from IRRC on 24 specific corporate governance provisions. The adjusted G-index isthe index adjusted each year by the average for all firms on the IRRC database. The E-index is based on Bebchuk et al. (2009). The adjusted E-index is adjustedeach year by the average for all firms on the IRRC database. The first number is the mean, followed by the median. The p-value refers to a t-test of significancefor changes in means and a sign test of significance for changes in medians. The p-value for the t-test is adjusted to reflect the lack of independence ofobservations associated with the same takeover threat.
takeovers altogether, this outcome may not be feasi-ble. As a result, they are forced to make the changesin financing and investment decisions documentedpreviously.
We have also studied whether the responses docu-mented in Table 2 are related to the level and changein takeover protection documented in Table 4. We findevidence that both measures of investment declinesubstantially less when firms have a higher E-indexbefore the bid (not reported in a table), but this resultdoes not hold when we replace the E-index by thebroader G-index. The other variables are not affectedby prebid takeover defenses. This evidence suggeststhat takeover defenses have some—but limited—impact on the peers’ response to takeover threats.20
In §5.1, we specifically study whether the response isdifferent for firms with dual-class shares outstanding.
4.3. Event-Study EvidenceAs discussed in §2, the agency cost hypothesis alsohas implications for the stock price reaction of the tar-gets’ peers at the announcement of the control threat.We expect the stock price reaction for the peers to bepositive, and more so for the peers with the highestlevels of overinvestment and free cash flows prior tothe control threat.
We focus on the abnormal returns computed overthe five-day window starting two days before theannouncement date. It is important to use a short win-dow to maximize the signal-to-noise ratio. The dis-advantage is that not all relevant information withrespect to the transaction may be released over thisperiod. To compute abnormal returns, we subtract thereturn on the value-weighted Center for Research in
20 We have also studied whether the changes we document arerelated to blockholder ownership (as in Denis and Serrano 1996)for those firms in our sample that overlap with the blockholderdatabase constructed by Dlugosz et al. (2006), but we do not findthat this is the case.
Security Prices (CRSP) index from the peer returns. Toavoid problems with outliers, we winsorize abnormalreturns at the 1st and 99th percentiles.
Panel A of Table 5 contains the results. Summarystatistics are displayed in panel A. Returns for peerfirms are 0.50%, on average, with a median of 0.28%.In the second row of panel A, we aggregate abnormalreturns by control threat and report that peer returnsincrease to 0.73%, on average, with a median of 0.41%.These returns are quite substantial, given that theyaccrue to a large number of firms. They are also con-sistent with our predictions.
In panel B of Table 5, we study whether the abnor-mal returns depend on the peers’ investment and freecash flow levels prior to the takeover announcements.We split the firms into two groups depending onwhether investment levels or free cash flows are highor low. For free cash flows, the split-up is based onthe median raw level of free cash flow for the firms inour sample (7.46%). For investment levels, we adjustfor investment opportunities, based on the explana-tory variables described in Appendix B. In particular,we use the following procedure. First, we estimatemodels of investment for all firms on Compustat,excluding our sample firms, in the two years prior tothe takeover announcement. Second, using the coeffi-cients from these regressions, we predict investmentfor our sample firms in those two years. Third, wecompute excess investment as the difference betweenactual and predicted investment for these years andset investment equal to high (low) if this difference ispositive (negative).
For each variable we first report the mean abnor-mal return and then the median (p-values arereported in parentheses). Average and median abnor-mal returns are always positive and significant forfirms with high levels of excess investment and freecash flows. For example, firms with high levels of(over)investment have average (median) abnormal
Dow
nloa
ded
from
info
rms.
org
by [
163.
119.
134.
226]
on
24 F
ebru
ary
2014
, at 0
3:44
. Fo
r pe
rson
al u
se o
nly,
all
righ
ts r
eser
ved.

Servaes and Tamayo: How Do Industry Peers Respond to Control Threats?390 Management Science 60(2), pp. 380–399, © 2014 INFORMS
Table 5 Peer Firm Abnormal Returns Around the Control Threat Announcement
Panel A: Summary statistics
Mean (p-value) Median (p-value) N
Individual observations 0.50% (0.00) 0.28% (0.00) 2,450Aggregated by control threat 0.73% (0.00) 0.41% (0.00) 202
Panel B: Cross-sectional analysis of abnormal returns
High Low Difference
Capital expenditures over total assets 0.67% (0.00) 0.32% (0.01) 0.35% (0.07)0.46% (0.00) 0.09% (0.24) 0.37% (0.10)
Adjusted investment ratio 0.59% (0.00) 0.30% (0.05) 0.29% (0.20)0.45% (0.01) 0.01% (0.94) 0.44% (0.16)
Free cash flow 0.70% (0.00) 0.24% (0.07) 0.46% (0.01)0.48% (0.00) −0.03% (0.78) 0.51% (0.01)
Notes. Abnormal returns are computed as market-adjusted returns over the five-day period starting two days before the announcement of the takeover attempt.In panel A, the p-value after the mean refers to a t-test of equality of this abnormal return to zero. The t-test is based on standard errors adjusted for the lackof independence of observations related to the same control threat. The p-value after the median refers to a sign test of equality of the median to zero. PanelB contains averages according to several subdivisions of the sample. We split the firms into two groups depending on whether investment levels or free cashflows are high or low. For free cash flows, the split-up is based on the median raw level of free cash flow for the firms in our sample (7.46%). For investmentlevels, we adjust for investment opportunities, based on the explanatory variables described in Appendix B using the following procedure: (i) we estimatemodels of investment for all firms on Compustat, excluding our sample firms, in the two years prior to the takeover announcement; (ii) using the coefficientsfrom these regressions, we predict investment for our sample firms in those two years; (iii) we compute excess investment as the difference between actualand predicted investment for these years and set investment equal to high (low) if this difference is positive (negative).
returns of 0.67% (0.46%). In contrast, the abnormalreturns are lower and often insignificant for firmswith low levels of investment and free cash flows.Moreover, the difference between the two is statisti-cally significant for the majority of comparisons.
Overall, the event-study evidence is consistentwith our predictions: the peer firms gain whenthe takeover is announced, and the extent of thegain depends on their investment policies before thetakeover threat.21
4.4. Changes in PerformanceUp to this point, our emphasis has been on document-ing changes in firm policies caused by the takeoverattempt. Next, we study whether these changes trans-late into improved performance. We employ two met-rics of performance, one based on stock returns, andone based on firm valuation. To compute stock mar-ket performance, we employ monthly returns for thethree year period before and the three year period
21 We have also studied whether the stock price response dependson the peer firms’ takeover defenses. Abnormal returns are lowerfor peer firms with more takeover defenses in place, but theeffect is only significant for firms with a classified board. The lackof significance may be due to two counteracting effects. Firmswith fewer takeover defenses in place may experience a higherstock price response because they are less insulated from takeoverthreats. On the other hand, because they were less insulated froma takeover attempt before the control threats, they were also lessable to engage in non-value-maximizing behavior to begin with.
after the takeover announcement. We then estimatethe following panel regression:
Rit −Rfit = �+�after × Afterit +�× Factorit + �it1 (2)
where Rit is stock i’s return in month t, Factorit is a(3 × 1) vector of the Fama–French three-factor port-folio returns (excess market return, small minus big(SMB), and high minus low book-to-market (HML))in month t, Rfit is the risk-free rate in month t, andAfterit is an indicator variable equal to 1 when montht is after the takeover announcement or equal to 0 oth-erwise. The risk-free rate, factor returns, and Afterdummy variable are all indexed by i and t becausethey pair up with security i’s return in month t, wheret = 6−361+367. The intercept in this regression (�)captures the average abnormal performance of oursample firms before the takeover attempt, whereas�after, the coefficient on the After dummy, captures thechange in abnormal stock price performance after theattempt. We estimate this model with standard errorsclustered by calendar time.
The results are reported in panel A of Table 6. Thereis some evidence suggestive of poor abnormal stockprice performance (−0.16% per month) in the threeyears prior to the takeover announcement. After thetakeover attempt, abnormal stock returns improve by0.26% per month for the following three years. Thistranslates into more than 9% over three years, whichis quite substantial. We also examine whether thefirms’ factors loadings change around the takeoverthreat and find a small increase in their market beta,
Dow
nloa
ded
from
info
rms.
org
by [
163.
119.
134.
226]
on
24 F
ebru
ary
2014
, at 0
3:44
. Fo
r pe
rson
al u
se o
nly,
all
righ
ts r
eser
ved.

Servaes and Tamayo: How Do Industry Peers Respond to Control Threats?Management Science 60(2), pp. 380–399, © 2014 INFORMS 391
Table 6 Post-Takeover Performance of Peer Firms
Panel A. Calendar time regression of peer firm returns
Coefficient (p-value)
Intercept −0016 (0.13)After takeover attempt 0.26 (0.05)Rm–Rf 1.08 (0.00)SMB 0.39 (0.00)HML 0.35 (0.00)Adjusted R2 0.19N 200,079
Panel B. Tobin’s q
(i) (ii)
Intercept 3066 (0.00) 3031 (0.00)Target industry dummy −0015 (0.00) −0007 (0.00)Target industry dummy ∗ 0013 (0.00) 0011 (0.00)
After takeover attemptLog age −0061 (0.00) −0047 (0.00)Industry dummies No YesAdjusted R2 0.05 0.10N 227,665 227,651
Notes. Panel A contains an analysis of changes in abnormal returns, basedon the following panel regression:
Rit −Rfit = �+ �After ×After it + �× Factor it + �it 1
where Rit is stock i ’s return in month t , Factorit is a (3 × 1) vector of theFama–French three-factor portfolio returns (excess market return, SMB, andHML) in month t , Rfit is the risk-free rate in month t , and Afterit is an indi-cator variable equal to 1 when month t is after the takeover announcementor equal to 0 otherwise. The risk-free rate, factor returns, and After dummyvariable are all indexed by i and t because they pair up with security i ’sreturn in month t , where t = 6−361+367. The intercept in this regression (�)captures the average abnormal performance of our sample firms before thetakeover attempt, whereas �After , the coefficient on the After dummy, capturesthe change in abnormal stock price performance after the attempt. Stan-dard errors are clustered in calendar time, and the associated p-values arereported in parentheses.
Panel B contains an analysis of changes in valuation, proxied by Tobin’s qusing the following panel regression:
Tobin ′s q it = �+ �14Target Industry 5it + �24Target Industry After 5it+ �34Log Firm Age 5it + �it 1
where Target Industryit is a dummy variable set equal to 1 if the firm is inan industry that will experience a hostile takeover within the next three yearsor has experienced a hostile takeover over the previous three years; TargetIndustry Afterit is a dummy variable set equal to 1 if the firm is in an industrythat has experienced a hostile takeover attempt over the previous three years;Firm Age is measured as the number of years since the firm has been listedon CRSP or Compustat, whichever is earlier. Industry dummies are basedon the 48 Fama–French industries. Standard errors are clustered at the firmlevel, and the associated p-values are reported in parentheses.
but this change does not affect our inferences (notreported in the table).22
22 We have also estimated abnormal returns using an alternativeapproach (as in Grullon and Michaely 2004) in which we firstestimate Equation (2) separately for each firm (requiring at least24 observations per firm), then compute the average of the regres-sion coefficients across firms, and, finally, test whether the average
In panel B, we study the evolution of the peers’q ratios around the takeover attempt. The q ratiois computed as (book value of assets − book value ofequity − deferred taxes + market value of equity)/bookvalue of assets. We employ all firms on Compustat andestimate the following panel regression:
Tobin′s qit
=�+�14Target Industry5it +�24Target Industry After5it
+�34Log Firm Age5it +�it1 (3)
where Target Industryit is a dummy variable set equalto 1 if the firm is in an industry that will experi-ence a hostile takeover attempt within the next threeyears or has experienced a hostile takeover attemptover the previous three years; Target Industry Afteritis a dummy variable set equal to 1 if the firm is inan industry that has experienced a hostile takeoverattempt over the previous three years; Firm Age ismeasured as the number of years since the firm hasbeen listed on CRSP or Compustat, whichever is ear-lier. We control for age because q and age are nega-tively related (Loderer and Waelchli 2010). Standarderrors in this analysis are clustered at the firm level.
The results are reported in column (i) of panel Bof Table 6. The average q ratio of firms in industrieswith hostile takeover attempts is 0.15 below that ofother Compustat firms. This evidence confirms theoriginal work by Morck et al. (1988, 1989). After thehostile takeover, however, this effect reverses; q ratiosincrease by 0.13, and they are no longer below thoseof other firms in the economy. In model (ii), we con-firm that these results still hold even when control-ling for the 48 Fama–French industries. Thus, evenafter removing the differences in performance due tomembership of broad industry groups, we continueto find performance improvements for the firms inour sample.
Overall, the evidence reported in Table 6 indicatesthat the firms in our sample perform poorly in theyears running up to the hostile takeover; after thetakeover attempt, performance improves significantly,which indicates that the changes in investment andfinancing decisions documented previously are valueincreasing.
The evidence on poor returns and low valuationsof the peers prior to the control threat also supportsrecent work by Edmans et al. (2012), who suggestthat low valuations increase the likelihood of acqui-sitions. Their work supports our conjecture that peerfirms face a credible increase in the probability of
is significantly different from zero, taking into account the lack ofindependence of observations related to the same control threat.Using this approach, we find improvements in performance afterthe acquisition of 0.28% per month (p-value = 0001).
Dow
nloa
ded
from
info
rms.
org
by [
163.
119.
134.
226]
on
24 F
ebru
ary
2014
, at 0
3:44
. Fo
r pe
rson
al u
se o
nly,
all
righ
ts r
eser
ved.

Servaes and Tamayo: How Do Industry Peers Respond to Control Threats?392 Management Science 60(2), pp. 380–399, © 2014 INFORMS
being acquired unless they take actions to improvetheir valuations. We document such actions (Table 2)and show that valuations and stock returns improveas a result (Table 6). Edmans et al. (2012) do pointout a countervailing feedback effect: if the increasedlikelihood of a takeover is anticipated by financialmarkets, this would increase valuations, which could,in turn, reduce the likelihood of a takeover. However,they suggest that this “anticipation effect” is econom-ically modest. As discussed in §4.3, we find a stockprice increase of 0.50% for peer firms around theannouncement of the control threat, consistent withboth the expectation of a higher takeover likelihoodand/or a reduction in non-value-maximizing behav-ior. Consistent with Edmans et al. (2012), however,we do not believe that this stock price increase alonewill deter many potential bidders. The subsequentimprovements in stock returns (9% over three years)and valuations (increase in q ratio by 0.13) docu-mented in Table 6, on the other hand, will likely deterfuture takeovers, which is what our sample firms areaiming for.
5. Alternative ExplanationsIn this section, we consider three alternative explana-tions for our findings and conduct a number of teststo see whether these explanations are supported bythe data.
5.1. Are the Firms in the Industry Responding toChanges in Industry Conditions?
In the previous section, we documented significantchanges in financing and investment policies sur-rounding the takeover attempt. In doing so, we madethe implicit assumption that the takeover attempt wasindeed the trigger for those changes and that thesechanges would not have occurred at that point with-out it.
In this section, we examine an alternative possi-bility, which is that the industry is simply evolvingtoward a new equilibrium and that the changes wedocument would have occurred at that time, evenwithout the control threat taking place (industry equi-librium hypothesis). For example, industry shocks maychange the optimal investment and financing poli-cies for all firms (e.g., Mitchell and Mulherin 1996,Harford 2005). Although a valid concern, we believethat this hypothesis is unlikely to explain our find-ings because we already control for changes in thefinancial characteristics of the firms in our sample insome specifications (column (iii) of panels A and B ofTable 2). To allay any remaining concerns, we conducttwo sets of tests.
First, we examine whether the peers in our sam-ple were acting optimally to start with, which is whatthe industry equilibrium hypothesis would predict, or
whether they behaved suboptimally, as predicted bythe agency costs hypothesis. It is in fact possible thatfirms acted optimally before the takeover attempt,but became inefficient afterward, perhaps because thetakeover attempt led to more short-termism.
To investigate this possibility, we examine the levelsof debt and capital expenditures of the target firms’peers before the takeover attempt. If most firms in theindustry suffered from free cash flow agency prob-lems, we would expect the firms in our sample tohave less debt and higher capital expenditures, onaverage, than optimal. As in our study of Tobin’s q,we employ all firms on Compustat and estimate thefollowing panel regressions:
Ratioit
=�+�14Target Industry5it +�24Target Industry After5it
+�4Control variables5it +�it1 (4)
where Ratioit is either a measure of investment or ameasure leverage (the ratios are the same as thosestudied in Table 2), the sets of control variablesemployed depend on the ratio and are described inAppendix B, � is the vector of coefficients on the con-trol variables, and Target Industryit and Target IndustryAfterit have been defined previously.
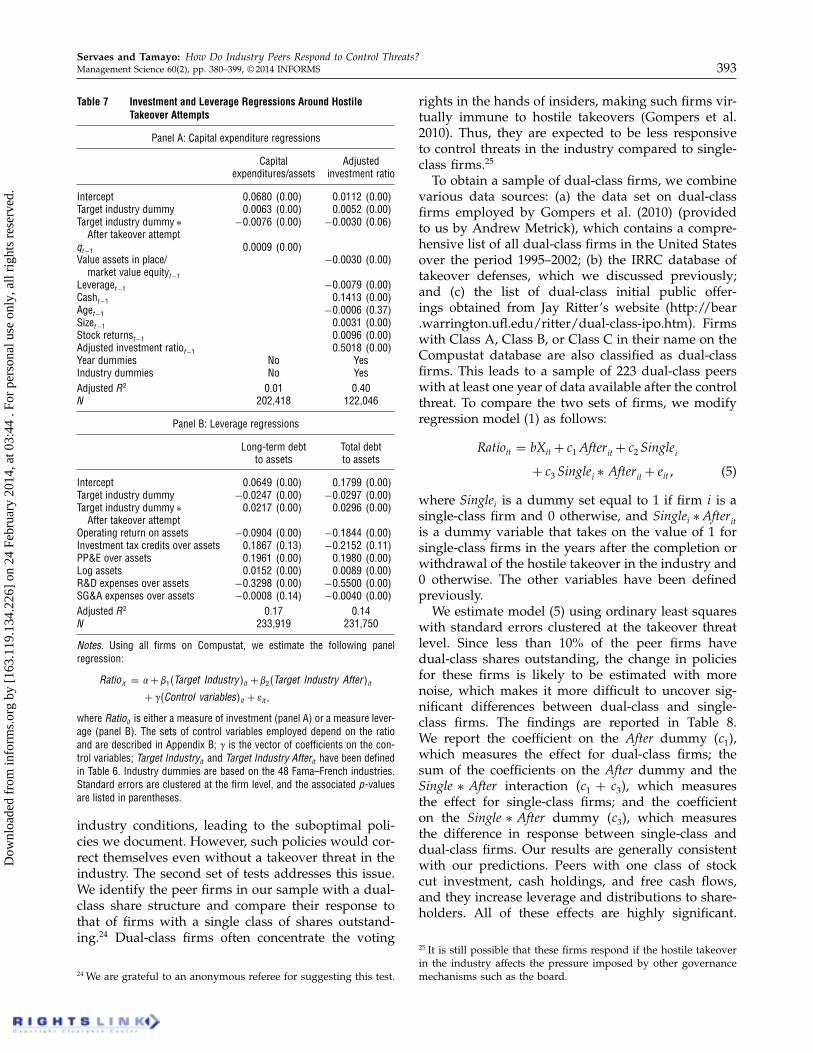
The results for our two investment measures arereported in panel A of Table 7. The results are striking.Both measures suggest that the peer firms were over-investing before the takeover attempt. Excess invest-ment is 0.63% for the regular capital expendituresmeasure and 0.52% for the adjusted measure. Afterthe takeover attempt, firms cut investment and botheffects reverse (by 0.76% for regular capital expen-ditures and 0.30% for adjustment investment); as aresult, we cannot reject that the peers in our samplebehave optimally after the control threat (the sum ofboth effects is not significantly different from zero).23
In panel B of Table 7, we study leverage. Theseregressions also point to suboptimal behavior beforethe control threat: long-term debt is more than twopercentage points below the optimal and total debt isalmost three percentage points lower. As was the casefor investment, these effects reverse after the controlthreat is announced, and any evidence of suboptimalbehavior disappears.
The results reported in Table 7 support the agencycost view and appear to be inconsistent with theindustry equilibrium hypothesis. Nevertheless, it couldstill be the case that firms take time to adjust to new
23 If we control for free cash flows in these models, then excessinvestment is 0.58% for regular capital expenditures and 0.75%for the adjusted measure, whereas the cut after the control threatis 0.72% for regular capital expenditures and 0.41% for adjustedinvestment.
Dow
nloa
ded
from
info
rms.
org
by [
163.
119.
134.
226]
on
24 F
ebru
ary
2014
, at 0
3:44
. Fo
r pe
rson
al u
se o
nly,
all
righ
ts r
eser
ved.
Servaes and Tamayo: How Do Industry Peers Respond to Control Threats?Management Science 60(2), pp. 380–399, © 2014 INFORMS 393
Table 7 Investment and Leverage Regressions Around HostileTakeover Attempts
Panel A: Capital expenditure regressions
Capital Adjustedexpenditures/assets investment ratio
Intercept 000680 (0.00) 000112 (0.00)Target industry dummy 000063 (0.00) 000052 (0.00)Target industry dummy ∗ −000076 (0.00) −000030 (0.06)
After takeover attemptqt−1 000009 (0.00)Value assets in place/ −000030 (0.00)
market value equityt−1Leveraget−1 −000079 (0.00)Casht−1 001413 (0.00)Aget−1 −000006 (0.37)Sizet−1 000031 (0.00)Stock returnst−1 000096 (0.00)Adjusted investment ratiot−1 005018 (0.00)Year dummies No YesIndustry dummies No YesAdjusted R2 0.01 0.40N 202,418 122,046
Panel B: Leverage regressions
Long-term debt Total debtto assets to assets
Intercept 000649 (0.00) 001799 (0.00)Target industry dummy −000247 (0.00) −000297 (0.00)Target industry dummy ∗ 000217 (0.00) 000296 (0.00)
After takeover attemptOperating return on assets −000904 (0.00) −001844 (0.00)Investment tax credits over assets 001867 (0.13) −002152 (0.11)PP&E over assets 001961 (0.00) 001980 (0.00)Log assets 000152 (0.00) 000089 (0.00)R&D expenses over assets −003298 (0.00) −005500 (0.00)SG&A expenses over assets −000008 (0.14) −000040 (0.00)Adjusted R2 0.17 0.14N 233,919 231,750
Notes. Using all firms on Compustat, we estimate the following panelregression:
Ratio it = �+ �14Target Industry 5it + �24Target Industry After 5it+ �4Control variables5it + �it 1
where Ratioit is either a measure of investment (panel A) or a measure lever-age (panel B). The sets of control variables employed depend on the ratioand are described in Appendix B; � is the vector of coefficients on the con-trol variables; Target Industryit and Target Industry Afterit have been definedin Table 6. Industry dummies are based on the 48 Fama–French industries.Standard errors are clustered at the firm level, and the associated p-valuesare listed in parentheses.
industry conditions, leading to the suboptimal poli-cies we document. However, such policies would cor-rect themselves even without a takeover threat in theindustry. The second set of tests addresses this issue.We identify the peer firms in our sample with a dual-class share structure and compare their response tothat of firms with a single class of shares outstand-ing.24 Dual-class firms often concentrate the voting
24 We are grateful to an anonymous referee for suggesting this test.
rights in the hands of insiders, making such firms vir-tually immune to hostile takeovers (Gompers et al.2010). Thus, they are expected to be less responsiveto control threats in the industry compared to single-class firms.25
To obtain a sample of dual-class firms, we combinevarious data sources: (a) the data set on dual-classfirms employed by Gompers et al. (2010) (providedto us by Andrew Metrick), which contains a compre-hensive list of all dual-class firms in the United Statesover the period 1995–2002; (b) the IRRC database oftakeover defenses, which we discussed previously;and (c) the list of dual-class initial public offer-ings obtained from Jay Ritter’s website (http://bear.warrington.ufl.edu/ritter/dual-class-ipo.htm). Firmswith Class A, Class B, or Class C in their name on theCompustat database are also classified as dual-classfirms. This leads to a sample of 223 dual-class peerswith at least one year of data available after the controlthreat. To compare the two sets of firms, we modifyregression model (1) as follows:
Ratioit = bXit + c1 Afterit + c2 Singlei+ c3 Singlei ∗ Afterit + eit1 (5)
where Singlei is a dummy set equal to 1 if firm i is asingle-class firm and 0 otherwise, and Singlei ∗ Afteritis a dummy variable that takes on the value of 1 forsingle-class firms in the years after the completion orwithdrawal of the hostile takeover in the industry and0 otherwise. The other variables have been definedpreviously.
We estimate model (5) using ordinary least squareswith standard errors clustered at the takeover threatlevel. Since less than 10% of the peer firms havedual-class shares outstanding, the change in policiesfor these firms is likely to be estimated with morenoise, which makes it more difficult to uncover sig-nificant differences between dual-class and single-class firms. The findings are reported in Table 8.We report the coefficient on the After dummy (c1),which measures the effect for dual-class firms; thesum of the coefficients on the After dummy and theSingle ∗ After interaction (c1 + c3), which measuresthe effect for single-class firms; and the coefficienton the Single ∗ After dummy (c3), which measuresthe difference in response between single-class anddual-class firms. Our results are generally consistentwith our predictions. Peers with one class of stockcut investment, cash holdings, and free cash flows,and they increase leverage and distributions to share-holders. All of these effects are highly significant.
25 It is still possible that these firms respond if the hostile takeoverin the industry affects the pressure imposed by other governancemechanisms such as the board.
Dow
nloa
ded
from
info
rms.
org
by [
163.
119.
134.
226]
on
24 F
ebru
ary
2014
, at 0
3:44
. Fo
r pe
rson
al u
se o
nly,
all
righ
ts r
eser
ved.
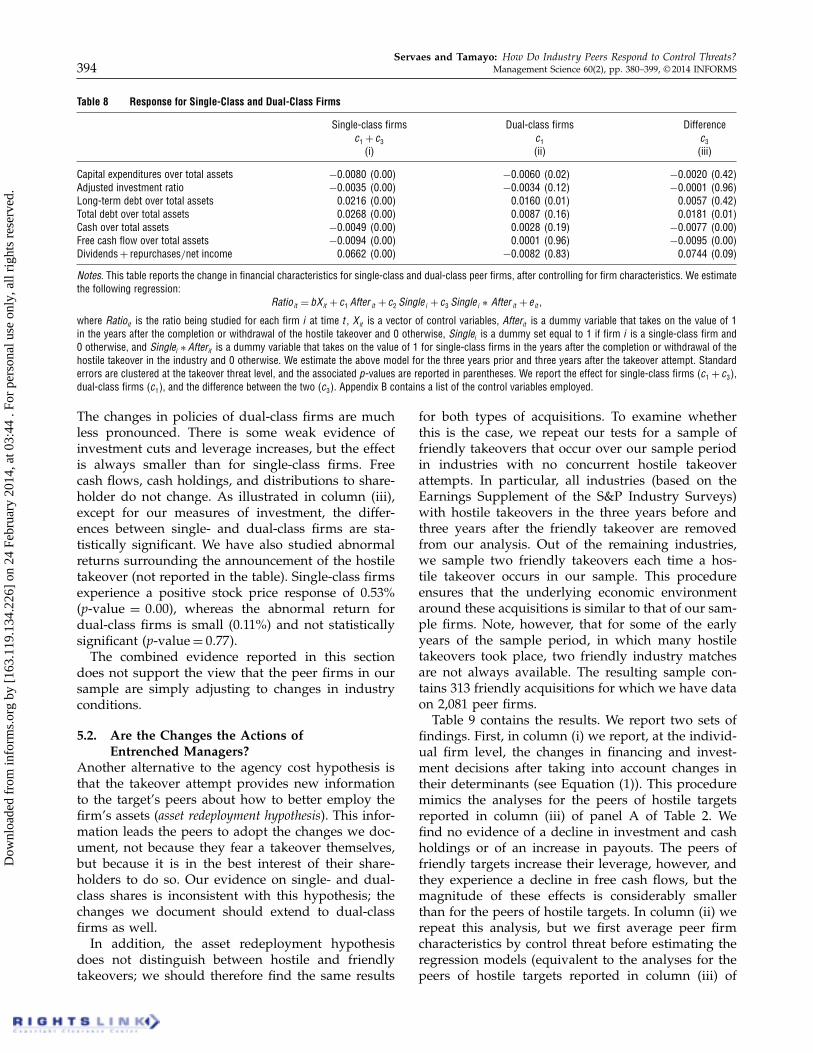
Servaes and Tamayo: How Do Industry Peers Respond to Control Threats?394 Management Science 60(2), pp. 380–399, © 2014 INFORMS
Table 8 Response for Single-Class and Dual-Class Firms
Single-class firms Dual-class firms Differencec1 + c3 c1 c3
(i) (ii) (iii)
Capital expenditures over total assets −000080 (0.00) −000060 (0.02) −000020 (0.42)Adjusted investment ratio −000035 (0.00) −000034 (0.12) −000001 (0.96)Long-term debt over total assets 000216 (0.00) 000160 (0.01) 000057 (0.42)Total debt over total assets 000268 (0.00) 000087 (0.16) 000181 (0.01)Cash over total assets −000049 (0.00) 000028 (0.19) −000077 (0.00)Free cash flow over total assets −000094 (0.00) 000001 (0.96) −000095 (0.00)Dividends + repurchases/net income 000662 (0.00) −000082 (0.83) 000744 (0.09)
Notes. This table reports the change in financial characteristics for single-class and dual-class peer firms, after controlling for firm characteristics. We estimatethe following regression:
Ratio it = bXit + c1 After it + c2 Single i + c3 Single i ∗ After it + eit 1
where Ratioit is the ratio being studied for each firm i at time t , Xit is a vector of control variables, Afterit is a dummy variable that takes on the value of 1in the years after the completion or withdrawal of the hostile takeover and 0 otherwise, Singlei is a dummy set equal to 1 if firm i is a single-class firm and0 otherwise, and Singlei ∗ Afterit is a dummy variable that takes on the value of 1 for single-class firms in the years after the completion or withdrawal of thehostile takeover in the industry and 0 otherwise. We estimate the above model for the three years prior and three years after the takeover attempt. Standarderrors are clustered at the takeover threat level, and the associated p-values are reported in parentheses. We report the effect for single-class firms (c1 + c3),dual-class firms (c1), and the difference between the two (c3). Appendix B contains a list of the control variables employed.
The changes in policies of dual-class firms are muchless pronounced. There is some weak evidence ofinvestment cuts and leverage increases, but the effectis always smaller than for single-class firms. Freecash flows, cash holdings, and distributions to share-holder do not change. As illustrated in column (iii),except for our measures of investment, the differ-ences between single- and dual-class firms are sta-tistically significant. We have also studied abnormalreturns surrounding the announcement of the hostiletakeover (not reported in the table). Single-class firmsexperience a positive stock price response of 0.53%(p-value = 0000), whereas the abnormal return fordual-class firms is small (0.11%) and not statisticallysignificant (p-value = 0077).
The combined evidence reported in this sectiondoes not support the view that the peer firms in oursample are simply adjusting to changes in industryconditions.
5.2. Are the Changes the Actions ofEntrenched Managers?
Another alternative to the agency cost hypothesis isthat the takeover attempt provides new informationto the target’s peers about how to better employ thefirm’s assets (asset redeployment hypothesis). This infor-mation leads the peers to adopt the changes we doc-ument, not because they fear a takeover themselves,but because it is in the best interest of their share-holders to do so. Our evidence on single- and dual-class shares is inconsistent with this hypothesis; thechanges we document should extend to dual-classfirms as well.
In addition, the asset redeployment hypothesisdoes not distinguish between hostile and friendlytakeovers; we should therefore find the same results
for both types of acquisitions. To examine whetherthis is the case, we repeat our tests for a sample offriendly takeovers that occur over our sample periodin industries with no concurrent hostile takeoverattempts. In particular, all industries (based on theEarnings Supplement of the S&P Industry Surveys)with hostile takeovers in the three years before andthree years after the friendly takeover are removedfrom our analysis. Out of the remaining industries,we sample two friendly takeovers each time a hos-tile takeover occurs in our sample. This procedureensures that the underlying economic environmentaround these acquisitions is similar to that of our sam-ple firms. Note, however, that for some of the earlyyears of the sample period, in which many hostiletakeovers took place, two friendly industry matchesare not always available. The resulting sample con-tains 313 friendly acquisitions for which we have dataon 2,081 peer firms.
Table 9 contains the results. We report two sets offindings. First, in column (i) we report, at the individ-ual firm level, the changes in financing and invest-ment decisions after taking into account changes intheir determinants (see Equation (1)). This proceduremimics the analyses for the peers of hostile targetsreported in column (iii) of panel A of Table 2. Wefind no evidence of a decline in investment and cashholdings or of an increase in payouts. The peers offriendly targets increase their leverage, however, andthey experience a decline in free cash flows, but themagnitude of these effects is considerably smallerthan for the peers of hostile targets. In column (ii) werepeat this analysis, but we first average peer firmcharacteristics by control threat before estimating theregression models (equivalent to the analyses for thepeers of hostile targets reported in column (iii) of
Dow
nloa
ded
from
info
rms.
org
by [
163.
119.
134.
226]
on
24 F
ebru
ary
2014
, at 0
3:44
. Fo
r pe
rson
al u
se o
nly,
all
righ
ts r
eser
ved.

Servaes and Tamayo: How Do Industry Peers Respond to Control Threats?Management Science 60(2), pp. 380–399, © 2014 INFORMS 395
Table 9 Changes in Characteristics of Peers of Firms Receiving a Friendly Takeover Bid
Adjusted change after Adjusted change aftertakeover attempt— takeover attempt—averaged
individual observations by takeover attempt(i) N (ii) N
Capital expenditures over total assets −000022 400265 2,036 −000032 400135 313Adjusted investment ratio −000005 400855 1,451 —Long-term debt over total assets 000119 400025 2,061 000156 400015 313Total debt over total assets 000157 400015 2,052 000191 400005 313Cash over total assets 000009 400735 2,081 −000004 400895 313Free cash flow over total assets −000046 400085 1,881 −000064 400015 313Dividends + repurchases/net income −000031 400865 1,826 −000030 400925 313
Notes. Adjusted change after takeover attempt—individual observations is computed as the coefficient on the After dummy variable in the following panelregression:
Ratio it = bXit + c After it + eit 1
where Ratioit is the ratio being studied for each firm i at time t , Xit is a vector of control variables, b is a vector of regression coefficients on the controlvariables, and Afterit is a dummy variable that takes on the value of 1 in the years after the completion or withdrawal of the friendly takeover and 0 otherwise,and c is the coefficient on the After dummy. We estimate the above model for the three years prior and three years after the takeover attempt. Appendix Bcontains a list of the control variables employed. Standard errors are clustered at the transaction level, and the associated p-values are reported in parentheses.To compute the Adjusted change after takeover attempt—averaged by takeover attempt, we first average all observations by control threat before estimatingthe regressions.
panel B of Table 2). The findings are similar to thoseof column (i): investment, cash holdings, and payoutsdo not change, but leverage increases, and free cashflows decline. We have also investigated whether thepeers of friendly targets invest more than predictedby our empirical model of investment or borrow lessthan predicted by our empirical model of leverage inthe years prior to the control threat, but do not findthis to be the case (not reported in a table for the sakeof brevity).26
These findings indicate that the peers of friendlytargets do not respond in a similar manner to thepeers of hostile targets, which is inconsistent with theasset redeployment hypothesis.
5.3. Are the Firms in the Industry Undervalued?Another alternative is that the takeover attempt sig-nals that the firms in the industry are undervalued(asset undervaluation hypothesis). We do not believe thatundervaluation can explain all of our results. Under-valuation is consistent with the positive stock pricereaction upon announcement of the control threat,and could also explain why firms increase borrow-ing, if firms set their leverage targets based on mar-ket values. Given the magnitude of the announcementeffect, however, the expected increase in borrowingwould be much smaller than the change we docu-ment. If the undervaluation is completely resolvedupon the announcement of the takeover threat, we donot expect other firm policies to change.
On the other hand, if the undervaluation is notcompletely resolved at the time of the announcement,
26 We have also studied the announcement effect of the peers offirms targeted in a friendly takeover. The mean is positive (0.18%),but not statistically significant (p-value = 0039), and much smallerthan for the peers of hostile targets. It is also unrelated to priorlevels of (excess) investment or free cash flow.
then peer firms may undertake actions to correct theundervaluation and avoid being acquired themselves.This could explain the increase in takeover defensesand the change in payouts, assuming the increasedpayout signals undervaluation (although the evidenceon market timing through payouts is not very strong;see Dittmar and Dittmar 2008). To fund the increasedpayouts, firms would increase leverage and decreasecash holdings. This hypothesis cannot explain, how-ever, why these firms would not have enough debt(according to an empirical model of optimal lever-age) before the takeover threat, and would restoredebt to the optimal level afterward. Similarly it cannotexplain why these firms would overinvest before thetakeover threat and cut capital spending afterwardto optimal levels (according to an empirical modelof optimal capital spending). The q theory of invest-ment suggests that undervalued firms invest less; incontrast, we find that firms cut investment after thecontrol threat, exactly when valuations increase.
The evidence on friendly acquisitions discussedearlier is also inconsistent with undervaluation, giventhat we find few changes in policies for the peers ofthese firms. Of course, it could be that undervaluationapplies only to firms in industries that experience ahostile takeover attempt.
As an additional test of the undervaluation hypoth-esis, we remove takeover threats in industries withbelow median q ratios (in the two years beforethe takeover threat). These should be the industrieswhere undervaluation is more prominent (see, e.g.,Rhodes-Kropf et al. 2005).27 If undervaluation is driv-ing our findings, then they should weaken substan-tially when the low q industries are removed. We find
27 Note that we do not claim that undervaluation is not possible inhigh q industries, just that it is less likely.
Dow
nloa
ded
from
info
rms.
org
by [
163.
119.
134.
226]
on
24 F
ebru
ary
2014
, at 0
3:44
. Fo
r pe
rson
al u
se o
nly,
all
righ
ts r
eser
ved.

Servaes and Tamayo: How Do Industry Peers Respond to Control Threats?396 Management Science 60(2), pp. 380–399, © 2014 INFORMS
no evidence that this is the case (not reported in atable). In general, the changes in financing and invest-ment policies are similar for high q and low q indus-tries, suggesting that undervaluation is less likely tobe an explanation for these phenomena.
Finally, recent evidence by Fos (2013), showing thatfirms change their policies in similar ways to thepeers in our sample when responding to an increasedthreat of a proxy contest, also suggests that underval-uation is not the main cause of these policies changes.Fos (2013) identifies changes in the threat of proxycontests using a measure of stock liquidity.
Overall, these findings do not support the under-valuation hypothesis. Of course, undervaluation maybe relevant for a subset of the transactions in oursample, but their weight in the overall sample is notstrong enough to be detected by our tests.
6. ConclusionThis paper studies how hostile takeover attemptsaffect the behavior of the target firms’ industry peers.This research is motivated by Jensen’s (1986, 1993)and Shleifer and Vishny’s (1988) argument that entireindustries may suffer from agency problems. If onefirm in the industry receives a takeover attemptbecause of agency problems, then the managers ofother firms who want to remain in control realize thatthey need to change their policies or face similar con-trol threats.
Our results are consistent with Jensen’s (1986, 1993)arguments: after the control threat, the peer firms cutcapital expenditures, reduce their cash balances andfree cash flows, increase debt, and increase their pay-outs to shareholders. The peers with the highest levelof industry-adjusted investment before the controlthreat have the largest cuts in capital expenditures.We also find that the peers increase their adoption oftakeover defenses.
Appendix A. Number of Hostile Acquisitions in Sample by 48 Fama–French Industries and Year
Years
Industry 83 84 85 86 87 88 89 90 91 92 93 94 95 96 97 98 99 00 01 02 03 04 05 Total
Food products 1 0 3 1 0 7 0 0 0 0 0 0 1 0 0 1 1 0 0 1 0 0 0 16Beer and liquor 0 1 0 0 1 0 0 0 0 0 0 0 0 0 0 0 0 0 0 0 0 0 0 2Tobacco products 0 0 0 0 0 1 0 0 0 0 0 0 0 0 0 0 0 0 0 0 0 0 0 1Recreation 0 0 0 2 0 1 0 0 0 0 0 0 0 1 0 0 0 0 0 0 0 0 0 4Entertainment 0 0 1 2 1 0 0 0 0 0 0 0 0 0 0 0 0 1 0 0 0 0 0 5Printing and publ. 0 1 0 1 1 1 1 0 0 0 0 0 0 1 0 0 0 0 0 0 0 0 0 6Consumer goods 1 0 2 2 1 2 0 0 0 0 0 0 0 1 0 0 0 0 0 0 0 0 0 9Apparel 0 0 0 0 2 1 0 0 0 0 0 0 0 0 0 0 0 0 0 0 0 0 0 3Healthcare 0 0 0 0 1 0 0 0 0 0 0 0 1 0 0 0 0 0 0 0 0 0 0 2Pharmaceuticals 0 0 0 0 0 0 0 0 0 0 0 0 1 0 0 0 0 0 0 0 0 0 0 1Chemicals 0 0 2 1 1 2 2 0 0 0 0 0 0 2 0 0 0 0 0 0 0 0 0 10
Event-study results provide further evidence in sup-port of agency costs. The industry peers gain 0.50%,on average, when a control threat is announced, withlarger returns accruing to firms with higher capitalexpenditures and free cash flows prior to the bidannouncement. Finally, we find that valuations andreturns of the peer firms improve after the takeoverattempt, indicating that the changes made by the peersare value enhancing.
The facts presented in this paper provide strongsupport for Jensen’s view (1986, 1993) that agencycosts manifest themselves at the industry level andthat takeover threats affect other firms as well.Although some pieces of our evidence are consistentwith other explanations, the combined evidence sup-ports the view that the industry as a whole suffersfrom agency problems and that the takeover attemptleads to a reduction in these problems for other firmsin the industry. Overall, our results indicate that thebenefits of takeover attempts are larger than previ-ously documented, since they also affect the policiesof industry peers.
AcknowledgmentsThe authors thank Nihat Aktas, Murillo Campello,Sergey Davydenko, Julian Franks, David Goldreich, JarradHarford, Li Jin, Bart Lambrecht, David Scharfstein, AnilShivdasani, Wei Xiong, an anonymous associate editor, twoanonymous referees, and seminar participants at the Bankof Italy, Boston College, Erasmus University, the FrenchFinance Association, Harvard Business School, IESEG, KoçUniversity, Lancaster University, London Business School,Maastricht University, Tilburg University, University Col-lege Dublin, the University of Cambridge, the University ofCyprus, and the University of Illinois for helpful comments,and the Research and Materials Development Fund at Lon-don Business School for financial support. The authors areespecially grateful to Denis Gromb for providing usefulfeedback, and to Ramin Baghai and Raja Patnaik for excel-lent research assistance.
Dow
nloa
ded
from
info
rms.
org
by [
163.
119.
134.
226]
on
24 F
ebru
ary
2014
, at 0
3:44
. Fo
r pe
rson
al u
se o
nly,
all
righ
ts r
eser
ved.

Servaes and Tamayo: How Do Industry Peers Respond to Control Threats?Management Science 60(2), pp. 380–399, © 2014 INFORMS 397
Appendix A (Continued)
Years
Industry 83 84 85 86 87 88 89 90 91 92 93 94 95 96 97 98 99 00 01 02 03 04 05 Total
Rubber and plastics 0 0 1 1 0 0 1 0 0 0 0 0 0 0 0 0 0 0 0 0 0 0 0 3Textiles 0 0 1 0 1 2 0 0 0 0 0 0 0 0 0 0 0 0 0 0 0 0 0 4Construction 0 0 1 1 0 1 0 0 0 0 0 0 0 0 0 0 0 0 0 0 0 0 0 3
materialsConstruction 0 0 0 1 0 0 0 0 0 0 0 0 0 0 0 0 0 1 0 0 0 0 0 2Steel 0 0 1 0 1 0 0 0 0 0 0 0 0 1 1 0 0 0 0 0 0 0 0 4Fabricated products 0 1 0 0 1 2 0 0 0 0 0 0 0 0 0 0 0 0 0 0 0 0 0 4Machinery 0 0 1 1 0 0 1 0 0 0 0 0 1 1 0 1 0 0 0 0 0 0 0 6Electrical equipment 0 0 0 0 0 0 0 1 0 0 0 0 0 0 0 0 0 0 0 0 0 0 0 1Automobiles and 0 0 0 2 1 2 0 0 0 0 0 0 1 0 0 2 0 0 0 1 1 0 0 10
trucksAircraft 0 0 0 0 0 1 0 0 0 0 0 2 0 0 1 0 0 0 0 0 0 0 0 4Precious metals 0 0 0 0 1 0 0 0 0 0 0 0 0 1 0 0 0 0 0 0 0 0 0 2Petroleum and 0 2 1 0 0 0 0 0 0 0 0 0 1 0 1 0 0 0 1 0 0 0 0 6
natural gasUtilities 1 1 1 1 0 0 2 1 0 0 0 0 1 3 1 0 1 0 0 0 0 0 0 13Communication 1 0 2 0 0 1 0 0 0 0 0 0 0 0 0 0 0 0 1 0 0 0 0 5Business services 0 0 0 0 0 2 0 0 0 0 0 0 1 1 2 1 0 0 0 0 0 0 0 7Computers 0 1 0 0 1 1 1 1 0 0 0 0 1 0 1 0 0 0 0 0 0 0 0 7Computer software 0 0 0 1 2 5 0 0 0 0 0 0 0 0 1 0 0 0 0 1 1 1 0 12Measuring and 0 0 0 0 0 0 0 0 0 0 0 0 1 0 2 0 1 0 0 0 0 0 0 4
control equipmentShipping containers 0 0 1 5 4 2 1 1 0 0 1 0 0 0 0 0 0 0 0 0 0 0 0 15Transportation 0 0 1 1 1 2 0 0 0 0 0 0 0 0 0 1 0 0 0 0 0 0 0 6Wholesale 0 2 0 7 2 4 2 0 0 0 0 0 2 2 0 0 0 0 0 0 0 0 0 21Retail 0 0 0 0 0 0 0 0 0 0 0 0 0 0 1 0 0 0 0 1 0 0 0 2Trading 0 0 0 1 0 0 0 0 0 0 0 0 0 0 0 0 0 0 0 0 0 1 0 2Total 4 9 19 31 23 40 11 4 0 0 1 2 12 14 11 6 3 2 2 4 2 2 0 202
Appendix B. Control Variables
Dependent variable Control variables
Capital expenditures/assets Lagged Tobin’s q, measured as (book value of assets − book value of equity − deferredtaxes + market value of equity)/book value of assets
Adjusted investment ratio:(capital expenditures + R&D+ cash acquisitions − sale of PP&E− depreciation)/assets
(i) lagged value of assets in place/market value of equity(ii) lagged total debt/assets
(iii) lagged cash/assets(iv) lagged firm age (number of years since listing on Compustat or CRSP,
whichever is higher)(v) lagged log assets
(vi) lagged one-year stock returns(vii) lagged adjusted investment ratio
(viii) industry dummies (using 48 Fama–French industries)(ix) year dummies
(Richardson 2006)
Long-term debt/assetsTotal debt/assets
(i) operating income/assets(ii) investment tax credits/assets
(iii) net property, plant, and equipment/assets(iv) log assets(v) R&D/assets
(vi) selling, general and administrative expenses (SG&A)/assets(Titman and Wessels 1988, Berger et al. 1997, Hovakimian et al. 2001)
Dow
nloa
ded
from
info
rms.
org
by [
163.
119.
134.
226]
on
24 F
ebru
ary
2014
, at 0
3:44
. Fo
r pe
rson
al u
se o
nly,
all
righ
ts r
eser
ved.

Servaes and Tamayo: How Do Industry Peers Respond to Control Threats?398 Management Science 60(2), pp. 380–399, © 2014 INFORMS
Appendix B (Continued)
Dependent variable Control variables
Cash/total assets (i) net working capital/assets(ii) R&D/assets
(iii) cash acquisitions/assets(iv) capital expenditures/assets(v) Tobin’s q
(vi) log assets(vii) total debt/assets(viii) a dummy equal to 1 if the firm pays dividends
(ix) operating income/assets(Opler et al. 1999)
Free cash flow/assets Log assets
(Dividends + repurchases)/net income (i) Tobin’s q(ii) retained earnings/equity
(iii) (sales/salest−1) − 1(iv) operating income/assets(v) equity/assets
(vi) log assets(vii) cash/assets(DeAngelo et al. 2006)
ReferencesAlmeida H, Campello M, Weisbach MS (2004) The cash flow sensi-
tivity of cash. J. Finance 59:1777–1804.Bates TW, Becher DA, Lemmon ML (2008) Board classification and
managerial entrenchment: Evidence from the market for cor-porate control. J. Financial Econom. 87:656–677.
Bebchuk LA, Cohen A, Ferrell A (2009) What matters in corporategovernance. Rev. Financial Stud. 22:783–827.
Berger PG, Ofek E, Yermack DL (1997) Managerial entrenchmentand capital structure decisions. J. Finance 52:1411–1438.
Billet MT, Xue H (2007) The takeover deterrent effect of open mar-ket share repurchases. J. Finance 62:1827–1850.
Core JE, Guay WR, Rusticus TO (2006) Does weak governancecause weak stock returns? An examination of firm operatingperformance and investors’ expectations. J. Finance 61:655–687.
DeAngelo H, DeAngelo L, Stulz RM (2006) Dividend policy and theearned/contributed capital mix: A test of the life-cycle theory.J. Financial Econom. 81:227–254.
Denis DJ, Denis DK (1993) Managerial discretion, organizationalstructure, and corporate performance: A study of leveragedrecapitalizations. J. Accounting Econom. 16:209–236.
Denis DJ, Serrano JM (1996) Active investors and managementturnover following unsuccessful control contests. J. FinancialEconom. 40:239–266.
Dittmar AK (2000) Why do firms repurchase stock? J. Bus.73:331–355.
Dittmar AK, Dittmar RF (2008) The timing of financing decisions:An examination of the correlation in financing waves. J. Finan-cial Econom. 90:59–83.
Dlugosz J, Fahlenbrach R, Gompers P, Metrick A (2006) Largeblocks of stock: Prevalence, size, and measurement. J. CorporateFinance 12:594–618.
Dong M, Hirshleifer D, Richardson S, Teoh SH (2006) Does investormisevaluation drive the takeover market. J. Finance 61:725–762.
Eckbo BE (1983) Horizontal mergers, collusion, and stockholderwealth. J. Financial Econom. 11:241–273.
Eckbo BE (1985) Mergers and the market power doctrine: Evidencefrom capital markets. J. Bus. 47:1005–1029.
Edmans A, Goldstein I, Jiang W (2012) The real effects of finan-cial markets: The impact of prices on takeovers. J. Finance67:933–971.
Fazzari SM, Hubbard RG, Petersen BC (1988) Financing constraintsand corporate investment. Brookings Papers Econom. Activity19:141–206.
Fee CE, Thomas S (2004) Sources of gains in horizontal mergers:Evidence from customer, supplier, and rival firms. J. FinancialEconom. 74:423–460.
Fos V (2013) The disciplinary effects of proxy contests. Work-ing paper, University of Illinois at Urbana–Champaign,Champaign.
Gompers PA, Ishii JL, Metrick A (2003) Corporate governance andequity prices. Quart. J. Econom. 118:107–155.
Gompers PA, Ishii JL, Metrick A (2010) Extreme governance: Ananalysis of dual-class firms in the United States. Rev. FinancialStud. 23:1051–1088.
Grossman SJ, Hart OD (1982) Corporate financial structure andmanagerial incentives. McCall J, ed. The Economics of Informationand Uncertainty (University of Chicago Press, Chicago), 107–140.
Grullon G, Michaely R (2004) The information content of sharerepurchase programs. J. Finance 59:651–680.
Guenther DA, Rosman AJ (1994) Difference between Compustatand CRSP SIC Codes and related effects on research. J. Account-ing Econom. 18:115–128.
Harford J (2005) What drives merger waves? J. Financial Econom.77:529–560.
Healy PM, Palepu KG, Ruback RS (1992) Does corporate perfor-mance improve after mergers? J. Financial Econom. 31:135–175.
Hendershott RJ (1996) Which takeover targets overinvest? J. Finan-cial Quant. Anal. 31:563–580.
Holmstrom B, Kaplan SN (2001) Corporate governance and mergeractivity in the United States: Making sense of the 1980s and1990s J. Econom. Perspect. 15:121–144.
Hovakimian A, Opler T, Titman S (2001) The debt-equity choice.J. Financial Quant. Anal. 36:1–24.
Jensen MC (1986) Agency costs of free cash flow, corporate finance,and takeovers. Amer. Econom. Rev. 76:323–329.
Jensen MC (1993) The modern industrial revolution, exit, and thefailure of internal control systems. J. Finance 48:831–880.
Kahle KM, Walkling RA (1996) The impact of industry classifica-tions on financial research. J. Financial Quant. Anal. 31:309–335.
Kaplan SN (1989) The effects of management buyouts on operatingperformance and value. J. Financial Econom. 24:217–254.
Dow
nloa
ded
from
info
rms.
org
by [
163.
119.
134.
226]
on
24 F
ebru
ary
2014
, at 0
3:44
. Fo
r pe
rson
al u
se o
nly,
all
righ
ts r
eser
ved.

Servaes and Tamayo: How Do Industry Peers Respond to Control Threats?Management Science 60(2), pp. 380–399, © 2014 INFORMS 399
Lambrecht BM, Myers SC (2007) A theory of takeovers and disin-vestment. J. Finance 62:809–845.
Lehn K, Poulsen A (1989) Free cash flow and stockholder gains ingoing private transactions. J. Finance 44:771–787.
Loderer C, Waelchli U (2010) Firm age and performance. Workingpaper, University of Bern, Bern, Switzerland.
Martin KJ, McConnell JJ (1991) Corporate performance, corporatetakeovers, and management turnover. J. Finance 46:671–687.
Mitchell ML, Mulherin JH (1996) The impact of industry shockson takeover and restructuring activity. J. Financial Econom.41:193–229.
Morck R, Shleifer A, Vishny RW (1988) Characteristics of targetsof hostile and friendly takeovers. Auerbach AJ, ed. CorporateTakeovers: Causes and Consequences (National Bureau of Eco-nomic Research, Chicago), 101–136.
Morck R, Shleifer A, Vishny RW (1989) Alternative mechanisms forcorporate control. Amer. Econom. Rev. 79:842–852.
Morellec E (2004) Can managerial discretion explain observedleverage ratios? Rev. Financial Stud. 17:257–294.
Opler T, Pinkowitz L, Stulz R, Williamson R (1999) The determi-nants and implications of corporate cash holdings. J. FinancialEconom. 52:3–46.
Rhodes-Kropf M, Robinson DT, Viswanathan S (2005) Valuationwaves and merger activity: The empirical evidence. J. FinancialEconom. 77:561–603.
Richardson S (2006) Over-investment of free cash flow. Rev.Accounting Stud. 11:159–189.
Safieddine A, Titman S (1999) Leverage and corporate perfor-mance: Evidence from unsuccessful takeovers. J. Finance 54:547–580.
Schwert GW (2000) Hostility in takeovers: In the eyes of thebeholder? J. Finance 55:2599–2640.
Servaes H (1994) Do takeover targets overinvest? Rev. FinancialStud. 7:253–277.
Shahrur H (2005) Industry structure and horizontal takeovers:Analysis of wealth effects on rivals, suppliers, and corporatecustomers. J. Financial Econom. 76:61–98.
Shleifer A, Vishny RW (1988) Value maximization and the acquisi-tion process. J. Econom. Perspect. 2:7–20.
Song MH, Walkling RA (2000) Abnormal returns to rivals ofacquisition targets: A test of the “acquisition probabilityhypothesis.” J. Financial Econom. 55:143–171.
Stillman R (1983) Examining antitrust policy towards horizontalmergers. J. Financial Econom. 11:225–240.
Stulz R (1990) Managerial discretion and optimal financing policies.J. Financial Econom. 26:3–27.
Titman S, Wessels R (1988) The determinants of capital structurechoice. J. Finance 43:1–19.
Zwiebel J (1996) Dynamic capital structure under managerialentrenchment. Amer. Econom. Rev. 86:1197–1215.
Dow
nloa
ded
from
info
rms.
org
by [
163.
119.
134.
226]
on
24 F
ebru
ary
2014
, at 0
3:44
. Fo
r pe
rson
al u
se o
nly,
all
righ
ts r
eser
ved.