housing the urban poor in post-reform china: some empirical evidence from the city of nanjing
TRANSCRIPT

Cities 29 (2012) 252–263
Contents lists available at SciVerse ScienceDirect
Cities
journal homepage: www.elsevier .com/locate /c i t ies
Housing the urban poor in post-reform China: Some empirical evidencefrom the city of Nanjing
Guo Chen ⇑Department of Geography & Global Urban Studies Program, 211 Geography Building, Michigan State University, East Lansing, MI 48824, United States
a r t i c l e i n f o
Article history:Received 16 June 2011Received in revised form 15 September 2011Accepted 16 October 2011Available online 12 November 2011
Keywords:Urban povertyHousingChinaPoor households
0264-2751/$ - see front matter � 2011 Elsevier Ltd. Adoi:10.1016/j.cities.2011.10.004
⇑ Tel.: +1 517 3165375.E-mail address: [email protected]
a b s t r a c t
This paper provides first-hand empirical evidence about the differentiation of housing conditions amongChina’s urban poor families based on a case study of Nanjing. The main findings include: (1) the Hukoufamily registration system has strong differential effects on poor families’ housing conditions; (2) housingconditions among the urban poor are tightly associated with privatization and home ownership, wherenon-owners face more severe housing difficulties than nominal owners; and (3) resettlement has playeda positive role in improving the poor’s housing conditions, but its positive effects are only present in caseswhere work units or the government has taken the responsibility of housing the resettled poor. Thesefindings show that housing the urban poor in post-reform China is largely: (1) path-dependent, (2) priv-atization-oriented, and (3) development-driven, and a mechanism that can pro-actively ensure the poor’sbasic right to housing is still lacking.
� 2011 Elsevier Ltd. All rights reserved.
Introduction
Housing is an important dimension of urban poverty in contem-porary China. Since the launch of urban housing reform in 1979(Wang & Murie, 1999), China’s urban housing system has been re-shaped in highly divergent directions. On one hand, the reform hasbolstered housing development, alleviated housing shortages inmajor Chinese cities, and greatly improved housing conditionsfor many urban Chinese. On the other hand, many disadvantagedgroups are facing significant housing difficulties due to the retreatof the state-backed housing allocation (Wang, 2000). As the centralgoal of China’s urban housing reform is to transfer the housingresponsibility from the state to individuals and the housingmarket, how to balance the roles of government, the market, andindividuals in order to assure the poor’s basic right to housing isa new challenge in today’s urban China (Lee, 2000).
In recent years, China’s urban housing inequality has been welldocumented by various studies, e.g. Logan, Bian, and Bian (1990),Wang (2000), Wang (2004), Wu (2001, 2002, 2004), Huang(2003a), Li and Huang (2006), Sato (2006), and Li and Wu (2006),to list only a few. However, China’s increasingly alarming-levelinequality has made it an urgent task to focus our analytical lenson poor communities and examine the more subtle impacts of rel-evant policies among the poor. Since the ultimate goal of China’sreform is to transform a socialist country founded on egalitarianprinciples (at least on paper) into a market-oriented system that
ll rights reserved.
respects merits and differential awards, merely recognizing theoutcome of material inequalities brought by the housing reformcannot provide the analytical depth required to answer the morefundamental question of social equity. The more important taskis to identify the complex institutional and distributional roots ofthese inequalities, and examine how these factors are embeddedinto the process of housing marketization to differentiate thepoor’s housing prospects. From this point of view, an empiricalstudy focused on the housing differentiation among the poorprovides more controlled results than those based on the generalpopulation, as it compares poor families with poor families. Suchfine-scale analyses can help us evaluate the social success (orfailure) of China’s housing reform and measure the divergenteffects of different urban policies on the urban poor.
Generally speaking, China’s post reform urban housing transi-tion can be regarded as a special case of actually-existing neo-liberalization (He & Wu, 2009; Lee & Zhu, 2006), where thedecentralization of state governance and the deregulation of urbaneconomy are combined with the path-dependent housing market-ization to reshape the production and reproduction of urban space(Chen, 2011; Lin, 2007; Ma, 2002). Theoretically, three major forcesdrive the unequal distribution of China’s transitional urban hous-ing system. First, the impact of institutional succession and powerconversion, which refers to the fact that unjust elements of thepre-reform institutions, especially those related to Hukou familyregistration and work-unit housing allocation (Li, 2000; Loganet al., 1999; Wu, 2004), have been carried over through the housingmarketization due to the gradualist nature of China’s reform.Second, the restructuring of the urban housing tenure system, as

G. Chen / Cities 29 (2012) 252–263 253
the main focus of China’s housing reform, especially since the mid-1990s, is to transform the old public rental system into an owner-ship-based housing model (Huang & Clark, 2002; Li & Yi, 2007). Thethird is the influence of urban redevelopment, which reflects thegrowing demands of urban spatial restructuring driven by thecontinued and accelerated production and reproduction of urbanspace since the reform (Li & Song, 2009; Lin & Ho, 2005; Wu &He, 2005). Under this context, this paper employs statistical meth-ods to test the housing differentiation among the urban poor fromthe perspectives of: (1) the Hukou family registration system, (2)housing tenure and housing distribution sources (includingsources related to work units, government, and private parties),and (3) housing change and resettlement. In the next section, weprovide the necessary background information for this study. Thenthe following three sections describe the general procedures andpresent the detailed results of our analysis, after which discussionsand conclusions are provided in the final section.
Background
Urban poverty and housing inequality in post-reform China
Although much of China’s urban poverty can be eventuallyattributed to the growing income inequality following the eco-nomic marketization (Ma, 2002; Meng, Gregory, & Wang, 2005),it is a complex problem greatly influenced by two inter-relatedsocio-economic processes since the reform: (1) the massiverural-urban transition and (2) the restructuring of urban economy,especially the reform of the public sectors. Since 1978, due to therelaxed control over population mobility and the practical demandfor inexpensive labor by the growing urban economy, manyChinese cities have seen a massive influx of migrant workers orig-inating from rural areas (Pannell, 1995). As rural residents are his-torically poorer than urban populations in general, and becausetheir Hukou status (which does not automatically change with aperson’s residential shift) restricts them to jobs in lower-paidinformal sectors, many rural migrants immediately become mem-bers of low-income groups in Chinese cities (Fan, 1999, 2002).Meanwhile, the marketization and privatization introduced bythe economic reform have resulted in a dramatic restructuring ofthe urban economy, where state-affiliated work units increasinglyhave to operate and compete on market terms. Usually highlyredundant in personnel and inefficient in terms of market adapt-ability, many of these work units faced financial difficulties. Someeventually collapsed or became privatized, and others shed offlarge numbers of employees in order to survive. As this restructur-ing process reached a culmination in the late 1990s, it produced agreat number of urban residents without a stable income, most ofwhom are former work unit employees who have been laid off orforced to retire early (Wu & Huang, 2007; Yao, 2004b). These jointhe low-income rural migrants to form the main forces of povertyin today’s urban China (Chen, Gu, & Wu, 2006; Liu, Wu, & He,2008).
Parallel to these developments has been China’s market-ori-ented housing reform, which aims to replace the old socialistpublic housing allocation with market-oriented housing distribu-tion. The chief reason for the reform, as noted by many authors,is due to the incapability of the sluggish public housing systemto provide urban residents with adequate housing. For example,crowding was a major problem in many Chinese cities in thepre-reform era and earlier years of the economic reform, and ithas been exacerbated by the growing urban population due tomigration and urbanization (Huang, 2003b). Thanks to the reform,this problem has been steadily alleviated by the boomingcommodity housing development and a fast-growing real estate
sector (Zhao & Bourassa, 2003). In general, the role of the mar-ket-oriented housing reform in improving urban China’s overallhousing standard is undeniable, although new problems such asaffordability have emerged (Chiu, 1996; Mak, Choy, & Ho, 2007).However, the impact of the housing reform on the emerging urbanpoor is not all positive. Path-dependency has been well recognizedas a main characteristic of China’s housing transition (as well as thegeneral economic reform). The legacy issues of the old system,including the institutional unbalances such as the divisions ofHukou and the inequity among or within work units, haveremained influential factors in most part of the urban housingtransition. For example, rural migrants are still left out in moststate or employer-sponsored housing programs (Wang, 2000;Wu, 2004). Although local urban Hukou holders can receive signif-icant assistance from their work units, e.g. through price discountsor housing subsidies, such aid is often proportional to the institu-tional power of work units and individuals’ social, political, and/or organizational ranks inherited from the old system (Huang &Clark, 2002; Logan et al., 1999). While higher-ranked employeesof powerful work units are able to obtain greater institutionalassistance and therefore better housing during the transition,grassroots workers of weaker work units have to live with inferiorarrangements, and sometimes are even completely left out due tothe severe financial difficulties of their work units (Zhao & Bou-rassa, 2003). As most public stocks have been eventually convertedinto dweller-owned housing (usually at discounted prices backedby work units) since the mid-1990s, such institutionally-pre-scribed inequalities have been transformed into great disparitieswithin the newly-formed urban housing tenure system, whichare difficult to overcome by market means. In summary, China’surban poverty and housing inequality are two inter-relatedproblems, as many of the poor are also the most disadvantagedpeople during the housing transition.
The city of Nanjing
The analyses in this study are based on data collected in 2004from a survey among poor families of Nanjing. Located on China’seast coast, and the capitol city of Jiangsu province, Nanjing is animportant regional economic center of the Yangtze River Delta. Itis also one of the ‘‘super large’’ cities in China by population size,with a resident population of over three million in the city core(defined by administrative areal units), and a total of nearly sevenmillion in the municipal area, according to the 2005 census. Havingbeen the capital of several historical Chinese states, Nanjing is wellknown for its rich legacy from ancient history and unique develop-ment trajectory in more recent times. Between 1927 and 1949, asthe then-capital-city under the nationalist government, Nanjingwas home to high-ranking bureaucrats, rich business-men, socialelites, as well as poor workers, proletariats, and vagrants, and it re-corded one of the highest income inequalities among all Chinesecities at the time (Chen, Gu, & Wu, 2004). After the socialistrevolution in 1949, Nanjing underwent a period of under-develop-ment due to the reorganization of China’s political economy. Butsince 1978, the city has experienced a new wave of growth asone of the earliest ‘‘open’’ cities in the coastal area of China andthe increasing economic prowess of the Yangtze River Delta.Compared with other Chinese cities, Nanjing’s unique history hasresulted in a highly visible landscape that contrasts post-reformachievements with pre-reform fixtures, pre-revolution landmarks,and historical footprints. In addition, unlike bigger cities such asBeijing, Shanghai, and Guangzhou, the characteristics of whichare tightly coupled with the surrounding extended metropolitanregions (Lin, 2001; Sit, 2005; Sun, Li, & Lu, 2009; Zhang & Sit, 2006),the city of Nanjing is not as large and diverse in terms of bothgeographical area and population composition. Thus its development
254 G. Chen / Cities 29 (2012) 252–263
is more in line with the conventional concept of central cities, mak-ing it a favorite subject of recent studies on China’s urban poverty(Chen et al., 2006; He, Liu, Wu, & Webster, 2008; Liu et al., 2008;Wu, 2007). Our data was collected at a time when the city wasexperiencing the most fervent urban redevelopment in its historyto make way for image-promoting events and a metro system.The city’s last group of ‘native’ urban residents, who lived in thesouthern part of the city, was expecting relocation.
Data collection
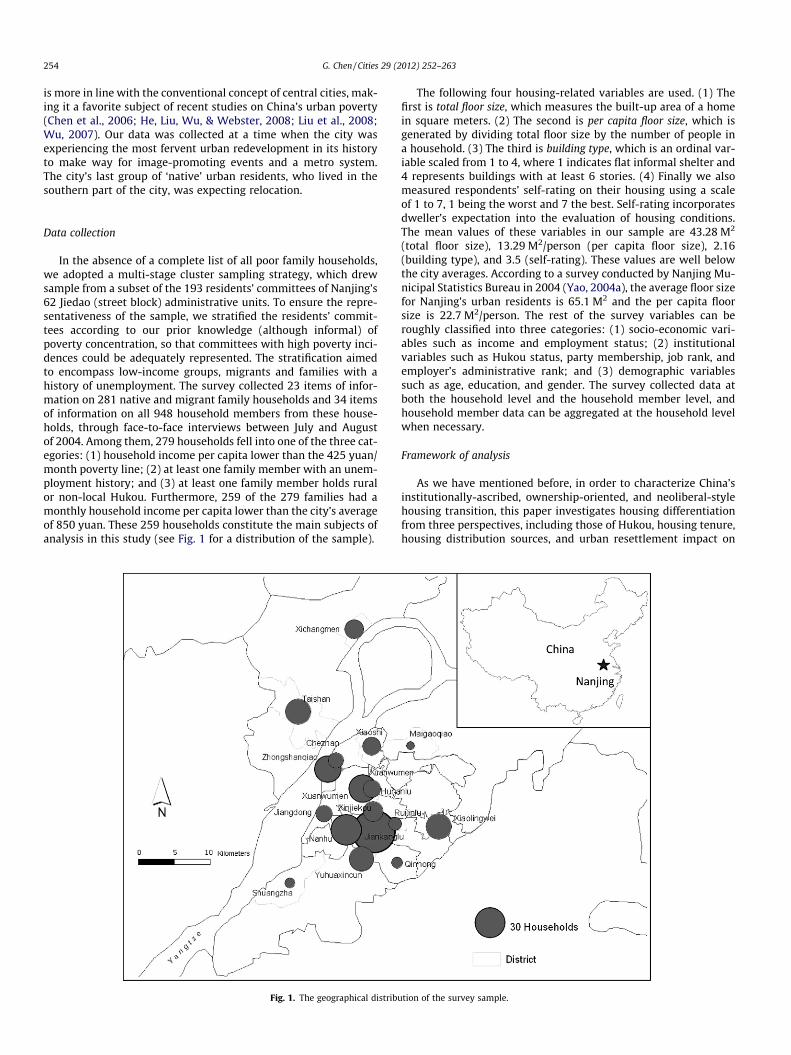
In the absence of a complete list of all poor family households,we adopted a multi-stage cluster sampling strategy, which drewsample from a subset of the 193 residents’ committees of Nanjing’s62 Jiedao (street block) administrative units. To ensure the repre-sentativeness of the sample, we stratified the residents’ commit-tees according to our prior knowledge (although informal) ofpoverty concentration, so that committees with high poverty inci-dences could be adequately represented. The stratification aimedto encompass low-income groups, migrants and families with ahistory of unemployment. The survey collected 23 items of infor-mation on 281 native and migrant family households and 34 itemsof information on all 948 household members from these house-holds, through face-to-face interviews between July and Augustof 2004. Among them, 279 households fell into one of the three cat-egories: (1) household income per capita lower than the 425 yuan/month poverty line; (2) at least one family member with an unem-ployment history; and (3) at least one family member holds ruralor non-local Hukou. Furthermore, 259 of the 279 families had amonthly household income per capita lower than the city’s averageof 850 yuan. These 259 households constitute the main subjects ofanalysis in this study (see Fig. 1 for a distribution of the sample).
Fig. 1. The geographical distribu
The following four housing-related variables are used. (1) Thefirst is total floor size, which measures the built-up area of a homein square meters. (2) The second is per capita floor size, which isgenerated by dividing total floor size by the number of people ina household. (3) The third is building type, which is an ordinal var-iable scaled from 1 to 4, where 1 indicates flat informal shelter and4 represents buildings with at least 6 stories. (4) Finally we alsomeasured respondents’ self-rating on their housing using a scaleof 1 to 7, 1 being the worst and 7 the best. Self-rating incorporatesdweller’s expectation into the evaluation of housing conditions.The mean values of these variables in our sample are 43.28 M2
(total floor size), 13.29 M2/person (per capita floor size), 2.16(building type), and 3.5 (self-rating). These values are well belowthe city averages. According to a survey conducted by Nanjing Mu-nicipal Statistics Bureau in 2004 (Yao, 2004a), the average floor sizefor Nanjing’s urban residents is 65.1 M2 and the per capita floorsize is 22.7 M2/person. The rest of the survey variables can beroughly classified into three categories: (1) socio-economic vari-ables such as income and employment status; (2) institutionalvariables such as Hukou status, party membership, job rank, andemployer’s administrative rank; and (3) demographic variablessuch as age, education, and gender. The survey collected data atboth the household level and the household member level, andhousehold member data can be aggregated at the household levelwhen necessary.
Framework of analysis
As we have mentioned before, in order to characterize China’sinstitutionally-ascribed, ownership-oriented, and neoliberal-stylehousing transition, this paper investigates housing differentiationfrom three perspectives, including those of Hukou, housing tenure,housing distribution sources, and urban resettlement impact on
tion of the survey sample.

Table 1One-way ANOVA tests of urban/rural and local/non-local divisions on housingvariables.
Floorsize (M2)
Per capita floorsize (M2)
Buildingtype
Self-rating
Urban 42.33 13.31 2.25 3.52Rural 38.74 11.94 1.68 3.67p (ANOVA) 0.131 0.036** <0.001*** 0.368
Local 41.82 13.30 2.20 3.53Non-local 41.19 11.27 1.81 3.22p (ANOVA) 0.473 0.057* 0.026** 0.163
Significance codes.* p < 0.1.
** p < 0.05.*** p < 0.01.
G. Chen / Cities 29 (2012) 252–263 255
the poor’s housing conditions. All these factors are categorical innature, and therefore our goal is to find whether there is substan-tial housing differentiation among the sub-groups. Traditionally,this kind of analyses can be conducted using techniques of Analysisof Variance (ANOVA). However, due to the non-experimentalnature of our data, extra caution must be taken in selecting theanalytical methods. More specifically, we only use one-way ANO-VA to test the existence of between-group differences of housingvariables, and once a positive result is obtained, we employ regres-sion methods to generate detailed pairwise comparisons. Thelength of this paper does not permit a detailed explanation of themethods used, which can be obtained from the author.
We take the following measures to assure the effectiveness andvalidity of the statistical analyses. (1) First, we use Box-Cox powertransformations (Box & Cox, 1964) to rescale dependant variablesinto normally distributed ones (except in models where the depen-dant variables are ordinal). The k value used by the specific powertransformation for each variable is estimated by the maximumlikelihood method. (2) To address potential problems arising fromthe clustered nature of the data due to our sampling strategy andthe concern of heteroscedasticity, we adopt the Huber-White errormeasure in significance tests, which has been shown to be robustin these situations (White, 1980). All analyses in this study areconducted in the statistical software package R.
Housing differentiation by Hukou
Generally speaking, there are two types of Hukou-imposed divi-sions in contemporary China: the rural/urban division and thelocal/non-local division (Chan, 1994; Wu, 2004). Many importantsocio-economic benefits are differentiated by these two divisions,including children’s schooling, social welfare, and medical carebenefits. The rest of this section examines the effects of both typesof Hukou divisions as well as their interaction on the poor’s hous-ing conditions.
Rural/urban vs. local/non-local
The identification of Hukou-based sub-groups in this study dif-fers from approaches used by some past studies in two respects.First, our data are based on families instead of individuals. It isnotable that in China a large part of the migrant population is con-stituted of the so-called ‘‘floating population’’ (Shen, 2002) withmultiple lengths of stay and high individual-driven mobility.Therefore, incorporating all individual migrants into housing com-parisons sometimes induces bias, because in such cases migrantgroups would be dominated by people who are less motivated tosettle down in the first place (Wu, 2002). A family-oriented catego-rization of Hukou groups helps to compare migrant and non-mi-grant groups on equal ground. Second, this study identifies thesubjects’ Hukou status immediately before they shift to theircurrent dwellings. Many studies tend to identify a person’s Hukoustatus at the time of data collection, which introduces anothersource of bias because such an approach ignores the connectionbetween Hukou changes and housing transitions. In Nanjing, forexample, this approach may overlook effects from measures suchas the ‘‘blue seal’’ Hukou policy that awards local urban Hukouto qualified home buyers and the conversion of the rural popula-tion to urban residents during different stages of urban expansion.
Bearing these concerns in mind, Table 1 lists the means of thefour housing variables for different sub-groups defined by thehousehold head’s Hukou status at the time of the housing change(if there was a change). For each housing variable, one-way ANOVAtests are conducted for both types of Hukou divisions and theirheteroscedasticity-corrected p values are also included in Table 1.
Results show that for both types of Hukou divisions, there are sig-nificant between-group differences for per-capita floor size andbuilding type, but not on overall floor size and self-reported hous-ing rating. The mean floor size among urban-Hukou households(42.33 M2) is greater than that of rural-Hukou households(38.74 M2), but the difference is not statistically significant dueto the large or unbalanced variance of the floor size variable. Theeffects of per capita floor size become significant for both Hukoudivisions mainly because rural/non-local households have morefamily members than urban/local households. The differences inbuilding type reflect the fact that urban/local families generallylive in better quality housing (as measured by building type) thanrural/non-local families. Finally, there are no significant differencesin self-ratings for both types of Hukou divisions.
Interaction effects of the two Hukou divisions
Perhaps more important information can only be revealed byanalyzing the interaction effects of the two types of Hukou divi-sions. For example, it is hypothesized that rural migrants, i.e. thosewith non-local rural Hukou, may live in the worst housing condi-tions, while the housing difficulties of the local urban poor maybe relatively less severe. However, traditional two-way ANOVAmethods do not work here because even with heteroscedasticity-consistent methods such as the one used above, it is not possibleto generate sensible results due to the problem of multicollinear-ity: the two Hukou factors are highly correlated with each other(e.g. a local household is also likely to be an urban household).
Instead, we use regression techniques to model the interactioneffects independently from the main effects, which have alreadybeen evaluated in Table 1. First, we use the two Hukou divisionsto cross-categorize the poor households into four sub-groups,including families with local urban Hukou, local rural Hukou,non-local urban Hukou, and non-local rural Hukou. Then we codethem into dummy independent variables and fit them into regres-sion models for each housing variable, where the housing variableis the dependent variable. For total floor size and per capita floorsize, we use linear regression methods with dependent variablesrescaled by Box-Cox power transformations. For building typeand housing rating, we use proportional odds models, which areessentially logistic regressions on multiple ordinal categories.More specifically, a binomial logistic regression usually containsone intercept term, which can be understood as the baseline‘‘odds’’ that ‘‘divides’’ the two categories of the dependent variable.The regression coefficients can then be regarded as effects that addto or subtract from these baseline odds. Similar to this, a propor-tional model of an N-category dependent variable contains N � 1number of ‘‘cut points’’ as the baseline odds, and the regressioncoefficients represent the increase or decrease effects against these

Table 2Interaction effects of the two types of Hukou divisions.
Non-local Non-local Local Local Group GroupRural Urban Rural Urban Mean Std.
No. of households 20 8 22 208 N/A N/A
Floor size (M2)Non-local rural 9.22 (Intercept) �4.39 (p = 0.015**) �1.71 (p = 0.287) �2.12 (p = 0.091*) 34.58 32.24Non-local urban +4.39 (p = 0.015**) 13.61 (Intercept) +2.68 (p = 0.108) +2.27 (p = 0.088*) 56.88 25.06Local rural +1.71 (p = 0.287) �2.68 (p = 0.108) 10.93 (Intercept) �0.41 (p = 0.694) 42.34 28.06Local urban +2.12 (p = 0.091*) �2.27 (p = 0.088*) +0.41 (p = 0.694) 11.34 (Intercept) 41.77 16.76
Per capita size (M2)Non-local rural 2.70 (Intercept) �0.81 (p = 0.069*) �0.53 (p = 0.243) �0.80 (p = 0.019*) 10.40 10.16Non-local urban +0.81 (p = 0.069*) 3.51 (Intercept) +0.28 (p = 0.512) +0.014 (p = 0.964) 13.33 5.74Local rural +0.53 (p = 0.243) �0.28 (p = 0.512) 3.23 (Intercept) �0.27 (p = 0.397) 13.25 9.70Local urban +0.80 (p = 0.019**) �0.014 (p = 0.964) +0.27 (p = 0.397) 3.50 (Intercept) 13.30 6.30
Building typeNon-local rural N/A �1.04 (p = 0.184) +0.03 (p = 0.963) �1.35 (p = 0.004***) 1.68 0.82Non-local urban +1.04 (p = 0.184) N/A +1.07 (p = 0.165) �0.31 (p = 0.637) 2.13 0.83Local rural �0.03 (p = 0.963) �1.07 (p = 0.165) N/A �1.38 (p = 0.002***) 1.68 0.84Local urban +1.35 (p = 0.004***) +0.31 (p = 0.637) +1.38 (p = 0.002***) N/A 2.26 0.78
Self ratingNon-local rural N/A �0.47 (p = 0.528) �0.64 (p = 0.246) �0.58 (p = 0.175) 3.16 1.07Non-local urban +0.47 (p = 0.528) N/A �0.17 (p = 0.812) �0.11 (p = 0.858) 3.38 1.06Local rural +0.64 (p = 0.246) +0.17 (p = 0.812) N/A +0.06 (p = 0.881) 3.55 0.86Local urban +0.58 (p = 0.175) +0.11 (p = 0.858) �0.06 (p = 0.881) N/A 3.53 1.15
Significance codes.* p < 0.1.
** p < 0.05.*** p < 0.01.
256 G. Chen / Cities 29 (2012) 252–263
baseline odds. The basic assumption of the proportional odds mod-el is that these effects remain the same across different categories.
For each housing variable, we run the corresponding regressionmodel four times, and during each time a different sub-group is setto be the reference group (therefore corresponding to the inter-cept). This eventually generates a matrix of pairwise comparisonsfor each housing variable, which are reported in Table 2. As wehave mentioned above, each column in Table 2 corresponds to aregression model that uses the sub-group in the column headeras the reference group. Here intercepts indicate the mean valuesof the housing variable for the reference sub-group, while the coef-ficient in each row represents the difference of means between therow sub-group and the reference sub-group. For example, the firstcolumn contains results of the regression where non-local ruralhouseholds are selected as the reference. For the total floor sizevariable, the first row (9.22) shows the mean value of the Box-Cox transformed total floor size for non-local rural households,and the second row indicates that the mean value of the dependentvariable for non-local urban households is greater than 9.22 by4.39. Note intercepts for building type and self-rating were notlisted in the table because there are more than one intercept inthe proportional odds models and they are not essential to ourcomparisons. All p values in the table have been adjusted usingheteroscedasticity-consistent variance matrices.
These results confirm that non-local rural (i.e. rural migrants)households constitute the most disadvantaged sub-group of theurban poor, in terms of both total and per capita floor sizes. The dif-ferences of housing sizes between local rural households and othersub-groups, on the other hand, are not significant. In contrast, non-local urban households (i.e. urban migrants) have the largestmeans in total and per-capita floor sizes, which are even signifi-cantly larger than that of local urban households. For building type,local urban households live in significantly better buildings thanboth local and non-local rural households. Finally, no significantdifferences in self-rating are detected between the four Hukousub-groups.
Housing differentiation by tenure and distribution types
A notable result of China’s housing reform is the restructuring ofurban housing tenure. In the pre-reform socialist era, most urbanChinese lived in public housing allocated to them through workunits, for which they only needed to pay trivial, nominal rents.There were few migrants and no private market, although a fewpeople still possessed aged private housing obtained before 1949(Huang & Clark, 2002). Since the reform, the urban housing tenurestructure has become more complicated due to the diversified pop-ulation, increased privatization, and the implementation of newhousing policies (Li & Yi, 2007). For urban poor families, it is impor-tant to identify the composition of housing tenure and analyze itsrelationship with their housing conditions.
Classification of housing tenure
Based on a careful evaluation of different variants of housingstructure in the sample population, this study categorizes thehousing tenure into three major classes, including those of renters,nominal owners, and self-dependent dwellers (see Table 3 for de-tails). This categorization takes into account the particular land andhousing institutions in China, according to which all urban land be-longs to the state and rural land is collectively owned by peasants.For urban housing development, the state usually grants the ‘‘useright’’ of approved land blocks to developers on lease terms for aperiod of time (up to 70 years), which can be later transferred tohome owners. Therefore, home ownership in China is jointly de-fined by both land-use right and housing ownership. They are offi-cially certified by: (1) the land-use permit, which certifies the stateapproval for housing construction on the given land lot, and (2) thehousing ownership certificate, which authenticates home owners’property rights to their housing. It should be noted that the aboveclassification is specifically devised to fit the data and goals of thisstudy, and one should avoid over-generalizing this classification
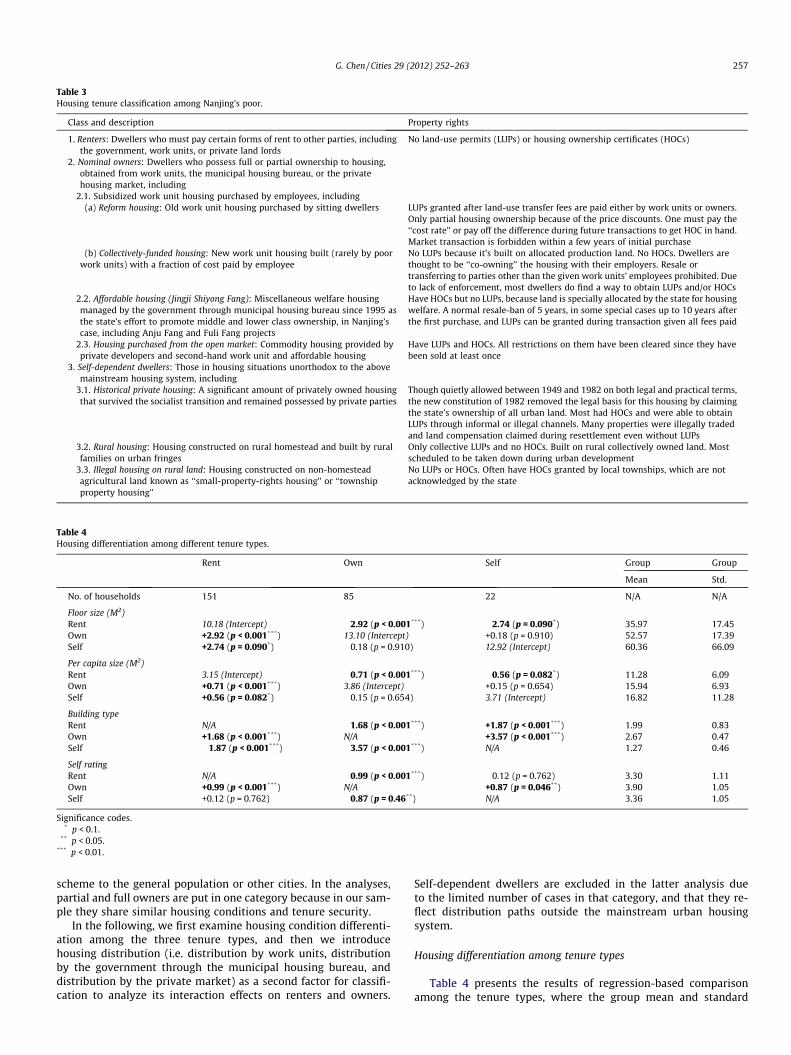
Table 3Housing tenure classification among Nanjing’s poor.
Class and description Property rights
1. Renters: Dwellers who must pay certain forms of rent to other parties, includingthe government, work units, or private land lords
No land-use permits (LUPs) or housing ownership certificates (HOCs)
2. Nominal owners: Dwellers who possess full or partial ownership to housing,obtained from work units, the municipal housing bureau, or the privatehousing market, including
2.1. Subsidized work unit housing purchased by employees, including(a) Reform housing: Old work unit housing purchased by sitting dwellers LUPs granted after land-use transfer fees are paid either by work units or owners.
Only partial housing ownership because of the price discounts. One must pay the‘‘cost rate’’ or pay off the difference during future transactions to get HOC in hand.Market transaction is forbidden within a few years of initial purchase
(b) Collectively-funded housing: New work unit housing built (rarely by poorwork units) with a fraction of cost paid by employee
No LUPs because it’s built on allocated production land. No HOCs. Dwellers arethought to be ‘‘co-owning’’ the housing with their employers. Resale ortransferring to parties other than the given work units’ employees prohibited. Dueto lack of enforcement, most dwellers do find a way to obtain LUPs and/or HOCs
2.2. Affordable housing (Jingji Shiyong Fang): Miscellaneous welfare housingmanaged by the government through municipal housing bureau since 1995 asthe state’s effort to promote middle and lower class ownership, in Nanjing’scase, including Anju Fang and Fuli Fang projects
Have HOCs but no LUPs, because land is specially allocated by the state for housingwelfare. A normal resale-ban of 5 years, in some special cases up to 10 years afterthe first purchase, and LUPs can be granted during transaction given all fees paid
2.3. Housing purchased from the open market: Commodity housing provided byprivate developers and second-hand work unit and affordable housing
Have LUPs and HOCs. All restrictions on them have been cleared since they havebeen sold at least once
3. Self-dependent dwellers: Those in housing situations unorthodox to the abovemainstream housing system, including
3.1. Historical private housing: A significant amount of privately owned housingthat survived the socialist transition and remained possessed by private parties
Though quietly allowed between 1949 and 1982 on both legal and practical terms,the new constitution of 1982 removed the legal basis for this housing by claimingthe state’s ownership of all urban land. Most had HOCs and were able to obtainLUPs through informal or illegal channels. Many properties were illegally tradedand land compensation claimed during resettlement even without LUPs
3.2. Rural housing: Housing constructed on rural homestead and built by ruralfamilies on urban fringes
Only collective LUPs and no HOCs. Built on rural collectively owned land. Mostscheduled to be taken down during urban development
3.3. Illegal housing on rural land: Housing constructed on non-homesteadagricultural land known as ‘‘small-property-rights housing’’ or ‘‘townshipproperty housing’’
No LUPs or HOCs. Often have HOCs granted by local townships, which are notacknowledged by the state
Table 4Housing differentiation among different tenure types.
Rent Own Self Group Group
Mean Std.
No. of households 151 85 22 N/A N/A
Floor size (M2)Rent 10.18 (Intercept) �2.92 (p < 0.001***) �2.74 (p = 0.090*) 35.97 17.45Own +2.92 (p < 0.001***) 13.10 (Intercept) +0.18 (p = 0.910) 52.57 17.39Self +2.74 (p = 0.090*) �0.18 (p = 0.910) 12.92 (Intercept) 60.36 66.09
Per capita size (M2)Rent 3.15 (Intercept) �0.71 (p < 0.001***) �0.56 (p = 0.082*) 11.28 6.09Own +0.71 (p < 0.001***) 3.86 (Intercept) +0.15 (p = 0.654) 15.94 6.93Self +0.56 (p = 0.082*) �0.15 (p = 0.654) 3.71 (Intercept) 16.82 11.28
Building typeRent N/A �1.68 (p < 0.001***) +1.87 (p < 0.001***) 1.99 0.83Own +1.68 (p < 0.001***) N/A +3.57 (p < 0.001***) 2.67 0.47Self �1.87 (p < 0.001***) �3.57 (p < 0.001***) N/A 1.27 0.46
Self ratingRent N/A �0.99 (p < 0.001***) �0.12 (p = 0.762) 3.30 1.11Own +0.99 (p < 0.001***) N/A +0.87 (p = 0.046**) 3.90 1.05Self +0.12 (p = 0.762) �0.87 (p = 0.46**) N/A 3.36 1.05
Significance codes.* p < 0.1.
** p < 0.05.*** p < 0.01.
G. Chen / Cities 29 (2012) 252–263 257
scheme to the general population or other cities. In the analyses,partial and full owners are put in one category because in our sam-ple they share similar housing conditions and tenure security.
In the following, we first examine housing condition differenti-ation among the three tenure types, and then we introducehousing distribution (i.e. distribution by work units, distributionby the government through the municipal housing bureau, anddistribution by the private market) as a second factor for classifi-cation to analyze its interaction effects on renters and owners.
Self-dependent dwellers are excluded in the latter analysis dueto the limited number of cases in that category, and that they re-flect distribution paths outside the mainstream urban housingsystem.
Housing differentiation among tenure types
Table 4 presents the results of regression-based comparisonamong the tenure types, where the group mean and standard
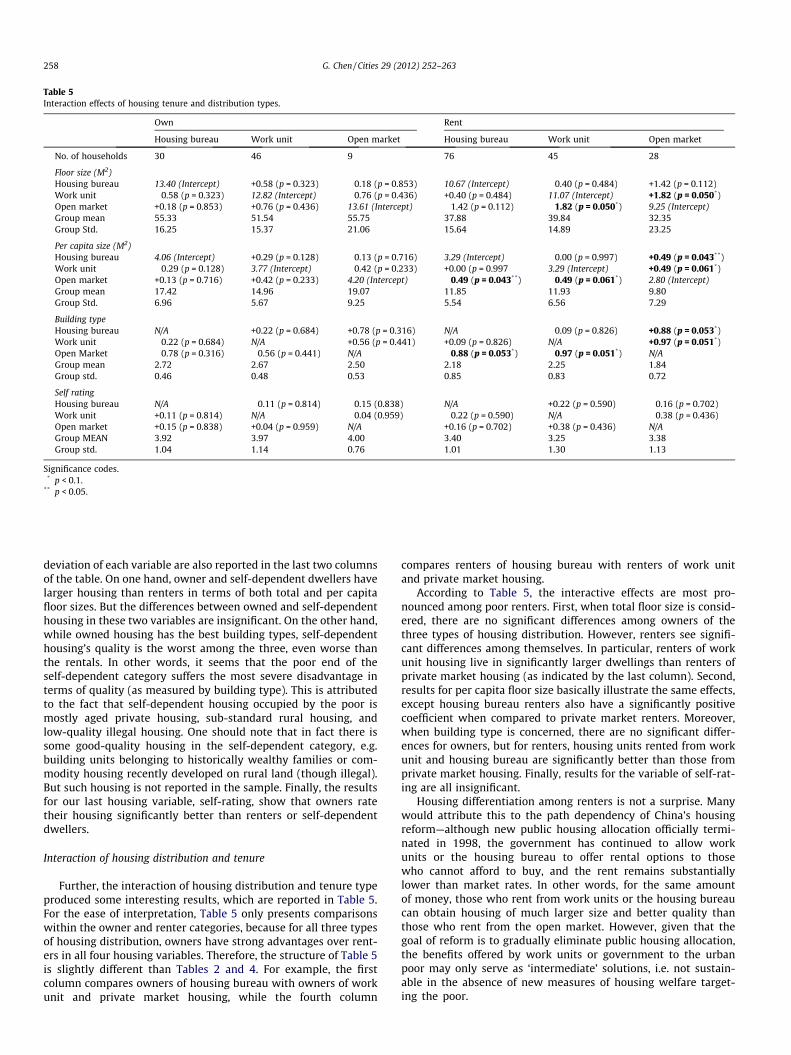
Table 5Interaction effects of housing tenure and distribution types.
Own Rent
Housing bureau Work unit Open market Housing bureau Work unit Open market
No. of households 30 46 9 76 45 28
Floor size (M2)Housing bureau 13.40 (Intercept) +0.58 (p = 0.323) �0.18 (p = 0.853) 10.67 (Intercept) �0.40 (p = 0.484) +1.42 (p = 0.112)Work unit �0.58 (p = 0.323) 12.82 (Intercept) �0.76 (p = 0.436) +0.40 (p = 0.484) 11.07 (Intercept) +1.82 (p = 0.050*)Open market +0.18 (p = 0.853) +0.76 (p = 0.436) 13.61 (Intercept) �1.42 (p = 0.112) �1.82 (p = 0.050*) 9.25 (Intercept)Group mean 55.33 51.54 55.75 37.88 39.84 32.35Group Std. 16.25 15.37 21.06 15.64 14.89 23.25
Per capita size (M2)Housing bureau 4.06 (Intercept) +0.29 (p = 0.128) �0.13 (p = 0.716) 3.29 (Intercept) �0.00 (p = 0.997) +0.49 (p = 0.043**)Work unit �0.29 (p = 0.128) 3.77 (Intercept) �0.42 (p = 0.233) +0.00 (p = 0.997 3.29 (Intercept) +0.49 (p = 0.061*)Open market +0.13 (p = 0.716) +0.42 (p = 0.233) 4.20 (Intercept) �0.49 (p = 0.043**) �0.49 (p = 0.061*) 2.80 (Intercept)Group mean 17.42 14.96 19.07 11.85 11.93 9.80Group Std. 6.96 5.67 9.25 5.54 6.56 7.29
Building typeHousing bureau N/A +0.22 (p = 0.684) +0.78 (p = 0.316) N/A �0.09 (p = 0.826) +0.88 (p = 0.053*)Work unit �0.22 (p = 0.684) N/A +0.56 (p = 0.441) +0.09 (p = 0.826) N/A +0.97 (p = 0.051*)Open Market �0.78 (p = 0.316) �0.56 (p = 0.441) N/A �0.88 (p = 0.053*) �0.97 (p = 0.051*) N/AGroup mean 2.72 2.67 2.50 2.18 2.25 1.84Group std. 0.46 0.48 0.53 0.85 0.83 0.72
Self ratingHousing bureau N/A �0.11 (p = 0.814) �0.15 (0.838) N/A +0.22 (p = 0.590) �0.16 (p = 0.702)Work unit +0.11 (p = 0.814) N/A �0.04 (0.959) �0.22 (p = 0.590) N/A �0.38 (p = 0.436)Open market +0.15 (p = 0.838) +0.04 (p = 0.959) N/A +0.16 (p = 0.702) +0.38 (p = 0.436) N/AGroup MEAN 3.92 3.97 4.00 3.40 3.25 3.38Group std. 1.04 1.14 0.76 1.01 1.30 1.13
Significance codes.* p < 0.1.
** p < 0.05.
258 G. Chen / Cities 29 (2012) 252–263
deviation of each variable are also reported in the last two columnsof the table. On one hand, owner and self-dependent dwellers havelarger housing than renters in terms of both total and per capitafloor sizes. But the differences between owned and self-dependenthousing in these two variables are insignificant. On the other hand,while owned housing has the best building types, self-dependenthousing’s quality is the worst among the three, even worse thanthe rentals. In other words, it seems that the poor end of theself-dependent category suffers the most severe disadvantage interms of quality (as measured by building type). This is attributedto the fact that self-dependent housing occupied by the poor ismostly aged private housing, sub-standard rural housing, andlow-quality illegal housing. One should note that in fact there issome good-quality housing in the self-dependent category, e.g.building units belonging to historically wealthy families or com-modity housing recently developed on rural land (though illegal).But such housing is not reported in the sample. Finally, the resultsfor our last housing variable, self-rating, show that owners ratetheir housing significantly better than renters or self-dependentdwellers.
Interaction of housing distribution and tenure
Further, the interaction of housing distribution and tenure typeproduced some interesting results, which are reported in Table 5.For the ease of interpretation, Table 5 only presents comparisonswithin the owner and renter categories, because for all three typesof housing distribution, owners have strong advantages over rent-ers in all four housing variables. Therefore, the structure of Table 5is slightly different than Tables 2 and 4. For example, the firstcolumn compares owners of housing bureau with owners of workunit and private market housing, while the fourth column
compares renters of housing bureau with renters of work unitand private market housing.
According to Table 5, the interactive effects are most pro-nounced among poor renters. First, when total floor size is consid-ered, there are no significant differences among owners of thethree types of housing distribution. However, renters see signifi-cant differences among themselves. In particular, renters of workunit housing live in significantly larger dwellings than renters ofprivate market housing (as indicated by the last column). Second,results for per capita floor size basically illustrate the same effects,except housing bureau renters also have a significantly positivecoefficient when compared to private market renters. Moreover,when building type is concerned, there are no significant differ-ences for owners, but for renters, housing units rented from workunit and housing bureau are significantly better than those fromprivate market housing. Finally, results for the variable of self-rat-ing are all insignificant.
Housing differentiation among renters is not a surprise. Manywould attribute this to the path dependency of China’s housingreform—although new public housing allocation officially termi-nated in 1998, the government has continued to allow workunits or the housing bureau to offer rental options to thosewho cannot afford to buy, and the rent remains substantiallylower than market rates. In other words, for the same amountof money, those who rent from work units or the housing bureaucan obtain housing of much larger size and better quality thanthose who rent from the open market. However, given that thegoal of reform is to gradually eliminate public housing allocation,the benefits offered by work units or government to the urbanpoor may only serve as ‘intermediate’ solutions, i.e. not sustain-able in the absence of new measures of housing welfare target-ing the poor.

Fig. 2. Reasons of housing changes.
G. Chen / Cities 29 (2012) 252–263 259
The impact of housing change and resettlement
One of the most interesting issues is how the urban poor, whichmostly emerged after the economic reform, have been affected bythe changes in their housing after the reform, especially the mas-sive resettlement processes in the city due to urban renewal, mu-nicipal expansion, and real estate development. Note again thatour survey was conducted at a time when the city was experienc-ing the most dramatic overhaul, which provides us with a primecase to explore this dimension of housing condition differentiationamong the urban poor. Specifically, we use the information abouthousing transition in the survey data to derive households thatchanged their primary dwellings after 1979. The differentiationeffects that housing changes produce on the poor’s housing condi-tions, as well as their interaction with categories of housing tenureand housing distribution, are examined in this section.
Table 6Housing differentiation between resettlement/non-resettlement sub-groups.
Floorsize (M2)
Per capita floorsize (M2)
Buildingtype
Self-rating
Resettlement 47.99 14.72 2.58 3.76Non-resettlement 40.18 12.28 2.17 3.46p (ANOVA) 0.001*** 0.003*** <0.001*** 0.070*
Significance codes.* p < 0.1.
*** p < 0.01.
Housing changes since the reform
According to the survey data, 190 of the total of 259 poor house-holds changed their primary dwellings after 1979. In the survey,we asked interviewees about their primary reasons for housingchanges, and the answers are summarized in Fig. 2. As shown inthe figure, 76 of the households (40%) changed their housing dueto resettlement. Housing allocation is another important reason,accounting for 60 (31%) of the 190 households. This refers to hous-ing changes resulting from allocation activities initiated by theiremployers or the local government without resettlement goals orspecific personal motivations on the dwellers’ side, e.g. simplybecause there is an opportunity to offer housing. Personal choices,including work-related considerations (e.g. living closer to thework place), household changes (e.g. marriage), other family-re-lated concerns (e.g. child education), and individual preferencesconstitute the third largest sub-group of housing changes, reportedby 43 (23%) households. Although one can hypothesize that thetiming for the change in housing may have some impact on hous-ing conditions, in our data we did not find any evidence of that.
Since we are most interested in the impact of resettlement onhousing, we divide the 190 households into two sub-groups: thosewho changed their housing because of resettlement and those whodid so for other reasons. The mean values of the four housing vari-ables for each sub-group plus the results of one-way ANOVA testsare listed in Table 6. It is evident that the resettlement sub-group’shousing conditions are significantly better than non-resettlementsub-group, as reflected by ANOVA tests on all four variables. Thisindicates that resettlement, although sometimes involving bitterconflicts between dwellers and developers, has positive effectson the urban poor’s housing conditions.
However, a simple comparison between resettled and non-resettled groups may not completely reveal the housing differenti-ation among the poor. In previous studies such as Li (2003) and Liand Yi (2007), resettlement housing has been categorized underthe same classification hierarchy with work units or housing frommunicipal housing bureaus. In the city of Nanjing, however, this isnot a preferable approach because resettlement can be a complexprocess driven by multiple forces. For instance, during the 1980sa large scale urban renewal effort was launched by the municipalgovernment, which resettled many people living in the old innercity at the time. In the 1990s and during more recent years after2000, private urban development has become more often the maindriver of resettlement. During these waves of redevelopment, workunits sometimes can play an important role because in many situ-ations the government would ask the relevant work unit to assistthe management of the resettlement and/or even share some costs.Therefore, it is not appropriate to treat housing obtained after
resettlement as a category side by side with those distributed bywork units or housing bureau. Instead, we regard housing distribu-tion and housing change as two factors, the interaction of whichcan produce more subtle effects on the poor.
Interaction of resettlement and housing distribution
The interaction effects produced by housing change and distri-bution are reported in Table 7, which are produced using the sameregression-based method employed before. The structure of Table7 is similar to Table 2, as all sub-groups generated by the interac-tion are compared in a pairwise way.
First, resettlement housing distributed by work units and hous-ing bureau is significantly larger in total floor size than almost alltypes of non-resettlement housing. This is illustrated by the firsttwo columns of Table 7, as all three housing distribution sub-groups in the non-resettlement category have significant negativecoefficients when compared with housing bureau or work unithousing in the resettlement category (with the exception of non-resettlement work unit housing). Private-market housing in theresettlement category, on the other hand, does not have the samekind of advantage (as shown in column 3). For non-resettlementhousing, which is compared in columns 4, 5, and 6, we can see thathousing distributed by work units is significantly larger than thosedistributed by the housing bureau and the private market.
Second, a similar pattern is observed for per capita floor size,where, in the resettlement category, housing from work unit andhousing bureau are significantly larger than almost all types ofnon-resettlement housing, and work unit housing in the non-reset-tlement category is significantly larger than other non-resettle-ment housing.
Third, when building type is examined, resettlement housingmanaged by the housing bureau or work units is generally betterthan non-resettlement housing. On the contrary, private markethousing in the resettlement category elicits considerable negative

Table 7Interaction effects of housing changes and housing distribution.
Resettlement Non-resettlement
Housing bureau Work unit Open market Housing bureau Work unit Open market
No. of households 51 17 8 34 54 26
Housing size (M2)Resettlement 12.52 �0.50 +2.06 +2.46 +0.64 +2.30Housing bureau (Intercept) (p = 0.449) (p = 0.202) (p < 0.001***) (p = 0.191) (p = 0.10**)Resettlement +0.50 13.02 +2.55 +2.95 +1.14 +2.79Work unit (p = 0.449) (Intercept) (p = 0.128) (p < 0.001***) (p = 0.09*) (p = 0.005***)Resettlement �2.06 �2.55 10.46 +0.40 �1.42 +0.24Open market (p = 0.202) (p = 0.128) (Intercept) (p = 0.811) (p = 0.383) (p = 0.893)Non-resettlement �2.46 �2.95 �0.40 10.06 �1.82 �0.16Housing bureau (p < 0.001***) (p < 0.001***) (p = 0.811) (Intercept) (p = 0.006***) (p = 0.873)Non-resettlement �0.64 �1.14 +1.42 +1.82 11.88 +1.66Work unit (p = 0.191) (p = 0.09*) (p = 0.383) (p = 0.006***) (Intercept) (p = 0.068*)Non-resettlement �2.30 �2.79 �0.24 +0.16 �1.66 10.22Open market (p = 0.010**) (p = 0.005***) (p = 0.893) (p = 0.873) (p = 0.068*) (Intercept)Group mean 48.25 51.38 39.13 35.15 44.66 37.46Group std. 14.45 15.54 29.03 19.22 16.14 23.71
Per capita size (M2)Resettlement 3.78 +0.07 +0.60 +0.66 +0.27 +0.66Housing bureau (Intercept) (p = 0.737) (p = 0.185) (p < 0.001***) (p = 0.068*) (p = 0.011**)Resettlement �0.07 3.71 +0.52 +0.59 +0.20 +0.59Work unit (p = 0.737) (Intercept) (p = 0.271) (p = 0.016**) (p = 0.356) (p = 0.051*)Resettlement �0.60 �0.52 3.18 +0.06 �0.33 +0.07Open market (p = 0.185) (p = 0.271) (Intercept) (p = 0.895) (p = 0.470) (p = 0.890)Non-resettlement �0.66 �0.51 �0.06 3.12 �0.39 +0.01Housing bureau (p < 0.001***) (p = 0.016**) (p = 0.895) (Intercept) (p = 0.041**) (p = 0.980)Non-resettlement �0.27 �0.20 +0.33 +0.39 3.51 +0.39Work unit (p = 0.068*) (p = 0.356) (p = 0.470) (p = 0.041**) (Intercept) (p = 0.132)Non-resettlement �0.66 �0.59 �0.07 �0.01 �0.39 3.11Open market (p = 0.011**) (p = 0.051*) (p = 0.890) (p = 0.980) (p = 0.132) (Intercept)Group mean 15.09 14.67 12.43 11.07 13.25 11.84Group std. 6.22 6.95 9.92 6.18 6.02 8.40
Building typeResettlement N/A +0.50 +2.56 +2.64 +0.85 +1.77Housing bureau (p = 0.398) (p < 0.001***) (p < 0.001***) (p = 0.034**) (p < 0.001***)Resettlement �0.50 N/A +2.06 +2.14 +0.35 +1.27Work unit (p = 0.398) (p = 0.013**) (p < 0.001***) (p = 0.533) (p = 0.046**)Resettlement �2.56 �2.06 N/A +0.08 �1.71 �0.79Open market (p < 0.001***) (p = 0.013**) (p = 0.910) (p = 0.015**) (p = 0.289Non-resettlement �2.64 �2.14 �0.08 N/A �1.79 �0.88Housing bureau (p < 0.001***) (p < 0.001***) (p = 0.910) (p < 0.001***) (p = 0.090*)Non-resettlement �0.85 �0.35 +1.71 +1.79 N/A +0.92Work unit (p = 0.034**) (p = 0.533) (p = 0.015**) (p < 0.001***) (p = 0.047**)Non-resettlement �1.77 �1.27 +0.79 +0.88 �0.92 N/AOpen market (p < 0.001***) (p = 0.046**) (p = 0.289) (p = 0.090*) (p = 0.047**)Group mean 2.73 2.53 1.75 1.76 2.46 2.08Group std. 0.45 0.72 0.71 0.85 0.61 0.84
Self ratingResettlement N/A �0.89 �0.62 +0.34 +0.23 +0.26Housing bureau (p = 0.087*) (p = 0.340) (p = 0.385) (p = 0.536) (p = 0.551)Resettlement +0.89 N/A +0.27 +1.23 +1.11 +1.15Work unit (p = 0.087*) (0.715) (p = 0.024**) (p = 0.033**) (p = 0.047**)Resettlement +0.62 �0.27 N/A +0.96 +0.84 +0.88Open market (p = 0.340) (p = 0.715) (p = 0.150) (p = 0.194) (p = 0.206)Non-resettlement �0.34 �1.23 �0.96 N/A �0.12 �0.08Housing Bureau (p = 0.385) (p = 0.024**) (p = 0.150) (p = 0.765) (p = 0.865)Non-resettlement �0.23 �1.11 �0.84 +0.12 N/A +0.04Work unit (0.536) (p = 0.033**) (p = 0.194) (p = 0.765) (p = 0.931)Non-resettlement �0.26 �1.15 �0.88 +0.08 �0.04 N/AOpen market (0.551) (p = 0.047**) (p = 0.206) (p = 0.865) (p = 0.931)Group mean 3.61 4.12 4.00 3.47 3.50 3.38Group std. 1.11 0.99 0.53 0.93 1.30 1.17
Significance codes.* p < 0.1.
** p < 0.05.*** p < 0.01.
260 G. Chen / Cities 29 (2012) 252–263
effects, as it is not only worse than the other two types of resettle-ment housing, but also worse than the work unit housing in thenon-resettlement category. Moreover, attention should be paid to
the non-resettlement housing from the housing bureau, becausealthough managed by the government, its building type is theworst among all non-resettlement housing. In fact non-resettlement
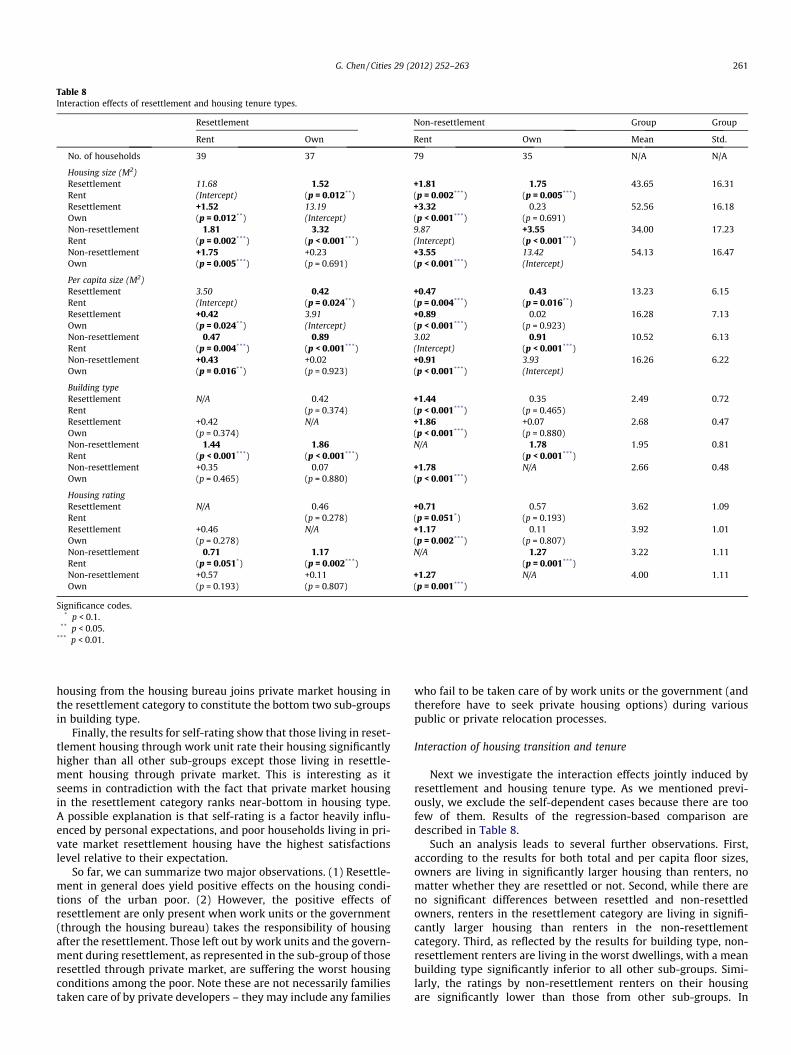
Table 8Interaction effects of resettlement and housing tenure types.
Resettlement Non-resettlement Group Group
Rent Own Rent Own Mean Std.
No. of households 39 37 79 35 N/A N/A
Housing size (M2)Resettlement 11.68 �1.52 +1.81 �1.75 43.65 16.31Rent (Intercept) (p = 0.012**) (p = 0.002***) (p = 0.005***)Resettlement +1.52 13.19 +3.32 �0.23 52.56 16.18Own (p = 0.012**) (Intercept) (p < 0.001***) (p = 0.691)Non-resettlement �1.81 �3.32 9.87 +3.55 34.00 17.23Rent (p = 0.002***) (p < 0.001***) (Intercept) (p < 0.001***)Non-resettlement +1.75 +0.23 +3.55 13.42 54.13 16.47Own (p = 0.005***) (p = 0.691) (p < 0.001***) (Intercept)
Per capita size (M2)Resettlement 3.50 �0.42 +0.47 �0.43 13.23 6.15Rent (Intercept) (p = 0.024**) (p = 0.004***) (p = 0.016**)Resettlement +0.42 3.91 +0.89 �0.02 16.28 7.13Own (p = 0.024**) (Intercept) (p < 0.001***) (p = 0.923)Non-resettlement �0.47 �0.89 3.02 �0.91 10.52 6.13Rent (p = 0.004***) (p < 0.001***) (Intercept) (p < 0.001***)Non-resettlement +0.43 +0.02 +0.91 3.93 16.26 6.22Own (p = 0.016**) (p = 0.923) (p < 0.001***) (Intercept)
Building typeResettlement N/A �0.42 +1.44 �0.35 2.49 0.72Rent (p = 0.374) (p < 0.001***) (p = 0.465)Resettlement +0.42 N/A +1.86 +0.07 2.68 0.47Own (p = 0.374) (p < 0.001***) (p = 0.880)Non-resettlement �1.44 �1.86 N/A �1.78 1.95 0.81Rent (p < 0.001***) (p < 0.001***) (p < 0.001***)Non-resettlement +0.35 �0.07 +1.78 N/A 2.66 0.48Own (p = 0.465) (p = 0.880) (p < 0.001***)
Housing ratingResettlement N/A �0.46 +0.71 �0.57 3.62 1.09Rent (p = 0.278) (p = 0.051*) (p = 0.193)Resettlement +0.46 N/A +1.17 �0.11 3.92 1.01Own (p = 0.278) (p = 0.002***) (p = 0.807)Non-resettlement �0.71 �1.17 N/A �1.27 3.22 1.11Rent (p = 0.051*) (p = 0.002***) (p = 0.001***)Non-resettlement +0.57 +0.11 +1.27 N/A 4.00 1.11Own (p = 0.193) (p = 0.807) (p = 0.001***)
Significance codes.* p < 0.1.
** p < 0.05.*** p < 0.01.
G. Chen / Cities 29 (2012) 252–263 261
housing from the housing bureau joins private market housing inthe resettlement category to constitute the bottom two sub-groupsin building type.
Finally, the results for self-rating show that those living in reset-tlement housing through work unit rate their housing significantlyhigher than all other sub-groups except those living in resettle-ment housing through private market. This is interesting as itseems in contradiction with the fact that private market housingin the resettlement category ranks near-bottom in housing type.A possible explanation is that self-rating is a factor heavily influ-enced by personal expectations, and poor households living in pri-vate market resettlement housing have the highest satisfactionslevel relative to their expectation.
So far, we can summarize two major observations. (1) Resettle-ment in general does yield positive effects on the housing condi-tions of the urban poor. (2) However, the positive effects ofresettlement are only present when work units or the government(through the housing bureau) takes the responsibility of housingafter the resettlement. Those left out by work units and the govern-ment during resettlement, as represented in the sub-group of thoseresettled through private market, are suffering the worst housingconditions among the poor. Note these are not necessarily familiestaken care of by private developers – they may include any families
who fail to be taken care of by work units or the government (andtherefore have to seek private housing options) during variouspublic or private relocation processes.
Interaction of housing transition and tenure
Next we investigate the interaction effects jointly induced byresettlement and housing tenure type. As we mentioned previ-ously, we exclude the self-dependent cases because there are toofew of them. Results of the regression-based comparison aredescribed in Table 8.
Such an analysis leads to several further observations. First,according to the results for both total and per capita floor sizes,owners are living in significantly larger housing than renters, nomatter whether they are resettled or not. Second, while there areno significant differences between resettled and non-resettledowners, renters in the resettlement category are living in signifi-cantly larger housing than renters in the non-resettlementcategory. Third, as reflected by the results for building type, non-resettlement renters are living in the worst dwellings, with a meanbuilding type significantly inferior to all other sub-groups. Simi-larly, the ratings by non-resettlement renters on their housingare significantly lower than those from other sub-groups. In
262 G. Chen / Cities 29 (2012) 252–263
summary, these findings suggest that housing differentiationcaused by resettlement is mainly occurring with poor renters,and non-resettlement renters seem to be the most disadvantagedsub-group among the poor households in all aspects of housingconditions.
Discussion and conclusion
In summary, this study examines the variation of housing con-ditions among Nanjing’s poor households from the perspectives ofHukou, housing tenure and distribution, and housing change. Ourresults are certainly limited by the specificity of the city, and hencecannot be over interpreted. However, as one of the few attempts byscholars to capture the housing condition of the poor, based on aconsiderably large random sample (around 1000 households) anda multi-criteria screening process to select the poor for face-to-faceinterview, it provides important insights into China’s housing con-ditions for the urban poor from three perspectives. We examinethese to explore the housing differentiation among the poor inChinese cities, based on the context of several driving forces ofhousing changes in china. First, in regard to the impact of Hukou,we have found that those with local urban Hukou generally havebetter conditions than other families, although non-local urbanhouseholds (urban migrants) have the largest (but not the best-quality)housing. In particular, rural migrants, i.e. those with non-local ruralHukou, suffer the most severe housing difficulties. Second, as forhousing tenure, both owners and self-dependent dwellers live inconsiderably larger housing than renters, but only owners havebetter housing quality. Owners also rate their housing higher.The interaction of housing tenure and housing distribution showsthat poor renters’ housing conditions are largely dependent onwhether they can obtain housing from work units or the municipalhousing bureau. Those renting from the private market live in theworst conditions among the poor. Finally, as a survey conductedduring the heyday of the latest round of urban redevelopment inNanjing, this study, though not able to include the housing changeinformation of the respondents who were then still negotiating acompensation package, very well captures the impact of the majorrounds of housing change on the urban poor living inside the city.Resettlement is found to be a major reason for housing change, andhousing conditions for those who resettled after 1979 are betterthan those who changed their housing for other reasons. However,resettlement has a negative impact on poor families without hous-ing support from work units or the municipal government. Fornon-resettlement groups, work unit is the best source of housingdistribution, while the government, represented by municipalhousing bureau, is not competent in housing provision. Whileresettlement does not differentiate the housing conditions of own-ers, it greatly impacts renters. Renters who have not resettled sincethe reform live in worse conditions among the poor.
This study reveals that the urban poor’s housing in today’s Chinafeatures the following characteristics. It is (1) path-dependent, aselements of the old institutions such as Hukou and work unithousing allocation remain influential factors in housing; (2) priv-atization-oriented, since private owners have access to betterhousing than non-owners; and (3) development-driven, becauseresettlement can usually lead to better housing. In detail, first,thirty years into the reform, there is no sign that unfair institu-tional divisions are waning. Second, the differentiation amongvarious tenure types can be hardly hailed as progress: since evenpoor owners’ housing standards are well below the city’s average,their ‘‘advantages’’ over non-owners are more likely due to theworsening of housing conditions for those who cannot own, ratherthan a positive improvement brought by privatization. Finally, theeffects of resettlement indicate a lack of housing welfare provision,
and the government struggles to provide housing to the poor with-out the backing of profit-driven or well-funded development pro-jects. It is notable that the central government has recentlystarted to press local governments in curbing housing prices anddeveloping alternative (public) housing sources for lower-incomeclasses. How significant this new ‘public’ housing sector is inaffecting the poor’s housing differentiation and prospects has yetto be studied. In fact, our study shows that poor families that arestill under the influence of the old system, e.g. those living in workunit housing, seem to be suffering less housing difficulties thanthose more exposed to the reform, e.g. poor families who have toseek housing in the private market. This is an indicator that thecurrent housing reform in China, which aims to gradually eliminatethe old system, has been actually undermining the housing pros-pects of the urban poor due to the lack of a working housingwelfare system. A housing provision system that can pro-activelyassure the poor’s basic right to housing is urgently needed.
References
Box, G. E. P., & Cox, D. R. (1964). An analysis of transformations. Journal of the RoyalStatistical Society, Series B, 26(2), 211–252.
Chan, K. W. (1994). Cities with invisible walls. Hong Kong: Oxford University Press.Chen, G., Gu, C., & Wu, F. (2004). Spatial analysis of urban poverty in Nanjing.
Scientia Geographica Sinica, 24(5), 542–549.Chen, G., Gu, C., & Wu, F. (2006). Urban poverty in the transitional economy: A case
of Nanjing, China. Habitat International, 30(1), 1–26.Chen, G. (2011). Privatization, marketization, and deprivation: Interpreting the
homeownership paradox in postreform urban China. Environment and PlanningA, 43(5), 1135–1153.
Chiu, R. L. H. (1996). Housing affordability in Shenzhen special economic Zone: Aforerunner of China’s housing reform. Housing Studies, 11(4), 561–580.
Fan, C. C. (1999). Migration in a socialist transitional economy: Heterogeneity,socioeconomic and spatial characteristics of migrants in China and Guangdongprovince. International Migration Review, 33(4), 954–987.
Fan, C. C. (2002). The elite, the natives, and the outsiders: Migration and labormarket segmentation in urban China. Annals of the Association of AmericanGeographers, 92(1), 103–124.
He, S., Liu, Y., Wu, F., & Webster, C. (2008). Poverty incidence and concentration indifferent social groups in urban China, a case study of Nanjing. Cities, 25(3),121–132.
He, S., & Wu, F. (2009). China’s emerging neoliberal urbanism: Perspectives fromurban redevelopment. Antipode, 41(2), 282–304.
Huang, Y. Q. (2003a). Renters’ housing behaviour in transitional urban China.Housing Studies, 18(1), 103–125.
Huang, Y. Q. (2003b). A room of one’s own: Housing consumption and residentialcrowding in transitional urban China. Environment and Planning A, 35(4),591–614.
Huang, Y. Q., & Clark, W. A. V. (2002). Housing tenure choice in transitional urbanChina: A multilevel analysis. Urban Studies, 39(1), 7–32.
Lee, J. (2000). From welfare housing to home ownership: The dilemma of China’shousing reform. Housing Studies, 15(1), 61–76.
Lee, J., & Zhu, Y. P. (2006). Urban governance, neoliberalism and housing reform inChina. Pacific Review, 19(1), 39–61.
Li, S. M. (2000). The housing market and tenure decisions in Chinese cities: Amultivariate analysis of the case of Guangzhou. Housing Studies, 15(2), 213–236.
Li, S. M. (2003). Housing tenure and residential mobility in urban China – A study ofcommodity housing development in Beijing and Guangzhou. Urban AffairsReview, 38(4), 510–534.
Li, S. M., & Huang, Y. Q. (2006). Urban housing in China: Market transition, housingmobility and neighbourhood change. Housing Studies, 21(5), 613–623.
Li, S. M., & Song, Y. L. (2009). Redevelopment, displacement, housing conditions, andresidential satisfaction: A study of Shanghai. Environment and Planning A, 41(5),1090–1108.
Li, S. M., & Yi, Z. (2007). The road to homeownership under market transition –Beijing, 1980–2001. Urban Affairs Review, 42(3), 342–368.
Li, Z. G., & Wu, F. L. (2006). Socio-spatial differentiation and residential inequalitiesin Shanghai: A case study of three neighbourhoods. Housing Studies, 21(5),695–717.
Lin, G. C. S. (2001). Metropolitan development in a transitional socialist economy:Spatial restructuring in the Pearl River Delta, China. Urban Studies, 38(3),383–406.
Lin, G. C. S. (2007). Reproducing spaces of Chinese urbanisation: New city-based andland-centred urban transformation. Urban Studies, 44(9), 1827–1855.
Lin, G. C. S., & Ho, S. P. S. (2005). The state, land system, and land developmentprocesses in contemporary China. Annals of the Association of AmericanGeographers, 95(2), 411–436.
Liu, Y., Wu, F., & He, S. (2008). The making of the new urban poor in transitionalChina: Market versus institutionally based exclusion. Urban Geography, 29(8),811–834.

G. Chen / Cities 29 (2012) 252–263 263
Logan, J. R., Bian, Y. J., & Bian, F. Q. (1990). Housing inequality in urban China in the1990s. International Journal of Urban and Regional Research, 23(1), 7–25.
Ma, L. J. C. (2002). Urban transformation in China, 1949–2000: A review andresearch agenda. Environment and Planning A, 34(9), 1545–1569.
Mak, S. W. K., Choy, L. H. T., & Ho, W. K. O. (2007). Privatization, housing conditionsand affordability in the People’s Republic of China. Habitat International, 31(2),177–192.
Meng, X., Gregory, R., & Wang, Y. J. (2005). Poverty, inequality, and growth in urbanChina, 1986–2000. Journal of Comparative Economics, 33(4), 710–729.
Pannell, C. (1995). China’s urban transition. Journal of Geography, 94(3), 394–403.Sato, H. (2006). Housing inequality and housing poverty in urban China in the late
1990s. China Economic Review, 17(1), 37–50.Shen, J. F. (2002). A study of the temporary population in Chinese cities. Habitat
International, 26(3), 363–377.Sit, V. F. S. (2005). China’s extended metropolitan regions: Formation and
delimitation. International Development Planning Review, 27(3), 297–331.Sun, T., Li, G., & Lu, M. (2009). Concentration and decentralization of population in
the Beijing–Tianjin–Hebei metropolitan region and its determinants: A regionaldensity function approach. Acta Geographica Sinica, 64(8), 956–966.
Wang, Y. P. (2000). Housing reform and its impacts on the urban poor in China.Housing Studies, 15(6), 845–864.
Wang, Y. P. (2004). Urban poverty, housing and social change in China. New York:Routledge.
Wang, Y. P., & Murie, A. (1999). Housing policy and practice in China. New York: St.Martin’s Press, Inc..
White, H. (1980). A heteroskedasticity-consistent covariance matrix estimator and adirect test for heteroskedasticity. Econometrica, 48(4), 817–838.
Wu, F. (2001). Housing provision under globalisation: A case study of Shanghai.Environment and Planning A, 33(10), 1741–1764.
Wu, F. (2007). The poverty of transition: From industrial district to poorneighbourhood in the city of Nanjing, China. Urban Studies, 44(13), 2673–2694.
Wu, F., & He, S. (2005). Changes in traditional urban areas and impacts of urbanredevelopment – A case study of three neighbourhoods in Nanjing, China.Tijdschrift Voor Economische En Sociale Geografie, 96(1), 75–95.
Wu, F., & Huang, N. (2007). New urban poverty in China: Economic restructuringand transformation of welfare provision. Asia Pacific Viewpoint, 48(2), 168–185.
Wu, W. P. (2002). Migrant housing in urban China – Choices and constraints. UrbanAffairs Review, 38(1), 90–119.
Wu, W. P. (2004). Sources of migrant housing disadvantage in urban China.Environment and Planning A, 36(7), 1285–1304.
Yao, J. (2004). Housing conditions, problems, and solutions for Nanjing’s urbanresidents, Nanjing Municipal Statistics Bureau, Nanjing, China.
Yao, S. (2004b). Unemployment and urban poverty in China: A case study ofGuangzhou and Tianjin. Journal of International Development, 16(2), 171–188.
Zhang, X., & Sit, V. F. S. (2006). Characteristics of the Yangtze River delta Mega-CityRegion. Acta Geographica Sinica, 61(10), 1025–1036.
Zhao, Y. S., & Bourassa, S. C. (2003). China’s urban housing reform: Recentachievements and new inequities. Housing Studies, 18(5), 721–744.