household use of chemical pesticides and fertilizers...household use of chemical pesticides and...
TRANSCRIPT

HOUSEHOLD USE OF CHEMICAL PESTICIDES AND FERTILIZERS CANADIAN ENVIRONMENTAL
SUSTAINABILITY INDICATORS

Household use of chemical pesticides and fertilizers Page 2 of 12
Suggested citation for this document: Environment and Climate Change Canada (2019) Canadian Environmental Sustainability Indicators: Household use of chemical pesticides and fertilizers. Consulted on Month day, year. Available at: www.canada.ca/en/environment-climate-change/services/environmental-indicators/household-use-
chemical-pesticides-fertilizers.html.
Cat. No.: En4-144/6-2019E-PDF ISBN: 978-0-660-32737-2
Unless otherwise specified, you may not reproduce materials in this publication, in whole or in part, for the purposes of commercial redistribution without prior written permission from Environment and Climate Change Canada's copyright administrator. To obtain permission to reproduce Government of Canada materials for
commercial purposes, apply for Crown Copyright Clearance by contacting:
Environment and Climate Change Canada Public Inquiries Centre 12th floor, Fontaine Building 200 Sacré-Coeur boul. Gatineau, QC K1A 0H3 Telephone: 1-800-668-6767 (in Canada only) or 819-938-3860 Fax: 819-938-3318
Email: [email protected]
Photos: © Thinkstockphotos.ca; © Environment and Climate Change Canada
© Her Majesty the Queen in Right of Canada, represented by the Minister of Environment and Climate Change, 2019
Aussi disponible en français
Canadian Environmental Sustainability Indicators Page 3 of 12
CANADIAN ENVIRONMENTAL
SUSTAINABILITY INDICATORS
HOUSEHOLD USE OF CHEMICAL PESTICIDES
AND FERTILIZERS
October 2019
Table of contents
Household use of chemical pesticides and fertilizers ............................................................................. 5
Key results .................................................................................................................................... 5
Household use of chemical pesticides and fertilizers by province ............................................................... 6
Key results .................................................................................................................................... 6
About the indicators ............................................................................................................................ 7
What the indicators measure ............................................................................................................ 7
Why these indicators are important.................................................................................................... 7
Related indicators ........................................................................................................................... 7
Data sources and methods .................................................................................................................. 7
Data sources ................................................................................................................................. 7
Methods ........................................................................................................................................ 8
Recent changes ............................................................................................................................. 9
Caveats and limitations.................................................................................................................... 9
Resources ........................................................................................................................................ 9
References .................................................................................................................................... 9
Related information ......................................................................................................................... 9
Annex ............................................................................................................................................... 11
Annex A. Data tables for the figures presented in this document.............................................................. 11

Household use of chemical pesticides and fertilizers Page 4 of 12
List of Figures
Figure 1. Percentage of households in Canada with a lawn or garden using chemical pesticides and fertilizers, selected years .................................................................................................................................. 5
Figure 2. Percentage of households with a lawn or garden using chemical pesticides and fertilizers by province, Canada, 1994 and 2017 ....................................................................................................... 6
List of Tables
Table A.1. Data for Figure 1. Percentage of households in Canada with a lawn or garden using chemical pesticides and fertilizers, selected years ............................................................................................. 11
Table A.2. Data for Figure 2. Percentage of households with a lawn or garden using chemical pesticides and fertilizers by province, Canada, 1994 and 2017 .................................................................................... 11

Canadian Environmental Sustainability Indicators Page 5 of 12
Household use of chemical pesticides and fertilizers
Households1 use chemical pesticides and fertilizers to improve the look of their lawns and gardens. These chemicals can pollute lakes and rivers that may be sources of drinking water for some communities. Chemical pesticides are also toxic to many forms of life and can threaten beneficial species, such as honeybees. The
indicators report the percentage of households using chemical pesticides or fertilizers.
Key results
Between 1994 and 2017, the percentage of households in Canada using chemical2 pesticides and fertilizers on their lawns and gardens decreased
Since 2013, the percentage of households using pesticides has remained stable at 19% While the percentage of households using fertilizers increased between 2011 and 2015, it has decreased
in 2017
Figure 1. Percentage of households in Canada with a lawn or garden using chemical pesticides and fertilizers, selected years
Data for Figure 1
Note: The percentage of households refer to the percentage of households with a lawn or garden only. In 1994 and 2005-2006, the Households and the Environment Survey did not make the distinction between natural and chemical ferti lizers and pesticides. However, there
were not many natural remedies available at that time. The impact on the trend is, therefore, expected to be minimal. Source: Statistics Canada (2019) Table 38-10-0052-01 - Use of ferti l izer and pesticides. Statistics Canada (2008) Households and the
Environment Survey, 1994 and 2005-2006.
The percentage of households using chemical pesticides and fertilizers decreased from 31% and 47% in 1994 to 15% and 21% in 2011 respectively. For pesticides, this percentage increased to 19% in 2013 and has remained stable since. For fertilizers, it has fluctuated slightly to reach 24% in 2017.
1 The indicator reports data on households with a lawn or garden only.
2 Chemical pesticides and ferti lizers are manufactured. Natural products include the use of nematodes and ladybugs to control p ests, and
manure and compost to ferti l ize lawns and gardens.

Household use of chemical pesticides and fertilizers Page 6 of 12
Cosmetic pesticide bans implemented in many provinces and municipalities have likely influenced the reduction
since the mid-1990's.
Household use of chemical pesticides and fertilizers by province
Key results
In 2017, the Prairie provinces had the highest percentage of households using pesticides and households using fertilizers
The percentage of households using pesticides has decreased since 1994 in most provinces, except in Newfoundland and Labrador, Manitoba, Saskatchewan and Alberta
The percentage of households using fertilizers has decreased since 1994 in every province
Figure 2. Percentage of households with a lawn or garden using chemical pesticides and fertilizers by province, Canada, 1994 and 2017
Data for Figure 2
Note: The percentage of households refer to the percentage of households with a lawn or garden only. In 1994, the Households and the
Environment Survey did not make the distinction between natural and chemical fertilizers and pesticides. However, there were not many natural remedies available at that time. The impact on the trend is therefore expected to be minimal.
Source: Statistics Canada (2019) Table 38-10-0052-01 - Use of ferti l izer and pesticides. Statistics Canada (2008) Households and the
Environment Survey, 1994 and 2005-2006.
In 2017, the highest users of chemical pesticides were Saskatchewan (45% of households), Alberta (37% of households) and Manitoba (36% of households).
Between 1994 and 2017, the largest drop in the percentage of households using chemical pesticides occurred in Quebec, where it decreased from 30% to 9%.
In general, households in provinces with pesticide bans had lower rates of use of the products on their lawns and gardens than the national average of 19% in 2017:
17% in Ontario 11% in Newfoundland and Labrador 10% in New Brunswick and Nova Scotia 9% in Quebec
7% in Prince Edward Island

Canadian Environmental Sustainability Indicators Page 7 of 12
Between 1994 and 2017, the largest drop in the percentage of households using chemical fertilizers occurred in Ontario (from 51% to 24%) and Quebec (from 41% to 17%). In 2017, the proportion of households using chemical fertilizers in Prince Edward Island, New Brunswick, Nova Scotia, Quebec and Newfoundland and Labrador provinces was lower than the national average of 24%. The share of households using fertilizers was the highest in the Prairie provinces, led by Saskatchewan.
About the indicators
What the indicators measure
The indicators report the percentage of households with a lawn or garden that use chemical pesticides and chemical fertilizers in Canada and by province.
Why these indicators are important
Households use chemical pesticides, which include herbicides, insecticides and fungicides, to kill pests and to help improve the look of lawns and gardens. These products can contaminate the air, water, soil and food sources and have negative effects on human and environmental health. For example, insecticides can harm or kill other non-target insects, soil microbes and insect-eating birds, disrupting the natural balance of the lawn or the garden's ecosystem.
Chemical fertilizers contain nitrogen, phosphorus and potassium and are added to lawns and gardens to help them grow greener and thicker. However, if fertilizer is applied improperly or in excess, these nutrients can pollute drainage and storm waters and can eventually reach lakes and rivers. Urban environments often make it easier for these nutrients to run off the land into water bodies because of the many hard surfaces. In addition, water in storm sewers is often not treated before it reaches lakes or rivers and can cause excessive growth of aquatic
plants and algae.
Related indicators
The Water quality in Canadian rivers indicators provide a measure of the ability of river water across Canada to
support plants and animals.
The Phosphorus levels in the offshore waters of the Canadian Great Lakes, Nutrients in the St. Lawrence River, and Nutrients in Lake Winnipeg indicators report the status of total phosphorus and total nitrogen levels in these 3 ecosystems.
The Risk to soil and water quality from agriculture indicator presents changes to soil quality and water quality agri-environmental performance indices over time, based on Agriculture and Agri-Food Canada's Soil and water quality agri-environmental performance indices.
Data sources and methods
Data sources
Data for the indicators are from Statistics Canada's Households and the Environment Survey. Data are available
from 1994 to 2017.
More information
Data completeness
Canadian households are the target population of the Households and the Environment Survey.
The 1994 survey was conducted as a supplement to the May 1994 Labour Force Survey. It surveyed
38 080 households and yielded a response rate of 83.1%.
The 2005-2006 survey was conducted as a supplement to the Labour Force Survey from February 15 to
April 15, 2006. It surveyed 36 431 households and yielded a response rate of 77.8%.

Household use of chemical pesticides and fertilizers Page 8 of 12
The surveys for 2007, 2009, 2011, 2013, 2015 and 2017 were conducted from October to December of their respective years. Survey samples were selected from respondents (January to June) to Statistics Canada's Canadian Community Health Survey, conducted as follow-up surveys.
The sample size and response rate for the biennial surveys were:
29 980 households and 72.3% response rate in 2007
20 000 households and 73.8% response rate in 2009
20 000 households and 74.3% response rate in 2011
31 962 households and 71.8% response rate in 2013
21 348 households and 69.9% response rate in 2015
22 983 households and 67.2% response rate in 2017
Household estimates are produced using weights associated with each sampled household. The weight
indicates the number of households in the sampled unit.3
Methods
Data from Statistics Canada's Households and the Environment Survey are used in these indicators. No changes
or additional calculations are performed on the data.
More information
Statistics Canada designed the questionnaire for the Households and the Environment Survey in consultation with stakeholders involved in the Canadian Environment Sustainability Indicators program.
The questionnaires for each survey year were designed to follow standard practices and wording.
For the 1994 survey, households were asked to respond to the following question:
In the last 12 months, did anyone, including commercial operators, apply the following chemicals to the yard, lawn or garden: pesticides or fertilizers? (Yes, No, Don't know)
For the 2005-2006 survey, households were asked to respond to the following questions:
In 2005, were any chemical fertilizers applied to your lawn/garden? (Yes, No, Don't know/Refused)
In 2005, were any weed killers, pesticides, or fungicides applied to your lawn/garden? Include
fertilizer and pesticide mixes like "Weed and Feed." (Yes, No, Don't know/Refused)
For both the 2007 and 2009 surveys, households were asked to respond to the following questions:
In the last 12 months, were any chemical fertilizers applied to your lawn/garden/lawn or garden? (Yes, No, Don't know/Refused)
In the last 12 months, were any chemical pesticides such as weed killers (herbicides), bug killers (insecticides), or fungicides applied to your lawn/garden/lawn or garden? Please include fertilizer and herbicide mixes such as "Weed and Feed". (Yes, No, Don't know/Refused)
For the 2011, 2013, 2015 and 2017 surveys, households were asked to respond to the following questions:
In the past 12 months, were any chemical fertilizers applied to your lawn/garden/lawn or garden? (Yes, No, Don't know/Refused)
3 Statistics Canada (2019) 2017 Households and the Environment Survey. Retrieved on August 22, 2019.

Canadian Environmental Sustainability Indicators Page 9 of 12
In the past 12 months, were any chemical pesticides such as weed killers (herbicides), bug killers (insecticides), or fungicides applied to your lawn/garden/lawn or garden? (Yes, No, Don't know/Refused)
Recent changes
Statistics Canada has modified the survey frame for the Households and the Environment Survey. The 2017 survey frame included households that responded to the Canadian Community Health Survey for the first 2 quarters (January 2017 to June 2017), which corresponds to the methodology used for the 2007, 2009, 2011 and 2013 surveys. In 2015, households that responded to the first 3 quarters were included. The Households and the Environment Survey is issued as a follow-up survey to the Canadian Community Health Survey.
Caveats and limitations
The coverage error for Statistics Canada's Households and the Environment Survey is based on the survey of which it is a sub-sample (the Labour Force Survey in 2006 and the Canadian Community Health Survey from
2007). In all cases, the coverage error is estimated at less than 2%.
In 1994 and 2005-2006, the survey did not make the distinction between natural and chemical fertilizers and pesticides. However, there were not many natural remedies available at that time. The impact on the trend is , therefore, expected to be minimal.
The survey also does not distinguish between more or less harmful products. Some cosmetic pesticide regulations, for example, specify permitted use of safe or least-toxic pesticides.
The survey does not include households:
located in the Yukon, the Northwest Territories and Nunavut located on reserves and other Indigenous settlements
consisting entirely of full-time members of the Canadian Armed Forces
Institutions and households in certain remote regions are also excluded.
Estimates not meeting an acceptable level of quality were either flagged for caution or suppressed.4
Resources
References
Statistics Canada (1995) 1994 Households and the Environment Survey. Retrieved on August 22, 2019.
Statistics Canada (2008) 2005-2006 Households and the Environment Survey. Retrieved on August 22, 2019.
Statistics Canada (2009) 2007 Households and the Environment Survey. Retrieved on August 22, 2019.
Statistics Canada (2011) 2009 Households and the Environment Survey. Retrieved on August 22, 2019.
Statistics Canada (2013) 2011 Households and the Environment Survey. Retrieved on August 22, 2019.
Statistics Canada (2015) 2013 Households and the Environment Survey. Retrieved on August 22, 2019.
Statistics Canada (2017) 2015 Households and the Environment Survey. Retrieved on August 22, 2019.
Statistics Canada (2019) 2017 Households and the Environment Survey. Retrieved on August 22, 2019.
Statistics Canada (2019) Table 38-10-0052-01 - Use of fertilizer and pesticides. Retrieved on August 22, 2019.
Related information
How to have a healthy lawn
4 Statistics Canada (2019) 2017 Households and the Environment Survey. Retrieved on August 22, 2019.

Household use of chemical pesticides and fertilizers Page 10 of 12
Canadians and Nature: Fertilizers and Pesticides, 2013
Canadian Environmental Sustainability Indicators Page 11 of 12
Annex
Annex A. Data tables for the figures presented in this document
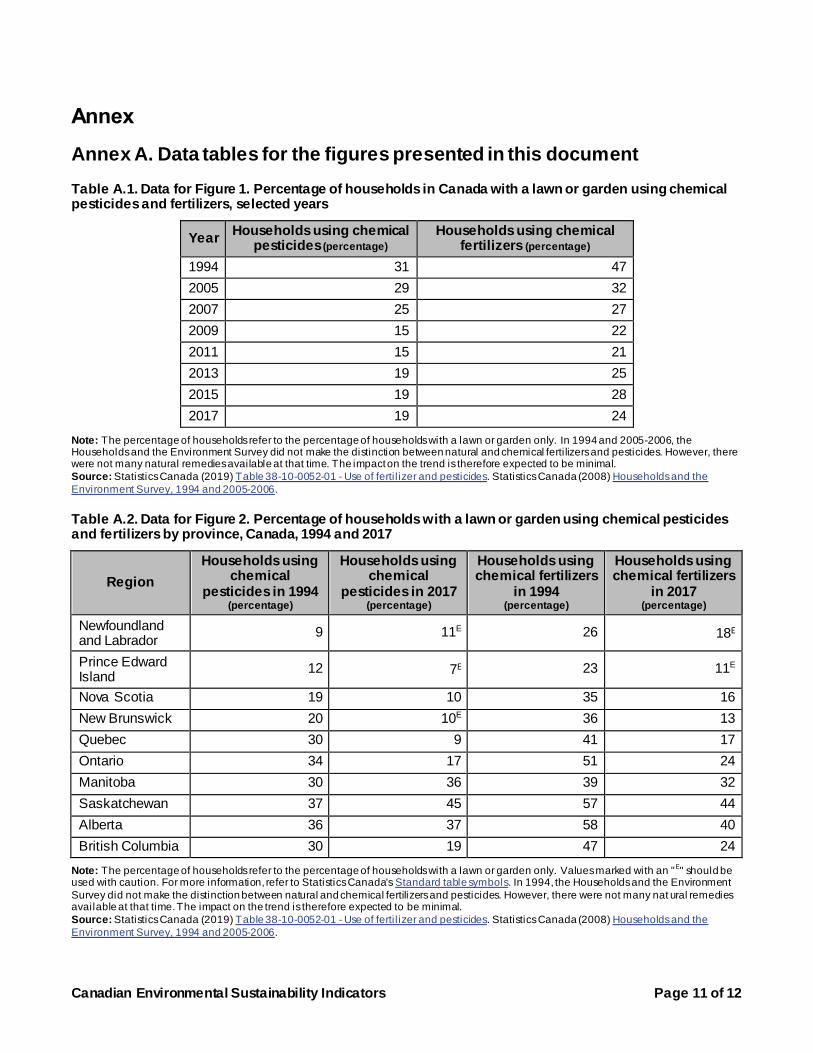
Table A.1. Data for Figure 1. Percentage of households in Canada with a lawn or garden using chemical pesticides and fertilizers, selected years
Year Households using chemical
pesticides (percentage) Households using chemical
fertilizers (percentage)
1994 31 47
2005 29 32
2007 25 27
2009 15 22
2011 15 21
2013 19 25
2015 19 28
2017 19 24
Note: The percentage of households refer to the percentage of households with a lawn or garden only. In 1994 and 2005-2006, the Households and the Environment Survey did not make the distinction between natural and chemical ferti lizers and pesticides. However, there were not many natural remedies available at that time. The impact on the trend is therefore expected to be minimal.
Source: Statistics Canada (2019) Table 38-10-0052-01 - Use of ferti l izer and pesticides. Statistics Canada (2008) Households and the
Environment Survey, 1994 and 2005-2006.
Table A.2. Data for Figure 2. Percentage of households with a lawn or garden using chemical pesticides and fertilizers by province, Canada, 1994 and 2017
Region
Households using chemical
pesticides in 1994 (percentage)
Households using chemical
pesticides in 2017 (percentage)
Households using chemical fertilizers
in 1994 (percentage)
Households using chemical fertilizers
in 2017 (percentage)
Newfoundland and Labrador
9 11E 26 18E
Prince Edward Island
12 7E 23 11E
Nova Scotia 19 10 35 16
New Brunswick 20 10E 36 13
Quebec 30 9 41 17
Ontario 34 17 51 24
Manitoba 30 36 39 32
Saskatchewan 37 45 57 44
Alberta 36 37 58 40
British Columbia 30 19 47 24
Note: The percentage of households refer to the percentage of households with a lawn or garden only. Values marked with an "E" should be
used with caution. For more information, refer to Statistics Canada's Standard table symbols. In 1994, the Households and the Environment
Survey did not make the distinction between natural and chemical fertilizers and pesticides. However, there were not many nat ural remedies available at that time. The impact on the trend is therefore expected to be minimal.
Source: Statistics Canada (2019) Table 38-10-0052-01 - Use of ferti l izer and pesticides. Statistics Canada (2008) Households and the
Environment Survey, 1994 and 2005-2006.

Household use of chemical pesticides and fertilizers Page 12 of 12
Additional information can be obtained at:
Environment and Climate Change Canada
Public Inquiries Centre
12th Floor, Fontaine Building
200 Sacré-Coeur boul.
Gatineau, QC K1A 0H3
Telephone: 1-800-668-6767 (in Canada only) or 819-938-3860
Fax: 819-938-3318
Email: [email protected]