house resubmitted plan gv1 - colorado.gov · hotchkiss collbran crawford grand junction delta 30952...
TRANSCRIPT

§̈¦I76
§̈¦I70
§̈¦I25
§̈¦I270
6461
5765
47
49
62
58
59
60
36
26
63
5519
33
13
25
20
48
17
357
45
3439
51
12
46
29
54
443
21
10
53
14
Moffat13795
Weld252825
Baca3788
Mesa146723
Las Animas15507
Routt23509 Yuma
10043
Garfield56389
Lincoln5467
Park16206
Larimer299630
Gunnison15324
Pueblo159063
Saguache6108 Bent
6499
Grand14843
Logan22709
Rio Blanco6666
Elbert23086
Kiowa1398
Eagle52197
Montrose41276
Washington4814
Kit Carson8270
Jackson1394
La Plata51334
Otero18831
Prowers12551
Delta30952
Fremont46824
Cheyenne1836
Morgan28159
Montezuma25535
Huerfano6711
Costil la3524
Adams441603
Pitkin17148
Conejos8256
Archuleta12084
Dolores2064 Mineral
712
San Miguel7359
Custer4255
Phillips4442
Crowley5823
Rio Grande11982
Sedgwick2379
El Paso622263
Chaffee17809
Hinsdale843
Douglas285465
Boulder294567
Teller23350
Ouray4436
Jefferson534543
Arapahoe572003
Summit27994
Alamosa15445
Lake7310
San Juan699
Gilpin5441
4
House Resubmitted Plan Gv1
Map prepared by Reapportionment Commission Staff, November 29, 2011.
2011 Colorado Reapportionment Commission1313 Sherman StreetRoom 122Denver, Colorado 80203

§̈¦I25
47
62
64
60
46
1917
Pueblo
Pueblo West
PenroseCañon City
Colorado City
Beulah Valley
FlorenceLincoln Park
WilliamsburgRockvale
Blende Avondale
Fowler
Vineland BooneSalt Creek
Crowley
Manzanola
Rye
Olney SpringsPueblo159063
Huerfano6711
Otero18831
Fremont46824 Crowley
5823
Custer4255
Las Animas15507
El Paso622263
Lincoln5467
4
House Resubmitted Plan Gv1Pueblo County
Map prepared by Reapportionment Commission Staff, November 29, 2011.
2011 Colorado Reapportionment Commission1313 Sherman StreetRoom 122Denver, Colorado 80203

§̈¦I2547
46
62
1917
Pueblo
Pueblo West
BlendeAvondale
Vineland BooneSalt Creek
Pueblo159063
El Paso622263
4
House Resubmitted Plan Gv1City of Pueblo
Map prepared by Reapportionment Commission Staff, November 29, 2011.
2011 Colorado Reapportionment Commission1313 Sherman StreetRoom 122Denver, Colorado 80203

§̈¦I70
64
36
19
20
7
3963 65
33
30
34
Elbert23086
Adams441603
El Paso622263
Arapahoe572003
Lincoln5467
Washington4814
Denver600158
House Resubmitted Plan Gv1Portions of Adams, Arapahoe, and Elbert Counties
3
2011 Colorado Reapportionment Commission1313 Sherman StreetRoom 122Denver, Colorado 80203
Map prepared by Reapportionment Commission Staff, November 29, 2011.

§̈¦I70
55
58
61
57
54Mesa146723
Delta30952
Montrose41276
Garfield56389
Gunnison15324
Pitkin17148
4
House Resubmitted Plan Gv1Mesa County
Map prepared by Reapportionment Commission Staff, November 29, 2011.
2011 Colorado Reapportionment Commission1313 Sherman StreetRoom 122Denver, Colorado 80203

§̈¦I70
55 54
Grand JunctionRedlands
Clifton
Fruitvale
Redlands
Redlands
Fruita
Orchard MesaOrchard Mesa
RedlandsClifton
Clifton
Orchard Mesa
Fruita
Orchard Mesa
Mesa146723
4
House Resubmitted Plan Gv1City of Grand Junction
Map prepared by Reapportionment Commission Staff, November 29, 2011.
2011 Colorado Reapportionment Commission1313 Sherman StreetRoom 122Denver, Colorado 80203

§̈¦I70
61
2657
55
58
EdwardsAvon
Snowmass Village
Gypsum Eagle
Aspen
El Jebel
Avon Vail
Basalt
Glenwood SpringsNew Castle Minturn
Dotsero
Gypsum
Carbondale
Chacra
Cattle Creek
MulfordCatherine
Marble
Wolcott
Redstone
Woody Creek
Fulford
Norrie
MinturnEagle52197
Pitkin17148
Garfield56389
Gunnison15324
Lake7310
Mesa146723
Delta30952
Chaffee17809
4
House Resubmitted Plan Gv1Roaring Fork Valley
Map prepared by Reapportionment Commission Staff, November 29, 2011.
2011 Colorado Reapportionment Commission1313 Sherman StreetRoom 122Denver, Colorado 80203

§̈¦I70
55
58
61
Delta
Orchard City
Clif ton
Cedaredge
Palisade
Paonia
Hotchkiss
Collbran
Crawford
Grand Junction
Delta30952
Mesa146723
Gunnison15324
Montrose41276
4
House Resubmitted Plan Gv1Delta County
Map prepared by Reapportionment Commission Staff, November 29, 2011.
2011 Colorado Reapportionment Commission1313 Sherman StreetRoom 122Denver, Colorado 80203

60
47
61
33 20
17
21
Coaldale
HowardPenrose
Guffey
Cañon City
Florence
Salida
Lincoln Park
WilliamsburgRockvale
Silver Cliff
Cripple Creek
Coal Creek
Westcliffe
Victor
BrooksideCotopaxi
Poncha Springs
Goldfield
Smeltertown
Fremont46824
Custer4255
Park16206 Teller
23350
Saguache6108
Chaffee17809
Pueblo159063
El Paso622263
4
House Resubmitted Plan Gv1Fremont County
Map prepared by Reapportionment Commission Staff, November 29, 2011.
2011 Colorado Reapportionment Commission1313 Sherman StreetRoom 122Denver, Colorado 80203

§̈¦I25
49
63
5148
53
52
13
Fort Collins
Loveland
Windsor
Johnstown
Berthoud
Mead
Laporte
Timnath
Estes Park
Red Feather Lakes
Allenspark
Milliken
Wellington
LyonsGrand Lake
Mead
Severance
Severance
Larimer299630
Jackson1394
Grand14843
Weld252825
4
House Resubmitted Plan Gv1Larimer County
Map prepared by Reapportionment Commission Staff, November 29, 2011.
2011 Colorado Reapportionment Commission1313 Sherman StreetRoom 122Denver, Colorado 80203

§̈¦I2549
53
5263
48
51
Fort Collins
Laporte
Timnath
Windsor
Windsor
WindsorLoveland Loveland Loveland
Larimer299630
Weld252825
4
House Resubmitted Plan Gv1City of Fort Collins
Map prepared by Reapportionment Commission Staff, November 29, 2011.
2011 Colorado Reapportionment Commission1313 Sherman StreetRoom 122Denver, Colorado 80203

§̈¦I25
51
4948
Loveland
Johnstown
Windsor
Berthoud
Larimer299630
4
House Resubmitted Plan Gv1City of Loveland
Map prepared by Reapportionment Commission Staff, November 29, 2011.
2011 Colorado Reapportionment Commission1313 Sherman StreetRoom 122Denver, Colorado 80203

§̈¦I76
§̈¦I25
63
65
49
36
48
13
35
51
12
5352
1039
50
11
566
Weld252825
Morgan28159
Larimer299630
Logan22709
Boulder294567
Adams441603
Washington4814
Broomfield55889
4
House Resubmitted Plan Gv1Weld County
Map prepared by Reapportionment Commission Staff, November 29, 2011.
2011 Colorado Reapportionment Commission1313 Sherman StreetRoom 122Denver, Colorado 80203

48
63
50Greeley
Evans
Windsor
Severance
Milliken
Eaton
La SalleMilliken
Johnstown
Kersey
Milliken
Garden City
Weld252825
4
House Resubmitted Plan Gv1Greeley
Map prepared by Reapportionment Commission Staff, November 29, 2011.
2011 Colorado Reapportionment Commission1313 Sherman StreetRoom 122Denver, Colorado 80203
§̈¦I76
§̈¦I25
63
35
48
39 36
12
56
49
13
11
6
Erie
Mead
Brighton
FrederickDacono
Broomfield
MillikenBerthoud
Todd Creek
Lochbuie
Firestone
Longmont
Thornton
Hudson
Fort Lupton
Johnstown
Lafayette
Keenesburg
Platteville
Firestone
Gilcrest
Platteville
Northglenn
Aristocrat Ranchettes
JohnstownEvans
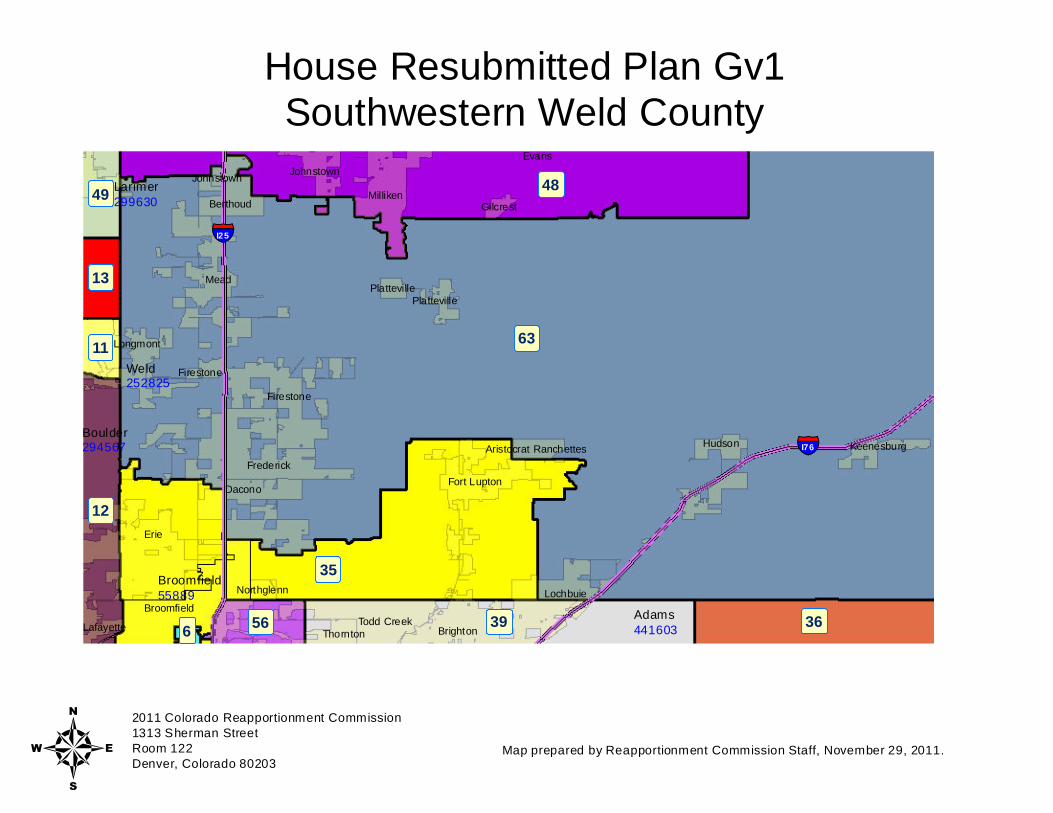
Weld252825
Adams441603
Boulder294567
Broomfield55889
Larimer299630
4
House Resubmitted Plan Gv1Southwestern Weld County
Map prepared by Reapportionment Commission Staff, November 29, 2011.
2011 Colorado Reapportionment Commission1313 Sherman StreetRoom 122Denver, Colorado 80203

1349
12
10
35
6311
25 29 6
Erie
Longmont
Boulder
Broomfield
LafayetteLouisville
Coal Creek
Niwot
Eldora
GunbarrelLazy Acres
Allenspark
Westminster
Superior
Boulder
Altona
Gold Hill
Sugarloaf
Lyons
Boulder
Pine Brook HillSunshine
Crisman
Nederland
Eldorado Springs
Glendale
Rollinsville
Ward
Paragon Estates
Mountain Meadows
St. Ann Highlands
Bark Ranch FrederickJamestown
Tall Timber
Hidden Lake
ValmontSeven Hills
Mead
Berthoud
Leyner
Mead
Firestone
Arvada
Bonanza Mountain Estates
Frederick
Berthoud
Boulder294567
Grand14843
Larimer299630
Gilpin5441 Jefferson
534543
Broomfield55889
4
House Resubmitted Plan Gv1Boulder County
Map prepared by Reapportionment Commission Staff, November 29, 2011.
2011 Colorado Reapportionment Commission1313 Sherman StreetRoom 122Denver, Colorado 80203

13
10
12
Boulder
Louisville
Gunbarrel
Lazy Acres
Niwot
Boulder
Lafayette
Boulder
Pine Brook Hill
Paragon Estates
Tall Timber
Sunshine
CrismanValmontSeven Hills
Glendale
SuperiorEldorado Springs
Boulder294567
4
House Resubmitted Plan Gv1City of Boulder
Map prepared by Reapportionment Commission Staff, November 29, 2011.
2011 Colorado Reapportionment Commission1313 Sherman StreetRoom 122Denver, Colorado 80203

6311
13
12
Longmont
Mead
Frederick
Firestone
Mead
Frederick
NiwotNiwot
Boulder294567
Weld252825
4
House Resubmitted Plan Gv1City of Longmont
Map prepared by Reapportionment Commission Staff, November 29, 2011.
2011 Colorado Reapportionment Commission1313 Sherman StreetRoom 122Denver, Colorado 80203

§̈¦I25
12 35
56
6
29
13
39
1063
28
Erie
BroomfieldThornton
Westminster
Lafayette
Louisville
Northglenn
Superior
Dacono
Paragon Estates
Northglenn
Valmont
Leyner
Todd Creek
Boulder
Federal Heights
Gunbarrel
Boulder
GunbarrelGunbarrel
Boulder294567
Adams441603
Broomfield55889
Weld252825
Jefferson534543
4
House Resubmitted Plan Gv1City and County of Broomfield
Map prepared by Reapportionment Commission Staff, November 29, 2011.
2011 Colorado Reapportionment Commission1313 Sherman StreetRoom 122Denver, Colorado 80203

§̈¦I25
33
25
64
45
4443
22
2060
3738 30 3613 40
ParkerHighlands Ranch
Black Forest
The Pinery
Centennial
Perry Park
Littleton
Castle Rock
Aurora
Lone Tree
Ponderosa Park
Ken Caryl
Roxborough Park Castle Pines
Dove ValleyColumbine
Franktown
Castle Pines North
Woodmoor
Castle Rock
Aspen Park
Castle Pines North
Palmer Lake
Stonegate
Louviers
Sedalia
Larkspur
Inverness
Westcreek
Littleton MeridianAcres Green Grand View Estates
Meridian
Larkspur
Douglas285465
Jefferson534543
Elbert23086
Park16206 Teller
23350
4
House Resubmitted Plan Gv1Douglas County
Map prepared by Reapportionment Commission Staff, November 29, 2011.
2011 Colorado Reapportionment Commission1313 Sherman StreetRoom 122Denver, Colorado 80203

§̈¦I25
19
20
33
64
17
60
21
1416
18
47
15Colorado Springs
Black Forest
Fountain
Ellicott
Security-WidefieldFort Carson
Cascade-Chipita Park
Woodmoor
Air Force AcademyWoodland Park
Cimarron Hills
Monument
Peyton
Stratmoor
Palmer Lake
Gleneagle
Manitou Springs
Calhan
Simla
Green Mountain Falls
Ramah
Pueblo
Victor Rock Creek Park
Midland El Paso622263
Teller23350
Elbert23086
Fremont46824
Lincoln5467
Crowley5823
4
House Resubmitted Plan Gv1El Paso County
Map prepared by Reapportionment Commission Staff, November 29, 2011.
2011 Colorado Reapportionment Commission1313 Sherman StreetRoom 122Denver, Colorado 80203

§̈¦I25
20
19
33
21
17
14
1615
18
Colorado Springs
Black Forest
Security-WidefieldFort Carson
Peyton
Fountain
Cascade-Chipita Park
Air Force Academy
Cimarron Hills
Stratmoor
Woodland Park
Manitou Springs
Gleneagle
Fountain
Green Mountain Falls
Rock Creek Park
El Paso622263
Teller23350
Teller23350
4
House Resubmitted Plan Gv1City of Colorado Springs
Map prepared by Reapportionment Commission Staff, November 29, 2011.
2011 Colorado Reapportionment Commission1313 Sherman StreetRoom 122Denver, Colorado 80203

§̈¦I70
§̈¦I76
§̈¦I25
§̈¦I270
§̈¦I225 36
734
3
30
6
5
29
140
9
8
39
322
423
28
27
42
41
3124
5635
38 372225
12
Denver
Aurora
Lakewood
Arvada
Commerce City
Westminster Thornton
Watkins
Aurora
Broomfield
Littleton
Wheat Ridge
Welby
Northglenn
Berkley
Greenwood VillageColumbine
Englewood
CentennialCherry Hills Village
North Washington
Centennial
Sheridan
SherrelwoodDerby
Brighton
Twin Lakes
Cherry Creek
Brighton
Federal Heights
Bow Mar
Derby
Ken Caryl
Edgewater
Glendale
Shaw Heights
Holly Hills
Lakeside
Brighton
Aetna Estates
Mountain View
FairmountFairmount
Adams441603
Denver600158
Arapahoe572003
Jefferson534543
Broomfield55889
4
House Resubmitted Plan Gv1City and County of Denver
Map prepared by Reapportionment Commission Staff, November 29, 2011.
2011 Colorado Reapportionment Commission1313 Sherman StreetRoom 122Denver, Colorado 80203

§̈¦I70
§̈¦I76
§̈¦I270
§̈¦I225
367
39
34
6335
8
56
42
31
28
5
4192 30
Aurora
Denver
Thornton
Brighton
Commerce City
Watkins
Todd Creek
Bennett
Lochbuie
Welby Derby
Strasburg
Northglenn
DaconoBroomfieldNorthglenn
Derby
Glendale
Fort Lupton
Aetna Estates
Hudson
Adams441603
Denver600158
Weld252825
Arapahoe572003
4
House Resubmitted Plan Gv1Western Adams County
Map prepared by Reapportionment Commission Staff, November 29, 2011.
2011 Colorado Reapportionment Commission1313 Sherman StreetRoom 122Denver, Colorado 80203

§̈¦I70
§̈¦I25
§̈¦I225
36
3 30
44
7
37
5
38
40
64
9
8
3343
1
2
4
42
41
31
23
22
24
45
34
25
32
27 6
AuroraDenver
AuroraCentennial
Watkins
Parker
Littleton
Highlands RanchLone Tree
Englewood
Greenwood Village
Cherry Hills Village
Dove Valley
Sheridan
Lakewood
Columbine
Stonegate
InvernessFoxfield
Wheat Ridge
Berkley
Cherry Creek
Commerce City
Bow Mar
Meridian
Edgewater
Glendale
Columbine Valley
Holly Hills
Acres GreenGrand View Estates
Meridian
Lakeside
Aetna Estates
Arapahoe572003
Denver600158
Douglas285465
Adams441603
Elbert23086
Jefferson534543
4
House Resubmitted Plan Gv1Western Arapahoe County
Map prepared by Reapportionment Commission Staff, November 29, 2011.
2011 Colorado Reapportionment Commission1313 Sherman StreetRoom 122Denver, Colorado 80203

§̈¦I25
§̈¦I70
§̈¦I76
25
3360
13
29
45
24
3
34
32
6
20
5
38
27
1
22
9
823
39
43
35
2
4
56
7
28
12
44
31
37
4142Denver
Arvada
Lakewood
Centennial
Wheat Ridge
Thornton
Westminster
Broomfield
Littleton
Highlands Ranch
Golden
Commerce City
Evergreen
Castle Rock
Ken Caryl
Coal Creek
Perry Park
Genesee
Lone Tree
Dakota Ridge
Columbine
Welby
Fairmount
Englewood
Northglenn
Floyd Hill
Berkley
Roxborough Park
Superior
Greenwood VillageIndian Hills
Applewood
Castle Pines
Eldora
North Washington
SheridanMorrison
Palmer Lake
Castle Rock
Aspen Park
Central City
KittredgeUpper Bear Creek
Castle Pines North
Sherrelwood Derby
Louviers
Sedalia
Black Hawk
Larkspur
Twin Lakes
Eldorado SpringsRollinsville
Westcreek
Idaho Springs
Cherry Creek
Woodmoor
West Pleasant View
Glendale
Idaho Springs
Holly Hills
Acres Green
Idledale
Lakeside
Larkspur
Jefferson534543
Douglas285465
Park16206
Gilpin5441
Clear Creek9088
Teller23350
Boulder294567
El Paso622263
Adams441603
Denver600158
Broomfield55889
House Resubmitted Plan Gv1Jefferson County
3
2011 Colorado Reapportionment Commission1313 Sherman StreetRoom 122Denver, Colorado 80203
Map prepared by Reapportionment Commission Staff, November 29, 2011.

Population SummaryPlan Name: Workspace: House>>House Resubmitted Plan Gv1
11/29/2011
10:21 am
Plan was last edited on: 11/29/2011 9:38:43 AM
State of Colorado
District Population Ideal District Deviation %Deviation
76,1211 77,372 -1,251 -1.62
75,5092 77,372 -1,863 -2.41
76,8883 77,372 -484 -0.63
75,6884 77,372 -1,684 -2.18
75,4475 77,372 -1,925 -2.49
77,6816 77,372 309 0.40
77,8257 77,372 453 0.59
75,4658 77,372 -1,907 -2.46
75,6289 77,372 -1,744 -2.25
75,47210 77,372 -1,900 -2.46
75,78311 77,372 -1,589 -2.05
78,73212 77,372 1,360 1.76
79,10913 77,372 1,737 2.24
75,99814 77,372 -1,374 -1.78
76,85815 77,372 -514 -0.66
79,23416 77,372 1,862 2.41
79,24217 77,372 1,870 2.42
79,30118 77,372 1,929 2.49
77,90119 77,372 529 0.68
76,38320 77,372 -989 -1.28
77,34621 77,372 -26 -0.03
75,61622 77,372 -1,756 -2.27
77,72323 77,372 351 0.45
76,11124 77,372 -1,261 -1.63
75,46025 77,372 -1,912 -2.47
75,70626 77,372 -1,666 -2.15
77,68927 77,372 317 0.41
79,03528 77,372 1,663 2.15
75,96529 77,372 -1,407 -1.82
76,30630 77,372 -1,066 -1.38
75,51531 77,372 -1,857 -2.40
75,69932 77,372 -1,673 -2.16
76,74433 77,372 -628 -0.81
78,72434 77,372 1,352 1.75
77,38335 77,372 11 0.01
79,19736 77,372 1,825 2.36
77,38637 77,372 14 0.02
77,78438 77,372 412 0.53
77,78039 77,372 408 0.53
78,10540 77,372 733 0.95
75,49241 77,372 -1,880 -2.43
78,76542 77,372 1,393 1.80
75,99743 77,372 -1,375 -1.78
79,28344 77,372 1,911 2.47
76,79145 77,372 -581 -0.75
78,67546 77,372 1,303 1.68
78,88547 77,372 1,513 1.96

76,71048 77,372 -662 -0.86
79,24249 77,372 1,870 2.42
77,81350 77,372 441 0.57
79,22851 77,372 1,856 2.40
78,87352 77,372 1,501 1.94
78,52453 77,372 1,152 1.49
78,58454 77,372 1,212 1.57
77,36955 77,372 -3 0.00
78,51756 77,372 1,145 1.48
76,85057 77,372 -522 -0.67
75,49258 77,372 -1,880 -2.43
78,93359 77,372 1,561 2.02
79,18060 77,372 1,808 2.34
77,33861 77,372 -34 -0.04
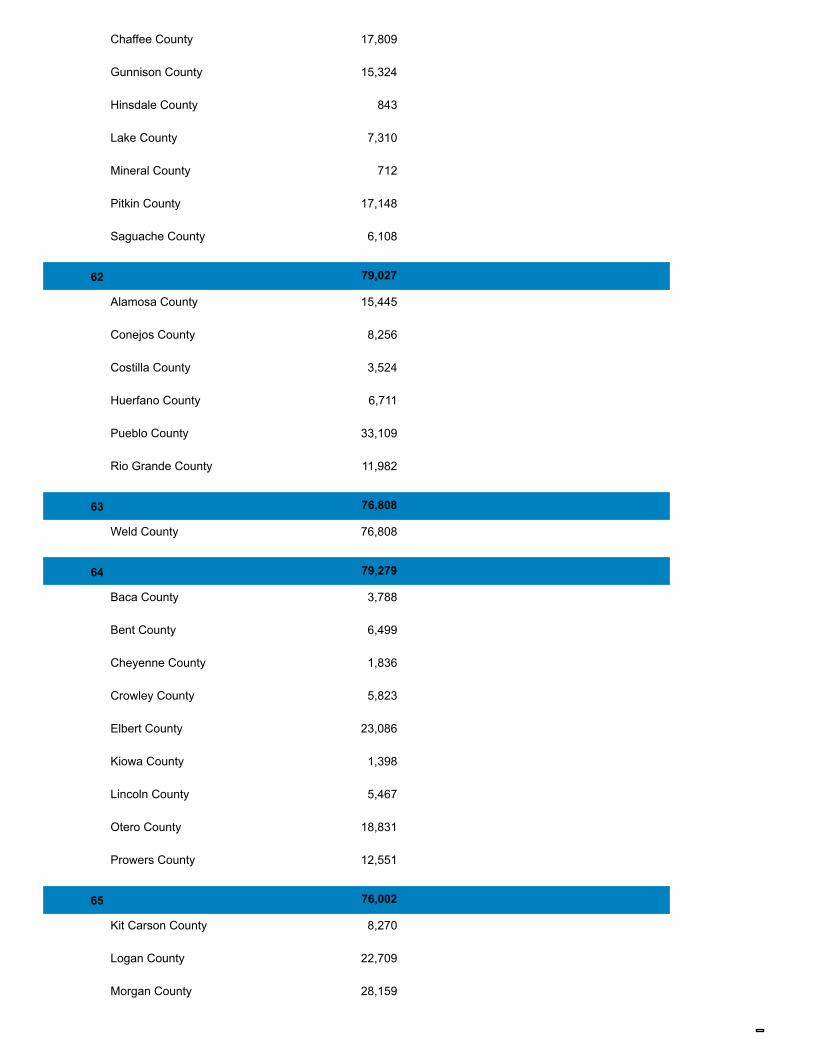
79,02762 77,372 1,655 2.14
76,80863 77,372 -564 -0.73
79,27964 77,372 1,907 2.46
76,00265 77,372 -1,370 -1.77
District with the largest population is district: with a population of: 79,301
District with the smallest population is district: with a population of: 75,447 5
18 77,372
77,372
18 79,301 77,372District with the largest population deviation is district: with a population of:
The set ideal population is:
The set ideal population is:
The set ideal population is:
1,929This district is Persons OVER its set ideal population. Percent Deviation: 2.49%
This district is 1,925 Persons UNDER its set ideal population. Percent Deviation: 2.49%
This district is 1,929 Persons OVER its set ideal population. Percent Deviation: 2.49%
Plan range (which is calculated between the district with the largest and the district with the smallest population) is as follows:
3,854 Persons, which is of the ideal set population for the district with the largest population . 4.98%
Mean Deviation in persons is: 1,232.00 *
Mean Deviation as a percent of ideal population is: 1.59 *
* Only absolute values are considered
2
State of Colorado

Plan ComponentsPlan Name: Workspace: House>>House Resubmitted Plan Gv1
11/29/2011
10:20 am
Plan was last edited on: 11/29/2011 9:38:43 AM
State of Colorado
District Population
76,1211
Denver County 75,841
Jefferson County 280
75,5092
Denver County 75,509
76,8883
Arapahoe County 76,888
75,6884
Denver County 75,688
75,4475
Denver County 75,447
77,6816
Adams County 77,681
77,8257
Denver County 77,825
75,4658
Denver County 75,465
75,6289
Arapahoe County 6,760
Denver County 68,868
75,47210
Boulder County 75,472
75,78311
Boulder County 75,783
78,73212
Boulder County 78,732

Broomfield County 0
79,10913
Boulder County 64,580
Clear Creek County 9,088
Gilpin County 5,441
75,99814
El Paso County 75,998
76,85815
El Paso County 76,858
79,23416
El Paso County 79,234
79,24217
El Paso County 79,242
79,30118
El Paso County 79,301
77,90119
El Paso County 77,901
76,38320
El Paso County 76,383
77,34621
El Paso County 77,346
75,61622
Jefferson County 75,616
77,72323
Jefferson County 77,723
76,11124
Jefferson County 76,111
75,46025
Jefferson County 75,460
75,70626
Eagle County 52,197

Routt County 23,509
77,68927
Jefferson County 77,689
79,03528
Adams County 79,035
75,96529
Jefferson County 75,965
76,30630
Arapahoe County 76,306
75,51531
Denver County 75,515
75,69932
Jefferson County 75,699
76,74433
Douglas County 53,394
Teller County 23,350
78,72434
Adams County 78,724
77,38335
Broomfield County 55,889
Weld County 21,494
79,19736
Adams County 49,866
Arapahoe County 24,517
Washington County 4,814
77,38637
Arapahoe County 77,386
77,78438
Arapahoe County 77,784
77,78039

Adams County 77,780
78,10540
Arapahoe County 78,105
75,49241
Arapahoe County 75,492
78,76542
Arapahoe County 78,765
75,99743
Douglas County 75,997
79,28344
Douglas County 79,283
76,79145
Douglas County 76,791
78,67546
Pueblo County 78,675
78,88547
Custer County 4,255
Fremont County 11,844
Las Animas County 15,507
Pueblo County 47,279
76,71048
Weld County 76,710
79,24249
Grand County 14,843
Jackson County 1,394
Larimer County 63,005
77,81350
Weld County 77,813
79,22851
Larimer County 79,228

78,87352
Larimer County 78,873
78,52453
Larimer County 78,524
78,58454
Mesa County 78,584
77,36955
Delta County 9,230
Mesa County 68,139
78,51756
Adams County 78,517
76,85057
Garfield County 56,389
Moffat County 13,795
Rio Blanco County 6,666
75,49258
Delta County 21,722
Montrose County 41,276
Ouray County 4,436
San Juan County 699
San Miguel County 7,359
78,93359
Dolores County 2,064
La Plata County 51,334
Montezuma County 25,535
79,18060
Fremont County 34,980
Park County 16,206
Summit County 27,994
77,33861
Archuleta County 12,084
Chaffee County 17,809
Gunnison County 15,324
Hinsdale County 843
Lake County 7,310
Mineral County 712
Pitkin County 17,148
Saguache County 6,108
79,02762
Alamosa County 15,445
Conejos County 8,256
Costilla County 3,524
Huerfano County 6,711
Pueblo County 33,109
Rio Grande County 11,982
76,80863
Weld County 76,808
79,27964
Baca County 3,788
Bent County 6,499
Cheyenne County 1,836
Crowley County 5,823
Elbert County 23,086
Kiowa County 1,398
Lincoln County 5,467
Otero County 18,831
Prowers County 12,551
76,00265
Kit Carson County 8,270
Logan County 22,709
Morgan County 28,159

Phillips County 4,442
Sedgwick County 2,379
Yuma County 10,043
District with the largest population is district: with a population of: 79,301
District with the smallest population is district: with a population of: 75,447 5
18 77,372
77,372
18 79,301 77,372District with the largest population deviation is district: with a population of:
The set ideal population is:
The set ideal population is:
The set ideal population is:
1,929This district is Persons OVER its set ideal population. Percent Deviation: 2.49%
This district is 1,925 Persons UNDER its set ideal population. Percent Deviation: 2.49%
This district is 1,929 Persons OVER its set ideal population. Percent Deviation: 2.49%
Plan range (which is calculated between the district with the largest and the district with the smallest population) is as follows:
3,854 Persons, which is of the ideal set population for the district with the largest population . 4.98%
Mean Deviation in persons is: 1,232.00 *
Mean Deviation as a percent of ideal population is: 1.59 *
* Only absolute values are considered
7
State of Colorado

Tuesday, November 29, 2011
Plan Last Edited on:
Plan Name:
10:18 am
Ethnic Summary
Workspace: House>>House Resubmitted Plan Gv1
11/29/2011 9:38:43 AM
District Population HispanicNH White DOJ NH Black DOJ NH Ind DOJ NH Asn DOJ NH Hwn DOJ NH Other Total Minority
1 76,121 31,469 38,095 1,480 816 3,978 88 195
41.34 50.05 1.94 1.07 5.23 0.26 0.12
44,652
58.66% % % % % % % %
2 75,509 61,790 7,670 2,401 713 2,681 80 174
81.83 10.16 3.18 0.94 3.55 0.23 0.11
13,719
18.17% % % % % % % %
3 76,888 60,051 10,361 1,827 789 3,613 102 145
78.10 13.48 2.38 1.03 4.70 0.19 0.13
16,837
21.90% % % % % % % %
4 75,688 30,974 40,122 1,835 937 1,555 46 219
40.92 53.01 2.42 1.24 2.05 0.29 0.06
44,714
59.08% % % % % % % %
5 75,447 28,513 39,236 4,138 878 2,413 84 185
37.79 52.00 5.48 1.16 3.20 0.25 0.11
46,934
62.21% % % % % % % %
6 77,681 48,556 21,847 1,359 745 4,920 84 170
62.51 28.12 1.75 0.96 6.33 0.22 0.11
29,125
37.49% % % % % % % %
7 77,825 19,386 31,824 22,532 496 3,203 194 190
24.91 40.89 28.95 0.64 4.12 0.24 0.25
58,439
75.09% % % % % % % %
8 75,465 52,422 9,226 8,804 512 4,247 80 174
69.47 12.23 11.67 0.68 5.63 0.23 0.11
23,043
30.53% % % % % % % %
9 75,628 51,246 11,837 7,518 689 4,026 102 210
67.76 15.65 9.94 0.91 5.32 0.28 0.13
24,382
32.24% % % % % % % %
10 75,472 61,873 7,361 979 562 4,416 97 184
81.98 9.75 1.30 0.74 5.85 0.24 0.13
13,599
18.02% % % % % % % %
11 75,783 53,277 17,636 883 682 3,124 73 108
70.30 23.27 1.17 0.90 4.12 0.14 0.10
22,506
29.70% % % % % % % %
1
State of Colorado 77,372Target Population

District Population HispanicNH White DOJ NH Black DOJ NH Ind DOJ NH Asn DOJ NH Hwn DOJ NH Other Total Minority
12 78,732 60,947 11,116 953 657 4,833 52 174
77.41 14.12 1.21 0.83 6.14 0.22 0.07
17,785
22.59% % % % % % % %
13 79,109 70,962 3,859 754 625 2,696 66 147
89.70 4.88 0.95 0.79 3.41 0.19 0.08
8,147
10.30% % % % % % % %
14 75,998 60,226 7,036 3,208 809 4,319 196 204
79.25 9.26 4.22 1.06 5.68 0.27 0.26
15,772
20.75% % % % % % % %
15 76,858 56,023 11,411 5,446 983 2,532 271 192
72.89 14.85 7.09 1.28 3.29 0.25 0.35
20,835
27.11% % % % % % % %
16 79,234 63,386 8,927 3,195 976 2,427 165 158
80.00 11.27 4.03 1.23 3.06 0.20 0.21
15,848
20.00% % % % % % % %
17 79,242 49,951 14,751 9,452 1,295 2,855 739 199
63.04 18.62 11.93 1.63 3.60 0.25 0.93
29,291
36.96% % % % % % % %
18 79,301 35,308 26,163 13,129 1,246 2,758 496 201
44.52 32.99 16.56 1.57 3.48 0.25 0.63
43,993
55.48% % % % % % % %
19 77,901 56,554 10,803 5,535 1,054 3,432 343 180
72.60 13.87 7.11 1.35 4.41 0.23 0.44
21,347
27.40% % % % % % % %
20 76,383 66,022 5,051 1,880 880 2,234 133 183
86.44 6.61 2.46 1.15 2.92 0.24 0.17
10,361
13.56% % % % % % % %
21 77,346 60,477 9,523 3,223 1,024 2,675 258 166
78.19 12.31 4.17 1.32 3.46 0.21 0.33
16,869
21.81% % % % % % % %
22 75,616 64,430 7,097 811 571 2,441 82 184
85.21 9.39 1.07 0.76 3.23 0.24 0.11
11,186
14.79% % % % % % % %
23 77,723 50,385 22,026 1,685 1,083 2,226 134 184
64.83 28.34 2.17 1.39 2.86 0.24 0.17
27,338
35.17% % % % % % % %
24 76,111 60,155 11,670 984 803 2,291 87 121
79.04 15.33 1.29 1.06 3.01 0.16 0.11
15,956
20.96% % % % % % % %
25 75,460 68,859 4,040 521 494 1,372 59 115
91.25 5.35 0.69 0.65 1.82 0.15 0.08
6,601
8.75% % % % % % % %
2
State of Colorado 77,372Target Population

District Population HispanicNH White DOJ NH Black DOJ NH Ind DOJ NH Asn DOJ NH Hwn DOJ NH Other Total Minority
26 75,706 56,415 17,289 462 419 919 81 121
74.52 22.84 0.61 0.55 1.21 0.16 0.11
19,291
25.48% % % % % % % %
27 77,689 62,475 11,493 884 766 1,853 79 139
80.42 14.79 1.14 0.99 2.39 0.18 0.10
15,214
19.58% % % % % % % %
28 79,035 33,734 39,697 1,690 903 2,757 98 156
42.68 50.23 2.14 1.14 3.49 0.20 0.12
45,301
57.32% % % % % % % %
29 75,965 61,700 9,056 1,037 640 3,314 94 124
81.22 11.92 1.37 0.84 4.36 0.16 0.12
14,265
18.78% % % % % % % %
30 76,306 44,150 14,017 11,583 636 5,528 212 180
57.86 18.37 15.18 0.83 7.24 0.24 0.28
32,156
42.14% % % % % % % %
31 75,515 41,824 14,483 16,294 710 1,932 62 210
55.39 19.18 21.58 0.94 2.56 0.28 0.08
33,691
44.61% % % % % % % %
32 75,699 58,910 11,050 1,255 817 3,448 93 126
77.82 14.60 1.66 1.08 4.55 0.17 0.12
16,789
22.18% % % % % % % %
33 76,744 67,590 4,501 805 729 2,922 73 124
88.07 5.86 1.05 0.95 3.81 0.16 0.10
9,154
11.93% % % % % % % %
34 78,724 32,873 40,954 2,027 804 1,810 78 178
41.76 52.02 2.57 1.02 2.30 0.23 0.10
45,851
58.24% % % % % % % %
35 77,383 58,369 12,682 969 626 4,528 85 124
75.43 16.39 1.25 0.81 5.85 0.16 0.11
19,014
24.57% % % % % % % %
36 79,197 38,784 26,417 10,147 793 2,622 269 165
48.97 33.36 12.81 1.00 3.31 0.21 0.34
40,413
51.03% % % % % % % %
37 77,386 58,598 6,777 4,685 487 6,571 124 144
75.72 8.76 6.05 0.63 8.49 0.19 0.16
18,788
24.28% % % % % % % %
38 77,784 66,173 7,416 1,252 682 2,075 79 107
85.07 9.53 1.61 0.88 2.67 0.14 0.10
11,611
14.93% % % % % % % %
39 77,780 47,829 24,948 1,290 778 2,693 89 153
61.49 32.08 1.66 1.00 3.46 0.20 0.11
29,951
38.51% % % % % % % %
3
State of Colorado 77,372Target Population

District Population HispanicNH White DOJ NH Black DOJ NH Ind DOJ NH Asn DOJ NH Hwn DOJ NH Other Total Minority
40 78,105 50,887 10,886 9,007 652 6,245 230 198
65.15 13.94 11.53 0.83 8.00 0.25 0.29
27,218
34.85% % % % % % % %
41 75,492 39,263 15,410 15,003 621 4,814 118 263
52.01 20.41 19.87 0.82 6.38 0.35 0.16
36,229
47.99% % % % % % % %
42 78,765 22,658 35,098 16,610 657 3,223 355 164
28.77 44.56 21.09 0.83 4.09 0.21 0.45
56,107
71.23% % % % % % % %
43 75,997 64,150 5,564 1,199 490 4,387 82 125
84.41 7.32 1.58 0.64 5.77 0.16 0.11
11,847
15.59% % % % % % % %
44 79,283 66,263 6,390 1,655 482 4,270 113 110
83.58 8.06 2.09 0.61 5.39 0.14 0.14
13,020
16.42% % % % % % % %
45 76,791 66,442 6,231 1,211 576 2,058 109 164
86.52 8.11 1.58 0.75 2.68 0.21 0.14
10,349
13.48% % % % % % % %
46 78,675 39,351 35,248 2,070 853 881 81 191
50.02 44.80 2.63 1.08 1.12 0.24 0.10
39,324
49.98% % % % % % % %
47 78,885 55,899 19,031 1,763 1,247 721 71 153
70.86 24.12 2.23 1.58 0.91 0.19 0.09
22,986
29.14% % % % % % % %
48 76,710 55,332 18,961 578 658 969 40 172
72.13 24.72 0.75 0.86 1.26 0.22 0.05
21,378
27.87% % % % % % % %
49 79,242 70,613 6,171 537 756 996 71 98
89.11 7.79 0.68 0.95 1.26 0.12 0.09
8,629
10.89% % % % % % % %
50 77,813 42,463 31,578 1,485 734 1,256 105 192
54.57 40.58 1.91 0.94 1.61 0.25 0.13
35,350
45.43% % % % % % % %
51 79,228 67,490 8,995 647 782 1,151 70 93
85.18 11.35 0.82 0.99 1.45 0.12 0.09
11,738
14.82% % % % % % % %
52 78,873 63,521 10,340 1,390 877 2,460 117 168
80.54 13.11 1.76 1.11 3.12 0.21 0.15
15,352
19.46% % % % % % % %
53 78,524 65,955 7,388 1,066 680 3,217 87 131
83.99 9.41 1.36 0.87 4.10 0.17 0.11
12,569
16.01% % % % % % % %
4
State of Colorado 77,372Target Population

District Population HispanicNH White DOJ NH Black DOJ NH Ind DOJ NH Asn DOJ NH Hwn DOJ NH Other Total Minority
54 78,584 65,007 10,523 766 953 1,089 124 122
82.72 13.39 0.97 1.21 1.39 0.16 0.16
13,577
17.28% % % % % % % %
55 77,369 63,526 11,422 632 1,029 573 100 87
82.11 14.76 0.82 1.33 0.74 0.11 0.13
13,843
17.89% % % % % % % %
56 78,517 53,101 18,464 1,796 813 4,055 121 167
67.63 23.52 2.29 1.04 5.16 0.21 0.15
25,416
32.37% % % % % % % %
57 76,850 55,952 18,628 509 910 650 78 123
72.81 24.24 0.66 1.18 0.85 0.16 0.10
20,898
27.19% % % % % % % %
58 75,492 62,337 10,989 419 914 613 78 142
82.57 14.56 0.56 1.21 0.81 0.19 0.10
13,155
17.43% % % % % % % %
59 78,933 62,290 8,956 448 6,465 597 64 113
78.92 11.35 0.57 8.19 0.76 0.14 0.08
16,643
21.08% % % % % % % %
60 79,180 67,025 8,719 1,393 1,094 809 59 81
84.65 11.01 1.76 1.38 1.02 0.10 0.07
12,155
15.35% % % % % % % %
61 77,338 62,750 11,997 643 950 803 53 142
81.14 15.51 0.83 1.23 1.04 0.18 0.07
14,588
18.86% % % % % % % %
62 79,027 34,694 41,512 931 1,103 503 67 217
43.90 52.53 1.18 1.40 0.64 0.27 0.08
44,333
56.10% % % % % % % %
63 76,808 59,021 14,675 615 1,161 1,134 81 121
76.84 19.11 0.80 1.51 1.48 0.16 0.11
17,787
23.16% % % % % % % %
64 79,279 57,307 18,205 1,866 1,037 693 57 114
72.29 22.96 2.35 1.31 0.87 0.14 0.07
21,972
27.71% % % % % % % %
65 76,002 54,830 17,838 2,067 664 457 52 94
72.14 23.47 2.72 0.87 0.60 0.12 0.07
21,172
27.86% % % % % % % %
5
State of Colorado 77,372Target Population
City Splits
11/29/2011 9:38:43 AM
Workspace: House>>House Resubmitted Plan Gv1
Plan Last Edited on:
Plan Name:
11/29/2011
Population Population
Voting Age
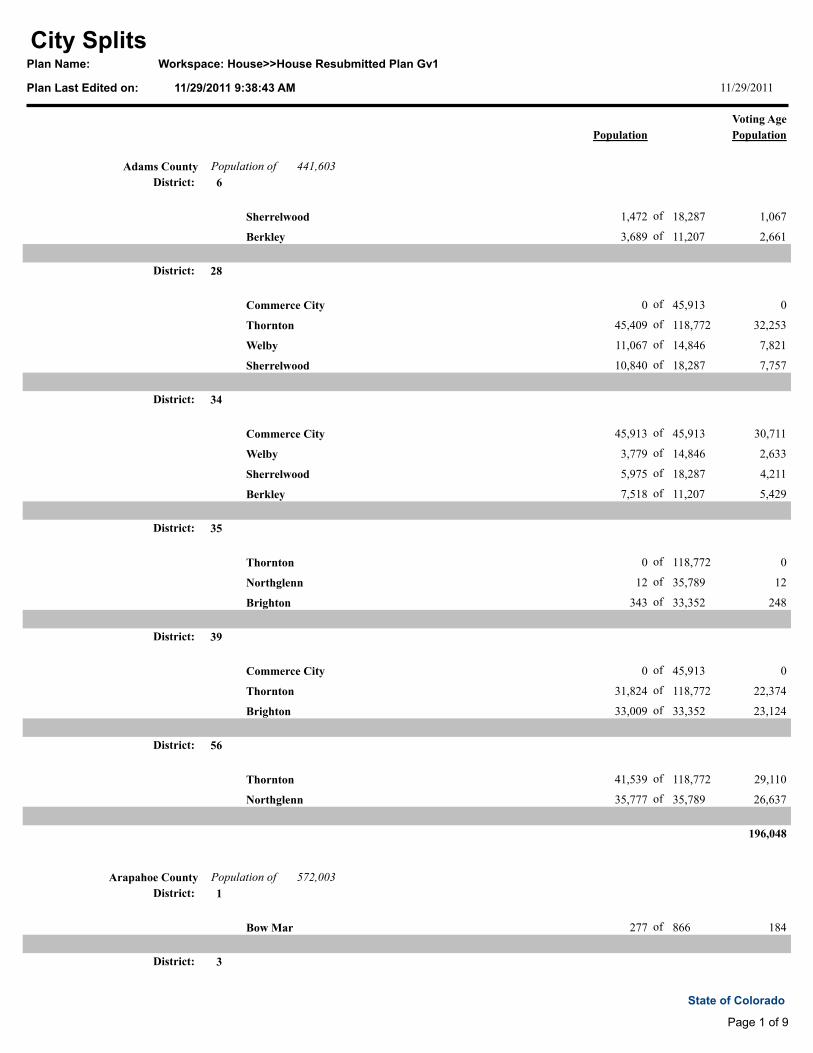
Adams County 441,603Population of
District: 6
1,067 1,472Sherrelwood of 18,287
2,661 3,689Berkley of 11,207
District: 28
0 0Commerce City of 45,913
32,253 45,409Thornton of 118,772
7,821 11,067Welby of 14,846
7,757 10,840Sherrelwood of 18,287
District: 34
30,711 45,913Commerce City of 45,913
2,633 3,779Welby of 14,846
4,211 5,975Sherrelwood of 18,287
5,429 7,518Berkley of 11,207
District: 35
0 0Thornton of 118,772
12 12Northglenn of 35,789
248 343Brighton of 33,352
District: 39
0 0Commerce City of 45,913
22,374 31,824Thornton of 118,772
23,124 33,009Brighton of 33,352
District: 56
29,110 41,539Thornton of 118,772
26,637 35,777Northglenn of 35,789
196,048
Arapahoe County 572,003Population of
District: 1
184 277Bow Mar of 866
District: 3
Page 1 of 9
State of Colorado

Population Population
Voting Age
10,506 13,925Greenwood Village of 13,925
6,536 8,308Centennial of 100,377
District: 25
1,570 2,381Littleton of 41,737
District: 30
54,676 75,596Aurora of 325,078
District: 33
82 117Aurora of 325,078
District: 36
38,953 55,796Aurora of 325,078
District: 37
0 0Aurora of 325,078
0 0Greenwood Village of 13,925
41,836 57,355Centennial of 100,377
District: 38
31,137 39,328Littleton of 41,737
406 589Bow Mar of 866
26,824 34,714Centennial of 100,377
District: 40
42,934 59,041Aurora of 325,078
District: 41
43,507 55,763Aurora of 325,078
District: 42
56,091 78,765Aurora of 325,078
District: 43
24 28Littleton of 41,737
355,266
Boulder County 294,567Population of
District: 10
Page 2 of 9
State of Colorado
Population Population
Voting Age
55,947 65,068Boulder of 97,385
4,682 5,627Gunbarrel of 9,263
District: 11
55,615 75,410Longmont of 86,270
District: 12
8,547 12,483Superior of 12,483
8,045 10,830Longmont of 86,270
District: 13
27,911 32,317Boulder of 97,385
2,870 3,636Gunbarrel of 9,263
District: 29
0 0Superior of 12,483
District: 63
13 30Longmont of 86,270
163,630
Broomfield County 55,889Population of
District: 12
0 0Broomfield of 55,889
District: 35
41,237 55,889Broomfield of 55,889
41,237
Denver County 600,158Population of
District: 1
55,717 75,841Denver of 600,158
District: 2
67,724 75,509Denver of 600,158
District: 4
57,060 75,688Denver of 600,158
Page 3 of 9
State of Colorado

Population Population
Voting Age
District: 5
59,035 75,447Denver of 600,158
District: 7
52,203 77,825Denver of 600,158
District: 8
61,049 75,465Denver of 600,158
District: 9
57,285 68,868Denver of 600,158
District: 31
61,319 75,515Denver of 600,158
471,392
Douglas County 285,465Population of
District: 33
12,866 20,744Highlands Ranch of 96,713
District: 43
52,926 75,969Highlands Ranch of 96,713
65,792
Eagle County 52,197Population of
District: 26
2,220 2,926Basalt of 3,857
District: 61
702 931Basalt of 3,857
2,922
El Paso County 622,263Population of
District: 14
52,062 74,583Colorado Springs of 416,427
District: 15
58,197 76,740Colorado Springs of 416,427
Page 4 of 9
State of Colorado

Population Population
Voting Age
District: 16
63,855 79,222Colorado Springs of 416,427
District: 17
21,535 30,197Security-Widefield of 32,882
District: 18
56,497 78,989Colorado Springs of 416,427
District: 19
20,069 29,982Colorado Springs of 416,427
1,887 2,685Security-Widefield of 32,882
District: 20
484 612Green Mountain Falls of 640
District: 21
61,611 76,911Colorado Springs of 416,427
District: 33
25 28Green Mountain Falls of 640
336,222
Fremont County 46,824Population of
District: 47
0 0Coal Creek of 343
District: 60
260 343Coal Creek of 343
260
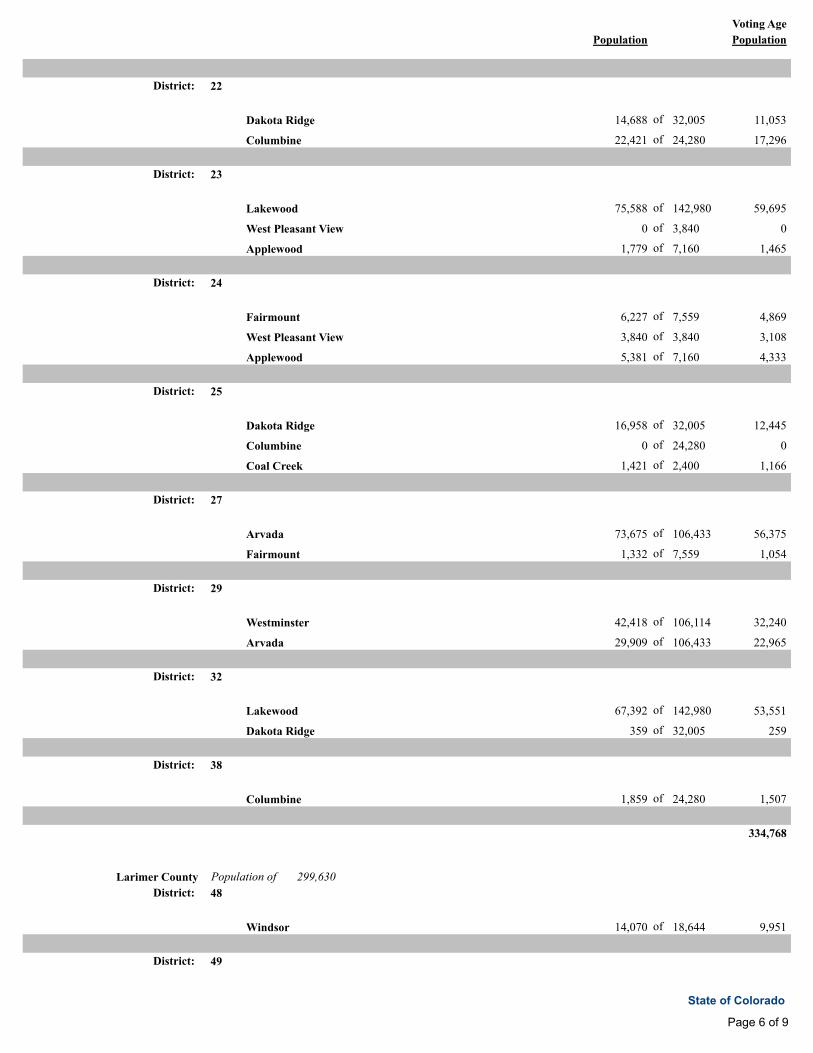
Jefferson County 534,543Population of
District: 6
48,330 63,696Westminster of 106,114
2,233 2,849Arvada of 106,433
District: 13
824 979Coal Creek of 2,400
Page 5 of 9
State of Colorado
Population Population
Voting Age
District: 22
11,053 14,688Dakota Ridge of 32,005
17,296 22,421Columbine of 24,280
District: 23
59,695 75,588Lakewood of 142,980
0 0West Pleasant View of 3,840
1,465 1,779Applewood of 7,160
District: 24
4,869 6,227Fairmount of 7,559
3,108 3,840West Pleasant View of 3,840
4,333 5,381Applewood of 7,160
District: 25
12,445 16,958Dakota Ridge of 32,005
0 0Columbine of 24,280
1,166 1,421Coal Creek of 2,400
District: 27
56,375 73,675Arvada of 106,433
1,054 1,332Fairmount of 7,559
District: 29
32,240 42,418Westminster of 106,114
22,965 29,909Arvada of 106,433
District: 32
53,551 67,392Lakewood of 142,980
259 359Dakota Ridge of 32,005
District: 38
1,507 1,859Columbine of 24,280
334,768
Larimer County 299,630Population of
District: 48
9,951 14,070Windsor of 18,644
District: 49
Page 6 of 9
State of Colorado

Population Population
Voting Age
3,207 4,574Windsor of 18,644
3,767 5,042Berthoud of 5,105
District: 52
59,669 69,691Fort Collins of 143,986
District: 53
55,687 74,295Fort Collins of 143,986
District: 63
40 63Berthoud of 5,105
132,321
Mesa County 146,723Population of
District: 54
6,180 7,655Redlands of 8,685
2,182 2,850Orchard Mesa of 6,836
770 979Fruitvale of 7,675
3,526 4,915Clifton of 19,889
District: 55
769 1,030Redlands of 8,685
2,984 3,986Orchard Mesa of 6,836
5,073 6,696Fruitvale of 7,675
10,503 14,974Clifton of 19,889
31,987
Pueblo County 159,063Population of
District: 46
60,212 78,269Pueblo of 106,595
District: 47
0 0Pueblo of 106,595
105 142Blende of 878
District: 62
20,771 28,326Pueblo of 106,595
557 736Blende of 878
Page 7 of 9
State of Colorado
Population Population
Voting Age
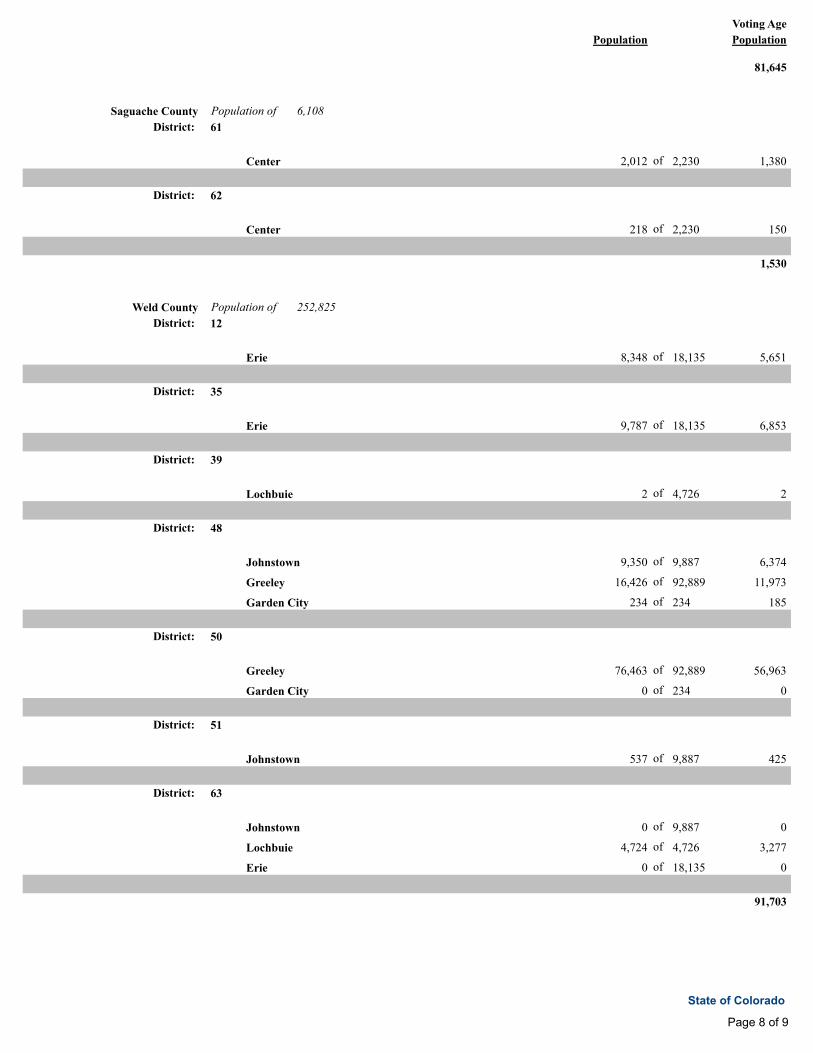
81,645
Saguache County 6,108Population of
District: 61
1,380 2,012Center of 2,230
District: 62
150 218Center of 2,230
1,530
Weld County 252,825Population of
District: 12
5,651 8,348Erie of 18,135
District: 35
6,853 9,787Erie of 18,135
District: 39
2 2Lochbuie of 4,726
District: 48
6,374 9,350Johnstown of 9,887
11,973 16,426Greeley of 92,889
185 234Garden City of 234
District: 50
56,963 76,463Greeley of 92,889
0 0Garden City of 234
District: 51
425 537Johnstown of 9,887
District: 63
0 0Johnstown of 9,887
3,277 4,724Lochbuie of 4,726
0 0Erie of 18,135
91,703
Page 8 of 9
State of Colorado
11/29/2011
Plan was last edited on:
Plan name:
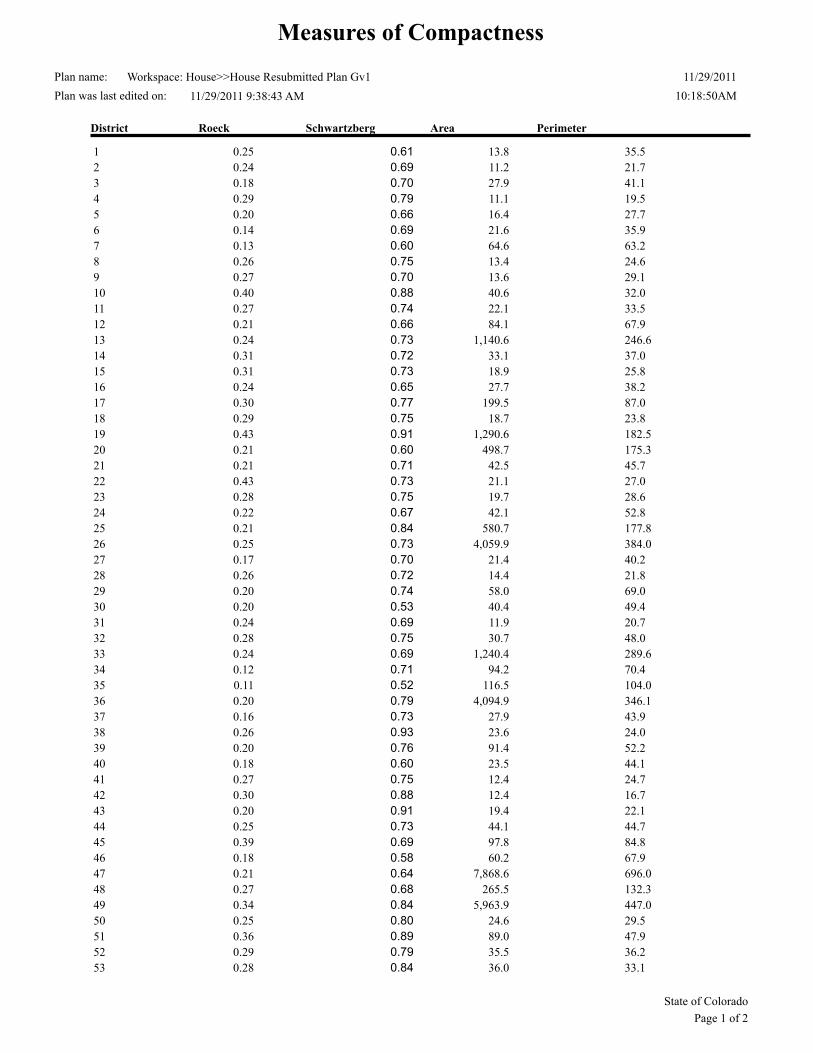
Measures of Compactness
Workspace: House>>House Resubmitted Plan Gv1
11/29/2011 9:38:43 AM 10:18:50AM
District Roeck Schwartzberg Area Perimeter
1 0.25 35.5 0.61 13.8
2 0.24 21.7 0.69 11.2
3 0.18 41.1 0.70 27.9
4 0.29 19.5 0.79 11.1
5 0.20 27.7 0.66 16.4
6 0.14 35.9 0.69 21.6
7 0.13 63.2 0.60 64.6
8 0.26 24.6 0.75 13.4
9 0.27 29.1 0.70 13.6
10 0.40 32.0 0.88 40.6
11 0.27 33.5 0.74 22.1
12 0.21 67.9 0.66 84.1
13 0.24 246.6 0.73 1,140.6
14 0.31 37.0 0.72 33.1
15 0.31 25.8 0.73 18.9
16 0.24 38.2 0.65 27.7
17 0.30 87.0 0.77 199.5
18 0.29 23.8 0.75 18.7
19 0.43 182.5 0.91 1,290.6
20 0.21 175.3 0.60 498.7
21 0.21 45.7 0.71 42.5
22 0.43 27.0 0.73 21.1
23 0.28 28.6 0.75 19.7
24 0.22 52.8 0.67 42.1
25 0.21 177.8 0.84 580.7
26 0.25 384.0 0.73 4,059.9
27 0.17 40.2 0.70 21.4
28 0.26 21.8 0.72 14.4
29 0.20 69.0 0.74 58.0
30 0.20 49.4 0.53 40.4
31 0.24 20.7 0.69 11.9
32 0.28 48.0 0.75 30.7
33 0.24 289.6 0.69 1,240.4
34 0.12 70.4 0.71 94.2
35 0.11 104.0 0.52 116.5
36 0.20 346.1 0.79 4,094.9
37 0.16 43.9 0.73 27.9
38 0.26 24.0 0.93 23.6
39 0.20 52.2 0.76 91.4
40 0.18 44.1 0.60 23.5
41 0.27 24.7 0.75 12.4
42 0.30 16.7 0.88 12.4
43 0.20 22.1 0.91 19.4
44 0.25 44.7 0.73 44.1
45 0.39 84.8 0.69 97.8
46 0.18 67.9 0.58 60.2
47 0.21 696.0 0.64 7,868.6
48 0.27 132.3 0.68 265.5
49 0.34 447.0 0.84 5,963.9
50 0.25 29.5 0.80 24.6
51 0.36 47.9 0.89 89.0
52 0.29 36.2 0.79 35.5
53 0.28 33.1 0.84 36.0
State of Colorado
Page 1 of 2

11/29/2011
Plan was last edited on:
Plan name:
Measures of Compactness
Workspace: House>>House Resubmitted Plan Gv1
11/29/2011 9:38:43 AM 10:18:50AM
54 0.25 80.0 0.68 54.2
55 0.25 403.1 0.85 3,548.9
56 0.29 28.9 0.77 27.5
57 0.40 439.0 0.94 10,929.5
58 0.30 450.6 0.77 5,348.3
59 0.36 301.7 0.96 4,808.0
60 0.23 423.9 0.74 4,206.8
61 0.39 623.8 0.79 12,158.4
62 0.26 453.7 0.71 5,891.6
63 0.29 361.8 0.78 3,643.5
64 0.28 624.6 0.80 15,817.6
65 0.33 578.0 0.69 8,906.5
38,555.74Total Perimeter for all Districts Miles
Total Area for all Districts 416,375.87 Square Miles
148.29 MilesAverage
Average 1,601.45 Square Miles
Report Summary
Maximum Compactness based on Schwartzberg
Minimum Compactness based on Schwartzberg
Maximum Compactness based on Roeck
Minimum Compactness based on Roeck
Schwartzberg Average
Roeck Average 0.43
0.11
Std. Dev. 0.07 0.26
0.96
0.52 0.74 0.09Std. Dev.
State of Colorado
Page 2 of 2

Tuesday, November 29, 2011
Plan Last Edited on:
Plan Name:
10:22 am
District Registration2008 & 2010 Political Party Registrations
Workspace: House>>House Resubmitted Plan Gv1
11/29/2011 9:38:43 AM
District REG VT 08 D REG VT 08 R REG VT 08 UREG VT 08 MP REG VTR 10 RREG VTR 10 D REG VTR 10 UREG VTR 10 MP
1
14,092 7,598 9,695 217
44.59 0.69 24.04 30.68%% %% 8,876 260
%%%% 25.17 43.42 30.52 0.89
12,626 7,320
2
25,422 8,378 17,161 676
49.23 1.31 16.22 33.23%% %% 14,819 602
%%%% 17.01 47.13 34.46 1.40
20,268 7,316
3
15,453 16,031 12,866 258
34.64 0.58 35.94 28.84%% %% 12,552 271
%%%% 36.31 33.43 29.62 0.64
14,168 15,391
4
20,357 4,076 10,264 311
58.15 0.89 11.64 29.32%% %% 9,133 314
%%%% 12.12 57.40 29.47 1.01
17,793 3,756
5
17,110 4,087 9,979 371
54.24 1.18 12.96 31.63%% %% 8,788 333
%%%% 13.01 52.97 32.77 1.24
14,206 3,490
6
14,247 10,437 12,789 218
37.80 0.58 27.69 33.93%% %% 11,657 273
%%%% 29.35 37.13 32.76 0.77
13,213 10,444
7
17,531 3,308 7,649 163
61.19 0.57 11.55 26.70%% %% 7,335 169
%%%% 12.08 60.04 27.25 0.63
16,161 3,250
8
22,339 9,965 13,011 301
48.97 0.66 21.85 28.52%% %% 11,601 303
%%%% 22.61 48.32 28.32 0.74
19,793 9,263
9
18,318 10,812 13,005 282
43.19 0.66 25.49 30.66%% %% 11,684 330
%%%% 26.37 41.65 31.10 0.88
15,651 9,910
10
1
State of ColoradoTarget Population 77,372
District REG VT 08 D REG VT 08 R REG VT 08 UREG VT 08 MP REG VTR 10 RREG VTR 10 D REG VTR 10 UREG VTR 10 MP
26,495 5,791 18,231 682
51.75 1.33 11.31 35.61%% %% 13,536 505
%%%% 11.74 52.78 34.21 1.28
20,882 4,644
11
13,097 12,708 13,909 269
32.76 0.67 31.78 34.79%% %% 13,083 340
%%%% 32.22 32.47 34.42 0.89
12,340 12,246
12
19,196 10,758 16,523 344
41.00 0.73 22.98 35.29%% %% 15,183 382
%%%% 23.28 41.13 34.72 0.87
17,986 10,181
13
25,636 11,494 19,559 546
44.79 0.95 20.08 34.17%% %% 16,849 543
%%%% 20.97 44.61 33.35 1.07
22,535 10,593
14
6,768 22,651 11,148 181
16.61 0.44 55.59 27.36%% %% 11,598 194
%%%% 55.22 15.84 28.46 0.48
6,455 22,504
15
9,594 18,548 11,759 205
23.92 0.51 46.25 29.32%% %% 11,436 214
%%%% 46.96 22.54 29.93 0.56
8,612 17,942
16
12,103 19,770 14,191 297
26.11 0.64 42.64 30.61%% %% 13,542 312
%%%% 43.26 25.05 30.98 0.71
10,953 18,911
17
7,334 9,754 8,375 132
28.65 0.52 38.11 32.72%% %% 8,219 134
%%%% 38.99 27.44 33.03 0.54
6,829 9,703
18
9,705 7,620 8,834 187
36.84 0.71 28.92 33.53%% %% 7,755 167
%%%% 30.78 35.49 33.02 0.71
8,335 7,228
19
6,921 17,116 10,185 156
20.13 0.45 49.79 29.63%% %% 10,305 214
%%%% 50.12 18.89 30.37 0.63
6,410 17,008
20
7,005 24,626 11,631 192
16.12 0.44 56.67 26.77%% %% 11,926 231
%%%% 56.48 15.64 27.36 0.53
6,816 24,620
21
11,431 18,961 12,971 310
26.17 0.71 43.42 29.70%% %% 12,360 340
%%%% 44.25 25.11 29.83 0.82
10,404 18,336
22
2
State of ColoradoTarget Population 77,372

District REG VT 08 D REG VT 08 R REG VT 08 UREG VT 08 MP REG VTR 10 RREG VTR 10 D REG VTR 10 UREG VTR 10 MP
12,967 19,084 14,186 204
27.92 0.44 41.09 30.55%% %% 14,266 251
%%%% 41.27 26.94 31.24 0.55
12,304 18,845
23
15,295 10,239 11,821 282
40.64 0.75 27.20 31.41%% %% 10,974 309
%%%% 28.07 38.94 32.09 0.90
13,316 9,599
24
15,906 13,084 13,839 271
36.90 0.63 30.36 32.11%% %% 13,395 312
%%%% 30.79 35.62 32.82 0.76
14,537 12,567
25
14,494 19,480 15,198 244
29.33 0.49 39.42 30.76%% %% 15,294 325
%%%% 39.66 28.43 31.24 0.66
13,920 19,419
26
12,084 11,411 15,067 426
30.99 1.09 29.27 38.65%% %% 13,356 421
%%%% 30.78 30.31 37.72 1.19
10,731 10,899
27
14,438 15,054 13,485 260
33.39 0.60 34.82 31.19%% %% 13,405 323
%%%% 35.25 32.11 31.87 0.77
13,504 14,824
28
11,805 5,229 9,197 166
44.72 0.63 19.81 34.84%% %% 8,389 199
%%%% 21.20 43.68 34.31 0.81
10,682 5,184
29
14,636 15,207 14,363 211
32.95 0.48 34.24 32.34%% %% 14,333 258
%%%% 34.57 31.98 32.86 0.59
13,949 15,076
30
13,702 11,383 10,381 156
38.46 0.44 31.95 29.14%% %% 10,867 211
%%%% 32.92 35.81 30.67 0.60
12,688 11,665
31
30,528 4,625 13,314 589
62.23 1.20 9.43 27.14%% %% 11,224 438
%%%% 9.79 61.74 27.40 1.07
25,288 4,009
32
15,511 15,444 13,886 180
34.45 0.40 34.30 30.84%% %% 13,705 230
%%%% 34.60 33.25 31.62 0.53
14,414 15,000
33
9,340 22,432 13,280 189
20.64 0.42 49.58 29.35%% %% 13,078 289
%%%% 50.51 19.87 28.98 0.64
8,967 22,796
34
3
State of ColoradoTarget Population 77,372
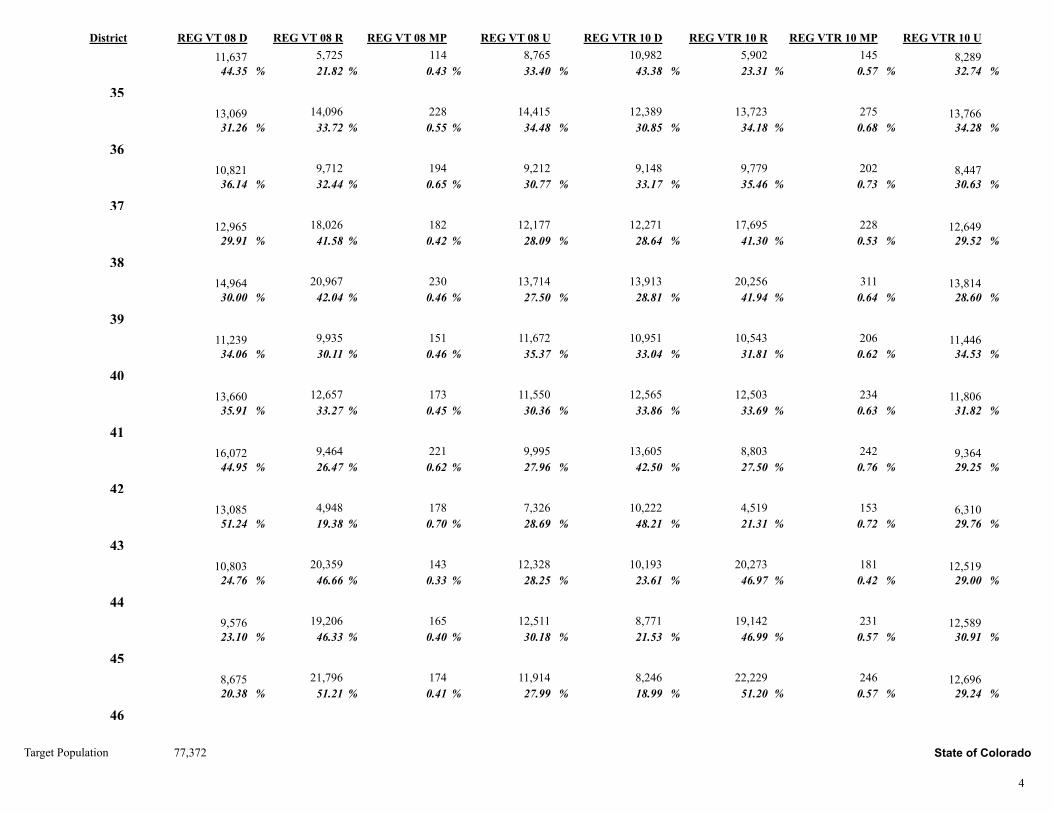
District REG VT 08 D REG VT 08 R REG VT 08 UREG VT 08 MP REG VTR 10 RREG VTR 10 D REG VTR 10 UREG VTR 10 MP
11,637 5,725 8,765 114
44.35 0.43 21.82 33.40%% %% 8,289 145
%%%% 23.31 43.38 32.74 0.57
10,982 5,902
35
13,069 14,096 14,415 228
31.26 0.55 33.72 34.48%% %% 13,766 275
%%%% 34.18 30.85 34.28 0.68
12,389 13,723
36
10,821 9,712 9,212 194
36.14 0.65 32.44 30.77%% %% 8,447 202
%%%% 35.46 33.17 30.63 0.73
9,148 9,779
37
12,965 18,026 12,177 182
29.91 0.42 41.58 28.09%% %% 12,649 228
%%%% 41.30 28.64 29.52 0.53
12,271 17,695
38
14,964 20,967 13,714 230
30.00 0.46 42.04 27.50%% %% 13,814 311
%%%% 41.94 28.81 28.60 0.64
13,913 20,256
39
11,239 9,935 11,672 151
34.06 0.46 30.11 35.37%% %% 11,446 206
%%%% 31.81 33.04 34.53 0.62
10,951 10,543
40
13,660 12,657 11,550 173
35.91 0.45 33.27 30.36%% %% 11,806 234
%%%% 33.69 33.86 31.82 0.63
12,565 12,503
41
16,072 9,464 9,995 221
44.95 0.62 26.47 27.96%% %% 9,364 242
%%%% 27.50 42.50 29.25 0.76
13,605 8,803
42
13,085 4,948 7,326 178
51.24 0.70 19.38 28.69%% %% 6,310 153
%%%% 21.31 48.21 29.76 0.72
10,222 4,519
43
10,803 20,359 12,328 143
24.76 0.33 46.66 28.25%% %% 12,519 181
%%%% 46.97 23.61 29.00 0.42
10,193 20,273
44
9,576 19,206 12,511 165
23.10 0.40 46.33 30.18%% %% 12,589 231
%%%% 46.99 21.53 30.91 0.57
8,771 19,142
45
8,675 21,796 11,914 174
20.38 0.41 51.21 27.99%% %% 12,696 246
%%%% 51.20 18.99 29.24 0.57
8,246 22,229
46
4
State of ColoradoTarget Population 77,372

District REG VT 08 D REG VT 08 R REG VT 08 UREG VT 08 MP REG VTR 10 RREG VTR 10 D REG VTR 10 UREG VTR 10 MP
22,778 8,594 10,483 143
54.24 0.34 20.46 24.96%% %% 8,841 147
%%%% 21.99 53.58 24.03 0.40
19,712 8,092
47
15,484 15,469 11,708 169
36.15 0.39 36.12 27.34%% %% 10,330 234
%%%% 38.11 35.49 25.81 0.58
14,203 15,254
48
9,204 15,711 12,290 169
24.63 0.45 42.04 32.88%% %% 12,267 207
%%%% 42.92 23.28 33.24 0.56
8,593 15,838
49
12,954 21,771 15,963 294
25.41 0.58 42.70 31.31%% %% 15,750 335
%%%% 43.10 24.52 31.71 0.67
12,178 21,408
50
9,942 10,671 10,856 225
31.37 0.71 33.67 34.25%% %% 9,337 192
%%%% 35.77 29.71 33.83 0.70
8,199 9,871
51
11,543 19,199 14,661 243
25.29 0.53 42.06 32.12%% %% 14,735 304
%%%% 41.85 24.30 33.16 0.68
10,801 18,600
52
17,520 11,472 17,546 607
37.16 1.29 24.33 37.22%% %% 14,364 502
%%%% 24.77 35.97 37.94 1.33
13,620 9,377
53
14,476 17,518 15,763 301
30.12 0.63 36.45 32.80%% %% 15,358 334
%%%% 36.04 29.21 34.02 0.74
13,188 16,270
54
10,549 18,569 13,050 247
24.87 0.58 43.78 30.77%% %% 11,932 317
%%%% 45.45 23.42 30.32 0.81
9,219 17,888
55
8,042 18,056 12,161 235
20.89 0.61 46.91 31.59%% %% 11,505 337
%%%% 48.69 19.68 30.73 0.90
7,369 18,227
56
13,576 11,037 13,286 188
35.64 0.49 28.98 34.88%% %% 12,532 250
%%%% 30.85 34.40 34.06 0.68
12,658 11,352
57
8,787 14,651 12,937 221
24.01 0.60 40.03 35.35%% %% 11,471 286
%%%% 43.44 22.24 33.48 0.83
7,620 14,881
58
5
State of ColoradoTarget Population 77,372
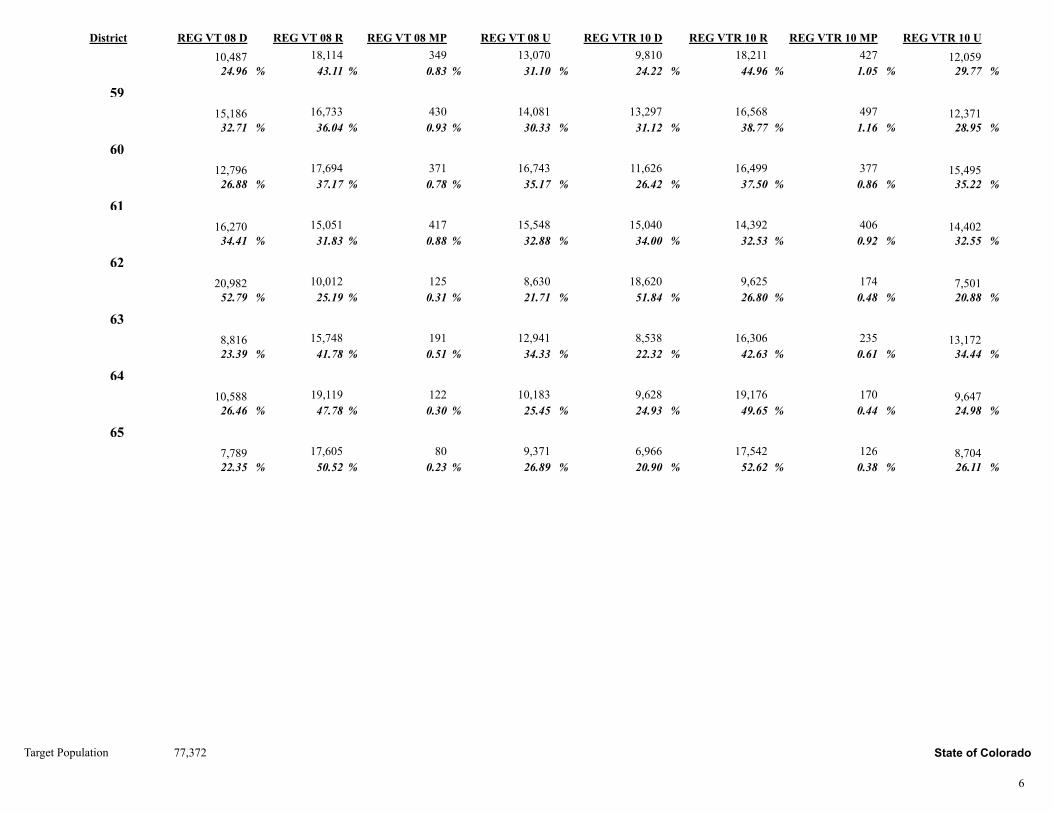
District REG VT 08 D REG VT 08 R REG VT 08 UREG VT 08 MP REG VTR 10 RREG VTR 10 D REG VTR 10 UREG VTR 10 MP
10,487 18,114 13,070 349
24.96 0.83 43.11 31.10%% %% 12,059 427
%%%% 44.96 24.22 29.77 1.05
9,810 18,211
59
15,186 16,733 14,081 430
32.71 0.93 36.04 30.33%% %% 12,371 497
%%%% 38.77 31.12 28.95 1.16
13,297 16,568
60
12,796 17,694 16,743 371
26.88 0.78 37.17 35.17%% %% 15,495 377
%%%% 37.50 26.42 35.22 0.86
11,626 16,499
61
16,270 15,051 15,548 417
34.41 0.88 31.83 32.88%% %% 14,402 406
%%%% 32.53 34.00 32.55 0.92
15,040 14,392
62
20,982 10,012 8,630 125
52.79 0.31 25.19 21.71%% %% 7,501 174
%%%% 26.80 51.84 20.88 0.48
18,620 9,625
63
8,816 15,748 12,941 191
23.39 0.51 41.78 34.33%% %% 13,172 235
%%%% 42.63 22.32 34.44 0.61
8,538 16,306
64
10,588 19,119 10,183 122
26.46 0.30 47.78 25.45%% %% 9,647 170
%%%% 49.65 24.93 24.98 0.44
9,628 19,176
65
7,789 17,605 9,371 80
22.35 0.23 50.52 26.89%% %% 8,704 126
%%%% 52.62 20.90 26.11 0.38
6,966 17,542
6
State of ColoradoTarget Population 77,372

Tuesday, November 29, 2011
Plan Last Edited on:
Plan Name:
10:17 am
Political Summary - US Senate2008 & 2010 General Election Results for Select Races & Voting Age Population
Workspace: House>>House Resubmitted Plan Gv1
11/29/2011 9:38:43 AM
US SEN 08 D US SEN 08 RDistrict US SEN 08 MP 18 + PopUS SEN 10 RUS SEN 10 D US SEN 10 MP
1 16,983 9,033 1,457
61.82% 32.88% 5.30%
55,904 7,307 10,884 1,13256.33% 37.82% 5.86%
2 33,594 9,766 1,693
74.57% 21.68% 3.76%
67,724 7,104 22,865 1,35672.99% 22.68% 4.33%
3 21,404 17,132 1,731
53.16% 42.55% 4.30%
59,476 14,454 15,870 1,52449.83% 45.38% 4.79%
4 23,236 5,071 1,480
78.01% 17.02% 4.97%
57,060 3,884 16,016 1,15976.05% 18.44% 5.50%
5 18,762 4,698 1,192
76.11% 19.06% 4.84%
59,035 3,187 12,208 82975.25% 19.64% 5.11%
6 19,601 12,362 1,686
58.25% 36.74% 5.01%
58,803 10,573 12,427 1,54250.64% 43.08% 6.28%
7 19,254 3,894 891
80.09% 16.20% 3.71%
52,203 2,985 13,065 56778.62% 17.96% 3.41%
8 28,022 11,555 1,068
68.94% 28.43% 2.63%
61,049 9,066 20,903 1,03367.42% 29.24% 3.33%
9 23,909 12,030 1,481
63.89% 32.15% 3.96%
62,879 9,478 16,736 1,22161.00% 34.55% 4.45%
10 36,627 6,683 1,434
81.86% 14.94% 3.20%
64,319 4,707 25,092 1,12481.14% 15.22% 3.63%
11
1
State of ColoradoTarget Population 77,372

US SEN 08 D US SEN 08 RDistrict US SEN 08 MP 18 + PopUS SEN 10 RUS SEN 10 D US SEN 10 MP
20,023 14,364 1,627
55.60% 39.88% 4.52%
55,929 12,266 14,359 1,61450.85% 43.44% 5.72%
12 28,654 12,603 1,408
67.16% 29.54% 3.30%
57,793 10,339 21,502 1,57164.35% 30.94% 4.70%
13 36,845 12,964 1,771
71.43% 25.13% 3.43%
65,771 11,087 27,059 1,72367.87% 27.81% 4.32%
14 10,935 24,538 1,199
29.82% 66.91% 3.27%
53,175 19,300 7,407 1,21626.53% 69.12% 4.35%
15 13,356 19,905 1,838
38.05% 56.71% 5.24%
58,289 15,699 8,939 1,61834.05% 59.79% 6.16%
16 18,154 21,028 1,722
44.38% 51.41% 4.21%
63,866 16,624 12,296 1,51040.41% 54.63% 4.96%
17 9,163 10,756 1,725
42.34% 49.70% 7.97%
55,112 7,560 5,390 1,16638.18% 53.56% 8.26%
18 10,878 7,978 1,660
53.02% 38.89% 8.09%
56,803 5,511 5,970 1,05347.63% 43.97% 8.40%
19 9,786 18,500 1,789
32.54% 61.51% 5.95%
53,869 13,762 5,725 1,42627.38% 65.81% 6.82%
20 11,717 26,427 1,517
29.54% 66.63% 3.82%
56,504 22,343 8,691 1,40726.79% 68.87% 4.34%
21 16,887 19,584 1,808
44.12% 51.16% 4.72%
61,969 16,013 11,743 1,48040.17% 54.77% 5.06%
22 20,271 21,688 2,053
46.06% 49.28% 4.66%
57,143 17,913 14,520 1,85042.35% 52.25% 5.40%
23 20,136 11,067 2,086
60.49% 33.25% 6.27%
61,448 9,306 13,750 1,59355.78% 37.75% 6.46%
24
2
State of ColoradoTarget Population 77,372

US SEN 08 D US SEN 08 RDistrict US SEN 08 MP 18 + PopUS SEN 10 RUS SEN 10 D US SEN 10 MP
22,631 14,932 2,191
56.93% 37.56% 5.51%
61,470 12,795 16,801 1,84553.44% 40.70% 5.87%
25 22,691 22,443 1,876
48.27% 47.74% 3.99%
57,626 19,339 17,120 1,71944.84% 50.65% 4.50%
26 20,232 12,295 1,326
59.76% 36.32% 3.92%
57,997 9,697 12,990 1,23854.29% 40.53% 5.17%
27 20,891 16,878 2,265
52.18% 42.16% 5.66%
59,395 14,778 14,767 1,93246.91% 46.95% 6.14%
28 14,591 6,277 1,626
64.87% 27.91% 7.23%
56,462 5,029 8,506 1,36257.10% 33.76% 9.14%
29 22,296 17,349 1,994
53.55% 41.67% 4.79%
58,047 14,564 15,544 1,90248.56% 45.50% 5.94%
30 17,609 12,800 1,688
54.86% 39.88% 5.26%
55,201 11,039 11,947 1,39449.00% 45.28% 5.72%
31 34,437 5,184 1,440
83.87% 12.63% 3.51%
61,319 3,857 24,456 96383.54% 13.17% 3.29%
32 22,621 17,432 2,081
53.69% 41.37% 4.94%
60,137 14,829 16,333 1,78549.57% 45.01% 5.42%
33 15,375 25,018 1,712
36.52% 59.42% 4.07%
56,256 21,238 11,089 1,58132.70% 62.63% 4.66%
34 13,683 7,024 1,508
61.59% 31.62% 6.79%
54,013 5,844 8,510 1,24554.55% 37.46% 7.98%
35 20,074 16,072 1,635
53.13% 42.54% 4.33%
56,464 13,897 14,163 1,63347.70% 46.80% 5.50%
36 12,527 10,805 1,667
50.11% 43.22% 6.67%
56,034 9,601 7,915 1,40741.83% 50.74% 7.44%
37
3
State of ColoradoTarget Population 77,372

US SEN 08 D US SEN 08 RDistrict US SEN 08 MP 18 + PopUS SEN 10 RUS SEN 10 D US SEN 10 MP
19,229 19,551 1,346
47.92% 48.72% 3.35%
55,949 16,102 14,153 1,34144.79% 50.96% 4.24%
38 22,161 22,160 1,943
47.90% 47.90% 4.20%
60,897 19,033 17,263 1,81445.30% 49.94% 4.76%
39 15,591 12,213 1,778
52.70% 41.29% 6.01%
54,789 10,680 10,019 1,61844.89% 47.86% 7.25%
40 18,557 14,086 1,631
54.14% 41.10% 4.76%
55,200 11,268 12,261 1,44649.09% 45.12% 5.79%
41 19,650 10,116 1,406
63.04% 32.45% 4.51%
58,666 8,201 12,957 1,15658.07% 36.75% 5.18%
42 13,779 5,349 1,305
67.44% 26.18% 6.39%
56,091 4,351 8,368 85761.64% 32.05% 6.31%
43 17,328 22,176 1,127
42.65% 54.58% 2.77%
52,950 17,850 12,442 1,13239.59% 56.80% 3.60%
44 15,108 21,247 1,478
39.93% 56.16% 3.91%
55,153 16,994 10,157 1,36935.61% 59.59% 4.80%
45 14,051 23,686 1,385
35.92% 60.54% 3.54%
52,664 20,135 10,306 1,31232.46% 63.41% 4.13%
46 22,311 11,640 1,543
62.86% 32.79% 4.35%
60,515 9,298 15,435 1,17059.59% 35.90% 4.52%
47 16,167 18,381 1,913
44.34% 50.41% 5.25%
60,812 16,238 12,052 1,72640.15% 54.10% 5.75%
48 13,818 17,541 1,838
41.62% 52.84% 5.54%
54,252 15,740 9,349 1,32035.40% 59.60% 5.00%
49 20,891 22,886 2,226
45.41% 49.75% 4.84%
62,418 20,029 15,885 2,31441.55% 52.39% 6.05%
50
4
State of ColoradoTarget Population 77,372

US SEN 08 D US SEN 08 RDistrict US SEN 08 MP 18 + PopUS SEN 10 RUS SEN 10 D US SEN 10 MP
13,961 11,214 1,511
52.32% 42.02% 5.66%
58,003 9,445 8,316 98944.35% 50.37% 5.27%
51 17,835 20,584 2,313
43.79% 50.54% 5.68%
60,491 17,406 13,110 2,32039.93% 53.01% 7.07%
52 25,523 12,382 1,978
63.99% 31.05% 4.96%
66,913 8,286 16,475 1,51762.70% 31.53% 5.77%
53 22,730 18,767 1,626
52.71% 43.52% 3.77%
58,710 14,916 16,996 1,61850.69% 44.49% 4.83%
54 15,095 20,323 1,542
40.84% 54.99% 4.17%
61,533 16,995 10,483 2,03135.52% 57.59% 6.88%
55 11,744 20,402 1,685
34.71% 60.31% 4.98%
57,452 17,850 7,890 2,23828.20% 63.80% 8.00%
56 19,013 13,670 1,836
55.08% 39.60% 5.32%
56,673 11,168 11,818 1,56548.14% 45.49% 6.37%
57 13,674 16,142 1,636
43.48% 51.32% 5.20%
56,280 13,385 9,646 1,82538.81% 53.85% 7.34%
58 16,006 19,978 1,960
42.18% 52.65% 5.17%
58,541 18,145 11,300 2,35535.53% 57.06% 7.41%
59 20,900 17,374 1,283
52.84% 43.92% 3.24%
61,960 15,526 14,007 1,50245.13% 50.03% 4.84%
60 18,987 17,689 2,143
48.91% 45.57% 5.52%
64,949 15,176 12,803 2,09042.58% 50.47% 6.95%
61 23,479 15,125 2,259
57.46% 37.01% 5.53%
62,656 13,308 17,473 2,00053.30% 40.60% 6.10%
62 19,965 10,944 2,010
60.65% 33.25% 6.11%
59,289 9,327 14,552 1,37857.62% 36.93% 5.46%
63
5
State of ColoradoTarget Population 77,372

US SEN 08 D US SEN 08 RDistrict US SEN 08 MP 18 + PopUS SEN 10 RUS SEN 10 D US SEN 10 MP
13,120 18,460 2,304
38.72% 54.48% 6.80%
54,942 16,783 8,602 1,86131.57% 61.60% 6.83%
64 12,131 20,828 1,965
34.74% 59.64% 5.63%
60,778 18,359 8,986 1,90130.73% 62.77% 6.50%
65 10,390 17,735 1,581
34.98% 59.70% 5.32%
57,517 15,706 7,938 1,65731.37% 62.08% 6.55%
6
State of ColoradoTarget Population 77,372

Tuesday, November 29, 2011
Plan Last Edited on:
Plan Name:
10:16 am
Political Summary - Regent & Treasurer2008 & 2010 General Election Results for Select Races & Voting Age Population
Workspace: House>>House Resubmitted Plan Gv1
11/29/2011 9:38:43 AM
TREASURER 10 D TREASURER 10 RDistrict 18 + PopRGT 10 LG RRGT 10 LG D RGT 10 LG MP
1 55,904 923 9,725 7,498
53.59% 41.32% 5.09%59.36% 40.64%
7,696 11,242
2 67,724 1,490 19,265 7,638
67.85% 26.90% 5.25%73.41% 26.59%
7,983 22,036
3 59,476 1,429 12,954 14,986
44.11% 51.03% 4.87%50.34% 49.66%
15,190 15,400
4 57,060 1,047 14,553 3,935
74.50% 20.14% 5.36%78.77% 21.23%
4,338 16,098
5 59,035 802 11,074 3,266
73.13% 21.57% 5.30%77.19% 22.81%
3,587 12,137
6 58,803 1,257 10,937 10,905
47.35% 47.21% 5.44%53.48% 46.52%
11,047 12,701
7 52,203 547 12,255 2,928
77.91% 18.61% 3.48%80.27% 19.73%
3,202 13,024
8 61,049 1,007 17,993 9,666
62.77% 33.72% 3.51%68.25% 31.75%
9,612 20,659
9 62,879 1,132 14,297 10,036
56.14% 39.41% 4.45%62.65% 37.35%
10,006 16,785
10 64,319 1,154 21,394 6,431
73.83% 22.19% 3.98%81.44% 18.56%
5,420 23,783
11
1
State of ColoradoTarget Population 77,372
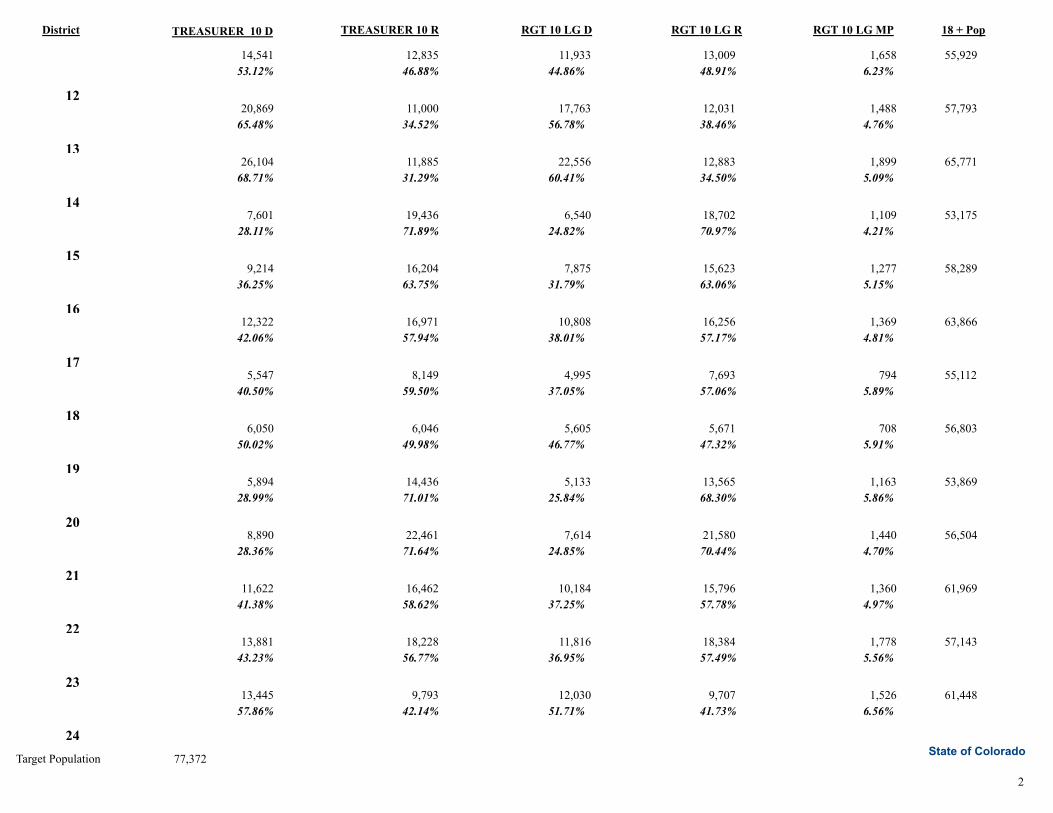
TREASURER 10 D TREASURER 10 RDistrict 18 + PopRGT 10 LG RRGT 10 LG D RGT 10 LG MP
55,929 1,658 11,933 13,009
44.86% 48.91% 6.23%53.12% 46.88%
12,835 14,541
12 57,793 1,488 17,763 12,031
56.78% 38.46% 4.76%65.48% 34.52%
11,000 20,869
13 65,771 1,899 22,556 12,883
60.41% 34.50% 5.09%68.71% 31.29%
11,885 26,104
14 53,175 1,109 6,540 18,702
24.82% 70.97% 4.21%28.11% 71.89%
19,436 7,601
15 58,289 1,277 7,875 15,623
31.79% 63.06% 5.15%36.25% 63.75%
16,204 9,214
16 63,866 1,369 10,808 16,256
38.01% 57.17% 4.81%42.06% 57.94%
16,971 12,322
17 55,112 794 4,995 7,693
37.05% 57.06% 5.89%40.50% 59.50%
8,149 5,547
18 56,803 708 5,605 5,671
46.77% 47.32% 5.91%50.02% 49.98%
6,046 6,050
19 53,869 1,163 5,133 13,565
25.84% 68.30% 5.86%28.99% 71.01%
14,436 5,894
20 56,504 1,440 7,614 21,580
24.85% 70.44% 4.70%28.36% 71.64%
22,461 8,890
21 61,969 1,360 10,184 15,796
37.25% 57.78% 4.97%41.38% 58.62%
16,462 11,622
22 57,143 1,778 11,816 18,384
36.95% 57.49% 5.56%43.23% 56.77%
18,228 13,881
23 61,448 1,526 12,030 9,707
51.71% 41.73% 6.56%57.86% 42.14%
9,793 13,445
24
2
State of ColoradoTarget Population 77,372

TREASURER 10 D TREASURER 10 RDistrict 18 + PopRGT 10 LG RRGT 10 LG D RGT 10 LG MP
61,470 1,949 14,154 13,260
48.20% 45.16% 6.64%54.53% 45.47%
13,333 15,990
25 57,626 2,018 13,859 19,256
39.45% 54.81% 5.74%44.98% 55.02%
19,447 15,899
26 57,997 1,368 10,170 10,005
47.21% 46.44% 6.35%52.79% 47.21%
10,676 11,939
27 59,395 1,868 12,482 15,287
42.12% 51.58% 6.30%48.39% 51.61%
15,342 14,384
28 56,462 946 7,891 5,357
55.59% 37.74% 6.66%60.69% 39.31%
5,678 8,765
29 58,047 1,782 12,841 15,236
43.01% 51.03% 5.97%49.77% 50.23%
15,307 15,166
30 55,201 1,217 10,415 11,277
45.46% 49.23% 5.31%50.26% 49.74%
11,718 11,842
31 61,319 1,046 22,113 4,093
81.14% 15.02% 3.84%84.80% 15.20%
4,306 24,031
32 60,137 1,720 13,841 15,326
44.81% 49.62% 5.57%51.54% 48.46%
14,996 15,946
33 56,256 1,754 8,910 21,062
28.08% 66.39% 5.53%32.84% 67.16%
22,195 10,853
34 54,013 1,006 7,771 5,945
52.78% 40.38% 6.83%57.27% 42.73%
6,430 8,617
35 56,464 1,434 11,858 14,888
42.08% 52.83% 5.09%49.27% 50.73%
14,621 14,198
36 56,034 1,182 7,004 9,686
39.19% 54.20% 6.61%43.76% 56.24%
10,324 8,032
37
3
State of ColoradoTarget Population 77,372

TREASURER 10 D TREASURER 10 RDistrict 18 + PopRGT 10 LG RRGT 10 LG D RGT 10 LG MP
55,949 1,281 11,612 16,444
39.58% 56.05% 4.37%44.90% 55.10%
16,682 13,596
38 60,897 1,728 13,874 19,734
39.26% 55.85% 4.89%46.10% 53.90%
19,769 16,906
39 54,789 1,378 8,698 10,784
41.70% 51.70% 6.61%47.03% 52.97%
11,425 10,144
40 55,200 1,259 10,552 11,682
44.92% 49.73% 5.36%50.09% 49.91%
11,994 12,036
41 58,666 1,017 11,324 8,588
54.11% 41.03% 4.86%59.11% 40.89%
8,852 12,796
42 56,091 824 7,630 4,475
59.01% 34.61% 6.37%64.10% 35.90%
4,745 8,474
43 52,950 1,175 9,689 18,215
33.32% 62.64% 4.04%38.64% 61.36%
18,637 11,736
44 55,153 1,437 7,918 17,097
29.93% 64.63% 5.43%35.26% 64.74%
17,863 9,730
45 52,664 1,543 7,887 20,158
26.66% 68.13% 5.21%31.78% 68.22%
21,038 9,799
46 60,515 805 14,728 9,581
58.64% 38.15% 3.21%62.52% 37.48%
9,536 15,905
47 60,812 1,450 11,207 15,829
39.34% 55.57% 5.09%43.59% 56.41%
16,607 12,831
48 54,252 1,356 7,853 15,346
31.98% 62.50% 5.52%37.62% 62.38%
15,867 9,568
49 62,418 2,240 12,849 20,496
36.11% 57.60% 6.29%41.91% 58.09%
21,675 15,636
50
4
State of ColoradoTarget Population 77,372

TREASURER 10 D TREASURER 10 RDistrict 18 + PopRGT 10 LG RRGT 10 LG D RGT 10 LG MP
58,003 929 7,172 9,347
41.10% 53.57% 5.32%47.65% 52.35%
9,442 8,595
51 60,491 2,081 10,691 17,937
34.81% 58.41% 6.78%41.45% 58.55%
18,792 13,306
52 66,913 1,577 13,637 8,493
57.52% 35.82% 6.65%62.96% 37.04%
9,297 15,805
53 58,710 1,680 13,539 15,073
44.69% 49.76% 5.55%50.50% 49.50%
15,914 16,238
54 61,533 1,837 9,213 16,892
32.97% 60.45% 6.57%35.66% 64.34%
17,934 9,939
55 57,452 2,005 7,112 17,527
26.69% 65.78% 7.53%28.75% 71.25%
18,956 7,649
56 56,673 1,331 10,256 11,591
44.25% 50.01% 5.74%49.88% 50.12%
11,921 11,866
57 56,280 1,812 7,902 13,202
34.48% 57.61% 7.91%38.67% 61.33%
14,674 9,254
58 58,541 2,426 9,766 17,637
32.74% 59.13% 8.13%36.00% 64.00%
19,448 10,941
59 61,960 1,703 11,633 15,242
40.71% 53.33% 5.96%45.75% 54.25%
16,103 13,579
60 64,949 2,085 10,577 15,094
38.11% 54.38% 7.51%44.00% 56.00%
16,300 12,806
61 62,656 1,915 14,558 13,154
49.14% 44.40% 6.46%53.47% 46.53%
14,403 16,553
62 59,289 1,042 13,863 9,318
57.23% 38.47% 4.30%60.30% 39.70%
9,812 14,906
63
5
State of ColoradoTarget Population 77,372

TREASURER 10 D TREASURER 10 RDistrict 18 + PopRGT 10 LG RRGT 10 LG D RGT 10 LG MP
54,942 1,703 7,290 16,614
28.47% 64.88% 6.65%34.04% 65.96%
17,387 8,973
64 60,778 1,526 7,753 18,340
28.07% 66.40% 5.53%33.24% 66.76%
19,092 9,505
65 57,517 1,206 6,155 16,185
26.14% 68.74% 5.12%33.60% 66.40%
16,409 8,303
6
State of ColoradoTarget Population 77,372