hospital pharmacy in europe 2010 survey... · dr. roberto frontini, president eahp...
TRANSCRIPT

Dr. Roberto Frontini, President EAHP [email protected]
Hospital Pharmacy in Europe
The EAHP survey 2010

© EAHP Dr. Roberto Frontini ASHP Midyear New Orleans 05/12/2011
EAHP
Methodology of the survey
Results
General frame, staffing
Procurement
Production & Quality assurance
Clinical services
Patient safety
Education & Research
Outline
2

European Association of Hospital Pharmacists
(EAHP)
Created in 1972 in The Hague (NL)
Federation of National Associations of
Pharmacists
Members of the Council of Europe
31 countries: 24 EU + 7 outside EU
More than 21,000 Hospital Pharmacists
working in hospitals and other healthcare
facilities in Europe
3 © EAHP Dr. Roberto Frontini ASHP Midyear New Orleans 05/12/2011

EAHP Members
Austria Belgium
Bosnia Herzegovina Bulgaria
Croatia Czech Republic
Denmark Estonia
Finland France
Germany Greece
Hungary Ireland
Italy Latvia
Lithuania Luxembourg
FYROM Netherlands
Norway Poland
Portugal Serbia
Slovakia Slovenia
Spain Sweden
Switzerland Turkey
United Kingdom
31 members
4 © EAHP Dr. Roberto Frontini ASHP Midyear New Orleans 05/12/2011

© EAHP Dr. Roberto Frontini ASHP Midyear New Orleans 05/12/2011
4th pan-European survey (1995/2000/2005/2010)
87 questions on hospital pharmacy
practice
Direct approach through national
coordinators of every Head of Pharmacy
of the member states (4,747 in total)
Data collection Oct.2010 -Jan. 2011
Total number of answers 1,238 = 26.1%
Methodology
5

Methodology: Response rate
green = > 20 (30)%
yellow = 10-20%
orange = < 10%
red = no answer
grey = no member
6 © EAHP Dr. Roberto Frontini ASHP Midyear New Orleans 05/12/2011
Max % = 100% (Fyrom)
Max # = 130 (Germany)

© EAHP Dr. Roberto Frontini ASHP Midyear New Orleans 05/12/2011
By insufficient response rate (<25%) check
by national coordinators
Decision on inclusion in national reports
based on the national distribution of hospital
types and the distribution of answering
hospitals
Rates (%) always in relation to the total
number of answers to the question
Response rate for each question ranges
between 5.0% and 91.0%
Methodology
7

© EAHP Dr. Roberto Frontini ASHP Midyear New Orleans 05/12/2011
The response rate varies substantially from country
to country and does not reflect the weight of the
population of that country in Europe
Language barriers might have created a bias of
answering pharmacists
Some of the questions might have been
misunderstood by non native English speakers
Enlargement of EU to eastern countries might have
created a bias in relation to past survey
Limitations by bias
8

General frame
Staffing
9 © EAHP Dr. Roberto Frontini ASHP Midyear New Orleans 05/12/2011

0
500
1000
1500
2000
2500
3000
3500
Au
str
ia
Be
lgiu
m
BiH
Bu
lga
ria
Cro
ati
a
Czec
h R
ep
ub
lic
De
nm
ark
Esto
nia
Fin
lan
d
Fra
nce
FY
RO
M
Germ
an
y
Gre
at
Bri
tain
Gre
ece
Hu
ng
ary
Irela
nd
Italy
Latv
ia
Lit
hu
an
ia
Lu
xe
mb
urg
Ne
the
rlan
ds
No
rwa
y
Po
lan
d
Po
rtu
gal
Serb
ia
Slo
vak
ia
Slo
ven
ia
Sp
ain
Sw
ed
en
Sw
itzerl
an
d
2010 2005 2000
© EAHP Dr. Roberto Frontini ASHP Midyear New Orleans 05/12/2011
General Frame: Number of beds served
10

0
100
200
300
400
500
600
700
800
2000 2005 2010
Sum Complete Partial
General Frame: Number of beds served
11 © EAHP Dr. Roberto Frontini ASHP Midyear New Orleans 05/12/2011
Sum 2010 2005 2000
Average 708 703 648
Median 427
Hospitalisation

© EAHP Dr. Roberto Frontini ASHP Midyear New Orleans 05/12/2011
General Frame: Ownership
12
Public hospital (i.e. owned by the
government) 81%
Church affiliated hospital
4%
Private hospital 10%
Other 5%
Hospital ownership in 2010 (n= 1102)
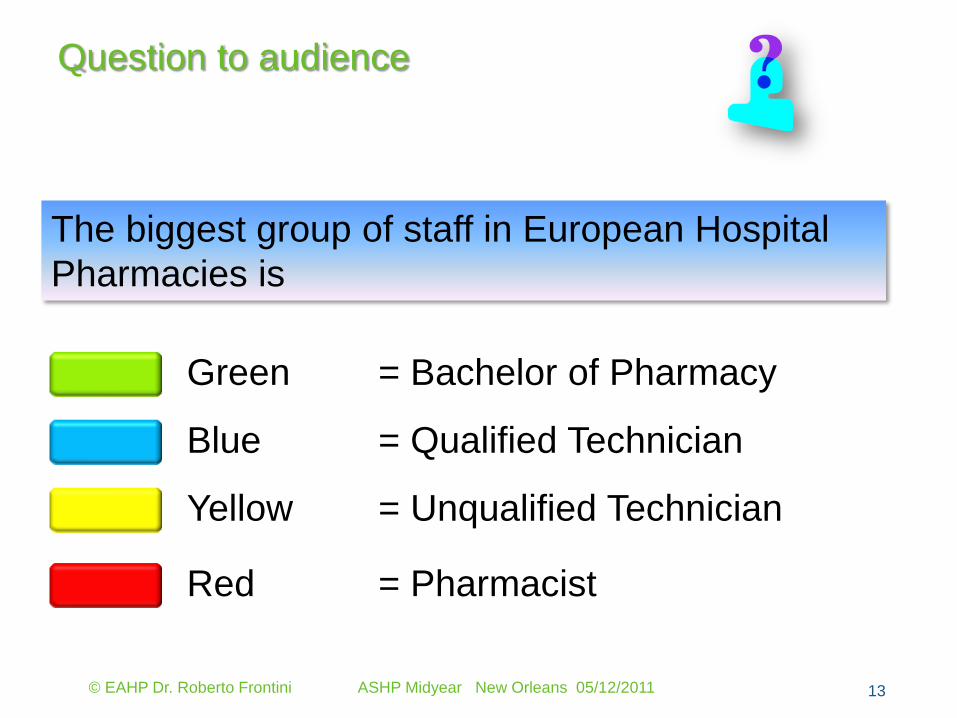
Question to audience
13 © EAHP Dr. Roberto Frontini ASHP Midyear New Orleans 05/12/2011
The biggest group of staff in European Hospital
Pharmacies is
Green = Bachelor of Pharmacy
Blue = Qualified Technician
Yellow = Unqualified Technician
Red = Pharmacist

© EAHP Dr. Roberto Frontini ASHP Midyear New Orleans 05/12/2011
Staffing: Qualification of Staff in Pharmacies (FTE)
14
Qualified pharmacy
assistants / technicians
32%
Pharmacists 27%
Non qualified pharmacy assistants
14%
Administrative Staff 8%
Others 5%
Trainee pharmacists (interns)
4%
Nurses 3%
Cleaning personnel
3%
Pharmacy students 3%
Prescriptionists (Bachelor of Pharmacy)
1%

0.33
3.47
0,00 0,50 1,00 1,50 2,00 2,50 3,00 3,50 4,00
GermanyCroatia
HungaryLithuania
AustriaSlovakia
PolandFYROMSerbiaFranceGreece
NetherlandsLatvia
BulgariaSlovenia
Czech RepublicFinland
DenmarkBelgiumEstonia
ItalySweden
LuxemburgSpain
BiHNorwayIreland
PortugalSwitzerland
Great Britain
© EAHP Dr. Roberto Frontini ASHP Midyear New Orleans 05/12/2011
Staffing: Pharmacists/100 beds (complete + partial hospitalisation)
15
2010 2005 2000
Average 1.0 0.9 0.7
Median 0.7

1.4
10.6
0 2 4 6 8 10 12
CroatiaGermanyLithuania
AustriaHungary
LatviaEstonia
BulgariaFYROM
SlovakiaSerbia
GreeceBiH
SwedenSlovenia
PolandCzech Republic
FinlandIreland
LuxemburgItaly
BelgiumNorway
DenmarkFrance
NetherlandsPortugal
SpainSwitzerland
Great Britain
© EAHP Dr. Roberto Frontini ASHP Midyear New Orleans 05/12/2011
Pharmacy staff / 100 beds (complete + partial hospitalisation)
16
2010 2005 2000
Average 3.1 3.6 2.9
Median 2.6

Staffing: Shortages
17
0%
10%
20%
30%
40%
50%
60%
70%
80%
90%
100%G
reece
Serb
ia
BiH
Hu
ng
ary
Gre
at
Bri
tain
Italy
Slo
ven
ia
FY
RO
M
Slo
vak
ia
Irela
nd
Po
rtu
gal
Czec
h R
ep
ub
lic
Po
lan
d
Sw
itzerl
an
d
Bu
lga
ria
Be
lgiu
m
Cro
ati
a
Ne
the
rlan
ds
Sp
ain
Lu
xe
mb
urg
Fin
lan
d
Au
str
ia
De
nm
ark
Latv
ia
Fra
nce
No
rwa
y
Germ
an
y
Sw
ed
en
Esto
nia
Lit
hu
an
ia
Have you experienced any shortages of pharmacists (n=939) or Technicians (n=936) in your hospital pharmacy in the past 2 years?
Pharmacist Technicians
© EAHP Dr. Roberto Frontini ASHP Midyear New Orleans 05/12/2011

Staffing: Specialisation in Hospital Pharmacy
18
0 10 20 30 40 50 60 70 80 90 100
EstoniaFYROM
LithuaniaSlovakiaDenmarkSweden
LatviaCroatiaFinlandNorwayPoland
Czech RepublicGreat Britain
SloveniaBulgaria
GreeceAustria
SwitzerlandBiH
LuxemburgSerbia
PortugalHungary
GermanyNetherlands
SpainItaly
FranceBelgium
Ireland
% 2010
Average 49.5
Median 33.3
© EAHP Dr. Roberto Frontini ASHP Midyear New Orleans 05/12/2011

Staffing: % of pharmacies with internal CPD
19
* Total >100% as partially more than 1 target group
© EAHP Dr. Roberto Frontini ASHP Midyear New Orleans 05/12/2011
0,0
10,0
20,0
30,0
40,0
50,0
60,0 50.1
40.2
20.8
Pharmacists
Technicians
Others
Target Group
*

Staffing: Financial support of CPD
20
0,0
10,0
20,0
30,0
40,0
50,0
60,0
70,0
80,0
75.6
16.4
38.7 Time off
Full reimbursement
Partial reimbursement
*
* Total >100% as partially more than 1 system
© EAHP Dr. Roberto Frontini ASHP Midyear New Orleans 05/12/2011

General frame / Staffing
21
The average number of bed served by one pharmacy did not change since 2005 but there is a decrease of complete and an increase of partial hospitalisation
Pharmacists (27%) and qualified technicians (32%) cover 60% of the total staff
The number of pharmacists/100 beds varies from 0.33 (Germany) to 3.47 (UK)
Only few countries did not experience shortages for pharmacists and technicians
49% of the pharmacists are specialised in Hospital Pharmacy
© EAHP Dr. Roberto Frontini ASHP Midyear New Orleans 05/12/2011

Procurement
22 © EAHP Dr. Roberto Frontini ASHP Midyear New Orleans 05/12/2011

Purchasing groups
23
No group purchasing
55%
Local group 6%
Regional group 17%
National multi hospital alliance
15%
Multiple answers
7%
© EAHP Dr. Roberto Frontini ASHP Midyear New Orleans 05/12/2011
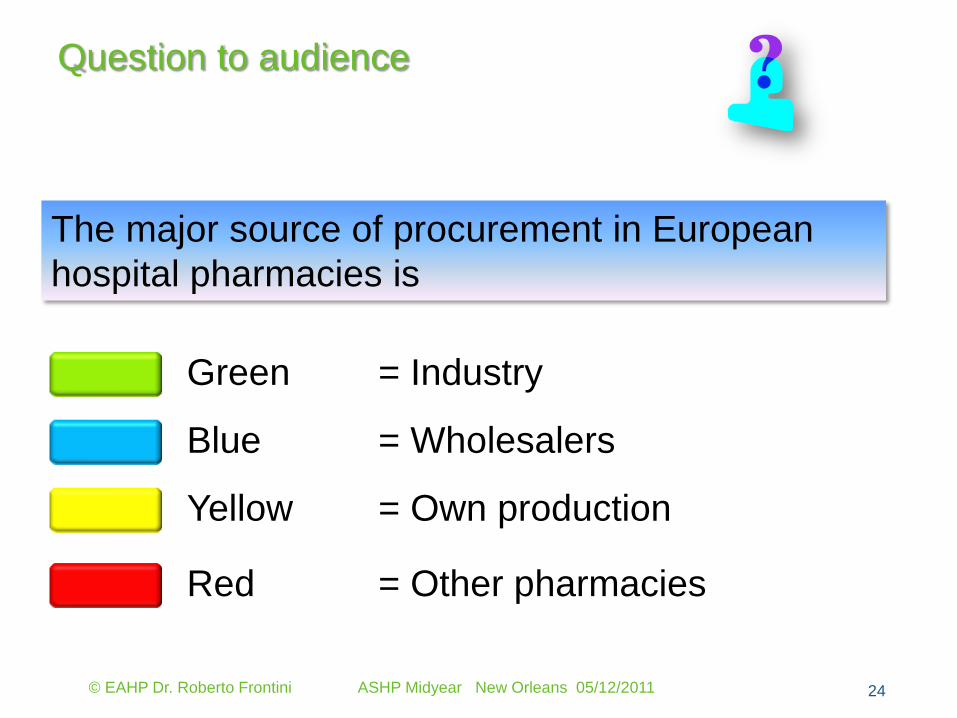
Question to audience
24 © EAHP Dr. Roberto Frontini ASHP Midyear New Orleans 05/12/2011
The major source of procurement in European
hospital pharmacies is
Green = Industry
Blue = Wholesalers
Yellow = Own production
Red = Other pharmacies

Procurement’s source
25
Wholesaler 51%
Industry 46%
Other hospital
1%
Own production
2%
© EAHP Dr. Roberto Frontini ASHP Midyear New Orleans 05/12/2011

Purchasing: Responsibility for medical devices
26
0
10
20
30
40
50
60
70
80
90
100
55.8
47.2
56.2
48.7
Selection
Evaluation
Purchasing
Vigilance
Selection 2010 2005 2000
% 55.8 77.8 84.6
© EAHP Dr. Roberto Frontini ASHP Midyear New Orleans 05/12/2011

Formularies
27
246
1,982
0 500 1000 1500 2000 2500
BiHEstoniaNorway
DenmarkHungary
ItalyLatvia
LithuaniaBulgariaSlovakia
PolandFinlandSerbia
Czech RepublicLuxemburg
SpainBelgiumPortugal
CroatiaGermany
FranceSwitzerland
GreeceSweden
NetherlandsIreland
SloveniaAustria
Great Britain
Number of Products in formulary
2010 2005 2000
Average 1,006 1,031 700
Median 960
2010 2005 2000
% Hospitals with 77.1 82.4 85.3
© EAHP Dr. Roberto Frontini ASHP Midyear New Orleans 05/12/2011

Formularies: Information content
28
0
10
20
30
40
50
60
70
80
90
100
43.6
52.1
56.8
14.4
28.9 29.9
Price
Dosage
Hospital drug policy
Local antibiotics sensitivity
Antibiotics surgical prophylaxis
Antibiotics guideline
*
* Total >100% as partially more than 1 information
© EAHP Dr. Roberto Frontini ASHP Midyear New Orleans 05/12/2011

Distribution
29
0
10
20
30
40
50
60
70
80
90
10094.2
6.3
7.3 2.4
10.9
Manual picking
Stock robotic
Unit picking automat
Unit dose (patient supply)
Automated cabinets
2010 2005
Total robotic % 10.1 3.3 *
* Total >100% as partially more than 1 system
© EAHP Dr. Roberto Frontini ASHP Midyear New Orleans 05/12/2011

Procurement
30
45% of pharmacies are purchasing in groups
Industry (46%) and wholesalers (51%) are the most important suppliers
55.8% of the pharmacies are responsible also for medical devices
Formularies have an average of 1,006 products with a broad range from 246 to 1982 and an increase since 2000 by 43.7%
94.2% of the pharmacies distribute by manual picking and the total of automation is still only 10.1%
© EAHP Dr. Roberto Frontini ASHP Midyear New Orleans 05/12/2011

Production & Quality assurance
31 © EAHP Dr. Roberto Frontini ASHP Midyear New Orleans 05/12/2011

Batch production
32
0
10
20
30
40
50
60
70
80
90
100
29.9
48.4
16.3
Sterile pharmaceuticals
Non sterile pharmaceuticals
Laboratory reagents
% 2010 2005 2000
Sterile 29.9 54.9 66.8
Non sterile 48.4 92.3 92.1
Reagents 16.3 30.1 33.6
© EAHP Dr. Roberto Frontini ASHP Midyear New Orleans 05/12/2011

Question to audience
33 © EAHP Dr. Roberto Frontini ASHP Midyear New Orleans 05/12/2011
Sterile production of individual preparations is
performed by
Green = 10% of Pharmacies
Blue = 80% of Pharmacies
Yellow = 30% of Pharmacies
Red = 50% of Pharmacies
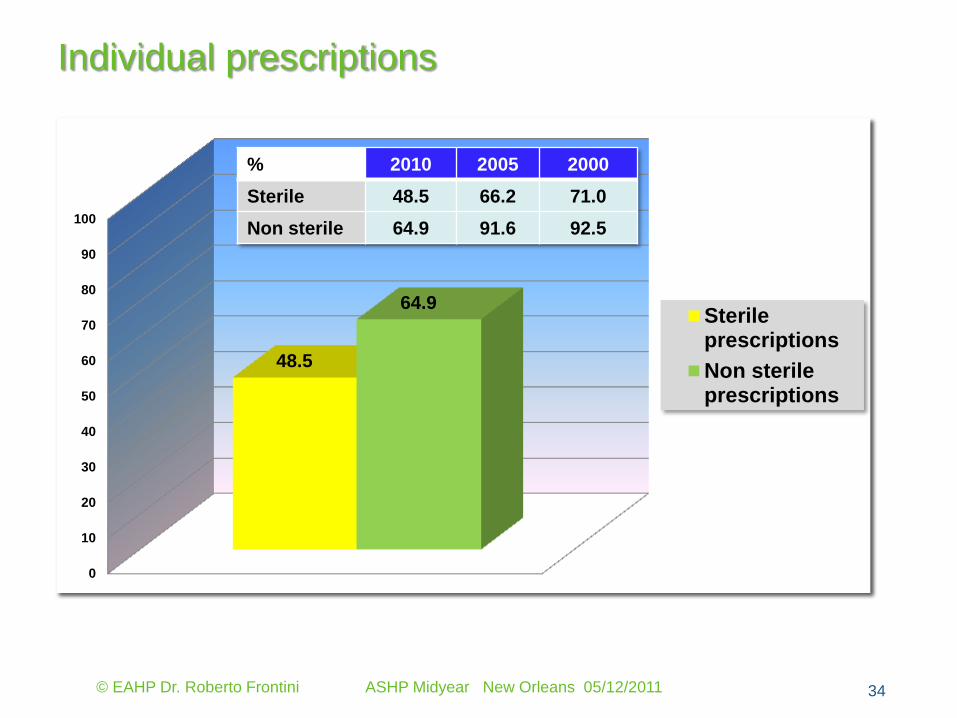
Individual prescriptions
34
0
10
20
30
40
50
60
70
80
90
100
48.5
64.9 Sterileprescriptions
Non sterileprescriptions
% 2010 2005 2000
Sterile 48.5 66.2 71.0
Non sterile 64.9 91.6 92.5
© EAHP Dr. Roberto Frontini ASHP Midyear New Orleans 05/12/2011

GMP
35
0 10 20 30 40 50 60 70 80 90 100
SlovakiaLithuania
EstoniaLatvia
BulgariaGreeceAustriaSerbia
FYROMBelgium
GermanySlovenia
LuxemburgPoland
BiHItaly
HungaryPortugal
CroatiaIreland
SpainCzech Republic
FranceSwitzerland
NorwayNetherlands
DenmarkFinland
Great BritainSweden
% 2010
Average 58.5
© EAHP Dr. Roberto Frontini ASHP Midyear New Orleans 05/12/2011

External quality certification
36
0
10
20
30
40
50
60
70
80
90
100
27.7
2.4
16.6
ISO 9001
ISO 14001
Others
% 2010
External certification 46.8
© EAHP Dr. Roberto Frontini ASHP Midyear New Orleans 05/12/2011

Production & Quality assurance
37
The batch as well as the individual production of sterile and non sterile medicines decreased significantly since 2000
In average 58.5% of pharmacies follow GMP guidelines with a broad range between countries from 0% to 100%
There is a need for more resources in the field of quality assurance especially in the eastern part of Europe
46.6% of the pharmacies are certified by external bodies
© EAHP Dr. Roberto Frontini ASHP Midyear New Orleans 05/12/2011

Clinical services
38 © EAHP Dr. Roberto Frontini ASHP Midyear New Orleans 05/12/2011

Question to audience
39 © EAHP Dr. Roberto Frontini ASHP Midyear New Orleans 05/12/2011
Pharmacists are working at the ward in
Green = 10% of Hospitals
Blue = 80% of Hospitals
Yellow = 25% of Hospitals
Red = 95% of Hospitals

Presence of pharmacists at ward
40
77%
16%
4%
3%
23%
* pharmacists at least 50% of time at ward
no yes occasionally yes daily yes decentralised*
© EAHP Dr. Roberto Frontini ASHP Midyear New Orleans 05/12/2011

Clinical services by technicians
41
25% 75%
yes no
0
10
20
30
40
50
60
70
80
90
100
84.32
41.2
20.2 22.6 25.1 25.1
ward stock
drug information
patient counselling
member ofcommittees
member of audit
other
*
* Total >100% as partially more than 1 activity
% of yes
© EAHP Dr. Roberto Frontini ASHP Midyear New Orleans 05/12/2011
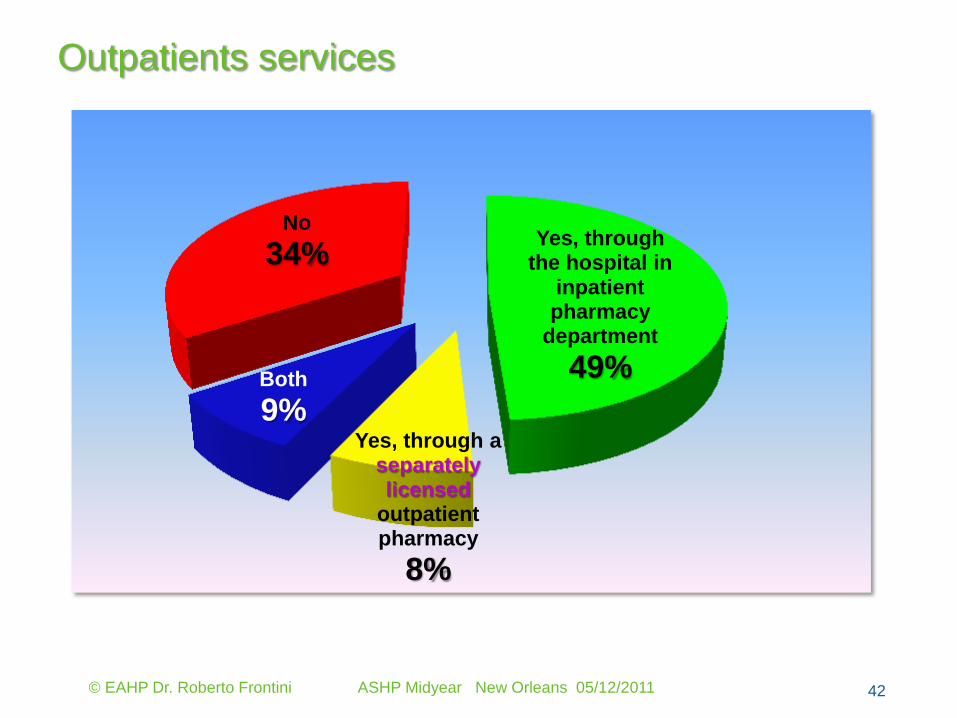
Outpatients services
42
Yes, through the hospital in
inpatient pharmacy
department
49%
Yes, through a separately licensed
outpatient pharmacy
8%
Both
9%
No
34%
© EAHP Dr. Roberto Frontini ASHP Midyear New Orleans 05/12/2011

Clinical consultations
43
0
10
20
30
40
50
60
70
80
90
100
14.9
6.0
41.3
21.1
11.7 15.4
Anticoagulants
Lipids drugs
Antibiotic therapy
Cytotoxic inducednausea
Immunosuppresivetherapy
Others
© EAHP Dr. Roberto Frontini ASHP Midyear New Orleans 05/12/2011

Clinical services nutrition
44
10%
32%
No
58% Yes
42%
Participation in TPN team only
Participation in TPN/Enteral nutrition team
Not involved in decisions about nutrition prescription
© EAHP Dr. Roberto Frontini ASHP Midyear New Orleans 05/12/2011

Clinical services pharmacokinetic
45
No 81.1%
inpatients
0.2%
outpatients
13.5%
Both 5.3%
Yes 18.9%
© EAHP Dr. Roberto Frontini ASHP Midyear New Orleans 05/12/2011

Drug information by pharmacist
46
29% 71%
yes no
Yes 2010 2005 2000
% 29.0 29.5 29.2
© EAHP Dr. Roberto Frontini ASHP Midyear New Orleans 05/12/2011

Documentation of services
47
No
76%
inpatients
14%
outpatients
2% Both
8%
Yes*
24%
* At least 80% of interventions
© EAHP Dr. Roberto Frontini ASHP Midyear New Orleans 05/12/2011

Clinical services
48
Only 23% of pharmacies offer clinical services at the ward and only 7% do it on regular base
Clinical services for outpatients are common (67%)
The major field of consultations are antibiotics, cytotoxic induced nausea and nutrition.
Drug information by pharmacists is implemented only in 29% of the hospitals and constant since 2000
Only 24% of the pharmacies document at least 80% of their interventions
© EAHP Dr. Roberto Frontini ASHP Midyear New Orleans 05/12/2011

Patient safety
49 © EAHP Dr. Roberto Frontini ASHP Midyear New Orleans 05/12/2011

Policy of hospital in safe medication
50
74%
26%
At least 1 None
0
10
20
30
40
50
60
70
80
90
100
51.1
38.1 35.2
55.1
policy on safemedication practice
committee for safemedication practice
dedicated teamdoctor/pharmacist/nurse
clinical incidentreporting system (CIRS)
% of ‘at least 1’
*
** Total >100% as partially more than 1 activity
© EAHP Dr. Roberto Frontini ASHP Midyear New Orleans 05/12/2011

Patient safety system implemented in hospital
51
0% 10% 20% 30% 40% 50% 60% 70% 80% 90% 100%
Greece
Lithuania
FYROM
BiH
Estonia
Croatia
Latvia
Slovakia
Austria
Bulgaria
Slovenia
Germany
Italy
Hungary
Poland
Serbia
France
Portugal
Czech Republic
Ireland
Finland
Spain
Switzerland
Netherlands
Norway
Belgium
Great Britain
Sweden
Denmark
Luxemburg
% 2010
Average 55.0
© EAHP Dr. Roberto Frontini ASHP Midyear New Orleans 05/12/2011

Question to audience
52 © EAHP Dr. Roberto Frontini ASHP Midyear New Orleans 05/12/2011
The most common activity for save medication in
European hospitals is
Green = Therapeutic drug monitoring
Blue = Drug information
Yellow = Unite dose dispensing
Red = Centralized cytotoxics reconstitution
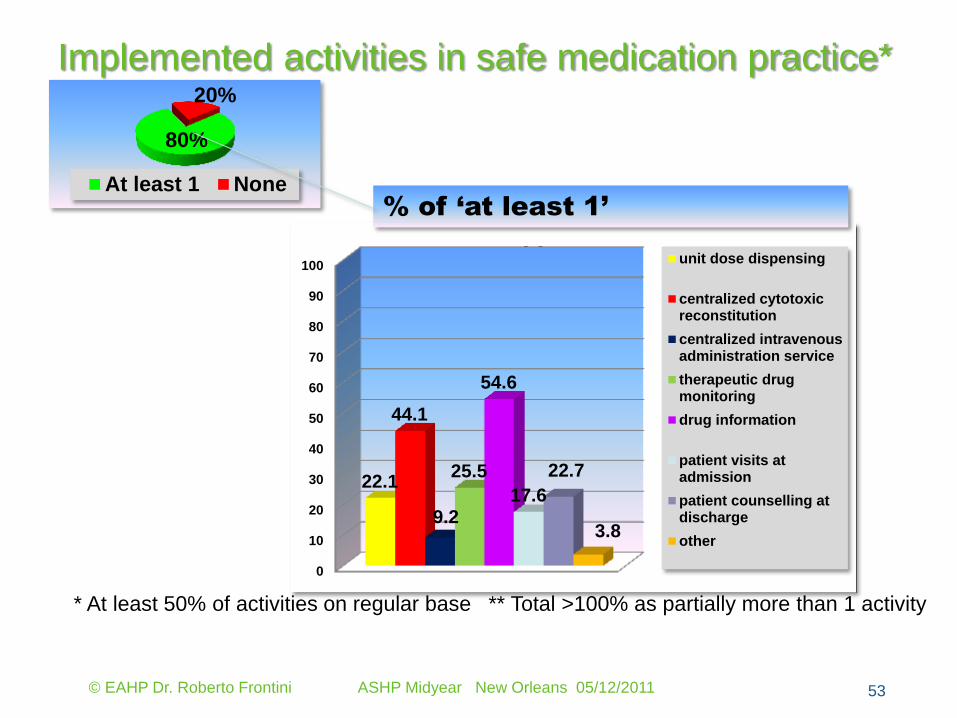
Implemented activities in safe medication practice*
53
* At least 50% of activities on regular base ** Total >100% as partially more than 1 activity
% of ‘at least 1’
**
80%
20%
At least 1 None
0
10
20
30
40
50
60
70
80
90
100
22.1
44.1
9.2
25.5
54.6
17.6
22.7
3.8
unit dose dispensing
centralized cytotoxicreconstitution
centralized intravenousadministration service
therapeutic drugmonitoring
drug information
patient visits atadmission
patient counselling atdischarge
other
© EAHP Dr. Roberto Frontini ASHP Midyear New Orleans 05/12/2011

Patient care of adverse reactions
54
No 46%
Inpatients
31%
Outpatients
4% Both 19%
Yes
54%
© EAHP Dr. Roberto Frontini ASHP Midyear New Orleans 05/12/2011

Activities to avoid medication errors
55
No 47%
Inpatients
31%
Outpatients
3% Both 19%
Yes
53%
© EAHP Dr. Roberto Frontini ASHP Midyear New Orleans 05/12/2011

Documentation of interventions in medical record
56
* At least 80% of the interventions
No 84%
Inpatients
11%
Outpatients
1% Both 4%
Yes
16%
© EAHP Dr. Roberto Frontini ASHP Midyear New Orleans 05/12/2011

Education activities in safe medication
57
% of ‘at least 1’
76%
24%
At least 1 None
0
10
20
30
40
50
60
70
80
90
100
46.6 49.0
53.3
24.2
4.4
national congress
CPD programmes
incidentalseminars
education includedin facultyprogramme
other
*
** Total >100% as partially
more than 1 activity
© EAHP Dr. Roberto Frontini ASHP Midyear New Orleans 05/12/2011

SOP for withdrawing own products
58
64%
36%
yes no
Yes 2010 2005 2000
% 64.1 55.5 61.0
© EAHP Dr. Roberto Frontini ASHP Midyear New Orleans 05/12/2011

Patient safety
59
Patient safety is in focus of hospital pharmacies and 80% of them have implemented activities in safe medication practice
There is a broad range between countries from 0% to 100% with some need for improvement especially in the eastern part of Europe
There is a lack of documentation with only 16% of interventions registered in medical records
76% of pharmacies have at least 1 education activity in safe medication
64% of pharmacies with production have a SOP for withdrawing own products
© EAHP Dr. Roberto Frontini ASHP Midyear New Orleans 05/12/2011

Education & Research
60 © EAHP Dr. Roberto Frontini ASHP Midyear New Orleans 05/12/2011

Affiliation with teaching programmes
61
68%
32%
At least 1 None
0
10
20
30
40
50
60
70
80
90
100
58.1
73.7
60.4
43.9
University PharmacySchool
Nursing school
University MedicalSchool
College offeringpharmacytechnician training
% of ‘at least 1’
*
** Total >100% as partially
more than 1 activity
© EAHP Dr. Roberto Frontini ASHP Midyear New Orleans 05/12/2011
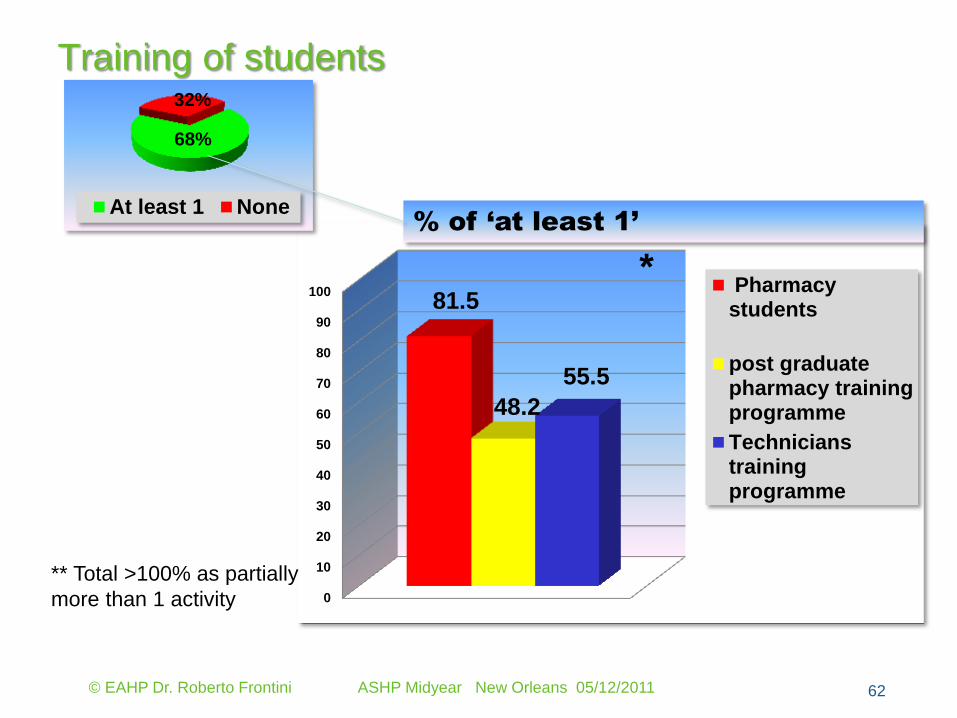
Training of students
62
0
10
20
30
40
50
60
70
80
90
10081.5
48.2
55.5
Pharmacystudents
post graduatepharmacy trainingprogramme
Technicianstrainingprogramme
68%
32%
At least 1 None% of ‘at least 1’
*
** Total >100% as partially
more than 1 activity
© EAHP Dr. Roberto Frontini ASHP Midyear New Orleans 05/12/2011
Question to audience
63 © EAHP Dr. Roberto Frontini ASHP Midyear New Orleans 05/12/2011
How many hospital pharmacies are involved in
research
Green = 10% of Pharmacies
Blue = 90% of Pharmacies
Yellow = 30% of Pharmacies
Red = 60% of Pharmacies

Participation in research
64
39%
61%
None At least 1 field
0,0
10,0
20,0
30,0
40,0
50,0
60,0
70,0
80,0
90,0
100,0
A B C
41.2
18.2 15.4
17.5
28.5
18.5
2.4
0.7
1.4
Outpatients
Inpatients
Both
∑ 47.3%
∑ 35.3%
% of ‘at least 1’
*
** Total >100% as partially
more than 1 activity
A) Research (including
clinical drug trials)
B) Drug use evaluation
programmes
C) Pharmaco-
epidemiological
studies
∑ 61.1%
© EAHP Dr. Roberto Frontini ASHP Midyear New Orleans 05/12/2011

Education & Research
65
Hospital pharmacies are highly involved (68%) in teaching programmes for health professionals including physicians, pharmacists, technicians and nurses
61% of hospital pharmacies are involved in clinical research
© EAHP Dr. Roberto Frontini ASHP Midyear New Orleans 05/12/2011

Take home messages
66
The 4th pan-European survey on Hospital Pharmacy is based on 1,238 (26.1%) answers out of all European pharmacies (# = 4,747)
Despite some unavoidable bias, the survey is a valuable source of information about the status quo of hospital pharmacy in Europe
The data from the survey highlight priorities for actions to achieve the state of the art as postulated in the Basel statements of FIP
© EAHP Dr. Roberto Frontini ASHP Midyear New Orleans 05/12/2011

Thanks for great input and
dedication!
67
Tajda Miharija Gala University Medical Centre Ljubljana
Prof. Juraj Sykora Pharmacy Department SZU
National Cancer Institute Bratislava
EAHP board members responsible for the survey
© EAHP Dr. Roberto Frontini ASHP Midyear New Orleans 05/12/2011

Thanks to all national
coordinators!
68
AUSTRIA Silvia HETZ
BELGIUM Raphaël COLLARD
Sofie VERBEKE
BOLGARIA Nina PURVANOVA
Ilko GETOV
BIH Enisa SALIHEFENDIĆ
Tijana MARINKOVIĆ
CROATIA Marijeta DUKARIĆ KURTIĆ
Ana CRNKOVIĆ
CZECH REP. Helena ROTTEROVA
Petr Horak
DENMARK Helle McNULTY
Gitte NIELSEN
ESTONIA Tiia VALS
FINLAND Hanna TOLONEN
FYROM Maja KOVAČEVA
FRANCE André RIEUTORD
GERMANY Steffen AMANN
GREECE Despina MAKRIDAKI
HUNGARY Gyöngyver SOOS
IRELAND Joan PEPPARD
ITALY Ilaria UOMO
LATVIA Valdis PIRSKO
LITHUANIA Birute VARANAVICIENE
LUXEMBOURG Patrick ENGELHARDT
NETHERLANDS Rob MOSS
Hans OVERDIEK
NORWAY Frank JORGENSEN
PORTUGAL Aida BATISTA
POLAND Dariusz SMOLINSKI
SERBIA Dragana RAJINAC
SLOVAKIA Juraj SYKORA
SLOVENIA Tajda MIHARIJA GALA
SPAIN María José TAMES
Eduardo ECHARRI
SWITZERLAND Susanna KUSSMANN
SWEDEN Per Nydert
UK Richard CATELL
© EAHP Dr. Roberto Frontini ASHP Midyear New Orleans 05/12/2011