hospital flow case study: cincinnati children’s...
TRANSCRIPT
11/27/2016
1
Frederick C. Ryckman, MDProfessor of Surgery / TransplantationSr. Vice President – Medical Operations
Cincinnati Children’s HospitalCincinnati, Ohio
IHI Forum
Dec. 5, 2016
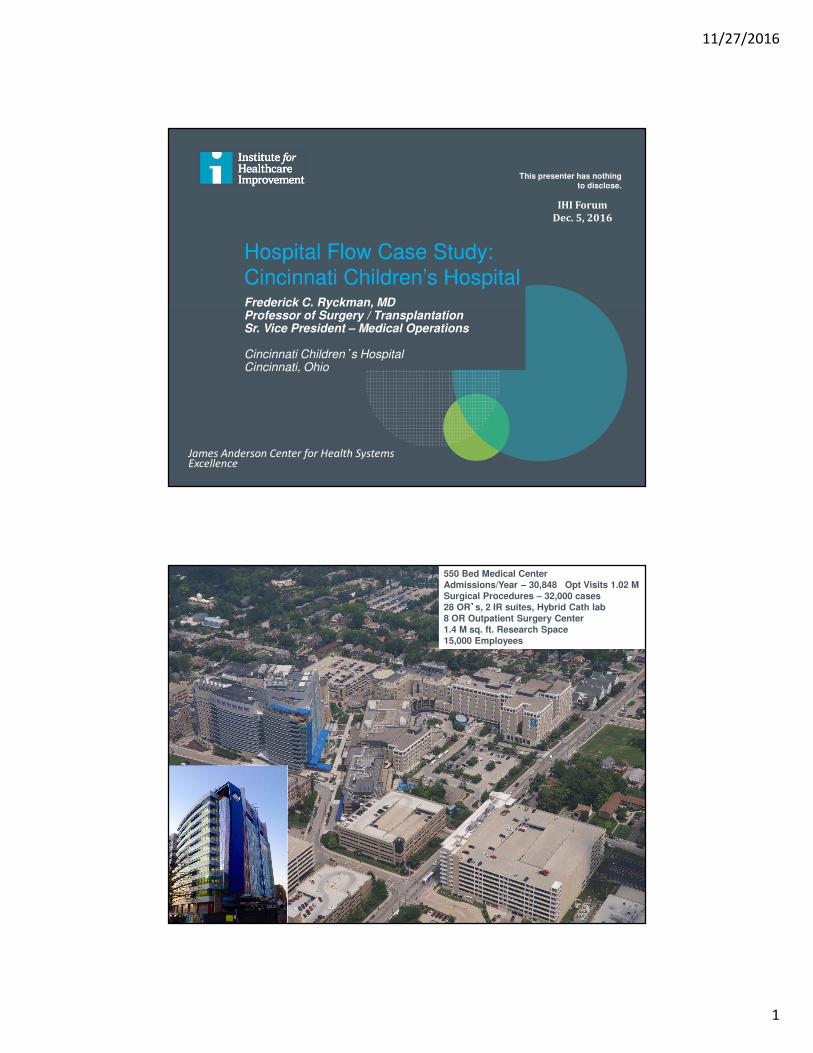
Hospital Flow Case Study: Cincinnati Children’s Hospital
This presenter has nothing to disclose.
James Anderson Center for Health Systems Excellence
James M. Anderson CenterFor
Health Systems Excellence
Cincinnati Children’s Hospital550 Bed Medical CenterAdmissions/Year – 30,848 Opt Visits 1.02 MSurgical Procedures – 32,000 cases28 OR’
’’
’s, 2 IR suites, Hybrid Cath lab8 OR Outpatient Surgery Center1.4 M sq. ft. Research Space 15,000 Employees
11/27/2016
2
James M. Anderson CenterFor
Health Systems Excellence
ACCESS FLOWPATIENT SAFETY
CLINICALEXCELLENCE
REDUCE HASSLES
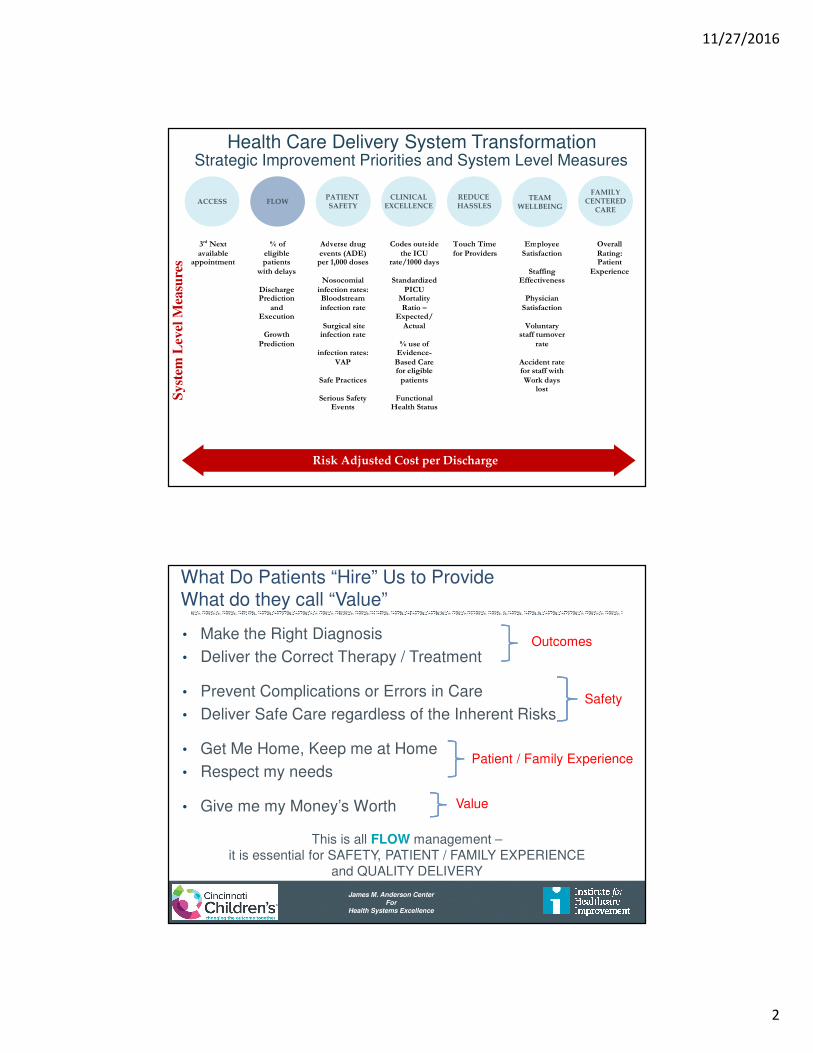
Health Care Delivery System TransformationStrategic Improvement Priorities and System Level Measures
TEAMWELLBEING
Risk Adjusted Cost per Discharge
Syst
em L
evel
Mea
sure
sFAMILY
CENTEREDCARE
3rd Next available
appointment
% of eligible patients
with delays
Discharge Prediction
and Execution
Growth
Prediction
Adverse drug events (ADE)
per 1,000 doses
Nosocomial infection rates: Bloodstream infection rate
Surgical site infection rate
infection rates:
VAP
Safe Practices
Serious Safety Events
Codes outside the ICU
rate/1000 days
Standardized PICU
Mortality Ratio –
Expected/ Actual
% use of
Evidence-Based Care for eligible
patients
Functional Health Status
Functional Health Status
Touch Time for Providers
Employee Satisfaction
Staffing
Effectiveness Staff
Physician Satisfaction
Voluntary
staff turnover rate
Accident rate for staff with Work days
lost
Overall Rating: Patient
Experience
James M. Anderson CenterFor
Health Systems Excellence
What Do Patients “Hire” Us to ProvideWhat do they call “Value”
• Make the Right Diagnosis
• Deliver the Correct Therapy / Treatment
• Prevent Complications or Errors in Care
• Deliver Safe Care regardless of the Inherent Risks
• Get Me Home, Keep me at Home
• Respect my needs
• Give me my Money’s Worth
Outcomes
Safety
Patient / Family Experience
Value
This is all FLOW management –it is essential for SAFETY, PATIENT / FAMILY EXPERIENCE
and QUALITY DELIVERY
11/27/2016
3
James M. Anderson CenterFor
Health Systems Excellence
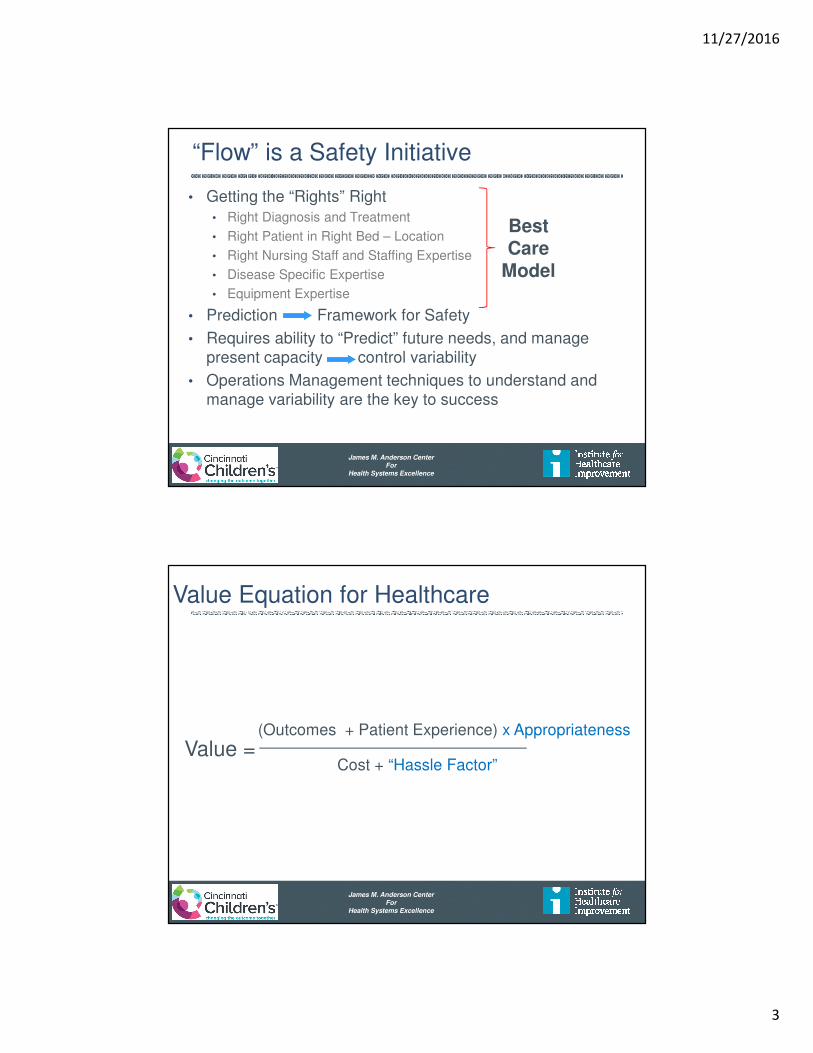
“Flow” is a Safety Initiative
• Getting the “Rights” Right
• Right Diagnosis and Treatment
• Right Patient in Right Bed – Location
• Right Nursing Staff and Staffing Expertise
• Disease Specific Expertise
• Equipment Expertise
• Prediction Framework for Safety
• Requires ability to “Predict” future needs, and manage present capacity control variability
• Operations Management techniques to understand and manage variability are the key to success
BestCare
Model
James M. Anderson CenterFor
Health Systems Excellence
Value Equation for Healthcare
Value = (Outcomes + Patient Experience) x Appropriateness
Cost + “Hassle Factor”

11/27/2016
4
James M. Anderson CenterFor
Health Systems Excellence
Critical Flow Failure Recognition
0
20
40
60
80
100
120
140
0
20
40
60
80
100
120
1407/1
4/2
008 (
Wed-…
8/1
8/0
89/2
2/0
810
/27/0
812
/1/0
81/5
/09
2/9
/09
3/1
6/0
94/2
0/0
95/2
5/0
96/2
9/0
98/3
/09
9/7
/09
10
/12/0
911
/16/0
912
/21/0
91/2
5/1
03/1
/10
4/5
/10
5/1
0/1
06/1
4/1
07/1
9/1
08/2
3/1
09/2
7/1
011
/1/1
012
/6/1
01/1
0/1
12/1
4/1
13/2
1/1
14/2
5/1
15/3
0/1
17/4
/11
8/8
/11
9/1
2/1
110
/17/1
111
/21/1
112
/26/1
11/3
0/1
23/5
/12
4/9
/12
5/1
4/1
26/1
8/1
27/2
3/1
28/2
7/1
210
/1/1
211
/5/1
212
/10/1
21/1
4/1
32/1
8/1
33/2
5/1
34/2
9/1
36/3
/13
7/8
/13
8/1
2/1
39/1
6/1
310
/21/1
311
/25/1
312
/30/1
32/3
/14
3/1
0/1
44/1
4/1
45/1
9/1
46/2
3/1
47/2
8/1
49/1
/14
10
/6/1
411
/10/1
412
/15/1
41/1
9/1
52/2
3/1
53/3
0/1
55/4
/15
6/8
/15
7/1
3/1
58/1
7/1
59/2
1/1
510
/26/1
511
/30/1
51/4
/16
2/8
/16
3/1
4/1
64/1
8/1
65/2
3/1
66/2
7/1
68/1
/16
9/5
/16
To
tal
# o
f B
ed
Days
# o
f N
ew
Pa
tie
nt
Fa
ilu
res
Week Beginning
Weekly Critical Flow Failures
# of New Failures Total Failures (Bed Days)
Type of Control Chart: P Chart
James M. Anderson CenterFor
Health Systems Excellence
Critical Flow Failure Recognition
0
20
40
60
80
100
120
140
160
0
20
40
60
80
100
120
140
160
10/5
/201
5
10/1
2/2
015
10/1
9/2
015
10/2
6/2
015
11/2
/201
5
11/9
/201
5
11/1
6/2
015
11/2
3/2
015
11/3
0/2
015
12/7
/201
5
12/1
4/2
015
12/2
1/2
015
12/2
8/2
015
1/4
/20
16
1/1
1/2
01
6
1/1
8/2
01
6
1/2
5/2
01
6
2/1
/20
16
2/8
/20
16
2/1
5/2
01
6
2/2
2/2
01
6
2/2
9/2
01
6
3/7
/20
16
3/1
4/2
01
6
3/2
1/2
01
6
3/2
8/2
01
6
4/4
/20
16
4/1
1/2
01
6
4/1
8/2
01
6
4/2
5/2
01
6
5/2
/20
16
5/9
/20
16
5/1
6/2
01
6
5/2
3/2
01
6
5/3
0/2
01
6
6/6
/20
16
6/1
3/2
01
6
6/2
0/2
01
6
6/2
7/2
01
6
7/4
/20
16
7/1
1/2
01
6
7/1
8/2
01
6
7/2
5/2
01
6
8/1
/20
16
8/8
/20
16
8/1
5/2
01
6
8/2
2/2
01
6
8/2
9/2
01
6
9/5
/20
16
9/1
2/2
01
6
9/1
9/2
01
6
9/2
6/2
01
6
10/3
/201
6
To
tal
# o
f B
ed
Days
# o
f N
ew
Pa
tie
nt
Fa
ilu
res
Week Beginning
Weekly Critical Flow FailuresOver the last 52 weeks
# of New Failures Total Failures (Bed Days)
Type of Control Chart: P ChartType of Control Chart: P ChartType of Control Chart: P ChartType of Control Chart: P Chart
11/27/2016
5
James M. Anderson CenterFor
Health Systems Excellence
0
50
100
150
200
250
300
JU
L
AU
G
SE
P
OC
T
NO
V
DE
C
JA
N
FE
B
MA
R
AP
R
MA
Y
JU
N
# o
f P
ati
en
ts w
ith
a N
ew
Failu
re
Month of Fiscal Year
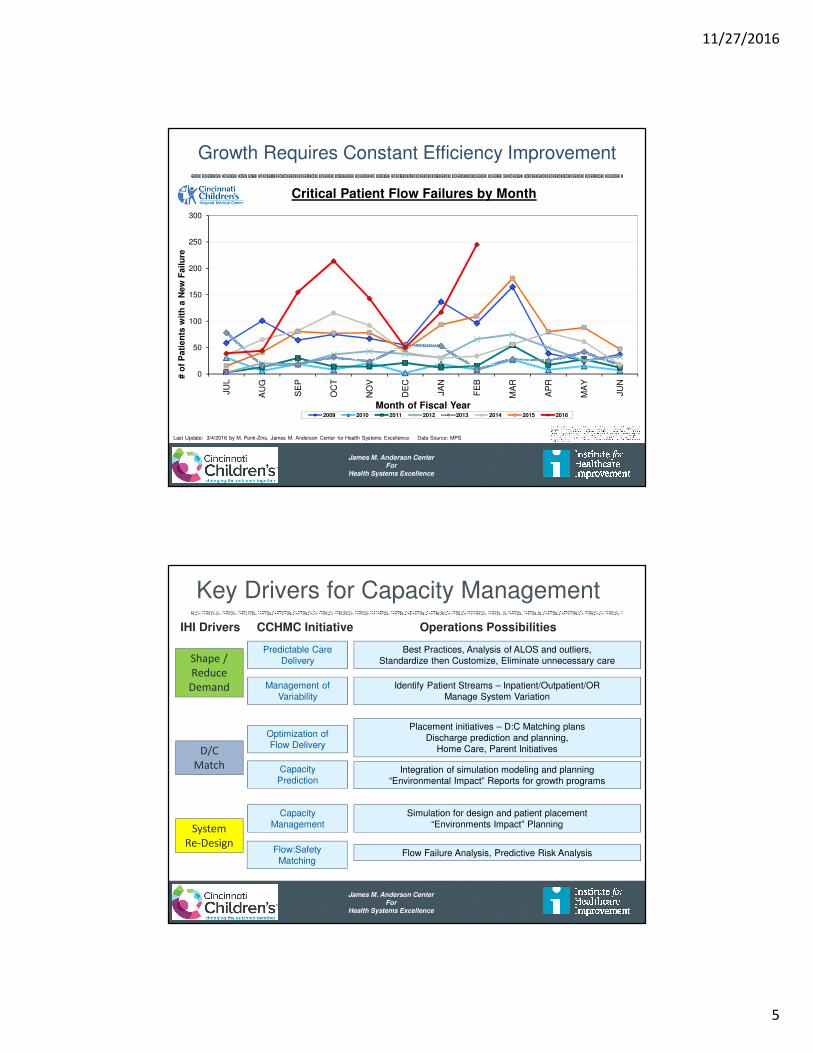
Critical Patient Flow Failures by Month
2009 2010 2011 2012 2013 2014 2015 2016
Last Update: 3/4/2016 by M. Ponti-Zins, James M. Anderson Center for Health Systems Excellence Data Source: MPS
Growth Requires Constant Efficiency Improvement
James M. Anderson CenterFor
Health Systems Excellence
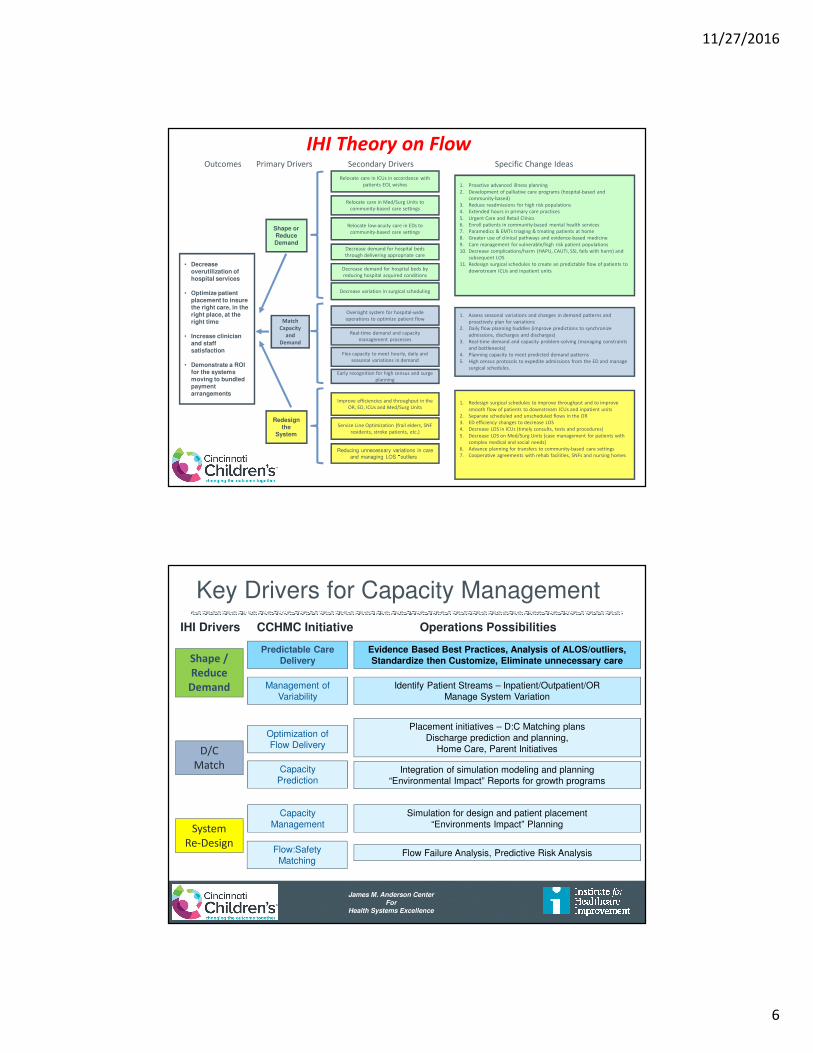
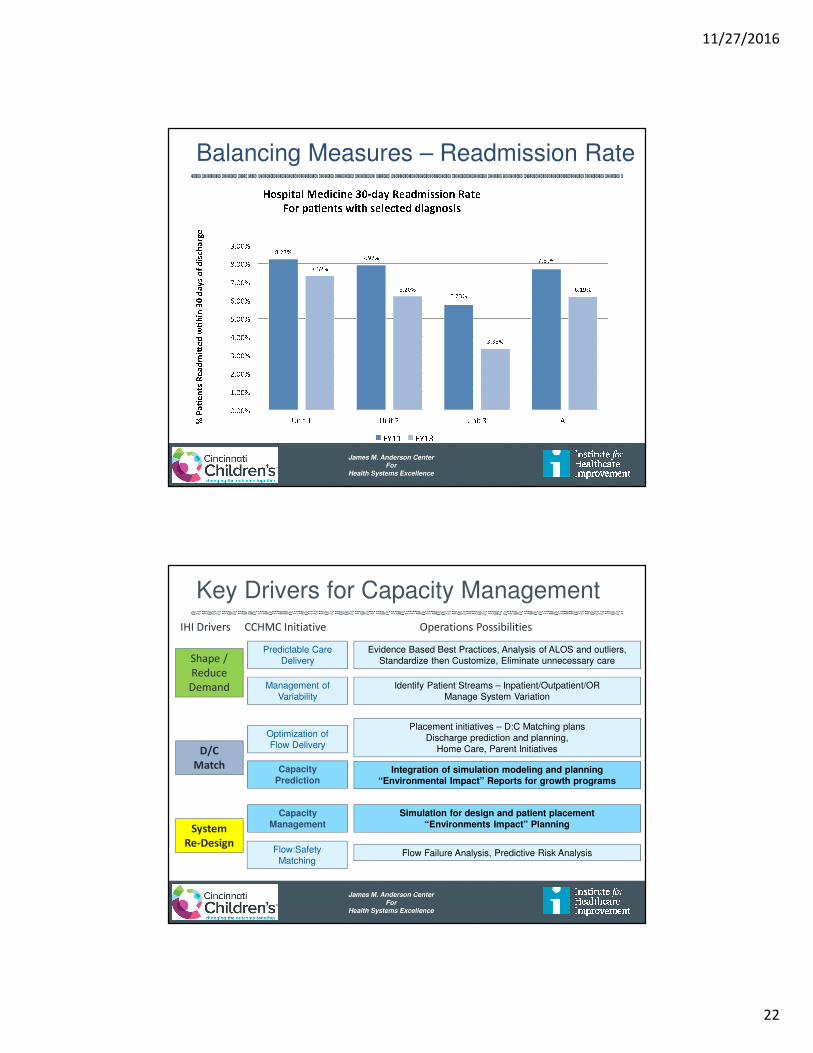
Key Drivers for Capacity Management
Management of Variability
Predictable CareDelivery
CapacityPrediction
CapacityManagement
Optimization ofFlow Delivery
Flow:SafetyMatching
Identify Patient Streams – Inpatient/Outpatient/ORManage System Variation
Best Practices, Analysis of ALOS and outliers,Standardize then Customize, Eliminate unnecessary care
Integration of simulation modeling and planning“Environmental Impact” Reports for growth programs
Simulation for design and patient placement“Environments Impact” Planning
Placement initiatives – D:C Matching plansDischarge prediction and planning,
Home Care, Parent Initiatives
Flow Failure Analysis, Predictive Risk Analysis
IHI Drivers CCHMC Initiative Operations Possibilities
D/C
Match
System
Re-Design
Shape /
Reduce
Demand
11/27/2016
6
James M. Anderson CenterFor
Health Systems Excellence
• Decrease overutilization of hospital services
• Optimize patient placement to insure the right care, in the right place, at the right time
• Increase clinician and staff satisfaction
• Demonstrate a ROI for the systems moving to bundled payment arrangements
1. Redesign surgical schedules to improve throughput and to improve
smooth flow of patients to downstream ICUs and inpatient units
2. Separate scheduled and unscheduled flows in the OR
3. ED efficiency changes to decrease LOS
4. Decrease LOS in ICUs (timely consults, tests and procedures)
5. Decrease LOS on Med/Surg Units (case management for patients with
complex medical and social needs)
6. Advance planning for transfers to community-based care settings
7. Cooperative agreements with rehab facilities, SNFs and nursing homes
1. Proactive advanced illness planning
2. Development of palliative care programs (hospital-based and
community-based)
3. Reduce readmissions for high risk populations
4. Extended hours in primary care practices
5. Urgent Care and Retail Clinics
6. Enroll patients in community-based mental health services
7. Paramedics & EMTs triaging & treating patients at home
8. Greater use of clinical pathways and evidence-based medicine
9. Care management for vulnerable/high risk patient populations
10. Decrease complications/harm (HAPU, CAUTI, SSI, falls with harm) and
subsequent LOS
11. Redesign surgical schedules to create an predictable flow of patients to
downstream ICUs and inpatient units
Redesign the
System
Shape or Reduce Demand
Match
Capacity
and
Demand
Outcomes Primary Drivers Secondary Drivers Specific Change Ideas
1. Assess seasonal variations and changes in demand patterns and
proactively plan for variations
2. Daily flow planning huddles (improve predictions to synchronize
admissions, discharges and discharges)
3. Real-time demand and capacity problem-solving (managing constraints
and bottlenecks)
4. Planning capacity to meet predicted demand patterns
5. High census protocols to expedite admissions from the ED and manage
surgical schedules.
Relocate care in ICUs in accordance with
patients EOL wishes
Relocate care in Med/Surg Units to
community-based care settings
Relocate low-acuity care in EDs to
community-based care settings
Decrease demand for hospital beds
through delivering appropriate care
Oversight system for hospital-wide
operations to optimize patient flow
Flex capacity to meet hourly, daily and
seasonal variations in demand
Real-time demand and capacity
management processes
Reducing unnecessary variations in care
and managing LOS “outliers”
Service Line Optimization (frail elders, SNF
residents, stroke patients, etc.)
Improve efficiencies and throughput in the
OR, ED, ICUs and Med/Surg Units
Decrease demand for hospital beds by
reducing hospital acquired conditions
Decrease variation in surgical scheduling
Early recognition for high census and surge
planning
IHI Theory on Flow
James M. Anderson CenterFor
Health Systems Excellence
Key Drivers for Capacity Management
Management of Variability
Predictable CareDelivery
CapacityPrediction
CapacityManagement
Optimization ofFlow Delivery
Flow:SafetyMatching
Identify Patient Streams – Inpatient/Outpatient/ORManage System Variation
Evidence Based Best Practices, Analysis of ALOS/outliers,Standardize then Customize, Eliminate unnecessary care
Integration of simulation modeling and planning“Environmental Impact” Reports for growth programs
Simulation for design and patient placement“Environments Impact” Planning
Placement initiatives – D:C Matching plansDischarge prediction and planning,
Home Care, Parent Initiatives
Flow Failure Analysis, Predictive Risk Analysis
IHI Drivers CCHMC Initiative Operations Possibilities
D/C
Match
System
Re-Design
Shape /
Reduce
Demand

11/27/2016
7
James M. Anderson CenterFor
Health Systems Excellence
Evidence Based Care
• Evidence Based Care Guidelines serve as an interface between rapidly evolving scientific information and busy clinical practices
• Developed by Inter-disciplinary teams – experts
• Implementation
• Awareness of recommendation to facilitate change
• Easy access to the Evidence
• Feedback on Outcomes
• Feedback on further improvements
• Culture of Improvement / Evidence Based Care
James M. Anderson CenterFor
Health Systems Excellence
Integration – Priority – Practice - Plan
Prioritization – Goal = Exceptional, Safe, Affordable Care Every Child
Owner – Executive Leadership
Practice – “What we Do” – Essential Steps, Decisions and Actions
Owner – Clinical Leadership Teams – Departments / Divisions
Processes – “How we Do It” – Processes to execute to the goal
Owner – Operational Leaders – Sites of Care
Plan – “Implement the Processes - plan through application of process steps
Owner – Sites of Care leaders and clinical staff (MD / RN)
Front Line Implementation – “Just Do It” – Every day for every child

11/27/2016
8
James M. Anderson CenterFor
Health Systems Excellence
Cytomegalovirus Prophylaxis
• 75% Decrease in CMV infection – liver/intestine transplants
• Decreased IV-IGG expense
Danziger-Isakov, Lara et al. CCHMC Integrated Solid Organ Transplant
James M. Anderson CenterFor
Health Systems Excellence
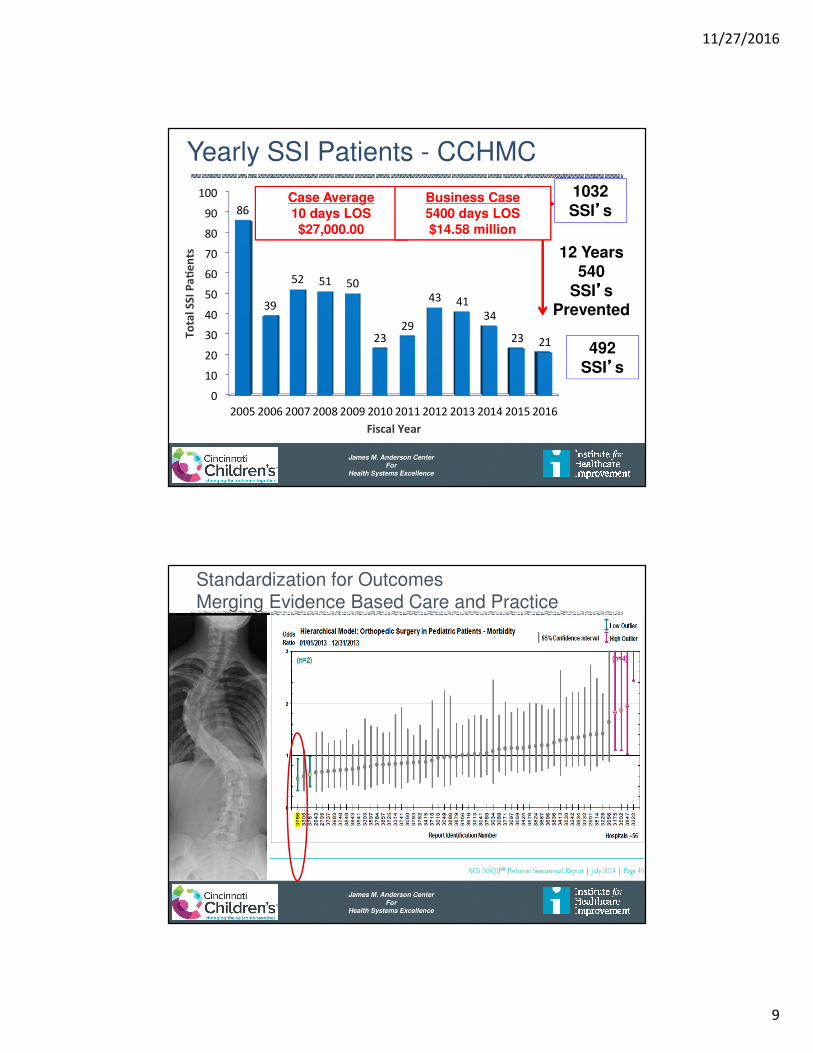
Yearly SSI Patients - CCHMC
0
10
20
30
40
50
60
70
80
90
100
2005 2006 2007 2008 2009 2010 2011 2012 2013 2014 2015 2016
86
39
52 51 50
23
29
43 41
34
23 21
To
tal
SS
I P
ae
nts
Fiscal Year
1032SSI’’’’s
492SSI’’’’s
12 Years540
SSI’’’’sPrevented
11/27/2016
9
James M. Anderson CenterFor
Health Systems Excellence
Yearly SSI Patients - CCHMC
0
10
20
30
40
50
60
70
80
90
100
2005 2006 2007 2008 2009 2010 2011 2012 2013 2014 2015 2016
86
39
52 51 50
23
29
43 41
34
23 21
To
tal
SS
I P
ae
nts
Fiscal Year
1032SSI’’’’s
492SSI’’’’s
12 Years540
SSI’’’’sPrevented
Case Average10 days LOS$27,000.00
Business Case5400 days LOS$14.58 million
James M. Anderson CenterFor
Health Systems Excellence
Focus on Excellence – SSI Spines
Standardization for OutcomesMerging Evidence Based Care and Practice
11/27/2016
10
James M. Anderson CenterFor
Health Systems Excellence
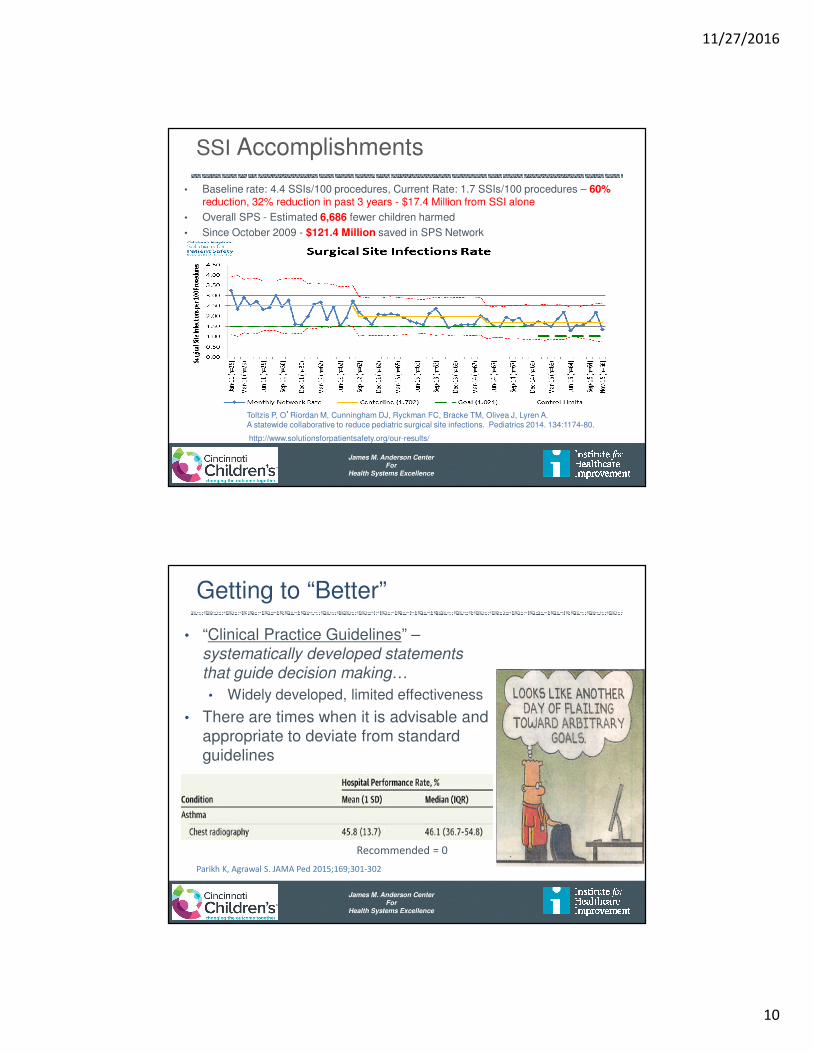
SSI Accomplishments
• Baseline rate: 4.4 SSIs/100 procedures, Current Rate: 1.7 SSIs/100 procedures – 60% reduction, 32% reduction in past 3 years - $17.4 Million from SSI alone
• Overall SPS - Estimated 6,686 fewer children harmed
• Since October 2009 - $121.4 Million saved in SPS Network
Toltzis P, O’Riordan M, Cunningham DJ, Ryckman FC, Bracke TM, Olivea J, Lyren A. A statewide collaborative to reduce pediatric surgical site infections. Pediatrics 2014. 134:1174-80.
http://www.solutionsforpatientsafety.org/our-results/
James M. Anderson CenterFor
Health Systems Excellence
Getting to “Better”
• “Clinical Practice Guidelines” –systematically developed statements
that guide decision making…
• Widely developed, limited effectiveness
• There are times when it is advisable and appropriate to deviate from standard guidelines
Parikh K, Agrawal S. JAMA Ped 2015;169;301-302
Recommended = 0

11/27/2016
11
James M. Anderson CenterFor
Health Systems Excellence
Getting to “Better”
• “Achievable Benchmarks of Care” (ABC’s)
• Actual performance at health care sites performing in the top 10%
Parikh K, Agrawal S. JAMAPed 2015;169;301-302
James M. Anderson CenterFor
Health Systems Excellence
Getting to “Better” – ABC’s
• Hospital Site Performance
• Individual Performance
11/27/2016
12
James M. Anderson CenterFor
Health Systems Excellence
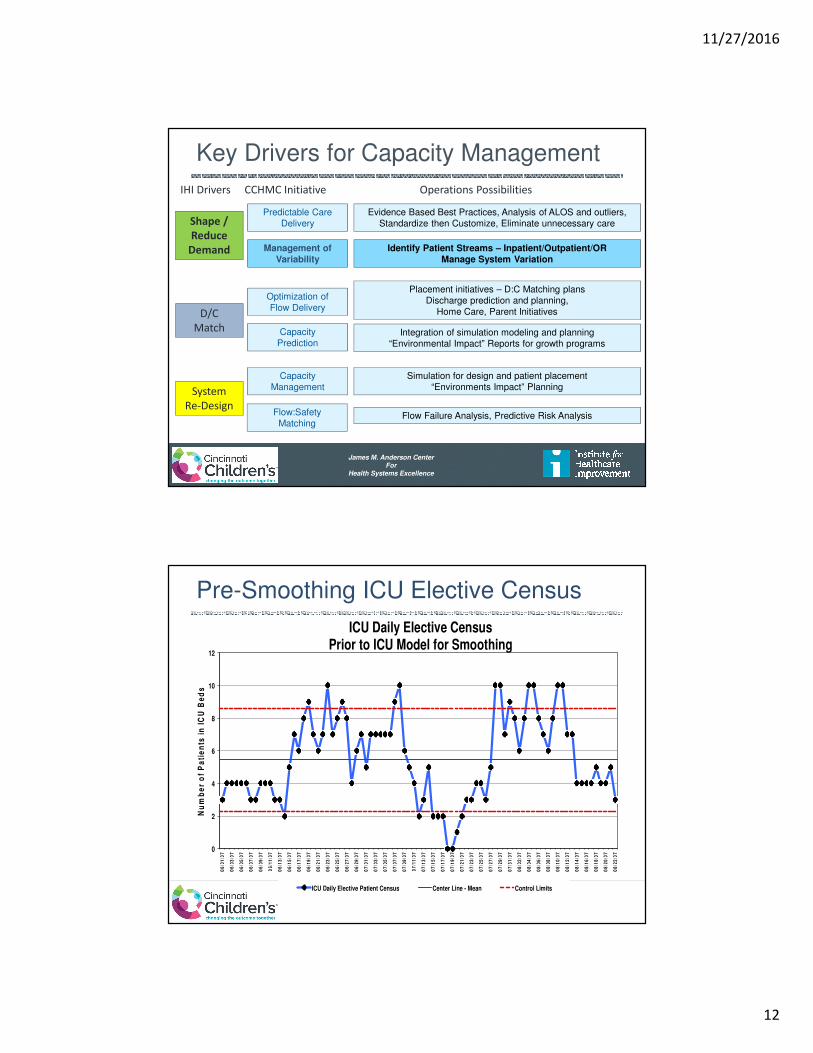
Key Drivers for Capacity Management
Management of Variability
Predictable CareDelivery
CapacityPrediction
CapacityManagement
Optimization ofFlow Delivery
Flow:SafetyMatching
Identify Patient Streams – Inpatient/Outpatient/ORManage System Variation
Evidence Based Best Practices, Analysis of ALOS and outliers,Standardize then Customize, Eliminate unnecessary care
Integration of simulation modeling and planning“Environmental Impact” Reports for growth programs
Simulation for design and patient placement“Environments Impact” Planning
Placement initiatives – D:C Matching plansDischarge prediction and planning,
Home Care, Parent Initiatives
Flow Failure Analysis, Predictive Risk Analysis
IHI Drivers CCHMC Initiative Operations Possibilities
D/C
Match
System
Re-Design
Shape /
Reduce
Demand
James M. Anderson CenterFor
Health Systems Excellence
Pre-Smoothing ICU Elective Census
0
2
4
6
8
10
12
06
/01
/07
06
/03
/07
06
/05
/07
06
/07
/07
06
/09
/07
06
/11
/07
06
/13
/07
06
/15
/07
06
/17
/07
06
/19
/07
06
/21
/07
06
/23
/07
06
/25
/07
06
/27
/07
06
/29
/07
07
/01
/07
07
/03
/07
07
/05
/07
07
/07
/07
07
/09
/07
07
/11
/07
07
/13
/07
07
/15
/07
07
/17
/07
07
/19
/07
07
/21
/07
07
/23
/07
07
/25
/07
07
/27
/07
07
/29
/07
07
/31
/07
08
/02
/07
08
/04
/07
08
/06
/07
08
/08
/07
08
/10
/07
08
/12
/07
08
/14
/07
08
/16
/07
08
/18
/07
08
/20
/07
08
/22
/07
Nu
mb
er
of
Pa
tie
nts
in
IC
U B
ed
s
ICU Daily Elective Census Prior to ICU Model for Smoothing
ICU Daily Elective Patient Census Center Line - Mean Control Limits
11/27/2016
13
James M. Anderson CenterFor
Health Systems Excellence
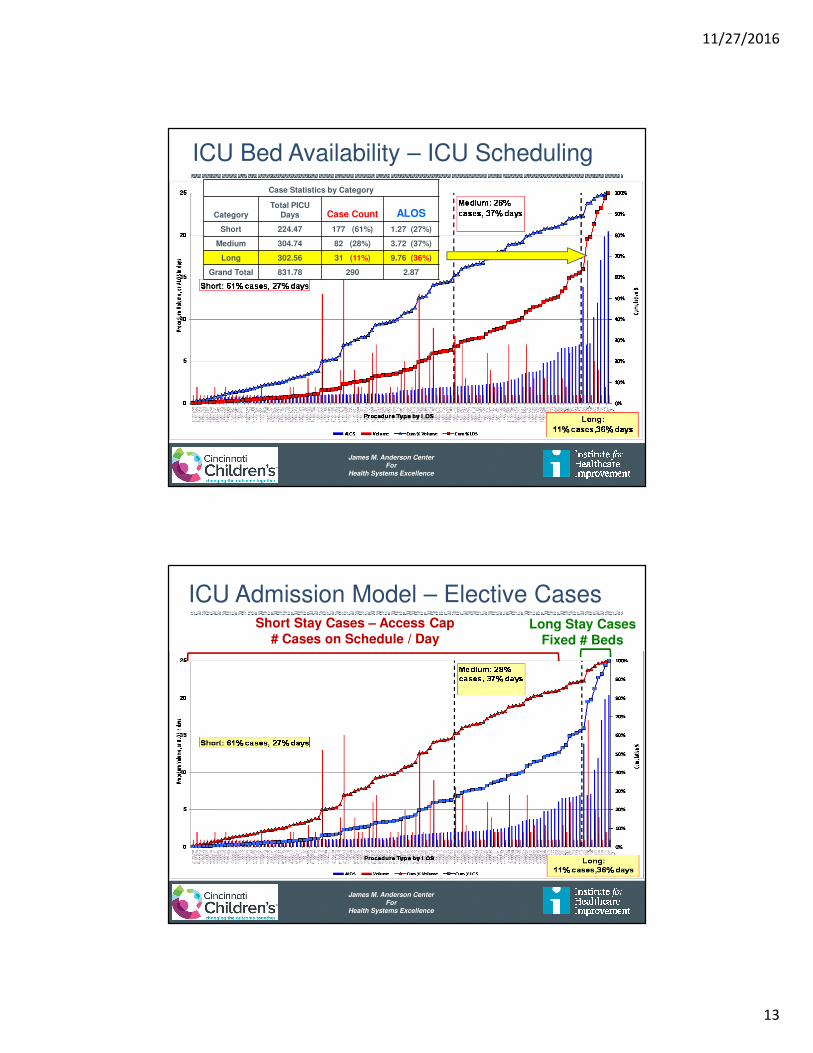
ICU Bed Availability – ICU Scheduling
Case Statistics by Category
CategoryTotal PICU
Days Case Count ALOS
Short 224.47 177 (61%) 1.27 (27%)
Medium 304.74 82 (28%) 3.72 (37%)
Long 302.56 31 (11%) 9.76 (36%)
Grand Total 831.78 290 2.87
James M. Anderson CenterFor
Health Systems Excellence
ICU Admission Model – Elective CasesShort Stay Cases – Access Cap
# Cases on Schedule / DayLong Stay Cases
Fixed # Beds
11/27/2016
14
James M. Anderson CenterFor
Health Systems Excellence
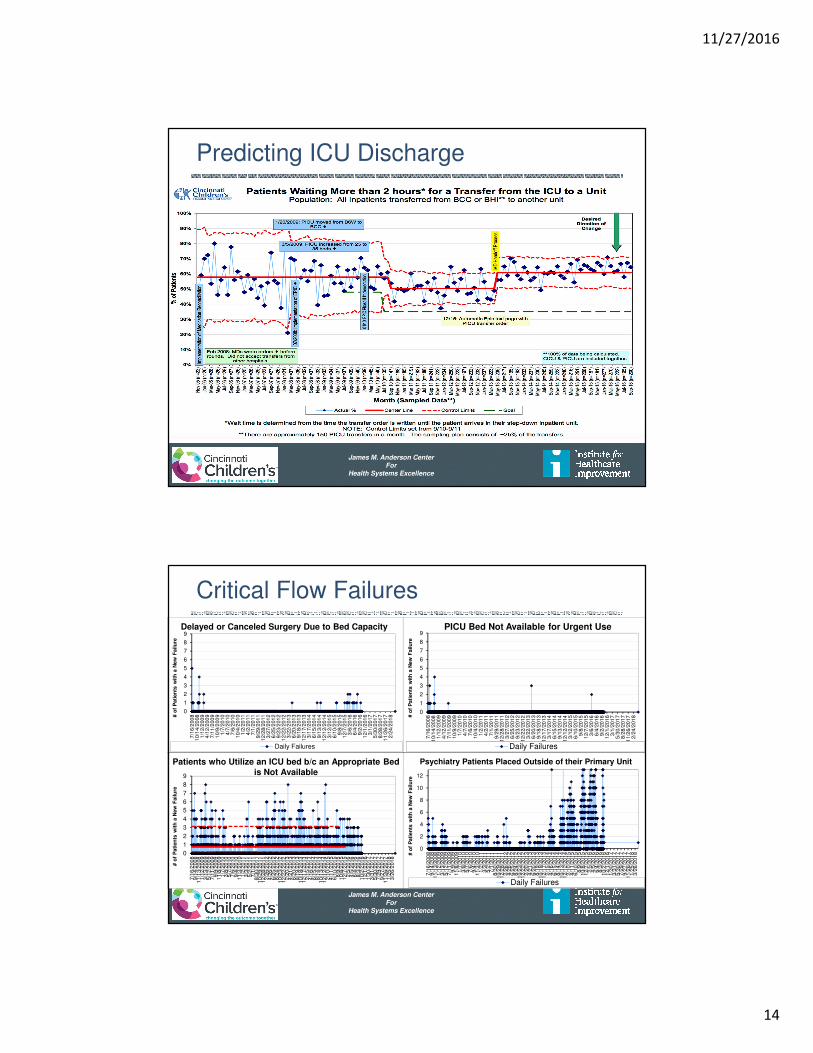
Predicting ICU Discharge
James M. Anderson CenterFor
Health Systems Excellence
Critical Flow Failures
0
1
2
3
4
5
6
7
8
9
7/1
6/2
00
81
0/1
4/2
008
1/1
2/2
00
94
/12
/200
97
/11
/200
91
0/9
/200
91
/7/2
010
4/7
/20
10
7/6
/20
10
10/4
/201
01
/2/2
011
4/2
/20
11
7/1
/20
11
9/2
9/2
01
11
2/2
8/2
011
3/2
7/2
01
26
/25
/201
29
/23
/201
21
2/2
2/2
012
3/2
2/2
01
36
/20
/201
39
/18
/201
31
2/1
7/2
013
3/1
7/2
01
46
/15
/201
49
/13
/201
41
2/1
2/2
014
3/1
2/2
01
56
/10
/201
59
/8/2
015
12/7
/201
53
/6/2
016
6/4
/20
16
9/2
/20
16
12/1
/201
63
/1/2
017
5/3
0/2
01
78
/28
/201
71
1/2
6/2
017
2/2
4/2
01
8# o
f P
ati
en
ts w
ith
a N
ew
Failu
re
Daily Failures
Delayed or Canceled Surgery Due to Bed Capacity
0
1
2
3
4
5
6
7
8
9
7/1
6/2
00
81
0/1
4/2
008
1/1
2/2
00
94
/12
/200
97
/11
/200
91
0/9
/200
91
/7/2
010
4/7
/20
10
7/6
/20
10
10/4
/201
01
/2/2
011
4/2
/20
11
7/1
/20
11
9/2
9/2
01
11
2/2
8/2
011
3/2
7/2
01
26
/25
/201
29
/23
/201
21
2/2
2/2
012
3/2
2/2
01
36
/20
/201
39
/18
/201
31
2/1
7/2
013
3/1
7/2
01
46
/15
/201
49
/13
/201
41
2/1
2/2
014
3/1
2/2
01
56
/10
/201
59
/8/2
015
12/7
/201
53
/6/2
016
6/4
/20
16
9/2
/20
16
12/1
/201
63
/1/2
017
5/3
0/2
01
78
/28
/201
71
1/2
6/2
017
2/2
4/2
01
8# o
f P
ati
en
ts w
ith
a N
ew
Failu
re
PICU Bed Not Available for Urgent Use
Daily Failures
0
1
2
3
4
5
6
7
8
9
7/1
6/2
00
89
/14
/200
81
1/1
3/2
008
1/1
2/2
00
93
/13
/200
95
/12
/200
97
/11
/200
99
/9/2
009
11/8
/200
91
/7/2
010
3/8
/20
10
5/7
/20
10
7/6
/20
10
9/4
/20
10
11/3
/201
01
/2/2
011
3/3
/20
11
5/2
/20
11
7/1
/20
11
8/3
0/2
01
11
0/2
9/2
011
12/2
8/2
011
2/2
6/2
01
24
/26
/201
26
/25
/201
28
/24
/201
21
0/2
3/2
012
12/2
2/2
012
2/2
0/2
01
34
/21
/201
36
/20
/201
38
/19
/201
31
0/1
8/2
013
12/1
7/2
013
2/1
5/2
01
44
/16
/201
46
/15
/201
48
/14
/201
41
0/1
3/2
014
12/1
2/2
014
2/1
0/2
01
54
/11
/201
56
/10
/201
58
/9/2
015
10/8
/201
51
2/7
/201
52
/5/2
016
4/5
/20
16
6/4
/20
16
8/3
/20
16
10/2
/201
61
2/1
/201
61
/30
/201
73
/31
/201
75
/30
/201
77
/29
/201
79
/27
/201
71
1/2
6/2
017
1/2
5/2
01
83
/26
/201
8
# o
f P
ati
en
ts w
ith
a N
ew
Failu
re
Patients who Utilize an ICU bed b/c an Appropriate Bed is Not Available
0
2
4
6
8
10
12
7/1
6/2
00
89
/14
/200
81
1/1
3/2
008
1/1
2/2
00
93
/13
/200
95
/12
/200
97
/11
/200
99
/9/2
009
11/8
/200
91
/7/2
010
3/8
/20
10
5/7
/20
10
7/6
/20
10
9/4
/20
10
11/3
/201
01
/2/2
011
3/3
/20
11
5/2
/20
11
7/1
/20
11
8/3
0/2
01
11
0/2
9/2
011
12/2
8/2
011
2/2
6/2
01
24
/26
/201
26
/25
/201
28
/24
/201
21
0/2
3/2
012
12/2
2/2
012
2/2
0/2
01
34
/21
/201
36
/20
/201
38
/19
/201
31
0/1
8/2
013
12/1
7/2
013
2/1
5/2
01
44
/16
/201
46
/15
/201
48
/14
/201
41
0/1
3/2
014
12/1
2/2
014
2/1
0/2
01
54
/11
/201
56
/10
/201
58
/9/2
015
10/8
/201
51
2/7
/201
52
/5/2
016
4/5
/20
16
6/4
/20
16
8/3
/20
16
10/2
/201
61
2/1
/201
61
/30
/201
73
/31
/201
75
/30
/201
77
/29
/201
79
/27
/201
71
1/2
6/2
017
1/2
5/2
01
83
/26
/201
8# o
f P
ati
en
ts w
ith
a N
ew
Failu
re
Daily Failures
Psychiatry Patients Placed Outside of their Primary Unit

11/27/2016
15
James M. Anderson CenterFor
Health Systems Excellence
Mental Health Impact on Flow
James M. Anderson CenterFor
Health Systems Excellence
Key Drivers for Capacity Management
Management of Variability
Predictable CareDelivery
CapacityPrediction
CapacityManagement
Optimization ofFlow Delivery
Flow:SafetyMatching
Identify Patient Streams – Inpatient/Outpatient/ORManage System Variation
Evidence Based Best Practices, Analysis of ALOS and outliers,Standardize then Customize, Eliminate unnecessary care
Integration of simulation modeling and planning“Environmental Impact” Reports for growth programs
Simulation for design and patient placement“Environments Impact” Planning
Placement initiatives – D:C Matching plansDischarge prediction and planning,
Home Care, Parent Initiatives
Flow Failure Analysis, Predictive Risk Analysis
IHI Drivers CCHMC Initiative Operations Possibilities
D/C
Match
System
Re-Design
Shape /
Reduce
Demand
11/27/2016
16
James M. Anderson CenterFor
Health Systems Excellence
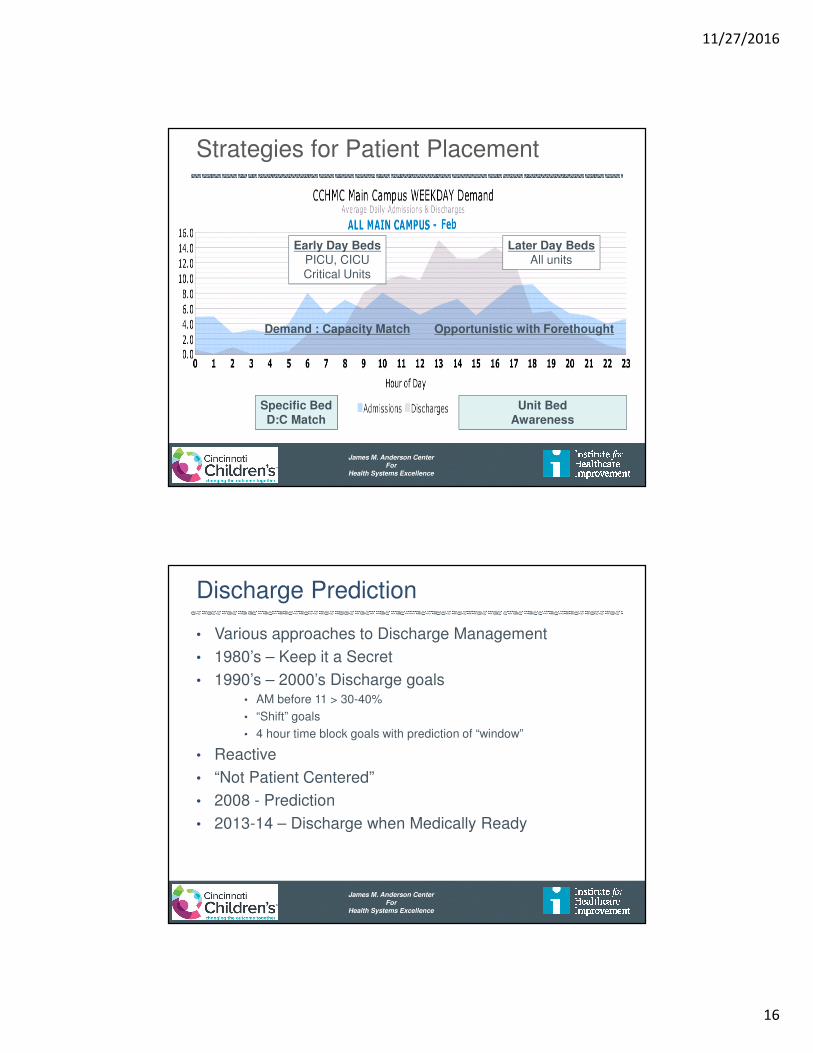
Early Day BedsPICU, CICUCritical Units
Later Day BedsAll units
Specific BedD:C Match
Unit BedAwareness
Strategies for Patient Placement
Demand : Capacity Match Opportunistic with Forethought
James M. Anderson CenterFor
Health Systems Excellence
Discharge Prediction
• Various approaches to Discharge Management
• 1980’s – Keep it a Secret
• 1990’s – 2000’s Discharge goals• AM before 11 > 30-40%
• “Shift” goals
• 4 hour time block goals with prediction of “window”
• Reactive
• “Not Patient Centered”
• 2008 - Prediction
• 2013-14 – Discharge when Medically Ready

11/27/2016
17
James M. Anderson CenterFor
Health Systems Excellence
Discharge Prediction Buckets
James M. Anderson CenterFor
Health Systems Excellence
Discharge Prediction
• Various approaches to Discharge Management
• 1980’s – Keep it a Secret
• 1990’s – 2000’s Discharge goals• AM before 11 > 30-40%
• “Shift” goals
• 4 hour time block goals with prediction of “window”
• Reactive
• “Not Patient Centered”
• 2008 - Prediction
• 2013-14 – Discharge when Medically Ready

11/27/2016
18
James M. Anderson CenterFor
Health Systems Excellence
Timeline for DC when Medically Ready
• Criteria established at admission
• Nurse at bedside notifies service when Medical discharge criteria are met
• Discharge from floor in < 2 hours
• Review Length of Stay and Re-Admissions as balancing measures
Criteria Set
Admission to
Floor
Discharge
Criteria Set Tracked
Discharge
Home
Re-Adm & LOS
TrackedStaff
Discharge
Criteria Met
Nurse Notifies
Staff
Treatment
Protocol
Followed
Standardized
Criteria
Buy-In by Staff
Modify Rounding
Clear Discharge Criteria
Communication Family
Standardized
• Protocols for most Tx
• Evaluation Criteria
2 Hrs
Not about Speed – Now about Efficiency
James M. Anderson CenterFor
Health Systems Excellence
Discharge When Medically ReadyKaren Tucker, Angela Statile, Diane Herzog, and Christy White
Increase percentage of
all HM patients who
have met* Medically
ready criteria who will
be discharged within
two hours of reaching
that goal* on A6S,
A6N, LA1W from
75%to 80% by June 30,
2014
Productivity: Optimize
use of facilities and
staff and improve
patient flow to achieve
20% greater utilization
of existing assets by
June 30, 2015
Criteria for Medically Ready Defined at
Admission
Agreement among HM attendings and nursing
staff
of discharge criteria for order set diagnoses and
general admissions (LOR 2)
1) 8 pm Huddle discussion re: early discharges
(LOR 2)
2) 0630 notification of patients ready for
discharge (LOR 1)
Standardized and modifiable order sets (LOR 2)
Feedback of data by HM team
In conference room and by email (LOR 1)
Identify and Mitigate Plans:
1) Transportation- census based (LOR 1)
2) Pharmacy- priority fills (LOR 2), Outpt
delivery to patient room (LOR 1)
3) Consults- proactive evaluation (LOR 2)
4) RT- process in PICU (LOR 1)
5) Home Health Care
Daily Feedback reports to RNs and MD’s with ID
and mitigation of process and outcome measure
failures (LOR 2)
Shared Ownership/ Accountability and Buy-In
Among Physicians and Nurses
Communication regarding prediction of
discharge and defined goals is ongoing through
the hospital stay
Evidence of Preoccupation with Failure
Performance by team is transparent
Potential Barriers to Discharge are Clearly
Articulated and Mitigation Plans Established
Performance Management (LOR 1)
Auto notification to resident team that patient
has met all criteria (LOR 2)
Clear expectations for Parents/ Families

11/27/2016
19
James M. Anderson CenterFor
Health Systems Excellence
EMR Discharge Criteria: Physician View
© 2013 Epic Systems Corporation. Used with permission.
James M. Anderson CenterFor
Health Systems Excellence
Poster in Resident Conference Room
11/27/2016
20
James M. Anderson CenterFor
Health Systems Excellence
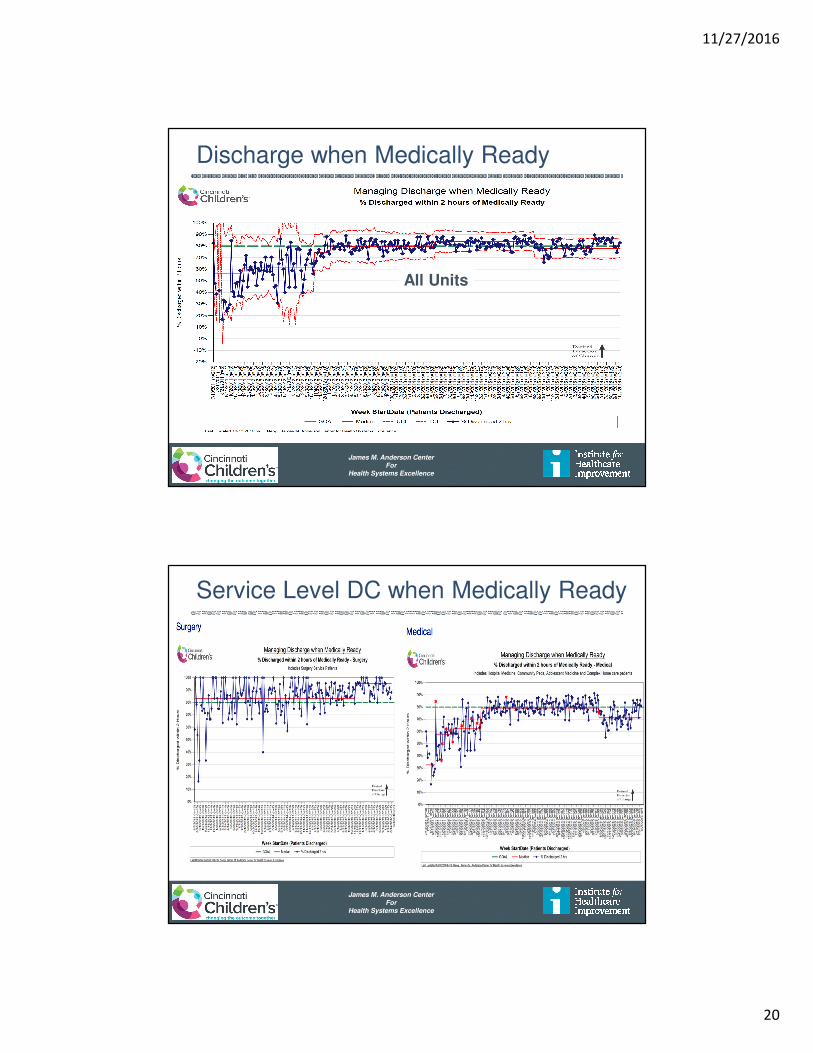
Discharge when Medically Ready
All Units
James M. Anderson CenterFor
Health Systems Excellence
Service Level DC when Medically Ready

11/27/2016
21
James M. Anderson CenterFor
Health Systems Excellence
Discharge Failure Reasons Comparison
James M. Anderson CenterFor
Health Systems Excellence
Balancing Measures – Length of Stay
2.12
2.42
1.14
2.12.11.97
1.4
1.87
0
0.5
1
1.5
2
2.5
3
Unit 1 Unit 2 Unit 3 All
Ave
rag
e L
en
gth
of
Sta
y (
Da
ys)
Hospital Medicine Average Length of Stay
For patients with selected diagnosis
FY11 FY13
11/27/2016
22
James M. Anderson CenterFor
Health Systems Excellence
Balancing Measures – Readmission Rate
James M. Anderson CenterFor
Health Systems Excellence
Key Drivers for Capacity Management
Management of Variability
Predictable CareDelivery
CapacityPrediction
CapacityManagement
Optimization ofFlow Delivery
Flow:SafetyMatching
Identify Patient Streams – Inpatient/Outpatient/ORManage System Variation
Evidence Based Best Practices, Analysis of ALOS and outliers,Standardize then Customize, Eliminate unnecessary care
Integration of simulation modeling and planning“Environmental Impact” Reports for growth programs
Simulation for design and patient placement“Environments Impact” Planning
Placement initiatives – D:C Matching plansDischarge prediction and planning,
Home Care, Parent Initiatives
Flow Failure Analysis, Predictive Risk Analysis
IHI Drivers CCHMC Initiative Operations Possibilities
D/C
Match
System
Re-Design
Shape /
Reduce
Demand
11/27/2016
23
James M. Anderson CenterFor
Health Systems Excellence
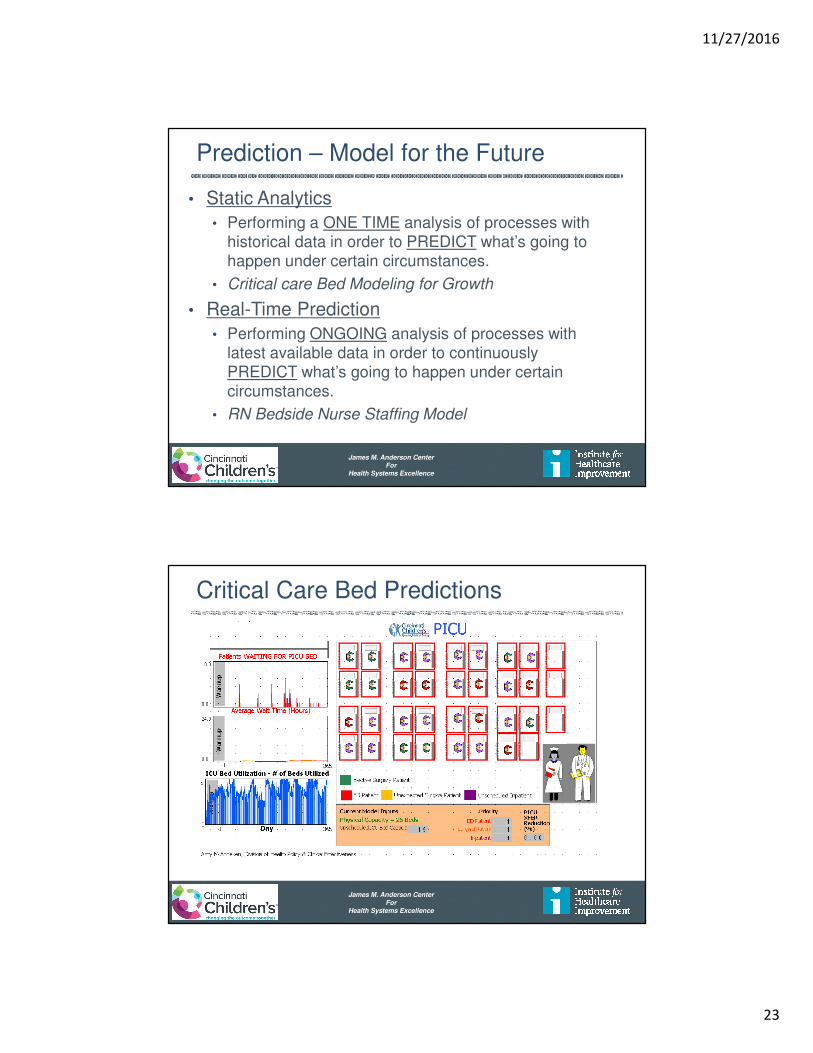
Prediction – Model for the Future
• Static Analytics
• Performing a ONE TIME analysis of processes with historical data in order to PREDICT what’s going to happen under certain circumstances.
• Critical care Bed Modeling for Growth
• Real-Time Prediction
• Performing ONGOING analysis of processes with latest available data in order to continuously PREDICT what’s going to happen under certain circumstances.
• RN Bedside Nurse Staffing Model
James M. Anderson CenterFor
Health Systems Excellence
Critical Care Bed Predictions
11/27/2016
24
James M. Anderson CenterFor
Health Systems Excellence
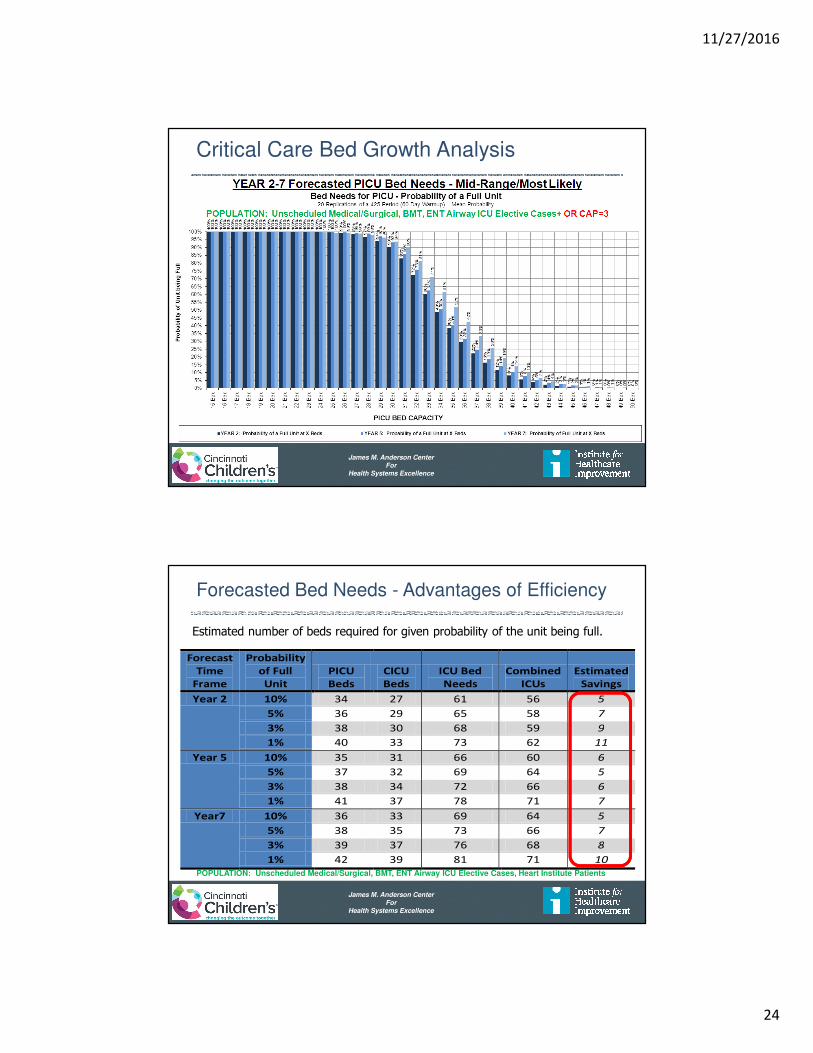
Critical Care Bed Growth Analysis
James M. Anderson CenterFor
Health Systems Excellence
Forecasted Bed Needs - Advantages of Efficiency
Forecast
Time
Frame
Probability
of Full
Unit
PICU
Beds
CICU
Beds
ICU Bed
Needs
Combined
ICUs
Estimated
Savings
Year 2 10% 34 27 61 56 5
5% 36 29 65 58 7
3% 38 30 68 59 9
1% 40 33 73 62 11
Year 5 10% 35 31 66 60 6
5% 37 32 69 64 5
3% 38 34 72 66 6
1% 41 37 78 71 7
Year7 10% 36 33 69 64 5
5% 38 35 73 66 7
3% 39 37 76 68 8
1% 42 39 81 71 10
Estimated number of beds required for given probability of the unit being full.
POPULATION: Unscheduled Medical/Surgical, BMT, ENT Airway ICU Elective Cases, Heart Institute Patients
11/27/2016
25
James M. Anderson CenterFor
Health Systems Excellence
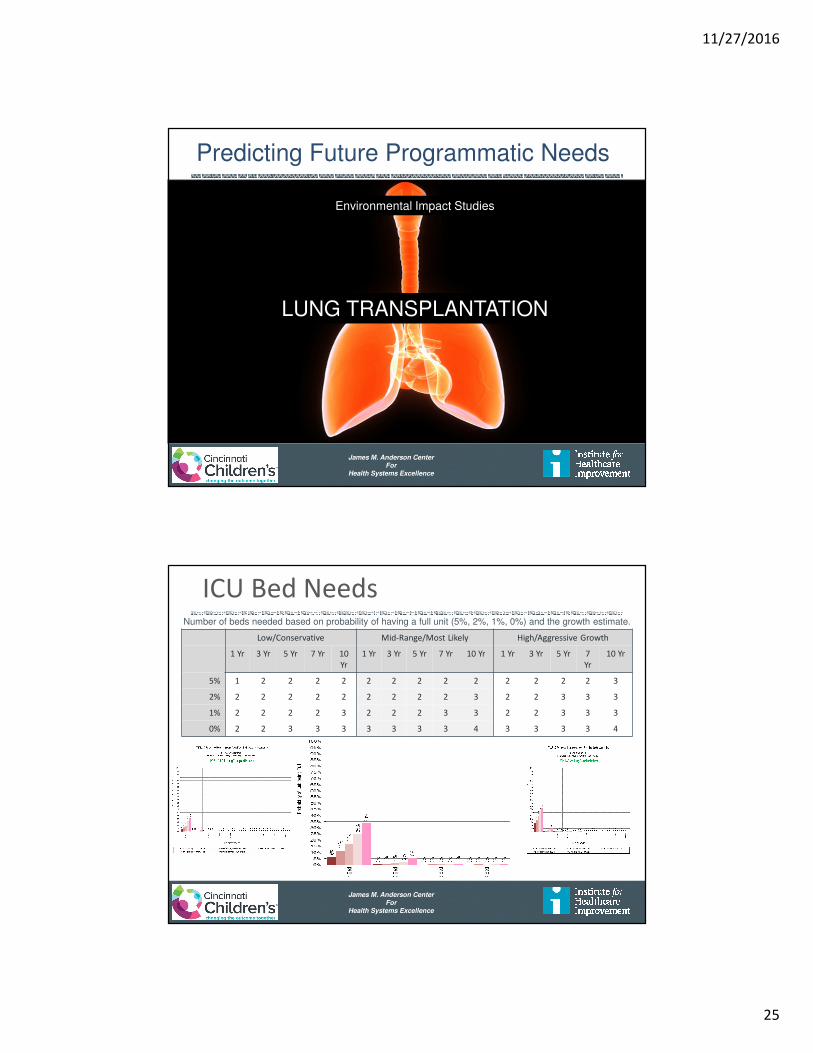
Environmental Impact Studies
LUNG TRANSPLANTATION
Predicting Future Programmatic Needs
James M. Anderson CenterFor
Health Systems Excellence
ICU Bed NeedsNumber of beds needed based on probability of having a full unit (5%, 2%, 1%, 0%) and the growth estimate.
Low/Conservative Mid-Range/Most Likely High/Aggressive Growth
1 Yr 3 Yr 5 Yr 7 Yr 10
Yr
1 Yr 3 Yr 5 Yr 7 Yr 10 Yr 1 Yr 3 Yr 5 Yr 7
Yr
10 Yr
5% 1 2 2 2 2 2 2 2 2 2 2 2 2 2 3
2% 2 2 2 2 2 2 2 2 2 3 2 2 3 3 3
1% 2 2 2 2 3 2 2 2 3 3 2 2 3 3 3
0% 2 2 3 3 3 3 3 3 3 4 3 3 3 3 4
11/27/2016
26
James M. Anderson CenterFor
Health Systems Excellence
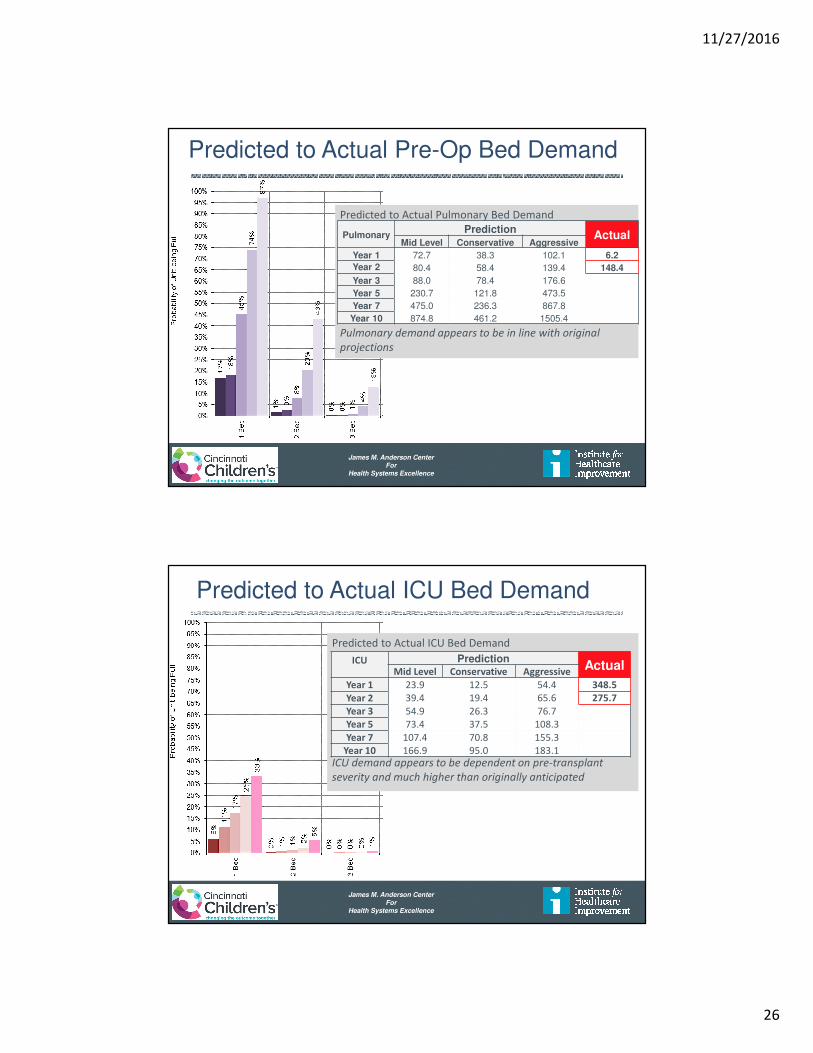
Predicted to Actual Pulmonary Bed Demand
Pulmonary demand appears to be in line with original
projections
PulmonaryPrediction
ActualMid Level Conservative Aggressive
Year 1 72.7 38.3 102.1 6.2
Year 2 80.4 58.4 139.4 148.4
Year 3 88.0 78.4 176.6
Year 5 230.7 121.8 473.5
Year 7 475.0 236.3 867.8
Year 10 874.8 461.2 1505.4
Predicted to Actual Pre-Op Bed Demand
James M. Anderson CenterFor
Health Systems Excellence
Predicted to Actual ICU Bed Demand
Predicted to Actual ICU Bed Demand
ICU demand appears to be dependent on pre-transplant
severity and much higher than originally anticipated
ICU PredictionActual
Mid Level Conservative Aggressive
Year 1 23.9 12.5 54.4 348.5
Year 2 39.4 19.4 65.6 275.7
Year 3 54.9 26.3 76.7
Year 5 73.4 37.5 108.3
Year 7 107.4 70.8 155.3
Year 10 166.9 95.0 183.1
11/27/2016
27
James M. Anderson CenterFor
Health Systems Excellence
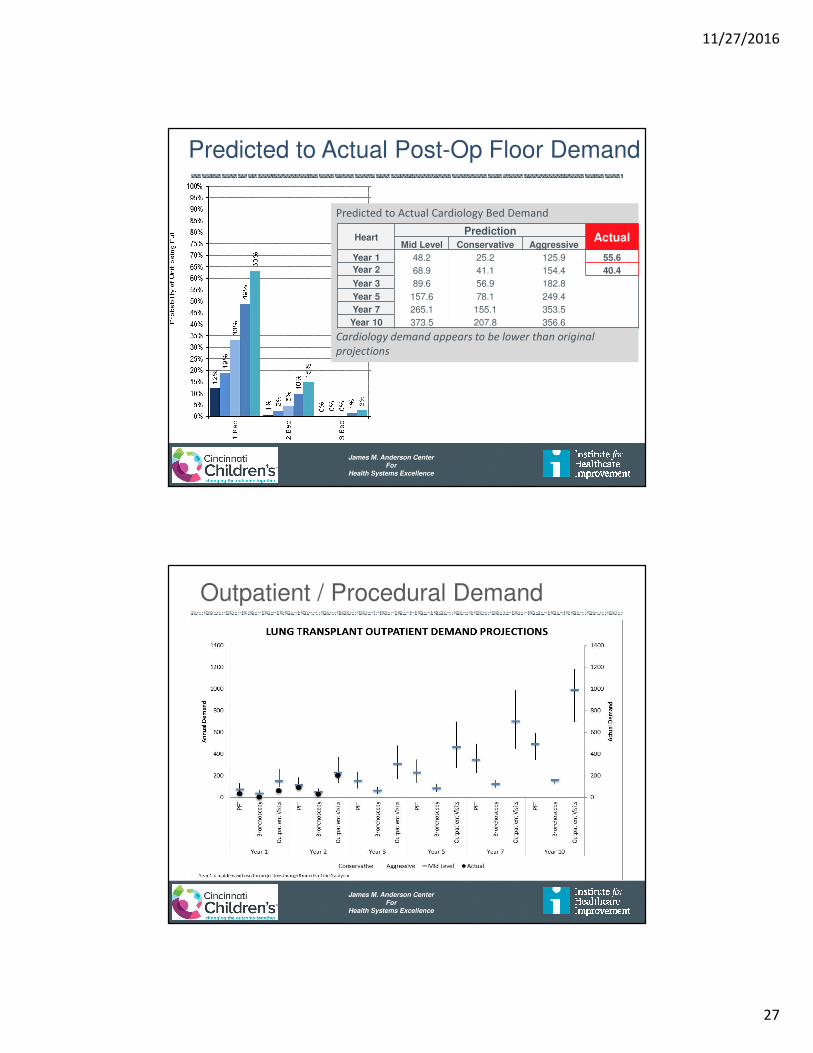
Predicted to Actual Cardiology Bed Demand
Cardiology demand appears to be lower than original
projections
HeartPrediction
ActualMid Level Conservative Aggressive
Year 1 48.2 25.2 125.9 55.6
Year 2 68.9 41.1 154.4 40.4
Year 3 89.6 56.9 182.8
Year 5 157.6 78.1 249.4
Year 7 265.1 155.1 353.5
Year 10 373.5 207.8 356.6
Predicted to Actual Post-Op Floor Demand
James M. Anderson CenterFor
Health Systems Excellence
Outpatient / Procedural Demand

11/27/2016
28
James M. Anderson CenterFor
Health Systems Excellence
Outcomes and Observations
- Environmental Impact Assessment provided valuable information allowing for assessment and agreement across the hospital before program was initiated
- Answer questions about patient flow and placement
- Assess potential stress on existing resources
- Quantify demand and capacity needs (staffing, beds,
outpatient clinic rooms, PFT demand, OR demand)
- Requires assumptions and research for new programs
- As always – your results are only accurate if your assumptions are correct
James M. Anderson CenterFor
Health Systems Excellence
Nurse Staffing and Hospital Mortality
• Tertiary Medical Center – 197,691 patients, 176,696 RN shifts, 43 hospital units
• Relationship between nurse staffing and patient turnover
• Risk of Death 2-3 % for each below target shift
• Risk of Death 4-7 % for every high turnover shift • Admissions, discharges, and transfers
• Risk of Death 12 % for each below target shift
• Risk of Death 15 % for every high turnover shift
• Independent Variables when considering risksNeedleman J. et al. N Engl J Med 2011;364:1037-45.
ICU
Patient
Non-ICU
Patient
1st 5 days
LOS
Staffing and Environment - Mortality
11/27/2016
29
James M. Anderson CenterFor
Health Systems Excellence
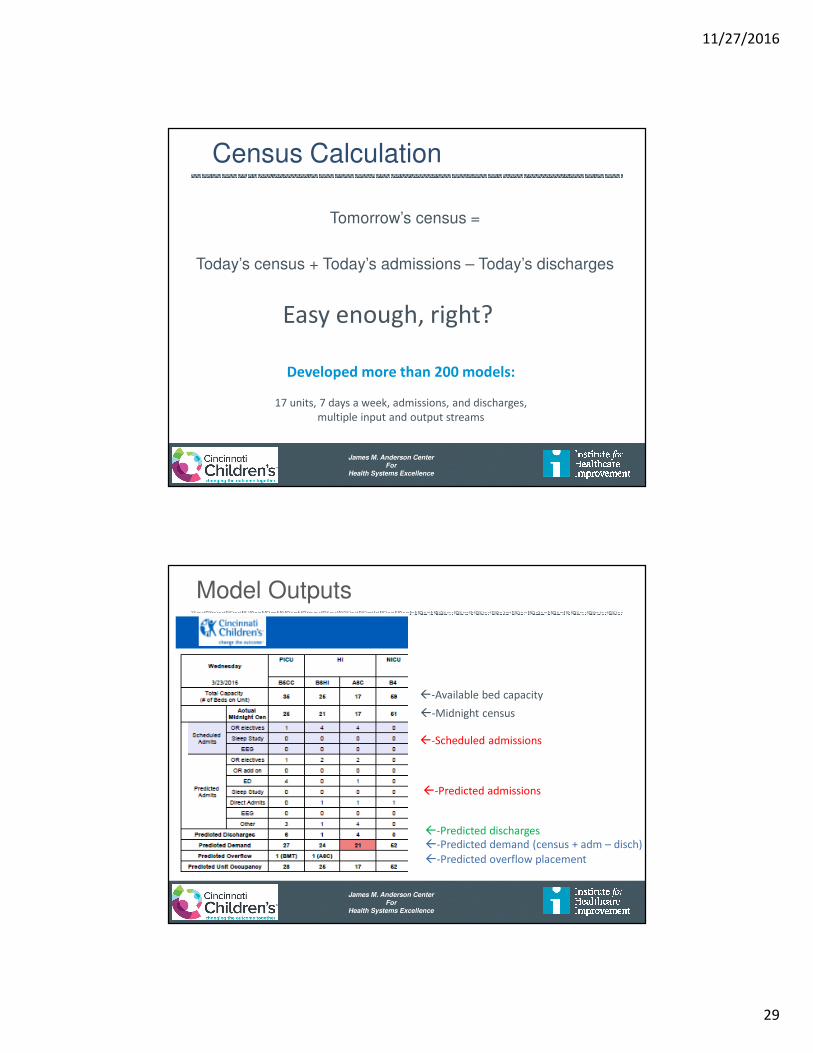
Census Calculation
Tomorrow’s census =
Today’s census + Today’s admissions – Today’s discharges
Easy enough, right?
Developed more than 200 models:
17 units, 7 days a week, admissions, and discharges,
multiple input and output streams
James M. Anderson CenterFor
Health Systems Excellence
Model Outputs
�-Available bed capacity
�-Midnight census
�-Scheduled admissions
�-Predicted admissions
�-Predicted discharges
�-Predicted demand (census + adm – disch)
�-Predicted overflow placement

11/27/2016
30
James M. Anderson CenterFor
Health Systems Excellence
Staffing Prediction – Proactive Planning
James M. Anderson CenterFor
Health Systems Excellence
Actual vs. Predicted Results

11/27/2016
31
James M. Anderson CenterFor
Health Systems Excellence
Impact of Analytics
• Bed demand predictions facilitate staffing and overflow planning – right patient – right team
• ED admit predictions improved from 40% to 70% accuracy – resource allocation
• Encourages staff to more consistently predict and document estimated discharge date, which helps guide care – system efficiency
• Uncovers scheduling issues – efficiency and access
• One-stop source to determine where there is capacity (or lack thereof) to add services (infusions, etc.) –efficiency and utilization
James M. Anderson CenterFor
Health Systems Excellence
Key Drivers for Capacity Management
Management of Variability
Predictable CareDelivery
CapacityPrediction
CapacityManagement
Optimization ofFlow Delivery
Flow:SafetyMatching
Identify Patient Streams – Inpatient/Outpatient/ORManage System Variation
Evidence Based Best Practices, Analysis of ALOS and outliers,Standardize then Customize, Eliminate unnecessary care
Integration of simulation modeling and planning“Environmental Impact” Reports for growth programs
Simulation for design and patient placement“Environments Impact” Planning
Placement initiatives – D:C Matching plansDischarge prediction and planning,
Home Care, Parent Initiatives
Flow Failure Analysis, Predictive Risk Analysis
IHI Drivers CCHMC Initiative Operations Possibilities
D/C
Match
System
Re-Design
Shape /
Reduce
Demand

11/27/2016
32
James M. Anderson CenterFor
Health Systems Excellence
GARDiANS
James M. Anderson CenterFor
Health Systems Excellence
Hospital Wide System for Safety
Floor Huddles ICU HuddlesED HuddlePeriOp Huddle
Institutional Wide Bed Huddle – Capacity Management
Individual Room / Floor / System Predictions – Capacity and Safety
Institutional Daily Operations Brief
System Prediction – Mitigation Strategy
Pharmacy Security
Pt. Transport Housekeeping
3 Times - Every Day
Facilities P.F.E.
Outpt, Home, Psych

11/27/2016
33
James M. Anderson CenterFor
Health Systems Excellence
Flow Dashboard – Sites of Care
James M. Anderson CenterFor
Health Systems Excellence
Patient Satisfaction
• Only 3-4% of 1 Million outpatient visitors rank our care in the lower half (0-6 of 10 pts)
• 35,000 patient per year
Great American Ballpark Paul Brown Stadium
42,319 65,535

11/27/2016
34
James M. Anderson CenterFor
Health Systems Excellence
Understanding Outliers
I thought:
If I can get 80-85% of thisunder good control, that will
solve at least 85% of theproblem
James M. Anderson CenterFor
Health Systems Excellence
N=14 >200 Days
N=25 >100 Days
N=50 >62 Days
N=6 >365 Days
N=297 cases < 62 days (85.6%)
Total N=347
11/27/2016
35
James M. Anderson CenterFor
Health Systems Excellence
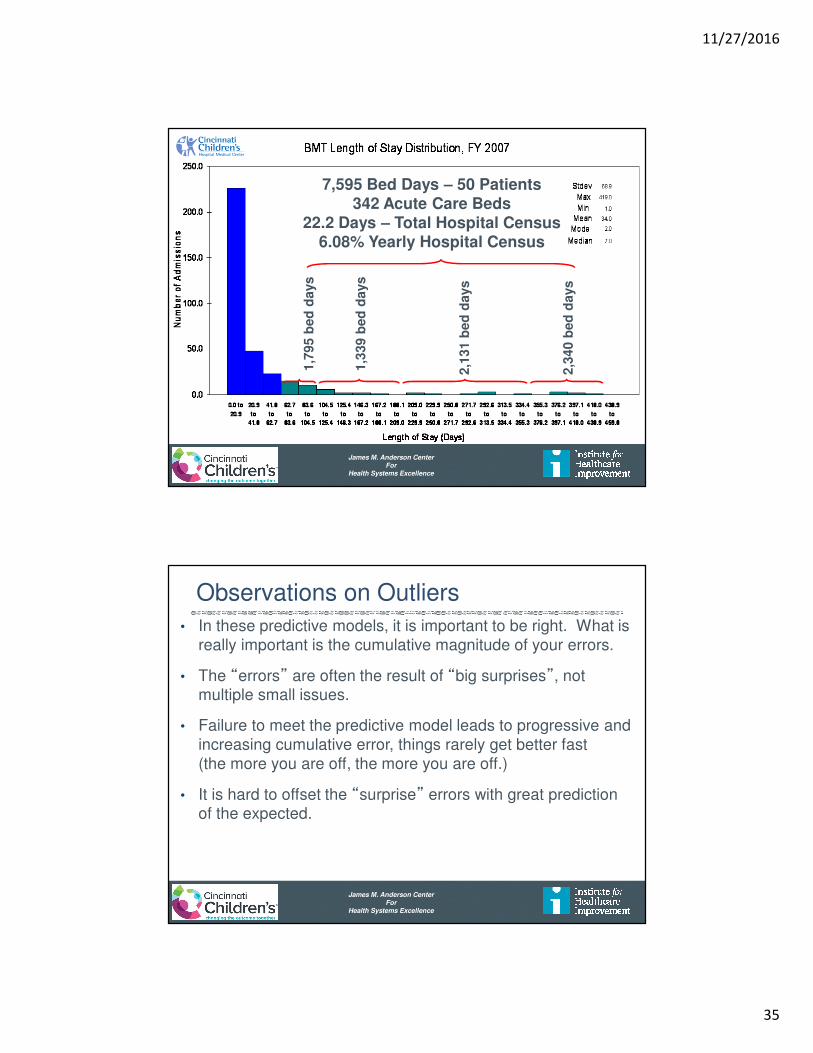
1,7
95 b
ed
days
1,3
39 b
ed
days
2,1
31 b
ed
days
2,3
40 b
ed
days
7,595 Bed Days – 50 Patients342 Acute Care Beds
22.2 Days – Total Hospital Census6.08% Yearly Hospital Census
James M. Anderson CenterFor
Health Systems Excellence
Observations on Outliers
• In these predictive models, it is important to be right. What is really important is the cumulative magnitude of your errors.
• The “errors” are often the result of “big surprises”, not multiple small issues.
• Failure to meet the predictive model leads to progressive and increasing cumulative error, things rarely get better fast (the more you are off, the more you are off.)
• It is hard to offset the “surprise” errors with great prediction of the expected.

11/27/2016
36
James M. Anderson CenterFor
Health Systems Excellence
Lessons Learned
• Building “Will” to work on Flow is a challenge
• When it works, it is not on anyone’s radar
• If it works for me, your problem is not my problem….
• When it does not work, somebody else should solve it
• Linkage Safety and Flow
• Speed vs Efficiency
• Work Backwards not just Forward
• Embrace Mathematics and Analytics
• Standardize processes and work flows
James M. Anderson CenterFor
Health Systems Excellence
Make it Personal
• Don’t let the Data
Drown out the Dream
• Stories not Statistics
• Names and Faces
• Accountability is Personal & Group Responsibility
• Collective Mission/Vision
© Cincinnati Children’s Hospital Medical Center 2013

11/27/2016
37
James M. Anderson CenterFor
Health Systems Excellence
Thanks !