horticulture sub-sector study report 2015images.agri-profocus.nl/upload/post/final_report... ·...
TRANSCRIPT

Horticulture Sub-Sector Study Report 2015
Mapping Investment Opportunities in the Horticulture Sub-Sector: The Case of
Vegetable Value Chains in Zambia

2
CONSULTANCY TEAM
Maxwell Mumba- Business Development Manager-AgBIT - Lead researcher
Brian Mwanamambo-CEO-AgBIT- Researcher 1
Moses Mwale- Investment Officer- Researcher 2
Isaac Sichivula- Lecturer NRDC - Researcher 3
Dr. Musaba- Lecturer Mulungushi University (MU) - Researcher 4
ABBREVIATIONS AND ACRONYMS AgBIT – Agribusiness Incubation Trust Limited ASNAPP- Agribusiness in Sustainable Natural African Plant Products
DAZ- Dairy Association of Zambia
DRC-Democratic Republic of Congo

3
EU- European Union
FGD-Focus Group Discussion
FISP- Farmer Input Support Programme
FRA- Food Reserve Agency
FREPEGA- Fresh produce and Export Growers Association
FSRP- Food Security Research Project
GM- Gross Margin
IAPRI-Indaba Agricultural Policy Research Institute
IDE- International Development Enterprise
KKIA- Kenneth Kaunda International Airport
MAL- Ministry of Agriculture and Livestock
NRDC- Natural Resources Development College
P N’ P – Pick and Pay
PLARD- Programme for Luapula Agriculture and rural development
RSA- Republic of South Africa
SMEs-Small and Medium Enterprises
SNV- Netherlands Development Agency
SPS-Sanitary and Phytosanitary Standards
TVC-Total variable Cost
UNWFP- World Food programme of the United Nations
ZamSeed- Zambia Seed Company
ZEGA- Zambia Export Growers Association
ZMW- Zambian Kwacha

4
EXECUTIVE SUMMARY
The demand for horticulture commodities and products has increased drastically due to increase in population in
the cities such as Lusaka, Ndola, Kitwe and Chingola. Notably Solwezi town in North Western Province has
experienced a population boom mainly due to 3 mines which have been commissioned in the last 10 years.
Coincidentally, during the same period, Zambia’s GDP has been growing at an average of 6% earning its self the
low middle income status by the World Bank in 2010. This economic growth has translated into increased incomes
among the middle class further increasing demand for fruits and vegetables.
Despite favorable climate, good soils and plenty of arable land, Zambia has continued to import significant
quantities of vegetables and fruits. Currently, 20% of the 1.5m smallholder farmers engage in horticulture
production which should be significant enough to produce enough vegetables for the domestic market and supply
for export. Statistics indicate that from the year 2010 to 2014, the value of imports or qualities imported have been
increasing. In the year 2014 alone Zambia imported vegetables worth US412.6m,(ITC Trade Map).On the other
hand, Zambia exported vegetables worth USD$ 11.5m to DR Congo and other COMESA member states. This shows
that the sub sector can create wealth and income smallholder famers if these imports were substituted by local
production and exports increased. Imports have continued to grow mainly because of low investment by the
private sector for improved production of quality vegetables and fruits. Production and supply of local vegetables
in formal markets falls far below quantities and quality standards demanded by the market through major retail
chain stores such as Pick n Pay, Shoprite, SPAR, Food Lovers’ Market, and Fruit and Veg City. For example Food
Lovers’ Market (East Park Mall) procures only 10% of its vegetable requirement from local smallholder farmers
with 90% imported from South Africa. The study revealed that smallholder farmers to do not have the capacity to
supply the formal market because they are constrained. They lack capital, knowledge and entrepreneurial skills
necessary for production and marketing for them to benefit positively from the value chains they participate in.
The Horticulture sub sector study which was undertaken between September and November 2015 revealed that
there are very few companies processing and adding value to horticultural commodities such as tomato, onions,
chilies and others. While this is a potential market for smallholder farmers, very few processing plants exist in
Lusaka and there is none in Luanshya, Kitwe and Chingola on the Copperbelt and Solwezi in North Western
Province. It also revealed that the few processors of horticultural products in Lusaka are facing supply challenges
due to unattractive prices they offer to smallholder farmers compared to the prices at Soweto, Mutendere and
other open market around the city of Lusaka.
The horticulture sub sector in Zambia can transform smallholder farmers, create jobs, sustainable incomes and
wealth through increased investment in focused value chain actors such as producers (farmers) processors,
transporters, input and equipment suppliers, marketers and information system managers.

5
ACKNOWLEDGEMENTS
First and foremost AgBIT would like to thank AgriProFocus and SNV Zambia for the confidence shown in selecting
us to conduct this study. AgBIT is also grateful to people who volunteered representing their various
organizations to be interviewed. This study would not have be complete without their participation. AgBIT would
also want to thank International Development Enterprise (IDE) for the support in identifying vegetable farmers in
the target areas.
Finally, AgBIT would like to thank individuals and organization who participated in the validation workshop held
on the 19th of November, 2015 at Protea Hotel Lusaka Towers, without which this draft would not have been
authenticated.

6
Table of Contents CONSULTANCY TEAM ............................................................................................................................................................... 2
ABBREVIATIONS AND ACRONYMS ........................................................................................................................................... 2
EXECUTIVE SUMMARY ......................................................................................................................................................... 4
ACKNOWLEDGEMENTS ............................................................................................................................................................ 5
List of tables and figures .......................................................................................................................................................... 8
CHAPTER ONE ....................................................................................................................................................................... 9
1.0 INTRODUCTION .............................................................................................................................................................. 9
1.1 Overview of the horticulture subsector in Zambia ........................................................................................................ 9
1.2 Purpose of the study .................................................................................................................................................... 10
1.3 Expected outputs ......................................................................................................................................................... 11
1.4 The concept of value chain analysis ............................................................................................................................ 12
Source: Adapted from a groundnut value chain study in Luapula , (AgBIT, 2015) ............................................................ 12
CHAPTER TWO .................................................................................................................................................................... 13
2.0 LITERATURE REVIEW .................................................................................................................................................... 13
CHAPTER THREE ................................................................................................................................................................. 17
3.0 STUDY METHODOLOY .................................................................................................................................................. 17
3.1 Geographic focus .......................................................................................................................................................... 17
3.2 Study design ................................................................................................................................................................. 17
3.3. Sample size .................................................................................................................................................................. 17
3.3. Data collection and analysis methods ......................................................................................................................... 17
3.3.1. Desk study ................................................................................................................................................................ 18
3.3.2. Market assessments ................................................................................................................................................. 18
3.3.4. Focus Group Discussions (FGDs) for thematic analysis ............................................................................................ 18
3.4 Actors ........................................................................................................................................................................... 18
CHAPTER FOUR ................................................................................................................................................................... 20
4.0 KEY FINDINGS AND ANALYSIS ....................................................................................................................................... 20
4.1 Actor relationships ........................................................................................................................................................... 20
4.1.1 Support actors ............................................................................................................................................................... 20
4.1.2 Production actors .......................................................................................................................................................... 20
4.1.3 Distribution channels and markets ............................................................................................................................... 20
4.1.4 Government .................................................................................................................................................................. 20

7
4.2 Lack of entrepreneurial/business management skills ...................................................................................................... 21
4.3 Inadequate value addition or processing of horticulture products ................................................................................. 22
4.5. Lack of smart cultivation and irrigation technologies ..................................................................................................... 23
4.6 Inadequate access finance and insurance ........................................................................................................................ 24
4.7 Uncoordinated market information ................................................................................................................................. 25
CHAPTER FIVE ......................................................................................................................................................................... 26
5.0 CONCLUSION AND RECOMMENDATIONS ........................................................................................................................ 26
5.1 Conclusion ........................................................................................................................................................................ 26
5.2 Recommendations ........................................................................................................................................................... 26
REFERENCES ........................................................................................................................................................................... 30
APPENDICES ........................................................................................................................................................................... 31
Appendix 1 – Investment opportunity analysis...................................................................................................................... 31
1. Processing and value addition .................................................................................................................................... 31
2. Farmer cluster development ...................................................................................................................................... 32
3. Soil fertility management ........................................................................................................................................... 33
4. Market information systems ...................................................................................................................................... 34
5. Market infrastructure and Cold Chain facilities ......................................................................................................... 35
Appendix 2: Enterprise Budgets for the four major vegetables and other crops commonly grown in the target areas ...... 36
APPENDIX 3: Key informants checklists ................................................................................................................................. 42
Appendix 4: Farmer questionnaire ........................................................................................................................................ 46
Appendix 5 – Demographic of smallholder study participants .............................................................................................. 52

8
List of tables and figures
Figure 1: A typical value chain diagram… ……………………………………………………………….……… 13
Figure 2: Schematic Representative of Actor relationship… ……….……………………………….…..22
Table 1: Import Values of Tomato processed products between 2 010 and 2014………….….23
Table 2: Imports of Frozen Vegetables from 2010 to 2014…………………………………….…..……24
Table 3: Yield Analysis per meter squared for 4 popular vegetabl e crops………….….…….…25
Table 4: Return analysis of vegetable crops………………………………………………………….…………25

9
CHAPTER ONE
1.0 INTRODUCTION
1.1 Overview of the horticulture subsector in Zambia
For many years, Zambia has been exporting a range of horticultural and floricultural products. The horticultural
and floricultural export sector is generally regarded as having started in the 1980s with the formation of Zambia
Export Growers’ Association (ZEGA). The establishment of ZEGA catalyzed the growth of the horticulture and
floriculture export sector.
The horticulture sector of Zambia experienced phenomenal growth between the 1980s and early 2000. Export
volumes in 2003 were 8,588 tons of vegetables and 4,011 tons of cut flowers. Eighty percent of vegetables were
destined for the UK, while seventy percent of cut flowers go to the Netherlands. The Government of Zambia and
ZEGA with a membership of 26 farmers influenced the local business environment which resulted in tremendous
growth. Export products included baby corn, fine beans, baby carrots, asparagus, runner beans, sugar snaps, tender
stem broccoli, okra, mange tout peas, passion fruit, spring onions, chilies, patti pans, in excess of 60 varieties of
roses, and summer flowers such as hypericums, solidago, rudbekia, liatris, etc. The relatively high profile and
reputable track record of the Zambian vegetable sector had won the confidence of major UK multiples. Quite a
considerable volume was exported in high care form for these multiples whose requirements were fairly difficult
to meet, especially in terms of food safety, hygiene, and traceability throughout the value chain. (Heri, 2005).
The remarkable growth of the horticultural and floriculture export sector during 1980s and early 2000s contributed
to Zambia’s competitiveness in the sub Saharan region. Sergeant (2004), shows that Zambia ranked 3rd after Kenya
and Zimbabwe in total value horticulture export value by the year 2002.
Since the late 1980s and early 1990s, there had been an increasingly important horticultural trade to Europe.
However, due to unforeseen circumstances, the sector suffered setbacks especially with the liquidation of major
producing firms such as Agriflora Ltd. Agriflora Ltd supported the participation of smallholder farmers in the
vegetable value chains through the out-grower scheme approach. In addition the firm provided smallholder
farmers and producer organization with ready for market for export vegetables. The collapse of the firm in the
early 2000 led to the disappearance of the ready market for the smallholder farmers and producers who dependent
on its existence. Despite the collapse of the firm, smallholder vegetable production has continued with the open
market being the main outlet for their vegetables and fruits. One of the farmer association which has continued to
support production and marketing of vegetables among smallholder farmers is Fresh Produce and Export Grower
Association (FREPEGA). FREPEGA was formed and registered in 2003 to assist smallholder fresh produce farmers
to access formal markets and finance. FREPEGA has been active since the year 2008 five years after its formation
due to some bottlenecks which came their way. It has since been working with fifteen (15) cooperative societies in
peri urban areas of Lusaka. Farmers belonging to these cooperative societies and many other farmers have been
the producers of vegetables and fruits consumed in Lusaka and many other places.

10
On the expert side, the major exporting agency ZEGA has also continued to play a role in the export sector on a
reduced level. According to Mbewe, (2012) ZEGA which was established in 1984 as a non – profit making org to
promote the collective interests of all growers wishing to export fresh horticultural produce is still a major actor
in the horticulture export sector. It runs as a professional, private and independent body. Presently ZEGA has 15
registered exporters comprising family businesses and companies from 26 members when it was first established
with most farms within 60 km radius of Kenneth Kaunda International Airport-KKIA. Most exports are to the EU
market based on duty-free, quota-free market access or preferential mechanisms.
Horticulture including floriculture has for long been regarded as highly promising non-traditional export sectors of
the economy of Zambia. These sectors have been export- oriented with some changes coming as a result of the
rising middle class. In addition, many firms experienced financial losses as a result of the appreciation of the kwacha
against major currencies around the year 2005, leading to decrease in output and revenues from the sector. In
order to better exploit the potential of the horticultural sector, much needs to be done to improve the domestic
horticultural value chains especially through investing in value addition chains which would work as a risk
minimization strategy for financial losses as a result foreign exchange fluctuations.
The horticulture sector has continued to play an important economic role in Zambia. Literature shows that 21% of
the 1.5m smallholder farmers engage in horticulture production a proportion which is significant and with the
potential to produce enough vegetables for the domestic market and supply for export. (IAPRI Policy Brief, 2015 #
72).
It is a common fact that generic information about the horticulture sub sector landscape in Zambia exist, this study
will go a step further in providing value chain specific information that would enhance upgrading of the sub sector.
The study report will act as a guide for investment by providing detailed investment appraisal outputs that would
help in decision making in prioritized and specified value chains.
1.2 Purpose of the study
The ultimate aim of the study is to map and quantify investment opportunities in the horticulture sub sector and
associated market channels in terms of potential for scalability, viability, smallholder farmer participation, private
sector investment, social impact agency participation for job creation, and increased incomes.
The study will also serve as a platform for the development of a blue-print and reference material for upgrading
the horticulture sub – sector through investment at various levels in the value chain. Furthermore, the study will
serve as a guide for the government and policy advocates in the formulation of policies that support the
development of viable horticulture value chains in Zambia.
In order to achieve the main purpose, the study will seek to attain the following specific objectives;
(i) Identify the major actors in the horticulture sub sector supply chains, their functions and how they
relate with other actors.

11
(ii) Identify segments/thematic area in the Horticulture value chain where the best investment or
financing opportunities exist (such as processing, transportation, input supply etc.), providing
benchmarks in comparison with other Sub-Sahara African countries.
(iii) Identify value chain segment/thematic area where the investment or financing opportunities are, and
where possible provide adequate preliminary investment analysis
(iv) Identify other needs and services required to take advantage of the investment opportunity
(transportation, aggregation, insurance, business development services, entrepreneurial skills, financial
literacy, etc.).
(v) Identify financial and resource needs of farmers and SMEs required for primary production and value
addition within the value chains
(vi) Identify risks and constraints limiting growth of farmers and SMEs in the horticulture sub sector
(vii) Identify and quantify major horticulture market channels that can be developed for smallholder farmer
participation.
(viii) Identify the critical success factors for the participation of smallholder producers to participate in the
lucrative market channels.
(ix) Propose strategies for efficient and effective linkage of smallholder farmers and SMEs to inputs and
output markets, finance etc.
1.3 Expected outputs
The study was among other outputs be expected to produce the following;
(i) Current horticulture sub sector value chain map including the functions and interrelationship between
the actors.
(ii) 3-4 specified high potential value chains with the following specific sub outputs;
• Supply and demand analysis
• Projection of revenues or profit margins where possible
• Sources of supply
• Investment size
• Return on investment
• Competitive advantage
• Type and size of financing required in the segment/thematic area
(iii) Support services required to rekindle the business fire in the value chains
(iv) Risks and major constraints quantified
(v) Major current and potential markets clearly defined
(vi) Success factors outlined
(vii) Upgrading strategies defined for all stakeholders
(viii) Agricultural Insurance status and landscape

12
1.4 The concept of value chain analysis
Value chains concept emerged in the mid-1980s as an approach to analyze and explain new forms of international
trade. Value chain approach necessitates understanding a market system in its totality, the actors that operate
from input supplies to end market buyers and consumers. Value chain approaches can make important
contributions to sustainable poverty reduction in rural areas if smallholders produce high value crops with good
market potential (Campbell, 2010) There has therefore been renewed importance of values chains as seen in the
prioritization of the approach in poverty reduction strategies and used by major donors and development partners.
A value chain depicts a set of actors and activities that bring a product from conception to its end use in a particular
industry. More simply, a value chain is described simply as the various stages of a production process, within the
agricultural sector, these stages include input supply, production, marketing and consumption and these are linked
through different relationships (Schipmann, 2006). The term value chain has been adopted because it is observed
that at each stage, value is being added to the product. In the horticultural sector, products refer to fresh fruits
and vegetables while value is realized through packaging, branding, processing or marketing.
……………………………………………………………………………………………………………………………………………….
Domestic consumer
market
International
consumer market
peanut
Utilization
Open market Super-
markets
Local
markets
Outlets
Juice, dried fruits
and vegetables Processing
Smallholder farmers Commercial farmers Production
Seed /seedling companies Agro dealers Input supply
Research Institutes/Universities Research
Traders
Source: Adapted from
a groundnut value
chain study in
Luapula, (AgBIT, 2015)
Figure 1: A typical
value chain diagram.
13
Actors along a value chain often move beyond spot market transactions to establish relations with each other
through contracts, vertical integration, alliances, and other forms of coordination. These relations can cover a
multitude of arrangements for production, processing, and logistics. The benefits that are usually sought from
stronger linkages include improved access to inputs, technology, information, markets, and capital. The strength
of relations within the value chain is determined by the trade-off between the economic incentives associated with
stronger relationships and the costs of losing independence.
CHAPTER TWO
2.0 LITERATURE REVIEW
Mbewe, (2012) indicates that the horticulture export faces a number of challenges. These challenges include
increasing demand on quality for the EU market where it has become more stringent without no commensurate
increase in product prices putting sustainability of the sector operations at a high risk. Secondly, high cost of air
freight, power deficits, and currency instability are also posing as barriers to growth of the sector. Little
understanding of impact of standards on producers also make small producers most vulnerable coupled with
discriminatory enforcement of standards, high cost of training and certification , Cold Chain Management for
quality, dependency on duty & quota- free EU market, SPS Inspections, border management delays continue to
affect the efficiency of the sector. The buy local campaign in countries such as South Africa equally poses as a
challenge to enter that market.
However, there are still opportunities in the alternative markets with a possibility of sourcing shifting to Asia, Latin
America and South African markets. There is also a very big opportunity to tap into emerging markets in the region
such as DR Congo, Angola and other neighboring countries.
A value chain is described simply as the various stages of a production process, within the agricultural sector, these
stages include input supply, production, marketing and consumption and these are linked through different
relationships. Three main value chains are discussed in this study, i.e., the general fruit and vegetable and the
banana value chains.
On the other hand, the Horticulture Sub Sector report, (2014) shows that constraints affecting the sector include:
i) Lack of good quality seed. The farmers indicated that some seed vendors sell mixed material or material with
poor germination and they travel to urban areas to buy seed. Seed suppliers revealed that the main varieties sold
were the old varieties improved hybrids are available but more expensive, ii) Lack of access to reliable water for
cropping. The rainfall pattern can be very variable and this affects available water since most smallholders rely on
streams and shallow wells for irrigation since they cannot afford irrigation systems. iii) Pests and diseases - farmers
face major problems when it comes to disease control. This is due to inadequate training and also due to

14
insufficient funds to purchase proper crop chemicals, iv) Lack of appropriate and adequate training and extension
support. This is due to the fact that most agricultural development activities including extension and training are
aimed at the main staple crops like maize and very little is aimed at supporting horticultural production,
v) Lack of and cost of fertilizers. Although the various types fertilizers used for fruit and vegetable production are
available in cities and towns, the farmer has to incur the extra cost of transporting the fertilizer to the village, hence
increasing production costs, vi) Inadequate production technologies. The horticultural sector does not have a
coordinated approach to adapting to foreign technology. The sector lacks an inventory of available foreign
technology, including sources and cost. This high dependence on foreign technology has resulted in smallholder
farmers being unable to access technologies appropriate to their specific needs, vii) Lack of appropriate post-
harvest technologies. The major cause of spoilage in vegetables is deterioration of product quality after harvesting.
These are caused by five main factors, thus, metabolic changes, bruising and mechanical injury, moisture loss or
transpiration, physiological breakdown and rots.
Very few smallholder farmers have access to loans for horticultural production. The major vehicle through which
smallholder farmers are accessing inputs is contract farming
A report by Indaba Agricultural Policy Research Institute (2015), Is Smallholder Horticulture the Unfunded Rural Poverty Reduction Option in Zambia? Identified following opportunities (in terms of productivity and profitability) and challenges for the stallholder farmers; Smallholder Horticulture Contributes Significantly to the Zambian Economy in Spite of Lack of Public and Limited
Private Sector Support and Investment: At the national level, the maize sector during the2010/11 production and
2011/12 marketing season involved 1.3 million smallholder households or 6.5 million people producing ZMW 2.9
million worth of produce of which ZMW 1.6 million (56%) was sold. During the same period, the horticultural sector
involved 300,000 smallholder households or 1.5 million people producing ZMW 0.8 million of which ZMW0.6
million (74%) was sold. On a per capita basis, the contribution of smallholder horticulture to the rural economy is
much superior to that of maize. For example, the value of production at the national level is 1.38 times higher (1.85
times higher for sales). It was also 1.34 (1.78 for sales) and 3.25 times higher (9.04 times higher for sales) compared
to maize subsector among the female headed and smallholder households cultivating less than one hectare
respectively.
Smallholder Horticulture Is Much More Profitable Compared to Maize, Especially Where the Market System Can
Be Navigated: Analysis has shown superior GMs of all horticultural crops compared to maize with the highest being
cabbage (219 times that of maize) followed by tomato (179 times) and onion (138 times). The percent Gross Margin
(GM) return on Total Variable Cost (TVC) of these respective horticultural crops was 263,158 and 141 percentage
points respectively more than that of maize.
Smallholder Horticultural Market Participation Has Much More Household Income Impact than That of Maize:
There are significant net household income increases as a result of smallholder participation in horticultural and
maize markets, but the impacts are much higher for the participation in horticultural than the maize markets.

15
Participation in horticultural markets results in net income increase of 157% compared to 22% for maize markets
at the national level; participation of female-headed households in horticultural and maize markets results in
incremental income of 172% and 61% respectively while that of smallholders cultivating up to 2 hectares ranges
from 160% to 167% for horticultural markets and only 24% to 28% for maize markets. Whilst, among the poor
households, income increases by 152% to 162% compared to only 15% to 26% by participation in the horticultural
and maize markets respectively.
A Number of Factors Condition Smallholder Participation in Horticultural Markets:
Female-headed households are significantly much less likely to participate in maize than horticultural markets.
This suggests that investments targeting increased participation of female-headed households in these markets
offer greater opportunities for their commercialization, income growth, and poverty reduction. Thus, smallholder
horticultural market participation offers greater potential in addressing gender income disparities than maize
market participation;
Households headed by relatively younger heads are more likely to participate in horticultural markets but age did
not seem to matter in maize market participation. This means that younger heads of household are willing
and/or able to navigate the current horticultural production and marketing constraints while age does not seem
to matter in the case of maize;
The proximity to good road infrastructure significantly increases the probability to participate in horticultural
markets while it does not matter for maize ones. This implies that market accessibility is a critical factor to be
addressed in investments meant to enhance smallholder horticultural market participation more especially that
most horticultural products are perishable and have a short shelf life;
The horticultural price variability significantly reduces the probability of participation in horticultural markets.
One of the critical ways to address horticultural price variability and enhance smallholder market participation is
the development of strategically located appropriate horticultural wholesale markets serviced with effectively
functioning price information system that will enable traders and farmers alike to spatially arbitrage their
supplies by regularly moving produce from high to low supply areas throughout the year;
As expected, an increase in the number of households receiving Farmer Input Support Programme (FISP) packs
significantly increased the participation in maize market more than horticultural market.
Field experience has shown that smallholder farmers sometimes use fertilizer acquired through FISP to grow
horticultural crops and proceeds from horticultural production and marketing to meet their contributions to the
input packs. This suggests that using the flexible electronic voucher in distributing FISP inputs might greatly benefit
horticultural production because farmers may opt to purchase horticultural crops inputs; and

16
The quantities of the previous year’s Food Reserve Agency (FRA) maize purchases significantly reduce the
probability of smallholders to participate in horticultural markets but have no significant effect on participation in
maize ones. This implies that government expenditure on maize marketing through FRA impacts negatively on
any efforts to diverse Zambian agriculture from maize monoculture.
A report by Indaba Agricultural Policy Research Institute (2015), Can Horticultural Market Agents Play A Role in the Development of Cost-Effective and Sustainable Price Information Systems? The following Opportunities and challenges in relation to Horticultural Market Agents were deduced; The intra-day price variation of tomato and rape tends to be much higher than that of onion which has a relatively longer shelf life. Significant price variations were evident between different markets and seasons for all the crops. However, the degree of variation differed by crop. Meaning supply chain actors, including smallholder farmers, can use this price information for spatial as well intra-season arbitrage or for supplying produce to markets during the season when they would get the best returns. Interaction with end users of Lima Links who included smallholder farmers indicated the following benefits/impacts of the price information system: Increase in supply chain activities. The total number of farmer transactions recorded by the market agents increased from 135 to 7,979 and the value of sales from ZMW649, 411 to ZMW13, 692,060 between the first and fourth quarter of 2014. Controlling for location of sales (the market) and market prices, these factors increased by 28% and 21% between the two quarters respectively. System end users saw a number of benefits including: o Empowerment to choose which market to supply their produce; o Empowerment to plan which crops to grow/supply to which markets during which months; o Reduction in the cost of sourcing price information; o Increased sales income and great potential for increased household well-being; and o Improved bargaining between farmers and traders at the farm-gate.
The literature reviewed provides an opportunity to understand the constraints that exist in the horticulture value
chain in Zambia. However, none of the literature has identified and provided specific investment opportunities
with estimates in the value chain but also specifying constraints each actor faces. Secondly, this study takes a
holistic view of how the actors in the smallholder vegetable supply chain interact, relate and conduct business
within the supply chain.

17
CHAPTER THREE
3.0 STUDY METHODOLOY
3.1 Geographic focus
The study and analysis was limited to the line of rail from Lusaka to Chingola including Solwezi in North Western
Province. The study covered the following areas specific areas Lusaka town and part of Chongwe, Chibombo in
Central province, Kafubu Block in Luanshya, Mugala in Kalulushi and Luankole in Chingola, Kyabakanka and
Shimabila in Solwezi.
3.2 Study design
A cross sectional survey was conducted in selected towns along the line of rail targeting the horticulture sub sector.
The horticulture sub-sector in Zambia is comprised of the fruit and vegetables value chains where 90% of trading
is done on the local market with mainly producing and trading on the local and export markets by both smallholder
farmers and commercial farmers. However, the analysis focused on the local sector due to resource and financial
limitations.
The discussions with horticulture commodity producers, value chain actors, market participants and key informants
with knowledge about the sector were conducted using checklists as interview guides. These discussions helped to
develop the sub-sector map to schematically show the horticulture sub sector in Zambia and how key subsector
actors related. Most importantly, these interviews were used to identify the nature and category of constraints
and opportunities in the sub-sector. In addition, checklists were important for identification of primary actors in
the sub-sector, their roles, interrelationships, governance structures and market channels. The study therefore
identified actors from input supply, production, assembling, processing, to delivery of the final commodity to
consumers locally, regionally and internationally.
The study however further used a MIXED approach whereby both quantitative and qualitative data was collected.
The study was conducted over a period of 21 working days.
3.3. Sample size
With consultation with smallholder farmer organizations, an average of 20 smallholder farmers per farming block
of smallholder farmers was selected to be part of the research sample. This means that 121 farmers shall be
interviewed. In addition, 1 functional area officer in each of the identified actors shall be interviewed. In some
circumstances where individual farmer interviews will not be possible, FGDs shall be conducted or both.
3.3. Data collection and analysis methods
From the study design given above, data collection was done using a systematic and sequenced process. Data was
collected from all the actors and stakeholders in the horticulture sub sector. The following methods are used to
collect verifiable and reliable data including analysis. Specific and customized data collection tools were developed
to help achieve the data collection objective. The primary producers who are the small scale formers were

18
interviewed using a semi structured questionnaire while other actors were interviewed using actor specific semi-
structured checklists. The tools are attached herein as appendix 1 & 2.
Data was collected from key informants through in-depth interviews that included quantitative and investment
analyses.
3.3.1. Desk study
Literature review was conducted for content analysis of previous studies and similar studies conducted in Zambia
and other countries
3.3.2. Market assessments
Both formal and informal markets. Informal open markets sampled included Mutendere and Kazimai markets as
well as markets along the line of rail were sampled for interviews and observation of the challenges and
opportunities faced in the course of their businesses. Group discussions and one on one interviews were conducted
with marketers at the two markets.
Formal markets sampled included chain stores such as Food lovers market at Eastpark Mall in Lusaka. Interviews
were conducted with management staff.
3.3.4. Focus Group Discussions (FGDs) for thematic analysis
Small Holder Horticulture farmers in Lusaka which is the major exporting area of horticulture products, Chibombo
area of the Central province, Kafubu farming block in Luanshya, Mugala area of Kalulushi, Chingola – Solwezi road
farming block on the Copperbelt, Kyankaka and Mumena areas of Solwezi. Solwezi was been included in the study
as a result of the emerging consumer market brought about by the three greenfield mines opened in the area in
the last 15 years namely Kanshanshi, Lumwana and Kalumbila mines. Comparatively, the selected areas arguably
represent the largest consumer market for traded fruits and vegetables in the country through retail chain stores,
supermarkets, council market and other informal channels in Zambia. Focused group discussions of an average 20
smallholder farmers were carried in all areas indicated above.
3.4 Actors
The key actors in the horticulture subsector were selected and interviewed as below;
The ministry of agriculture and livestock, the central statistics office and the Zambia development agency
represented government in the study. The study with government departments focused in issues of policy support,
statistical information and investment promotions in the horticulture subsector. The interviews were conducted
with key personnel as well as use of various documents.
Large farming business involved in production and supply of larger quantities of vegetables per annum to both the
local and international markets. The study involved questionnaire led interviews were key personnel.

19
3 processors based in Lusaka namely Rivonia, Sylva Foods and Freshpikt were selected for the study. Management
gave their experiences dealing with smallholder farmers as suppliers to their processes as well as key challenges
that they faced in the course of business.
2 input suppliers were selected and interview for the study on their experiences and areas of growth. These were
represented by starke aryre and Afriseed.
Actors in the non-governmental organizations (NGOs) subsectors were interviewed to share their experiences
working with horticultural farmers in many parts of the country. Key staffs were interviewed during this process.
Input was collected from Musika, IDE and the UNWFP.
Financial institutions and insurance companies interviewed included first national bank, vision fund and focus
insurance.

20
CHAPTER FOUR
4.0 KEY FINDINGS AND ANALYSIS
Following analysis of data collected on a cross section of data sources indicated above, presented hereunder are
key findings from the study.
4.1 Actor relationships
The key actors in the horticulture value chain are divided into 4 broad categories namely; support actors,
production actors, the markets and the government.
4.1.1 Support actors
Support actors included input, chemical and equipment suppliers who supply the smallholder farmers directly or
through agro dealers with seeds, fertilisers, irrigation equipment/kits, chemicals, sprayers and cultivation
implements among others. There include Skarke Ayres, Osho Chemicals, Kick start, Afriseed, Zamseed and other
local agro dealers.
Other support actors include Finance and Business Development support actors who provide finance and various
agriculture production and market development services that enhance capacity of smallholder farmers to
increase productivity and quality of the fresh produce. This includes AgBIT, IDE, SNV, AgriProFocus, ASNAPP,
VisionFund and Profit – Plus.
Farmer associations such as FREPEGA provide advocacy and representation of the interest of smallholder farmers
in various fora.
4.1.2 Production actors
The actors in this category are the vegetable smallholder farmers cultivating an average of an eighth of a hectare
of land.
4.1.3 Distribution channels and markets
The markets represent a cross section of the various market options for the smallholder farmers. The markets
can be sub divided into 3 market outlets. These are open markets, formal markets and processors. The major
open markets are Soweto in Lusaka, Chisokone in Kitwe and Kasumbalesa on the border with Congo DR. The
formal markets include Foodlovers market, Freshmark, Fruit and Veg City and P N’ P. The processors include
Rivonia, Freshpikt and Ronipam Enterprise who are located in Lusaka and mainly processing tomatoes, onion and
chili.
Commodities are largely distributed by the smallholder farmers themselves and middlemen (mobile traders).
4.1.4 Government
The government provides policy support, research, market development, training and extension services through
the ministry of agriculture, Zambia development agency and other supporting departments.

21
Figure 2.0 below represents the schematic presentation of the horticulture supply chain in Zambia.
Figure 2.0 Schematic Representative of Actor relationship
4.2 Lack of entrepreneurial/business management skills
Whilst large horticultural farmers such as York Farm exhibited well set out farm structures, planned production
scheduling, crop analysis and marketing systems, smallholder farmers showed signs that they had no basic
systems for organization their farming occupation as a business.
Their (smallholder farmers) growing calendars coincided leading to oversupply of the markets of particular
commodities and adverse price fluctuations. They also grew the same kinds of vegetable crops and had the same
markets.
The majority of the smallholder farmers did not keep records of their production and sales activity for them to
check the profitability of the farm plots and crops that they engaged in. only lead farmers were found with
records during the study representing 5% of the population sampled for the study.
SMA
Support Actors Production Actors Markets
Input & equipment suppliers:
Osho Chemicals, Starke Ayres,
Kickstart, Afriseed, Zamseed, Local
agro, dealers
Finance/BDS Providers: IDE, SNV,
AgriProFocus, Profit-plus, AgBIT,
VisionFund, ASNAPP, Media
Farmer associations:
FREPEGA
Government (Ministry of Agriculture) – Policy Support, research, market development, training and extension
Vegetables
smallholder
farmers
Processors; Rivonia,
Freshpikt, Sylva foods,
Ronipam
Formal markets;
Foodlovers, Fruit & Veg
City, Freshmark, P n P
Major Open Markets;
Soweto (Lusaka),
Chisokone(Kitwe),
Kasumbalesa(DRC border)

22
The smallholder farmers were found perennially in need of finance for working capital and have hence remained
at the same levels without growth in wealth for many production cycles.
4.3 Inadequate value addition or processing of horticulture products
Whilst a number of small firms were noted to have undertaken value addition of vegetables, only 3 major firms
were found to be processing tomatoes and chili for sale in chain stores and export namely Rivonia, Freshpikt and
Sylva Foods, all based in Lusaka.
The 3 major vegetable processors were indicative of massive demand for their products both on the local market
and international market. They however complained of inconsistent and poor quality supplies from the local
smallholder farmers. The processors indicated that despite their offer of a stable price, the smallholder farmers
opted for the open informal markets where they earn a higher return despite volatility of the prices on that
market.
Demand for processed vegetables such as tomato ketchups, sauces and other mixed condiments remains very
high and indicative of a massive opportunity for investment.
Table 1 below shows the levels of imports of processed tomato products into Zambia from 2010 to 2014.
Table 1- Import Values of Tomato processed products between 2010 and 2014.
Value of imports in USD 000’s
Product 2010 2011 2012 2013 2014
Tomato Ketchup & other tomato sauces 582 895 922 1,003 1,047
Tomato Sauces & other mixed condiments 4,386 5,475 6,544 7639 8,170
Total 4,968 6,370 7,466 8,642 9,217
Source: ITC Trade map
Imports have therefore grown at an average annual value of USD850, 000 from USD4.968million to
USD9.217million between 2010 and 2014.
4.4 Inadequate market infrastructure and cold chain systems
There are no market places in cool chain infrastructure in Zambia for the informal traders, the study revealed. All
goods supplied by smallholder farmers are placed/displayed at makeshift structures made from sticks and in
many cases placed on the ground.
Whilst these conditions are unhygienic, they also compromise the quality and shelf life of the highly perishable
vegetable commodities displayed for sale. Some of Zambia’s major open markets used in the study are Soweto in
Lusaka, Chisokone in Kitwe, Chiwempala in Chingola, Kasumbalesa in Chililabombwe, Chibombo road side
market, Kyawma in solwezi.
However cool chain facilities were noted in chain stores that also formed part of the study.

23
Further review revealed that Zambia imports a significant value of frozen vegetables from abroad for sale in local
chain stores. This is indicative of demand for frozen vegetables which can be an option in the event that demand
for vegetables has adversely fluctuated at a particular time for the traders at various markets around the country.
See table 2.0.0 below.
Table 2– Imports of Frozen Vegetables from 2010 to 2014
All values in USD’ 000s
Product 2010 2011 2012 2013 2014
Frozen Potatoes 326 657 1,172 2,013 2,742
Frozen spinach 0 2 2 2 2
Frozen sweet corn
9 13 22 12 16
Frozen Peas 42 57 67 67 69
Frozen beans 3 6 8 13 15
Frozen Vegies 41 90 110 37 35
Frozen mixed vegies
97 108 130 118 159
Total 518 933 1,511 2,262 3,038
Source: ITC Trade map
4.5. Lack of smart cultivation and irrigation technologies
The study revealed that smallholder farmers did not use modern cultivation and irrigation technologies in the
course of their farming activities.
All farmers interviewed in Luanshya, Chingola and Kalulushi did not use modern irrigation technologies such as drip
irrigation whilst 1 out of 20 farmers interviewed had drip irrigation technology in Mumena Solwezi. Farmers
physically carried water in containers from wells to the plots for irrigation.
Farmers were indifferent about use of hybrid seed mainly on account of cost of the seed in all areas covered in the
study.
In addition smallholder farmers used old traditional implements such as hand held hoes for their cultivation.
The above farming methods have further affected their cultivation areas and yields thereof. All farmers
interviewed showed low yields compared to the potential yields per hectare if good agriculture practices are
implemented and modern farming equipment are used.
Table 3.0.0 below shows average yields per hectare being achieved by smallholder farmers in the areas covered in
the study for the 4 most popular vegetable crops.

24
Table 3 – Yield Analysis per meter squared for 4 popular vegetable crops.
Vegetable Crop Actual Potential Variance/Loss
Tomato 5.6Kgs per m2 6.0Kgs per m2 0.4Kgs per m2
Okra 1.8Kgs per m2 3.0Kgs per m2 1.2Kgs per m2
Onion 0.5Kgs per m2 4.0Kgs per m2 3.5Kgs per m2
Cabbage 3 Head per m2 4 Heads per m2 1Head per m2
Source: Researchers computations from smallholder farmers
Enterprise budgets for the 4 vegetable crops above and others are show in appendix 3.
The study further revealed that smallholder farmers used very small plots for cultivation leading to difficulty in
meeting their fixed costs and perennially needing working capital finance and hence lacking in growth. This is
despite the high margins attained on most vegetable crops studied herein. Below is table 4.0.0 indicating analysis
of returns on the 4 popular vegetables.
Table 4 – Return analysis of vegetable crops
Vegetable Productivity Direct Costs/Ha(ZMW)
Gross Profit Margins
Profit/Ha(ZMW)
Tomato 5.6Kgs per m2 96,200 86% 120,760
Okra 1.8Kgs per m2 46,200 79% 169,800
Onion 0.5Kgs per m2 27,333 59% 39,333
Cabbage 3 Head per m2 14,420 28% 5,580
Source: Researchers computations from smallholder farmers
The study further revealed that Zambia has not been soil mapped on the general scale. The populace however
relies on generally agreed soil regional types and therefore match various crops to regions accordingly.
There are very few institutions offering soil testing services for individual farms and these have tended to take
long for results to be released.
4.6 Inadequate access finance and insurance
Some smallholder farmers in Kafubu farming block of Luanshya, Mugala in Kalulushi, Chongwe and Chibombo were
found to have access to credit finance for purchase of fixed equipment and for working capital support. Indications
of possible financial support were noted in Solwezi following inquiries by a microfinance institution.
All financial support has been made by microfinance institutions. Interviews with the commercial banks targeted
for this study revealed that there were no products designed to support smallholder farmers owing the level of risk
attached to this sector of farmers. The major source of risk sighted was the lack of business structures in the way
smallholder farmers operated. However commercial banks have been able to support the smallholder farmers
through clusters organized by other development institutions that guarantee credit advanced to those smallholder
farmers.

25
All smallholder farmers covered in this study did not have access to insurance either for their household’s goods
or their vegetable crops. Lack of knowledge in insurance products was noted across all smallholder farmers during
the study.
Some insurance companies did not have product offering for insuring vegetable crops for smallholder farmers
sighting issues of risk.
4.7 Uncoordinated market information
Despite Zambia attaining a penetration rate of over 85% for mobile phones communications, there is no robust
mobile phone trading platform where stakeholders such as smallholder farmers can check for prevailing market
prices and make informed decisions and make business deals before taking their goods to the market.
Significant variations exceeding 50% between preceding days have been the order the day leading to smallholder
farmers incurring large losses.
A pilot project by international development enterprise (IDE) whereby smallholder farmer could get prevailing
market prices on a daily basis has so far shown good results. Further results indicated that prior business deals
could be struck between some farmers in Chingola and sales agents at Kasumbalesa. The deals spelt out quantities
and prices beforehand.

26
CHAPTER FIVE
5.0 CONCLUSION AND RECOMMENDATIONS
5.1 Conclusion
Following review of the horticulture subsector through analysis of existing literature of past studies, reports from
government authorities, interviews with selected input and equipment suppliers, selected financial and insurance
institutions, formal and informal markets, processors, development institutions, large farmers and smallholder
farmers, the study has identified six(6) key areas of interventions that are likely to lead to job creation and
increased income levels in Zambia and the region.
Areas of interventions identified included; (1)capacity building of smallholder farmers to enhance their structural
organizations to effectively operate as businesses, (2) enhancement of farming production technologies, (3) market
infrastructure for enhanced product shelf life ad quality and hygiene, (4) access to finance and insurance
,(5)platforms for market information and (6) business and entrepreneurial skills development
The study also identified four value chains as the mostly engaged by smallholder farmers in the targeted areas
based on profitability and economic importance. These value chains are:
(i) The tomato value chain
(ii) The onion value chain
(iii) The okra value chain
(iv) The cabbage value chain
Other vegetables of economic importance in the target areas include;
(i) Rape
(ii) Water Mellon and
(iii) Carrots and
(iv) Indigenous vegetables
5.2 Recommendations
Hereunder are areas recommended for interventions that would catalyze development in the horticulture sub
sector in line with output (ii) and (vii) which sought to determine specific high potential value chain chains and
upgrading strategies for all stakeholders.
5.2.1 Smallholder farmer cluster development through incubation
In line with output (iii) and (iv) of this study, the smallholder farmer cluster development through incubation
provides support services required to rekindle the business fire in the value chains and addresses the risks and
major constraints faced by smallholder farmers.

27
The problem of a lack of production, business and entrepreneurship skills can best be addressed through the
development of clusters of about 40 farmers each and farmers incubated into entrepreneurial farmers.
The approach ensures handheld development of the smallholder farmers into business structures leading to better
production scheduling, record keeping and crop analysis among the key intentions.
It is envisaged that such an approach would ensure wealth creation through growth of their business, more direct
jobs created through increased production activities and incomes.
Development of a 40 farmer cluster is estimated to cost between USD330, 000 and USD405, 000. These costs
include trainings in production techniques, business management, entrepreneurship, set up management
structures for smallholder farmers and purchase of key equipment such as low cost irrigation kit and storage for
fresh produce (refer to appendix 1 for investment details).
5.2.2 Investment in soil testing equipment
Equally in line with output (iv) of this study, investment in soil testing equipment provides support services required
to addresses the risks of investing in a smallholder farmer whose soil status is not established.
Investment in soil testing equipment shall enhance reach to the widely spread Zambian farmers and match crop
varieties to particular soils for enhanced productivity, which is relatively very low against world standards.
Investment in a modern laboratory equipment from Soil Cares Limited would cost between USD190, 000 to
USD260, 000 including annual subscriptions to a web based database.
Under this business model, clients around the country can send soil samples in prescribed paper bags to a particular
hub and results report with clear interpretations sent back to clients within 48hours of receipt of samples.
Return on investments is estimated at about 40% with a payback of about 2 years. The investment would further
raise income of smallholder farmers across the country and create employment through increased yields as a result
of prior soil testing and advisory services on the best approach to cultivate the particular plot indicated on the
results report (refer to appendix 1 for investment details).
5.2.3 Set up and strengthening of processing facilities for value addition
Equally in line with output (v) of this study, investment in set up of processing facilities as well as strengthening the
existing ones would go a long way in streamlining processing as a major market for vegetable produce in Zambia.
Currently Freshpikt, one of the processors in Lusaka, has the capacity to take in 25 tons of tomatoes, onions and
chilies per day but currently not operating at full capacity due to insufficient supplies. This provides a very big
market opportunity for smallholder farmers if were linked to this processor. In addition, Rivonia requires between
3 to 5 tons per week of the same commodities, however the plant is equally insufficiently supplied.
With tomato ketchup and sauces imports standing at USD9.217million at 2014 and a growth trajectory, there is a
good market for processed vegetables in Zambia and the outside world. The growth in demand for downline

28
products say for tomato include its increasing and extensive use as food enrichers and the making of many fast
items like Pizzas, burgers and hotdogs.
Investment in a medium size tomato processing plant that can also process onion, carrots, fruit jam and chili with
a maximum capacity of 1500tons production per day would cost between USD1.475million and USD1.765million.
This estimate is inclusive of one yeas operating expenses such as labor and raw material costs.
Return on investments has been estimated in excess of 50% with a payback period of between 1 to 2 years.
Prices are high and volatile on the open market for fresh unprocessed tomato. This may indicate that an investor
into a vegetable processing plant should consider investing in production in order to mitigate risks to net earnings
that may arise from high tomato prices. Supplies from smallholder farmers is also expected to boost supplies to
the processing plant.
Investment in processing facilities also ensures market expansion for fresh vegetables and stability in prices due to
increased alternatives and lengthening of shelf life(refer to appendix 1 for investment details)..
5.2.4 Strengthening of wholesale market infrastructure with cold chain facilities
Equally in line with output (ii) , (iv) and (v) of this study, investment strengthening wholesale market infrastructure
with cold chain facilities and equipment provides high potential investment that addresses the risks related fresh
produce quality loss, enhancing competitiveness and creating formal market for smallholder farmers.
According to FSRP (2009), in a paper title Fruit and Vegetable Production, Marketing and Consumption in Zambia, 95% of
fresh fruits and vegetable were traded in the domestic markets. In the year 2014, Zambia exported vegetables with a total
value of US$12.6m, a total of quantity of 8,000metric tons. This means that the domestic market can be estimated to have
traded a total of 152,000 metric tons. According to Food Lovers’ market, smallholder vegetable farmers supply 10% of their
total vegetable requirement. It is therefore estimated that 90% of vegetables produced by smallholder farmers are traded
on the open market.
This means that a total value of Fresh vegetables are highly perishable and prices on the open market reduce the
longer the commodity is not purchased by retailers. Smallholder farmers are therefore in a hurry to dispose of
them for fear of making losses the longer the commodities stays on the market (Hichaambwa, & Munthali, 2015).
Investment into market infrastructures with cold chain facilities will help ease this problem and ensure smallholder
farmers get a good return on the investment. Shelf life for fresh vegetables would be enhanced and further provide
an alternative for freezing the vegetables for sale in other markets. At USD3.038million imports of frozen
vegetables at a growth trajectory of about USD500, 000 per year, the technology is being acceptable as a means to
preserve fresh vegetables.
Investment in a wholesale market infrastructure is estimated to cost between USD1.0million andUSD1.2million
with capacity to store 24000 tons per annum. The business model is such that the investor would charge a fee and
rentals for storage of the fresh vegetable and for further processing if the farmer opts for such.

29
Similar investments in the region (RSA) have yielded return on investments in excess of 40% with a payback of
about 2 years.
Other expected benefits include increased earnings for smallholder farmers arising from savings on price volatility
and reduced waste (refer to appendix 1 for investment details).
5.2.5 Market information system and trading platform
Lastly, in line with output (iii) of this study, investment in market information system and trading platforms would
addresses information flow and communication constraints which have haunted the smallholder farmers in many
areas. Smallholder farmers have not had opportunities to access information on prices for inputs, chemicals,
equipment, fertilizers and equipment. They are also denied information on new technologies and innovation which
would help them enhance their farm productivity. They equally do not have platforms they can use to disseminate
information about their produce.
Market information and trading platform would empower the smallholder farmers with information about
whether to take their goods to a particular market, enter prior deals before they transport the good to a market of
their choice and save on transport that they incur when they move goods speculatively to the market.
The investor in this system can build on the positive results from the Lima Link programme piloted by IDE.
Investment in such a platform is estimated to cost between USD270, 000 to USD365, 000. Return on Investment is
estimated at over 50% with a payback period between 2 and 3 years from revenues collected from subscription
fees and activity fees from a minimum of 14,000 farmer users.
Such an investment is expansionary in the fiscal space owing the savings and efficiency that may result from such
an establishment and lead to job creation and increased incomes (refer to appendix 1 for investment details).

30
REFERENCES
1. AgBIT/PARD II, 2015. Upgrading the groundnut value chain in Luapula Province. A value Chain analysis
Approach.
2. Heri S. (2005). Improving Export Processing Logistics and Documentation for the Horticulture Export Sector
3. Horticulture sub sector report Zimbabwe (2014) -Rural Agriculture Revitalization Program
4. Mbewe, (2012). Horticulture for export markets: challenges and opportunities. Zambia Export Growers
Association
5. Sergeant A. (2004). Horticultural and Floricultural Export. Constraints, Potential and an Agenda for Support
for the
Tanzania Diagnostic Trade Integration Study. Accord Associates LLP.
6. (2015). Can Horticultural Market Agents Play A Role in the Development of Cost-Effective and
Sustainable Price Information Systems. (Indaba Agricultural Policy Research Institute (IAPRI) Working
Paper September, 2015.
7. (2015). Is Smallholder Horticulture the Unfunded Rural Poverty Reduction Option in Zambia. Indaba
Agricultural Policy Research Institute (IAPRI) Working Paper May, 2015.
8. DAZ, 2015. Market study on Financial Opportunities in the Dairy Sector Zambia

31
APPENDICES
Appendix 1 – Investment opportunity analysis
1. Processing and value addition
Investment Type 1
Medium Size Tomato Sauce processing anchor firms(Can also process Onion, Carrot, Fruit Jam and Chili) - Capacity of 30 to 1500tons per day
Context Tomato is the most preferred horticultural crop among smallholder farmers in Zambia owing favorable climate and knowledge in production technology. It is grown throughout the year with some high and low supply cycles. Variations in supplies lead to volatility in prices on the open market and wastage, a major concern for smallholder farmers. There are very few companies involved in value addition of horticultural farm produce (including tomato) in Zambia which leaves the open market is the market uptake of horticultural commodities.
Costs Investment item Cost range Processing plant (Max 1500tons per day) 400,000 - $600,000 Materials – Tomato Supplies(Yr1 production @60% capacity) 1,000,000 - $1,100,000 Training on machinery use for 10 staff $15,000 - $25,000 Staff Costs(Yr One) – 10 operational staff $60,000 - $90,000 Total Investment $1,475,000 - $1,765,000
Performance Deliverables
Measure Range Return on Investment 100% - 150% Gross Profit Margin 50% - 60% Investment Payback period 1 - 2 years Social Impact on farmers: Market, jobs and income for over 400 smallholder farmers Savings of over $600 per smallholder farmer owing stability tomato selling price Foreign exchange savings on imported tomato paste. Zambia imports an average of $600,000 vinegar preserved tomato processed products annually.
Risks Risk description Criticality Likelihood H : High Volatility in FX market affecting export earnings H M M : Medium Low grade input materials affecting product quality H L L : Low Inconsistent raw material supplies affecting production and sales H M Competition from rival firms H L High interest rates affecting operating financing & profit margins H H Inconsistent power supplies H M
Policy Alignment
Policy Investment in line with government policy on economic diversification. Government has put incentives through the taxation regime (Low duty, life of tax assets on balance sheet).

32
2. Farmer cluster development
Investment Type 2
Smallholder Farmer Cluster Development through Incubation(40 farmers/cluster)
Context Production of consist and high quality vegetables requires development of production skills and farmer coordination. Smallholder Farmers require to be mobilized and structured into clusters were training in production techniques, business management, entrepreneurship and quality management would be delivered. Aggregation of produce for high returns is also made possible if bulk selling is done through such avenues.
Costs Investment item Cost range Drip Irrigation kit(overhead tank, drip tapes, treadle pump) $200,000- $250,000 Processing plant (Max 1500tons per day) $110,000 - $130,000 Linkage(facilitation) to finance, markets, suppliers – Yr1 $20,000 - $25,000 Total Investment $330,000 - $405,000
Performance Deliverables
Measure Range Return on Investment 20% - 50% Gross Profit Margin 50% - 75% Investment Payback period 3 - 4 years Social Impact on farmers: Market, jobs and income for over smallholder farmers leading poverty reduction Sustainable Horticulture business eco-system
Risks Risk description Criticality Likelihood H: High Inconsistent raw material supplies affecting production and sales H M M: Medium Competition from rival firms H L L : Low High interest rates affecting operating financing & profit margins H H Inconsistent power supplies H M
Policy Alignment
Policy Investment in line with government policy on economic diversification. Government has put incentives through the taxation regime (Low duty, life of tax assets on balance sheet).

33
3. Soil fertility management
Investment Type 3
Set up of latest Soil Testing Laboratory(Both Fixed and Mobile)
Context Zambia has not been soil mapped on the general scale. The populace however relies on generally agreed soil regional types and therefore match various crops to regions accordingly. There are very few institutions offering soil testing services for individual farms and these have tended to take long for results to be released. Investment in soil testing equipment shall enhance reach to the widely spread Zambian farmers and match crop varieties to particular soils for enhanced productivity, which is relatively very low against world standards.
Costs Investment item Cost range Soil Testing Laboratory Equipment (Supplier – Soil Cares Kenya) $90,000 - $110,000 Operating Costs(Subscription fees, maintenance, staff) Yr1 $100,000 - $150,000 Total Investment $190,000 - $260,000
Performance Deliverables
Measure Range Return on Investment 30% - 40% Gross Profit Margin 15% - 25% Investment Payback period 1 - 2 years Social Impact on farmers: Significantly raise yields leading to improved incomes and poverty reduction Create employment through increased yields across the country
Risks Risk description Criticality Likelihood H : High Volatility in FX market affecting operating costs of facility H M M : Medium Competition from rival firms H L L : Low High interest rates affecting operating financing & profit margins H H Inconsistent power supplies H M
Policy Alignment
Policy Investment in line with the Zambian government policy to create a smart economy. Government has an also put incentives through the taxation regime (Low duty, life of tax assets on balance sheet).

34
4. Market information systems
Investment Type 5
Set up of an integrated Market Information System Platform firm
Context Smallholder farmers have for a long time now been taking their goods to Zambia’s major markets without knowing the prevailing prices. Significantly large variations between commodity prices of proceeding days have been the order of the day. This has led to smallholder farmers incurring large losses on their investments. With mobile phone penetration of over 85% Zambia is ripe for a mobile technology trading platform to ensure smallholder farmers access prevailing market conditions, make prior deals and hence make informed decisions.
Costs Investment item Cost range Software & System Development $100,000-$150,000 Linkage to ICT platform - e.g. Airtel, MTN $80,000-$100,000 Link to content providers - Short Code owners $80,000-$100,000 Marketing $10,000 - $15,000 Total Investment $270,000 - $365,000
Performance Deliverables
Measure Range Return on Investment 100% - 150% Gross Profit Margin 20% - 30% Investment Payback period 1 - 3 years Social Impact on farmers: Stable and predictable income for smallholder farmers Efficiency in the market information system for smallholder farmers shall to make informed decisions.
Risks Risk description Criticality Likelihood H : High Poor internet and mobile network connectivity H L M : Medium Low participation by stakeholders H L L : Low High interest rates affecting operating financing & profit margins H H Inconsistent power supplies H M
Policy Alignment
Policy Investment in line with government policy for a smart economic. Government has also put incentives through the taxation regime (Low duty, life of tax assets on balance sheet).

35
5. Market infrastructure and Cold Chain facilities
Investment Type 6
Set up of structured market infrastructure and Cooled Chain facilities
Context Zambia does not have a well-structured market facility to which smallholder farmers can deposit their fresh horticultural produce before being bought by consumers. Significant quantities of horticulture produce have been wasted in the process at many vegetable markets at major cities especially during times of increased supply. Investment in market infrastructure with cool chain facilities would help smallholder farmers attain better prices without loss of quality of produce. Such a facility would help smallholder farmers keep record of transactions which would help build their business profiles.
Costs Investment item Cost range Physical Infrastructure(Max 24000tons per annum) $900,000 - $1,000,000 Information System Infrastructure $30,000 - $40,000 Training Costs on use and maintenance of infrastructure $15,000 - $25,000 Staff Costs for 15 staff(Yr One) $60,000 - $90,000 Total Investment $1,005,000 - $1,155,000
Performance Deliverables
Measure Range Return of Investment 40% - 60% Gross Profit Margin 50% - 75% Investment Payback period 1 - 2 years Social Impact on farmers: Market, jobs and income for over thousands of smallholder farmers Savings owing stability in horticultural selling price Better transparency, quality and hygiene for both the local and international market.
Risks Risk description Criticality Likelihood H : High Volatility in FX market affecting export earnings H M M : Medium Low grade input materials affecting product quality H L L : Low Inconsistent raw material supplies affecting production and sales H L Competition from rival firms H L High interest rates affecting operating financing & profit margins H H Inconsistent power supplies H M
Policy Alignment
Policy Investment in line with government policy on economic diversification and local production of currently imported commodities. Government has also put incentives through the taxation regime (Low duty, life of tax assets on balance sheet).

36
Appendix 2: Enterprise Budgets for the four major vegetables and other crops commonly grown in the target
areas
Crop Tomato
Variety Tengeru
Plot Size 2500m2
Input Quantity Unit Cost – K Total Cost - K
Seed(25 Kgs bag) 1 60 60
Fert - Basal(50Kgs bag) 2 420 840
Fert. –Top(50Kgs bag) 2 420 840
CAN(50Kgs bag) 1 420 420
Insecticide(Liters) 6 75 450
Director labor 2,500
Total Cost 4,800
Output
Boxes 700 50 35,000
Kgs 14,000
Yield-Kgs/m2 5.6
Potential Yield/m2 6
Key Ratios
Gross Profit(K) 30,190
Gross Profit Margin 86%
Growing period-Months 4
Gross profit per month (K) 7,548

37
Crop Okra
Variety Clemson spineless
Plot Size 500m2
Input Quantity Unit Cost – K Total Cost – K
Seed(1 Kg bag) 1 220 220
Fert - Basal(50Kgs bag) 1 420 420
Fert. –Top(50Kgs bag) 1 420 420
Fungicides(Kgs) 3 80 240
Insecticide(100mls) 10 20 200
Director labor 600
Total Cost 2,310
Output
Bags 36 300 10,800
Kgs 900
Yield-Kgs/m2 1.8
Potential Yield/m2 3
Key Ratios
Gross Profit 8,490
Gross Profit Margin 79%
Growing period –months 5
Gross profit per month(K) 1,698

38
Crop Carrot
Variety Kuroda
Plot Size 500m2
Input Quantity Unit Cost – K Total Cost – K
Seed(250g bag) 1 85 85
Fert - Basal(50Kgs bag) 1 420 420
Fungicides(Kgs) 3 60 180
Weed killer(bags) 1 50 50
Director labor 600
Total Cost 1,735
Output
Kgs 750 4 3,000
Yield-Kgs/m2 1.5
Potential Yield/m2 3
Key Ratios
Gross Profit 1,265
Gross Profit Margin 42%
Growing period –months 3
Gross profit per month(K) 422
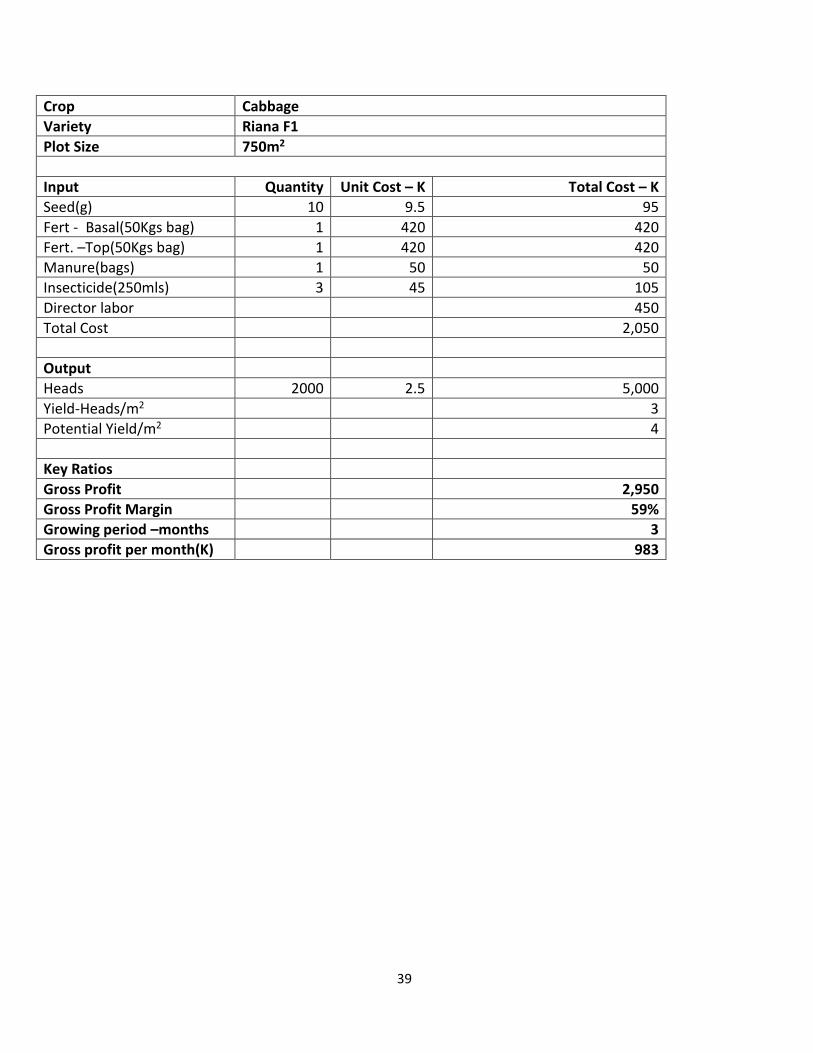
39
Crop Cabbage
Variety Riana F1
Plot Size 750m2
Input Quantity Unit Cost – K Total Cost – K
Seed(g) 10 9.5 95
Fert - Basal(50Kgs bag) 1 420 420
Fert. –Top(50Kgs bag) 1 420 420
Manure(bags) 1 50 50
Insecticide(250mls) 3 45 105
Director labor 450
Total Cost 2,050
Output
Heads 2000 2.5 5,000
Yield-Heads/m2 3
Potential Yield/m2 4
Key Ratios
Gross Profit 2,950
Gross Profit Margin 59%
Growing period –months 3
Gross profit per month(K) 983
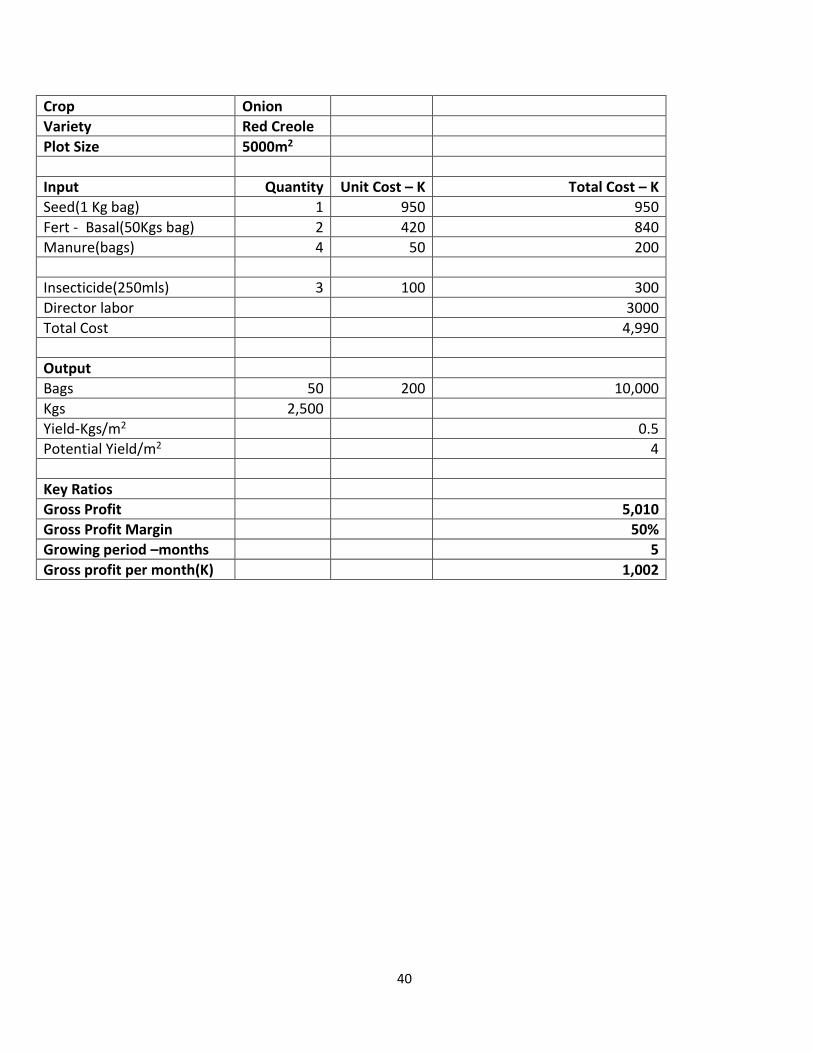
40
Crop Onion
Variety Red Creole
Plot Size 5000m2
Input Quantity Unit Cost – K Total Cost – K
Seed(1 Kg bag) 1 950 950
Fert - Basal(50Kgs bag) 2 420 840
Manure(bags) 4 50 200
Insecticide(250mls) 3 100 300
Director labor 3000
Total Cost 4,990
Output
Bags 50 200 10,000
Kgs 2,500
Yield-Kgs/m2 0.5
Potential Yield/m2 4
Key Ratios
Gross Profit 5,010
Gross Profit Margin 50%
Growing period –months 5
Gross profit per month(K) 1,002

41
Crop Water Melon
Variety Crimson sweet
Plot Size 4900m2
Input Quantity Unit Cost – K Total Cost – K
Seed(500g bag) 1 300 300
Fert - Basal(50Kgs bag) 2 420 840
Fert. - Top(50 Kgs bags) 1 420 420
Fungicides(Kgs) 15 80 1,200
Insecticide(lts) 6 100 600
Director labor 1500
Total Cost 5,610
Output
Tons 14 1430 20,020
Kgs 14000
Yield-Kgs/m2 3
Potential Yield/m2 4
Key Ratios
Gross Profit 14,410
Gross Profit Margin 72%
Growing period –months 3
Gross profit per month(K) 4,803

42
APPENDIX 3: Key informants checklists
KEY INFORMERS CHECKLISTS
1. Ministry of Agriculture and Livestock (MAL)
Targets: Director of Agriculture
What specific policies has the ministry developed to support horticulture subsector in Zambia?
What challenges do smallholder horticulture producers face in Zambia?
What Opportunities (low hanging fruits) exist in the subsector for smallholder farmers?
What are the major costs incurred by small holder farmers in Zambia?
What are the commonly used markets and distribution channels for smallholder horticulture
farmers in Zambia?
What role do you play in the development of markets and distribution channels?
2. Central Statistical Office
Target: Principal Statistician
Volumes and values of local horticultural sales
Volume and values of horticultural exports
Volumes and Values of horticultural imports
Rural livelihood survey data
Price information
3. Zambia Development Agency
Target: Director, Enterprise Development
Which areas of agribusiness investment has Zambia received?
What role is the agency playing in attracting agribusiness investment in the horticulture
subsector?
What investments is the agency projecting in the next 5 years in the horticulture subsector?
What investment opportunities exist in the agribusiness supply chain and particularly the
horticultural subsector for local and foreign investors?
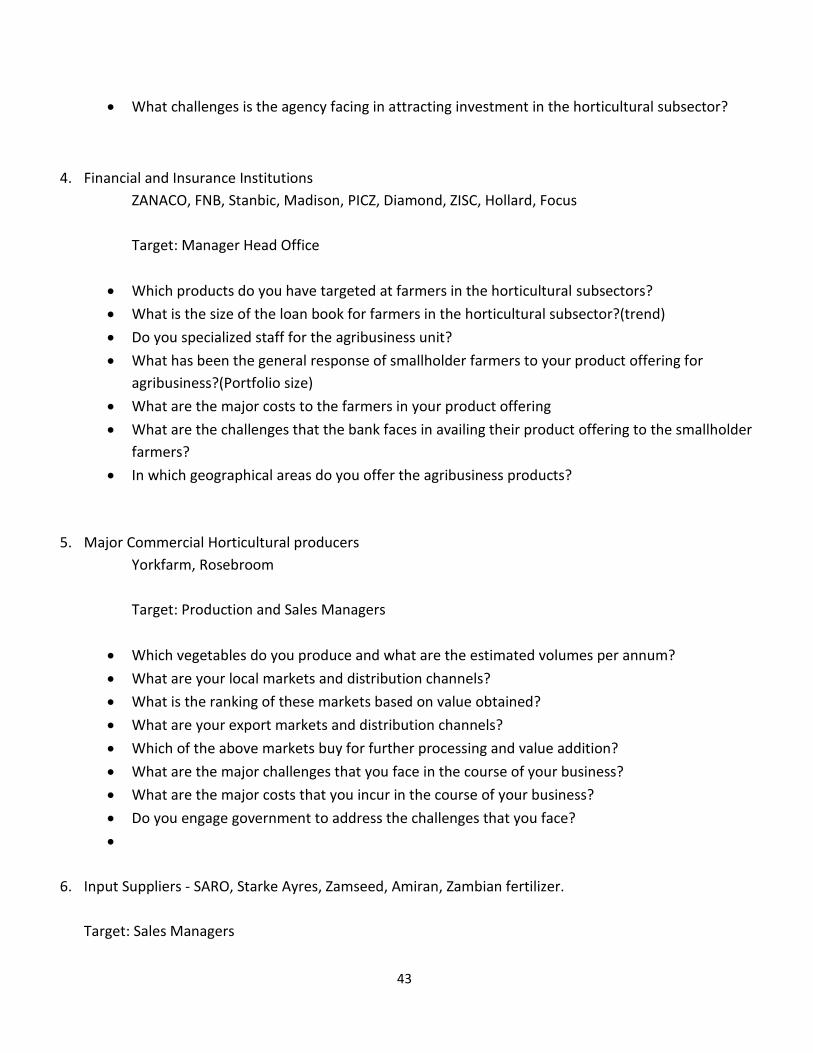
43
What challenges is the agency facing in attracting investment in the horticultural subsector?
4. Financial and Insurance Institutions
ZANACO, FNB, Stanbic, Madison, PICZ, Diamond, ZISC, Hollard, Focus
Target: Manager Head Office
Which products do you have targeted at farmers in the horticultural subsectors?
What is the size of the loan book for farmers in the horticultural subsector?(trend)
Do you specialized staff for the agribusiness unit?
What has been the general response of smallholder farmers to your product offering for
agribusiness?(Portfolio size)
What are the major costs to the farmers in your product offering
What are the challenges that the bank faces in availing their product offering to the smallholder
farmers?
In which geographical areas do you offer the agribusiness products?
5. Major Commercial Horticultural producers
Yorkfarm, Rosebroom
Target: Production and Sales Managers
Which vegetables do you produce and what are the estimated volumes per annum?
What are your local markets and distribution channels?
What is the ranking of these markets based on value obtained?
What are your export markets and distribution channels?
Which of the above markets buy for further processing and value addition?
What are the major challenges that you face in the course of your business?
What are the major costs that you incur in the course of your business?
Do you engage government to address the challenges that you face?
6. Input Suppliers - SARO, Starke Ayres, Zamseed, Amiran, Zambian fertilizer.
Target: Sales Managers

44
Which products do you have targeted at farmers in the horticultural subsectors?
What is the size of the portfolio of smallholder farmers in the horticultural subsector that you
support? (
Do you specialized staff for the agribusiness unit?
What has been the general response of smallholder farmers to your product offering for
agribusiness?(Portfolio size)
What are the costs to the farmers for producing 1 lima of a product?
What are the challenges that your company faces in availing their product offering to the
smallholder farmers?
In which geographical areas do you offer the agribusiness products?
Do you engage government and other stakeholder to address the challenges that you face in your
line of business?
7. Agri based service Organisations – ASNAP, MUSIKA, IDE, ZNFU, NUSSFZ
Target: Programme Managers
Which services do you have targeted at farmers in the horticultural subsectors?
What is the size of the portfolio of smallholder farmers in the horticultural subsector that you
support?
Do you specialized staff for the agribusiness unit?
What has been the general response of smallholder farmers to your service offering for
agribusiness?
What are the costs to the farmers for producing 1 lima of a product?
What are the challenges that you face as an organisation working with smallholder farmers?
In which geographical areas do you offer the agribusiness services?
Do you engage government and other stakeholders to address the challenges that you face
working with smallholder farmers?
8. Markets (formal and informal) – Freshmark, Food lovers, Pick N Pay, Intercontinental, Pamodzi, ATS,
Kasumbalesa, Nyangulu (Elias contact) representatives from SOWETO Open market, Mutendere, Kabwata,
Chawama.
Target: Buyers and Trader representatives

45
Which vegetables do you the smallholder farmers supply you and what are the estimated volumes
per annum?
Which areas do the smallholder farmers that supply you come from?
What is the ranking of these areas based on volumes and quality of the produce?
Which new high value vegetables do you recommend for production by smallholder farmers?
Who are you major customers?
What are the major challenges that you face in handling smallholder farmers and what do you
recommend for improvement?
9. Processors – Freshpikt, Rivonia, Ronipam
Target: Buyers and Sales Managers
Which vegetables do you the smallholder farmers supply you and what are the estimated volumes
per annum?
Which areas do the smallholder farmers that supply you come from?
What is the ranking of these areas based on volumes and quality of the produce?
Which new high value vegetables do you recommend for production by smallholder farmers?
Who are you major customers?
What are the major challenges that you face in handling smallholder farmers and what do you
recommend for improvement?

46
Appendix 4: Farmer questionnaire
N.B.: Decisions on average occurring variables and values were determined by probing during the focus group discussions (FGDs) held in the targeted areas along the line of rail (Refer to methodology in Chapter 3) Introduction Dear Sir/Madam,
AgBIT in collaboration with SNV and AgriProFocus is conducting a study whose ultimate aim is to map and quantify
investment opportunities in the horticulture sub sector and associated market channels in terms of potential for
scalability, viability, smallholder farmer participation, private sector investment, social impact agency participation
for job creation, and increased incomes.
In order to fulfill this mandate a survey has been designed to collect data and information which will inform the
study findings. You have been randomly selected as one of the people to participate in this study by way of
responding to this questionnaire. We would like to ask you to answer questions contained in this questionnaire
and we promised that all the information you will provide shall be treated as confidential and shall only be used
for the purpose of informing this study. Please feel free to decline if you feel uncomfortable in any way but you
help change many lives by participating in this exercise. Thank you so much for your time.
Section A: Socio demographic data Name of farmer: --------------------------------------------------------- Name of coop/association: ------------------------------------------- Town/area: ------------------------------------------------------------ Age: Gender: Family size:
47
Section B: Production and marketing data
TOR #1: Identify the major actors in the horticulture sub sector supply chains, their functions and how they relate
with other actors.
(a) List organizations/companies including the role they play in your vegetable enterprise(s)?
Actor Role
Value chain 1 ---------------------------------------------- ------------------------------------------
Value chain 2 ------------------------------------------- ---------------------------------------------
Value chain 3 ---------------------------------------------- ------------------------------------------
Value chain 4 --------------------------------------------- ------------------------------------------
Value chain 5 ----------------------------------------------- -----------------------------------------
(b) List vegetable value chains/ enterprises in which you are economically and actively involved as a farmer/producer? Please rank in order of importance based on return on investment or profitability.
---------------------------------------------------------------
---------------------------------------------------------------
---------------------------------------------------------------
---------------------------------------------------------------
---------------------------------------------------------------
(c) Which vegetable value chains/ enterprises do you view as high value with high returns and as low hanging fruits? Please provide justification for your choice of value chains. ---------------------------------------------------------------
---------------------------------------------------------------

48
---------------------------------------------------------------
---------------------------------------------------------------
---------------------------------------------------------------
(d) Identify the constraints and opportunities in each value chain – related to organization and management,
production, input/raw material supply, access to technology, market access, and finance
Constraint Opportunity
Value chain 1 ---------------------------------------------- ----------------------------------------------
Value chain 2 -------------------------------------------- ------------------------------------------------
Value chain 3 --------------------------------------------- -----------------------------------------------
Value chain 4--------------------------------------------- ------------------------------------------------
Value chain 5 ----------------------------------------------- ----------------------------------------------
TOR #2: Identify segments/thematic area in the Horticulture value chain where the best investment or
financing opportunities exist (such as processing, transportation, input supply etc.), providing benchmarks in
comparison with other Sub-Sahara African countries.
(a) As an enterprising farmer/producer, kindly rank value chains within the agricultural supply chains with the
best investment or financing opportunities based on market demand and returns with reference to
processing, input supply and transport service. Please justify your choices
1. ----------------------------------------------------
2. ----------------------------------------------------
3. ---------------------------------------------------
4. ---------------------------------------------------
5. ----------------------------------------------------
(b) Using the ranking in (a), kindly provide detailed analysis of the return on investment on the three most
profitable or high potential vegetable value chains
49
1. Value chain 1 (ROI)-----------------------------------
2. Value chain 2 (ROI)-----------------------------------
3. Value chain 3 (ROI)-----------------------------------
4. Value Chain 4 (ROI)-----------------------------------
5. Value Chain 5 (ROI)------------------------------------
(c) Identify financial and resource needs of farmers and SMEs required for primary production and value
addition within the value chains.
Value chain resources
1. -------------------------------------------------- ----------------------------------------------
2. -------------------------------------------------- -----------------------------------------------
3. ------------------------------------------------- ------------------------------------------------
4. -------------------------------------------------- -----------------------------------------------
5. ------------------------------------------------- ------------------------------------------------
TOR #3: Identify other needs and services required to take advantage of the investment opportunity
(transportation, aggregation, insurance, business development services, entrepreneurial skills, financial literacy,
etc.).
(a) Kindly rank major needs and service given above in order of importance. Please remember ranking with
emphasis on which need or services would help you transform your vegetable business faster.
------------------------------------------------------------------
-----------------------------------------------------------------
------------------------------------------------------------------
-----------------------------------------------------------------
------------------------------------------------------------------
(b) Would you please separately indicate if you have insured your vegetable business and associated assets
---------------------------------------------------
---------------------------------------------------
(c) Please state the insurance company and the type of insurance policy you pursued.

50
Insurance Company ---------------------------------------------------------
Insurance policy --------------------------------------------------------------
(d) If not participating in any agricultural insurance policy, would you insure your vegetable business if
insurance providers were available?
----------------------------------------------------------------------
---------------------------------------------------------------------
(e) Which type or form of insurance policy you would you participate in?
----------------------------------------------------------------------
----------------------------------------------------------------------
TOR # 4: Identify and quantify major horticulture market channels that can be developed for smallholder farmer
participation.
(a) List current major distribution and market channels available to your business
----------------------------------------------------
----------------------------------------------------
-------------------------------------------------------
--------------------------------------------------------
------------------------------------------------------
(b) List potential distribution and market channels you view as lucrative for your vegetable business which you currently do not have access to. ---------------------------------------------- ----------------------------------------------- ----------------------------------------------- -------------------------------------------------- -------------------------------------------------
(c) Give reasons as to why you do not have access to these channels
51
--------------------------------------------------- -------------------------------------------------- -------------------------------------------------- -------------------------------------------------- -------------------------------------------------- -------------------------------------------------
TOR # 5 Vegetable cost and revenue analysis based on 1 lima production area-- (profitability analysis).
(a) Cost analysis.
Inputs/raw materials Labor
Value chain 1: ZMK -------------------------- -------------------------------------
Value chain 2: ZMK ------------------------------ -------------------------------
Value chain 3: ZMK -------------------------------- -------------------------------
Value chain 4: ZMK -------------------------------- -------------------------------
Value chain 5: ZMK ------------------------------- -------------------------------
(b) Revenue analysis
Value chain 1: ZMK --------------------------
Value chain 2: ZMK ------------------------------
Value chain 3: ZMK --------------------------------
Value chain 4: ZMK --------------------------------
Value chain 5: ZMK -------------------------------

52
Appendix 5 – Demographic of smallholder study participants
Area Male Female Total Age
Kafubu farming block - Luanshya 4 4 8 41
Mugala farming block - Kalulushi 11 11 22 41
Kalima-Nsenga - Chibombo 20 6 26 50
Shimabila Mumena - Solwezi 4 7 11 46
Kyabankaka Agric Camp- Solwezi 5 10 15 50
Luankole A & B – Chingola 9 5 14
Chongwe 14 6 20
IDE Officers 3 2 5
Totals 70 51 121

53

54