homelessness in manitoulin-sudbury: 2018 …phases of the study, such as liaison with agency...
TRANSCRIPT

HOMELESSNESS IN MANITOULIN-SUDBURY:
2018 ENUMERATION
Report prepared for
the Manitoulin-Sudbury District Services Board
August 2018
Carol KAUPPI, Ph.D.
Henri PALLARD, LL.B., Doct.
Emily FARIES, Ph.D.
Phyllis Montgomery, Ph.D.
Michael Hankard, Ph.D.
29 August 2018
Centre for Research in Social Justice and Policy
Laurentian University


How to cite this document: Carol KAUPPI, Henri PALLARD, Emily FARIES, Phyllis MONTGOMERY, Michael HANKARD. (2018). Homelessness in Manitoulin-Sudbury: 2018 Enumeration. Report prepared for the Manitoulin-Sudbury District Services Board, August 2018. Centre for Research in Social Justice and Policy, Laurentian University, Sudbury, Ontario. This study was funded in part by the Social Sciences and Humanities Research Council and the Manitoulin-Sudbury District Services Board.
Poverty, Homelessness and Migration Pauvreté, sans-abrisme et migration
Centre for Research in Social Justice and Policy
Laurentian University 935 Ramsey Lake Road
Sudbury ON P3E 2C6
Tel. 705-675-1151, ext. 5156 Fax 705-671-3832
www.lul.ca/homeless
Centre de recherche en justice et politique sociales Université Laurentienne 935, chemin du lac Ramsey Sudbury (Ontario), P3E 2C6 Tél. 705-675-1151, poste 5156 Télec. 705-671-3832 [email protected] www.lul.ca/sansabri


iii
Acknowledgments
This project was conducted to enumerate the homeless population in the Manitoulin-
Sudbury District. As the Province of Ontario had passed legislation to require the collection of
data, the project involved as many agencies and organizations in the towns studied. It involved
a research team comprising over 20 people as well as staff in numerous participating agencies
who facilitated the research or collected information for the survey. Nineteen organizations
participated in the study by allowing the research to take place in the organization. The
contributions of many people ensured the success of this project.
First and foremost, we pay tribute to the participants of the study, who were unhoused,
homeless, living with hidden homelessness or at risk of becoming homeless and who shared
information about their circumstances by participating in the survey.
Second, the assistance of service providers and agency personnel was vital in enabling
this project to be completed successfully. They assisted in many ways, such as facilitating
recruitment, providing access to their clients and collecting information for the study.
Third, staff of the Centre for Research in Social Justice and Policy and students from
various schools and departments at Laurentian University—most notably the School of Social
Work, the Department of Law and Justice, the Department of Economics, Faculty of
Management and the School of Nursing—made essential contributions by assisting with many
phases of the study, such as liaison with agency personnel, project planning, data collection,
data entry and analysis. College students also worked on the project team as did many
community members. People who were from participating communities in the Manitoulin-
Sudbury District were recruited to work on the enumeration project.
This study was supported by funding from the Manitoulin-Sudbury District Services
Board and the Social Sciences and Humanities Research Council of Canada. The research is
the responsibility of the authors of the report and the findings do not necessarily reflect the
views of the funders.

iv

v
Table of contents
Acknowledgements ................................................................................................................................... iii
Table of contents ........................................................................................................................................ v
Executive summary .................................................................................................................................. vii
1.0 Background and Definitions of Homelessness ............................................................................. 1
2.0 Objective ............................................................................................................................................ 3
3.0 Methodologies for Counting and Studying Homelessness.......................................................... 3
4.0 Conducting a Survey or Count of Homeless Persons .................................................................. 4
4.1 Ethics Approvals ....................................................................................................................... 4 4.2 Qualifications and Experience of the Research Team ............................................................. 5 4.3 Geographic Area ...................................................................................................................... 6 4.4 Data Collection Tool ................................................................................................................. 6 4.5 Data Collection Procedures ...................................................................................................... 6 4.6 Timeframe for the Study ........................................................................................................... 9 4.7 Unduplicated Count .................................................................................................................. 9
5.0 Results ............................................................................................................................................... 9
5.1 Number of Participants ............................................................................................................. 9 Number of participants and dependent children in custody .............................................. 10
5.2 Results for Specified Data Points ........................................................................................... 11 5.3 Demographic Results ............................................................................................................. 12 5.4 Chronic and Episodic Homelessness ..................................................................................... 15 5.5 Experiences of Housing or Shelter ......................................................................................... 17 5.6 Reasons for Homelessness .................................................................................................... 19 5.7 Family Homelessness ............................................................................................................ 20 5.8 Health Issues ......................................................................................................................... 21 5.9 Experiences of Child Welfare or Foster Care ......................................................................... 22 5.10 Income Sources ..................................................................................................................... 24 5.11 Participants’ Needs ................................................................................................................ 25 5.12 Recommendations arising from the findings .......................................................................... 27
Emergency services .......................................................................................................... 27 Basic needs ....................................................................................................................... 28 Housing ............................................................................................................................. 28 Trauma and counselling .................................................................................................... 28 Domestic violence ............................................................................................................. 29 Indigenous people ............................................................................................................. 29 Mental illness .................................................................................................................... 29 Physical illness .................................................................................................................. 29 Income supports ................................................................................................................ 29 Food security ..................................................................................................................... 30

HOMELESSNESS IN MANITOULIN-SUDBURY: 2018 ENUMERATION
vi
Forms of homelessness .................................................................................................... 30 Public education ................................................................................................................ 30
5.13 Incorporation of the Database into the PPC Database .......................................................... 30
6.0 Discussion and Conclusion ........................................................................................................... 30
References ........................................................................................................................................ 34
Tables
Table 1: Number of unduplicated individuals in the Period Prevalence Count ............................................. 9
Table 2: Number of participants in regions of the Manitoulin-Sudbury Distrcit ........................................... 10
Table 3: Age, cultural background, sexual orientation and military service by type of homelessness ........................................................................................................... 11
Table 4: Current lodging/homelessness ..................................................................................................... 17
Table 5: Reasons for homelessness ........................................................................................................... 19
Table 6: Sources of income ........................................................................................................................ 24
Table 7: Need for services .......................................................................................................................... 25
Table 8: General needs ............................................................................................................................... 26
Figures
Figure 1: Percentage experiencing types of homelessness by linguistic/cultural groups ........................... 13
Figure 2: Percentage of people experiencing types of homelessness by gender identity ............................. 14
Figure 3: Number of people experiencing chronic and episodic homelessness by type of homelessness................................................................................................................ 15
Figure 4: Experience of chronic and episodic homelessness ..................................................................... 16
Figure 5: Number of participants indicating family homelessness by type of homelessness ........................................................................................................... 20
Figure 6: Number of participants indicating health issues by type of homelessness ................................. 21
Figure 7: Percentage of participants indicating one or more health issues ................................................ 22
Figure 8: Percentage experiencing child welfare by type of homelessness ............................................... 22
Figure 10: Mean number of months after leaving care before becoming homeless by type of homelessness ........................................................................................................... 23
Appendix
Housing and homelessness in northeastern Ontario 2018 Mandatory questions for the province of Ontario ........................................................................... 35

vii
HOMELESSNESS IN THE MANITOULIN-SUDBURY DISTRICT:
2018 ENUMERATION
Executive Summary
OBJECTIVE
The objective of the enumeration project was to obtain information about the number, socio-demographic/linguistic characteristics, histories of homelessness and prior experiences of homeless persons. The enumeration study was conducted in a manner consistent with the requirement of the Province of Ontario to conduct project to count the number of people living with homelessness within every district in the province. It is linked to the objectives of the Province of Ontario to end homelessness in Ontario and, specifically, to end chronic homelessness by 2025. It is intended to help Service Managers and the Ministry of Housing to better understand the extent and nature of homelessness and to guide policy and program design.
METHODOLOGY
The enumeration project was conducted by following the guidelines for a period prevalence count (PPC) of homeless persons, including a count of chronically and episodically homeless people. The PPC method is based on the guide, Period Prevalence Counts of People Experiencing Homelessness: A Guide for Rural and Northern Communities (Kauppi, 2017). Data were collected from people experiencing forms of homelessness and hidden homelessness using a structured questionnaire, which includes all mandatory questions identified and specified by the Government of Ontario, in order to gather information from them regarding forms of homelessness. A service-based methodology was used to conduct a period prevalence count (PPC) for the current study because it captures most of the homeless population.
CONDUCTING THE SURVEY
Ethics approval was obtained from the Laurentian University Research Ethics Board. The study sought to include the largest towns within various regions of the catchment area of the Manitoulin-Sudbury District Services Board (Manitoulin-Sudbury DSB). The 2018 period prevalence count involved data collection in Espanola, Little Current, Mindemoya, Noëlville;Markstay, Chapleau and Foleyet. The decision about locations was made following a consultation with the Manitoulin-Sudbury DSB and service providers in the fall of 2017 and in early 2018. The PPC project followed the Ministerial Directive and the Provincial Guidelines for Homelessness Enumeration. It was completed in a manner that addressed all provincial requirements. The Manitoulin-Sudbury District covers a vast region, providing services to residents in an area comprising more than 45,000 square kilometres. As per the provincial

viii
HOMELESSNESS IN MANITOULIN-SUDBURY: 2018 ENUMERATION
requirement, the study covered regions of the Manitoulin-Sudbury District in which a minimum of 30 percent of the total population resides (the study exceeded the minimum requirements by covering about 46% of the catchment population in regions in which close to 16,000 people were living. (More precisely, the population of the areas studied was 15,692 which is 56% of 28,107, the total population of the Manitoulin-Sudbury District).
The data collection instrument to be used included the required questions specified by the Province of Ontario. Information regarding background, experiences and types of homelessness was gathered from people living with absolute and hidden homelessness as well as the risk of homelessness using a structured questionnaire. The data collection instrument allowed for the identification of duplicate cases and, if found, the exclusion of duplicates. The research team worked with local service providers in the Manitoulin-Sudbury District in order to create an accurate snapshot of the homeless population.
The PPC was conducted at agencies or services from April 16th to 22nd. Data collection proceeded at the food bank in Markstay on April 12th, the date it was open in April.
RESULTS
Number of Adult and Youth Participants • The number of questionnaires completed by adults or youth in the PPC study was 122. A
check based on de-duplication information collected showed that there were no duplicatecases (i.e., no one completed the survey more than once). In addition, there were 35dependent children under the age of 18, of whom participants had custody, for a total countof 157. The number of participants and children is based on three groups: 1) absolutelyhomeless (n=24), 2) hidden homelessness (n=57), and those who were at risk ofhomelessness (n=76).
• Half of the surveys were completed on Manitoulin Island (53%) followed by Espanola (24%),Sudbury North (Chapleau and Foleyet, 20% and Sudbury East (3%). Cold weather andother factors hampered data collection in Sudbury East.
Demographic Results • As we have consistently found in prior studies in northeastern Ontario, Indigenous people
(including First Nations and Métis) were present within the study sample in proportionsgreater than their numbers in the total population of the Manitoulin-Sudbury district,according to 2016 census data (Statistics Canada, 2017). Indigenous people werereportedly 26.3 percent of the population but they comprised 52.2 percent (n=57, excludingchildren) of the participants who provided information about their Indigenous ancestry for thestudy. Among those who were absolutely homeless, Indigenous people, including FirstNation, Métis or Inuit, constituted close to two-thirds (65.0%) of this subsample. Indigenouspeople were the largest subgroup amongst those who were living with hidden homelessness(47.9). They also made up about half of those who were at-risk of homelessness (48.9%).
• The number of young people up to age 24 was 16; these youth were not connected to afamily unit when they participated in the survey. Of these, three were absolutely homeless.

HOMELESSNESS IN MANITOULIN-SUDBURY: 2018 PERIOD PREVALENCE COUNT
ix
• Women (n=60) comprised 50.9 percent of those who indicated their gender as male or female; men (n=53) comprised 44.9 percent of this sample. Persons who self-identified their gender as two-spirit, transwoman, transman or not listed/don’t know comprised 4.7 percent of the participants based on self-reports of gender identity.
• Regarding sexual orientation, 96 percent of participants self-reported that they identified as heterosexual while 4 percent indicated that they identified as LGBTQ2S.
• The number of people with backgrounds involving military service who participated in the survey was 8. One of these participants was absolutely homeless, another was living with hidden homelessness and five were at-risk.
Chronic and Episodic Homelessness • Chronically homeless persons have been continuously homeless for six months or more in
the previous year, and episodically homeless have had 3 or more 4 episodes of homelessness in the previous year.
• The number of absolutely homeless people reporting chronic and episodic homelessness was 10. It is notable that 6 individuals in the at risk population—a number that is over half of the absolutely homeless subgroup—reported that they had been chronically homeless.
• It was more common for homeless people to be homeless continuously for six months or more than to experience three or more episodes of homelessness.
Experience of Housing and Shelter • Many homeless people do not know where they will stay at night. Amongst those living with
hidden homelessness, the dominant response was that they would stay at someone else’s place (i.e., couch surfing) while people who were at-risk of homelessness typically had their own place to stay, even if it was unsuitable or unsafe. Many people pay rent to stay in accommodation that is severely substandard and not appropriate for human habitation.
• It is particularly remarkable that several people who were absolutely homeless indicated that the location where they would sleep was a public space, abandoned building or other unsheltered location due to the cold weather. During the PPC from April 16th to April 22nd, the minimum temperature ranged between -0° C and -8° C.
Reasons for Homelessness • The top five reasons for homelessness were inability to pay rent or mortgage, addictions,
illness, conflict with spouse or partner and abuse by spouse or partner. These five reasons were also given frequently by people living with hidden homelessness or at risk of homelessness but they also cited unsafe housing conditions as a reason.
Family Homelessness • Few people who are absolutely homeless have partners, other adults or children with them.
However, those living with hidden homelessness or the risk of homelessness were sharing the circumstances with a partner, other adults or children.
Health Issues • A substantial number of people indicated that they have health issues. The most prevalent
issue pertained to mental health challenges, reported by 89% of people living with absolute homelessness. Two-thirds or more of the participants in all homeless categories reported

HOMELESSNESS IN MANITOULIN-SUDBURY: 2018 ENUMERATION
x
one or more health challenges (i.e., chronic/acute medical condition, physical disability, addictions or substance use or mental health issue).
Experiences of Child Welfare or Foster Care • Close to or more than a quarter of the participants in each subcategory of homelessness
had been in the child welfare system, including foster care or a group home. On average, people who were absolutely homeless or at-risk who had been in the child welfare system became homeless in 1.5 years while those living with hidden homelessness had become homeless after less than a year of leaving the system.
Income Sources • The largest number of participants were receiving income supports from social assistance
(Ontario Works) or Ontario Disability Support Program. The third main response of people living with absolute homelessness was that they had no income.
• People who were absolutely homeless collectively had fewer sources of income compared with those living in hidden homelessness or with the risk of homelessness.
Needs • Participants identified the primary needs pertaining to health as mental health services,
medical services to address physical disability or serious, ongoing medical conditions and addictions.
• The main needs in other areas centred on housing and the basic necessities of food, clothing, infant necessities, transportation, security and money.
Recommendations
Twenty-two recommendations are put forward based on the study findings. They pertain to emergency services (4), basic needs (1), housing (4), trauma and counselling (1), domestic violence (2), Indigenous people (2), mental illness (2), physical illness (1), income supports (2), food security (1), forms of homelessness (1), and public education (1).
Discussion
One hundred and fifty seven individuals is one percent of the population of 15,692 (the population of the areas studied). This is the same rate of homelessness as was found in our studies of North Bay in 2011 and Sudbury in 2015. If those at-risk of homelessness are removed from the calculation, the rate is .43, which is higher than the rate previously reported for Vancouver, Kelowna, Red Deer, Lethbridge and Toronto.

1
HOMELESSNESS IN THE MANITOULIN-SUDBURY DISTRICT:
2018 ENUMERATION
REPORT—AUGUST 2018
1.0 BACKGROUND AND DEFINITIONS OF HOMELESSNESS
Homelessness is a serious problem in Ontario, including northern towns and cities;
moreover, Indigenous people are greatly overrepresented amongst homeless people in northern
urban and rural places (Kauppi, Pallard & Faries, 2015). In our prior studies, we have reported
that Indigenous people comprised 39 percent of the total in Timmins where the homeless
population exceeded 700 people in 2011 (Kauppi & Pallard, 2015). Indigenous people
comprised 41 percent of those who were absolutely homeless but only 8 percent of the total
population. Kauppi and Pallard (2015) also reported that the prevalence of prior homelessness
was five times higher amongst Indigenous people compared with non-Indigenous, low income
participants in a nearby urban centre. The risk of homelessness is extremely high amongst
Indigenous people.
The Canadian Homelessness Research Network (CHRN, 2012) developed a typology of
homelessness that includes four major categories: homeless persons may be (i) unsheltered, (ii)
emergency sheltered, (iii) provisionally accommodated, and (iv) at risk of homelessness. The
first two categories refer to circumstances for those who are absolutely without housing. The
third and fourth categories describe the varied circumstances for persons whose shelter
arrangements lack permanence and those who are at risk of becoming homeless. Terms used
to refer to persons in the latter two categories include technically homeless, near homeless,
precariously housed, provisionally or temporarily accommodated, inadequately housed, at-risk
or at imminent risk. New research has revealed the significance of hidden homelessness in
Ontario as a poorly understood aspect of homelessness (Kauppi et al., 2017). Hidden
homelessness involves various circumstances in which people are homeless but do not live on
the streets and may not access services. Kauppi et al. (2017, p. 9) describe hidden
homelessness as including “people who live in temporary, provisional accommodation, or in a
situation that is not sustainable. It refers to people who generally do not pay rent, live

HOMELESSNESS IN MANITOULIN-SUDBURY: 2018 ENUMERATION
2
temporarily with others and do not have the ability to secure their own permanent housing
immediately or in the near future. The term ‘hidden’ is used for a variety of reasons. Some use
this term to refer to the fact that this population is often not visible to the public as compared to
“visibly” homeless people who sleep on streets and in public settings. Others use this term to
indicate that there may be a large population of people who, although they fit within definitions
of homelessness, do not access services and as such are not visible to the service system.”
The frequency and duration of homeless episodes can have important implications for
how the problem is understood and addressed. Taking into account the time element,
homelessness may be divided into three categories including chronic, episodic and temporary
forms (Kauppi, Shaikh, Pallard & Rawal, 2013). According to the Homelessness Partnering
Secretariat (2012), chronic homelessness is a term used to describe people who have been
continuously homeless for six months or more in the previous year. Chronic homelessness is
often experienced by those with recurring or continuing illness or addiction problems. The
Government of Ontario and the Homelessness Partnering Secretariat have also identified the
need to study episodic homelessness, which involves three or more episodes of homelessness
in the previous year. Episodic homelessness may be cyclical and may result from changes in
circumstances, for example release or discharge from an institution such as prison or hospital
(Kauppi et al., 2013). Thus, complexity in the categorization of homeless people must be
recognized given the inter-related and overlapping nature of the concepts; categories of people
who are considered to be chronically, episodically and cyclically homeless are not always
distinct. The frequency and duration of homeless episodes can have important implications for
how the problem is understood and addressed.1
The purpose of the current study was to gather up-to-date information about various
subgroups within the homeless population in the Manitoulin-Sudbury District, including
information such as age, gender, socio-cultural data and history of homelessness. The
questionnaire included all mandatory questions identified and developed by the Government of
Ontario.
1 The definitions of chronic and episodic homelessness are from the “Homelessness Partnering
Strategy Directives 2014-2019” www.canada.ca/en/employment-social-development/services/funding /homeless/homeless-directives.html
HOMELESSNESS IN MANITOULIN-SUDBURY: 2018 PERIOD PREVALENCE COUNT
3
2.0 OBJECTIVE
The Manitoulin-Sudbury District Services Board required the completion of an
enumeration project. The enumeration is linked to the objectives of the Province of Ontario to
end homelessness in Ontario and, specifically, to end chronic homelessness by 2025. The
enumeration in 2018 is intended to help Service Managers and the Ministry of Housing to better
understand the extent and nature of homelessness and to guide policy and program design.
3.0 METHODOLOGIES FOR COUNTING AND STUDYING HOMELESSNESS
The utilization of sound methods for collecting data on the prevalence of homelessness
is vital for reducing and eliminating homelessness as it provides critical information to policy
makers, service providers, advocates and community members about prevalence,
demographics, trends and service use. One of those methods to enumerate homeless persons
is the period prevalence count or PPC approach. It has recently been described in the Period
Prevalence Counts of People Experiencing Homelessness: A Guide for Service Managers in
Rural and Northern Communities (Kauppi, 2017), and the guide was made available for use by
service managers in Ontario. This enumeration used the PPC method and followed the guide.
The guide provides information about the PPC approach and how to implement it as one
of the accepted enumeration methods to be used by service managers in 2018. This
methodology was promoted by the Ministry of Housing as it can capture most of the population
and is deemed useful in northern and rural communities. It involves community outreach and
the involvement of agencies offering front-line services and programs to people experiencing
forms of homelessness, including food banks. There has been a tendency to utilize a variation
of the service-based methodology in most studies of homelessness conducted since the late
1980s. This methodology was used for the current study because it captures most of the
population. Including the agencies offering front-line services and programs to people
experiencing forms of homelessness can yield information about the complexity of the forms of
homelessness as well as increase accuracy in counting people in various socio-demographic
groups (e.g. by gender, socio-cultural/linguistic group and age).
The PPC of homeless persons—including a count of chronically and episodically
homeless people—is also a method that is appropriate for use in rural and northern

HOMELESSNESS IN MANITOULIN-SUDBURY: 2018 ENUMERATION
4
communities. It was used to obtain information about socio-demographic/linguistic
characteristics, histories of homelessness and current and prior experiences. Data were
collected from people experiencing forms of homelessness and hidden homelessness using a
structured questionnaire, which includes all mandatory questions identified and specified by the
Government of Ontario, in order to gather information from them regarding forms of
homelessness. We used the same methodology as we have successfully employed in the past
in our PPC studies of persons accessing a broad range of front-line services for poor and
homeless people.
The PPC data collection activities took place when the Markstay food bank was
operating before the 7-day PPC, that is on April 12th, while the PPC took place from April 16th to
22nd. Continuing the PPC for 7 days, while collecting information allowing for the elimination of
duplicate cases (de-duplication), yields information leading to more accurate data than
studies/counts that take place over a shorter time via the PiT. In the USA, based on extensive
experience with homelessness enumeration, HUD (2014) has acknowledged that some people
do not access services every day and thus counts may be extended to 7 days to allow for
greater accuracy.
The report of Ontario’s Expert Advisory Panel on Homelessness, “A Place to Call Home”
(MMAH, 2015) identifies hidden homelessness as an important issue. The Panel stated that
approaches to enumeration used in big cities may not be appropriate for use in rural and
northern communities where hidden homelessness is prevalent. A study funded by the Ministry
of Municipal Affairs and the Ministry of Housing on hidden homelessness in Ontario examined
varied forms of homelessness in rural and northern Ontario. The report, “Homelessness and
Hidden Homelessness in Rural and Northern Ontario” (Kauppi, O’Grady, Schiff, Martin and
Ontario Municipal Social Services Association, 2017), provided a framework for measuring
hidden homelessness in the 2018 enumeration study.
4.0 CONDUCTING A SURVEY OR COUNT OF HOMELESS PERSONS
4.1 Ethics Approvals
The Centre for Research in Social Justice and Policy had previously received approval
from the Research Ethics Board at Laurentian University (LU REB) for conducting period

HOMELESSNESS IN MANITOULIN-SUDBURY: 2018 PERIOD PREVALENCE COUNT
5
prevalence counts in various communities in northeastern Ontario. A revised application was
submitted to the LU REB in February, 2018. Ethics approval was received on March 6, 2018.
The procedures for data collection and all aspects of the study met the standards required by all
ethics review committees.
4.2 Qualifications and Experience of the Research Team
Carol Kauppi has directed a team of researchers conducting studies on homelessness
since 2000. She has 18 years of experience in working with homeless persons as research
participants. Her teams conducted 10 period prevalence counts in Sudbury between 2000 and
2015, and counts in Timmins (2011), North Bay (2011), Hearst (2012), Moosonee (2012) and
Cochrane (2013). She is the author of the guide Period Prevalence Counts of People
Experiencing Homelessness: A Guide for Service Managers in Rural and Northern Communities
(2017). She is also the lead author of the report, Homelessness and Hidden Homelessness in
Rural and Northern Ontario (2017), conducted with support from the Ontario Ministry of
Housing. From 2010 to 2016, Carol Kauppi was the director of Poverty, Homelessness and
Migration, a $1,000,000 project funded by the Social Sciences and Humanities Research
Council. She has also conducted studies on homelessness for the Homelessness Partnering
Strategy, Employment and Social Development Canada, notably the study, Understanding and
Addressing Family Homelessness in a Northern Community, Timmins, Ontario (Kauppi et al.,
2014). She has extensive experience in conducting large scale research projects at the national,
provincial and regional levels, as well as policy research and action research projects. She has
managed these large scale projects effectively and provided the agreed deliverables in a timely
manner. A recognized leader in research on homelessness, she has in-depth knowledge of the
needs of people experiencing homelessness.
The research team included four additional university researchers, Dr. Emily Faries, Dr.
Henri Pallard, Dr. Phyllis Montgomery and Dr. Michael Hankard, and the staff of the Centre for
Research in Social Justice and Policy, as well as upper year social work students who were
involved as research assistants. In total, the research team comprised over 20 members,
including research assistants who were hired and trained to work on the project. The lead
university researchers were from the School of Social Work, the Department of Indigenous
Studies, the Department of Law and Justice and School of Nursing. The research team included
Anglophone, Francophone and Indigenous faculty members and students from varied schools
and departments. The project team had the required skills and knowledge to conduct the project

6
HOMELESSNESS IN MANITOULIN-SUDBURY: 2018 ENUMERATION
activities, including bilingual capacity and connections to the key cultural communities (i.e.
Francophones, Indigenous people, and Anglophones) in the Manitoulin-Sudbury District.
4.3 Geographic Area
The study sought to include all regions within the Manitoulin-Sudbury District. The 2018
period prevalence count involved data collection in Espanola, Little Current, Mindemoya,
Noëlville; Markstay, Chapleau and Foleyet. The decision about locations was made following a
consultation with service providers in the fall of 2017 and in early 2018. The PPC project
followed the Ministerial Directive and the Provincial Guidelines for Homelessness Enumeration.
It was completed in a manner that addressed all provincial requirements. The study covered
regions of the Manitoulin-Sudbury District in which more than 56 percent of the total population
resides (approximately 16,000 people).
4.4 Data Collection Tool
The data collection instrument to be used included the required questions specified by
the Province of Ontario and the Homelessness Partnering Secretariat. Additional questions on
health, mental health, migration, and history of homelessness were included. The data
collection instrument consisted of a questionnaire for collecting information from each homeless
person using shelters and allied services. The definitions of homelessness used in previous
studies in prior PPCs in other northeastern Ontario communities were employed in 2018. The
definitions are consistent with the Canadian definition of homelessness published by the
Canadian Homelessness Research Network (CHRN, 2012), and incorporates its four major
categories of (i) unsheltered, (ii) emergency sheltered, (iii) provisionally accommodated, and (iv)
at risk of homelessness, as set out above (1.0 Background and Definitions of Homelessness).
Measures of hidden homelessness were also included.
4.5 Data Collection Procedures
Using a service-based methodology, data were collected from homeless persons using a
structured questionnaire in order to gather information regarding background, experiences and
forms of homelessness. We used the same methodology that we have used successfully in the
past in our period prevalence studies of persons accessing a broad range of front-line services
for poor and homeless people. The survey was conducted in April, from the 12th in Markstay and

HOMELESSNESS IN MANITOULIN-SUDBURY: 2018 PERIOD PREVALENCE COUNT
7
the 16th to the 22nd in Espanola, Little Current, Mindemoya, Noëlville; Chapleau and Foleyet. The
extended data collection period for the food bank in Markstay was required since it operates on
a specific day of each month.
As the questionnaire collects specific information that allows for the elimination of
duplicate cases, extending the time frame of the study did not raise concerns about counting the
same person more than once. Expanding the timeline and the geographic area allowed us to
collect data about persons accessing services in outlying areas. Our procedure led to more
accurate data than studies/counts that take place over a shorter time and in a single central
area.
The data collection activity addressed all requirements specified by the Manitoulin-
Sudbury Services Board, including:
• type of current housing/lodging;
• reasons for homelessness;
• number of chronically homeless persons;
• number of episodically homeless persons;
• number of persons with Indigenous identity;
• number of persons with racialized identity;
• age and number of youths under the age of 18 not connected to a family unit;
• family homelessness and number of women and children;
• number of veterans;
• gender identity, sexual orientation, number of LGBTQ2S persons; and
• health.
The survey was conducted in a manner that allowed all people experiencing forms of
homelessness to participate, including those who had prior military service.
There are inherent difficulties in conducting research involving people experiencing
forms of homelessness, as noted above. The research team worked closely with local service
providers in order to create an accurate snapshot of the homeless population. It must be
recognized that any count will produce an under-estimate of the total homeless population.
However, the participation of a large majority of service providers offering services to poor and

HOMELESSNESS IN MANITOULIN-SUDBURY: 2018 ENUMERATION
8
homeless people made it possible to obtain a reasonable estimate of the homeless population
and provided baseline data for ongoing homelessness initiatives. The PPC in 2018 was the first
study of homelessness conducted in the Manitoulin-Sudbury District. There was generally a
good response to the study and many organizations agreed to participate and to assist with data
collection.
A preliminary list of providers was developed from existing lists of programs and services
and it was expanded early in 2018 to ensure that all organizations serving this population, within
the designated communities, were invited to participate. Searches were conducted to identify
and locate additional services, notably food banks. Using the internet, telephone directories and
the networks of identified service providers, a list of services was produced. Every provider
known to serve extremely poor and homeless people was contacted by telephone in order to
explain the study and to set a date and time for a meeting or teleconference. The purpose of the
meeting was to review the information to be collected in the study and to determine how the
data could be collected from that agency.
Following the telephone contact, a letter explaining the objectives of the study and the
need for participation from all providers was delivered to the agencies along with a copy of the
data collection instrument to be used for the count. By involving service providers in discussions
about the data collection, strategies were developed to reduce the level of intrusiveness of the
data collection and to maximize confidentiality. A few service providers decided not to
participate due to limited resources or to a reluctance to allow research assistants to collect data
on the agency premises. However, those that did not participate stated that they informed
people accessing their services about the survey and locations where they could complete the
questionnaire. Cards specifying the locations for the PPC data collection were sent to all
recipients of Ontario Works.
Given the service pressures and limited staff resources to collect the data, research
assistants were made available to administer the questionnaire in most agencies. A job
advertisement was posted online to recruit and hire a team of research assistants; they included
bi-lingual and Indigenous people. In total, more than 20 research assistants collected data in
agencies, services or programs that agreed to participate. The research team members were
trained and closely supervised to ensure that the study protocols were followed. Nineteen
agencies, programs or services participated in the study. Data collection stations were located
in services within each town, such as the District Services Board offices. A substantial

HOMELESSNESS IN MANITOULIN-SUDBURY: 2018 PERIOD PREVALENCE COUNT
9
proportion of the participants completed the survey at locations such as hospitals, as well as
other services and teams also conducted door-to-door surveys in low income areas where
homelessness has been identified as most likely to be concentrated. Data was also collected at
magnet events such as community dinners provided to low income people. One or more
surveys were completed at all service locations. The staff were trained to give attention to the
goal of limiting participation to a single completed survey from each individual as the honorarium
of $5.00 was an incentive for participation.
4.6 Timeframe for the Study
The PPC was conducted at agencies or services located in the Manitoulin-Sudbury
District on April 12th in Markstay and from April 16th to 22nd in all other locations.
4.7 Unduplicated Count
The data collection instrument allowed for the identification of duplicate cases. De-
duplication procedures were conducted by examining the first, middle, and last initials as well as
the date of birth, gender and sociocultural/linguistic background. Individuals with identical
information were considered to be the same person and the duplicated case was eliminated
from further analysis. As in prior studies, most individuals provided the information required to
identify duplicate cases. In 2018, approval was sought to require the provision of the de-
duplication information as part of the consent process. The de-duplication procedures showed
that participants completed the survey only once, as there were no duplicate cases in the
Manitoulin-Sudbury District database.
5.0 RESULTS
5.1 Number of Participants
The number of questionnaires completed by adults or youth in the PPC study was 122.
The questionnaire asked participants to indicate the age and gender of dependents.

HOMELESSNESS IN MANITOULIN-SUDBURY: 2018 ENUMERATION
10
Number of participants and dependent children in custody
As shown in Table 1, the unduplicated results are based on 122 adult and youth
participants, in addition to their 35 dependent children under the age of 18 who were in the
custody of a participant, for a total count of 157. The number of participants and children who
were absolutely homeless (n=24), living with hidden homelessness (n=57) as well as those who
were at risk of homelessness (n=76) is shown in Table 1.
Table 1: Number of unduplicated individuals in the period prevalence count
Absolutely homeless Number
Hidden homelessness
Number
At risk of homelessness
Number Total
Number
Number of participants 21 47 54 122
Dependent children under 18 3 10 22 35
Total 24 57 76 157
Table 2 shows the overall numbers in Sudbury East, Espanola, Manitoulin Island and
Sudbury North. The results indicate that over half of the surveys were completed on Manitoulin
Island (53%), followed by Espanola (24%), Sudbury North (20%) and Sudbury East (3%). The
small number of participants in Sudbury East likely undercounts the extent of homelessness.
The weather was unseasonably cold and local service providers stated that it was unusually
quiet during the seven days of the PPC. A snowstorm on the day of data collection in the
Markstay food bank resulted in a small number of participants. Furthermore, service providers in
Sudbury East commented that from May to September, a transient population moves into the
region. However, the data collection was conducted during April, consistent with the timelines
set by the province of Ontario; it is possible that many people who become homeless were not
staying in Sudbury East in April.

HOMELESSNESS IN MANITOULIN-SUDBURY: 2018 PERIOD PREVALENCE COUNT
11
Table 2: Number of participants in regions of the Manitoulin-Sudbury District
Region Number of Participants Percentage
Manitoulin Island 65 53.3
Espanola 29 23.7
Sudbury North 24 19.7
Sudbury East 4 3.3
Total 122 100
5.2 Results for Specified Data Points
The Province of Ontario specified the requirement to gather information only about
absolutely homeless people. However this report provides information about absolutely
homeless persons as well as those living with hidden homelessness or the risk of
homelessness. It is important to include all categories of people living with forms of
homelessness because prior studies and the published literature show that there is a strong
interrelationship between these categories. For example, in a 2015 study of homelessness in
the City of Greater Sudbury, 45 percent of persons at risk of homelessness previously had been
absolutely homeless. These two groups are not distinct from each other as people who are at
risk of homelessness are vulnerable to hidden homelessness or to becoming absolutely
homelessness. Moreover, some who fit accepted definitions of absolute homelessness may not
self-define and self-report as homeless.
Table 3 shows the results for data points required by the Province of Ontario. Dependent
children are not included in these results. As typically occurs with surveys, some people choose
not to answer certain questions. The number of “missing values” is within accepted parameters
and therefore appear not to have impacted on basic trends in the data. As the total sample of
adult participants (n=122) is relatively small, it is not feasible to provide breakdowns for each
town.

HOMELESSNESS IN MANITOULIN-SUDBURY: 2018 ENUMERATION
12
Table 3: Age, cultural background, sexual orientation and military service by type of homelessness
Absolutely homeless Number
Hidden homeless Number
At risk Number
Total Number %
Cultural background
Indigenous identity (including Inuit) 13 24 20 57 52.2
Racialized identity (e.g., Asian, Arab, Black, Filipino, Hispanic) -- -- 5 5 4.4
Age, gender and sexual orientation
Youth under age 18 not connected to a family unit -- 2 -- 2 1.7
Youth aged 16 to 24 3 7 6 16 13.5
Female/Women 13 20 27 60 50.9
Male/Men 6 23 24 53 44.9
LGBTQ (Trans, two-spirit, genderqueer, don’t know, not listed) 1 3 1 5 4.2
Chronic and episodic homelessness
Chronic 34 18 6 34 17.9
Episodic 3 3 5 11 9.0
History with child welfare
Was in foster care or group home 6 11 11 28 23.1
Military service
Veterans 1 2 5 8 6.7
Note: Missing values are within acceptable parameters. Percentages are calculated using the number of respondents for each variable. Note: Type of current housing/lodging, reasons for homelessness/housing loss, family homelessness, health and income sources are reported below.
5.3 Demographic Results
As we have consistently found in prior studies in northeastern Ontario, Indigenous
people (including First Nations and Métis) were present within the study samples in proportions
greater than their numbers in the total population according to 2016 census data (Statistics
Canada, 2017). Indigenous people were 26.3 percent of the population of the regions included

HOMELESSNESS IN MANITOULIN-SUDBURY: 2018 PERIOD PREVALENCE COUNT
13
in the Manitoulin-Sudbury District but they comprised 52.2 percent (n=57, excluding children) of
the participants who provided information about Indigenous identity (n=113 or 93% of
participants) in the study.
Among those who were absolutely homeless, Indigenous people, including First Nation,
Métis or Inuit, constituted about two-thirds (65.0 %) of this subsample (i.e., 21 individuals were
absolutely homeless and 20 reported their cultural identity). Indigenous people were also close
to half (47.8%) of the subgroup of people who were living with hidden homelessness. They also
made up about half (48.9%) of those who were at-risk of homelessness.
In contrast to Indigenous people, Francophones (n=9) appeared to be greatly under-
represented among the study participants (7.5%) compared to their proportion within the total
population (24.6%) as reported for the Sudbury District in the 2016 census (Statistics Canada,
2017)2. Francophones comprised 14.3% of those who were absolutely homeless. There were
no people living with absolute homelessness or hidden homelessness who self-identified as
being in a racialized group. A very small subgroup of the racialized homeless population in the
Manitoulin-Sudbury District (n=5) participated in the enumeration study; they were 4.4 percent
of the sample. Overall, Francophones and racialized people were 11.5 percent of those
experiencing various forms of homelessness.
Caucasian anglophones constituted close to half of those who were homeless (44.7%)
but they were a smaller subgroup amongst people living with absolute homelessness. Figure 1
shows the percentage of Caucasian and Indigenous participants in the categories of absolute
homelessness, hidden homelessness and those at-risk.
The age range for people living with homelessness was 16 to 89. Those living with
absolute homelessness included a man aged 60 and women aged 60 and 65. Several men and
women over age 60 were among those experiencing hidden homelessness.
2 These percentages are estimates since Statistics Canada does not provide community profiles
for the catchment population of the Manitoulin-Sudbury District Services Board. The data for the Sudbury District, which excludes the City of Greater Sudbury and covers much of the area for which the Manitoulin-Sudbury District Services Board is responsible, nevertheless has a smaller population than the Manitoulin-Sudbury District.

HOMELESSNESS IN MANITOULIN-SUDBURY: 2018 ENUMERATION
14
The number of young people up to age 24 was 16. They included individuals who were
living with absolute, hidden homelessness and the risk of homelessness. These youth were not
connected to a family unit when they participated in the survey. Of these, 3 were absolutely
homeless and 7 were living with hidden homelessness. It is important to note that homeless
youth are extremely vulnerable; it is possible that more young people were present among
homeless people but may not have participated in the survey in order to remain part of the
hidden homeless population.
Women comprised 50.9 percent of those who indicated their gender as male or female
(n=60); men (n=53) comprised 44.9 percent of this sample. Persons who self-identified their
gender as two-spirit (n=1), transwoman (n=2), transman (n=1), or not listed/don’t know (n=1)
comprised 4.2 percent of the participants based on self-reports of gender identity (n=118 self-
identified as male, female or gender fluid/non-binary).
Figure 2 shows the percentage of people experiencing forms of homelessness by
gender identity. Women were a majority of the participants in the categories of absolute
homelessness and at-risk of homelessness, but men made up a larger proportion of people who
were experiencing hidden homelessness. The proportion of those who identified as gender fluid,
gender queer or transgender was similar for absolute and hidden homelessness (i.e., at or
38.1
45.5 46.9
61.9
54.5
40.8
0
10
20
30
40
50
60
70
Absolute Hidden At-risk
Perc
enta
ge
Figure 1: Percentage experiencing types of homelessness by linguistic/cultural groups
Caucasian-Anglo
Indigenous

HOMELESSNESS IN MANITOULIN-SUDBURY: 2018 PERIOD PREVALENCE COUNT
15
above 5% of those in these categories). Regarding sexual orientation, 96 percent of participants
self-reported that they identified as heterosexual while 4 percent indicated that they identified as
LGBTQ2S. These numbers may under-report the experience of gender fluid identity due to
concerns about the stigma in small and rural communities. It should be noted that gender
appears to be an issue in the Manitoulin-Sudbury District as most enumeration studies have
shown that men outnumber women among those who are homeless.
The number of people with backgrounds involving military service who participated in the
survey was 8. One of them was absolutely homeless while two were living with hidden
homelessness and the remainder (n=5) were at-risk of homelessness.
5.4 Chronic and Episodic Homelessness
An examination of the length of time during which participants had been homeless and
the number of episodes of homelessness experienced shows that a substantial proportion of the
participants who were living with absolute homelessness or hidden homelessness had
experienced long periods (six months or more) without housing. Fewer people at risk of
homelessness had been homeless for six months or more. As shown in Figure 3, the
percentage of people reporting chronic homelessness (for six months or more within a year)
30
50.0 46.2
65.0
43.5
51.9
5 6.5 1.9
0
10
20
30
40
50
60
70
Absolute Hidden At-risk
Perc
enta
ge
Figure 2: Percentage of people experiencing types of homelessness by gender identity
Men
Women
LGBTQ2S

HOMELESSNESS IN MANITOULIN-SUDBURY: 2018 ENUMERATION
16
was much greater than the percentage who reported episodic homelessness (three or more
episodes within a year) amongst those who were absolutely homeless or experiencing hidden
homelessness. A similar proportion of people at-risk of homelessness had experienced chronic
or episodic homelessness. It is possible that people who were at risk of homelessness had
experienced chronic or episodic homelessness prior to becoming housed or that their living
circumstances in housing constituted a form of hidden homelessness.
Figure 3 compares the pattern of results from the cross tabulation of episodic (defined as
more than 2 episodes in a one-year period) and chronic (continuously homeless for six months
or more) homelessness among the total sample of participants. The results show that, for all
types of homelessness, the largest subgroup was people who had not experienced either
chronic or episodic homelessness. A cross tabulation of the subgroups that were chronically
and episodically homeless showed that there is a statistically significant relationship between
these forms of homelessness for the sample as a whole (Figure 4). Those who were not
episodically homeless tended not to have experienced chronic homelessness. Yet there was an
overlap between chronic and episodic homelessness in that 25 percent (n=7) of the participants
who had experienced chronic homelessness indicated that they had three or more episodes of
homelessness.
47.6
38.3
11.1 14
6 9
0.0
5.0
10.0
15.0
20.0
25.0
30.0
35.0
40.0
45.0
50.0
Absolute Hidden At-risk
Perc
enta
ge o
f par
ticip
ants
Figure 3: Number of people experiencing chronic and episodic homelessness by type of homelessness
Chronic Episodic

HOMELESSNESS IN MANITOULIN-SUDBURY: 2018 PERIOD PREVALENCE COUNT
17
ϕ = 5.71, p < .05
Further examination showed that the largest number of people who reported that they
had not been chronically or episodically homelessness were those at-risk of homelessness.
Slightly more people living with hidden homelessness reported both episodic and chronic
homelessness compared with those who were absolutely homeless. However, there were no
significant differences in chronic or episodic homelessness between the absolute and hidden
homelessness groups.
5.5 Experiences of Housing or Shelter
Table 4 provides information about experiences of housing or shelter among those who
participated in the survey. The responses to the mandatory question about current lodging
suggested that many people did not know where they would stay at night. The dominant
response for people who were absolutely homeless was that they intended to stay in an
emergency or domestic violence shelter, or a transitional shelter. Amongst those living with
hidden homelessness, the dominant response was that they would stay at someone else’s
place (i.e., couch surfing) while people who were at-risk of homelessness typically had their own
place to stay. It is worth noting, however, that many people pay rent to stay in accommodation
82
5
28
7
0
10
20
30
40
50
60
70
80
90
Neither chronic norepisodic
Episodic only Chronic only Episodic and chronic
Num
ber o
f par
ticip
ants
Figure 4: Experience of chronic and episodic homelessness

HOMELESSNESS IN MANITOULIN-SUDBURY: 2018 ENUMERATION
18
that is severely substandard and not appropriate for human habitation. Alternatively, their
existing home does not meet basic standards or requires major repairs.
Table 4: Current lodging/homelessness
Absolute Hidden At risk
N % N % N %
Own apartment or house 4 19.0 7 14.9 53 98.1
Someone else’s place 2 9.5 30 63.8 – –
Motel/hotel 1 4.8 4 8.5 – –
Hospital, jail, prison, remand -- -- 2 4.3 – –
Emergency or DV shelter 9 42.9 – – – –
Transitional shelter 1 4.8 2 4.3 – –
Public space 1 4.8 – – – –
Vehicle -- -- – – – –
Makeshift shelter, tent, shack -- -- – – – –
Abandoned/vacant building 1 4.8 – – – –
Other unsheltered location 1 4.8 – – – –
Do not know/decline 1 4.8 2 4.3 1 1.9
Note: Data are based on the number of responses. Some participants did not answer all questions while others gave multiple responses. Note: Percentages may not sum to 100 due to rounding error.
It is important to note that the 4 individuals who were absolutely homeless and the 7 who
were living with hidden homelessness indicated that they would stay in their own place;
however, careful examination of their questionnaires showed that they could not stay there.
Some people have accommodation but are not able to stay there due to safety issues or
eviction. Such circumstances impacted on these individuals.
It is notable that three people who were absolutely homeless indicated the location
where they would sleep was a public space, abandoned building or other unsheltered location
even in the cold weather that persisted in April. During the PPC from April 16th to 22nd, the
minimum temperature ranged between 0° C and -3° C in Espanola, Little Current and Noëlville,

HOMELESSNESS IN MANITOULIN-SUDBURY: 2018 PERIOD PREVALENCE COUNT
19
but it was colder by a few degrees in Chapleau.3 Moreover, on April 12th, when data collection
took place in Markstay, a snowstorm and cold, blustery weather combined with a gas leak at the
organization, were barriers to participation.
5.6 Reasons for Homelessness
Table 5 shows the reasons given for homelessness or the loss of housing. The reasons
have been sorted based on the most frequent responses given by people living with absolute
homelessness. As indicated, the top five reasons were inability to pay rent or mortgage,
addictions, illness or a medical condition, and conflict or abuse by a spouse or partner. The top
five reasons given most frequently by people living with hidden homelessness were somewhat
different from absolutely homeless people, but the inability to pay rent or mortgage was a
primary reason, as was conflict by spouse/partner or abuse by a spouse/partner. Unsafe
housing conditions, job loss and conflict or abuse with a parent or guardian were other reasons
cited most often by people experiencing hidden homelessness. Among those at risk of
homelessness, the top five reasons were addiction or substance use, unsafe housing
conditions, inability to pay rent or mortgage and abuse by spouse or partner. If the responses
about conflict and abuse listed as four separate reasons are combined (i.e., (i) conflict with
spouse/partner, (ii) abuse by spouse/partner, (iii) conflict with parent/guardian and (iv) abuse by
parent/guardian), this issue becomes the primary reason for homelessness.
The reasons given for homelessness provide for a better understanding of the overlap
between categories of homelessness. Within all three categories (at-risk, hidden or absolute
homelessness), all of the reasons listed in Table 5 were selected by one or more participants. It
is noteworthy that the inability to pay rent or mortgage was a top reason given by people living
with absolute and hidden homelessness. Addiction was a primary reason given by all three
groups. Unsafe housing was also an important factor in homelessness for people living with
hidden homelessness and the risk of homelessness. Finally, many people indicated that they
did not know why they were homeless or checked a category “other”. In addition, some people
did not answer the question.
3 Temperatures are from records available at www.accuweather.com

HOMELESSNESS IN MANITOULIN-SUDBURY: 2018 ENUMERATION
20
Table 5: Reasons for homelessness
Reasons At-risk Hidden homeless
Absolutely homeless
Total N
Total %
Unable to pay rent or mortgage 4 10 9 23 24.7
Addiction/substance use 6 6 6 18 19.4
Illness/medical condition 2 4 5 11 11.8
Conflict with spouse/partner 1 10 4 15 16.1
Experienced abuse by spouse/partner 3 4 4 11 11.8
Incarcerated 1 4 4 9 9.7
Hospitalization or treatment program 1 1 4 6 6.5
Job loss 2 7 3 12 12.9
Conflict with parent/guardian 2 7 3 12 12.9
Unsafe housing conditions 6 8 1 15 16.1
Experienced abuse by parent/guardian 1 7 1 9 9.7
Don’t know/other/decline 16 17 7 40 43.0
Note: Results are based on multiple responses as participants were invited to check all reasons that applied to them. The number of responses exceeds the number of participants.
5.7 Family Homelessness
The analysis of responses regarding family homelessness indicates that most people
living with forms of homelessness, including those living with the risk of homelessness, are on
their own. The question asked: “What family members are staying with you tonight?” The
dominant response was “none” and only one person living with absolute homelessness was
staying with a partner. According to Figure 5, few people who are absolutely homeless have
partners, other adults or children with them. Those who had partners, other adults or children
were experiencing hidden homelessness or the risk of homelessness. Yet fewer of those living
with hidden homelessness share the experience with other adults or children compared with
people at-risk of homelessness.

HOMELESSNESS IN MANITOULIN-SUDBURY: 2018 PERIOD PREVALENCE COUNT
21
5.8 Health Issues
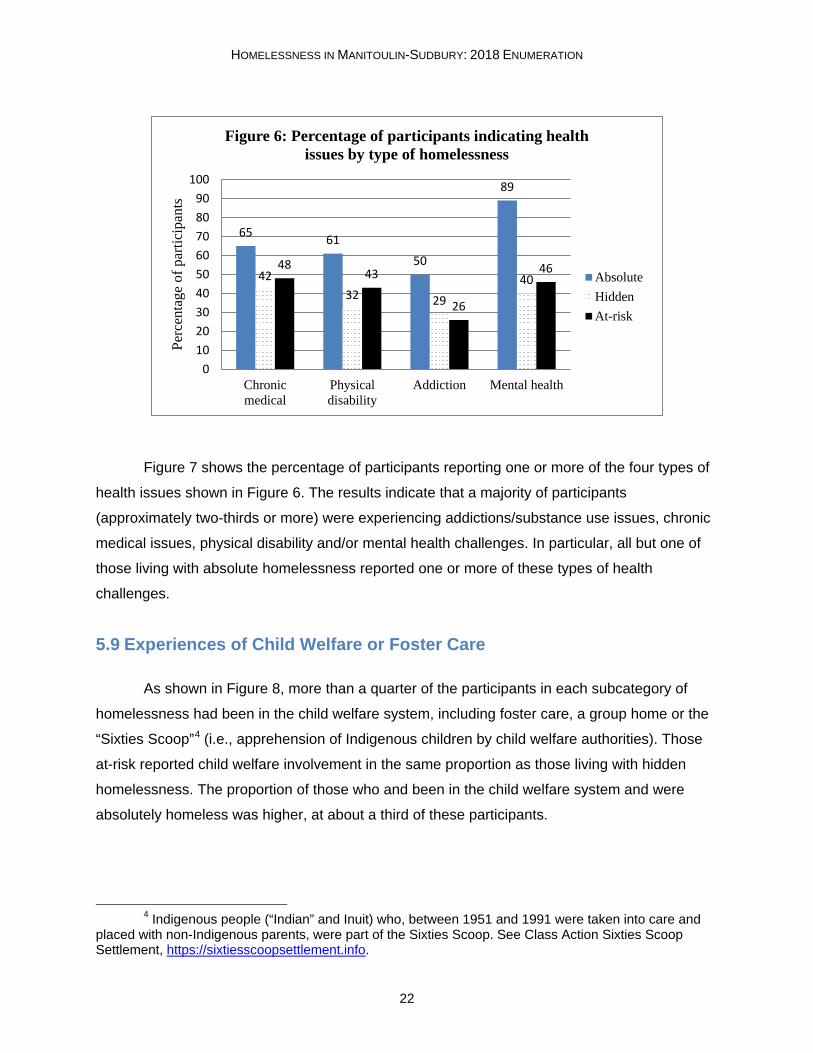
As shown in Figure 6, a substantial number of people indicated that they have health
issues. It is evident that addiction was the issue identified least often by people in all three
homeless categories. Nevertheless, half of those who were absolutely homeless and over a
quarter of those in hidden homeless and those at-risk reported that they had addictions or were
using substances.
A key finding is that amongst those absolutely homeless, nearly all reported mental
illness but less than half of those experiencing hidden homelessness or the risk of
homelessness reported mental health challenges. It is also important to note that over half of
those living with absolute homelessness reported that they had chronic medical issues or a
physical disability. Amongst people living with hidden homelessness, over a third had chronic
medical issues and about a third reported a physical disability. The findings for people at-risk of
homelessness were fairly consistent with regard to chronic medical issues, physical disability
and mental health: between 43 and 48 percent reported these health issues.
19
1 0 0
24
9 7
2
24
16
8
5
0
5
10
15
20
25
30
None Partner Other adult Child/children
Num
ber o
f par
ticip
ants
Figure 5: Number of participants indicating family homelessness
by type of homelessness
Absolute
Hidden
At-risk
HOMELESSNESS IN MANITOULIN-SUDBURY: 2018 ENUMERATION
22
Figure 7 shows the percentage of participants reporting one or more of the four types of
health issues shown in Figure 6. The results indicate that a majority of participants
(approximately two-thirds or more) were experiencing addictions/substance use issues, chronic
medical issues, physical disability and/or mental health challenges. In particular, all but one of
those living with absolute homelessness reported one or more of these types of health
challenges.
5.9 Experiences of Child Welfare or Foster Care
As shown in Figure 8, more than a quarter of the participants in each subcategory of
homelessness had been in the child welfare system, including foster care, a group home or the
“Sixties Scoop”4 (i.e., apprehension of Indigenous children by child welfare authorities). Those
at-risk reported child welfare involvement in the same proportion as those living with hidden
homelessness. The proportion of those who and been in the child welfare system and were
absolutely homeless was higher, at about a third of these participants.
4 Indigenous people (“Indian” and Inuit) who, between 1951 and 1991 were taken into care and
placed with non-Indigenous parents, were part of the Sixties Scoop. See Class Action Sixties Scoop Settlement, https://sixtiesscoopsettlement.info.
65 61 50
89
42 32 29
40 48
43
26
46
0102030405060708090
100
Chronicmedical
Physicaldisability
Addiction Mental health
Perc
enta
ge o
f par
ticip
ants
Figure 6: Percentage of participants indicating health issues by type of homelessness
AbsoluteHiddenAt-risk

HOMELESSNESS IN MANITOULIN-SUDBURY: 2018 PERIOD PREVALENCE COUNT
23
Figure 9 shows that, on average, individuals who had been in the child welfare system
became homeless within 1.5 years. Those living with hidden homelessness indicated that they
experienced homelessness within the shortest period after leaving foster care compared with
those absolutely homeless or at-risk. However, the differences between groups of homeless
people were not statistically significant. Seven Indigenous individuals stated that they were part
of the “Sixties Scoop” and these participants were in every category of homelessness, with the
largest number (n=4) being at-risk.
95
64 70
0102030405060708090
100
Absolute Hiddenhomelessness
At-risk
Perc
enta
ge o
f par
ticip
ants
Figure 7: Percentage of participants indicating one or more health issues
31.6%
26.1%
26.0%
Figure 8: Percentage experiencing child welfare by type of homelessness
Absolute
Hidden
At-risk

HOMELESSNESS IN MANITOULIN-SUDBURY: 2018 ENUMERATION
24
5.10 Income Sources
Table 6 shows the number of responses for each source of income reported by
participants. This mandatory question required by the Government of Ontario simply asked for
all sources of income, without any timeframe specified. The analysis is based on multiple
responses as it is possible for people to have more than one source of income.
The responses are ordered from the highest to lowest based on people living with
absolute homelessness. People who were absolutely homeless collectively had the fewest
sources of income. The largest number of participants were receiving income supports from the
Ontario Disability Support Program (ODSP) or social assistance (Ontario Works). These two
categories accounted for about a third of the responses. The third main response of people
living with absolute homelessness was that they had no income. Some who were at-risk or in
hidden homelessness also had no income. A few people living with absolute homelessness
received some income from GST refunds, seniors’ benefits, informal self-employment (e.g.,
income from panhandling), or from Employment Insurance.
With regard to employment, people at-risk of homelessness were most likely to have
some income from this source, while ten people living with hidden homelessness also reported
that employment provided some income. As no additional questions were asked about income,
it is unknown whether any sources of income were received at one point in time or prior to
homelessness.
18
11
17
0
5
10
15
20
Absolute Hidden At-risk
Num
ber o
f par
ticip
ants
Figure 9: Mean number of months after leaving care before becoming homeless by type of homelessness

HOMELESSNESS IN MANITOULIN-SUDBURY: 2018 PERIOD PREVALENCE COUNT
25
Table 6: Sources of income
Sources At-risk Hidden Absolute Total Number Percent
Disability benefit 16 11 10 37 31.9
Welfare/social assistance 8 14 6 28 24.1
No income 1 2 4 5 6.0
GST refund 4 6 2 12 10.3
Other source 7 7 2 16 13.8
Seniors benefits 8 9 2 19 16.4
Informal/self-employment 2 2 1 5 4.3
Employment insurance 1 2 1 4 3.4
Money from family/friends 1 5 - 6 5.2
Employment 15 10 - 25 21.6
Child and family tax benefits 3 3 - 6 5.2
Note: Results are based on multiple responses, therefore, the number of responses may be larger than the number of participants.
5.11 Participants’ Needs
Need for Services
The responses about the need for the services listed in Table 7 are rank-ordered
according to the subcategory of people who were absolutely homeless. It is notable that this
order is also consistent with the responses of those who were at-risk and similar to the
responses of people who were living with hidden homelessness.
The findings show that the main services needed by the participants are for mental
health, physical disabilities, serious medical conditions, and addictions. It is significant also that
a quarter to a third of participants stated that they needed services to help with a learning
disability. A few people required supports for brain injury or pregnancy.

HOMELESSNESS IN MANITOULIN-SUDBURY: 2018 ENUMERATION
26
Table 7: Need for services
Sources At-risk Hidden Absolute Total Number Percent
Mental health 17 13 13 43 50.0
Physical disability 16 9 10 35 40.7
A serious medical condition 13 11 9 33 38.4
Addiction or substance use 13 13 9 35 40.7
Learning disability 12 8 5 25 29.1
Brain injury 1 2 1 4 4.7
Pregnancy - 3 1 4 4.7
Note: Results are based on multiple responses, therefore, the number of responses may be larger than the number of participants.
General Needs
In an open-ended format, participants were asked to state what they needed, and 84
percent provided this information. The results shown in Table 8 are rank-ordered according to
the responses of those who were absolutely homeless. Of vital importance was the need for
housing, and this was identified by a substantial proportion of those who were experiencing
hidden and absolute homelessness. The second area of need was for basic necessities.
Participants in all subgroups reported that they need food, clothing, infant necessities,
transportation, security and money. Other needs pertained to social networks, health and
mental health and employment and education. In combination with the results shown in Table 7,
the general needs and the health-related needs indicate the kinds of supports that are required
by people living with homelessness in rural and northern communities.

HOMELESSNESS IN MANITOULIN-SUDBURY: 2018 PERIOD PREVALENCE COUNT
27
Table 8: General needs
Needs At-risk Hidden Absolute Total Number Percent
Housing 1 17 10 28 27.5 Necessities (food, clothing, infant needs, transportation, security, money)
26 24 8 58 56.7
Social networks (family, partner, friends) 1 2 3 6 5.9
Health and mental health - 4 2 6 5.9
Employment and education 8 4 - 12 11.8
Note: Results are based on multiple responses, therefore, the number of responses may be larger than the number of participants.
5.12 Recommendations arising from the findings
The following recommendations are based on the responses of the participants
regarding health needs and general needs, as well as other issues that have been identified
through this enumeration project. These recommendations should be reviewed and prioritized
by the communities in the Manitoulin-Sudbury DSB catchment area in order to ensure that the
pressing needs of homeless people are met and that they are supported effectively in obtaining
and retaining housing, employment, education and services.
Emergency services
1. Study how the system of emergency services may be developed to reflect the
characteristics of the homeless populations (e.g. more women, children, youth and
Indigenous people etc.) using them.
2. Develop and support programs/services that can address the social exclusion of homeless
people. Many homeless people do not have access to family or friends who can assist and
support them. People overcoming addictions often need to form new networks of friends in
order to avoid relapse. Programs that strengthen ties between homeless people and others
in the community must be designed to prevent marginalization and social exclusion.

HOMELESSNESS IN MANITOULIN-SUDBURY: 2018 ENUMERATION
28
3. Examine how services can be made more responsive to the needs of adolescents.
Homeless youth are among those who are least well served by community agencies and
most often do not have access to income support from government programs.
4. Provide enhanced funding for community-based prevention programs for youth with a focus
on family violence, abuse, sexual assault, and bullying in order to reduce youth
homelessness.
Basic needs
5. Develop the service system for the provision of services addressing the basic needs of food,
shelter, clothing, and medical care for homeless people so that there are enough services to
meet the needs.
Housing
6. Develop new social housing initiatives by taking action to access federal government funds
from the National Housing Strategy (i.e. create more subsidized housing).
7. Educate landlords in order to reduce discrimination against key groups (e.g. people with
mental illness, women who have experienced domestic violence and Indigenous people).
Develop an initiative to consult with landlords to address the requirements for references
from previous landlords.
8. Study the local housing market and develop strategies to create more safe, decent, and
affordable private housing, including room and board accommodation.
9. Provide more supportive housing services in order to reduce the risk of chronic and episodic
homelessness.
Trauma and counselling
10. Provide homeless people with access (e.g., transportation and free service) to counselling
services in the settings they inhabit (e.g. shelters, soup kitchens, and other emergency
services). There must be more acknowledgement of the experiences of trauma among
homeless people and strategies to address the trauma.

HOMELESSNESS IN MANITOULIN-SUDBURY: 2018 PERIOD PREVALENCE COUNT
29
Domestic violence
11. Provide more funding support for services to address this form of trauma, especially among
women and adolescents, given the primacy of domestic violence as a cause of
homelessness.
12. Increase funding for outreach and prevention programs to address domestic violence and
abuse among all age groups, including adolescents, women and seniors.
Indigenous people
13. Work with Indigenous communities to develop strategies for supporting Indigenous people
who move from their First Nations communities into urban centres. Culturally appropriate
services must be developed to assist with basic needs, education, and employment.
14. Take steps to address racism as a cause of homelessness to ensure that Indigenous people
can gain access to services and obtain rental housing, education, and employment.
Mental illness
15. Provide more community-based services to people with mental illness in order to prevent
periodic or chronic homelessness.
16. Develop, support and implement more harm reduction programs for people with addictions.
Physical illness
17. Examine and implement strategies to ensure that people living with homelessness can
access health services.
Income supports
18. Identify the barriers to the receipt of social assistance benefits at the local and provincial
levels in order to prevent homelessness among people who are denied benefits, disentitled
or face other barriers.
19. Establish income and housing supports that can prevent individuals and families from losing
their housing and their possessions. For example, provide funding for an emergency fund for
rent arrears, deposits, storage, and moving supports.

HOMELESSNESS IN MANITOULIN-SUDBURY: 2018 ENUMERATION
30
Food security
20. Develop standards around food security to ensure that people living with homelessness
have access to nutritious food supplies. For example, the needs for food security are not
met when individuals and families can only access food banks once per month and when
homeless people are not permitted to use food banks due to the requirement to produce
proof of residence.
Forms of homelessness
21. Adopt a definition of homelessness that takes into account experiences of people in rural
and northern Ontario by recognizing the prevalence of hidden homelessness and the risk of
homelessness in addition to absolute homelessness.
Public education
22. Develop and distribute materials to educate service providers and the general public about
the complex individual and structural causes of homelessness, including the high prevalence
of victimization and trauma among homeless people.
5.13 Incorporation of the Database into the PPC Database
The data collected for the current study are subject to requirements of the Laurentian
University Research Ethics Board (LU REB) and the Tri-Council Policy Statement: Ethical
Conduct for Research Involving Humans (2010) as ethical review was required for the study.
These requirements have implications for the storage and use of data. The data collected for
the PPC study allow for comparisons of data collected in the Manitoulin-Sudbury District with
other towns and cities in northeastern Ontario (the City of Greater Sudbury, Timmins, Cochrane,
Hearst, Kapuskasing, Iroquois Falls, Matheson and Moosonee). The Manitoulin-Sudbury District
data will be added to the existing database.
6.0 DISCUSSION AND CONCLUSION
The study procedures and analysis were designed to allow for data collection and an
analysis of people living with hidden homelessness. Importantly, the inclusion of key questions
within the survey enabled the identification of people living with hidden homelessness. One
difference between absolute homelessness and hidden homelessness is that people who are

HOMELESSNESS IN MANITOULIN-SUDBURY: 2018 PERIOD PREVALENCE COUNT
31
hidden from view and without a home stay with others who have a place to live. It was important
to study this group because it is now recognized that, in northern and rural places, much
homelessness is largely invisible as many people cope with homelessness by finding others
who allow them to stay temporarily, such as through “couch surfing”, living in bush camps and
other strategies to remain hidden (Kauppi, O’Grady and Schiff et al., 2017).
This study shows that the hidden homeless population is larger than the absolutely
homeless subgroup in the Manitoulin-Sudbury District. While the former group very similar, on
many measures, to those who are absolutely homeless, nevertheless, in some ways it is more
disadvantaged. Compared to individuals who are absolutely homeless, more of those living with
hidden homelessness are Indigenous, young, in the LGBTQ2S population and chronically
homeless. More individuals report health challenges, job loss, unsafe housing conditions and
inability to pay rent or a mortgage. As relatively little has been known about people living with
hidden homelessness, the findings of the current enumeration study provide information to
better understand the issues and needs of this subgroup of the homeless population within
small, northern communities.
The prevalence of conflict and violence in relationships is an important factor linked to
homelessness in the current study. In identifying reasons for homelessness, responses to four
questions provide evidence about the extent to which homelessness is connected to conflict and
violence or abuse from spouses/partners or parents/guardians. Combining the responses
regarding reports of conflict and abuse as reasons for homelessness reveals the extent to which
homelessness results when people flee from conflict, abuse and violence.
The results of this study indicate that gender issues are central to understanding the
nature of homelessness in the Manitoulin-Sudbury District. Women were a majority of the
participants in the enumeration study. When the number of children is added to the number of
women, these two groups account for 60.5 percent of the sample. This finding shows that old
stereotypes and beliefs about homelessness as primarily a male phenomenon are inaccurate.
Policies and practices need to be developed to address the needs of women and children.
The indication too that Indigenous people are a majority of those who are homeless in
the Manitoulin-Sudbury District underscores the importance of ensuring that policies and
procedures are sensitive to the cultural differences between Indigenous and non-Indigenous
people in this region.

32
HOMELESSNESS IN MANITOULIN-SUDBURY: 2018 ENUMERATION
A further issue for consideration pertains to the weather during the April 2018
enumeration in relation to homelessness and decisions about lodging and accessing services.
While more moderate weather typically occurs in April, the spring weather in 2018 was
unusually cold, with temperatures falling as low as -8° C at night. On the day of data collection
at the Sudbury East food bank in Markstay on April 12th, a winter snowstorm took place, which
likely deterred people from attending the food bank and denied them the opportunity to
participate. In general, it has been understood that cold weather is a barrier to participation in
enumeration studies (Calgary Homeless Foundation, 2012).
The data provide for insights into the survival strategies of people living with
homelessness in the Manitoulin-Sudbury District. The responses to the enumeration question
about current lodging should be interpreted as likely places where participants may stay but not
as definite indications of their accommodations. In the current enumeration, a careful review of
each case was possible as the number of participants was relatively small at 122 adults or
adolescents. The examination of the totality of the questionnaire data provided insights into the
circumstances for people who indicated that they had a place of their own. In several cases,
individuals could not stay in these accommodations because they had been evicted or because
it was not safe for them to stay there. When people cannot stay in a housing unit for these
reasons, their status should be changed from at-risk to hidden or even absolutely homeless in
order to appropriately match their circumstances. The data for Manitoulin-Sudbury thus provide
information about the complexity of homelessness and the need for policy-makers, service
providers and researchers to learn about the true nature of the circumstances experienced. Also
affecting the categorization of individuals as absolutely homeless, in hidden homelessness or
at-risk is their own perspectives on homelessness. Many people do not want to think of
themselves as homeless and respond to survey questions according to these beliefs. For
example, a participant in a prior study stated that he had a home—it was the railyard.
Finally, it is important to put the findings of this enumeration project into context by
offering some comparison to prior studies. Calculating the rate of homelessness as a
percentage of the local population provides an indication of the extent of the problem. The
calculation shows that 157 individuals is one percent of the population of 15,692 (the number of
people living in the areas studied) and .56 of the total population of 28,107. One percent is the
same rate of homelessness as was found in our studies of North Bay in 2011 and Sudbury in
2015. If those at-risk are removed from the calculation, the rate is .52 of the sample (15,692)
and .29 of the total population (28,107), which is higher than all studies reported by Gaetz,

33
HOMELESSNESS IN MANITOULIN-SUDBURY: 2018 PERIOD PREVALENCE COUNT
Donaldson, Richter and Gulliver (2013) for Vancouver (0.27), Kelowna (0.24), Red Deer (0.31),
Lethbridge (0.12) and Toronto (0.19). Therefore, while the number of participants in the
enumeration of the Manitoulin-Sudbury District is relatively small for the large area covered by
the enumeration, the rate of one percent is as high as urban areas in the City of Greater
Sudbury which we have studied using the same methodology. Calculating the rate of
homelessness based on the total population of 28,107, using the number of people who were
living with absolute homeless and hidden homelessness, the rate is still higher than the
communities reported on by Gaetz et al.
Given the nature of the enumeration in the Manitoulin-Sudbury District, concentrated
within specific towns with no enumeration taking place in the remaining towns in the district, it is
more accurate to calculate the percentage of the total population by using the total population of
the towns studied. It may not be appropriate to include the population of towns not studied as
there is little very likelihood that people travelled to the areas where the enumeration was taking
place.
The enumeration activities are intended to provide information that lead to the
development of strategies to address and end homelessness. The results of the 2018
enumeration provided data about the issues and needs of people living with homelessness in
the Manitoulin-Sudbury District. Hidden homelessness is a relatively new aspect of
homelessness that has emerged in recent years (Kauppi et al., 2017). Learning how to address
the needs of this population can enable the Manitoulin-Sudbury District Services Board to
develop sound strategies for supporting people who are vulnerable and marginalized in small,
rural, northern communities. Adopting and pursuing the goal of reducing or eliminating all forms
of homelessness in the future is central to the development of policies and practices that will
enable the Manitoulin-Sudbury DSB to meet the needs of people struggling with homelessness
in the region.

HOMELESSNESS IN MANITOULIN-SUDBURY: 2018 ENUMERATION
34
References
Canadian Homelessness Research Network. (2012). Canadian Definition of Homelessness. Homeless Hub: www.homelesshub.ca/CHRNhomelessdefinition/ (accessed 7 March 2015).
Collectiva (2018). The Sixties Scoop Settlement. Montreal: Class action Services Inc. https://sixtiesscoopsettlement.info/Record.htm?record=191312491959&heading=Contact+us (accessed 30 August 2018).
FEANTSA (2006). ETHOS—Taking Stock. European Federation of National Associations Working with the Homeless / Fédération Européen d’Associations Nationales Travaillant avec les Sans-Abri. http://www.feantsa.org/spip.php?rubrique175&lang=en
Gaetz, S., Donaldson, J.,Richter, T. & Tanya Gulliver, T. (2013). The State of Homelessness in Canada 2013. Homeless Hub Paper #4. Canadian Homelessness Research Network Press. http://www.homelesshub.ca/SOHC2013 (accessed 7 March 2015).
Kauppi, C., Shaikh, A., Pallard, H. & Rawal, H. (2013). Understanding and Addressing Homelessness in a Northern Community—Timmins, Ontario. Report 2. A Comparative Study with Three Northern Ontario Communities. Report prepared for the Homelessness Partnering Strategy, Employment and Social Development Canada: Sudbury, Ontario: Centre for Research in Social Justice and Policy, Laurentian University.
Kauppi, C. (2017). Period Prevalence Counts of People Experiencing Homelessness: A Guide for Service Managers in Rural and Northern Communities. The Homelessness Secretariat, Ministry of Housing. Toronto, Ontario: Queens Printer for Ontario.
Kauppi, C., O’Grady, B., Schiff, R., Martin, F. and Ontario Municipal Social Services Association. (2017). Homelessness and Hidden Homelessness in Rural and Northern Ontario. Guelph, ON: Rural Ontario Institute.
Kauppi, C., Pallard, H., & Faries, E. (2015). Homelessness in Greater Sudbury: 2015 Period Prevalence Count. Report Prepared for the City of Greater Sudbury. Sudbury, Ontario: Centre for Research in Social Justice and Policy, Laurentian University. http://www3.laurentian.ca/homelessness/research/completed-research/
Kauppi, C. & Pallard, H. (2015). Poverty, homelessness and migration in Northeastern Ontario, Canada. The International Journal of Interdisciplinary Cultural Studies. 8 (Special Issue, 2015), pp. 11-22.
Ministry of Municipal Affairs and Housing (MMAH). (2015). A Place to Call Home, Queen’s Printer for Ontario.
Ontario Ministry of Municipal Affairs and Housing. (2017). Ministerial Directive to Service Managers under S. 19.1 of the Housing Services Act, 2011. http://www.mah.gov.on.ca/Page15242.aspx (accessed 30 August 2018).
Ontario Ministry of Housing (2018). Guidelines for Service Manager Homeless Enumeration. http://www.mah.gov.on.ca/AssetFactory.aspx?did=15968 (accessed 30 August 2018).
U.S. Department of Housing and Urban Development (HUD). (2012). The 2012 Point-In-Time Estimates of Homelessness. Volume 1 of the 2012 Annual Homeless Assessment Report. Washington, DC. https://www.hudexchange.info/resources/documents/2012AHAR_PITEstimates.pdf (accessed 7 March 2015).
U.S. Department of Housing and Urban Development (HUD). (2014). Point-in-Time Count Methodology Guide. Washington, DC. https://www.hudexchange.info/resources/documents/PIT-Count-Methodology-Guide.pdf (accessed 7 March 2015).
HOMELESSNESS IN MANITOULIN-SUDBURY: 2018 PERIOD PREVALENCE COUNT
35
APPENDIX A
HOUSING AND HOMELESSNESS IN NORTHEASTERN ONTARIO 2018 MANDATORY QUESTIONS FOR THE PROVINCE OF ONTARIO
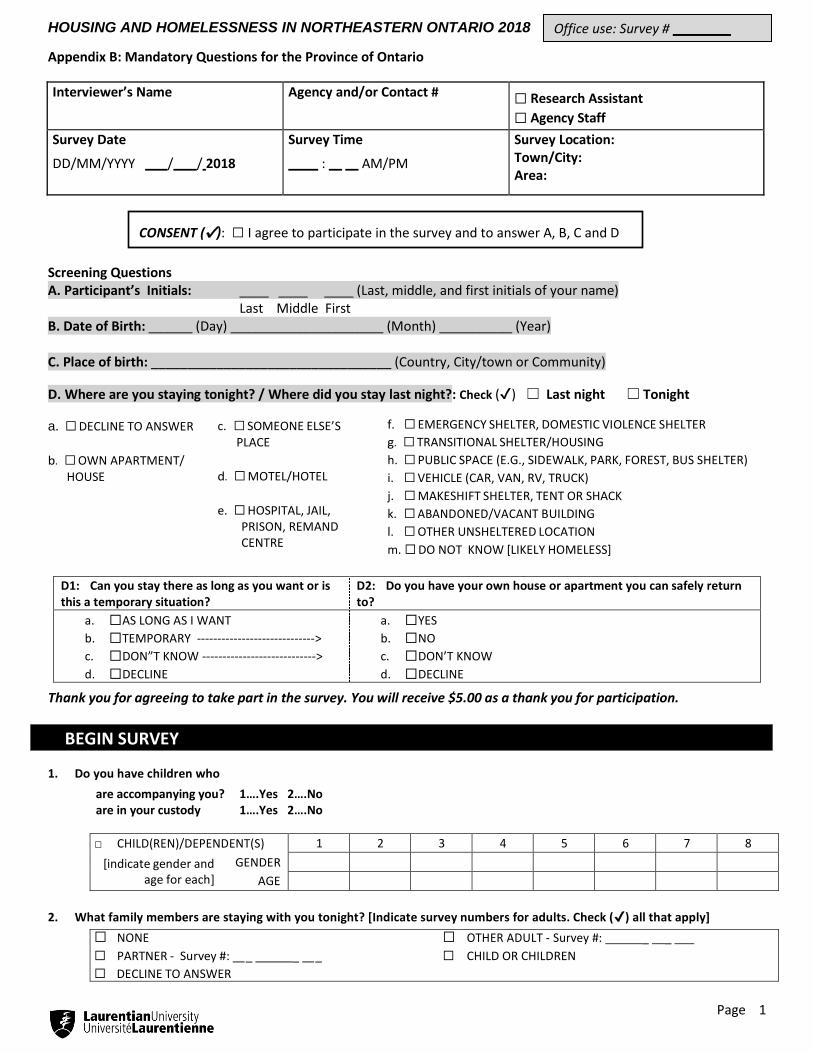
HOUSING AND HOMELESSNESS IN NORTHEASTERN ONTARIO 2018
Page 1
Office use: Survey # ________
_________________ Appendix B: Mandatory Questions for the Province of Ontario
Interviewer’s Name Agency and/or Contact # ☐ Research Assistant
☐ Agency Staff
Survey Date
DD/MM/YYYY / / 2018
Survey Time
: AM/PM
Survey Location: Town/City: Area:
Screening Questions A. Participant’s Initials: ____ ____ ____ (Last, middle, and first initials of your name)
Last Middle First B. Date of Birth: ______ (Day) _____________________ (Month) __________ (Year) C. Place of birth: _________________________________ (Country, City/town or Community) D. Where are you staying tonight? / Where did you stay last night?: Check (✔) ☐ Last night ☐ Tonight
a. ☐ DECLINE TO ANSWER
b. ☐ OWN APARTMENT/
HOUSE
c. ☐ SOMEONE ELSE’S PLACE
d. ☐ MOTEL/HOTEL
e. ☐ HOSPITAL, JAIL,
PRISON, REMAND CENTRE
f. ☐ EMERGENCY SHELTER, DOMESTIC VIOLENCE SHELTER
g. ☐ TRANSITIONAL SHELTER/HOUSING
h. ☐ PUBLIC SPACE (E.G., SIDEWALK, PARK, FOREST, BUS SHELTER)
i. ☐ VEHICLE (CAR, VAN, RV, TRUCK)
j. ☐ MAKESHIFT SHELTER, TENT OR SHACK
k. ☐ ABANDONED/VACANT BUILDING
l. ☐ OTHER UNSHELTERED LOCATION
m. ☐ DO NOT KNOW [LIKELY HOMELESS]
D1: Can you stay there as long as you want or is this a temporary situation?
D2: Do you have your own house or apartment you can safely return to?
a. ⬜AS LONG AS I WANT
b. ⬜TEMPORARY ----------------------------->
c. ⬜DON”T KNOW ---------------------------->
d. ⬜DECLINE
a. ⬜YES
b. ⬜NO
c. ⬜DON’T KNOW
d. ⬜DECLINE
Thank you for agreeing to take part in the survey. You will receive $5.00 as a thank you for participation.
BEGIN SURVEY
1. Do you have children who
are accompanying you? 1….Yes 2….No are in your custody 1….Yes 2….No
□ CHILD(REN)/DEPENDENT(S)
[indicate gender and GENDER age for each] AGE
1 2 3 4 5 6 7 8
2. What family members are staying with you tonight? [Indicate survey numbers for adults. Check (✔) all that apply]
⬜ NONE ⬜ OTHER ADULT - Survey #: _ _
⬜ PARTNER - Survey #: _ _ _ ⬜ CHILD OR CHILDREN
⬜ DECLINE TO ANSWER
CONSENT (✔): □ I agree to participate in the survey and to answer A, B, C and D

HOUSING AND HOMELESSNESS IN NORTHEASTERN ONTARIO 2018
Page 2
For the next questions, “homelessness” means any time when you have been without a secure place to live, including sleeping in shelters, on the streets/bush, or living temporarily with others.
3. In total, how much time have you been homeless over the PAST YEAR? [Best estimate.]
○ LENGTH _ DAYS | WEEKS | MONTHS ○ DON’T KNOW ○ DECLINE TO ANSWER
4. In total, how many different times have you experienced homelessness over the PAST YEAR? [Best estimate.]
○ NUMBER OF TIMES _ [Includes this time] ○ DON’T KNOW ○ DECLINE TO ANSWER
5. Do you identify as Indigenous or do you have Indigenous ancestry? This includes First Nations with or without status, Métis, and Inuit. [If yes, please specify.
○ YES ---------------------------------------------> ○ NO ○ DON’T KNOW ○ DECLINE TO ANSWER
If YES: ○ FIRST NATIONS Specify: ⬜ with status ⬜ non-status ○ INUIT ○ MÉTIS
○ HAVE INDIGENOUS ANCESTRY
6. People may identify as belonging to a particular racial group. For example, some people may identify as Black or African- Canadian, other people may identify as Asian or South Asian and other people may identify as white. What racialized identity do you identify with? [Do not list categories. Select all that apply]
□ ABORIGINAL/INDIGENOUS/MÉTIS specify _________________
□ INUIT □ ARAB □ ASIAN (E.G., CHINESE, KOREAN, JAPANESE, ETC.) □ SOUTH-EAST ASIAN (E.G., VIETNAMESE, CAMBODIAN,
MALAYSIAN, LAOTIAN, ETC.)
□ SOUTH ASIAN (E.G., EAST INDIAN, PAKISTANI, SRI LANKAN, ETC.)
□ WEST ASIAN (E.G., IRANIAN, AFGHAN, ETC.)
□ BLACK OR AFRICAN CANADIAN
□ FILIPINO □ HISPANIC OR LATIN AMERICAN □ WHITE (E.G., EUROPEAN-CANADIAN) □ OTHER (PLEASE SPECIFY) _ □ DON’T KNOW □ DECLINE TO ANSWER
7. In what language do you feel best able to express yourself?
○ ENGLISH ○ NO PREFERENCE ○ DON’T KNOW
○ FRENCH ○ NEITHER/OTHER (please specify) __ ○ DECLINE TO ANSWER
8. \Have you ever had any service in the Canadian Military or RCMP or did you serve in a peace keeping mission?
[Military includes Canadian Navy, Army, or Air Force]
□ YES, MILITAR Y □ YES, RCMP □ YES, PEACE KEEPING □ NO ○ DON’T KNOW □ DECLINE TO ANSWER
9. What gender do you identify with?
○ MALE / MAN ○ TRANS FEMALE / TRANS WOMAN ○ NOT LISTED: ○ FEMALE / WOMAN ○ TRANS MALE / TRANS MAN ○ DON’T KNOW ○ TWO-SPIRIT ○ GENDERQUEER/GENDER NON-CONFORMING ○ DECLINE TO ANSWER
10. How do you describe your sexual orientation, for example straight, gay, lesbian?
O STRAIGHT/HETEROSEXUAL o BISEXUAL o QUEER o DON’T KNOW O GAY o TWO-SPIRIT o NOT LISTED: o DECLINE TO ANSWER O LESBIAN o QUESTIONING
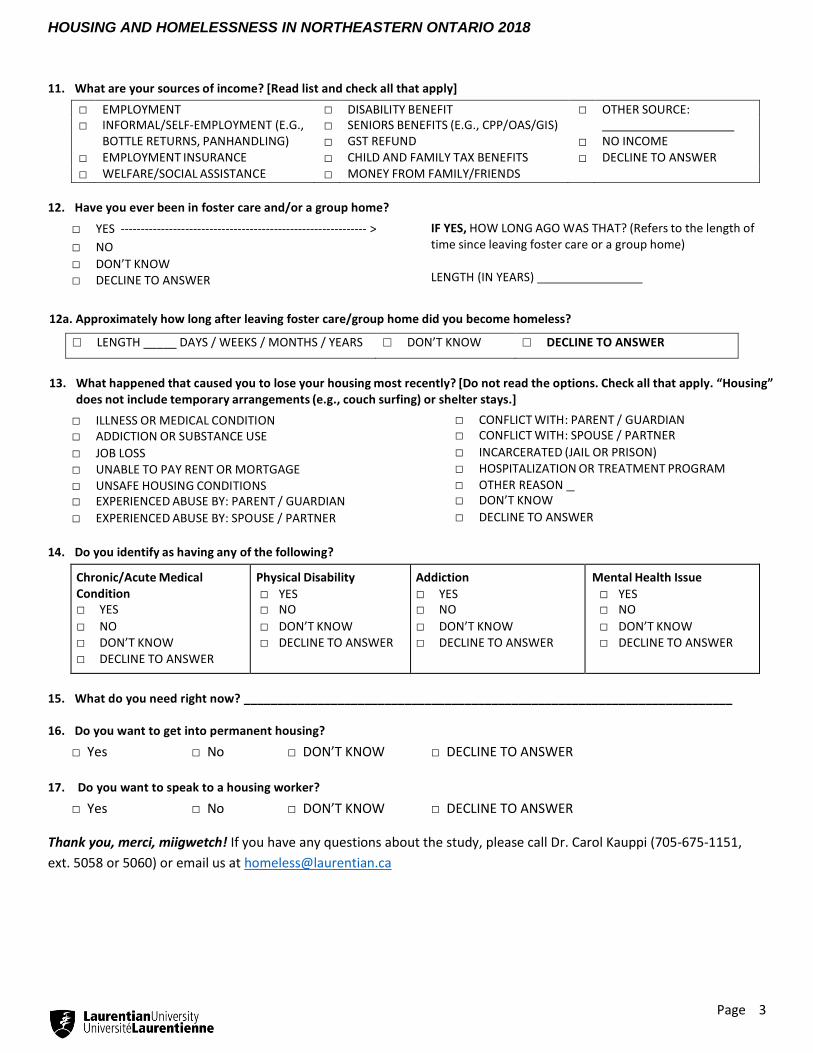
HOUSING AND HOMELESSNESS IN NORTHEASTERN ONTARIO 2018
Page 3
11. What are your sources of income? [Read list and check all that apply]
□ EMPLOYMENT □ DISABILITY BENEFIT □ OTHER SOURCE: □ INFORMAL/SELF-EMPLOYMENT (E.G., □ SENIORS BENEFITS (E.G., CPP/OAS/GIS)
BOTTLE RETURNS, PANHANDLING) □ GST REFUND □ NO INCOME □ EMPLOYMENT INSURANCE □ CHILD AND FAMILY TAX BENEFITS □ DECLINE TO ANSWER □ WELFARE/SOCIAL ASSISTANCE □ MONEY FROM FAMILY/FRIENDS
12. Have you ever been in foster care and/or a group home?
□ YES ------------------------------------------------------------- >
□ NO □ DON’T KNOW □ DECLINE TO ANSWER
IF YES, HOW LONG AGO WAS THAT? (Refers to the length of time since leaving foster care or a group home)
LENGTH (IN YEARS)
12a. Approximately how long after leaving foster care/group home did you become homeless?
□ LENGTH _____ DAYS / WEEKS / MONTHS / YEARS □ DON’T KNOW □ DECLINE TO ANSWER
13. What happened that caused you to lose your housing most recently? [Do not read the options. Check all that apply. “Housing” does not include temporary arrangements (e.g., couch surfing) or shelter stays.]
□ ILLNESS OR MEDICAL CONDITION □ ADDICTION OR SUBSTANCE USE □ JOB LOSS □ UNABLE TO PAY RENT OR MORTGAGE □ UNSAFE HOUSING CONDITIONS □ EXPERIENCED ABUSE BY: PARENT / GUARDIAN □ EXPERIENCED ABUSE BY: SPOUSE / PARTNER
□ CONFLICT WITH: PARENT / GUARDIAN □ CONFLICT WITH: SPOUSE / PARTNER □ INCARCERATED (JAIL OR PRISON) □ HOSPITALIZATION OR TREATMENT PROGRAM □ OTHER REASON □ DON’T KNOW □ DECLINE TO ANSWER
14. Do you identify as having any of the following?
Chronic/Acute Medical Condition □ YES □ NO □ DON’T KNOW □ DECLINE TO ANSWER
Physical Disability
□ YES □ NO □ DON’T KNOW □ DECLINE TO ANSWER
Addiction
□ YES □ NO □ DON’T KNOW □ DECLINE TO ANSWER
Mental Health Issue
□ YES □ NO □ DON’T KNOW □ DECLINE TO ANSWER
15. What do you need right now? _________________________________________________________________________
16. Do you want to get into permanent housing?
□ Yes □ No □ DON’T KNOW □ DECLINE TO ANSWER
17. Do you want to speak to a housing worker?
□ Yes □ No □ DON’T KNOW □ DECLINE TO ANSWER
Thank you, merci, miigwetch! If you have any questions about the study, please call Dr. Carol Kauppi (705-675-1151,
ext. 5058 or 5060) or email us at [email protected]
