home range and habitat preferences of terrapene...
TRANSCRIPT

Home Range and Habitat Preferences of Terrapene carolina carolina
at Jug Bay Wetlands Sanctuary, Maryland
Jenny Lentz1
Summer 2004 Jug Bay Fellow
Technical Report of the Jug Bay Wetlands Sanctuary
Jug Bay Wetlands Sanctuary, Lothian, MD 20711, USA
1 Undergraduate senior with an Interdisciplinary Concentration in Environmental Studies at Hamilton College

2
ABSTRACT
Terrapene carolina carolina (Eastern Box Turtle) home range size and habitat
preferences were studied over a 9 year period at the Jug Bay Wetlands Sanctuary in Maryland.
Males were found to have a mean home range of 1.51 ± SD 1.33 Ha; while females have a
significantly larger (t(20)=2.589, p=0.018) home range of 5.92 ± SD 7.49 Ha. The home range
estimates based on two commonly used data-collection methods, mark-recapture and telemetry,
were also compared to determine which was more accurate when compared to the overall home
range (based on compiled data from the 2 methods). Telemetry females and males were found to
have significantly different home ranges (t(16)=2.234, p=0.040), and the difference between
female random and compiled data was also found to be significant (t(21)=-2.465, p=0.022). To
increase confidence levels in the home range size study turtles were chosen from the database
based on 10+ sightings (29 on average). Females were found to use all 7 habitat types with no
significant preference, and males were found to use most of the habitats with similar frequency
to the females although they did use the meadow appreciably less and were never found in the
Phragmites. The significant size and diversity of female home ranges has important
implications, because without their recognition critical nesting habitats are likely to be left
overlooked by conservation plans putting T. c. carolina populations at risk.
KEY WORDS: Eastern Box turtle; home range; habitat; Maryland; tidal wetland; marsh
INTRODUCTION
There is currently an accelerating rate of decline in global biodiversity resulting in
impoverished and dysfunctional ecosystems (Ehrlich and Ehrlich, 1981); among the principal
causes for this decline are habitat loss, degradation, and fragmentation (Mitchell and Klemens,
2000). It is therefore no surprise that the primary cause of turtle population decline is the ever
increasing rates of habitat loss (Mitchell and Klemens, 2000); therefore understanding the home
range and habitat preferences of T. c. carolina is crucial for their conservation. Currently box
turtles are viewed as predominantly terrestrial; however, at the Jug Bay Wetlands Sanctuary
(Swarth, unpublished data) in Eastern Maryland female (and more rarely male) T. c. carolina
include the tidal wetlands in their home ranges. Since this appears to be the only reported case
of T. c. carolina using a tidal environment, it is important to determine the significance of this
habitat to box turtles.
3
Terrapene carolina carolina
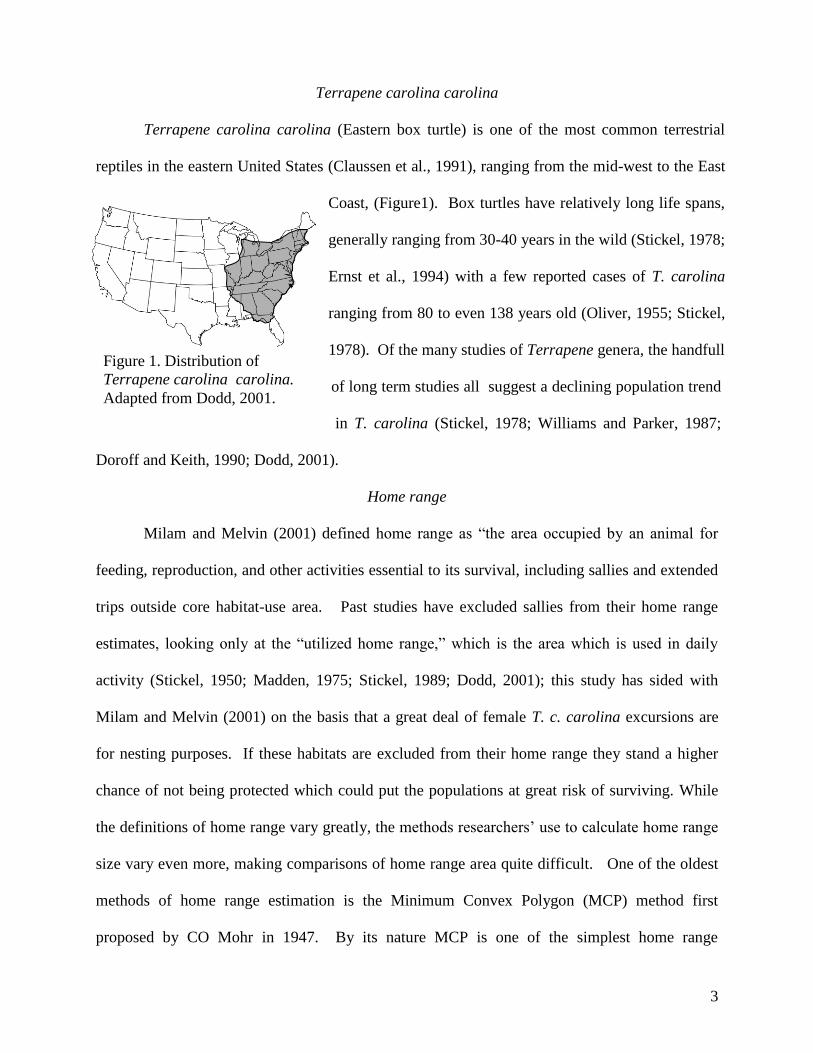
Terrapene carolina carolina (Eastern box turtle) is one of the most common terrestrial
reptiles in the eastern United States (Claussen et al., 1991), ranging from the mid-west to the East
Coast, (Figure1). Box turtles have relatively long life spans,
generally ranging from 30-40 years in the wild (Stickel, 1978;
Ernst et al., 1994) with a few reported cases of T. carolina
ranging from 80 to even 138 years old (Oliver, 1955; Stickel,
1978). Of the many studies of Terrapene genera, the handfull
of long term studies all suggest a declining population trend
in T. carolina (Stickel, 1978; Williams and Parker, 1987;
Doroff and Keith, 1990; Dodd, 2001).
Home range
Milam and Melvin (2001) defined home range as “the area occupied by an animal for
feeding, reproduction, and other activities essential to its survival, including sallies and extended
trips outside core habitat-use area. Past studies have excluded sallies from their home range
estimates, looking only at the “utilized home range,” which is the area which is used in daily
activity (Stickel, 1950; Madden, 1975; Stickel, 1989; Dodd, 2001); this study has sided with
Milam and Melvin (2001) on the basis that a great deal of female T. c. carolina excursions are
for nesting purposes. If these habitats are excluded from their home range they stand a higher
chance of not being protected which could put the populations at great risk of surviving. While
the definitions of home range vary greatly, the methods researchers’ use to calculate home range
size vary even more, making comparisons of home range area quite difficult. One of the oldest
methods of home range estimation is the Minimum Convex Polygon (MCP) method first
proposed by CO Mohr in 1947. By its nature MCP is one of the simplest home range
Figure 1. Distribution of
Terrapene carolina carolina.
Adapted from Dodd, 2001.

4
measurement methods because it is simply the area of a polygon formed by connecting the
outermost data points of an organism (Plummer, 2003). The main drawback to this method is
that it often includes areas in which the subject was never seen in, thus the accuracy of the
method is dependant on sample size. The second oldest method, and perhaps the most popular is
the Bivariate Normal Home Range method (Jennrich and Turner, 1969). The bivariate normal
method is based on the statistical distribution of sightings along an x-y axis, forming an ellipse.
This method stipulates that the data be normally distributed, which rarely happens in nature, and
the method inherently gives a less conservative home range estimation (Plummer, 2003). The
most recent method of home range estimation is the Kernel Home Range (Worton, 1989)
method. This method uses non-parametric statistics to determine the probability of an organism
using various locations (Plummer, 2003). This method operates with 95% accuracy because it
does not require the data be normally distributed, and it weights the home range boundaries
according to the frequency in which the areas are used. The only true drawback of this method is
that it requires special software to do the home range calculations.
According to Dodd (2001), most box turtles have fairly stable, well defined home ranges.
While the home ranges of many organisms tend to coincide with their territories, T. c. carolina
has not been found to exhibit any definite signs of territorialism (Stickel, 1989; Dodd, 2001).
Since there is no territorialism in T. c. the home ranges of these turtles overlap with one another.
Cross-study comparisons of male-female-juvenile home range sizes show that there is no definite
trend towards which sex or age class will have the smallest or largest home range size (Stickel,
1950; Legler, 1960; Schwartz and Schwartz, 1974; Dodd, 2001). While the exact boundaries of
the home range may shift over time, it appears the general area stays the same. Several studies in
which turtles were removed from their home ranges documented the displaced turtles returning
to their original home range (Breder, 1927; Nichols, 1939; Stickel, 1950).

5
Habitat
Due to their close proximity to the ground, T. carolina are especially sensitive to changes
in their surrounding substrate environment (Dodd, 2001); further they have a limited ability to
move between isolated habitat patches, resulting in genetic fragmentation ((Mitchell and
Klemens, 2000). Reagan (1974) found that thick canopied forests with complex habitat
structures offer ideal habitats for T. carolina by supplying the turtles with microhabitats which
offer cool shelter in the summer and warm protection for hibernating in the winter (Dodd, 2001).
While T. carolina are generally considered terrestrial in nature, several studies have found that T.
c. carolina may congregate in freshwater floodplains (Stickel, 1978; Dodd, 2001; Swarth
unpublished work). Upon observing T. c. carolina in the tidal wetlands in 1998, researchers at
Jug Bay Wetlands Sanctuary began telemetring the turtles in order to better understand their use
of the habitat, since it is the only known use of a tidal habitat by this species (Swarth,
unpublished work). While their overall use of aquatic habitats is not well understood, it is
generally agreed that water retention is essential to the survival T. c. carolina (Rose, 1969;
Riedesel et al., 1971; Dodd, 2001).
Many of the habitats other studies have identified as important to box turtles are
becoming endangered: 99% of the original “turtle-rich eastern deciduous forest biome” have
been lost, and freshwater wetlands are considered one of the most endangered global ecosystems
(Mitchell and Klemens, 2000). The most alarming part about the ever increasing rate of habitat
destruction is that habitat-related problems almost always have a synergistic effect (Mitchell and
Klemens, 2000).
Study Objective
The purpose of my study was to calculate and better understand the home range and
habitat preferences of Terrapene c. carolina (Eastern Box Turtle) found at Jug Bay Wetlands
6
3%
6% 11%
10%
25%
5% 40%
Meadow
Open Forest
Dense Forest
Flood Plain
Tidal Wetland
Phragmites
Scrub-Shrub
Sanctuary in South-eastern Maryland. Specifically this study hopes to answer the following
questions:
- How large are the home ranges of T. c. carolina, and do males differ from females?
- What habitats do their home ranges include?
- Does one home range measuring technique appear to be more accurate than another
(Telemetry vs. Mark Recapture)?
- What percentage of their observed sightings were the turtles using each habitat?
- Are some habitats preferred overall, or are the preferences individual?
It is my hope that in answering these questions resource managers will be better able to preserve
the habitats in which these turtles thrive and depend on.
MATERIALS & METHODS
Study site and habitat differentiation
Our study site of approximately 47Ha is located within the 566Ha Jug Bay Wetlands
Sanctuary, located along the Patuxent River in Southeastern Maryland. Jug Bay is an estuarine
research center owned by the Anne Arundel County Department of Recreation and Parks. Public
access within the sanctuary is limited to hikers, education groups, and researchers (Friebele et al.,
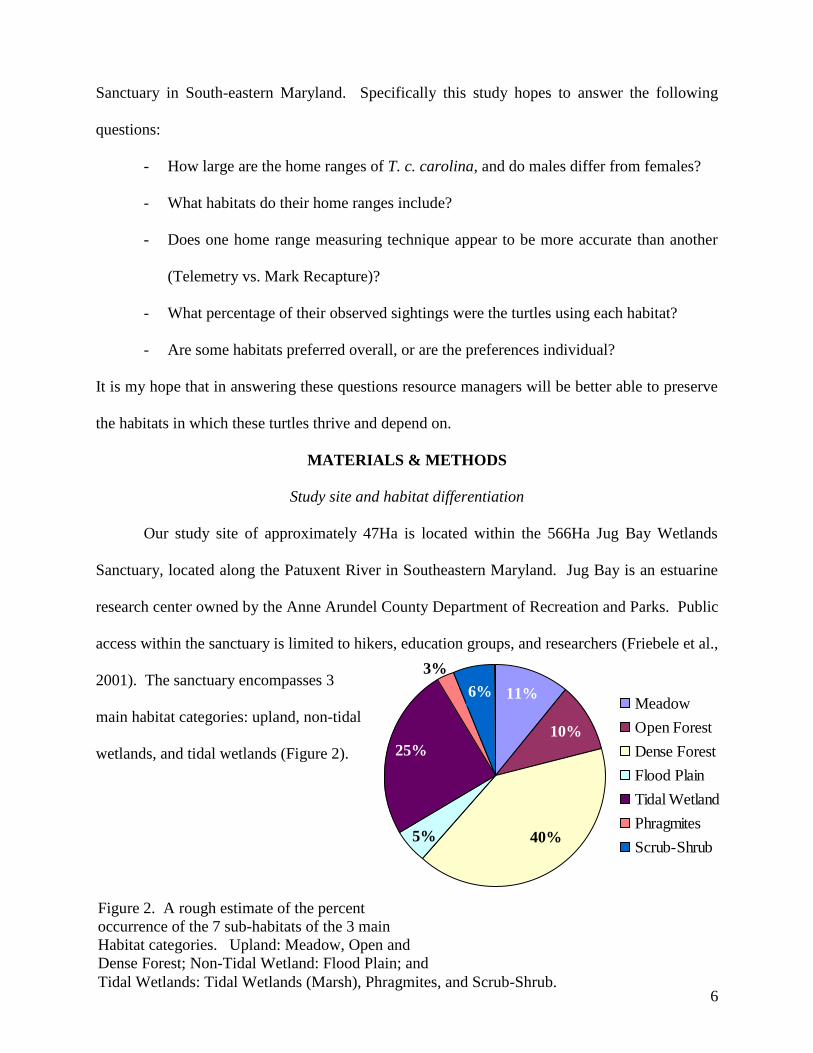
2001). The sanctuary encompasses 3
main habitat categories: upland, non-tidal
wetlands, and tidal wetlands (Figure 2).
Figure 2. A rough estimate of the percent
occurrence of the 7 sub-habitats of the 3 main
Habitat categories. Upland: Meadow, Open and
Dense Forest; Non-Tidal Wetland: Flood Plain; and
Tidal Wetlands: Tidal Wetlands (Marsh), Phragmites, and Scrub-Shrub.

7
Upland habitats consist of meadows (M), Open and Dense forests (OF and DF
respectively). The meadows are made up of warm season grasses, wire grasses, forbs, and shrub
patches (Marchand et al., 2003). Both types of forest consist predominantly of the following 30
to 80 year-old hardwood trees: Quercus falcata (Spanish Oak), Carya spp. (Hickory),
Liquidambar styraciflua (Sweet gum), Fagus grandifolia (American beech), Liriodendron
tulipifera (tuliptree), Acer rubrum (red maple), and Sassafras albidium (sassafras) (Burke and
Swarth, 1997); with an understory of Ilex opaca (American Holly) and Smilax rotundifolia
(Common Greenbriar). Open and dense forests vary only by their degree of canopy and
understory density.
Within the sanctuary there are several areas classified as non-tidal wetlands: the most
prominent of these areas is Two Run Creek which runs through the center of the property;
followed by several ponds and vernal pools. These area are non-tidal and are fresh in nature.
For the purposes of this study these areas will be referred to as flood plain (FP) habitats.
The tidal freshwater habitats are formed by the Patuxent River (a Chesapeake Bay
tributary), which are influenced by a salinity range of 0 to 1.0 ppt and 0.6m semi-diurnal tide
fluctuations. The tidal habitats are differentiated by the dominating vegetation: Scrub-Shrub
(SS), Phragmites (PH), and Tidal Wetlands (TW). The local SS wetlands are made up of
hummocks and the following woody shrubs and trees: Alnus spp. (Alder), Fraxinus
pennsylvanica (Green ash), and Cornus amomum (Silky Dogwood). The PH wetlands are
dominated by a common reed, Phragmites australis (phragmites). The wetland habitat (TW)
consists of the following marsh vegetation: Peltandra virginica (Arrow-Arum), Nuphar luteum
(Spadderdock), Zizania aquatica (Wild Rice) and Typha spp. (Cattails).

8
Analytical method
Habitat preference and home range size will be calculated based on data obtained
between 1995 and 2004 (Swarth, unpublished data) using two observation techniques: Mark
recapture and Radio-telemetry. Mark recapture is the most common form of box turtle
monitoring in the sanctuary because it is low-cost and provides general information on the size
of the home range and habitat use. In order to obtain more extensive information on home range
and habitat use radio telemetry was initiated in 1998. Telemetried turtles are affixed with a
2.5cm radio-transmitter, and then tracked every 2nd
-3rd
day by an antennae attached to a R4000
ATS receiver. For the purposes of this study, turtles found using purely the mark recapture
method will be deemed “random” sightings, since observations resulted from an observer
randomly encountering a turtle.
My study makes use of the 445 box turtles that have been marked by sanctuary staff,
interns and volunteers. In 1995 Jug Bay began marking T. c. Carolina by bringing the turtles
back to the lab where they were processed. The turtles are weighed with an Ohaus spring scale,
then their carapace length and width are measured with veneer calipers to the nearest mm. The
turtle is then assigned an identification number and a unique notch code. The notch code is a
combination of triangularly filled notches on the marginal scutes (Cagel, 1939). Various sex
determining characteristics are recorded, along with a photograph of the plastron and a precise
description and map of the location in which it was found. In order to increase the accuracy of
the sightings data, PVC pipe poles were installed using GPS in 2002 around the sanctuary
marking off 1 Ha2 grid system.
This study sample consists of 20 females, 17 males, and 3 juveniles. These turtles were
chosen because there were a large number of sightings (10 minimum, average 29) which could
be plotted on a grid map with confidence, and most of which had been found using both home
9
range methods. Home range size is calculated for each turtle using the Minimum Convex
Polygon method. The polygon method estimates home range size by connecting the peripheral
sighting locations with a straight line. The size of each home range was found by cutting out
area of each mapped home range and weighing it on a Sartorius analytical balance. The area size
was found by dividing the range weight by the weight of a cut out of a Ha2 plot scaled to their
map.
Habitat preference was calculated by determining the percent habitat use based on the
total number of sightings of each turtle in each of the seven habitats. As with the home range
calculations, the habitat percentages were calculated according to random, telemetry, and
compiled data. To limit observer error, the original habitat descriptions for the turtle locations
will be ignored; instead grid locations used for the home range estimates will be plotted on a
habitat color-coded map made by State Department cartographer and sanctuary volunteer Dave
Linthicum (Appendix II). The habitat categories, as described above, are Meadow (M), Open
forest (OF), Dense forest (DF), Flood Plain (FP), Tidal Wetland (TW), Phragmites (PH), and
Scrub-Shrub (SS).
Data Analysis
T-tests were used to determine if there was a significant difference between male and
female home range sizes. The two home range measurement methods were also compared using
T-tests. Due to a low sample size (n=3) juveniles were excluded from the statistical analysis.
RESULTS
Home Range Size
Analysis of data compiled over a 9-year period (1995 – 2004) of 40 T. c. carolina
resulted in 1,153 sightings. Males exhibited the smallest mean home range and were localized to
a grid area of 49 Ha. Females and juveniles encompassed a much larger grid area, 130 Ha and

10
84 Ha respectively (Appendix III). Juveniles had the largest mean home range (8.96Ha),
followed by females (5.92Ha) and males having the smallest mean home range (1.51 Ha) (Table
1). Females had the largest home range size (30.11 Ha Maximum) while males had the smallest
home range (0.34Ha Minimum). As well as having the largest home range size females also
exhibited the largest range in home range (29.10 Ha), followed by juveniles (23.30 Ha); while
males had a substantially smaller range (5.62 Ha).
Figure 3 shows the variance between the two age-sex categories and the two methods of
home range estimation as well as the total (compiled) home range size for all 40 turtles. Figure 4
0
5
10
15
20
25
30
35
Hom
e R
an
ge
Siz
e (H
a)
Mark-Recapture Telemetry Compiled
Females (n=20) Males (n=17) Juveniles (n=3)
simplifies the above figure by comparing the mean home range size for the three categories of
turtles. T-tests showed a significant difference between overall Female and Male home ranges
Table 1. Home range size for female, male and juvenile T. c. carolina
Mean SD SE n Sample
Variance
Confidence
Level (95%)
Females 5.92 Ha 7.49 Ha 1.67 Ha 20 56.07 3.50
Males 1.51 Ha 1.33 Ha 0.32 Ha 17 1.77 0.68
Juveniles 8.96 Ha 12.80 Ha 7.39 Ha 3 163.79 31.79
Figure 3. Comparison of home range size using mark-recapture and telemetry sightings, as
well as the compiled sightings data.
0
5
10
15
20
25
30
35
Ho
me
Ra
ng
e S
ize
(Ha
)
Mark-Recapture Telemetry Compiled
Females (n=20) Males (n=17) Juveniles (n=3)

11
0
5
10
15
20
25
Female
(n=20)
Male (n=17) Juvenile
(n=3)
Mea
n H
om
e R
an
ge
Are
a (
Ha)
Random Telemetry Compiled
Jug Bay Plot Stickel’s Plot
Males Males
Females Females
Figure 4: Comparison of Jug Bay Male and Female
home ranges in a 5 acre (2.025 Ha) plot vs the plotted
areas of male and female T. c. carolina in the same size
plot from Stickel’s 1950 study.
(t(20)=2.589, p=0.018) as well as those measured using telemetry (t(16)=2.234, p=0.040) (Table
2). Female Random and Compiled home range estimates were also shown to be significantly
different (t(21)=-2.465, p=0.022). The female random and telemetry comparison appeared to be
strong but it was not statistically significant;
while the remaining categories showed no strong
or significant differences in home range size.
Figure 5 compares the male and female
home overlapping ranges in the same 5 acre plot,
with overlapping male and female home ranges in
the same size plot, documented by Stickel in
1950. Overall home range sizes were found to be
much larger than those found in past studies
(Table 3).
Figure 4. Mean home range size with
standard deviation plotted in the error bars.
Table 2. Home range statistical comparisons
Factors being
compared df T-Stat p
Fem
ale
vs.
Male
Random 25 1.706 0.100
Telemetry 16 2.234 0.040*
Compiled 20 2.589 0.018*
Fem
ale
Random vs. Telemetry 17 -2.036 0.058
Random vs. Compiled 21 -2.465 0.022*
Telemetry vs. Compiled 33 -0.063 0.950
Male
Random vs. Telemetry 23 -1.217 0.236
Random vs. Compiled 29 -1.412 0.169
Telemetry vs. Compiled 25 -0.411 0.685
* indicates a significant difference
Figure 5. Comparison of Jug Bay Male and
Female home ranges in 5 acre (2.025 Ha) plots
with the plotted areas from Stickel’s 1950 study
of male and female T. c. carolina in the same
size plot.
Scale
150ft
0 |–―|–―――| 2.025 Ha
45.72 m

12
Habitat Preference
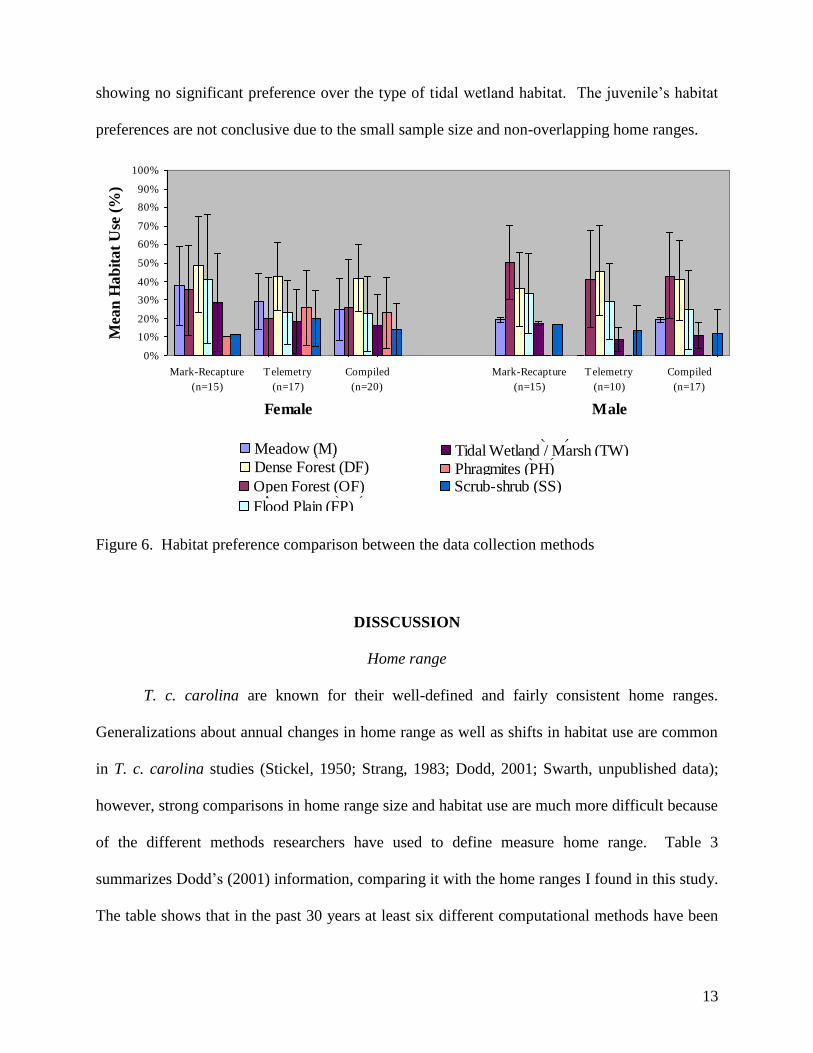
The upland habitats (open and dense forest) were used the most by all three age-sex
categories, while the tidal wetlands (marsh, Phragmites, and scrub-shrub) were used the least
(Figure 6). Even though turtles used the other two tidal wetlands there were no observations of
males in Phragmites; the freshwater flood plain, however, proved to be male’s preferred aquatic
environment. Females used all seven habitats, using the meadow more than the males and
Table 3. A comparison of T. c. carolina home ranges using different measuring and computation
methods (adapted from Dodd, 2001).
Location Collection
Method
Computation
Method*
Area (Ha) n Reference
Mean Range
MD Mark-recapture
Telemetry
Combined
MCP ♀1.70; ♂0.93
♀5.76; ♂1.35
♀5.92; ♂1.50
♀4.22; ♂3.55
♀29.75; ♂2.43
♀29.10; ♂5.62
♀15; ♂15
♀17; ♂10
♀20; ♂17
This study
MD Mark-recapture BNE
♀1.13; ♂1.20
♀52; ♂51
Stickel (1989)
MD Thread trailing CP 0.20 0.48 11 Hallgren-Scaffidi
(1986)
VA Telemetry MA
O-U
1.25
2.47
1.80
3.30
6 Bayless (1984)
MO Mark-recapture -- ♀5.1; ♂5.2 10.00 ♀16; ♂21 Schwartz et al.
(1984)
TN Telemetry CP 0.38 0.30 4 Davis (1981)
NY Telemetry
BNE
MP
CP
6.95
2.12
4.05
17.80 23 Madden (1975)
MO Mark-recapture -- ♀1.45; ♂1.53 3.50 ♀64; ♂79 Schwartz &
Schwartz (1974)
*Computation Method Key: Bivariate Normal Elipse (BNE); Minimum Polygon (MP); Convex Polygon (CP); Minimum Convex
Polygon (MCP); Minimum Area (MA); Ornstein-Uhlenbeck (O-U)
13
showing no significant preference over the type of tidal wetland habitat. The juvenile’s habitat
preferences are not conclusive due to the small sample size and non-overlapping home ranges.
0%
10%
20%
30%
40%
50%
60%
70%
80%
90%
100%
Mark-Recapture
(n=15)
Telemetry
(n=17)
Compiled
(n=20)
Mark-Recapture
(n=15)
Telemetry
(n=10)
Compiled
(n=17)
Mea
n H
ab
ita
t U
se (
%)
Meadow (M) Open Forest (OF)Dense Forest (DF) Flood Plain (FP)Tidal Wetland / Marsh (TW) Phragmites (PH)Scrub-shrub (SS)
Female Male
0%
10%
20%
30%
40%
50%
60%
70%
80%
90%
100%
Mark-Recapture
(n=15)
Telemetry
(n=17)
Compiled
(n=20)
Mark-Recapture
(n=15)
Telemetry
(n=10)
Compiled
(n=17)
Mea
n H
ab
itat
Use
(%
)
Meadow (M) Open Forest (OF)Dense Forest (DF) Flood Plain (FP)Tidal Wetland / Marsh (TW) Phragmites (PH)Scrub-shrub (SS)
Female Male
DISSCUSSION
Home range
T. c. carolina are known for their well-defined and fairly consistent home ranges.
Generalizations about annual changes in home range as well as shifts in habitat use are common
in T. c. carolina studies (Stickel, 1950; Strang, 1983; Dodd, 2001; Swarth, unpublished data);
however, strong comparisons in home range size and habitat use are much more difficult because
of the different methods researchers have used to define measure home range. Table 3
summarizes Dodd’s (2001) information, comparing it with the home ranges I found in this study.
The table shows that in the past 30 years at least six different computational methods have been
Figure 6. Habitat preference comparison between the data collection methods
14
used to measure home range size. The table shows the great degree of variation in reported
home range sizes, even within the same study areas.
Overall, the ranges of the Jug Bay T. c. carolina were much larger than those reported
elsewhere, while having the third largest sample size. The difference in home range size may be
due to how each study defined home range, whether it was the total home range or the “utilized
home range” (Madden, 1975 in Dodd, 2001). Another difference may be in how strong the mean
areas were for the past studies. Stickel (1950) used turtles who had 6+ sightings (8 on average),
whereas, my study uses turtles with 10+ sightings (29 on average), thus making the confidence
of my home ranges stronger. Past studies have found an inverse relationship between population
size and home range size (Stickel, 1989), which would indicate that the large home ranges of the
Jug Bay Terrapenes indicates a small population. However, the nine year on-going study at the
sanctuary indicates a large T. c. carolina population with at least 445 turtles (as of July 2004).
Being non-territorial by nature, T. c. carolina are always found with overlapping home ranges
(Stickel, 1950; Dodd, 2001). Interestingly, despite the large home range size the degree of
overlap within the sanctuary is much larger than in Stickel’s 1950 study (Figure 4). Given the
contrary findings of no inverse population-home range relationship, Jug Bay’s high density-high
home range size relationship is more likely explained by Madden’s (1975) theory that high turtle
densities in specific areas reflect the criticalness of that specific habitat.
Habitat Preferance
As has been the case in past studies (Strang, 1983), there was no significant preference
among the seven habitat types. The T. c. carolina were found to be more abundant in upland
habitats but not to a significant degree. It is very clear that females occupy a much larger and
more diverse area of the Sanctuary, than the males. This is due to the nesting requirements of
females. As Figure 4 shows, there is significant overlap among home ranges within a relatively

15
small area (~2 Ha). The plot in Figure 5 is made up of the three most used habitats: flood plain,
open and dense forest. It is therefore no surprise the high degree of overlap within this area.
Females overall were seen using more habitats than males, which is most likely because of they
require the meadow and wetlands in their nesting preparations. It is important to note that while
the turtles are clearly using the tidal wetlands to a lesser extent than the upland habitats, there is a
very strong observer bias against finding the turtles in this habitat through the mark-recapture
method for the simple reason that the marshes are very dense and difficult to walk around in.
Study Limitations
Home Range estimates. The Bivariate Normal method was one of the most commonly
used home range measuring methods; however, it has been found to greatly exaggerate the home
range size by including areas the turtle never visits. The Minimum Convex Polygon (MCP)
method is also popular, thus making it the preferred estimate method for comparing reported
home ranges of T. c. carolina. It is important to acknowledge that there is a more accurate
home range measuring method available today, the Kernel Home Range method. While fewer
studies have used this method due to its relatively recent development, it by nature defines home
ranges more accurately than MCP by weighting the importance of certain, more frequented,
areas of the home range. Given more time it would be interesting to run Kernel estimating
software on the data set and compare the MCP home ranges with KNL models.
Conclusion
The most important findings of my study were that females’ home range was
significantly larger than that of males. This has important conservational implications, because
larger, more diverse areas need to be protected in order to insure population health. It is
therefore dangerous to average male and female home ranges, as past research has done, because
it risks the omission of crucial nesting habitats.
16
ACKNOWLEDGEMENTS
I wish to thank Chris Swarth for all his extensive assistance and guidance; Mike Quinlan,
Ramona Sampsell, Anna Moyer and countless other volunteers and staff who have helped collect
observation data over the past 9 years; Jug Bay Wetlands Sanctuary for their logistical support,
and the Friends of Jug Bay, without whose financial support this study would not have been
possible.
WORKS CITED
Breder, R.B. 1927. Turtle trailing: a new technique for studying the life habitats of certain
Testudinata. Zoologica 9:231-243.
Burke, J., AND Swarth, C. W. 1997. Tree and Shrub Habitats at Jug Bay Wetlands Sanctuary. A
Jug Bay Wetlands Sanctuary Technical Report. 19 pp.
Cagel, F.R. 1939. A system for marking turtles for future identification. Copeia 1939:170-73.
Claussen, D.L., Daniel, P.M., Jiang, S., AND Adams, N.A. 1991. Hibernation in the Eastern Box
Turtle, Terrapene c. carolina. p. 334-341.
Dodd, C.K. 2001. North American Box Turtles: A natural history. University of Oklahoma
Press: Norman, Oklahoma. p. 39-175.
Doroff, A.M., AND Keith, L.B. 1990. Demography and ecology of an Ornate Box Turtle
(Terrapene ornata) population in south-central Wisconsin. Copeia 1990:387-399.
Ehrlich, P.R. AND Ehrlich, A.H. 1981. Extinction: The Causes and Consequences of the
Disappearance of Species. Random House, New York.
Ernst, C.H., Lovich, J.E., AND Barbour, R.W. 1994. Terrapene carolina (Linnaeus, 1758)
Eastern box turtle. In: Turtles of the United States. Smithsonian Institution Press.
Washington, D. C. p. 250-265.
17
Friebele, E., Swarth, C.W., AND Stafford, K. 2001. The Ecology and History of Jug Bay: A
Volunteer’s Guide. 90 pp.
Jennrich, R.I., AND Turner, F.B. 1969. Measurement of non-circular home rane. Journal of
Theoretical Biology 22:227-237.
Legler, J.M. 1960. Natural History of the Ornate box turtle, Terrapene ornata ornata Agassiz.
Univ. Kansas Publ., Mus. Nat. Hist. 11:527-669.
Madden, R. 1975. Home range, movements, and orientation in eastern box turtle, Terrapene
carolina carolina. Unpublished Ph.D. Dissertation, City University of New York. 217pp.
Marchand, M.N., Quinlan, M.M., AND Swarth, C.W. 2003. Movement patterns and habitat use of
Eastern box turtles at the Jug Bay Wetlands Sanctuary, Maryland. In: Conservation and
ecology of turtles of the Mid-Atlantic region. p. 55-61.
Milam, J.C., AND Melvin, S.M. 2001. Density, Habitat Use, Movements, and Conservation of
Spotted Turtles (Clemmys guttata) in Massachusetts. Journal of Herpetology 35(3):418-427.
Mitchell, J.C., AND Klemens, M.W. (2000) Chapter 1: Primary and secondary effects of habitat
alteration. In: Turtle Conservation. Ed. Klemens, M.W. Smithsonian Institution Press.
Washington. p. 5-32.
Mohr, C. O. 1947. Table of equivalent populations of North American mammals. American
Midland Naturalist 37:233-249.
Nichols, J.T. 1939. Range and homing of individual box turtles. Copeia 1939:125-127.
Oliver, J. A. 1955. The natural history of North American amphibians and reptiles. D. Van
Nostrand Co. Princeton, New Jersey. 359 pp.
Plummer, M. 2003. “Movement and Home Range Ecology” Fall 2003 Ecology Laboratory.
Department of Biology, Harding University. Availiable:
http://www.harding.edu/USER/plummer/WWW/ecology/ecolab/movementlab.htm.

18
Reagan, D.P. 1974. Habitat selection in the three-toed box turtle, Terrapene carolina triunguis.
Copeia 1974:512-527.
Riedesel, M.L., Cloudsley-Thompson, J.L., AND Cloudsley-Thompson, J.A. 1971. Evaporative
thermoregulation in turtles. Physiol. Zool. 44:28-32.
Rose, F.L. 1969. Tortoise chin glands fatty acid composition: behavioral significance. Comp.
Biochem. Physiol. 32:577-580.
Schwartz, C.W., AND Schwartz, E.R. 1974. The three-toed turtle in central Missouri: its
population, home range, and movements. Missouri Department of Conservation
Terrestrial Series 5:1-28.
Stickel, L.F. 1950. Populations and home range relationships of the box turtle, Terrapene c.
carolina (Linnaeus). Ecol. Monog. 20(4):351-378.
, 1978. Changes in a box turtle population during three decades. Copeia 1978:221-225.
, 1989. Home range behavior among box turtles (Terrapene c. carolina) of a Bottomland
forest in Maryland. Journal of Herpetology 23(1):40-44.
Strang, C.A. 1983. Spatial and temperal activity patterns in two terrestrial turtles. Journal of
Herpetology 17:43-47.
Swarth, C. W. unpublished work.
Williams, E.C., AND Parker, W.S. 1987. A long term study of a box turtle (Terrapene carolina)
population at Allee Memorial Woods, Indiana, with emphasis on survivorship.
Herpetological 43:328-335.
Worton, B.J. 1989. Kernel methods for estimating the utilization distribution in homerange
studies. Ecology 70:164-168.
19
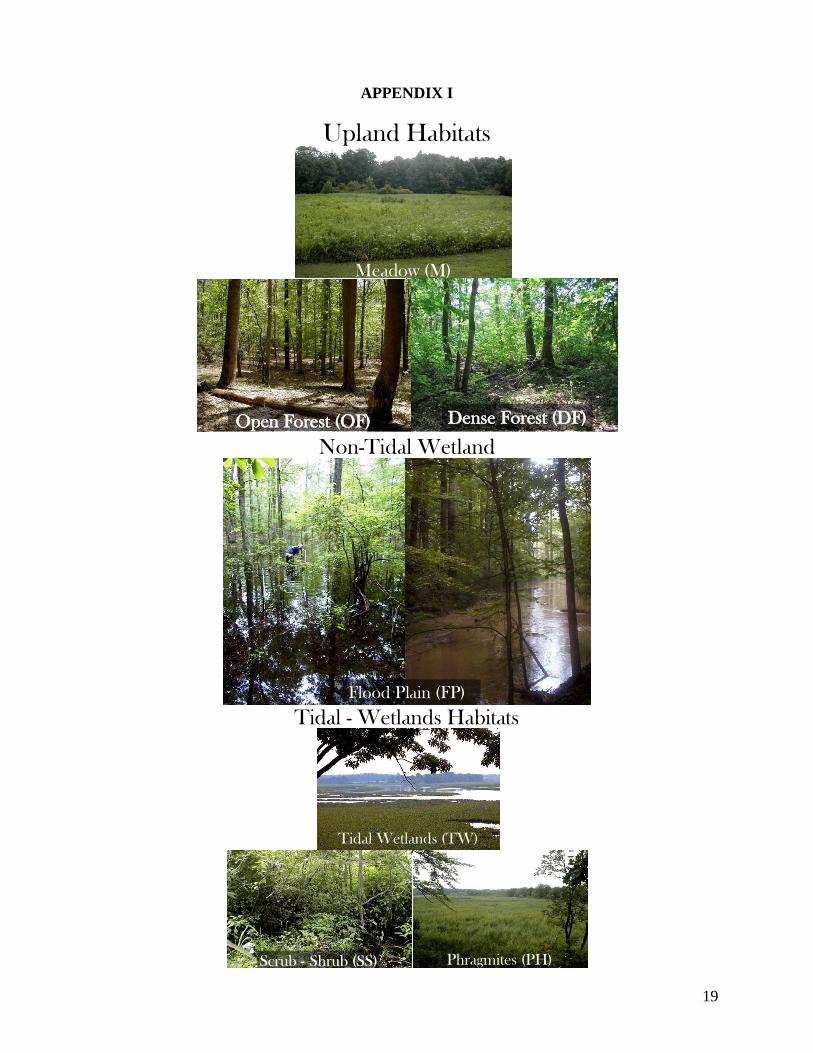
APPENDIX I
Open Forest
Upland Habitats
Dense Forest (DF)Open Forest (OF)
Meadow (M)
Non-Tidal Wetland
Flood Plain (FP)
Tidal - Wetlands Habitats
Phragmites (PH)
Tidal Wetlands (TW)
Scrub Scrub -- Shrub (SS)Shrub (SS)

20
APPENDIX II
Upland Habitats Non-Tidal Wetlands Tidal Wetlands
Meadow (M) Flood Plain (FP) Scrub-Shrub (SS)
Open Forest (OF) Phragmites (PH)
Dense Forest (DF) TidalWetland (TW)
21
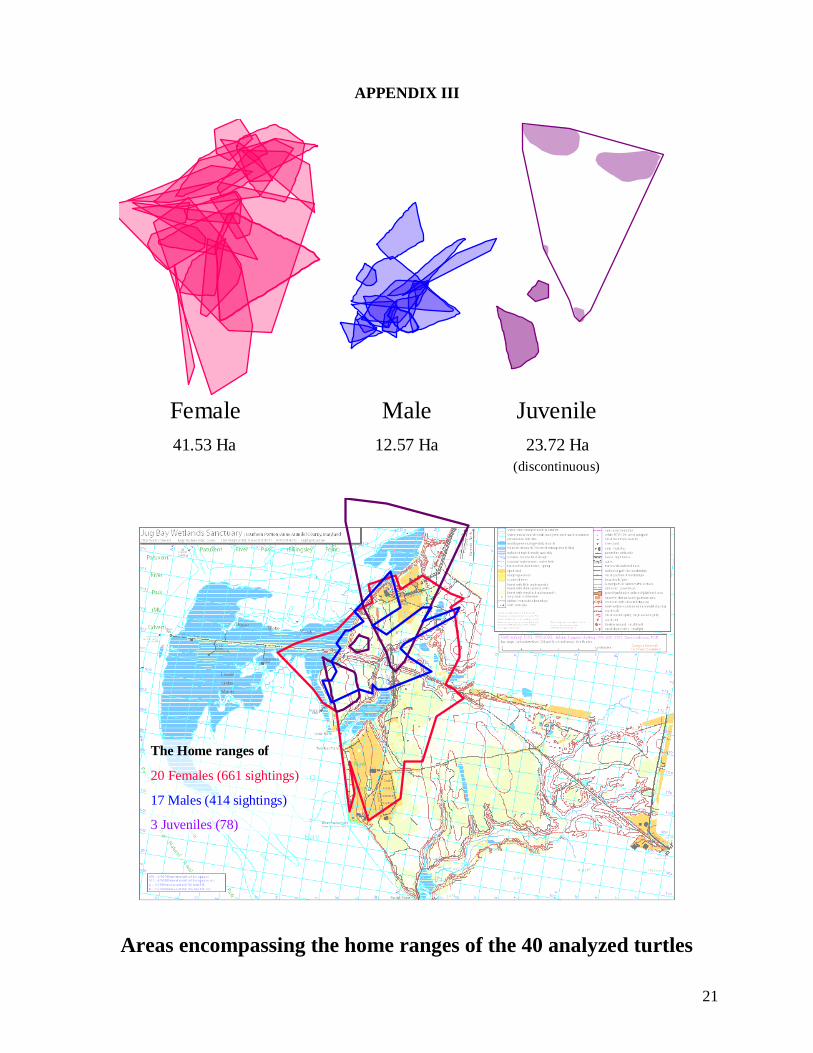
APPENDIX III
Total Home Range Comparison
Female Male Juvenile
41.53 Ha 12.57 Ha 23.72 Ha
(discontinuous)
The Home ranges of
20 Females (661 sightings)
17 Males (414 sightings)
3 Juveniles (78)
Areas encompassing the home ranges of the 40 analyzed turtles