holt algebra 2 2-3 graphing linear functions meteorologists begin tracking a hurricane's...
TRANSCRIPT

Holt Algebra 2
2-3 Graphing Linear Functions
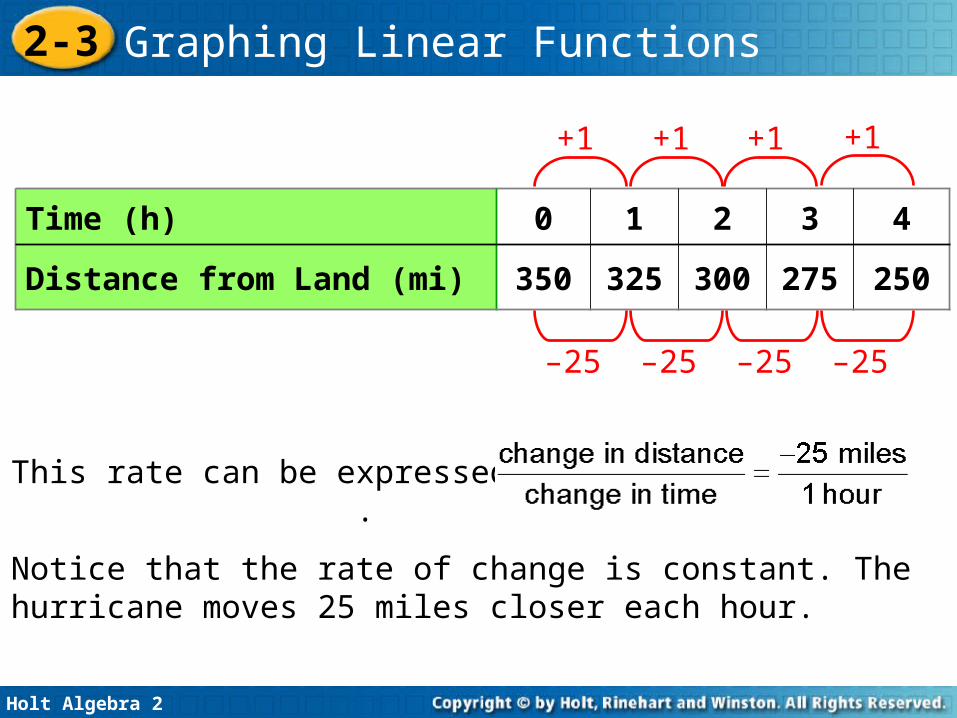
Meteorologists begin tracking a hurricane's distance from land when it is 350 miles off the coast of Florida and moving steadily inland.The meteorologists are interested in the rate at which the hurricane is approaching land.
Holt Algebra 2
2-3 Graphing Linear Functions
Time (h) 0 1 2 3 4
Distance from Land (mi) 350 325 300 275 250
+1
–25
+1
–25
+1
–25
+1
–25
This rate can be expressed as .
Notice that the rate of change is constant. The hurricane moves 25 miles closer each hour.
Holt Algebra 2
2-3 Graphing Linear Functions
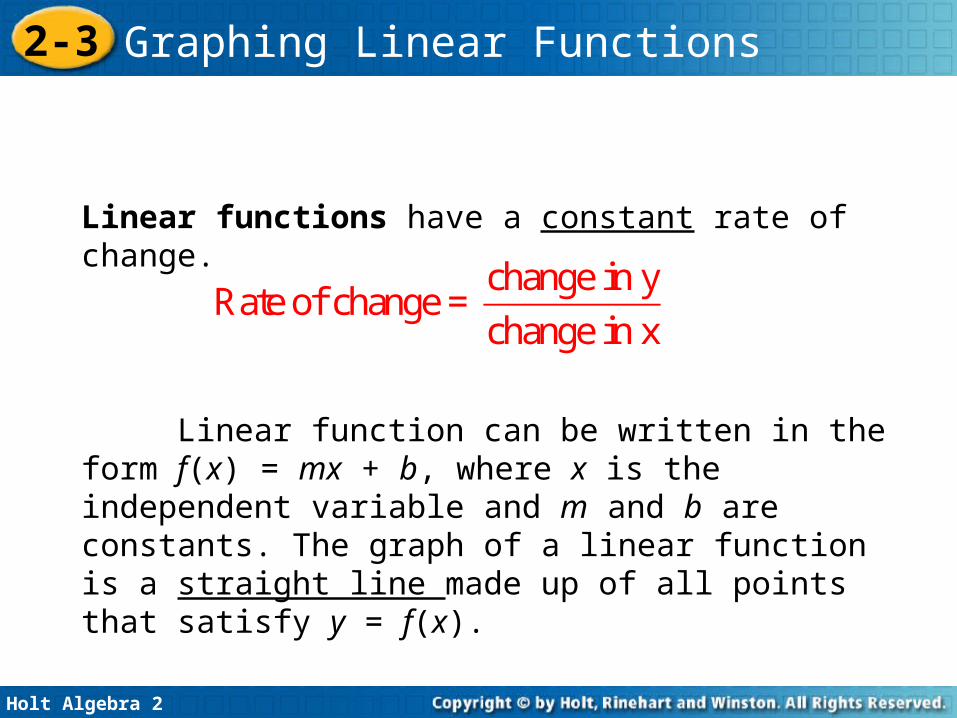
Linear functions have a constant rate of change.
Linear function can be written in the form f(x) = mx + b, where x is the independent variable and m and b are constants. The graph of a linear function is a straight line made up of all points that satisfy y = f(x).
Holt Algebra 2
2-3 Graphing Linear Functions
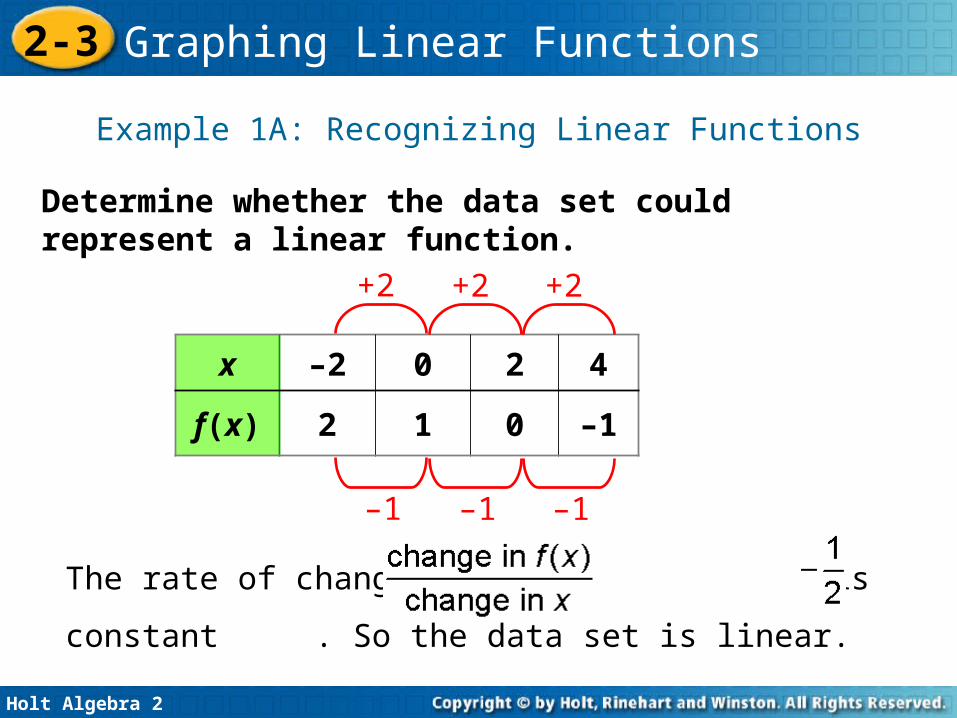
Determine whether the data set could represent a linear function.
Example 1A: Recognizing Linear Functions
x –2 0 2 4
f(x) 2 1 0 –1
+2
–1
+2
–1
+2
–1
The rate of change, , is
constant . So the data set is linear.

Holt Algebra 2
2-3 Graphing Linear Functions
Determine whether the data set could represent a linear function.
Example 1B: Recognizing Linear Functions
x 2 3 4 5
f(x) 2 4 8 16
+1
+2
+1
+4
+1
+8
The rate of change, , is
not constant. 2 ≠ 4 ≠ 8. So the data
set is not linear.

Holt Algebra 2
2-3 Graphing Linear Functions
The constant rate of change for a
linear function is its slope. The
slope of a linear function is the
ratio , or .The slope of a line is the same
between any two points on the line.
You can graph lines by using the
slope and a point.
Holt Algebra 2
2-3 Graphing Linear Functions
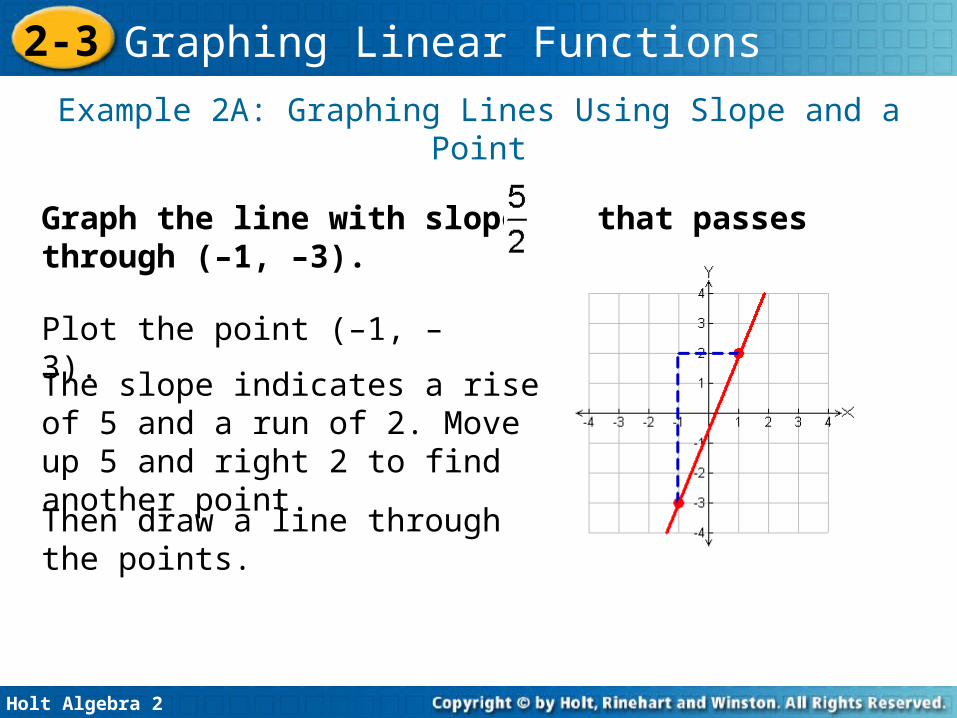
Example 2A: Graphing Lines Using Slope and a Point
Plot the point (–1, –3).
Graph the line with slope that passes through (–1, –3).
The slope indicates a rise of 5 and a run of 2. Move up 5 and right 2 to find another point. Then draw a line through the points.
Holt Algebra 2
2-3 Graphing Linear Functions
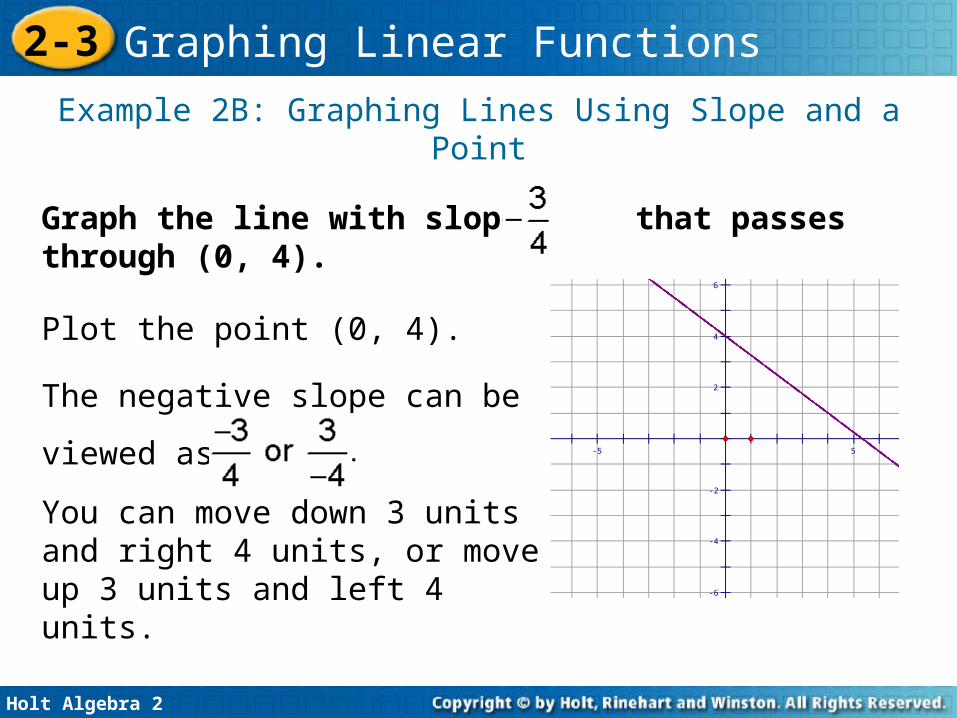
Example 2B: Graphing Lines Using Slope and a Point
Plot the point (0, 4).
Graph the line with slope that passes through (0, 4).
You can move down 3 units and right 4 units, or move up 3 units and left 4 units.
The negative slope can be
viewed as
6
4
2
-2
-4
-6
-5 5

Holt Algebra 2
2-3 Graphing Linear Functions
Recall from geometry that two points determine a line. Often the easiest points to find are the points where a line crosses the axes.
The y-intercept is the y-coordinate of a point where the line crosses the y-axis.
The x-intercept is the x-coordinate of a point where the line crosses the x-axis.

Holt Algebra 2
2-3 Graphing Linear Functions
To find the x-intercept of the equation: Set y=0 and solve for x.
To find the y-intercept of the equation: Set x=0 and solve for y.
Find Intercepts & Graphing Using Intercepts
Holt Algebra 2
2-3 Graphing Linear Functions
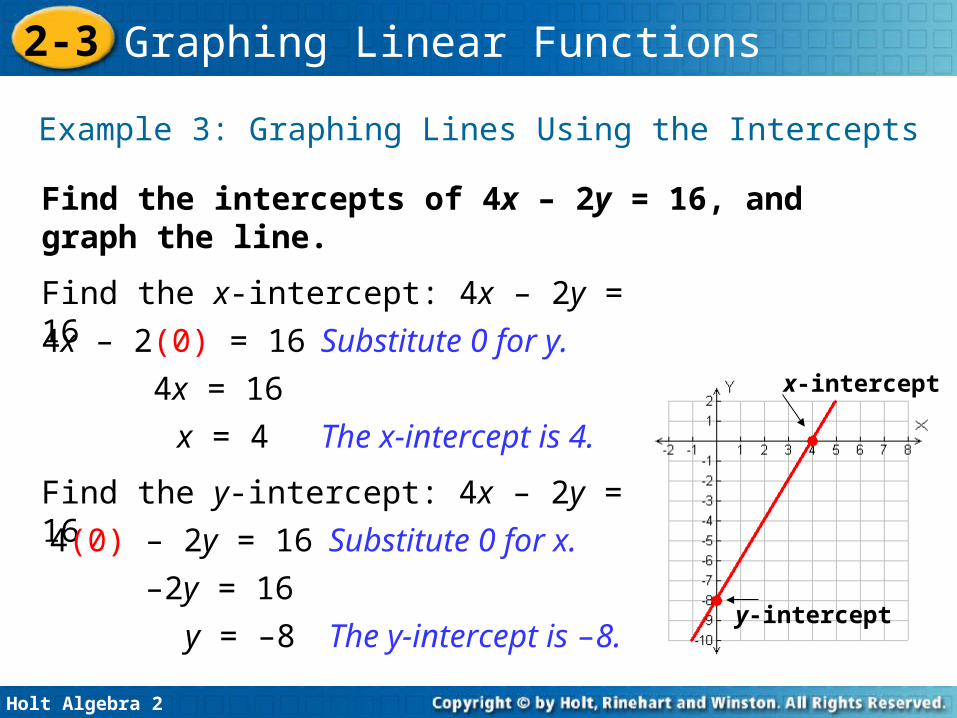
Example 3: Graphing Lines Using the Intercepts
Find the x-intercept: 4x – 2y = 16
Find the intercepts of 4x – 2y = 16, and graph the line.
4x – 2(0) = 16
Find the y-intercept: 4x – 2y = 16
4x = 16
x = 4
4(0) – 2y = 16
–2y = 16
y = –8
Substitute 0 for y.
The x-intercept is 4.
Substitute 0 for x.
The y-intercept is –8.
x-intercept
y-intercept

Holt Algebra 2
2-3 Graphing Linear Functions
Check It Out! Example 3
Find the x-intercept: 6x – 2y = –24
Find the intercepts of 6x – 2y = –24, and graph the line.
6x – 2(0) = –24
Find the y-intercept: 6x – 2y = –24
6x = –24
x = –4
6(0) – 2y = –24
–2y = –24
y = 12
Substitute 0 for y.
The x-intercept is –4.
Substitute 0 for x.
The y-intercept is 12.
x-intercept
y-intercept
Holt Algebra 2
2-3 Graphing Linear Functions
Linear functions can also be expressed as linear equations of the form y = mx + b. When a linear function is written in the form y = mx + b, the function is said to be in slope-intercept form because m is the slope of the graph and b is the y-intercept. Notice that slope-intercept form is the equation solved for y.

Holt Algebra 2
2-3 Graphing Linear Functions
Example 4A: Graphing Functions in Slope-Intercept Form
Solve for y first.
Write the function –4x + y = –1 in slope-intercept form. Then graph the function.
–4x + y = –1
y = 4x – 1
Add 4x to both sides.+4x +4x
The line has y-intercept –1 and slope 4, which is . Plot the point (0, –1). Then move up 4 and right 1 to find other points.
Holt Algebra 2
2-3 Graphing Linear Functions
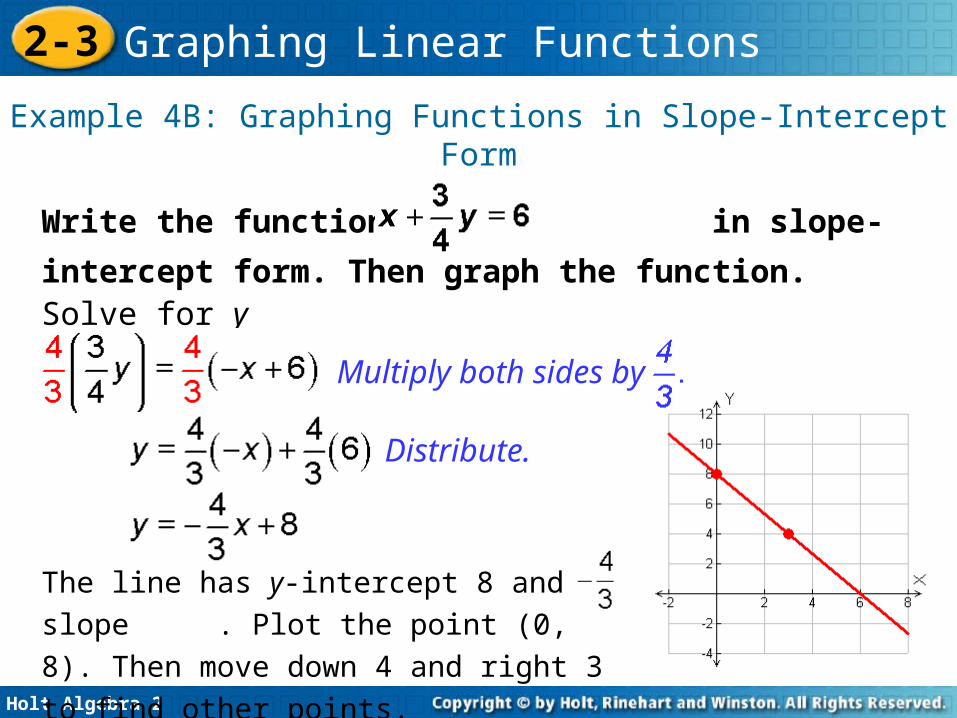
Example 4B: Graphing Functions in Slope-Intercept Form
Solve for y first.
Write the function in slope-
intercept form. Then graph the function.
Distribute.
The line has y-intercept 8 and slope . Plot the point (0, 8). Then move down 4 and right 3 to find other points.
Multiply both sides by

Holt Algebra 2
2-3 Graphing Linear Functions
Example 4A Continued
You can also use a graphing calculator to graph. Choose the standard square window to make your graph look like it would on a regular grid. Press ZOOM, choose 6:ZStandard, press ZOOM again, and then choose 5:ZSquare.

Holt Algebra 2
2-3 Graphing Linear Functions
An equation with only one variable can be represented by either a vertical or a horizontal line.

Holt Algebra 2
2-3 Graphing Linear Functions
Vertical and Horizontal Lines
Vertical Lines Horizontal Lines
The line x = a is a vertical line at a.
The line y = b is a horizontal line at b.
Holt Algebra 2
2-3 Graphing Linear Functions
The slope of a vertical line is undefined.
The slope of a horizontal line is zero.
Holt Algebra 2
2-3 Graphing Linear Functions
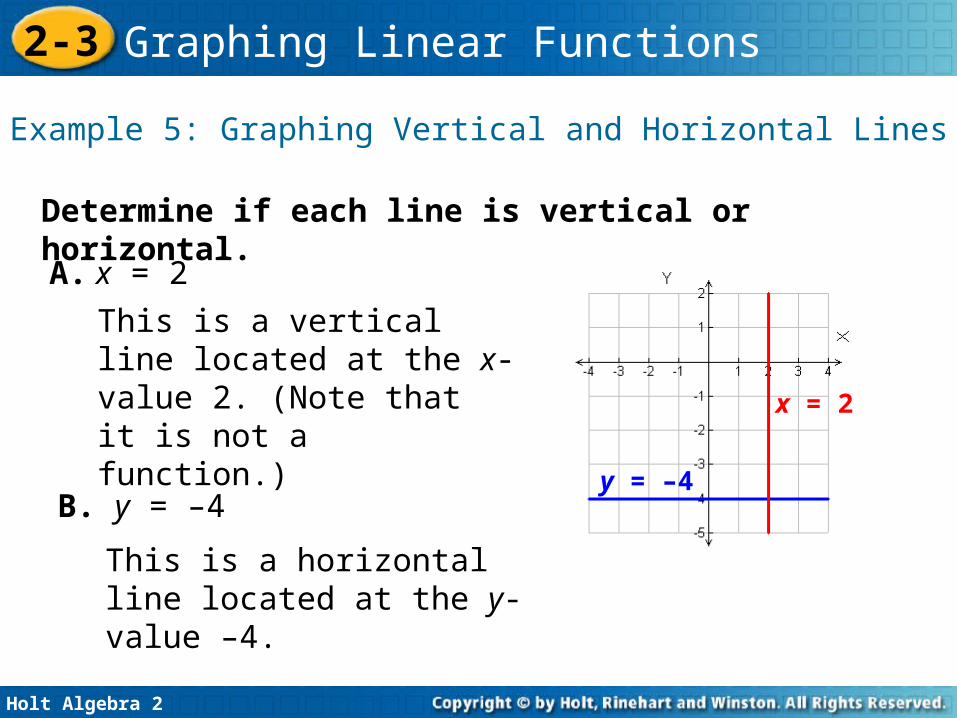
Example 5: Graphing Vertical and Horizontal Lines
Determine if each line is vertical or horizontal.A. x = 2
B. y = –4
This is a vertical line located at the x-value 2. (Note that it is not a function.)
This is a horizontal line located at the y-value –4.
x = 2
y = –4
Holt Algebra 2
2-3 Graphing Linear Functions
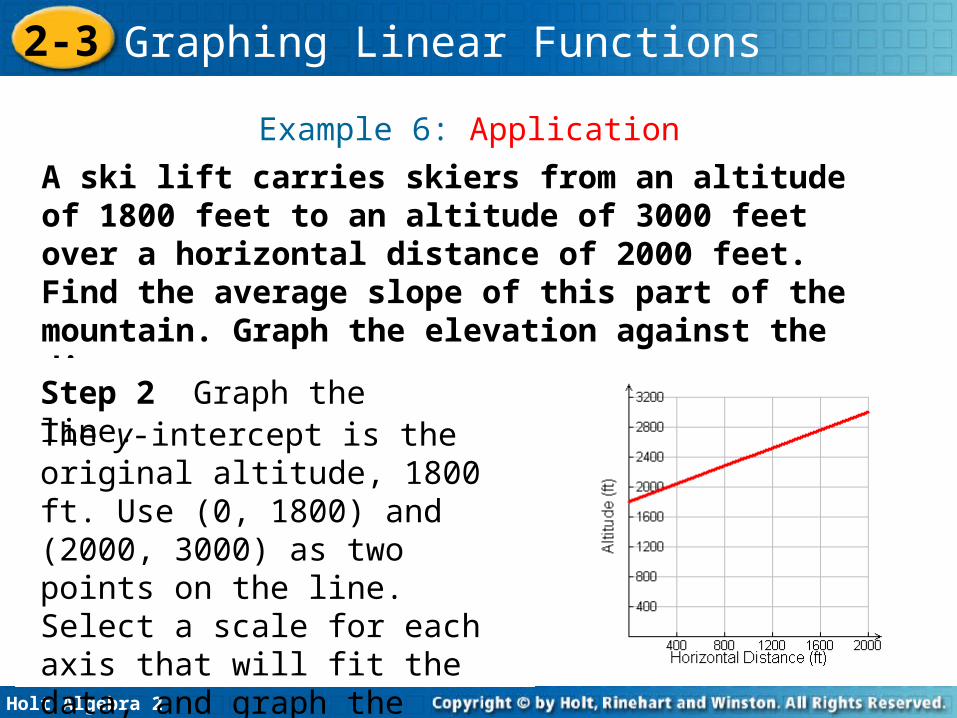
Example 6: Application
A ski lift carries skiers from an altitude of 1800 feet to an altitude of 3000 feet over a horizontal distance of 2000 feet. Find the average slope of this part of the mountain. Graph the elevation against the distance.Step 1 Find the slope.The rise is 3000 – 1800, or 1200 ft.
The run is 2000 ft.
The slope is .
Step 2 Graph the line.The y-intercept is the original altitude, 1800 ft. Use (0, 1800) and (2000, 3000) as two points on the line. Select a scale for each axis that will fit the data, and graph the function.
Holt Algebra 2
2-3 Graphing Linear Functions
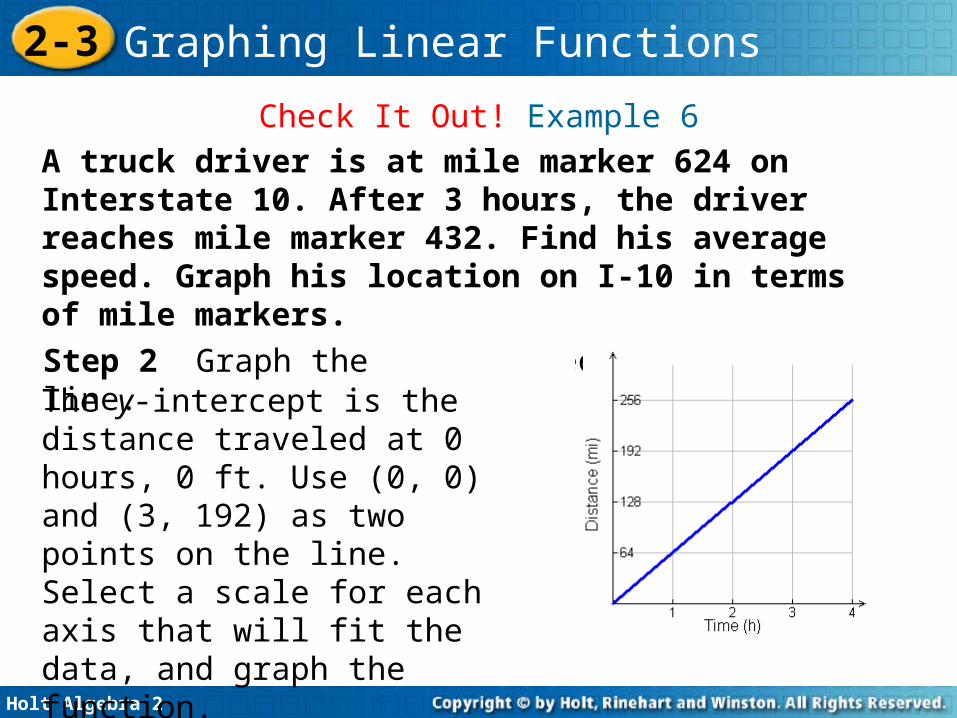
Check It Out! Example 6A truck driver is at mile marker 624 on Interstate 10. After 3 hours, the driver reaches mile marker 432. Find his average speed. Graph his location on I-10 in terms of mile markers.Step 1 Find the average speed.
distance = rate time
The slope is 64 mi/h.
192 mi = rate 3 h
The y-intercept is the distance traveled at 0 hours, 0 ft. Use (0, 0) and (3, 192) as two points on the line. Select a scale for each axis that will fit the data, and graph the function.
Step 2 Graph the line.

Holt Algebra 2
2-3 Graphing Linear Functions
Lesson Quiz: Part 1
1. Determine whether the data could represent a linear function.
yes
x-intercept: 8; y-intercept: –6; y = 0.75x – 6
x –1 2 5 8
f(x) –3 1 5 9
2. For 3x – 4y = 24, find the intercepts, write in slope- intercept form, and graph.
Holt Algebra 2
2-3 Graphing Linear Functions
Lesson Quiz: Part 2
3. Determine if the line y = -3 is vertical or
horizontal.horizontal
2.8
4. The bottom edge of a roof is 62 ft above the ground. If the roof rises to 125 ft above ground over a horizontal distance of 7.5 yd, what is the slope of the roof?