holonet: holographic networks · 2 authorship this paper was authored by william van rensselaer,...
TRANSCRIPT

1
Supervisors:
Dmitry Korkin
HoloNet: Holographic Networks
Authors:
William Van Rensselaer
Vakhtang Margvelashvili
Jonathan Sawin
This report represents the work of WPI undergraduate students submitted
to the faculty as evidence of completion of a degree requirement. WPI
routinely publishes these reports on its website without editorial or peer
review. For more information about the projects program at WPI, please
see http://www.wpi.edu/academics/ugradstudies/project-learning.html

2
Authorship
This paper was authored by William Van Rensselaer, Vakhtang Margvelashvili, and Jonathan
Sawin
William Van Rensselaer completed the methodology and future work sections.
Vakhtang Margvelashvili was responsible for results and analysis.
Jonathan Sawin completed the abstract, executive summary, introduction, background, and
works cited.
The entire team worked on the implementation of the visualization tool, and focus on the project
was distributed as such. William Van Rensselaer’s focus was on overall application structure
and network layout, Vakhtang Margvelashvili’s focus was on sharing and new features from
Holotoolkit, and Jonathan Sawin’s focus was on visual enhancements and voice commands.

3
Acknowledgements
The team would like to thank:
Dmitry Korkin for his advice and guidance throughout the project
Pavel Terentiev and Andi Dhroso for their assistance and collaboration
Microsoft for developing the HoloLens and HoloToolkit

4
Abstract
For as long as data have been collected, data visualization has been a key component
in understanding the information that we gather. As technologies have advanced, so too have
our capabilities to display data in an understandable and readable format. Augmented reality
enables users to interact with data in ways that were previously impossible. Using Microsoft’s
HoloLens, a tool capable of projecting 3D networks into the user’s surroundings, these
interactions made possible by augmented reality can be realized. Our team approached this
development task with the goal of creating an application which would be capable of interpreting
an input network and providing a robust method with which to interact with its contents. We
researched frameworks and existing projects for the HoloLens, and designed a data
visualization application. The resulting software we’ve created displays a 3D network with
support for voice and gesture commands to aid user interaction. Using augmented reality to
enhance network visualization is a promising field, with encouraging implications for future
development.

5
Executive Summary
Displaying networks in a comprehensive manner is crucial to understanding the data it contains.
When looking for trends in data, clusters of nodes, or patterns and relationships, data models require
the means to manipulate what is in the field of view, and quickly display what the user has interest in.
Despite the desire to show as much as possible to the viewer, too much data at once can become
convoluted, and disrupt a user’s focus. Unnecessary labels may obstruct the ability to see the network,
and unwanted pop ups with details hinder progress when distracting the users attention.
Ideally, a user would be able to see an accurate representation of data in a network, and be able
to manipulate it in an intuitive manner. Using a personal computer as an interface to the network, this
challenge seems insurmountable. In order to adequately control the network as well as your own
position of the network, there exist more commands a user would wish to execute than simple inputs to
correspond to. Inevitably, this leads to a situation where a user must learn several keyboard shortcuts
or tricks in order to reach an only somewhat satisfying result. Using augmented reality to interact with
networks as holograms, however, offers a means to circumvent this challenge.
Augmented, or mixed reality, enables a device to project holograms into real, 3-dimensional
space. In essence, a user will be able to see and interact with a hologram of a network as if a solid
model of it existed in front of them. This is a new way of interacting with data that is more than
intuitive, unlike keyboard controls that need to be memorized. Instead, to manipulate the network, one
can simply reach out and touch it. By taking advantage of the Microsoft HoloLens’ gesture and voice
recognition, amongst other features, our team created a tool that takes in an input file of a standard
format which generates a hologram of a network. This hologram will be created along with a base it is
anchored to, and the HoloLens will utilize spatial mapping in order to find a flat surface to place the base
on. After the base is placed, the hologram of the network is anchored to that point, and various
manipulations can be performed in order to improve the user’s ability to interact with the network. By
gazing at a node and selecting it via an air tap, a user can see more information about that node as it
highlights to indicate it has been selected. The user can use gestures and voice controls in order to
move the network, scale the network, or rotate the network. By applying these features to biological
networks, as well as complex or crowded networks, the application we created is capable of
revolutionizing network exploration and visualization.
This application is being developed fairly soon after the HoloLens was announced, and became
available for developers to purchase and develop new tools. Network visualization is more than capable
of taking advantage of the strengths offered by holograms in augmented reality, and has a bright future
ahead of it. By creating this application, we are becoming competitors in developing this new field, and
trying to create a new, useful tool that has purpose in a professional setting.

6
Table of Contents
Authorship 2
Acknowledgements 3
Abstract 4
Executive Summary 5
Table of Contents 6
List of Figures 8
1. Introduction 9
2. Background 12
2.1 Network Visualization and Biological Networks 12
2.2 Microsoft HoloLens 14
2.3 Augmented Reality and Network Visualization 16
2.4 HoloToolkit and Applications 17
3. Methodology 18
3.1 Design 18
3.1.1 File Format 19
3.2 Gaze 20
3.3 Interaction 21
3.3.1 Hand Gestures 21
3.3.2 Voice Commands 24
3.4 Spatial Mapping 25
3.4 Shared Visualization 26
4. Results and Analysis 27
4.1 Research and Development Analysis 27
4.1.1 General Development 27

7
4.1.2 Analysis of sharing holograms 28
4.2 HoloNet 30
4.2.1 HoloNet-Alpha 31
4.2.2 HoloNet-Aware 32
5. Conclusions and Future Work 34
Appendix A 35
Appendix B 36
Works Cited 39

8
List of Figures Figure 1.1: The Protein Interaction Network of Treponema Pallidum (Gravicom) ......................................9
Figure 1.2: An Obtrusive Popup over the T. Pallidum Network ……............................................................10
Figure 2.1: Arena3D Displaying Multiple Networks with Layered 2D graphs (Pavlopoulos et al., 2008)...12
Figure 2.2: 3-Dimensional Shapes Generated Using Processing (“Processing”, n.d.).................................13
Figure 2.3: A User Projecting a Video Call Using the HoloLens (Savov)......................................................14
Figure 2.4: Cornell’s Cancer Model Visualization (“NYC HoloLens Developers Meetup”)..........................15
Figure 3.1: Manager Scripts used in the HoloNet application…………………………………………………………………19
Figure 3.2: A HoloNet network……………………………………………………………………………………………………………...20
Figure 3.3: (a) The gaze cursor follows your head movements. (b) Gazing at a node will cause it to
become focused ................................................................................................................................22
Figure 3.4: (a) Extending your index finger. (b) Retracting your index finger…………………………………….... 23
Figure 3.5: Selecting a node reveals more information about that node………………………………………………..24
Figure 3.6: Scaling a network using hand gestures………………………………………………………………………………...25
Figure 3.7: (a) Move mode. (b) Rotate mode. (c) Scale mode……………………………………………………………...26
Figure 3.8: Spatial mapping mesh of surrounding environment…………………………………………………………..26
Figure 3.9: Sharing with Holotoolkit in emulator. Sharing with unity networking (UNET).........................27
Figure 4.1: a) SharingService command line. b) session manager…………………………………………………………..30
Figure 4.2: a) Hosting a server as a player.b) The authorities on server and player objects(UNITY,
2017). ................................................................................................................................................30
Figure 4.3: Network Identity, Network Transform, Network Transform Child and Network
Manager……......................................................................................................................................31
Figure 4.4: Alpha version of HoloNet…………………………………………………………………………………………………...32
Figure 4.5: Spatial mapping in HoloNet-alpha……………………………………………………………………………………...33

9
Figure 4.6: HoloNet-aware displaying a dna network and information of a node…………….………………….33
Figure 4.7: HoloNet-aware used to scale the model to a larger size……………………………………………………..34

10
1. Introduction
Networks have become pervasive in several fields of science where gathering data is
involved, be it biology networks of proteins or traffic networks in civil engineering. In order to
create a clear picture that best includes all relevant data when facing a problem, it is becoming
more and more important to have an effective way to visualize that data. Additionally, it is
important to automate the process of deciding what information might be relevant and therefore
offered to a user. Displaying the right information at the right time is crucial to a successful
network visualization tool. While a difficult task to achieve, there are various ways that the
problem can be approached.
Figure 1.1: The Protein Interaction Network of Treponema Pallidum (Gravicom)
This concept of focusing on important aspects of data sets is becoming more and more
prevalent as the amounts of data we are gathering increase to the point where huge data sets
and networks need to be dealt with. In the figure above, the protein interaction network of T.
Pallidum is displayed in a confusing 2-dimensional graph, representing 576 proteins and 991
interactions (Gravicom). To help make sense of large data structures, it is extremely important
to understand how to integrate and visualize large amounts of data. The HoloLens, capable of
showing representations of these data sets in 3 dimensional space, enables an entirely new
way to interact with networks that was not before possible. Using gestures and regular
movement, one could interact with data using a control method that is much more intuitive than
a keyboard and mouse. One could move about the information as they like, sort and select
without needing to think about any complicated procedures or commands, and they could show
their changes and discoveries to other users of a HoloLens nearby. This has the potential to
revolutionize the way people interact with data structures, and are able to intuitively reposition
networks to place them in a more understandable position.

11
Another distinct advantage of using the HoloLens to visualize networks is the ability to
pull up information for each node of a network by using a simple command, which can be
displayed in a manner that is unobtrusive to the other data while still clearly linked to that node.
For instance, a 2 dimensional interface may bring up information that obstructs the user’s view
of other nodes, while a HoloLens user could simply walk around or move the network with a
gesture. In the figure below, the same network is shown with an information box drawn to
represent labeling information related to one of the nodes near the middle of the network. By
trying to present the user with this information, the text box covers a significant portion of the
center of the network, hindering readability.
Figure 1.2: An Obtrusive Popup over the T. Pallidum Network
The goal of our project is to emblazon the potential of the HoloLens as a network
visualization tool, and create a resource that can be used to generate an interactive network
from a set of data. The HoloLens offers the ability to interact with complex networks using voice
and gestures instead of conventional means. The user will be able to reach out and move the
network as if it were a real model that existed in front of them. Popups and information can be
displayed out of the way of the other important information. Sharing visualizations with other
users becomes a possibility, amongst other functionalities. It results in an intuitive and versatile
tool for those who manage, maintain, and most importantly, analyze data.

12
2. Background
This section outlines a brief history of network visualization and its importance, the introduction
of the Microsoft HoloLens, how augmented reality can contribute to better understanding of 3-
dimensional networks, and other resources we made use of during the project.
2.1 Network Visualization and Biological Networks
Data visualization is a general term to describe the methods used in order to present the
significance of data by placing it into a visual context (Rouse, n.d.). A large amount of information can
be conveyed through showing a picture of nodes and edges, and even more so if the picture is
presented in an intelligent way. Imagine for instance a model of DNA, a double helix composed of
adenine, thymine, cytosine, and guanine molecules. By labeling each molecule in a 2-dimensional
drawing of the model, someone looking at the picture could understand the pattern the molecules
arrange themselves to form DNA. However, writing the full title of each molecule has potential to hide
the graphic itself, or detract from the understandability of the model. Additionally, if the user wants
more information about one of the nodes being displayed, in this case the individual molecules, they
should ideally be able to find it quickly. Adding complexity to the network will also add issues, for
example representing a cancer cell, as more information needs to be displayed graphical views become
incomprehensible, and less meaningful.
Many tools attempt to address these challenges of network visualization, and offer ways to
interact with data intelligently. As complexity increases, jumping from 2-dimensional representations to
3-dimensional representations seems to be an obvious solution to the issue of convoluted models. The
challenges with this approach, however are twofold. First of all, 3-dimensional representations of
networks can become computationally demanding. Secondly, navigating 3-dimensional networks
necessitates a more complicated user interface, and this can be more difficult to learn and use. One
approach that has been used in the past is a visualization tool entitled Arena3D (Pavlopoulos et al.,
2008). Essentially, Arena3D aims to approach this issue by dividing larger datasets into multiple, simpler
2-dimensional graphs and layering them to add a 3-dimensional element to the representation. This
tool, developed in 2008, shows the efforts being taken to make the transition to 3-dimensional
representations of data. The reason for this is to improve user experience and ability to discern
important information from data being presented to them. The figure below shows this attempt at
layering to create a 3-dimensional effect.

13
Figure 2.1: Arena3D Displaying Multiple Networks with Layered 2D graphs (Pavlopoulos et al., 2008)
Another tool that is in development that allows users to represent data in 3-dimensions is
Processing. Processing is a “flexible software sketchbook” that allows programmers to create
interactive programs with 3-dimensional output (“Processing”, n.d.). While it is simple to create and
manipulate 3-dimensional objects using the coding features available, manipulating and navigating
through 3-dimensional networks still poses a challenge with regard to control. The figure below
demonstrates an example of a 3-dimensional object created using Processing’s scripting, and being
displayed as output.

14
Figure 2.2: 3-Dimensional Shapes Generated Using Processing (“Processing”, n.d.)
Despite how Processing is used, users are still restricted to mouse and keyboard controls on a PC. The
direction of data visualization and network visualization is heading towards a flexible software that
allows for intuitive controls and clear communication of the important factors of data. Our team aimed
to accomplish this through the use of augmented reality with the Microsoft HoloLens as our
development platform.
2.2 Microsoft HoloLens
The Microsoft HoloLens is a virtual reality headset designed by Microsoft to deliver an
augmented reality experience to the user. Windows Holographic is similar to virtual reality goggles;
however, it distinguishes itself by superimposing holograms into the world around you instead of simply
blocking off vision of your surroundings. The HoloLens headset is a self-contained computer containing
its own CPU, GPU, and dedicated holographic processor (Savov, 2015). Announced in early 2015, the
device offers spatially based sound, motion sensors, environmental sensors, voice control, gesture
recognition, and spatial mapping. Being self-contained, the HoloLens does not require any wires or
connections to a computer to function.

15
Figure 2.3: A User Projecting a Video Call Using the HoloLens (Savov)
The HoloLens is not yet available for commercial sale, but development copies are available for
researchers to experiment with. By using visual studio and unity, applications can be developed for the
HoloLens. On the Microsoft official website, there is a section devoted to tutorials regarding how to
develop with the HoloLens (“Holograms 101”, n.d.). This documentation proved to be a very useful
resource when troubleshooting problems we encountered. As this technology has only recently become
available, there are many people who have recognized the potential of augmented reality and
developing new applications for the HoloLens. HoloLens developers in NYC have created a meetup
organization which highlights academic demonstrations related to the HoloLens (“NYC HoloLens
Developers Meetup”, n.d.). As recently as April 12th 2017, developers met at Grand Central Tech to
discuss how mixed/augmented reality can revolutionize medical visualization related to CT and MRI
scans. In mid-January 2017, Cornell presented a project showing how the HoloLens could be used for
cancer research and interacting with complex genomic data. The figure below is a snapshot from the
public video released to advertise the demonstration of the current state of their product.

16
Figure 2.4: Cornell’s Cancer Model Visualization (“NYC HoloLens Developers Meetup”)
2.3 Augmented Reality and Network Visualization
The main strength of the HoloLens and augmented reality is its ability to provide a user with an
immersive experience. By projecting holograms into your surroundings, the HoloLens allows you to
interact with holograms as if the model really existed, and you could simply pick it up and move it
(Savov, 2015). Additionally, with voice control available, commands can be given in a natural way to
interact with the hologram instead of knowing a specific keyboard shortcut or drop down menu. Our
team aimed to capitalize on these advantages while creating our network visualization tool.
By providing a manner of manipulating complicated 3-dimensional networks in a natural way,
new opportunities of presenting information become available. The network can be scaled to an
appropriate size and moved easily to focus on important areas. Rotating nodes that were represented
in the back of the network to bring them to the front is a simple task. Even walking around the network
to look from a different angle is a powerful ability when analyzing a 3-dimensional network. Looking for
patterns in data or clusters of nodes can become a much simpler task with these tools available.
The HoloLens also easily solves the issue of obstructing the network while presenting additional
information related to nodes of the network. Since the HoloLens is capable of mapping your
surroundings, it is capable of finding a flat surface nearby or below your network to project a hologram
of the related information (Microsoft, 2017). The ability to delve deeper into a network, and have the
information readily available without being obtrusive enhances the user experience and ability to take

17
away information from the network visualization.
2.4 HoloToolkit and Applications
When developing for the HoloLens, Unity and Visual Studio were essential tools. In addition to
this, we made heavy use of the HoloToolkit, a set of Unity-based tools that aid in the HoloLens
development process. HoloToolkit is “a collection of scripts and components intended to accelerate
development of holographic applications targeting Windows Holographic” (Microsoft, 2017). Available
on GitHub, this resource allowed for a smoother development of our application. HoloToolkit offers
developers enhancements to Gaze such as “GazeStabilizer”, which tracks the user’s line of sight while
adjusting for natural fidgeting or ambient movement. It offers gesture recognition through the form of
a “GestureManager” which enables input such as an “air-tap”. Additionally, voice recognition is
enhanced through a “KeywordManager” which enables easy setup of voice commands with
corresponding code blocks (Microsoft, 2017). Finally, it offers expansions and improvements to the
HoloLens’ sharing and spatial mapping capabilities.

18
3. Methodology
This section describes our approach to implementing HoloNet, a three dimensional network
visualization application for the HoloLens. As mentioned in the previous section, we developed using the
Unity platform and utilized Visual Studio for debugging. Unity and HoloToolkit provide C# APIs to
develop three dimensional holographic applications. So, naturally, C# was our primary language used for
development. We took a modular approach to programming features for the HoloNet application, with
different managers and components to handle different parts of the application rather than bundling all
the features into one manager. As shown in Figure 3.1. In addition to scripts, we also created three
dimensional models that were packaged into reusable Unity prefabs for various components used in the
HoloNet application. Some of these are described in the following subsections.
Figure 3.1: Manager Scripts used in the HoloNet application.
3.1 Design
A network in the HoloNet application is represented as a collection of nodes connected by edges
relative to some origin in three dimensional space. Unity’s sphere primitive is used for nodes and the
line renderer component is used for edges. The color red was chosen for nodes and white for edges to
maximize visibility and contrast with the surrounding environment. The origin of the network floats
above a custom base component. This base has displays that show the name of the network and the
current interaction mode, as shown in Figure 3.2.

19
Figure 3.2: A HoloNet network.
3.1.1 File Format
Before displaying a network, the application needs know all the information pertaining to the
nodes and edges it is going to display. This section describes the file format used to represent a HoloNet
network, which is fed into the application, parsed and then displayed. Any network that can be
described using the file format can be displayed by our application. The file follows the JavaScript Object
Notation (JSON) format and should be structured as follows:
● Network (Root Object)
○ name (String)
○ nodes (Array of Node)
○ edges (Array of Edge)
● Node
○ id (String, unique)
○ name (String)
○ image (String, optional)

20
○ position (Vector3)
● Edge
○ left (String, Node.id)
○ right (String, Node.id)
● Vector3
○ x (Number, meters)
○ y (Number, meters)
○ z (Number, meters)
A Network object has a name, a list of nodes, and a list of edges. The name is displayed on the
base component. A Node has a unique identifier (used to reference it from an Edge), a name, an image,
and a position. The image is displayed next to the base component when the Node is selected in the
application. An Edge has left and right nodes. A line will be drawn between these nodes in the
application. See Appendix A for an example network file.
3.2 Gaze
The way in which the HoloLens headset handles targeting of objects in an application is through
gaze. To focus on a hologram you must direct your gaze vector at it. This is an invisible ray cast from the
front-center of the headset in the direction the headset is facing (not your eyes). To aid users in knowing
where this gaze vector actually hits, the application displays a gaze cursor. As a user moves his head, the
gaze cursor will follow and rest on the line along the gaze vector.
Gazing at a node in the network will cause a pulsing halo to appear around that node so that you
know which node you are gazing at. In addition, the name of the node will appear right above the node.
This is shown in Figure 3.3. This lets you learn information about the network as you gaze from node to
node. The gaze cursor also provides feedback when the user performs actions like selecting a node or
manipulating the network.

21
(a)
(b)
Figure 3.3: (a) The gaze cursor follows your head movements. (b) Gazing at a node will cause it to
become focused.
3.3 Interaction
There are a two ways in which you may interact with a HoloNet network. The first is through
hand gestures and the second is through voice. These combined are what make the HoloLens a unique
platform for data visualization.
3.3.1 Hand Gestures
In order to properly analyze a three dimensional network it is important that one can place the
network in a comfortable location where the analysis can be done. The HoloNet application uses two
forms of hand gestures provided by the HoloLens API: the air tap gesture and the manipulation gesture.
The air tap gesture will perform a select action in the application. To prepare an air tap you hold one of
your hands in front of the HoloLens headset with your index finger extended and the other fingers
curled into a fist. To execute the air tap you retract your index finger then extend it again, as shown in
Figure 3.4.

22
(a)
(b)
Figure 3.4: (a) Extending your index finger. (b) Retracting your index finger.
[https://support.microsoft.com/en-us/help/12644/HoloLens-use-gestures]
If you are gazing at a node and perform an air tap, the node you are gazing at will be selected.
This is signified by the node’s color changing to blue. In addition, if you gaze away from the node, the
pulsing halo will remain on the node and the name will remain displayed above the node. Selecting a
node will also reveal more information about that node. Figure 3.5 shows that if an image was defined
for the node (as described by Section 3.1.1), that image will be displayed next to the base.

23
Figure 3.5: Selecting a node reveals more information about that node.
The air tap gesture may also be used to reposition the base of the network. By gazing at the
network then performing an air tap gesture, the base will go into a movement mode. In this mode the
base will follow your gaze until you wish to release it. To release it, simply perform an air tap again. The
network will remain floating above the base at its new position.
The second hand gesture used is the manipulation gesture. The manipulation gesture tracks and
lets you map actions to the movement of the user’s hand. The preparation for this gesture is the same
as the air tap. Though, instead of retracting and then extending your index finger, you just retract it to
go into a hold state. Once in the hold state, the manipulation gesture has been initiated. You may move
your hand in any direction and its position updates will be fed to the application. To stop the
manipulation gesture, you simply re-extend your index finger.
The manipulation gesture is used for three different operations: moving, rotating, and scaling
the network. The interaction mode (move, rotate, scale) you are in is signified by the icon displayed on
the base. The default interaction mode is the “move” mode. Changing the mode can be done via a voice
command described in the next section.
The movement manipulation is useful when you want to reposition the network in relation to
the base. Moving your hand up or down while executing the manipulation gesture will cause the
network to follow your hand until you complete the gesture by re-extending your index finger. When in
the rotation mode you may move your hand to the left or right and the network will rotate (around its
origin) in the direction of your hand movement. For scaling, moving your hand up will cause the network
to grow larger in scale and moving your hand down will cause the network to shrink smaller in scale.

24
Figure 3.6: Scaling a network using hand gestures.
Together, the hand gestures provide an intuitive way to interact with a holographic network.
Movement lets one fix the positioning of the network. Rotation lets one fix the orientation of the
network. Scaling lets one grow or shrink the network to a comfortable size for analysis.
3.3.2 Voice Commands
The HoloLens provides a voice recognition interface in which you can listen for keywords spoken
by the user and then perform an action based on those keywords. We utilize this interface in addition to
the gesture interface to provide the user with some convenient actions.
The first is simply rebasing the network. Suppose you were visualizing a network and then left
the room. But you decided that you want to visualize the network again. Instead of walking back to the
room you were in and selecting the base to move it all the way back to where you were, you may use
the “Rebase” voice command. This will reposition the base of the network to right in front of you.
The HoloNet application also provides voice commands for switching interaction modes. The
three voice commands “Move”, “Rotate”, and “Scale” will switch the interaction mode to movement,
rotation, and scale, respectively. You will know the interaction mode has changed by the mode indicator
displayed on the base. The current mode’s icon will be displayed as shown in Figure 3.7.

25
(a)
(b)
(c)
Figure 3.7: (a) Move mode. (b) Rotate mode. (c) Scale mode.
The final use of voice commands is for selecting a node by name in the network. Suppose you
gazed at a node to learn its name then you go to explore other nodes in the network. Perhaps you
walked around or rotated the network and lost the position of the original node. You can use the voice
command “Select <name>”, replacing “<name>” with the node’s name, to select that node.
3.4 Spatial Mapping
One of the HoloLens’ more impressive features is its ability to spatially map the environment
around it. The headset is equipped with four environment understanding cameras and one depth
camera which are used to build a detailed virtual representation of the surfaces making up the
environment around you. Applications can utilize these surfaces by placing holograms on them or using
them to occlude holograms for a more realistic experience. The HoloNet application uses spatial
mapping to search for flat surfaces, like tables, on which to place the base of the network. When using
the air tap gesture to move the base of the network, you can place it on any flat surface detected by the
spatial mapping interface as shown in Figure 3.8.

26
Figure 3.8: Spatial mapping mesh of surrounding environment.
3.4 Shared Visualization
Analysis is thoroughly enhanced by collaboration. Luckily, the HoloLens is a Wi-Fi capable device
and can be connected to the internet. This allows developers to share holographic experiences in real-
time. If multiple people are in the same room wearing a HoloLens headset, the headsets can
communicate their generated spatial-mapping meshes and sync anchor points in the real world. An
application can then place a hologram at that anchor point and it will be seen by all of the headsets. The
HoloNet application does this so that multiple people can visualize and work with the same network.
(a)
(b)
Figure 3.9: (a) Sharing with Holotoolkit in emulator. (b) Sharing with unity networking (UNET).
We achieved two implementations of sharing. Figure 3.8 (a) demonstrates the implementation
of the holotoolkit sharing. The holotoolkit sharing service is looking for a server. After establishing
connection with the server HoloLens is creates or finds already created meshes for the room, it locates
the anchor and shares the room and anchor over the network. Since the figures are demonstrations
from emulators, the anchors are not available. In the figure 3.8 (b) you can see a perspective from one
HoloLens that creates the server and the red cube represents the second application (HoloLens) on the

27
server. Once again the anchor is not created in this image since the application is running in the
emulator.
4. Results and Analysis
With the help of the HoloLens device we can make use of gaze, gesture and voice commands as
an input for HoloLens applications. In return user gets experience with visual and audio effects. By
creating well guided voice infrastructure, the user can easily change to different modes of the
application and do several actions. The experience of the user is in real world and the holograms look
almost as clear as any real world object. With good development one can make the hologram not just
look but also behave as a real world object. This allows user to interact with data structures as real
objects rather than just visualization. HoloNet gets rid of the layers between user and data so that
working with data is robust.
4.1 Research and Development Analysis
In this part of the section, we will discuss the results of our research and development so that
future developers get easier time continuing working with project or starting development with
HoloLens.
4.1.1 General Development
HoloLens development requires knowledge of Universal Windows platform development and
game development. To start development one needs Microsoft Visual Studio, Unity game engine and
Hyper-V installed on the computer for emulation. Since none of us had experience with HoloLens
development we started research on HoloLens development. At the beginning of the project we were
working with Holographic academy by Microsoft. The Holographic academy provides introductory video
tutorials on each part of HoloLens development. The tutorials include main topics such as gaze, gesture,
voice detection, Spatial Sound, Spatial mapping and sharing. Each tutorial also includes given prefabs
and already ready scenes which is available to freely implement and edit. As a result we conclude that
holographic academy is a good way to start working with HoloLens. Although we found out that a lot of
Holographic Academy material is outdated, since there has been improvements in several codes for
HoloLens.
We therefore leveraged the most recent repository, Holotoolkit. Holotoolkit is open source
collection of scripts with a goal to accelerate the development of the HoloLens applications. Holotoolkit
is written in C and C++ and is currently the only low level framework for HoloLens development.
However there also is Holotoolkit-unity which is written in C# and uses the Holotoolkit framework as a

28
base. In our project we mostly used Holotoolkit-unity and wrote our own separate code. There have
been several issues with holotoolkit frameworks. The low level framework which also is a base for high
level framework has some errors in sharing and potentially in other sections. We found out that while
developing HoloLens application it is good to keep up with the framework commits, issues and new
releases, since they pinpoint the current problems with the framework and sometimes patch the
existing bugs. We concluded that it is better to transition working with holotoolkit as soon as possible,
or maybe even start development with holotoolkit.
4.1.2 Analysis of sharing holograms
When developing sharing, we found out that there is no stable version of sharing available in
existing projects. Our goal for sharing was to let 2 HoloLenses use the same app to see and interact with
one network in a shared environment. We found out that currently there are two types of sharing that
developers implement. The first one is developed for the framework holotoolkit-unity sharing services
and the second one is using Unity’s networking API UNET. We had success with implementing partial
sharing in emulator. We achieved a state where we can join the same server and HoloLenses share
world anchor and their locations according to world anchor. However we had problems with sharing the
actual network, we get instance of 2 separate networks and one of the networks is shared without its
children game objects. This happens because the way the holotoolkit uses its implementation of UNET.
Holotoolkit requires a parent object with the “Sharedcollection” script, but UNET requires us to create
one parent object with network identity, network transformation and network transformation child
components so that all transformations are synced. Using both does not seem to be possible, since
“Sharedcollection” is a stationary object that serves as an anchor, but UNET requires the network to be
the parent object which should not be stationary. As a result none of these 2 sharing techniques fully
satisfy the needs of our application.
Sharing with holotoolkit-unity has not been functioning properly most of the time during our
development. The Github issues and the comments posted by the other developers led us to the main
holotoolkit framework and showed that the problem was in sharing world anchors and in finding the
existing servers. Since then holotoolkit-unity got new releases and they seem to be promising.

29
(a)
(b)
Figure 4.1: a) SharingService Command Line. b) Session Manager.
Holotookit-unity is equipped with tools to help the developers out in sharing. The framework
provides sharing service command line and a session manager for controlling the server. In the figure
we can see the sharing services creating a server on desktop. Holotoolkit provides a session manager
which lets the users control the server with existing interface.
UNET is a networking service for unity, which means it is built for game development. In the
case of HoloLens, Unity recognizes HoloLens as a player. When a server is needed in UNET, one of the
players host the server and the remote players access it through this player. In our case one of the
HoloLens will host the server and the other HoloLenses will act as remote clients.
(a)
(b)
Figure 4.2: a) Hosting a server as a player. b) The authorities on server and player objects. (UNITY, 2017)
When sharing the HoloLens we need to think of the HoloLens as a non-player object. For example if you
look at the figure below you can see the enemy, a non-player object on the server, so only the server

30
has the authority to act on the enemy. For us to enable HoloLens to act on the holograms on server we
need to talk to the server and the server needs to do the action on the object.
Figure 4.3: Network Identity, Network Transform, Network Transform Child and Network Manager.
Network manager is the main network component from UNET. As recommended by holotoolkit we
decided not to use NetworkManagerHUD, instead we are using a script that lets the users connect to
server with predetermined port and key. Since we are using UNET we need to identify the gameobjects
with Network Identity, which lets us give the players or the server the authority.
4.2 HoloNet In our final application we succeeded to use gaze, hand gestures, spatial mapping, spatial
understanding, voice recognition, and voice feedback. Our final product consists of a system that lets
the user go through different networks of data. The application chooses correct Json file and afterwards
displays the network. The network is displayed over a base which can be picked up by using tap gesture.
Once the customer picks up the base the HoloLens starts displaying rendered meshes from spatial
mapping, this helps the customer to find flat surface, which can be used to place the base. Once again
with the tap hand gesture the customer can place the base on the chosen surface. Once the network
stands on a chosen place the customer can start interacting with it. With the help of voice commands
the customer can either switch through different networks or through different modes of interaction.
We have 3 modes of interaction, "Rotate", "Move" and "Scale". Each mode has its own logo and they

31
are displayed on the top of the base. After choosing the mode the customer can start the interaction by
using the gaze at the network, taping on it and then moving to the tapped hand. During our
development cycle we ended up with several versions of the application demonstrating different
features that are possible. 2 of these versions are most prevalent and have most of the features
implemented. First application HoloNet-Alpha was our starting project and then we moved on to
HoloNet-Aware to experiment with different features.
4.2.1 HoloNet-Alpha
Our first version included an empty network without the base. In this network we implemented
transformation in all directions, the network, the canvas displaying the nodes, spatial mapping, spatial
understanding, help canvas, node selection, indicator on cursor, and voice commands.
Figure 4.4: Network Displayed Using HoloNet-Alpha
In this figure you can see the protein network with names of the nodes all displayed. One node is
targeted with the gaze so its color is changed to blue. On the left you can see the help menu with
available voice commands and the current command displayed in yellow. When we look at the node and
say voice command select the node will become yellow instead of blue.

32
Figure 4.5: Spatial Mapping in HoloNet-Alpha
In the figure above you can notice the use of spatial understanding. In HoloNet-Alpha we used spatial
mapping to render the surrounding and then implemented spatial understanding to map the room more
accurately. This way we can see already mapped surfaces and meshes more clearly.
4.2.2 HoloNet-Aware
We started developing second version of the application to target the features that were most
important for us. Instead of using spatial understanding we decided to use just spatial mapping, since
we do not do a lot of interaction with spatial meshes. Also we introduced the base and the ability to put
it on flat surfaces, system to switch between networks, halo and sound effects.
Figure 4.6: HoloNet-Aware Displaying a DNA Network and Projecting Node Information
In the figure above you can see HoloNet-Aware. The base is located on the table and a single
node is selected. The picture of the node appears next to the base on the table. The halo effect is used
on the marked node. On the logo on the base you can see the movement logo, showing that the
network is in the movement mode.

33
Figure 4.7: HoloNet-Aware Used to Scale the Model to a Larger Size
In the figure above you can see the model rotated, scaled and moved to improve viewing. The base is also shared with another network, although due to the unfinished sharing the network is not visible for second user.
HoloNet-Aware also introduced a few additional voice commands in addition to the new features listed. A help command was re-implemented to display a help menu of possible voice commands to a user. We thought this would be helpful for new users who were unfamiliar with using the HoloLens, and had never used our application before. A rebase command was added, which served to pull the base of the network to the center of the user’s focus. We found while testing that the base of the network would occasionally get lost in the process of using the application, and decided that this would be an effective time saving addition for users trying to use our application. Finally, we added a switch command. This command allows a user to change between networks being visualized while using the application. This is applicable if there are multiple networks being loaded by the application, and you would like to change between the networks quickly and seamlessly.

34
5. Conclusions and Future Work
In this project, we developed an application for the HoloLens to visualize and interact with the
data that can be represented as a three dimensional network. Using our work as a basis, significant
advancements can be made in the field of network visualization. Our team succeeded in creating an
application capable of generating a hologram from a generic input, and creating a model with which a
user can interact with the network. The user is capable of manipulating the network by relocating its
base, moving the network, scaling the network, and rotating the network through a combination of
gestures and voice commands. Additionally, we have implemented a way to display a help menu, as
well as toggle between which networks are being displayed via voice command. Users are able to
receive visual and audio feedback for actions that are taken. By looking at a node, a halo will be
displayed to indicate that node has been focused, and a text label will provide some basic information
about the node. By tapping to select that node, it will change color and provide additional information
in an out-of-the way manner. Overall, a very strong and flexible framework has been established for
future development of network visualization using augmented reality using the HoloLens.
However, there is still much analysis and improvement that can be done. One avenue for future
work is to use the case studies to compare visualization of the three dimensional networks using the
HoloLens and a standard desktop or laptop display. The benefit of the HoloLens is that the holograms
are placed in the real world. You can reach out and touch them and manipulate them with your hands.
But is this really more efficient than using a mouse and keyboard with a traditional computer display.
The other direction for future work is improving the visualization capabilities of the HoloNet
application. It would be interesting to test different shapes and sizes for nodes as well as varying colors
for nodes and edges. The network might also be more engaging if there were a contextual mesh
enclosing it. For example, for the visualization of a brain neural network, overlaying nice translucent
model of the brain might help in understanding the visualization better.
35
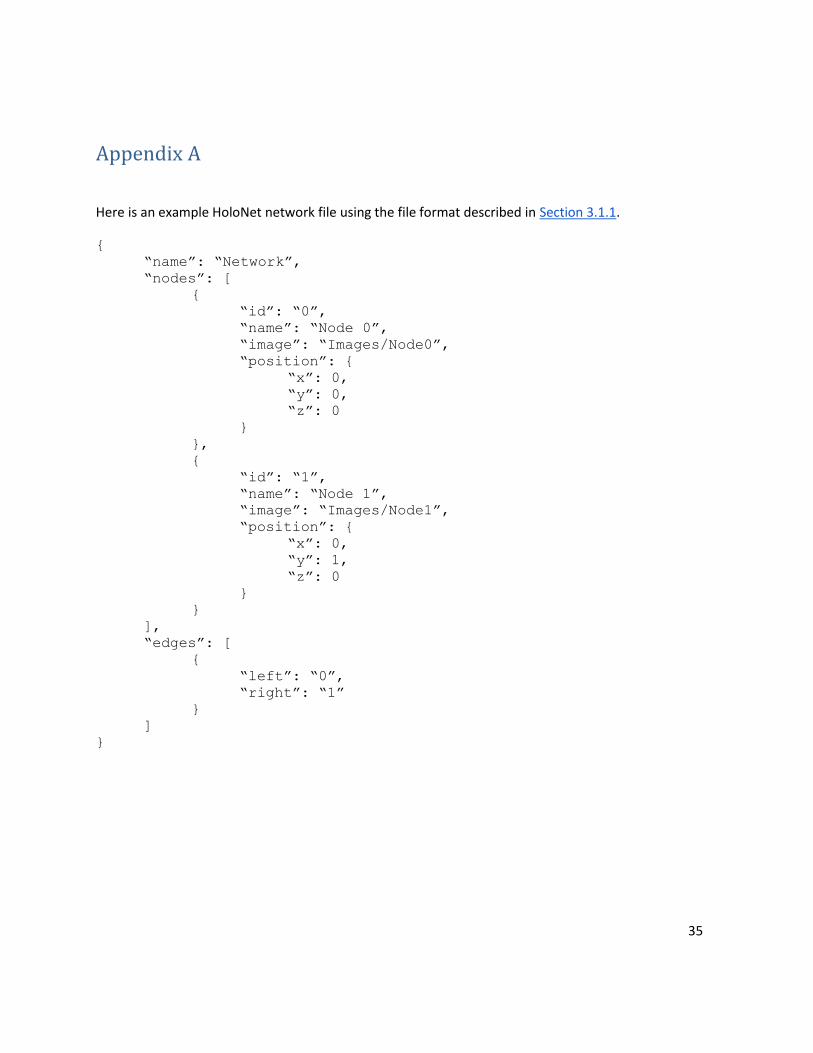
Appendix A
Here is an example HoloNet network file using the file format described in Section 3.1.1.
{
“name”: “Network”,
“nodes”: [
{
“id”: “0”,
“name”: “Node 0”,
“image”: “Images/Node0”,
“position”: {
“x”: 0,
“y”: 0,
“z”: 0
}
},
{
“id”: “1”,
“name”: “Node 1”,
“image”: “Images/Node1”,
“position”: {
“x”: 0,
“y”: 1,
“z”: 0
}
}
],
“edges”: [
{
“left”: “0”,
“right”: “1”
}
]
}

36
Appendix B
A code excerpt showing our implementation for manipulation of the network:
public void OnManipulationUpdated(ManipulationEventData eventData) {
Transform transform = networkManager.transform;
Vector3 delta = eventData.CumulativeDelta;
switch (Mode) {
case InteractionMode.Move:
transform.localPosition = positionCache + Vector3.up * delta.y *
MOVE_FACTOR;
Debug.Log("Move: " + delta + ", " + positionCache + ", " +
transform.localPosition);
break;
case InteractionMode.Rotate:
transform.localRotation = rotationCache;
transform.Rotate(Vector3.up * delta.x * ROTATE_FACTOR);
Debug.Log("Rotate: " + delta + ", " + rotationCache + ", " +
transform.localRotation);
break;
case InteractionMode.Scale:
Vector3 newScale = scaleCache;
float deltaY = delta.y * SCALE_FACTOR;
if (deltaY >= 0) {
newScale *= deltaY + 1;
} else {
newScale /= Mathf.Abs(deltaY) + 1;
}
transform.localScale = newScale;
Debug.Log("Scale: " + delta + ", " + scaleCache + ", " +
transform.localScale);
break;
}
}

37
Appendix C
A code excerpt showing our implementation for parsing/building the network by instantiating network
managers:
private void ParseNetwork() {
NetworkJSON networkJson =
JsonUtility.FromJson<NetworkJSON>(NetworkFiles[networkFileIndex].text);
if (NetworkJSON.IsValidNetwork(networkJson)) {
BuildNetwork(networkJson);
} else {
Debug.LogError("Invalid network file.");
}
}
private void BuildNetwork(NetworkJSON networkJson) {
var network = GameObject.Instantiate<GameObject>(NetworkPrefab, transform);
networkCache = network;
networkManager = network.GetComponent<NetworkManager>();
networkManager.Setup(networkJson);
NetworkName.text = networkJson.name;
Debug.Log("HoloNet network created.");
}
---from the networkManager class---
public void Setup(NetworkJSON networkJson) {
Name = networkJson.name;
gameObject.transform.localPosition = Vector3.up * 0.15f;
foreach (var nodeJson in networkJson.nodes) {
var node = GameObject.Instantiate<GameObject>(NodePrefab, transform);
var nodeManager = node.GetComponent<NodeManager>();
nodeManager.Setup(nodeJson);
Nodes[nodeManager.Id] = nodeManager;
}

38
foreach (var edgeJson in networkJson.edges) {
var edge = GameObject.Instantiate<GameObject>(EdgePrefab, transform);
var edgeManager = edge.GetComponent<EdgeManager>();
edgeManager.Setup(edgeJson);
}
}

39
Works Cited 1. Bhavnani, S. K., Ganesan, A., Hall, T., Maslowski, E., Eichinger, F., Martini, S., . . . Kretzler, M.
(2010, November 11). Discovering hidden relationships between renal diseases and regulated
genes through 3D network visualizations. Retrieved April 10, 2017, from
http://bmcresnotes.biomedcentral.com/articles/10.1186/1756-0500-3-296
2. Bisson, S. (2017, February 22). HoloLens enterprise apps are now a reality. Retrieved April 8,
2017, from
libraries.state.ma.us%2Flogin%3Fgwurl%3Dhttp%3A%2F%2Fgo.galegroup.com%2Fps%2Fi.do%3
Fp%3DITOF%26sw%3Dw%26u%3Dmlin_c_worpoly%26v%3D2.1%26id%3DGALE%257CA482072
274%26it%3Dr%26asid%3Ddcc1dc35c28328d497a670d786f339a9
3. Processing. (n.d.). Retrieved April 17, 2017, from https://www.processing.org/
4. Gravicom. (n.d.). Retrieved April 19, 2017, from http://andeekaplan.com/gravicom/
5. Rouse, M. (n.d.). Guide to telling stories with data: How to share analytics insights. Retrieved
April 17, 2017, from http://searchbusinessanalytics.techtarget.com/essentialguide/Guide-to-
telling-stories-with-data-How-to-share-analytics-insights
6. Holograms 101. (n.d.). Retrieved April 10, 2017, from https://developer.microsoft.com/en-
us/windows/mixed-reality/holograms_101
7. Microsoft (2017, April 10). Microsoft/HoloToolkit-Unity. Retrieved April 10, 2017, from
https://github.com/Microsoft/HoloToolkit-Unity
8. NYC HoloLens Developers Meetup. (n.d.). Retrieved April 19, 2017, from
https://www.meetup.com/NYC-HoloLens-Developers-Meetup/
9. Pavlopoulos, G. A., O'Donoghue, S. I., Satagopam, V. P., Soldatos, T. G., Pafilis, E., & Schneider, R.
(2008, November 28). Arena3D: visualization of biological networks in 3D. Retrieved April 10,
2017, from http://bmcsystbiol.biomedcentral.com/articles/10.1186/1752-0509-2-104
10. Savov, V. (2015, January 21). Microsoft announces Windows Holographic with HoloLens
headset. Retrieved April 10, 2017, from
http://www.theverge.com/2015/1/21/7867593/microsoft-announces-windows-holographic
11. Taylor, A. G. (2016). Develop Microsoft HoloLens Apps Now. Apress.
12. Unity Documentation manual, “NetworkHost”, Unity, 2017,
https://docs.unity3d.com/2017.1/Documentation/Manual/UNetConcepts.html