history of weather observations college hill, ohio...
TRANSCRIPT

HISTORY OF WEATHER OBSERVATIONS COLLEGE HILL, OHIO
1814 - 1889
October 2004
Prepared By Glen Conner
9216 Holland Road Scottsville, Kentucky
This report was prepared for the Midwestern Regional Climate Center under the auspices of the Climate Database Modernization Program, NOAA's National Climatic Data Center, Asheville, North Carolina.

ii
CONTENTS
List of Illustrations iii Introduction Introduction 1 Goal of the Study 2 Location of Observations 3 Instrumentation 6 The Observers 7 The End of College Hill’s Climate Observations 16 Bibliography 17 Appendices Appendix 1, Methodology 18

iii
ILLUSTRATIONS
Figures
1. Preface to Jackson’s 1814-18 Data 3 2. College Hill Observer Homes Map 4 3. Farmers’ College 5 4. Pyrotechnic Hall 5 5. Jackson’s 1814-1848 Temperature Data 7 6. College Hill Data November 1858 9 7. Hammitt Letter 10 8. College Hill Observations January 1884 12 9. Hammitt Remarks 13 10. Signal Service Letter to Hammitt 14 11. Hammitt’s Response to Greely 15 12. Mary Hammitt’s Note 16

1
HISTORY OF WEATHER OBSERVATIONS COLLEGE HILL, OHIO
1814-1889
Glen Conner Kentucky State Climatologist Emeritus
INTRODUCTION
Introduction
The most significant of the early weather observations in the Cincinnati area were from
College Hill. Among others, there were earlier observations at Fort Washington and from Dr. Daniel Drake but those were for shorter periods or were concerned with extremes instead of the daily data. The significance of College Hill was the nature of its data that provided monthly means and the continuity of it over a long period of time.
The credit for the early College Hill’s weather records belongs to Isaac. H. Jackson. Not
only did he record the weather, but his data were published. These data appeared in the Thirteenth Annual Report of Ohio State Board of Agriculture for 1858 and in the Smithsonian Contributions to Knowledge. The record has monthly mean temperature from January 1814 through December 1848.
Preserved records such as those produced by Mr. Jackson are rare for that period. The U.S.
Army Surgeon General established the first formal network of weather observers in the United States in 1818. The motivation for the new network was to determine if there was a cause and effect relationship between climate and the health of the soldiers. The Surgeon General said that the purpose of the network was to ascertain if “in a series of years there be any material change in the climate of a given district of the country; and if so, how far it depends on cultivation of the soil, density of population, etc.”
The medical doctors in the Army were trained scientists, schooled in the importance of
careful observations and reasoned analysis, and were a logical choice to become the weather observers. They would find the connections between climate and disease, if they existed.
The Army was a logical choice for this role because it could direct action and assure
compliance. It could assure that the data were collected into a single standardized format so that geographical differences would be assessed. Of great importance was that it had posts in the most remote areas of the frontier. That was important because it would be possible to know what the climate was before large numbers of people began migrating westward.
The location of the earliest of the Army’s network in the area was at Newport Barracks
across the Ohio River from Cincinnati. The earliest record of weather there was recorded in July

2
1825. One must be impressed that Mr. Jackson of College Hill had, by then, been making observations for over eleven years.
After a brief interruption, the observational record continued with R. S. Bosworth making
the observations at the Farmers College in College Hill. There followed a long and uninterrupted record of observations that were made by faculty and students through October 1889. The combined records of Mr. Jackson and those that followed produced 75 years of temperature records during a period for which there are few extant records.
This study of the history of College Hill weather observations is one way to preserve that
history and to help us understand Ohio’s climate from its frontier beginning to modern days.
Goal of the Study The goal of this study is to document the primary weather observational history of College
Hill that recorded such an important block of knowledge of early Ohio climate. Climatic data from the weather observations there throughout their period of record are readily available from the National Climatic Data Center, the Midwestern Regional Climate Center, and the State Climatologist of Ohio. The challenge of this study was to identify College Hill’s role in the development of a federal weather observational program and where it fit in the route that followed from the Army surgeons, through the Smithsonian Observers, the Signal Service Observer Sergeants, the Weather Bureau meteorologists, to the National Weather Service observational network of today.
3
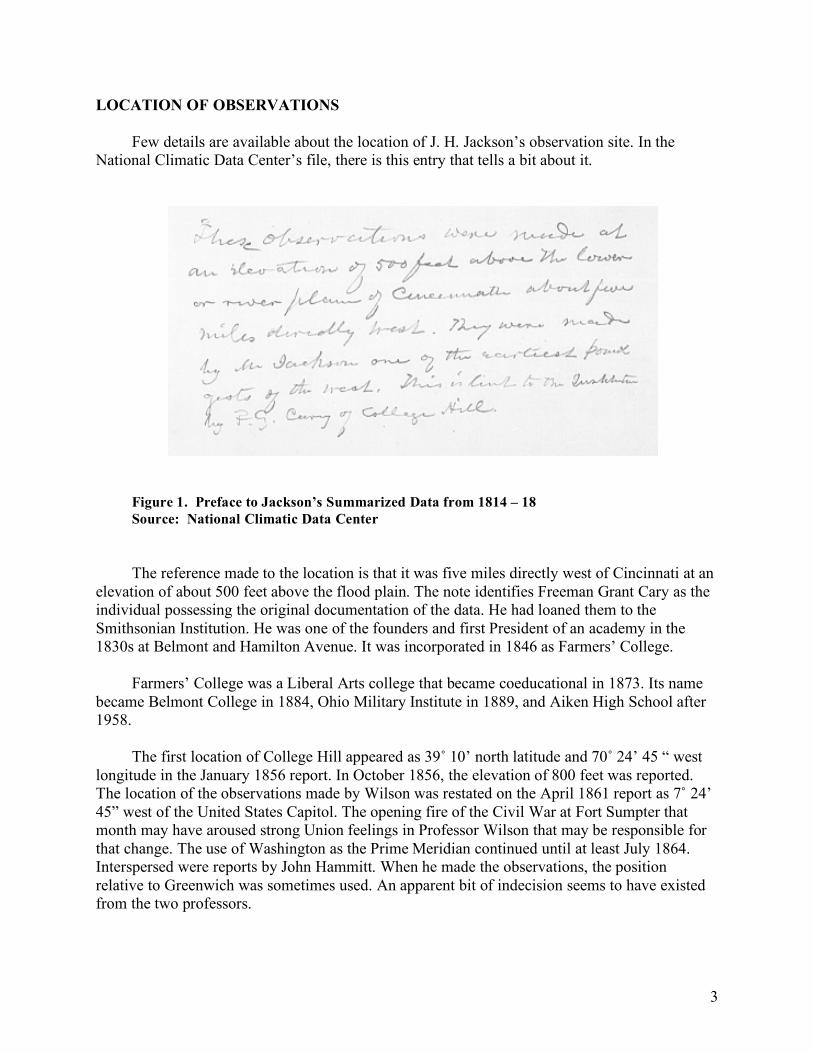
LOCATION OF OBSERVATIONS Few details are available about the location of J. H. Jackson’s observation site. In the
National Climatic Data Center’s file, there is this entry that tells a bit about it.
Figure 1. Preface to Jackson’s Summarized Data from 1814 – 18 Source: National Climatic Data Center The reference made to the location is that it was five miles directly west of Cincinnati at an
elevation of about 500 feet above the flood plain. The note identifies Freeman Grant Cary as the individual possessing the original documentation of the data. He had loaned them to the Smithsonian Institution. He was one of the founders and first President of an academy in the 1830s at Belmont and Hamilton Avenue. It was incorporated in 1846 as Farmers’ College.
Farmers’ College was a Liberal Arts college that became coeducational in 1873. Its name
became Belmont College in 1884, Ohio Military Institute in 1889, and Aiken High School after 1958.
The first location of College Hill appeared as 39˚ 10’ north latitude and 70˚ 24’ 45 “ west
longitude in the January 1856 report. In October 1856, the elevation of 800 feet was reported. The location of the observations made by Wilson was restated on the April 1861 report as 7˚ 24’ 45” west of the United States Capitol. The opening fire of the Civil War at Fort Sumpter that month may have aroused strong Union feelings in Professor Wilson that may be responsible for that change. The use of Washington as the Prime Meridian continued until at least July 1864. Interspersed were reports by John Hammitt. When he made the observations, the position relative to Greenwich was sometimes used. An apparent bit of indecision seems to have existed from the two professors.

4
Figure 2. College Hill in 1869 with Observer Homes Source: Modified from A Little Piece of Paradise, College Hill Ohio, Smiddy. The observations continued at Farmers’ College throughout its lifetime as a meteorological
station. The exact location of the instruments may have changed as the observers changed (Figure 2). In particular, it appears that John Hammitt made observations at his home.
Farmers’ College
S. F. Cary John W. Hammitt
L. B. Tuckerman
John H. Wilson

5
Figure 3. Farmers’ College Source: Old College Hill, College Hill Historical Society The observation site may have been at the principal building (Figure 3) of the early
College. However, the College completed its Pyrotechnic Hall in 1856 as a nineteen-room laboratory for the agricultural department. Most of the observers were from that department and it may be that they had their meteorological equipment located near it. The Pyrotechnic Hall (Figure 4) was at the intersection of Groesbeck and Hamilton Avenues
Figure 4. Pyrotechnic Hall of Farmers’ College 1856 Source: A Little Piece of Paradise, College Hill, Ohio, Smiddy
6
INSTRUMENTATION The makers of the instrumentation used at College Hill is generally not known. There was a
single reference to a barometer that was manufactured by Charles Woodruff and to a rain gauge that was described as a square tin.
College Hill’s observational record tells us something of the type instruments that were
used if not the manufacturer. A barometer was used by the Professor Bosworth, the first observer at the Farmers’ College. In 1854 for example, he had the thermometer that was attached to the barometer and also an open air thermometer with which to measure temperature. He had a rain gauge too. In March 1854, he experimented with a psychrometer and recorded dry and wet bulb temperatures for a short time. Those readings were used to calculate the relative humidity.
The College Hill station was apparently widely known. In 1868, Williamson wrote a study
“On the Use of the Barometer on Surveys and Reconnaissances” and the College Hill data were used as one of several stations he chose from across the United States. Those stations included the Cincinnati Stations operated by Professor Harper at Woodward High School and Mr. Phillips in Engineer. Professor Wilson at College Hill was cited as the observer there. The “Computer,” as it was called, of those data was the Smithsonian Institute. Williamson compared the barometric data from those stations for the year 1859.
College Hill is but 15 miles from Cincinnati: there is a decided want of parallelism between the curves of the two places; and the two observers at the latter place five observations erratically different….
The comparison showed that the annual mean from Phillips’ data were 0.57 inch lower and the Harper’s data were 0.42 inch lower than the College Hill data. The use of College Hill’s data as the referent is indicative of the confidence placed in them.

7
THE OBSERVERS The earliest observations from College Hill were those made by Isaac. H. Jackson.
According to Ford, it is his data that appear in the top section of Figure 5 below. In combination with the College Hill data, it forms an impressive data set.
Figure 5. Combined Mean Temperature Data, Jackson’s 1814-1848, College Hill’s 1854-1890 Source: Adapted from A Climatological History of Ohio, Alexander

8
Mr. Jackson’s son, Sidney S. Jackson, was well known as a horticulturist who had greenhouses and, with others, founded the Horticultural Society of Cincinnati. He no doubt found his father’s weather records valuable in his business. Horticulture may have been the link between the Jackson record keeping and the Farmers’ College record keeping that followed.
The first observer at the College was R. S. Bosworth who submitted a report to the
Smithsonian Institute in October 1853. He used the form titled “Register of Meteorological Observations Under the Direction of the Smithsonian Institution, Adopted by the Commissioner of Patents for his Agricultural Report.” He was a professor of chemistry, mechanical philosophy, and natural science at the College from 1850 to 1859. In 1851, his title was listed as Professor of Chemistry and Its Application to Agriculture and the Arts. He also built telescopes in the shop of the Laboratory at the college one of which was shown at the Ohio Mechanics Institute Fair in 1854.
George S. Ormsby was a 32 year old mathematics professor for Farmers’ College but he
also made weather observations beginning in June 1853. Professor Bosworth resumed the observation duties in September 1854. In November 1858, he used 7˚ 24’ 45” longitude was measured west of the United States Capitol in Washington D. C. Using our Capitol as the referent for longitude was a widespread but short lived practice during that time. Professor Ormsby would later become the Superintendent of Schools in Xenia, Ohio.
The Rev. John H. Wilson assumed the observational duties in November 1858. He was a
professor of chemistry from 1857 to 1858. His specialty was agricultural chemistry, a science still young at a time when fertilizers were being developed. He also taught ancient languages. Some of his observations were published (Figure 6). Note that the Capitol’s longitude was being used.

9
Figure 6. Meteorological Table for College Hill for November 1858 Source: National Climatic Data Center In May 1859, John W. Hammitt became the observer at age 32. He and other members of
the Hammitt family were well known for their orchards and flowers. His occupation was listed in the 1880 United States Census of Hamilton County, Ohio as “Fruit Grower.” Professor Wilson substituted occasionally but it was Mr. Hammitt who was the primary observer through the Civil War years. Enrollment dropped as men enlisted in the Army, down to 92 by 1862. It was an historic period for Farmers’ College because it became a station on the famous Underground Railroad that assisted runaway slaves in their flight toward freedom.
Mr. Hammitt used a different form for his record. It was the “Register of Observations on
the Face of the Sky Under the Direction of the Smithsonian Institution, Adopted by the Commissioner of Patents for his Agricultural Report.” It included only observations of cloudiness, wind direction and force, and rain and snow amounts with beginning and ending times.
Mr. Hammitt acquired the services of an assistant. He reported that change to the
Commissioner of Agriculture (Figure 7).

10
Figure 7. Hammitt letter 10 November 1865 Source: Observer Records November 1865, National Climatic Data Center The reduction of enrollment may have been a reason that L. B. Tuckerman was available to
become the observer in November 1865. His father was the College’s fourth President whose term ran from 1860 to 1866. Mr. Hammitt reports that his health was the reason for the need for an assistant. The son seemed to have shared the observation responsibility with Mr. Hammitt for only a short time.
The Signal Service took over the weather observation role from the Smithsonian Institution
in 1870 with twenty-four reporting stations. In Cincinnati, the first Sergeant Observer was assigned in 1871 and the earliest of the extant reports from the Signal Service were sent in March 1872. Shortly after the Signal Service started, the observers at Woodward High School ceased sending their reports to the Smithsonian but the observations at College Hill continued. In March 1875, John Hammitt began sending his reports to the Signal Service in Washington rather than to the Smithsonian Institute. The following month he reported that
We have been unusually busy April past but have endeavored to do the best that our time will permit. As we practice on the blanks we hope to improve.

11
It was the War Department, Signal Service Form F that he used for practice. The form required observations three times per day and he was observing at 7 a.m., 2 p.m., and 9 p.m. He entered the barometer reading in inches and tenths; the exposed thermometer reading in Fahrenheit; wind direction in cardinal points and the coded wind force; the low cloud type and sky coverage in tenths, the upper clouds type, coverage, and direction of movement; the beginning and ending times of rain and snow; the amount of rain or melted snow; the daily mean barometer and temperature means; the type of weather, and remarks.
The old Smithsonian Register of Meteorological Observations form needed 27 entries per
day. The new Signal Service form had space for 69 entries per day. He did not complete all the columns on the new form. He did not have a hygrometer, and left the relative humidity, maximum and minimum temperature columns blank. Often he omitted the upper cloud information too.
Mr. Hammitt did not have the opportunity to be trained as the Army Sergeants were.
Goodwin’s study described the “school of instruction” located at Fort Whipple (later renamed Fort Myer) in Virginia. General Myer, Chief Signal Officer after the Civil War, created that weather school in 1870. The school trained the Signal Service observers in both weather observation and in telegraphy. The simultaneous transmission of weather observations from the observers to Fort Whipple permitted the evolution of daily weather maps.
By 1878, the total number of Signal Service reporting locations had increased to seventy-
eight nationwide. Three times each day (usually 7:35 a.m., 4:35 p.m., and 11:35 p.m.), each station telegraphed their observations to Washington, D.C. These observations consisted of:
Barometric pressure and its change since the last report. Temperature and its 24-hour change. Relative humidity. Wind velocity. Pressure of the wind in pounds per square foot. Amount of clouds. State of the weather.
From the beginning, the Signal Service station at Cincinnati was very active. It received daily reports from fifty-three other stations and those data were used to prepare issued eleven daily bulletins. They also provided tables of weather data to five daily newspapers, several libraries, the Chamber of Commerce, and the Board of Trade. The daily newspapers published the daily weather reports with attribution to the Signal Service.
In September 1879, Mr. Hammitt began using a new reporting form. It was a “Voluntary
Observer Form.” It still required the three times daily observations of the temperature, precipitation information, the clouds and sky conditions, the wind information, barometer information, and humidity and dew point information. There was a monthly climatological summary added with the requirements of reports of the dates of thunderstorms, the number of
12
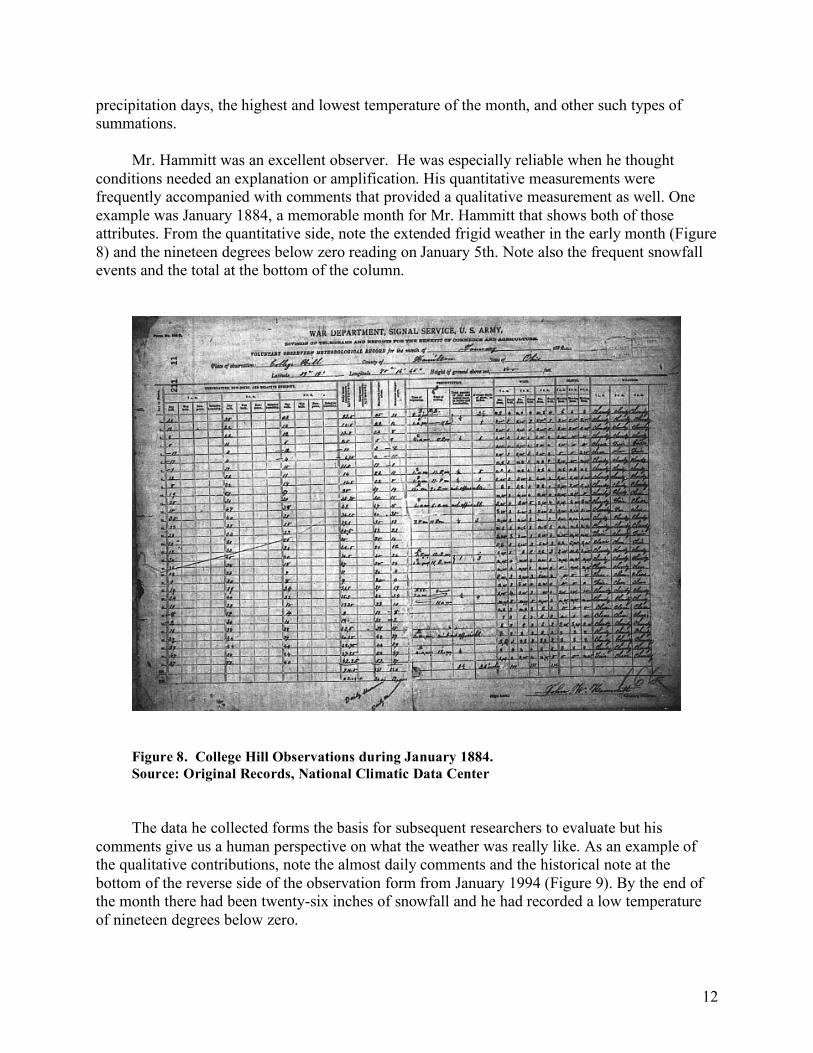
precipitation days, the highest and lowest temperature of the month, and other such types of summations.
Mr. Hammitt was an excellent observer. He was especially reliable when he thought
conditions needed an explanation or amplification. His quantitative measurements were frequently accompanied with comments that provided a qualitative measurement as well. One example was January 1884, a memorable month for Mr. Hammitt that shows both of those attributes. From the quantitative side, note the extended frigid weather in the early month (Figure 8) and the nineteen degrees below zero reading on January 5th. Note also the frequent snowfall events and the total at the bottom of the column.
Figure 8. College Hill Observations during January 1884. Source: Original Records, National Climatic Data Center The data he collected forms the basis for subsequent researchers to evaluate but his
comments give us a human perspective on what the weather was really like. As an example of the qualitative contributions, note the almost daily comments and the historical note at the bottom of the reverse side of the observation form from January 1994 (Figure 9). By the end of the month there had been twenty-six inches of snowfall and he had recorded a low temperature of nineteen degrees below zero.

13
Figure 9. The Remarks by John Hammitt during January 1884. Source: Original Record, National Climatic Data Center Even as good an observer as he was, he wasn’t always immune from the critical eye of the
recipients of his reports.

14
Figure 10. Letter from Chief Signal Officer to John W. Hammitt Source: Observer Records November 1889, National Climatic Data Center In 1889, Mr. Hammitt received a letter (Figure 10) from the office of A. W. Greely the
Chief Signal Officer that stated that one day’s data were missing from his October 1889 report. The letter is interesting because it shows that the reports were carefully read and that missing data were not taken lightly.

15
Figure 11. John Hammitt’s Response to A. W. Greely, December 1889 Source: Observer Records December 1889, National Climatic Data Center Mr, Hammitt responded (Figure 11) to the Greely letter. He states that conversation with
his family distracted him and caused the omission. That indicates he was making the observations at his home rather than at Farmers’ College. He said that he discovered the error on the day following the observation date and the day that he had mailed the report. He stated that he had submitted a correction the next day to the Signal Service and to the Weather Bureau in Columbus, Ohio. That indicates that he was routinely sending monthly reports to each of them. He then added a poetic note.
I am much pleased to own my errors past And make each day a critic (sic) on the last.

16
THE END OF COLLEGE HILL’S CLIMATE OBSERVATIONS On 3 August 1890, Mary Hammitt, John Hammitt’s wife, reported his death (Figure 12).
She said that he continued his labor up to the 20th of July when his failing health caused him to desist. She reported that he died on the 28th after an illness of three weeks. She attributed his illness to over exertion during the hot days of June. She must have been referring to the nine consecutive days above 90˚F from the 21st through the 29th of June.
Figure 12. Note by Mrs. Mary C. Hammitt, Written on Her Husband’s Last Observational
Form , July 1890 Source: National Climatic Data Center So ended a long and valuable record of the variability of climate during the developmental
period after the early settlement of the Old Northwest. One can’t help but be proud that all the people involved recognized the value of these weather records and preserved them with care.

17
BIBLIOGRAPHY
Alexander, William Henry, 1923. A Climatological History of Ohio. The Engineering Department of the Ohio State University, Columbus, Ohio. 745 pages
Cary, Samuel F., 1886. Historical Sketch of College Hill and Vicinity. Printed under the direction
of a committee appointed by the Citizens of College Hill, Ohio, April 1886. Cist, Charles, 1851. Sketches and statistics of Cincinnati in 1851. W H Moore & Company,
Cincinnati, Ohio College Hill Historical Society, 1988. Old College Hill. College Hill Historical Society, College
Hill, Ohio Devereaux, W. C., 1919. Paper on Weather in Cincinnati, Monthly Weather Review, July 1919. Ford, 1881. History of Hamilon County Ohio. Goodwin, R. Christopher, et al., 1995. National Historic Context for Department of Defense
Installations 1790-1940. Volume I of IV Volumes. Contract No. DACW31-89-D-0059, U.S. Corps of Engineers, Baltimore Maryland.
Huston, A. B., 1902. Historical Sketch of Farmers’ College. The Students Association of
Farmers’ College. Cincinnati. Miller, Eric R., 1931. The Evolution of Meteorological Institutions in the United States. Monthly
Weather Review, Vol 59, No. 1, January 1931 100 obscure American telescope makers & designers. http://home.europa.com/~telscope/tsusobs.txt Smart, Charles. 1894. The Connection of the Army Medical Department With the Development of
Meteorology in the United States, in Weather Bureau Bulletin 11, Washington Smiddy, Betty Ann, 1999. A Little Piece of Paradise, College Hill, Ohio. College Hill Historical
Society, College Hill, Ohio Surgeon General’s Office, Meteorological Register, 1822-1825. Washington D. C. 1826 Williamson, Robert Stockton, 1868. On the Use of the Barometer on Surveys and
Reconnaissances. D. Van Norstrand, New York. 248 pages.

18
APPENDIX 1
METHODOLOGY
The primary sources of information for this study were the College Hill, Ohio and other Hamilton County observers’ daily weather records themselves. Copies of their monthly reports and the data digitized from those reports were available from the Midwestern Regional Climate Center in Champaign, Illinois, or the National Climatic Data Center in Asheville, North Carolina. The monthly reports can be considered original sources because they were written by the observers and not altered by subsequent readers.
There were a variety of secondary sources that held information about College Hill, its
history, and its people. The author visited and collected information from the holdings of the Kentucky Climate Center and the Kentucky Library at Western Kentucky University in Bowling Green, Kentucky; and the National Climatic Data Center at Asheville, North Carolina. The primary historical sources were the Cincinnati Public Library, the Cincinnati Historical Society Library, and the University of Cincinnati Archives. The LDS Family History Library in Salt Lake City, Utah was visited as well. The National Weather Service Office in Wilmington, Ohio, especially Sam McNeil, was most helpful.
The tertiary sources were reference materials that are available on-line. Among those were
the metadata prepared by the Office of the State Climatologist of Ohio, Midwestern Regional Climate Center, the National Climatic Data Center substation histories, and the Signal Service records of the U.S. Army. Two genealogical research sources, Ancestry.com and Genealogy.com were used to provide some of the personal information about the observers. For location analysis, the interactive maps available from TopoZone.com were used.
There was an attempt to glean information from all these sources that would allow a
glimpse into the lives of the observers, the location of the observation site, and the historical environment that produced the climatic history of College Hill, Ohio. Maps, drawings, and photographs were included when appropriate to illustrate the information.
Throughout the research for and preparation of this study, the objective was to produce a
document that future studies can use to evaluate the validity of the data that were collected here, judge the trustworthiness of the observers who collected them, and determine the climatological significance of the whatever variability may be discerned.