hindustan petroleum corporation limited - petrotechpetrotech.in/uploadfiles/speakerprofiles/hpcl_ m...
TRANSCRIPT
Questions
1
Hindustan Petroleum
Corporation Limited
New Delhi
December 6, 2016
- M K Surana

Questions
2
Plan of Presentation
1 Hydrocarbon Industry : Outlook
2 Impact of Renewables
3 Reducing environmental footprint

Questions
3
Global Energy Mix : 2015
Oil is the world’s leading fuel, contributing to ~ 33% of
global energy consumption of 13,147 mtoe
Units in mtoeSource : BP Statistical Review 2016
Global Energy consumption
10 Year CAGR = 2.3% ; Growth in 2015 = 1.0%
Questions
4
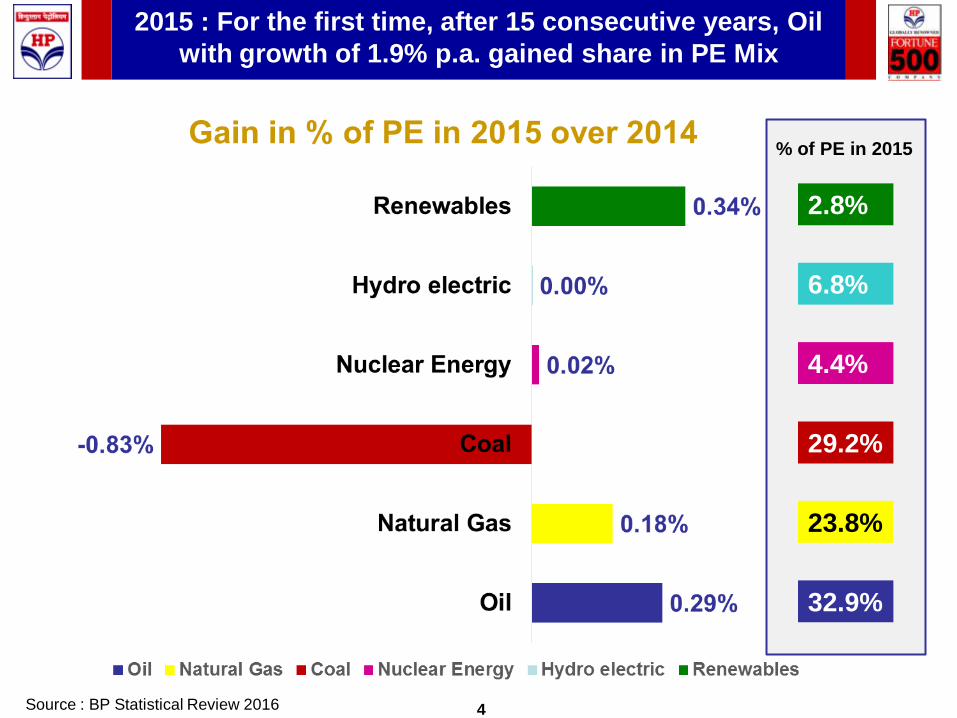
2015 : For the first time, after 15 consecutive years, Oil
with growth of 1.9% p.a. gained share in PE Mix
32.9%
23.8%
29.2%
4.4%
6.8%
2.8%
% of PE in 2015
Source : BP Statistical Review 2016

Questions
5
Key Global Trends witnessed in 2015
• Weakening energy demand due to decline in China growth, slow recovery
in Europe and shift of fuel mix from Coal to Natural gas in US power sector.
• Increased Supply, due to rapid technology and productivity gains driving
strong growth in US Oil output and growth in other Oil producers like Iraq,
Iran and Saudi Arabia.
• OPEC continued to leave output targets unchanged resulting in rise in Oil
inventories globally.
• Sharp fall in energy prices across Oil, Natural Gas and Coal.
• Non-Fossil fuels grew on the back of growth in new entrants of Solar and
Wind in Power sector, with China becoming the largest generator of Solar
Power.
• Technology costs particularly for wind and solar power have decreased
justifying investments in new capacities.
• Carbon Emissions from energy use witnessed the slowest growth in the
past 2 decades.
Source: Bloomberg, BP Statistical review 2016, Team Analysis
Questions
6
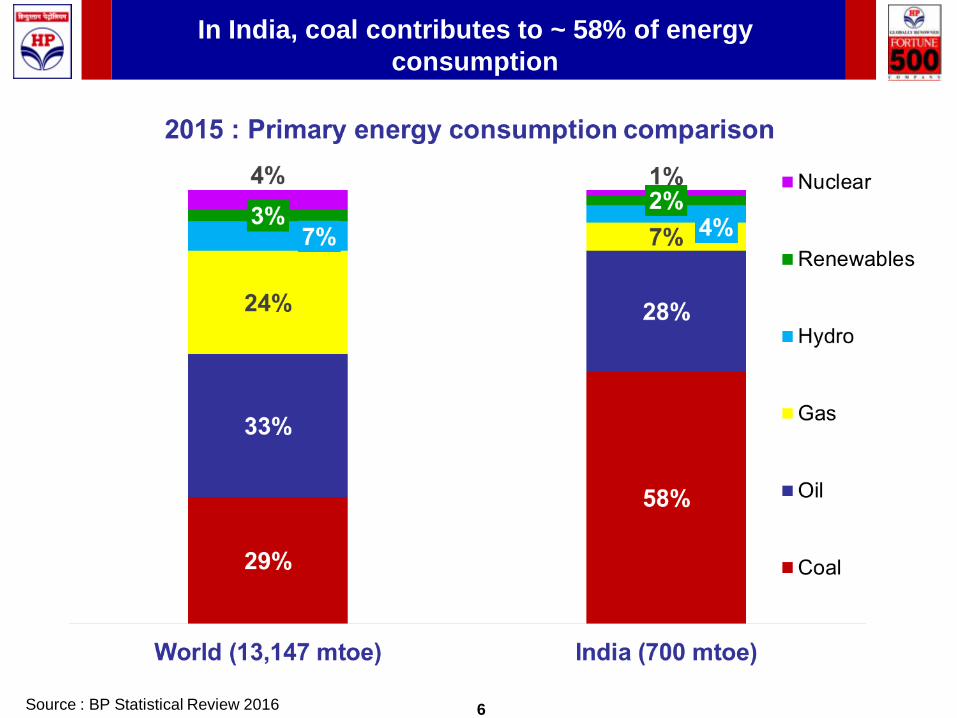
In India, coal contributes to ~ 58% of energy
consumption
Source : BP Statistical Review 2016
Questions
7
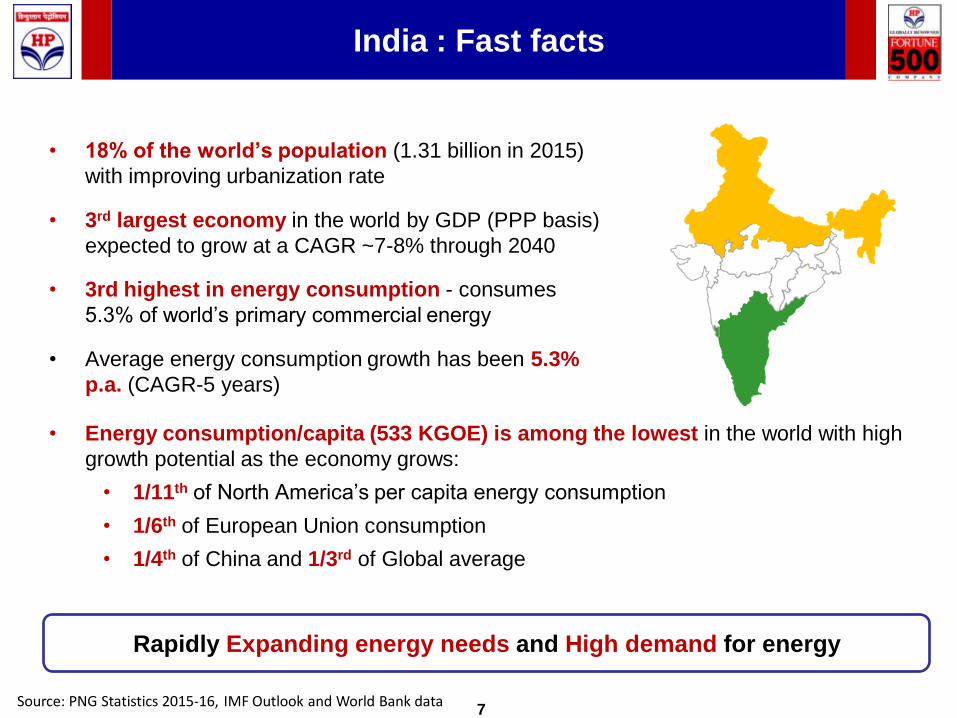
India : Fast facts
• 18% of the world’s population (1.31 billion in 2015)
with improving urbanization rate
• 3rd largest economy in the world by GDP (PPP basis)
expected to grow at a CAGR ~7-8% through 2040
• 3rd highest in energy consumption - consumes
5.3% of world’s primary commercial energy
• Average energy consumption growth has been 5.3%
p.a. (CAGR-5 years)
Rapidly Expanding energy needs and High demand for energy
• Energy consumption/capita (533 KGOE) is among the lowest in the world with high
growth potential as the economy grows:
• 1/11th of North America’s per capita energy consumption
• 1/6th of European Union consumption
• 1/4th of China and 1/3rd of Global average
Source: PNG Statistics 2015-16, IMF Outlook and World Bank data
Questions
8
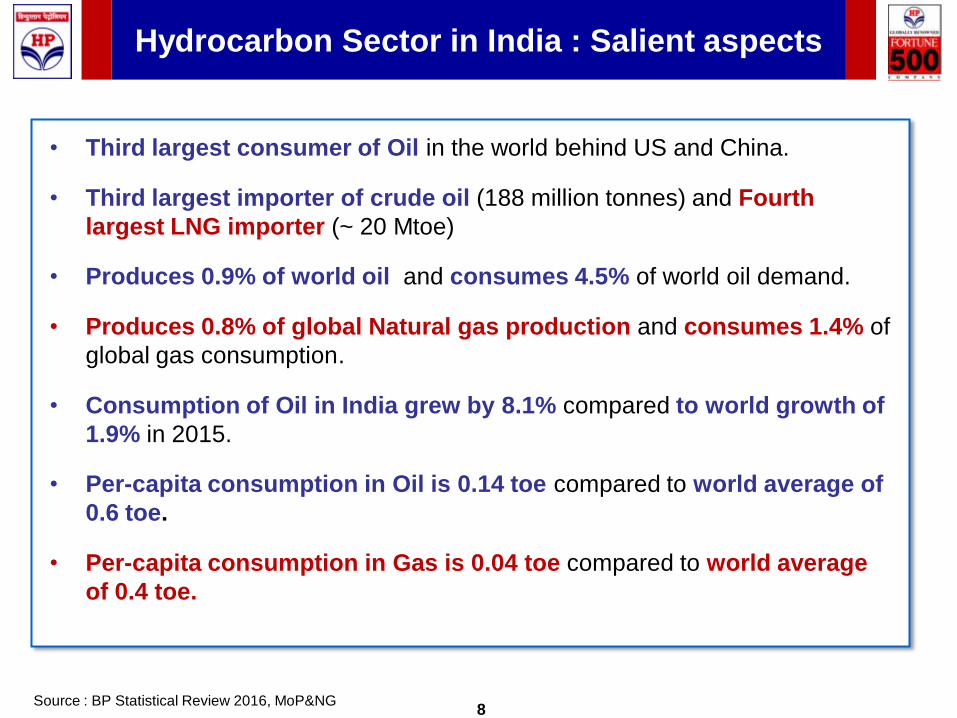
Hydrocarbon Sector in India : Salient aspects
Source : BP Statistical Review 2016, MoP&NG
• Third largest consumer of Oil in the world behind US and China.
• Third largest importer of crude oil (188 million tonnes) and Fourth
largest LNG importer (~ 20 Mtoe)
• Produces 0.9% of world oil and consumes 4.5% of world oil demand.
• Produces 0.8% of global Natural gas production and consumes 1.4% of
global gas consumption.
• Consumption of Oil in India grew by 8.1% compared to world growth of
1.9% in 2015.
• Per-capita consumption in Oil is 0.14 toe compared to world average of
0.6 toe.
• Per-capita consumption in Gas is 0.04 toe compared to world average
of 0.4 toe.

Questions
9
Government of India Initiatives driving Growth
FDI Liberalization• Construction
• Civil Aviation
• Defence
• Financial Services
• Oil & Gas
Policy Instruments • PMUY, DBTK, Perform Achieve and Trade (PAT) scheme
• RPO, Electricity to every household by 2019
• Pro-market, Pro-growth Reforms
• GST Framework under process
Government Initiatives
Make in India• Promoting India’s production/ manufacturing sector
• Improving investment and innovation landscape
• Start up India, Digital India, Skill India
Questions
10
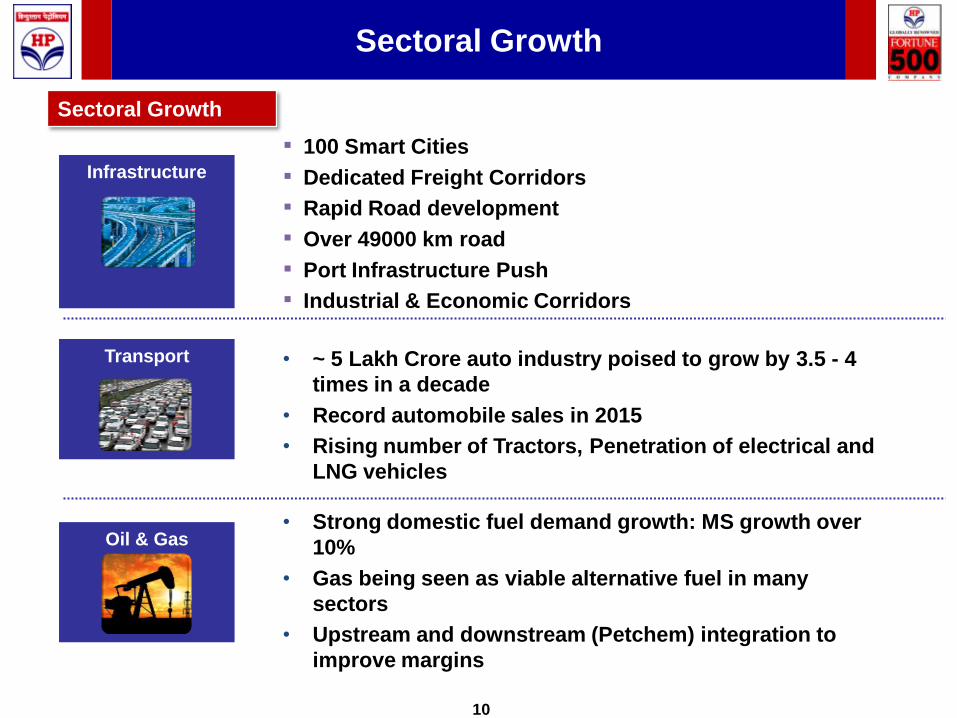
Sectoral Growth
Sectoral Growth
Oil & Gas• Strong domestic fuel demand growth: MS growth over
10%
• Gas being seen as viable alternative fuel in many
sectors
• Upstream and downstream (Petchem) integration to
improve margins
Infrastructure
▪ 100 Smart Cities
▪ Dedicated Freight Corridors
▪ Rapid Road development
▪ Over 49000 km road
▪ Port Infrastructure Push
▪ Industrial & Economic Corridors
Transport • ~ 5 Lakh Crore auto industry poised to grow by 3.5 - 4
times in a decade
• Record automobile sales in 2015
• Rising number of Tractors, Penetration of electrical and
LNG vehicles
Questions
11
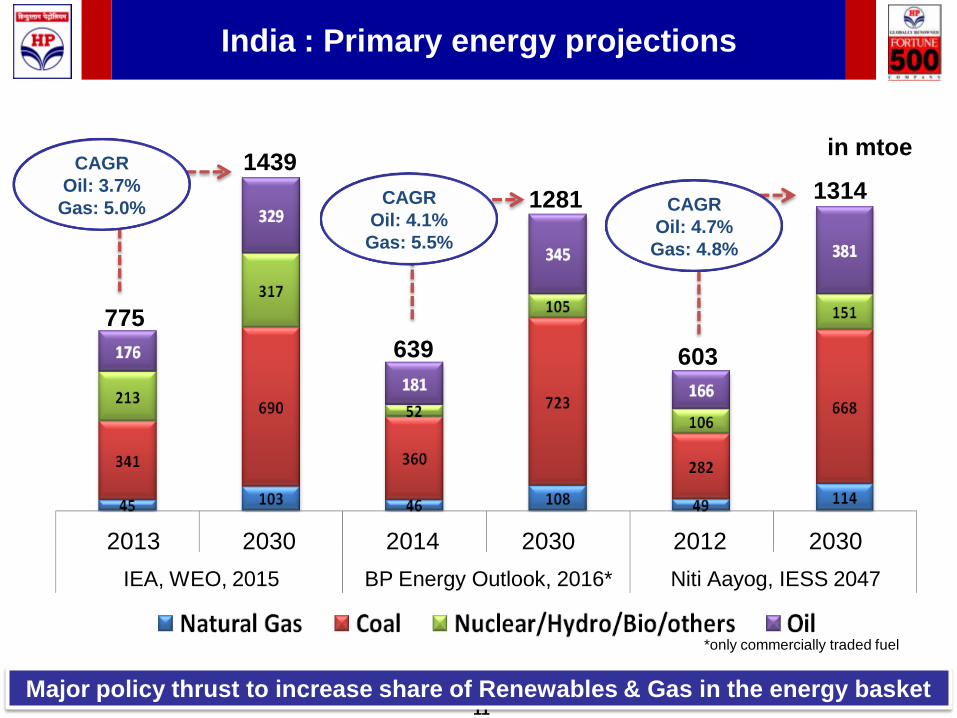
India : Primary energy projections
IEA, WEO, 2015 BP Energy Outlook, 2016* Niti Aayog, IESS 2047
2013 2030 2014 2030 2012 2030
775
1439
1281
639
1314
603
in mtoe
Major policy thrust to increase share of Renewables & Gas in the energy basket
CAGR
Oil: 3.7%
Gas: 5.0%CAGR
Oil: 4.1%
Gas: 5.5%
CAGR
Oil: 4.7%
Gas: 4.8%
*only commercially traded fuel
Questions
12
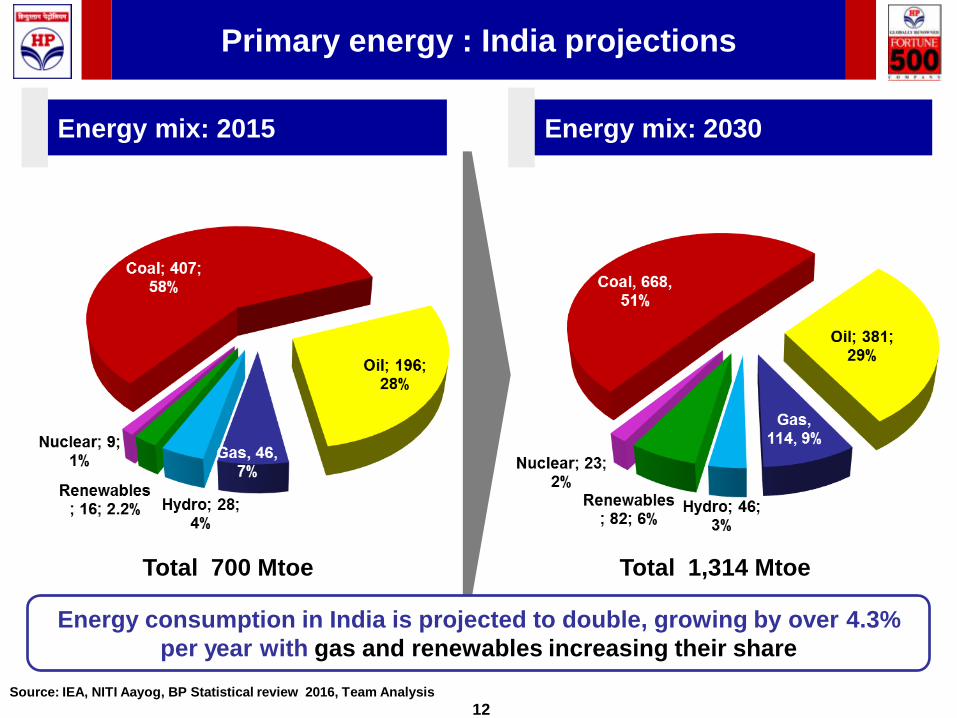
Primary energy : India projections
Source: IEA, NITI Aayog, BP Statistical review 2016, Team Analysis
Energy mix: 2015 Energy mix: 2030
Total 700 Mtoe Total 1,314 Mtoe
Energy consumption in India is projected to double, growing by over 4.3%
per year with gas and renewables increasing their share
Questions
13
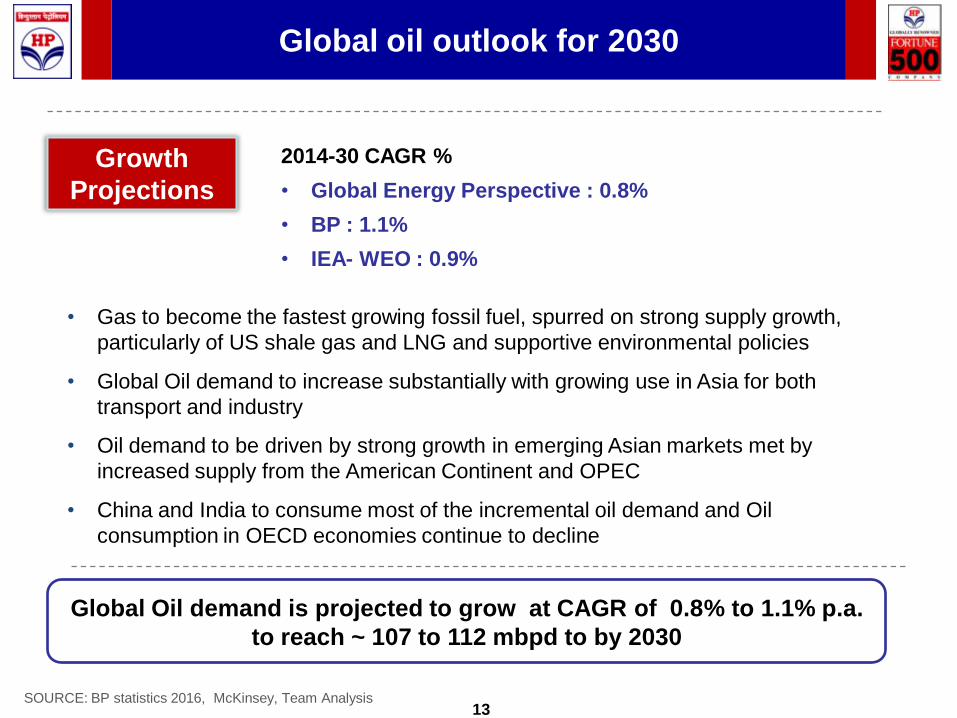
Global oil outlook for 2030
SOURCE: BP statistics 2016, McKinsey, Team Analysis
Growth
Projections
2014-30 CAGR %
• Global Energy Perspective : 0.8%
• BP : 1.1%
• IEA- WEO : 0.9%
Global Oil demand is projected to grow at CAGR of 0.8% to 1.1% p.a.
to reach ~ 107 to 112 mbpd to by 2030
• Gas to become the fastest growing fossil fuel, spurred on strong supply growth,
particularly of US shale gas and LNG and supportive environmental policies
• Global Oil demand to increase substantially with growing use in Asia for both
transport and industry
• Oil demand to be driven by strong growth in emerging Asian markets met by
increased supply from the American Continent and OPEC
• China and India to consume most of the incremental oil demand and Oil
consumption in OECD economies continue to decline
Questions
14
Plan of Presentation
1 Hydrocarbon Industry : Outlook
2 Impact of Renewables
3 Reducing environmental foot print
Questions
15
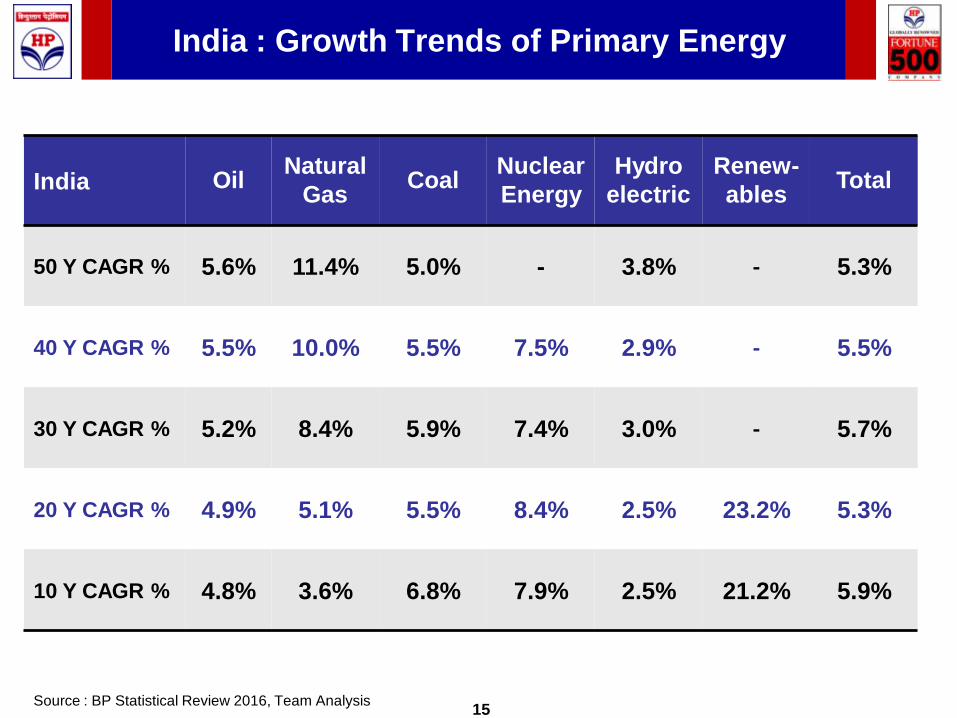
India : Growth Trends of Primary Energy
India OilNatural
GasCoal
Nuclear
Energy
Hydro
electric
Renew-
ablesTotal
50 Y CAGR % 5.6% 11.4% 5.0% - 3.8% - 5.3%
40 Y CAGR % 5.5% 10.0% 5.5% 7.5% 2.9% - 5.5%
30 Y CAGR % 5.2% 8.4% 5.9% 7.4% 3.0% - 5.7%
20 Y CAGR % 4.9% 5.1% 5.5% 8.4% 2.5% 23.2% 5.3%
10 Y CAGR % 4.8% 3.6% 6.8% 7.9% 2.5% 21.2% 5.9%
Source : BP Statistical Review 2016, Team Analysis
Questions
16
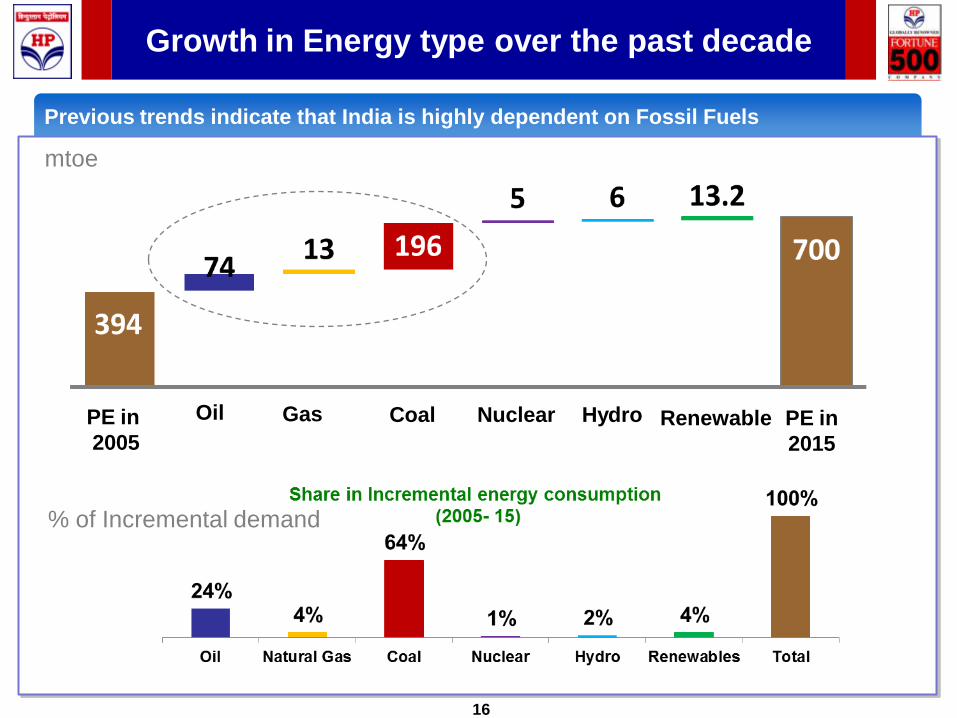
Growth in Energy type over the past decade
Previous trends indicate that India is highly dependent on Fossil Fuels
mtoe
GasPE in
2005
Oil Coal Nuclear Hydro Renewable PE in
2015
% of Incremental demand
Questions
17
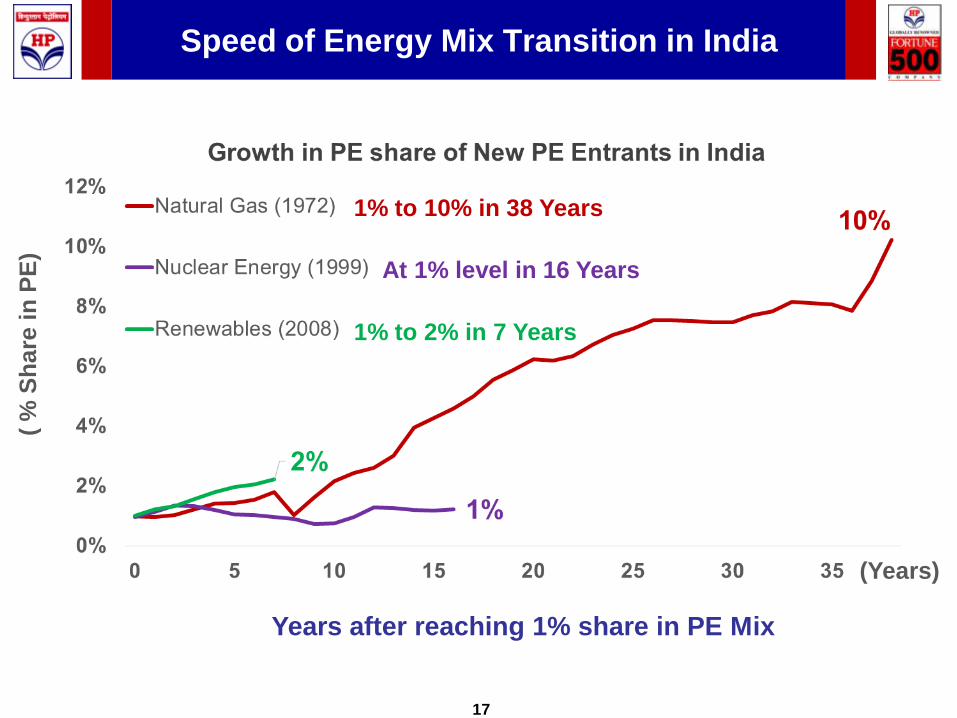
Speed of Energy Mix Transition in India
Years after reaching 1% share in PE Mix
1% to 10% in 38 Years
At 1% level in 16 Years
1% to 2% in 7 Years
(Years)
( %
Sh
are
in
PE
)
Questions
18
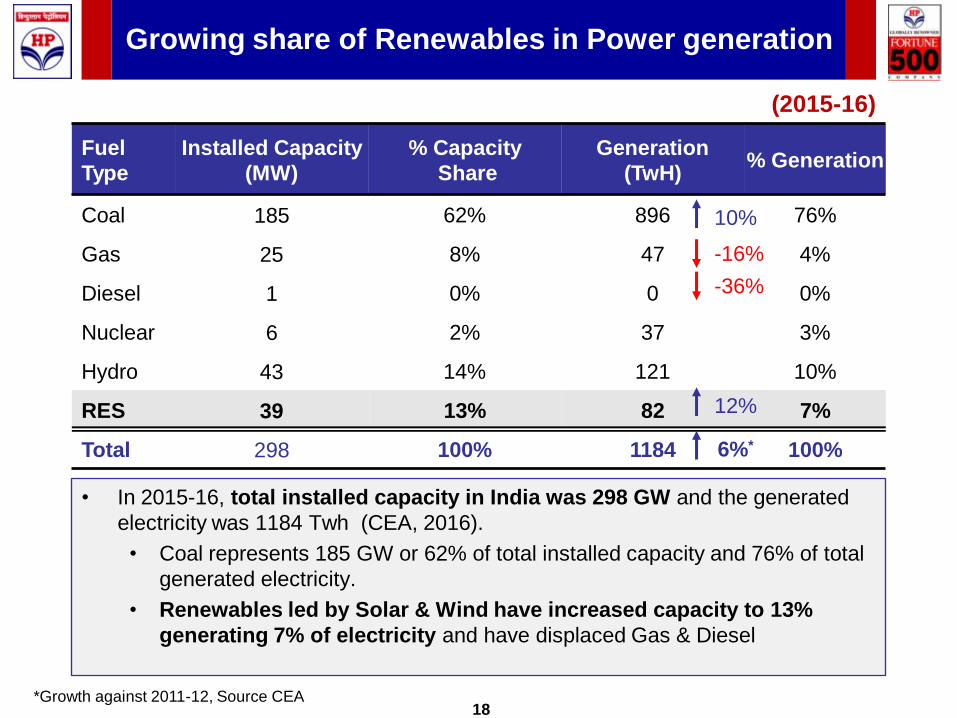
Growing share of Renewables in Power generation
Fuel
Type
Installed Capacity
(MW)
% Capacity
Share
Generation
(TwH)% Generation
Coal 185 62% 896 76%
Gas 25 8% 47 4%
Diesel 1 0% 0 0%
Nuclear 6 2% 37 3%
Hydro 43 14% 121 10%
RES 39 13% 82 7%
Total 298 100% 1184 100%
(2015-16)
• In 2015-16, total installed capacity in India was 298 GW and the generated
electricity was 1184 Twh (CEA, 2016).
• Coal represents 185 GW or 62% of total installed capacity and 76% of total
generated electricity.
• Renewables led by Solar & Wind have increased capacity to 13%
generating 7% of electricity and have displaced Gas & Diesel
-16%
-36%
10%
12%
6%*
*Growth against 2011-12, Source CEA
Questions
19
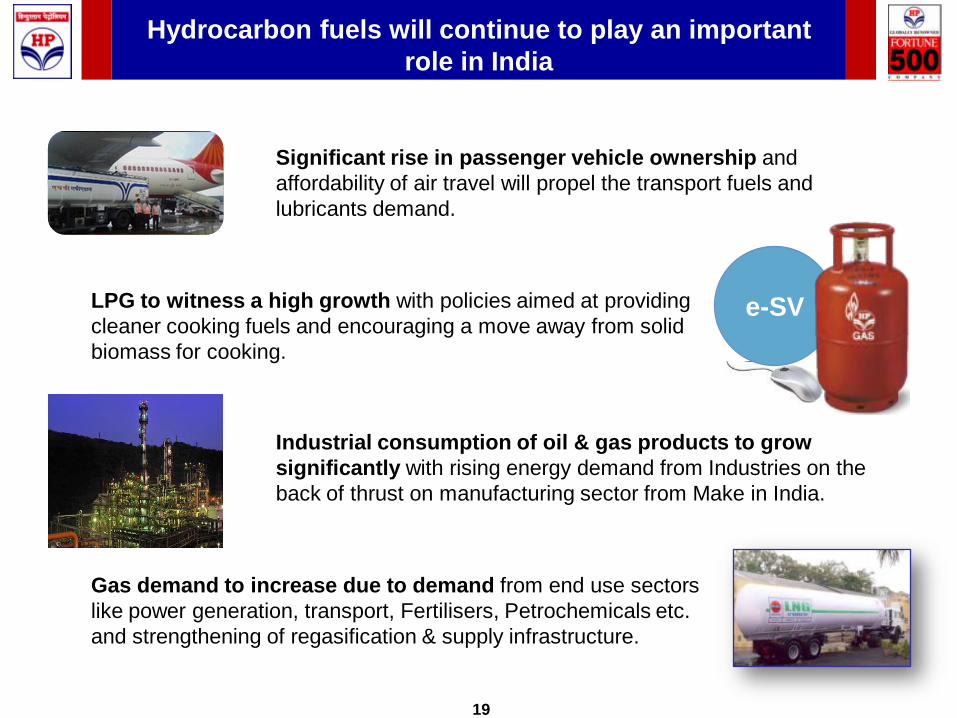
Hydrocarbon fuels will continue to play an important
role in India
Significant rise in passenger vehicle ownership and
affordability of air travel will propel the transport fuels and
lubricants demand.
LPG to witness a high growth with policies aimed at providing
cleaner cooking fuels and encouraging a move away from solid
biomass for cooking.
Industrial consumption of oil & gas products to grow
significantly with rising energy demand from Industries on the
back of thrust on manufacturing sector from Make in India.
Gas demand to increase due to demand from end use sectors
like power generation, transport, Fertilisers, Petrochemicals etc.
and strengthening of regasification & supply infrastructure.
e-SV
Questions
20
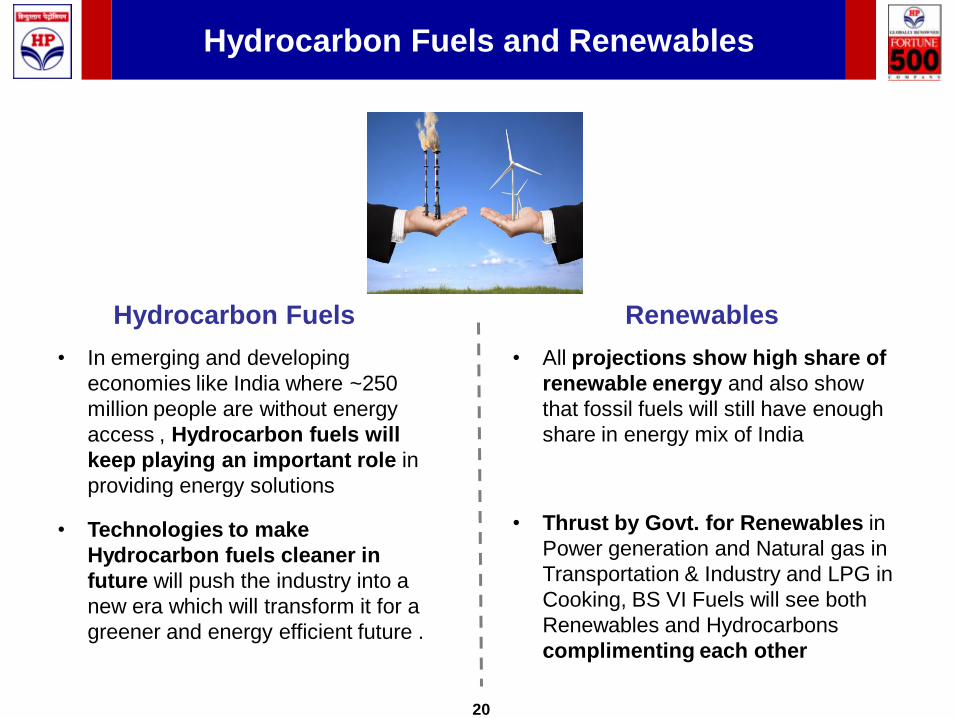
Hydrocarbon Fuels and Renewables
• In emerging and developing
economies like India where ~250
million people are without energy
access , Hydrocarbon fuels will
keep playing an important role in
providing energy solutions
• Technologies to make
Hydrocarbon fuels cleaner in
future will push the industry into a
new era which will transform it for a
greener and energy efficient future .
• All projections show high share of
renewable energy and also show
that fossil fuels will still have enough
share in energy mix of India
• Thrust by Govt. for Renewables in
Power generation and Natural gas in
Transportation & Industry and LPG in
Cooking, BS VI Fuels will see both
Renewables and Hydrocarbons
complimenting each other
Hydrocarbon Fuels Renewables
Questions
21
Plan of Presentation
1 Hydrocarbon Industry : Outlook
2 Impact of Renewables
3 Reducing environmental foot print
Questions
23
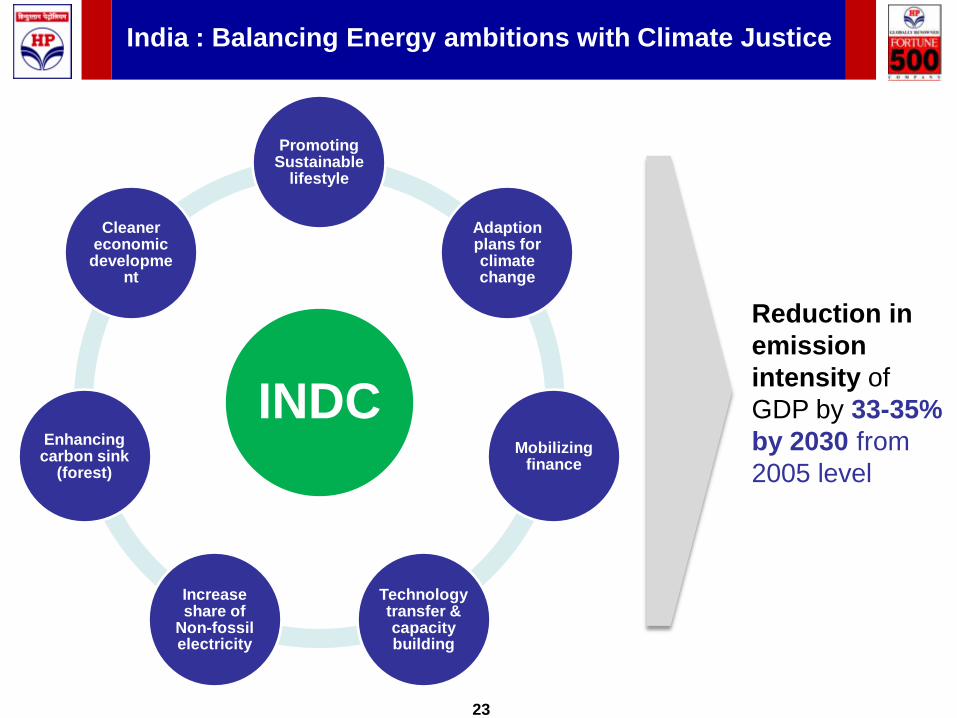
India : Balancing Energy ambitions with Climate Justice
INDC
Promoting Sustainable
lifestyle
Adaption plans for climate change
Mobilizing finance
Technology transfer & capacity building
Increase share of
Non-fossil electricity
Enhancing carbon sink
(forest)
Cleaner economic
development
Reduction in
emission
intensity of
GDP by 33-35%
by 2030 from
2005 level
Questions
24
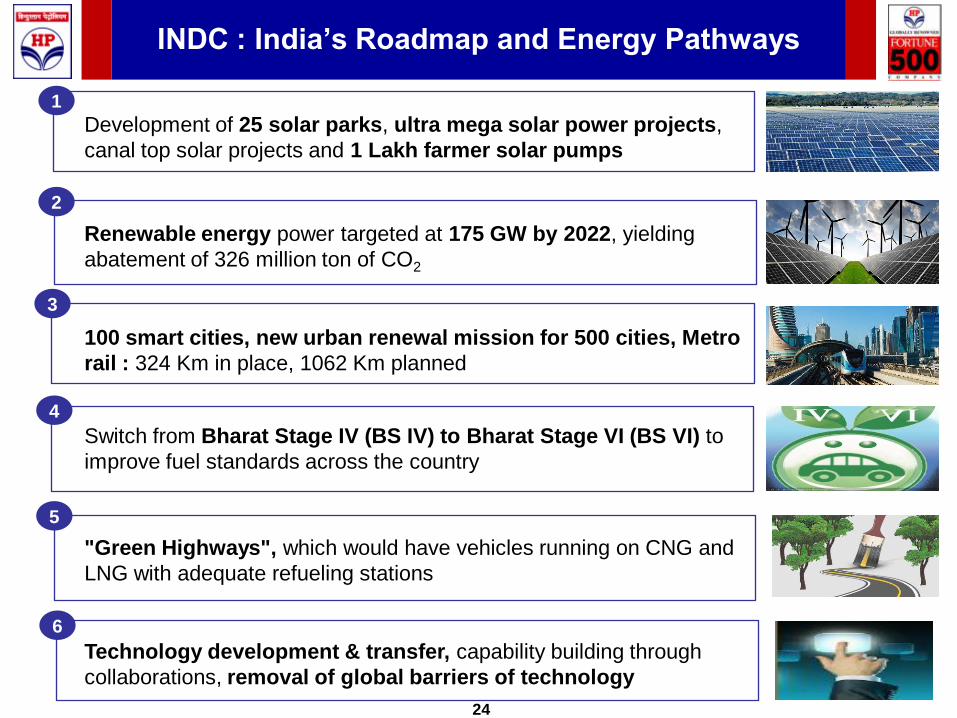
INDC : India’s Roadmap and Energy Pathways
1
2
3
4
5
6
Development of 25 solar parks, ultra mega solar power projects,
canal top solar projects and 1 Lakh farmer solar pumps
Renewable energy power targeted at 175 GW by 2022, yielding
abatement of 326 million ton of CO2
100 smart cities, new urban renewal mission for 500 cities, Metro
rail : 324 Km in place, 1062 Km planned
Switch from Bharat Stage IV (BS IV) to Bharat Stage VI (BS VI) to
improve fuel standards across the country
"Green Highways", which would have vehicles running on CNG and
LNG with adequate refueling stations
Technology development & transfer, capability building through
collaborations, removal of global barriers of technology
Questions
25
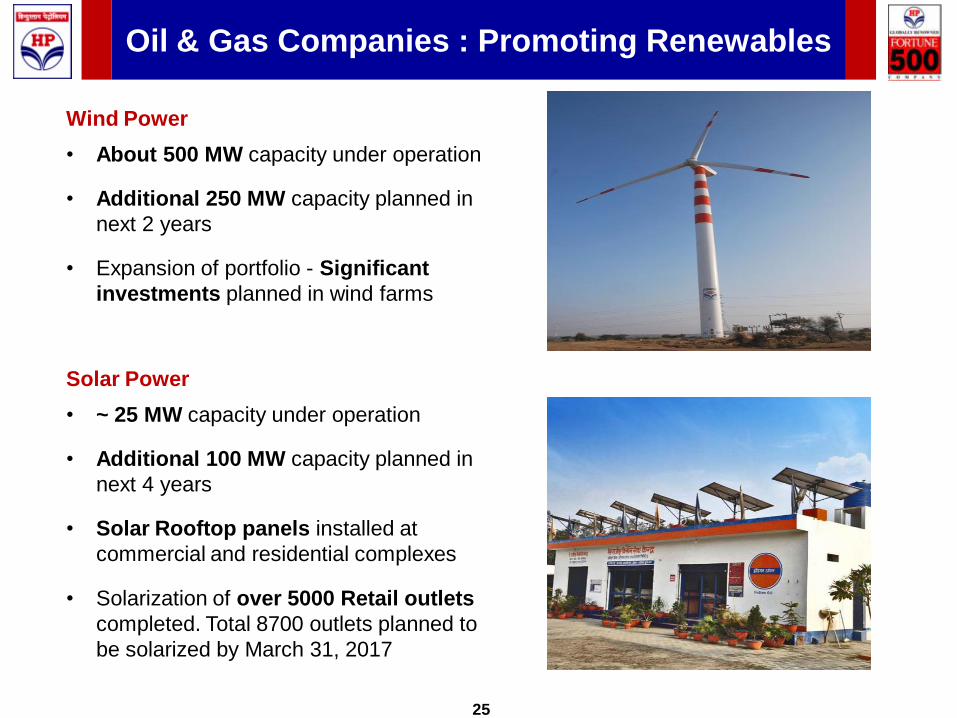
Oil & Gas Companies : Promoting Renewables
Wind Power
• About 500 MW capacity under operation
• Additional 250 MW capacity planned in
next 2 years
• Expansion of portfolio - Significant
investments planned in wind farms
Solar Power
• ~ 25 MW capacity under operation
• Additional 100 MW capacity planned in
next 4 years
• Solar Rooftop panels installed at
commercial and residential complexes
• Solarization of over 5000 Retail outlets
completed. Total 8700 outlets planned to
be solarized by March 31, 2017
Questions
26
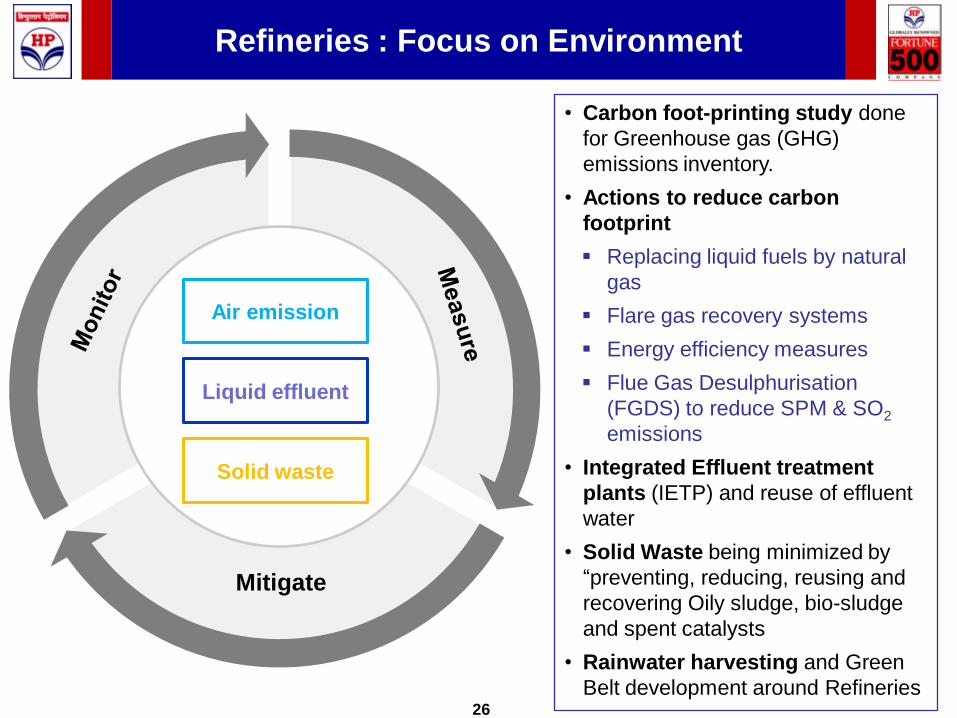
Refineries : Focus on Environment
Mitigate
• Carbon foot-printing study done
for Greenhouse gas (GHG)
emissions inventory.
• Actions to reduce carbon
footprint
Replacing liquid fuels by natural
gas
Flare gas recovery systems
Energy efficiency measures
Flue Gas Desulphurisation
(FGDS) to reduce SPM & SO2
emissions
• Integrated Effluent treatment
plants (IETP) and reuse of effluent
water
• Solid Waste being minimized by
“preventing, reducing, reusing and
recovering Oily sludge, bio-sludge
and spent catalysts
• Rainwater harvesting and Green
Belt development around Refineries
Air emission
Liquid effluent
Solid waste
Questions
27
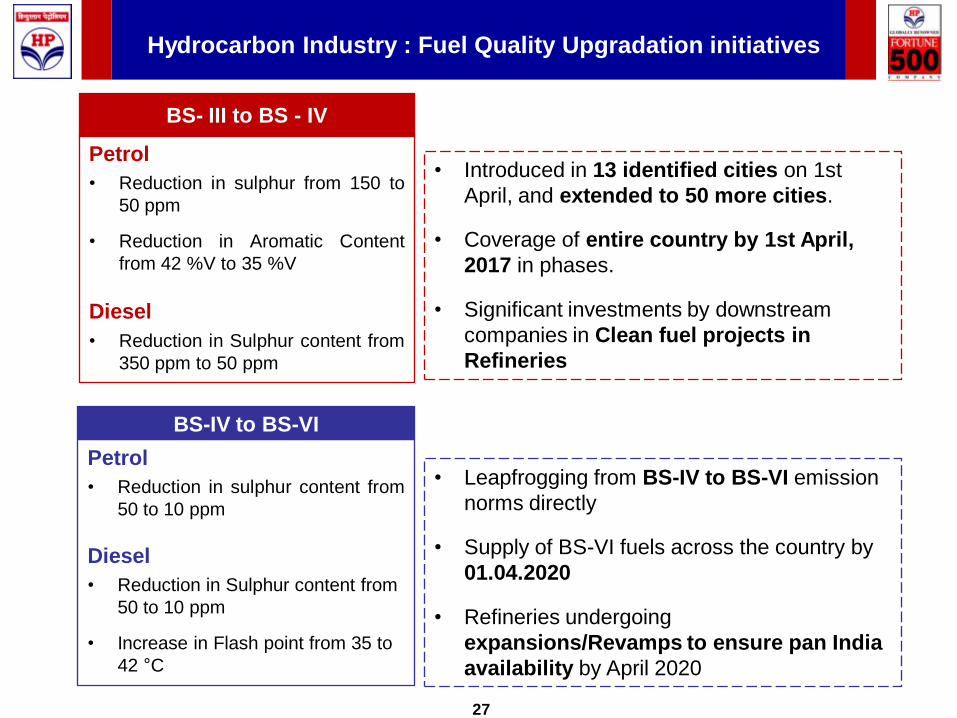
Hydrocarbon Industry : Fuel Quality Upgradation initiatives
Petrol
• Reduction in sulphur from 150 to
50 ppm
• Reduction in Aromatic Content
from 42 %V to 35 %V
Diesel
• Reduction in Sulphur content from
350 ppm to 50 ppm
BS- III to BS - IV
Petrol
• Reduction in sulphur content from
50 to 10 ppm
Diesel
• Reduction in Sulphur content from
50 to 10 ppm
• Increase in Flash point from 35 to
42 °C
BS-IV to BS-VI
• Introduced in 13 identified cities on 1st
April, and extended to 50 more cities.
• Coverage of entire country by 1st April,
2017 in phases.
• Significant investments by downstream
companies in Clean fuel projects in
Refineries
• Leapfrogging from BS-IV to BS-VI emission
norms directly
• Supply of BS-VI fuels across the country by
01.04.2020
• Refineries undergoing
expansions/Revamps to ensure pan India
availability by April 2020
Questions
28
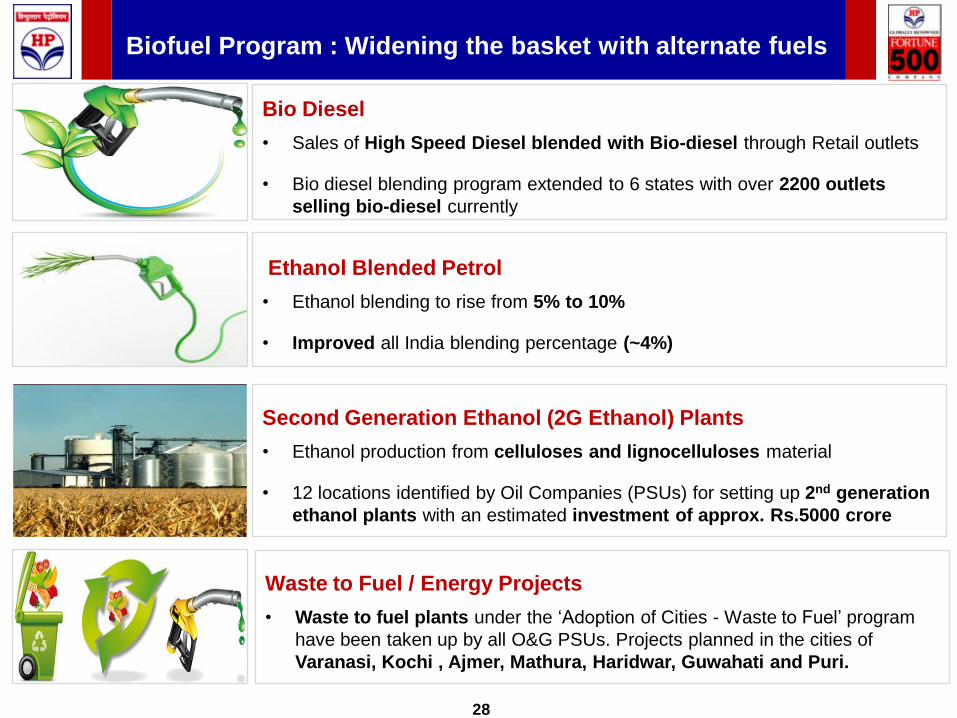
Biofuel Program : Widening the basket with alternate fuels
Bio Diesel
• Sales of High Speed Diesel blended with Bio-diesel through Retail outlets
• Bio diesel blending program extended to 6 states with over 2200 outlets
selling bio-diesel currently
Second Generation Ethanol (2G Ethanol) Plants
• Ethanol production from celluloses and lignocelluloses material
• 12 locations identified by Oil Companies (PSUs) for setting up 2nd generation
ethanol plants with an estimated investment of approx. Rs.5000 crore
Ethanol Blended Petrol
• Ethanol blending to rise from 5% to 10%
• Improved all India blending percentage (~4%)
Waste to Fuel / Energy Projects
• Waste to fuel plants under the ‘Adoption of Cities - Waste to Fuel’ program
have been taken up by all O&G PSUs. Projects planned in the cities of
Varanasi, Kochi , Ajmer, Mathura, Haridwar, Guwahati and Puri.
Questions
29
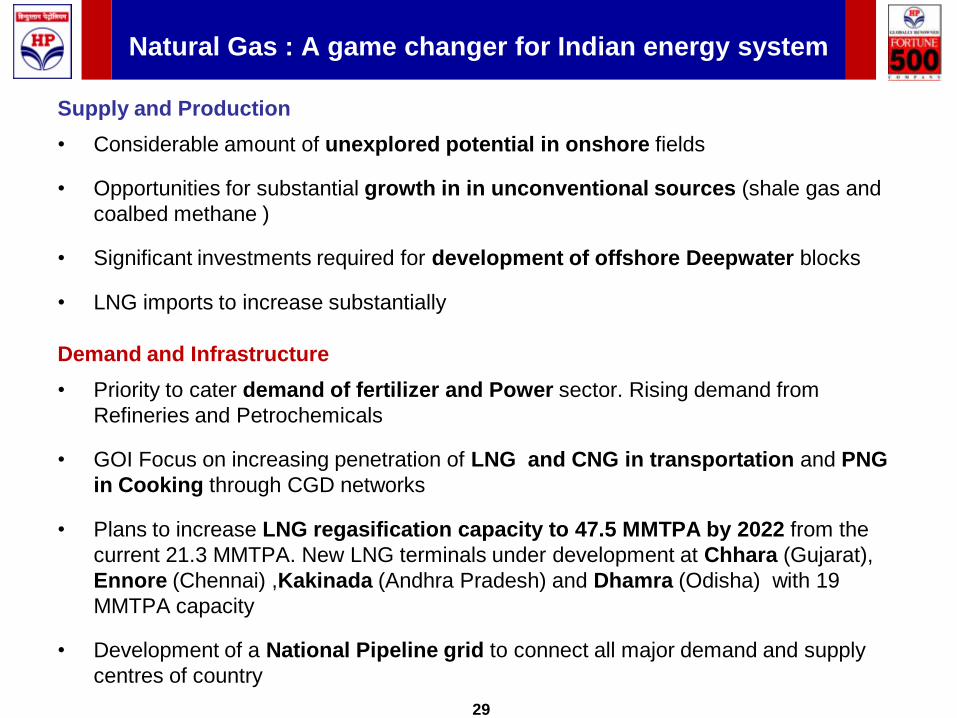
Natural Gas : A game changer for Indian energy system
Supply and Production
• Considerable amount of unexplored potential in onshore fields
• Opportunities for substantial growth in in unconventional sources (shale gas and
coalbed methane )
• Significant investments required for development of offshore Deepwater blocks
• LNG imports to increase substantially
Demand and Infrastructure
• Priority to cater demand of fertilizer and Power sector. Rising demand from
Refineries and Petrochemicals
• GOI Focus on increasing penetration of LNG and CNG in transportation and PNG
in Cooking through CGD networks
• Plans to increase LNG regasification capacity to 47.5 MMTPA by 2022 from the
current 21.3 MMTPA. New LNG terminals under development at Chhara (Gujarat),
Ennore (Chennai) ,Kakinada (Andhra Pradesh) and Dhamra (Odisha) with 19
MMTPA capacity
• Development of a National Pipeline grid to connect all major demand and supply
centres of country
Questions
30
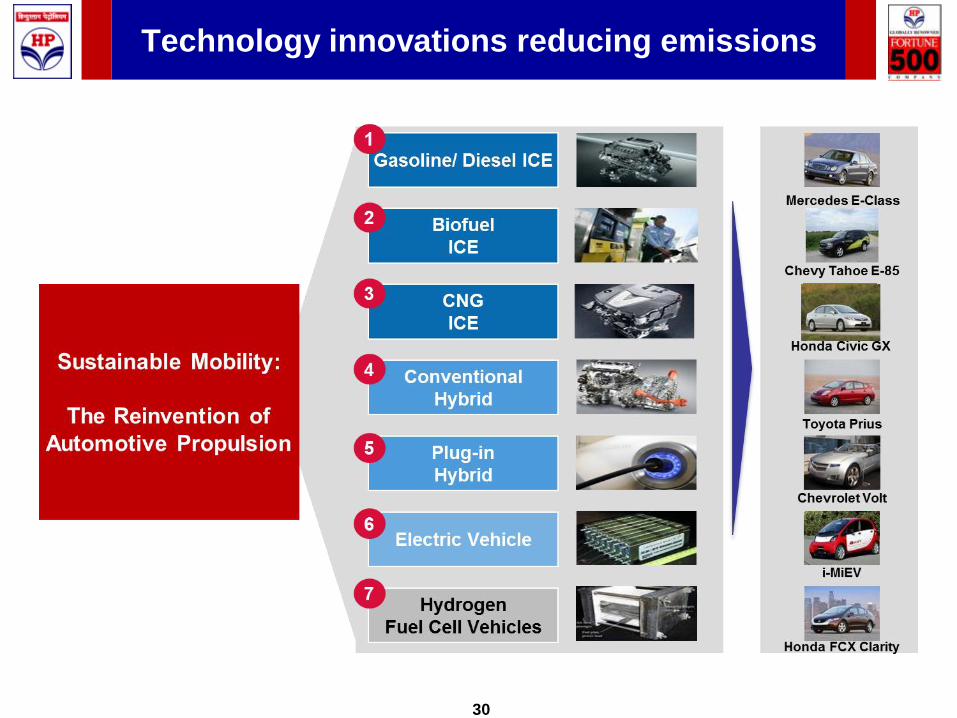
Technology innovations reducing emissions
Questions
31
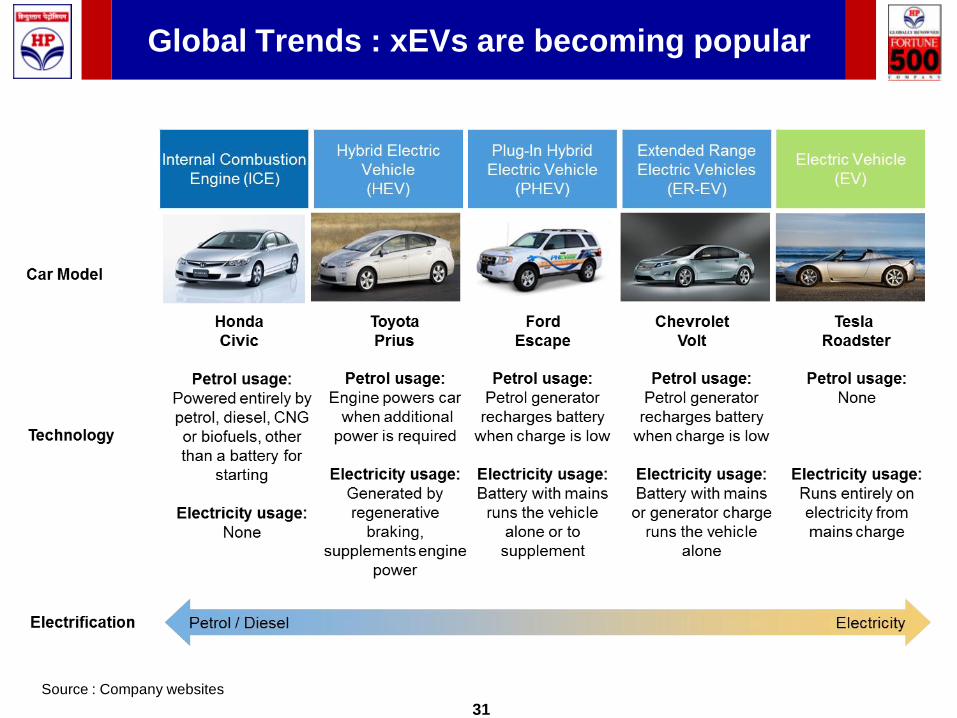
Global Trends : xEVs are becoming popular
Source : Company websites
Questions
32
In Conclusion
• Energy consumption in India is projected to double, growing by a CAGR of 4.3%
per year to reach ~ 1314 mtoe by 2030.
• The energy mix is projected to change with Renewables & Gas increasing the
share and Oil holding steady.
• Fossil fuels remain the dominant source of energy powering the Indian economy,
providing around 84% of the growth in energy demand (Coal – 43%, Oil – 30% and
Gas -11%) between 2015 to 2030 and accounting for about 89% of total energy
supply in 2030 (down from 93% in 2015).
• Gas is seen to be increasingly used in the industrial sector and for power
generation. Liquid fuels continue to dominate in the Transport sector.
• Among non-fossil fuels, renewables (including biofuels) is projected to grow
rapidly (11.7% p.a.), increasing share in primary energy from 2% in 2015 to reach
6% by 2030.
• Renewables is seen competing with fossil fuels in Power sector directly.
• The degree of Policy measures in Carbon Emissions will see advent of Battery
operated vehicles and increased use of natural gas as vehicle fuel.

Thank you