highlights shifting global supply chain, economic ties · other finished goods. ... t-shirt’s...
TRANSCRIPT

18 FEDERAL RESERVE BANK OF DALLAS • Globalization and Monetary Policy Institute 2012 Annual Report
he life of a T-shirt—from its origins in
a Lubbock, Texas, cotton field to its
final days in a used-clothing store in
Tanzania—aptly tells the story of glo-
balization, comparative advantage, trade regimes,
proximity to market and modern retailing.
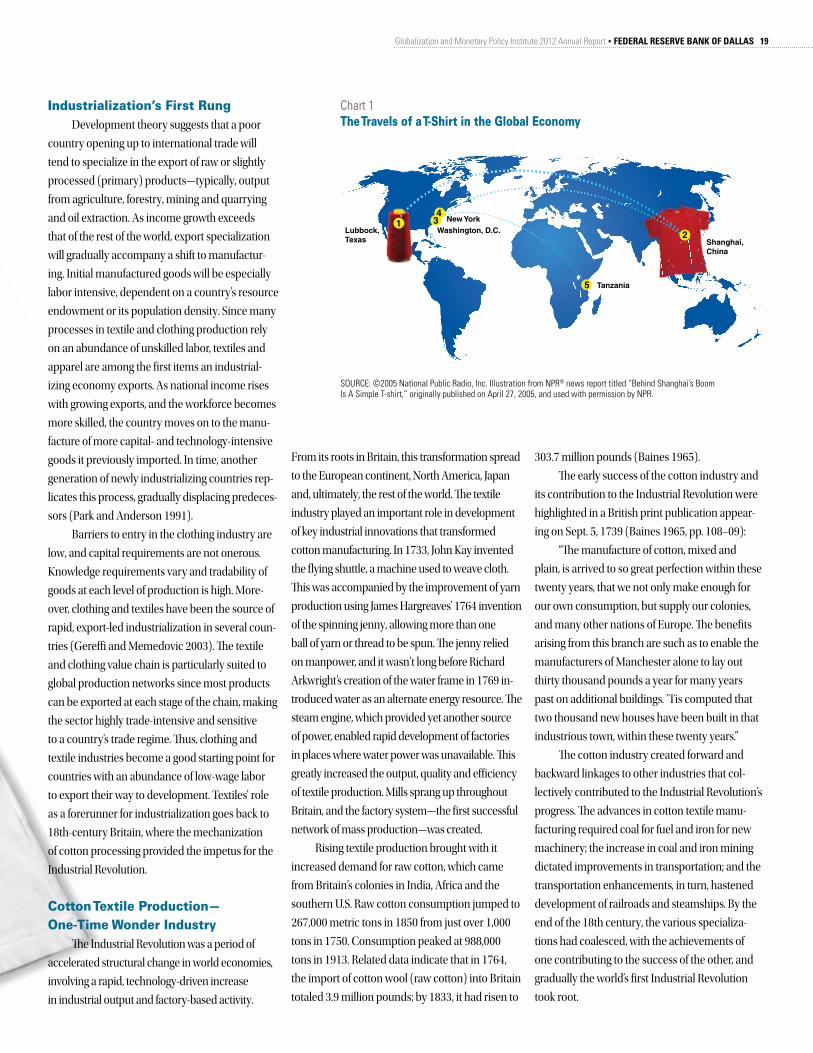
In the book The Travels of a T-Shirt in
the Global Economy, Georgetown University
economist Pietra Rivoli documents the roles of
three countries on three continents (Chart 1):
the United States, where the raw materials are
produced; China, where cheap labor and flexible
manufacturing practices are tailored to U.S. speed-
to-market demands; and Tanzania, an east African
country, whose used-clothing industry imports
extensively from the U.S. Along the way, cotton
for the T-shirt is spun, woven, cut and stitched to
U.S. specifications in China. Before the garment
can travel from the factory, it is subject to trade
policies (most formulated in Washington), which
determine sourcing and the quantity allowed
into the country. Once the T-shirt arrives in North
America, a U.S. shopper becomes its first owner.
Years later, after a household spring cleaning,
the now-faded garment is donated to charity,
perhaps to the Salvation Army or Goodwill.1 It
then starts another journey, this time across the
Atlantic to used-clothing stores in parts of Africa
and other developing nations. Here, a second
consumer buys the T-shirt. The single garment
provides a source of income to many during its
lifespan (Rivoli 2009).
The tale of this everyday item sheds light on
the complexities of globalization, mapping the
role of apparel and textiles in emergent economic
development, global shifts in sourcing and the
impact of trade policies.
Apparel and Textiles in Industrialization
Producing textiles and apparel typically
represents a “starter” opportunity for countries
engaged in export-oriented industrialization. It
involves global production, employment and
trade ties as nations cater to various markets. The
textiles and apparel industries each offer a range
of possibilities, including entry-level positions for
unskilled labor and a broad source of earnings
(Gereffi 2003). The two industries have migrated
from high-income locales to developing (low-
income) ones. Countries importing textiles and
apparel consider not only production costs and
trade agreements, but also the speed to get prod-
ucts to market and flexibility to adapt to retailers’
demands. Supply chains able to react quickly to
changing requirements have gained prominence
over inflexible ones.
Textile and apparel industries—although of-
ten thought of interchangeably—are two distinct,
albeit closely related, endeavors. Both represent
important links in the chain of production and
distribution responsible for providing consum-
ers with clothing and related products. Textile
mills manufacture yarn, thread and fabric for
clothing and items such as carpeting, automotive
upholstery, fire hoses, cord and twine. The textile
industry is highly automated and includes yarn
spinning, weaving, knitting, tufting and nonwoven
production.
Apparel manufacture converts textile
industry-produced fabrics into clothing and
other finished goods. The industry’s intermedi-
ate processes include cutting, sewing, assembly,
design, pressing, dying and transportation to the
consumer. The largest apparel-related occupation
is sewing machine operator, the most labor-inten-
sive step in production (Mittelhauser 1997).
T-Shirt’s Journey to MarketHighlights Shifting Global Supply Chain, Economic Ties
The life of a T-shirt—
from its origins in
a Lubbock, Texas,
cotton field to its
final days in a used-
clothing store in
Tanzania—aptly
tells the story of
globalization,
comparative
advantage, trade
regimes, proximity to
market and modern
retailing.
tBy Janet Koech
Globalization and Monetary Policy Institute 2012 Annual Report • FEDERAL RESERVE BANK OF DALLAS 19
Chart 1 The Travels of a T-Shirt in the Global Economy
Lubbock, Texas Shanghai,
China
Tanzania
New YorkWashington, D.C.
14
3
5
2
SOURCE: ©2005 National Public Radio, Inc. Illustration from NPR® news report titled “Behind Shanghai’s Boom Is A Simple T-shirt,” originally published on April 27, 2005, and used with permission by NPR.
Industrialization’s First Rung Development theory suggests that a poor
country opening up to international trade will
tend to specialize in the export of raw or slightly
processed (primary) products—typically, output
from agriculture, forestry, mining and quarrying
and oil extraction. As income growth exceeds
that of the rest of the world, export specialization
will gradually accompany a shift to manufactur-
ing. Initial manufactured goods will be especially
labor intensive, dependent on a country’s resource
endowment or its population density. Since many
processes in textile and clothing production rely
on an abundance of unskilled labor, textiles and
apparel are among the first items an industrial-
izing economy exports. As national income rises
with growing exports, and the workforce becomes
more skilled, the country moves on to the manu-
facture of more capital- and technology-intensive
goods it previously imported. In time, another
generation of newly industrializing countries rep-
licates this process, gradually displacing predeces-
sors (Park and Anderson 1991).
Barriers to entry in the clothing industry are
low, and capital requirements are not onerous.
Knowledge requirements vary and tradability of
goods at each level of production is high. More-
over, clothing and textiles have been the source of
rapid, export-led industrialization in several coun-
tries (Gereffi and Memedovic 2003). The textile
and clothing value chain is particularly suited to
global production networks since most products
can be exported at each stage of the chain, making
the sector highly trade-intensive and sensitive
to a country’s trade regime. Thus, clothing and
textile industries become a good starting point for
countries with an abundance of low-wage labor
to export their way to development. Textiles’ role
as a forerunner for industrialization goes back to
18th-century Britain, where the mechanization
of cotton processing provided the impetus for the
Industrial Revolution.
Cotton Textile Production— One-Time Wonder Industry
The Industrial Revolution was a period of
accelerated structural change in world economies,
involving a rapid, technology-driven increase
in industrial output and factory-based activity.
303.7 million pounds (Baines 1965).
The early success of the cotton industry and
its contribution to the Industrial Revolution were
highlighted in a British print publication appear-
ing on Sept. 5, 1739 (Baines 1965, pp. 108–09):
“The manufacture of cotton, mixed and
plain, is arrived to so great perfection within these
twenty years, that we not only make enough for
our own consumption, but supply our colonies,
and many other nations of Europe. The benefits
arising from this branch are such as to enable the
manufacturers of Manchester alone to lay out
thirty thousand pounds a year for many years
past on additional buildings. ’Tis computed that
two thousand new houses have been built in that
industrious town, within these twenty years.”
The cotton industry created forward and
backward linkages to other industries that col-
lectively contributed to the Industrial Revolution’s
progress. The advances in cotton textile manu-
facturing required coal for fuel and iron for new
machinery; the increase in coal and iron mining
dictated improvements in transportation; and the
transportation enhancements, in turn, hastened
development of railroads and steamships. By the
end of the 18th century, the various specializa-
tions had coalesced, with the achievements of
one contributing to the success of the other, and
gradually the world’s first Industrial Revolution
took root.
From its roots in Britain, this transformation spread
to the European continent, North America, Japan
and, ultimately, the rest of the world. The textile
industry played an important role in development
of key industrial innovations that transformed
cotton manufacturing. In 1733, John Kay invented
the flying shuttle, a machine used to weave cloth.
This was accompanied by the improvement of yarn
production using James Hargreaves’ 1764 invention
of the spinning jenny, allowing more than one
ball of yarn or thread to be spun. The jenny relied
on manpower, and it wasn’t long before Richard
Arkwright’s creation of the water frame in 1769 in-
troduced water as an alternate energy resource. The
steam engine, which provided yet another source
of power, enabled rapid development of factories
in places where water power was unavailable. This
greatly increased the output, quality and efficiency
of textile production. Mills sprang up throughout
Britain, and the factory system—the first successful
network of mass production—was created.
Rising textile production brought with it
increased demand for raw cotton, which came
from Britain’s colonies in India, Africa and the
southern U.S. Raw cotton consumption jumped to
267,000 metric tons in 1850 from just over 1,000
tons in 1750. Consumption peaked at 988,000
tons in 1913. Related data indicate that in 1764,
the import of cotton wool (raw cotton) into Britain
totaled 3.9 million pounds; by 1833, it had risen to
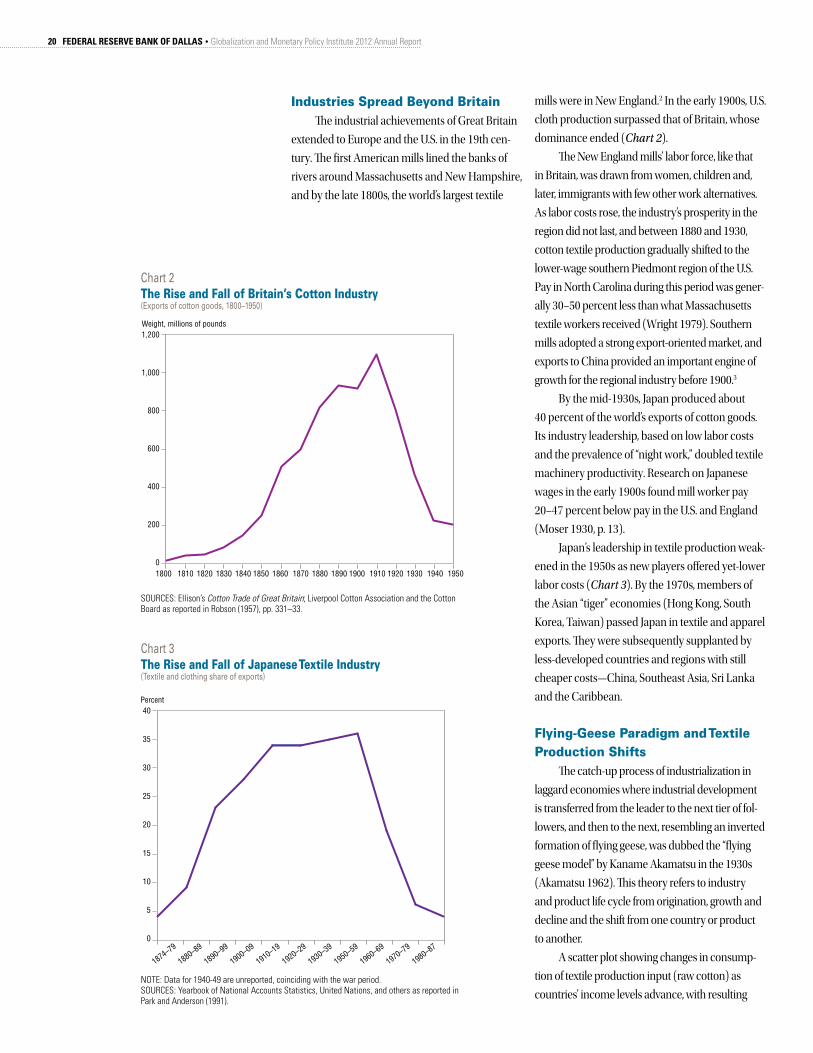
20 FEDERAL RESERVE BANK OF DALLAS • Globalization and Monetary Policy Institute 2012 Annual Report
mills were in New England.2 In the early 1900s, U.S.
cloth production surpassed that of Britain, whose
dominance ended (Chart 2).
The New England mills’ labor force, like that
in Britain, was drawn from women, children and,
later, immigrants with few other work alternatives.
As labor costs rose, the industry’s prosperity in the
region did not last, and between 1880 and 1930,
cotton textile production gradually shifted to the
lower-wage southern Piedmont region of the U.S.
Pay in North Carolina during this period was gener-
ally 30–50 percent less than what Massachusetts
textile workers received (Wright 1979). Southern
mills adopted a strong export-oriented market, and
exports to China provided an important engine of
growth for the regional industry before 1900.3
By the mid-1930s, Japan produced about
40 percent of the world’s exports of cotton goods.
Its industry leadership, based on low labor costs
and the prevalence of “night work,” doubled textile
machinery productivity. Research on Japanese
wages in the early 1900s found mill worker pay
20–47 percent below pay in the U.S. and England
(Moser 1930, p. 13).
Japan’s leadership in textile production weak-
ened in the 1950s as new players offered yet-lower
labor costs (Chart 3). By the 1970s, members of
the Asian “tiger” economies (Hong Kong, South
Korea, Taiwan) passed Japan in textile and apparel
exports. They were subsequently supplanted by
less-developed countries and regions with still
cheaper costs—China, Southeast Asia, Sri Lanka
and the Caribbean.
Flying-Geese Paradigm and Textile Production Shifts
The catch-up process of industrialization in
laggard economies where industrial development
is transferred from the leader to the next tier of fol-
lowers, and then to the next, resembling an inverted
formation of flying geese, was dubbed the “flying
geese model” by Kaname Akamatsu in the 1930s
(Akamatsu 1962). This theory refers to industry
and product life cycle from origination, growth and
decline and the shift from one country or product
to another.
A scatter plot showing changes in consump-
tion of textile production input (raw cotton) as
countries’ income levels advance, with resulting
Chart 2 The Rise and Fall of Britain’s Cotton Industry(Exports of cotton goods, 1800–1950)
Weight, millions of pounds
0
200
400
600
800
1,000
1,200
1950194019301920191019001890188018701860185018401830182018101800
SOURCES: Ellison’s Cotton Trade of Great Britain; Liverpool Cotton Association and the Cotton Board as reported in Robson (1957), pp. 331–33.
Chart 3 The Rise and Fall of Japanese Textile Industry(Textile and clothing share of exports)
Percent
0
5
10
15
20
25
30
35
40
1980–87
1970–79
1960–69
1950–59
1930–39
1920–29
1910–19
1900–09
1890–99
1880–89
1874–79
NOTE: Data for 1940-49 are unreported, coinciding with the war period. SOURCES: Yearbook of National Accounts Statistics, United Nations, and others as reported in Park and Anderson (1991).
Industries Spread Beyond BritainThe industrial achievements of Great Britain
extended to Europe and the U.S. in the 19th cen-
tury. The first American mills lined the banks of
rivers around Massachusetts and New Hampshire,
and by the late 1800s, the world’s largest textile

Globalization and Monetary Policy Institute 2012 Annual Report • FEDERAL RESERVE BANK OF DALLAS 21
Chart 4 Flying Geese Paradigm Illustrates Production Relocation
SOURCES: International Historical Statistics: Europe, 1750–2000, by B.R. Mitchell, Palgrave Macmillan, 2003; International Historical Statistics: Africa, Asia and Oceania, 1750-1988, by B.R. Mitchell, Palgrave Macmillan, 1995; Historical Statistics of the World Economy: 1–2008 AD, by Angus Maddison.
industry shifts, is indicative of the flying-geese
paradigm (Chart 4). The model helps explain the
growth, decline and shift of textile and apparel
industries from developed to developing countries.
When nations produce for export, consumption
of raw materials increases, and over time export
earnings translate into higher incomes and greater
capital accumulation. Production inputs such as
labor become more skilled and more expensive
relative to other nations with cheaper inputs, thus,
Cotton consumption, thousands of metric tons
Japan 1830–1998
0
100
200
300
400
500
600
700
800
900
0 4,000 8,000 12,000 16,000 20,000 24,000Real GDP per capita (in 1990 prices)
Cotton consumption, thousands of metric tons
China 1950–1998
Real GDP per capita (in 1990 prices)400 900 1,400 1,900 2,400 2,900 3,400
0
1,000
2,000
3,000
4,000
5,000
6,000
Cotton consumption, thousands of metric tons
South Korea 1950–1998
0
50
100
150
200
250
300
350
400
450
500
Real GDP per capita (in 1990 prices)500 2,500 4,500 6,500 8,500 10,500 12,500 14,500
Cotton consumption, thousands of metric tons
Taiwan 1950–1998
800 2,800 4,800 6,800 8,800 10,800 12,800 14,800 16,8000
50
100
150
200
250
300
350
400
450
500
Real GDP per capita (in 1990 prices)
Cotton consumption, thousands of metric tons
0 5,000 10,000 15,000 20,0000
200
400
600
800
1,000
1,200U.K. 1830–1992
Real GDP per capita (in 1990 prices)
Cotton consumption, thousands of metric tons
0 5,000 10,000 15,000 20,000 25,0000
500
1,000
1,500
2,000
2,500
3,000U.S. 1860–1993
Real GDP per capita (in 1990 prices)

22 FEDERAL RESERVE BANK OF DALLAS • Globalization and Monetary Policy Institute 2012 Annual Report
leading to a loss of comparative advantage in textile
production. These countries then move to the next
tier of manufactured goods requiring more capital
and skilled labor (up the industrial ladder), and
consumption of textile production inputs drops.
Another country embarks on textile production
until it loses comparative advantage to others that
produce cheaply.
U.S. Textile and Apparel Sourcing Patterns
The production shift from developing to
developed countries is evident in U.S. textile and
apparel sourcing patterns. Hong Kong, Taiwan
and Korea make the top 10 list of suppliers in the
1990 to 2000 period, but drop out after 2000, with
China, Vietnam and India taking the lead since
2008 (Chart 5). In the U.S., falling employment in
these industries also illustrates movement of pro-
duction offshore. Textile mill employment peaked
at about 1.4 million in 1941, while apparel industry
employment topped out in 1973 at 1.5 million
workers. Today, these sectors each employ fewer
than 250,000 people, with their shares of total
manufacturing similarly declining. In 1939, textile
and apparel employment represented about 10
percent of total U.S. manufacturing. Today, their
share has dropped to around 2 percent (Chart 6).
Surviving industries in the U.S. include the
manufacture of articles for armed forces per-
sonnel and certain high-end items. To remain
competitive, enterprises must be extremely
labor-efficient. The use of advanced machinery—
computers and computer-controlled equipment
in designing, patternmaking and cutting—helps
boost productivity. The industry also benefits from
procurement regulations mandating that U.S. mili-
tary clothing be produced in the United States—a
requirement subsequently extended to cover the
Transportation Security Administration (Bureau
of Labor Statistics 2011).
Behind Global ShiftsThe U.S., as one of the largest importers of
textiles and apparel, significantly influences world
markets. U.S. sourcing patterns have changed
over time (see Chart 5), owing to such traditional
considerations as labor, transport and procure-
ment costs, and trade policies. There also are new
factors—speedy product delivery and flexibility to
adapt to changing market demand.
Labor costs have driven relocations of textile
and apparel production—from Britain to the U.S., to
Japan, to the Asian Tigers and, finally, to China and
other developing nations. Government and trade
policies also help determine industry location. As
the newly manufactured T-shirts in Rivoli’s narra-
tive return to the U.S. via the Pacific, the economist
notes that they enter the most complex and most
challenging part of their existence: accessing U.S.
markets. Trade decisions in the U.S. significantly
influence world markets; conversely, international
trade policies impact U.S. sourcing decisions.
As globalization of textiles and apparel has
accelerated, countries have sought to protect
their domestic industries. Textiles and apparel
are among the most heavily protected sectors in
industrialized countries, with the average tariff as
Chart 5 U.S. Textile and Apparel Sourcing Shifts Over TimePercent
0
10
20
30
40
50
60
70
80
90
100
Rest of the World
Honduras
Italy
El Salvador
Canada
Thailand
Cambodia
Pakistan
Bangladesh
Phillippines
Taiwan
South Korea
Hong Kong
China
Mexico
’11’10’09’08’07’06’05’04’03’02’01’00’99’98’97’96’95’94’93’92’91’90 ’12
Indonesia
Vietnam
India
NOTE: The yellow area represents other countries from which the U.S. imports textiles and apparel. This group,which accounts for 30 percent or less of U.S. textile and apparel imports, consists of over 180 countries, each accounting for a small portion of U.S. imports.
SOURCE: U.S. Department of Commerce’s Office of Textiles and Apparel.
Globalization and Monetary Policy Institute 2012 Annual Report • FEDERAL RESERVE BANK OF DALLAS 23
high as 32 percent on clothing, according to the
United Nations (UNDP 2005).
One of the most influential government
policies was the Multi-Fiber Agreement (MFA),
established in 1974 to help manage market
disruptions in developed countries while allow-
ing growth of textile and apparel exports from
developing countries. The agreement consisted
of bilateral arrangements establishing quotas for
certain product lines. In 1995, the Agreement on
Textiles and Clothing (ATC), a 10-year transitional
program for quota removal under the World Trade
Organization (WTO), replaced the MFA. The ATC
regulated quotas until it expired on Dec. 31, 2004.
Under the quota system, a firm’s purchases
from one country were limited, forcing companies
to buy where quota slack existed, not necessar-
ily where goods were most efficiently produced.
This system shielded many developing countries
from large-supplier competitors, such as China.
After the ATC expired, competition became fierce
and some countries benefited by freely trading
their goods, particularly those nations that could
produce additional product at low cost and gain
market share.
Trade agreements provide an advantage to
suppliers operating in duty-free environments. The
North American Free Trade Agreement (NAFTA),
signed in 1994, is one such arrangement affect-
ing the U.S. textile and apparel industries. NAFTA
eliminated quotas and tariffs on goods produced
in member countries: Mexico, Canada and the
Chart 6 U.S. Textile and Apparel Employment Declines Along with Employment Share
Percent
’11’02’93’84’75’66’57’48’39
Apparel production
Textile production
0
2
4
6
8
10
12
14Share of total manufacturing employment
Workers, in thousands
0
200
400
600
800
1,000
1,200
1,400
1,600
’11’02’93’84’75’66’57’48’39
Apparel production
Textile production
Total employment
SOURCES: Bureau of Labor Statistics’ Current Employment Statistics Survey reported in Employment, Hours and Earnings, United States, 1909–1990, Volume II, Bulletin 2370 and 1991–1993, Bulletin 2429; Haver Analytics; author’s calculations.
U.S. The Caribbean Basin Preferential Trade Act,
enacted in 2000, is a production-sharing arrange-
ment linking U.S. market access to the Caribbean
Basin with duty- and quota-free products if they
are made of U.S. yarns and textiles. The Dominican
Republic–Central America Free Trade Agreement
offers favorable trade policies and expansion of
regional trade involving Costa Rica, El Salvador,
Guatemala, Honduras, Nicaragua, the Dominican
Republic and the U.S. The African Growth and
Opportunity Act is a U.S. agreement with African
countries for tariff-free trade if production inputs
are sourced from the U.S. or African countries
covered under the agreement.
Such trade arrangements have impacted U.S.
sourcing decisions. For example, China’s integra-
24 FEDERAL RESERVE BANK OF DALLAS • Globalization and Monetary Policy Institute 2012 Annual Report
tion into the world trading system through its ac-
cession to the WTO at the end of 2001 diminished
Mexico’s textile and apparel industry, which greatly
expanded following NAFTA’s enactment (Chart 7).
Retailers’ Preferences Dictate Sourcing
Often, discussion of apparel and textile in-
dustries shifts focus to national trade flows. These
movements reflect decisions of private parties and
supply chains (retailers and producers of textiles
and apparel) operating within the constraints of
national and international policies. More recently,
retailers’ preferences increasingly dictate national
sourcing patterns.
With new technologies enabling retailers
and suppliers to efficiently track products and
consumer demand, suppliers confront demands
to quickly replenish products and adopt efficient
inventory management while maintaining low
costs. Bar coding and point-of-sale scanning
provide real-time information on product sales;
electronic data interchange tells retailers what in-
ventory to replenish; and automated distribution
centers handle small orders, replacing traditional
warehouse systems used for large bulk ship-
ments (Abernathy et al. 1999). This deployment of
technology to capture information on consumer
demand, reduce inventory surplus, and improve
operations efficiency and profitability is known as
lean retailing.
Lean retailing allows department stores, mass
merchandisers and other retailers to minimize
exposure to demand uncertainty while restrain-
ing inventory costs. Widespread adoption of these
strategies means that suppliers must invest in basic
technologies providing information links necessary
for rapid replenishment to retailers. Additionally,
apparel suppliers must devote resources for capital
improvements to package, label, route and quickly
move products from their production centers
directly to retailers. The lean strategy requires fre-
quent shipments sent from suppliers on the basis of
continuous replenishment orders.
For example, an order may be placed with
a manufacturer on a Sunday, after a week’s retail
sales have been tallied. Typically, it might specify a
number of men’s jeans of a given style, color, fabric
weight and finishing treatment and size. The man-
ufacturer’s computer receives the order stipulating
the jeans be placed in particular cartons for each
of the retailer’s stores. The cartons bear bar codes
identifying the specific location where each will
go. The product must be ready for placement on
sales displays with the appropriate price marked.4
The jeans most likely won’t be touched from
the time they leave the manufacturer until they go
on sale Thursday morning. The processes and as-
sociated documentation must be fully understood
by the manufacturer and retailers and conform
to industrial standards (Abernathy et al. 1999).
These are significant new costs for suppliers, in
essence shifting the risk of added variability and
quickly changing fashion trends from the retailers
to suppliers. Manufacturers that haven’t adopted
the new technology may end up holding retailer
inventory—a particularly common occurrence
with high-fashion and seasonal items.
Replenishment considerations and the
need for speed to market arising from the new
economics of distribution and production explain
an important portion of sourcing shifts during the
past decade. As lean retailing becomes even more
widespread and suppliers more adept at manag-
ing risk, sourcing decisions increasingly include
replenishment considerations. This heightens
Chart 7 U.S. Imports of Textiles and Apparel Shift(Impact of trade policies on manufacturing)
China’s share of total imports (percent)
Mexico joinsNAFTA
China joinswith WTO
0
2
4
6
8
10
12
14
16
Mexico
China
Mexico’s share of total imports (percent)
0
5
10
15
20
25
30
35
40
45
50
’11’08’05’02’99’96’93’90
SOURCE: U.S. Department of Commerce’s Office of Textiles and Apparel.
Globalization and Monetary Policy Institute 2012 Annual Report • FEDERAL RESERVE BANK OF DALLAS 25
competitiveness among countries able to help
manage retailer inventories.
“In the new quota-free environment, we
will have no choice but to be very discriminating
about our suppliers, selecting only those who can
provide real value to our customer,” said Janet Fox,
then-senior vice president and director of sourcing
for J.C. Penney, during congressional testimony in
2004. “Value does not mean the product with the
cheapest price. It means a supplier that is able to
provide a quality product and service, including
speed to market and supply chain efficiency and
reliability.”
The Next Destination As production and labor costs inch higher in
China, the primary textile and apparel supplier to
the U.S., global winds may shift, possibly sending
the industry to yet other destinations, including
ones in Africa.5 Indeed, Rivoli’s T-shirt tale ends
up in Africa, as do many articles of clothing and
textiles. Salvation Army and Goodwill stores in the
U.S. take in donations of old clothes. The charities’
stores once sold or gave away much of this inven-
tory, but the domestic supply has grown so large
that only a fraction of the clothing stays in the U.S.
America’s castoffs have therefore found customers
elsewhere in the world.
The U.S. exported nearly 5.5 billion tons of
used clothing and textiles between 2000 and 2010,
becoming the largest used-clothing seller over
the period. Rivoli’s T-shirt arrives in Tanzania,
a big beneficiary; used clothing was Tanzania’s
no. 1 import from the U.S. in 2010 and its no. 2
U.S. import in 2011. Critics charge that an influx
of used clothing has kept Africa from ascending
the traditional development ladder via textile
and apparel manufacture (Frazer 2005). Other
studies show that producing for export rather than
for domestic consumption is the more effective
development path (Ekanayake 1999) and that im-
ports of used clothing present no threat to African
exports (Rivoli 2009). Nonetheless, Africa’s share
of world textile and apparel exports has stagnated
at around 2 percent from 1995 to 2011, even as
other developing countries’ share increased to
58 percent in 2011, from 52 percent in 1995. De-
veloped economies’ share declined to 38 percent
from 44 percent over the same period.
Textiles and apparel were responsible for 61
percent of Lesotho’s total exports in 2011, up from
53 percent in 1995 (Chart 8). These sectors ac-
counted for 20 percent or more of total exports for
four countries—Lesotho, Mauritius, Madagascar
and Tunisia—in 2011, down from five nations in
1995. The sector’s performance across the conti-
nent has been mixed, with export shares for previ-
Chart 8 Africa’s Export Share of Textiles and Apparel Shows Mixed Picture of Sector Dominance
1995 shares
Percent of total exports0 10 20 30 40 50 60 70
Kenya
Egypt
Swaziland
Morocco
Tunisia
Madagascar
Mauritius
Lesotho
2011 shares
61
38
6
8
10
13
19
23
27
9
Gambia
Cape Verde
53
58
17
45
28
13
3
3
23
3
NOTE: Countries are ranked according to their 2011 textile and apparel export shares. The reported figures are all rounded.SOURCE: United Nations Conference on Trade and Development.
ous major exporters, such as Egypt and Morocco,
dropping in 2011 from 1995 levels.
The continent offers some of the basic ingredi-
ents needed for establishment of these industries—
cheap and abundant labor, availability of raw mate-
rials (cotton) and favorable trade agreements, such
as the African Growth and Opportunity Act and
the Everything but Arms initiative offering access

26 FEDERAL RESERVE BANK OF DALLAS • Globalization and Monetary Policy Institute 2012 Annual Report
to U.S. and European markets. The sector’s growth
in Africa has been hindered by the same factors
limiting the expansion of all manufacturing—lack
of infrastructure, corruption, unstable political
environments, inaccessibility to capital and lack of
regional and foreign market knowledge. Poor roads,
railways and ports create delays, adding to the cost
of importing raw materials and exporting finished
goods. African countries have been disadvantaged
dealing with retailers seeking fast order-to-delivery
cycles. Insufficient transportation networks also
impede intraregional trade and economies of scale
achievable through larger regional production and
market centers. Furthermore, the effects of the MFA
expiration in 2005 exposed smaller, previously
quota-protected economies to fierce competi-
tion from large suppliers in Asia. Greater regional
integration could bolster competitiveness through
improved access to materials, product specializa-
tion, production sharing and speed to market.
Competitive ChallengesTextiles and apparel were the starting point
of world industrialization. Both industries are
viewed as starter endeavors for development
efforts. Because apparel and textiles are labor-
intensive, their manufacture has migrated from
high-income countries to developing economies
with relatively lower pay.
The increasing importance of logistic con-
nections between manufacturing and distribu-
tion of textiles and apparel means that supply
chains must exhibit a blend of considerations
reflecting factor prices, transportation costs and
adjustment to the risks of sourcing products in
various locations. The impact of replenishment
and risk-shifting within supply channels alters the
traditional role apparel and textiles can play in
developing countries. The two sectors remain at-
tractive industries in terms of economic develop-
ment, but assuring their success has become more
complex (Abernathy, Volpe and Weil 2006). It will
be difficult for nations with inadequate infrastruc-
ture, located far from major consumer markets or
plagued by political instability to gain competitive
advantage for textile and apparel production even
if they have low wage rates.
Notes1 The bulk of these donations not sold in stores is sold to textile recyclers, who resell a portion of their purchase to used-clothes merchants around the world. 2 The Amoskeag Manufacturing Co. in Manchester, N.H., was the largest cotton textile plant in the 19th century.3 In the late 1800s, China purchased more than half of U.S. cloth exports, and more than half of U.S. exports to China were cotton textiles. In essence, the Chinese market built Piedmont textile mills. A century later, floods of cheap cotton clothing from China are an almost symmetric reversal of previous trade flows (Rivoli 2009). 4 Under traditional retailing, retailers prepared items received from manufacturers for display in the stores. They unpacked the items, affixed price tags and put them on hangers. However, lean retailing entails using standards to ensure that products are “floor-ready” on delivery—that is, on hangers and tagged and priced when they arrive in stores. 5 China’s hourly manufacturing costs increased 138 percent from 2002 to 2008, according to estimates by the Bureau of Labor Statistics.
ReferencesAbernathy, Frederick H., John T. Dunlop, Janice H. Hammond and David Weil (1999), A Stitch in Time (Oxford: Oxford University Press).
“In the new quota-free environment, we will have
no choice but to be very discriminating about our
suppliers, selecting only those who can provide
real value to our customer. Value does not mean
the product with the cheapest price. It means a
supplier that is able to provide a quality product
and service, including speed to market and
supply chain efficiency and reliability.” —Janet Fox, then-senior vice president and director of sourcing for J.C. Penney, testimony before the Subcommittee on Trade, U.S. House Ways and Means Committee, Sept. 22, 2004.
Globalization and Monetary Policy Institute 2012 Annual Report • FEDERAL RESERVE BANK OF DALLAS 27
Abernathy, Frederick H., Anthony Volpe and David Weil (2006), “The Future of the Apparel and Textile Industries: Prospects and Choices for Public and Private Actors,” Environment and Planning 38 (12): 2207–32.
Akamatsu, Kaname (1962), “A Historical Pattern of Economic Growth in Developing Countries,” The Developing Economies, preliminary issue, no.1, 3–25.
Baines, Edward (1965), History of the Cotton Manu-facture in Great Britain: With a Notice of Its Early History in the East, and in All the Quarters of the Globe (London: H. Fisher, R. Fisher and P. Jackson, orig. pub. 1835).
Bureau of Labor Statistics (2011), “Textile, Textile Product and Apparel Manufacturing,” Career Guide to Industries, 2010–11 Edition.
Ekanayake, E.M. (1999), “Exports and Economic Growth in Asian Developing Countries: Cointegration and Error-Correction Models,” Journal of Economic Development 24 (2): 43–56.
Frazer, Garth (2005), “Used-Clothing Donations and Apparel Production in Africa,” University of Toronto (Paper presented at the American Economic Associa-tion 2005 Annual Meeting, Philadelphia, Jan. 7–9).
Gereffi, Gary (2003), “The International Competi-tiveness of Asian Economies in the Global Apparel Commodity Chain,” International Journal of Business and Society 4 (2): 71–110.
Gereffi, Gary, and Olga Memedovic (2003), “The Global Apparel Value Chain: What Prospects for Up-grading for Developing Countries?,” (Vienna: United Nations Industrial Development Organization, May).
Mittelhauser, Mark (1997), “Employment Trends in Textiles and Apparel, 1973–2005,” Monthly Labor Review, 120 (8): 24–35.
Moser, Charles K. (1930), The Cotton Textile Industry of Far Eastern Countries (Boston: Pepperell Manufac-turing Co.).
Park, Young-Il, and Kym Anderson (1991), “The Rise and Demise of Textiles and Clothing in Economic De-velopment: The Case of Japan,” Economic Develop-ment and Cultural Change, 39 (3): 531–48.
Rivoli, Pietra (2009), The Travels of a T-Shirt in the Global Economy: An Economist Examines the Mar-kets, Power and Politics of World Trade (Hoboken, N.J.: John Wiley & Sons).
Robson, R. (1957), The Cotton Industry in Britain (London: Macmillan).
United Nations Development Programme (UNDP) 2005, “Flying Colours, Broken Threads: One Year of Evidence from Asia After the Phase-Out of Textiles and Clothing Quotas,” Tracking Report, Asia-Pacific Trade and Investment Initiative (Colombo, Sri Lanka: UNDP Regional Center, December).
Wright, Gavin (1979), “Cheap Labor and Southern Textiles Before 1880,” Journal of Economic History 39 (3): 655–80.