high throughput gene expression profiling of yeast
TRANSCRIPT

High throughput gene expression profiling of yeast colonies with microgel-culture Drop-seq
Journal: Lab on a Chip
Manuscript ID LC-ART-01-2019-000084.R1
Article Type: Paper
Date Submitted by the Author: 28-Mar-2019
Complete List of Authors: Liu, Leqian; University of California San Francisco, Department of Bioengineering and Therapeutic SciencesDalal, Chiraj; University of California San FranciscoHeineike, Benjamin ; University of California San FranciscoAbate, Adam R.; University of California San Francisco
Lab on a Chip

1
High throughput gene expression profiling of yeast colonies with microgel-culture Drop-seq
Leqian Liu1, Chiraj Dalal2, Ben Heineike3, Adam Abate145*
1 Bioengineering and Therapeutic Sciences, University of California, San Francisco, San Francisco, CA 94158, USA2 Department of Microbiology and Immunology, University of California, San Francisco, CA 94158, USA
3 Biological and Medical Informatics PhD Program, University of California, San Francisco, CA 94158, USA
4 California Institute for Quantitative Biosciences, University of California San Francisco, San Francisco, CA 94158, USA 5 Chan Zuckerberg Biohub, San Francisco, CA 94158, USA.
*Correspondence and requests for materials should be addressed to A.R.A. (email: [email protected])
Page 1 of 22 Lab on a Chip

2
Abstract
Yeast can be engineered into “living foundries” for non-natural chemical production by reprogramming them via a “design-build-test” cycle. While methods for “design” and “build” are relatively scalable and efficient, “test” remains a bottleneck, limiting the effectiveness of the procedure. Here we describe Isogenic Colony Sequencing (ICO-seq), a massively-parallel strategy to assess the gene expression, and thus engineered pathway efficacy, of large numbers of genetically distinct yeast colonies. We use the approach to characterize opaque-white switching in 658 C. albicans colonies. By profiling the transcriptomes of 1642 engineered S. cerevisiae strains, we assess gene expression heterogeneity in a protein mutagenesis library. Our approach will accelerate synthetic biology by allowing facile and cost-effective transcriptional profiling of large numbers of genetically distinct yeast strains.
Page 2 of 22Lab on a Chip

3
Introduction
The baker’s yeast Saccharomyces cerevisiae is easy to culture, non-infectious to humans, and has powerful tools for modifying its genome (1-3). For these and other reasons, S. cerevisiae has been engineered into “living foundries” that synthesize high-value chemicals from renewable feedstocks (4,5). To maximize production, the cells must be genetically engineered to convert feedstock into product. Optimally engineering a cell’s genome is a challenging process that often relies on a “design-build-test” cycle, in which variants are constructed and tested for the desired activity (6,7). The effectiveness of this process depends on the number of strains that can be built and tested. While advances in computation, DNA synthesis, and genome editing enable facile construction of large libraries (>106), testing these strains remains a costly bottleneck as it requires each to be individually isolated, cultured, and assayed for activity (6).
Droplet microfluidics has markedly increased the throughput of strain testing. Like flow cytometry, droplet microfluidics analyzes individual cells at kilohertz rates; however, a unique advantage of droplets is that they allow cells to be characterized based on phenotypes not detectable with flow cytometry, like extracellular analyte consumption, product secretion, and interactions with other cells (6,8-10). Nevertheless, a limitation of the approach is that it usually requires a fluorogenic assay, which is not possible for many phenotypes and can be challenging to optimize for the requisite water-in-oil emulsions (11,12). Moreover, these assays are usually specific to a given target, making it difficult to extend the approach across targets.
Gene expression profiling by mRNA sequencing is a standard approach for characterizing cell phenotypes and has been used for applications like characterizing the cell cycle, transcriptional rewiring, pathway efficiency assessment, and metabolic flux analysis (13-16). Moreover, new droplet microfluidic based single cell RNA-seq (scRNA-seq) has demonstrated gene expression profiling of tens of thousands of single cells per experiment (17-19). However, these approaches have been optimized for mammalian cells, which are larger and contain more RNA than the yeast cells commonly used as living foundries. Consequently, droplet microfluidic scRNA-seq is ineffective when applied to fungal and other microbial cells. While a recent study has demonstrated single yeast cell sequencing with the Fluidigm C1 platform (20), the throughput is limited and not adequate for testing strains from libraries. Additionally, scRNA-seq is subject to significant biological and technical noise due to the dynamic nature of gene expression and the tiny amount of RNA available for sequencing. To enable effective, general, and scalable strain testing, a new approach for characterizing gene expression of engineered strains is needed that has the generality of single cell RNA sequencing and is applicable to fungal cells.
In this paper, we present Isogenic Colony Sequencing (ICO-seq), a general approach for profiling the gene expression of cultivable cells at high throughput. The key innovation of ICO-seq is the coupling of hydrogel droplet culture of single cells with barcoded RNA sequencing (Drop-seq). Hydrogel culturing amplifies single cells into an isogenic colony of tens to hundreds of cells; this provides ample RNA for deep sequencing of the colony and reduces error due to noisy single cell gene expression profiles. The resultant profiles correspond to individual strains and can be used to screen for the desired phenotype. To demonstrate and validate ICO-seq, we use it to study white-opaque switching in Candida albicans and to assess expression heterogeneity of a Saccharomyces cerevisiae ARO4 regulatory domain mutagenesis library. We anticipate our approach will aid in the generation of optimized strains by allowing rich gene expression information to be collected from tens of thousands of genetically distinct fungal strains. This platform can be readily implemented into the “design-build-test” cycle of synthetic biology.
Results
ICO-seq Workflow
Page 3 of 22 Lab on a Chip
4
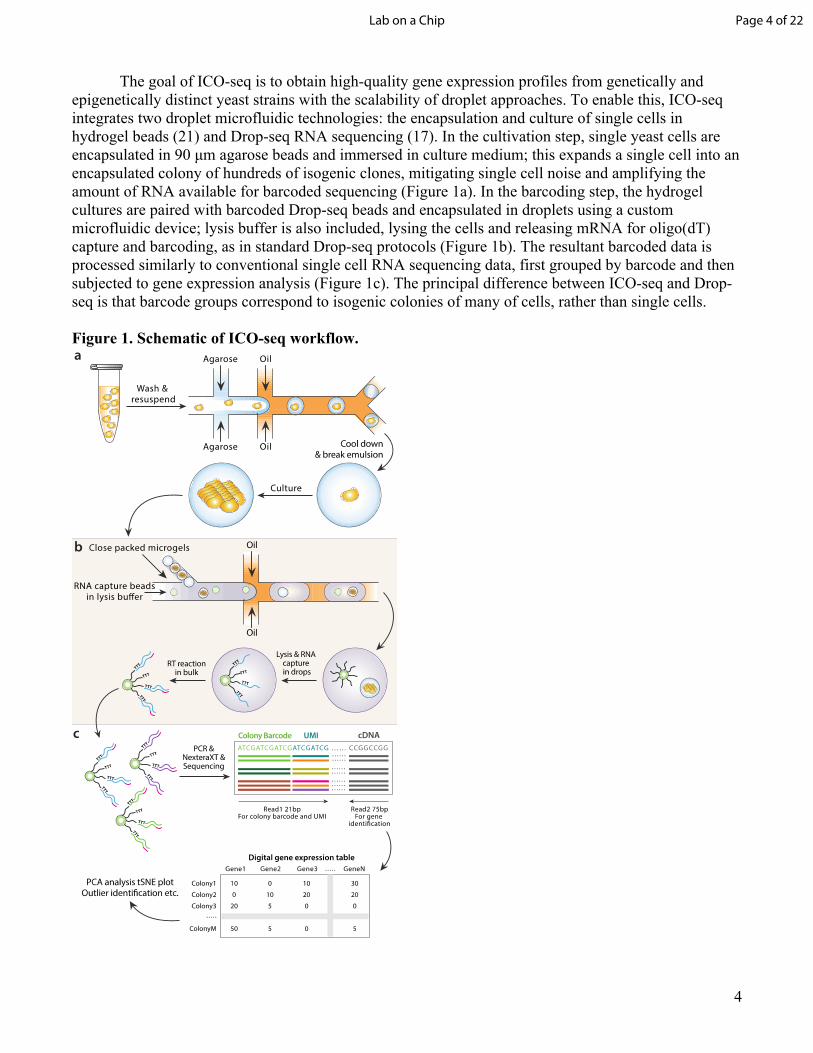
The goal of ICO-seq is to obtain high-quality gene expression profiles from genetically and epigenetically distinct yeast strains with the scalability of droplet approaches. To enable this, ICO-seq integrates two droplet microfluidic technologies: the encapsulation and culture of single cells in hydrogel beads (21) and Drop-seq RNA sequencing (17). In the cultivation step, single yeast cells are encapsulated in 90 μm agarose beads and immersed in culture medium; this expands a single cell into an encapsulated colony of hundreds of isogenic clones, mitigating single cell noise and amplifying the amount of RNA available for barcoded sequencing (Figure 1a). In the barcoding step, the hydrogel cultures are paired with barcoded Drop-seq beads and encapsulated in droplets using a custom microfluidic device; lysis buffer is also included, lysing the cells and releasing mRNA for oligo(dT) capture and barcoding, as in standard Drop-seq protocols (Figure 1b). The resultant barcoded data is processed similarly to conventional single cell RNA sequencing data, first grouped by barcode and then subjected to gene expression analysis (Figure 1c). The principal difference between ICO-seq and Drop-seq is that barcode groups correspond to isogenic colonies of many of cells, rather than single cells.
Figure 1. Schematic of ICO-seq workflow.
Page 4 of 22Lab on a Chip

5
(a) Colony-containing agarose microgels are generated by encapsulating single yeast cells into agarose microdroplets followed by microgel recovery and colony formation within the microgel. (b) mRNA is converted to cDNA from single colonies by co-encapsulation of microgels and barcoded RNA capture beads followed by in-droplet hybridization and a bulk reverse transcription reaction after droplets are demulsified. (c) Sequencing libraries are prepared from cDNA containing barcoded RNA capture beads following the Drop-seq protocol. Following sequencing, digital gene expression tables for individual yeast colonies are generated and analyzed.
Microfluidic design and operation in ICO-seqICO-seq utilizes microfluidic technologies for encapsulating single cells in microgels and pairing
the resultant isogenic cultures with barcoded beads for sequencing. The hydrogel matrix must be carefully selected to allow microfluidic synthesis of the microgels, single cell culture, and Drop-seq. Agarose is a suitable hydrogel material for many biological applications and is compatible with microfluidic microgel fabrication and Drop-seq (21-23). A key property of agarose is that it melts at moderate temperatures (~90°C), allowing it to flow through microfluidic channels and be formed into liquid droplets. Upon cooling, the droplets solidify into elastic microgels. If cells are included in the droplets, they are embedded in the resultant microgels (21,23). To utilize agarose in this way, we thus require a microfluidic device that can emulsify the molten solution into monodispersed droplets. Because the elevated temperature (~50 °C) required to keep molten agarose from gelling may harm cells, the melt and cell suspensions are introduced via separate inlets using a “co-flow” geometry (Figure 2a, yellow box). Due to low Reynolds number laminar flow, these miscible solutions merge but do not mix until encapsulated in droplets in the flow-focus junction. In addition, the droplets cool down rapidly due to their large surface area to volume ratio.
For ICO-seq to be useful, it must be scalable to tens of thousands of cells, which necessitates rapid encapsulation of cells in the microgel spheres. However, molten agarose is viscous, slowing droplet generation. To increase droplet production rate, we thus employ sequential droplet splitting (24). A large droplet (3200 pL) is formed at high flow rates and subsequently bisected into eight sister droplets (400 pL) (Figure 2a, green and red boxes). The net throughput of this device (5 KHz) is ~8-fold faster than a single droplet generator creating 400 pL droplets directly. To ensure the daughter droplets contain an equivalent composition of cell and agarose solution, a mixing channel stirs the large droplets before they reach the first split (Figure 2a, blue box).
The molten agarose droplets are collected on ice to solidify, then the oil is removed via demulsification and the droplets are washed and transferred to an aqueous solution. To ensure a substantial fraction of microgels contain single yeast cells, the cell suspension is diluted such that ~22% of droplets contain one cell in accordance with a Poisson distribution (Figure 2b, top panel). This cell encapsulation rate yields ~10% of microgels containing cultured yeast colonies, because some of the encapsulated cells do not grow and form colonies. This cell encapsulation rate is dependent on the ability of individual cells to form colonies and must be experimentally determined for specific yeast strains and media conditions. The washed microgels are then transferred into culture media. The porous agarose allows the media to perfuse through the gels, allowing the cells to grow to form colonies (Figure 2b, middle and bottom panels). The colony size can be tuned by controlling the culture properties, including the media composition, and duration and temperature (21,23).
The second step in ICO-seq is to capture and barcode each microgel culture’s mRNA. This requires lysing the cultures in a droplet containing a barcoded oligo(dT) capture bead, following the Drop-seq protocol (17). It thus requires a microfluidic device that encapsulates each microgel culture with a barcoding bead (Figure 2c). Prior to injection into the device, the microgels are close-packed by centrifugation. Due to the monodispersity of the microgels and their close packing, they flow regularly into the droplet generator, allowing efficient loading (25). In our experiment, we observe a loading efficiency of around 25% and further optimization can be performed to increase this efficiency.
Page 5 of 22 Lab on a Chip

6
Barcoded RNA capture beads are suspended in lysis buffer at a concentration such that on average 10% of droplets contain a single bead, and are introduced via a parallel inlet, spacing the microgels just before droplet generation. With this loading efficiency, we co-encapsulate ~3000 yeast colonies and barcode RNA capture beads per hour. Upon encapsulation, lysis buffer diffuses into the microgels. This releases polyadenylated mRNA from the colony so that it hybridizes to the oligo(dT) barcodes on the capture beads. This process is repeated for hundreds of thousands of droplets in parallel. For each colony that is co-encapsulated with a capture bead, its mRNA is captured onto the uniquely barcoded oligo(dT) capture probes on the bead surface. The droplets are then demulsified, and the recovered beads are subjected to the remaining steps of Drop-seq, including reverse transcription (Figure 1b), PCR, and tagmentation for Illumina sequencing library preparation. The library is sequenced and the resulting gene expression data is analyzed (Figure 1c).
Figure 2. ICO-seq microfluidic device design and operation.
1mm
1mm
Droplets outlet
Oil inlet
Low melting agarose inlet
Yeasts inlet100 m
100 m
100 m
100 m
RNA capture beadswith lysis bu er
Close-packed microgels
Droplets outlet Oil inlet
1000 m
ba
c
Page 6 of 22Lab on a Chip

7
(a) Microfluidic device design for high throughput single yeast encapsulation into agarose microgels. From top to bottom, images showing droplet generator, droplet mixer, the first droplet splitter and the third droplet splitter. (b) Yeast colony formation within agarose microgels. Top: single cell encapsulated agarose microgels; middle and bottom: colony containing agarose microgels. (c) Microfluidic device design for co-encapsulation of agarose microgels and barcoded RNA capture beads. Images on the bottom showing co-encapsulation step (left panel) and droplets generated with this device (right panel). Analysis of white-opaque switching in C. albicans using ICO-seq
C. albicans is an opportunistic commensal yeast that can colonize and invade human tissue when the human immune system is compromised, or the competing microbial flora is eliminated (26). It has been hypothesized that the ability of C. albicans cells to colonize warm-blooded hosts is enhanced by its ability to switch between multiple cell types, amongst which are the white and opaque cell types (27,28). White-opaque switching results in two distinct types of cells from the same genome that vary significantly from each other in size, shape, susceptibility to host defense and mating-competence (29). Perhaps most interesting to us, white-opaque switching is heritable; in other words, when an opaque cell switches to white, the resulting progeny continue to be white (it is important to note that these white cells can switch back to opaque cells, albeit at a low frequency).
Here we use an opaque diploid C. albicans strain engineered such that YFP (yeast fluorescent protein) replaces one copy of the WH11 gene. Since the WH11 promoter is active only in white cells (30) and its expression correlates with the commitment of cells being white, YFP expression under WH11 control monitors the switch from opaque to white (29). With ICO-seq, which provides gene expression profiles of isogenic colonies, the presence of YFP mRNA can be used to define colony type. In this experiment, we encapsulated opaque C. albicans cells in agarose microgels followed by colony formation through cultivation. Due to switching from opaque-to-white cells, opaque and white C. albicans colonies (as well as some mixed cultures) existed at the end of cell culturing. These colonies were analyzed for gene expression using ICO-seq (658 colonies with at least 600 genes that exists in at least two colonies were used for analysis) (Figure 3a).
Using principle component analysis (PCA) and YFP expression as reference, we saw that colonies with highly positive YFP expression (n=50 with normalized YFP expression > 1.4, which we attribute to white cells), have a distinct gene expression profile from ones with no YFP expression (n=381 with normalized YFP expression < 0, which we attribute to opaque cells) (Figure 3b). Moreover, this PCA analysis revealed that WH11 expression correlates well with YFP expression; in other words, WH11 is also induced in colonies with positive YFP expression (Figure 3c, blue arrow). Finally, PCA analysis revealed that genes implicated in energy metabolism such as C1_08610C, STF2 and AOX2 also correlates with WH11 and YFP. Multiple reports have shown that a majority of the ~1000 gene expression differences (using a two-fold cutoff) between white and opaque cells involve genes implicated in nutrient acquisition and metabolism (31-33). PCA analysis of ICO-Seq data (1) reaffirms that WH11 is a valid reporter for white cells, (2) validates that the major gene expression differences between white and opaque cells involve metabolism and (3) identifies a handful of valuable reference genes for both white and opaque cells.
To gain more insight into the heterogeneity across opaque and white cells with a more unbiased approach, we employed t-SNE (34) using Seurat (35), a clustering algorithm that revealed 4 major clusters (Figure 3d). WH11 expression is mostly contained in colonies within cluster 0 (orange), suggesting cluster 0 corresponds to white colonies (Figure 3e). Besides WH11, genes related to glycerol metabolism and biofilm formation such as GPD2, RHR2 are also upregulated in cluster 0 (Figure 3f), in accordance with previous findings (36,37). In addition, energy metabolism genes (AOX2 and C1_08610C) found by PCA are also over-represented in cluster 0 (Figure 3f). Cluster 2 cells overexpress fermentation genes (ALD5 and 6) (Figure 3f), as is to be expected for opaque cells (38). In
Page 7 of 22 Lab on a Chip

8
addition to these two major populations (which we attribute to white and opaque cells), another cluster (cluster 3, which could either be a separate cell-type or a population of cells that includes both white and opaque cells) is marked by expression of SLR and NPL3 (Figure 3f), members from the SR (serine-arginine) family of RNA-binding proteins that may influence polarized growth (39). This t-SNE analysis uses an orthogonal clustering algorithm to identify additional reference genes that can be used to distinguish between white and opaque cells and further demonstrates the ability of ICO-seq to dissect gene expression differences between cell types.
Figure 3. White-opaque switching analysis of C. albicans using ICO-seq.
(a) Schematic workflow of C. albicans opaque-white analysis using ICO-seq. (b) Principal component analysis of gene expression profiles from single C. albicans colonies with YFP positive colonies labeled blue and YFP negative colonies labeled grey. (c) Gene expression heatmaps for PC1 and PC2 with both cells and genes are ordered according to their PCA scores (barcodes on x-axis and upregulated gene names on y-axis, yellow indicates upregulation, purple indicates downregulation, top 15 genes and 100
Page 8 of 22Lab on a Chip

9
barcodes are shown in the heatmap). Genes shown are color coded and listed on the right. (d) t-SNE analysis plot of gene expression profiles from C. albicans colonies showing four separate clusters. (e) t-SNE analysis plot with WH11 expression shown in red. (f) Heatmap shows top 35 marker genes (thresh.use set as 0.25) from each cluster. When there were more than 35 genes, only the top 35 were shown. Genes shown are color coded and listed on the right.
Heterogeneity analysis of S. cerevisiae ARO4 mutagenesis library In the previous section, we employed ICO-seq to analyze the differences between two cell-types
for which population-level gene expression differences had already been documented. Next, we used ICO-seq to identify gene expression differences across colonies in a yeast system where gene expression profiling has, to our knowledge, not been conducted.
ARO4 is a key regulator for the pathway that synthesizes aromatic amino acids in S. cerevisiae, the building blocks of many valuable molecules (40). ARO4 is inhibited by the aromatic amino acid tyrosine, one of several negative feedback loops that constrain flux through the pathway (40). Mutations in the regulatory region (residues 191-263) and elsewhere in the protein have been shown to reduce feedback inhibition by tyrosine and increase metabolic flux through the pathway (6,41). We applied ICO-seq to study the effect that mutations in the regulatory domain of ARO4 have on the transcriptome of S. cerevisiae (Figure 4a),
We analyzed expression data from 1642 colonies that expressed at least 500 unique genes that exist in at least two colonies. Similar to analysis performed with data from C. albicans experiment, we identified three major clusters through tSNE analysis using Seurat (35) (Figure 4b, c). The colonies in cluster 1 express genes related to protein biosynthesis, suggesting these colonies were actively growing when profiled. The colonies in cluster 2 express genes related to amino acid biosynthesis (GLN1, SER3, LYS12, MET14, LYS9, LEU1), suggesting they could correspond to ARO4 mutants that upregulate the amino acid biosynthesis pathway. Meanwhile, colonies in cluster 0 express genes implicated in the stationary phase of growth (SPG4, SPG1) and respiratory metabolism (OLI1, FMP43, RGI2, YDR119W-A).
To provide a more comprehensive analysis, we further limited our analysis to 1064 genes that had at least 3 mRNA counts in at least one of the 300 colonies with the lowest overall expression level. In principal component space we can identify three large clusters that are separated most clearly by a linear combination of principal components 1 and 2 ( ) (Figure 4d). Along that axis, clusters A 𝑣𝑠𝑒𝑝(magenta, N=620) and B (cyan, N=155) express relatively more genes related to cytoplasmic translation (RPL33B, RPS25B, TIF11, RPS18B, etc), and cluster C (grey, N=867) expresses relatively more genes related to growth in stationary phase (SPG1 and SPG4), as well as genes associated with respiratory metabolism (MPC3, OLI1, RGI1, COX26, RGI2) and stress (MRK1, GPX1) (Supplementary Tables 1-3). This suggests that the colonies in clusters A and B were actively growing when profiled. This is further supported by the fact that the correlation between the average expression for clusters A and B to bulk sequencing data from unperturbed cells is higher than the correlation between cluster C and unperturbed bulk sequencing data, while the opposite is true when comparing to bulk sequencing data for cells in which the master regulator PKA is inhibited (Supplementary Figure 1). We also compare the average of our single colony sequencing data to bulk colony sequencing data and find a positive correlation (~0.4). The differences of gene expression profiles between single and bulk colony sequencing may be attributed to different culture conditions, since culture in picoliter-volume spherical hydrogels in suspension is not the same as culture on an open agar slab, and different growth phases, since many of the colonies formed in the microgel appear in exponential growth phase and the colony formed on the agar plate is in late stationary phase (Supplementary Figure 2).
There is heterogeneity within the clusters in the direction orthogonal to (which we denote 𝑣𝑠𝑒𝑝). Colonies with lower values on the axis have higher overall sequencing reads (Figure 4e). 𝑣ℎ𝑒𝑡 𝑣ℎ𝑒𝑡
These colonies have relatively higher expression of genes associated with the ER-Associated
Page 9 of 22 Lab on a Chip

10
Degradation pathway (UBC7, CUE1) and mitochondrial ribosomal proteins (MRPL38, MRP17, MNP1, MRPS8, MRPL49, Supplementary Table 1). Colonies with lower total transcript counts tend to have higher values. Those colonies have higher transcript counts of 21s rRNA and RPL24A as well as 𝑣ℎ𝑒𝑡two paralogous metallothioneins, CUP1-1 and CUP1-2 which mediate resistance to copper and cadmium (Supplementary Table 1). Interestingly, cluster C (which was characterized by higher expression of stress and stationary phase genes) contained the colonies with both the lowest number of transcript counts (which might include colonies that grew very slowly after implanting in a microgel) as well as those with the highest number of transcript counts (which may have slowed growth after reaching saturation).
The two actively growing clusters, A and B, separate most clearly along principal component 3 (Figure 4f, g). Colonies with higher principal component 3 values have relatively more expression of genes associated with the GO term Organophosphate Metabolic Process (YSA1, ATP16, CYC7, PHM8, YNK1, MTD1, PGM2, URA10, NRK1, AFT2) as well as other amino acid metabolism genes (SER3, GLN3, LYS12) and relatively lower expression of genes associated with the GO term rRNA processing (POP8, NHP2, LOC1, CGR1, LRP1, EBP2, CBF5, RPL37A, NOP56, NOP15, NIP7, Supplementary Tables 1-3). This suggests that the colonies in cluster B could be actively growing mutants from the ARO4 library that have adjusted their metabolism to adapt to changes in metabolic flux resulting from the mutations.
Figure 4. Heterogeneity analysis of S. cerevisiae ARO4 mutagenesis library.
Page 10 of 22Lab on a Chip

11
(a) Schematic workflow of S. cerevisiae library heterogeneity analysis using ICO-seq. (b) t-SNE analysis plot of gene expression profiles from single S. cerevisiae colonies showing three clusters. (c) Heatmap shows top 35 marker genes (thresh.use set as 0.25) from each cluster. When there were more than 35 genes, only the top 35 were shown. Genes shown are color coded and listed on the right. (d) Plot of principal component 1 and 2 values for all colonies analyzed showing the different clusters, as well as the direction that most clearly separates the clusters ( ) and the direction along which colonies 𝑣𝑠𝑒𝑝within clusters vary most ( ). (e) Same as (d), but colonies are colored by the logarithm of the total 𝑣ℎ𝑒𝑡number of counts. (f) Same as (d) but for principal components 1 and 3. (g) Expression heatmap of genes whose expression separates the clusters most clearly. Groups GAC and GCA include genes that are expressed at higher or lower levels respectively in cluster A than in cluster C. Groups GAB and GBA include genes that are expressed at higher or lower levels respectively in cluster A than in cluster B (subtracting out any genes already included in groups GAC and GCA).
Page 11 of 22 Lab on a Chip

12
From this analysis, we can group colonies from a yeast mutagenesis library into three major bins and use gene expression profiling to select those that appear to be conducting efficient protein biosynthesis. Confirming that the observed heterogeneity is a direct result from the mutations of ARO4 will require further development of ICO-seq to enable the direct linking of genotype (mutations) with phenotype (transcriptome). We expect that using high-throughput RNA sequencing to screen for mutants with desired gene expression profiles will be valuable for protein engineering (42), deep mutational scanning (43), and strain engineering (44); Current methods are costly, limited in throughput, or restricted to optical assays (6,8). ICO-seq may provide a versatile, high-throughput and scalable alternative for such analyses going forward.
Discussion ICO-seq enables high-throughput RNA-seq of isogenic cell colonies, which can be used to characterize cellular phenotype for high throughput screening applications. We demonstrated the proof-of-concept usage of ICO-seq by expression profiling hundreds to thousands of colonies of both C. albicans and S. cerevisiae. By scaling up our protocol, we would be able to collect data from hundreds of thousands of individual yeast colonies. In our current implementation, ~10% of yeast colonies are sequenced. The major factor limiting colony sequencing efficiency is co-encapsulation of each colony with a barcode bead, loaded at ~10%. To increase colony sequencing efficiency, barcode bead loading efficiency must be increased, which would be best achieved by using close-packed hydrogels that can barcode RNA (either by increasing the fraction of hydrogels containing a barcoded RNA capture beads through enrichment (45), or by functionalizing the hydrogels directly via split pool methods, ensuring that every introduced hydrogel contains a barcode). Using published close-packing methods (26), this should enable sequencing of up to ~80% of colonies, similar to commercially-available single mammalian cell RNA sequencing approaches (19).
The core innovation of our approach is to exploit the ability of individual yeast cells to expand into isogenic colonies in microgels, thereby biologically amplifying mRNA available for sequencing. Such in vitro cultivation is thus essential to our approach. The ability of a single cell to generate a colony will depend on its genotype and the culture conditions. In our experiments, the yeast cells are cultured for 16-20 hours, and colony sizes generally >100 cells, yielding ample material for analysis. To provide a rough estimation of the number of cells needed for analysis, there are ~15,000 mRNA per yeast cell (46) and ~200,000 mRNA in a mammalian cell (47), so ~14 yeast cells yield mRNA roughly equivalent to one mammalian cell, which has been shown to be sufficient for RNA sequencing. Thus, we estimate a minimum colony size of 14 cells for our method, although fewer cells may also be used at the expense of expression profile coverage and overall data quality. Generally, if it is possible, a longer culture will yield a larger colony and, thus, more mRNA and better sequencing data.
Key to the method is the capture, growth, and sequencing of single cells in agarose hydrogel spheres, which affords a facile route towards generating and analyzing large numbers of distinct colonies. Because gene expression is a universal readout, ICO-seq can be applied to a broad range of phenotypes such as metabolic flux prediction (47-49). It can also be applied to dissect a heterogeneous response from single colonies when they are perturbed (e.g. addition of toxic compound, elevated temperature and when co-cultured with other species). Moreover, microgels are compatible with sorting via flow cytometry prior to ICO-seq, adding more flexibility of the workflow. Additionally, collective analysis of gene expression across large numbers of genetically distinct variants can be applied to characterize sequence-phenotype relationships, and aid in identifying optimal genetic engineering to obtain a desired phenotype. To do this, it is essential to link gene expression profiles to perturbation genotypes. This can be done by incorporating barcodes (expressed as mRNA) for each perturbation as is done in Perturb-seq applications (50,51). In this method a library of single-guide RNA (sgRNA) that cause CAS9 based genetic perturbations are introduced into single cells and transcriptome data is collected using droplet-based sequencing. The identity of the sgRNA for each perturbation is encoded
Page 12 of 22Lab on a Chip

13
in a sequence that is highly expressed in each cell and is sequenced with the rest of the transcriptome. ICO-seq will enable Pertub-seq to be used with yeast and potentially other microbes. ICO-seq can also be applied to genetic circuits, allowing characterization of genetic logic gates and associated promoters, insulators, and terminators, for thousands of circuit variants per experiment (52).
While we have focused on yeast, ICO-seq is applicable to any culturable cell type, including mammalian, bacterial, plant and other fungal cells. Profiling soil microbes may yield novel enzymes and pathways (53), and analyzing the gene expression of gut microbes when cultured in the gut may yield insights useful to microbiome-based therapy (54). By combining ICO-seq with modern in situ cultivation approaches (55) that also rely on hydrogel colony culture, it should be possible to obtain accurate and comprehensive gene expression profiles for currently uncultivable microorganisms. When applied to mammalian cells, ICO-seq should be valuable for methods that currently rely on single cell RNA-seq, such as Perturb-seq (50,51), with the significant benefit of reduced expression noise. ICO-seq also enables new possibilities for studying small colonies of genetically or phenotypically distinct cells, allowing accurate gene expression profiling of microbial consortia, cancer spheroids (56) or organoids (57,58). While we have applied the approach using a custom microfluidics and Drop-seq strategy, new microgel workflows announced for commercial platforms (10X Genomics) should allow our approach to be applied in a more accessible format using commercially available hardware.
Methods
Microfabrication of devicesPhotoresist masters are created by spinning on a layer of photoresist SU-8 (Microchem) onto a 3
inch silicon wafer (University Wafer), then baking at 95 °C for 20 min. Then, the photoresist is subjected to 3 min ultraviolet exposure over photolithography masks (CAD/Art Services) printed at 12,000 DPI. After ultraviolet exposure, the wafers are baked at 95 °C for 10 min then developed in fresh propylene glycol monomethyl ether acetate (Sigma Aldrich) then rinsed with fresh propylene glycol monomethyl ether acetate and baked at 95 °C for 5 min to remove solvent. The microfluidic devices are fabricated by curing poly(dimethylsiloxane) (10:1 polymer-to-crosslinker ratio) over the photoresist master (59). The devices are cured in an 80 °C oven for 1 h, extracted with a scalpel, and inlet ports added using a 0.75 mm biopsy core (World Precision Instruments). The device is bonded to a glass slide using O2 plasma treatment and channels are treated with Aquapel (PPG Industries) to render them hydrophobic. Finally, the devices are baked at 65 °C for 20 min to dry the Aquapel before they are ready for use.Yeast strains and culture conditions
C. albicans experiments were carried out in strain RZY122. RZY122 is modified from strain SN87, a SC5314 derivative (60), with YFP-HIS1 replaces one copy of the WH11 ORF (a/a leu2∆/leu2∆ his1∆/his1∆ URA3/ura3∆::imm434 IRO1/iro1∆::imm434 WH11::YFP-HIS1/WH11). Cultures of opaque cells were inoculated from a single colony from a plate into liquid media at 25 °C for ~20 hours before encapsulation. Plates are standard synthetic complete yeast media with Uridine. Media is same as the plates but without agarose.
S. cerevisiae experiments were carried out in strain BY4741 (MATa; his3Δ1; leu2Δ0; met15Δ0; ura3Δ0). The ARO4 regulatory domain mutagenesis library used in this study has been described in Abatemarco et al. (6). The library was cultivated with constant agitation in YSC-HIS at 30 °C for ~16 hours. YSC-HIS media consisted of 20 g/L glucose (Thermo Fisher Scientific), 0.77 g/L CSM-His supplement (MP Biomedicals), and 0.67 g/L Yeast Nitrogen Base (Becton, Dickinson, and Company). Plate is same as the YSC-HIS media with agarose. Agarose microgel generation
The yeast culture was washed with PBS 2 times before being resuspended in PBS at an appropriate concentration based on hemocytometer counting. The low melting agarose (Sigma) solution
Page 13 of 22 Lab on a Chip

14
was made with heating 2% ultra low melting agarose in PBS at 90 °C until completely melted. The melted agarose was quickly loaded in a syringe and installed to the pump. A tabletop space heater set to 80 °C was positioned to keep the agarose syringe warm during droplet generation. HFE7500 oil with 2% ionic krytox as surfactant was used for the oil phase. The agarose droplets were collected into a 50 ml falcon tube placed on ice for the formation of agarose microgel. The agarose microgel were released from the droplets by adding 20% PFO (1H,1H,2H,2H-Perfluoro-1-octanol, sigma) in HFE7500 into the emulsion followed by washing twice with TETW solution (10mM Tris pH 8.0, 1mM EDTA, 0.01% Tween-20). The agarose microgels were then resuspended in appropriate media for overnight culturing to form single colony containing microgels.Dropseq workflow with agarose microgels
Barcoded Drop-seq beads were purchased from ChemGenes corporation (catalog number MACOSKO-2011-10) at 10um synthesis scale. Cleanup and storage of the beads was performed as in (17).
For the C. albicans experiment, the barcoded Drop-seq beads were resuspended in 0.9X YR lysis buffer (Zymo Research) with additional 500 mM NaCl. The yeast colonies in agarose microgels were first washed with PBS buffer twice and YR Digestion buffer (Zymo Research) once then treated with Zymolyase in YR Digestion buffer to digest the yeast cell walls for 1 hour at 37oC. The microgels were then close-packed in a 1ml syringe by centrifugation. The dropseq beads, close-packed agarose microgels, and HFE 7500 with 2% w/v EA surfactant (RAN Biotechnologies) were then loaded into the yeast agarose Drop-seq device for droplet generation controlled via syringe pumps. Guanidine chloride from the YR lysis buffer leads to dissociation of the agarose microgels, which may improve availability of mRNA for capture.
For the S. cerevisiae experiment, a LiOAc-SDS based lysis protocol was used to simplify the workflow (61). The barcoded Drop-seq beads were resuspended in Drop-seq lysis buffer with additional 400 mM LiOAc, 2% SDS solution and 500mM NaCl. The microgels were then close-packed in a 1ml syringe by centrifugation. The dropseq beads, close-packed microgels, and HFE 7500 with 2% w/v ionic krytox surfactant were then connected to the yeast agarose Drop-seq device for droplet generation. The collected emulsions were heated at 70 °C for 15min to facilitate the cell lysis and dissociation of the agarose microgels and then kept on ice to facilitate mRNA capture.
The collected emulsions were then processed following the Drop-seq protocol (17). In short, collected emulsions were broken by addition of PFO. mRNA transcripts bound on Drop-seq beads were then reverse transcribed using reverse transcriptase (Maxima RT, Thermo Fisher). Unused primers were degraded by addition of Exonuclease I (New England Biolabs). Washed beads were counted and aliquoted for PCR amplification (a representative bioanalyzer time trace can be found in Supplementary Figure 3). 600 pg of the amplified cDNA was then used to construct a sequencing library using the Nextera XT kit.
For bulk yeast colony RNA-seq, colonies of ARO4 expressing strain (6) from YSC-HIS plate were collected after growth for 60 hours at 30 °C and total RNA was extracted using YeaStar kit (Zymo Reseach). Reverse transcription reaction was performed with primer 5’-TTTAAGCAGTGGTATCAACGCAGAGTACNNNNNNNNNNNNNNNNNNNNTTTTTTTTTTTTTTTTTTTTTTTTTTTTTT-3’ followed by PCR amplification and sequencing library construction based on Drop-seq protocol (17). Next generation sequencing and data analysis
Nextera XT generated sequencing libraries were sequenced with Illumina MiSeq system using custom read 1 primer. Read1 length is 25 bp and Read2 length is 75 bp. C. albicans library was sequenced with 24 million paired-end reads and S. cerevisiae library was sequenced with 23.6 million paired-end reads. Two libraries of bulk colonies were sequenced with 8.7 and 8.3 million paired-end reads.
For ICO-seq, the sequencing reads were fed into the Drop-seq bioinformatics analysis pipeline following Drop-seq protocol (17) except the alignment were done with Bowtie (62). C. albicans (63) or
Page 14 of 22Lab on a Chip

15
S. cereivisae (64) reference genomes were used for alignment. YFP gene sequence was added to the C. albicans reference genome to facilitate the analysis. The resulted digital gene expression tables were then used as input for Seurat V1.3 for analysis and visualization (35). For C. albicans PCA plot, we first used scale.data from Seurat object to analyze the expression distribution of YFP gene followed by extracting cell barcodes with high YFP expression (>1.4) and low YFP expression (<0) to use as white cells and opaque cells respectively. We scanned different cut-offs and parameters to balance data quality and cell numbers.
For the Principal Component Analysis for the ARO4 library, we first filtered out genes that did not have at least 3 counts in at least one of the 300 colonies with the lowest overall expression level. We then normalized counts for each colony, by the total number of read counts for that colony in this 𝑘reduced set of genes , and multiplied by the median total read number for all colonies, 𝑐𝑘
𝑡𝑜𝑡 𝑆 =. We then added a pseudocount of so that the pseudocount would be 10% of the 𝑚𝑒𝑑
𝑘(𝑐𝑘
𝑡𝑜𝑡)0.1𝑆
max𝑘
(𝑐𝑘𝑡𝑜𝑡)
value of the smallest possible value that a real count could take on. We then took the base 10 logarithm prior to principal component analysis (Figure 4c-f). The vector is defined as the direction 𝑣𝑠𝑒𝑝connecting the points and in PC1 PC2 space. The vector (𝑥0,𝑦0) = (3.1, ― 1.6) (𝑥1,𝑦1) = (20.9, 10.5)
is the vector perpendicular to that passes through and . For each 𝑣ℎ𝑒𝑡 𝑣𝑠𝑒𝑝 (𝑥0,𝑦0) (𝑥2,𝑦2) = ( ― 6.9,𝑦2)colony we can find coordinates in PC1/PC2 space, and project those coordinates onto to obtain 𝑣𝑠𝑒𝑝 𝑢𝑠𝑒𝑝. Clusters A, B, and C are defined as all colonies for which , , or 𝑢𝑠𝑒𝑝 < ―9.83 ―9.83 < 𝑢𝑠𝑒𝑝 < 0 𝑢𝑠𝑒𝑝
respectively.> 0For bulk colony sequencing, after alignment using Bowtie (60) to S.cerevisiae genome assembly
EF4. We used BEDTools with feature annotation to extract counts of gene expression from the alignment file. Counts from all exons for a given gene were summed. The average of the two bulk colony sequencing data sets was used to compare with average of our single colony sequencing data set. After filtering the bulk colony count data so that only genes analyzed for individual colonies were considered, counts were normalized and multiplied by S, the same scaling factor as was used for the individual colonies. A pseudocount of was added to the normalized ( 0.1𝑆
max (𝑡𝑜𝑡𝑎𝑙 𝑐𝑜𝑢𝑛𝑡𝑠 𝑓𝑜𝑟 𝑒𝑎𝑐ℎ 𝑟𝑒𝑝𝑙𝑖𝑐𝑎𝑡𝑒))counts prior to taking the log10 value.
Data availabilityThe accession number for the raw and analyzed data reported in this paper is GEO: GSE121271. Reviewer token is upqbwgcofturlel.
AcknowledgementsWe thank Dr. Alexander D. Johnson from UCSF for gifting C. albicans strain RZY122. We also thank Dr. Alexander Johnson, Dr. John Haliburton, and Dr. Cyrus Modavi for helpful discussion. This work was supported by the Chan Zuckerberg Biohub, the National Science Foundation CAREER Award (Grant Number DBI-1253293); the National Institutes of Health (NIH) (Grant Numbers R01-EB019453-01, R01-HG008978 and DP2-AR068129-01.) Chiraj Dalal was supported by NIH grant R01-AI049187 to AJ.
Competing Interests The authors declare that they have no competing financial interests.
Correspondence Correspondence and requests for material should be addressed to A.R.A. (email: [email protected]).
Page 15 of 22 Lab on a Chip

16
Contribution A.R.A and L.L. conceived the project. L.L. C.D. and B.H. designed and carried out the experiments. L.L., C.D. and B.H. and A.R.A. evaluated the data. L.L. and A.R.A. wrote the manuscript with input from C.D. and B.H..
Page 16 of 22Lab on a Chip

17
Reference
1. Mager, W.H. and Winderickx, J. (2005) Yeast as a model for medical and medicinal research. Trends in pharmacological sciences, 26, 265-273.
2. Botstein, D., Chervitz, S.A. and Cherry, J.M. (1997) Yeast as a model organism. Science, 277, 1259-1260.
3. Liu, L., Redden, H. and Alper, H.S. (2013) Frontiers of yeast metabolic engineering: diversifying beyond ethanol and Saccharomyces. Current opinion in biotechnology, 24, 1023-1030.
4. Curran, K.A. and Alper, H.S. (2012) Expanding the chemical palate of cells by combining systems biology and metabolic engineering. Metabolic engineering, 14, 289-297.
5. Jensen, M.K. and Keasling, J.D. (2015) Recent applications of synthetic biology tools for yeast metabolic engineering. FEMS yeast research, 15, 1-10.
6. Abatemarco, J., Sarhan, M.F., Wagner, J.M., Lin, J.L., Liu, L., Hassouneh, W., Yuan, S.F., Alper, H.S. and Abate, A.R. (2017) RNA-aptamers-in-droplets (RAPID) high-throughput screening for secretory phenotypes. Nature communications, 8, 332.
7. Gill Ryan, T., Halweg‐Edwards Andrea, L., Clauset, A. and Way Sam, F. (2016) Synthesis aided design: The biological design-build-test engineering paradigm? Biotechnology and Bioengineering, 113, 7-10.
8. Terekhov, S.S., Smirnov, I.V., Stepanova, A.V., Bobik, T.V., Mokrushina, Y.A., Ponomarenko, N.A., Belogurov, A.A., Rubtsova, M.P., Kartseva, O.V., Gomzikova, M.O. et al. (2017) Microfluidic droplet platform for ultrahigh-throughput single-cell screening of biodiversity. Proceedings of the National Academy of Sciences, 114, 2550-2555.
9. Wang, B.L., Ghaderi, A., Zhou, H., Agresti, J., Weitz, D.A., Fink, G.R. and Stephanopoulos, G. (2014) Microfluidic high-throughput culturing of single cells for selection based on extracellular metabolite production or consumption. Nature Biotechnology, 32, 473-478.
10. Wagner, J.M., Liu, L., Yuan, S.-F., Venkataraman, M.V., Abate, A.R. and Alper, H.S. (2018) A comparative analysis of single cell and droplet-based FACS for improving production phenotypes: Riboflavin overproduction in Yarrowia lipolytica. Metabolic engineering, 47, 346-356.
11. Mongersun, A., Smeenk, I., Pratx, G., Asuri, P. and Abbyad, P. (2016) Droplet microfluidic platform for the rapid determination of single-cell lactate release. Analytical chemistry, 88, 3257-3263.
12. Siltanen, C.A., Cole, R.H., Poust, S., Chao, L., Tyerman, J., Kaufmann-Malaga, B., Ubersax, J., Gartner, Z.J. and Abate, A.R. (2018) An oil-free picodrop bioassay platform for synthetic biology. Scientific Reports, 8, 7913.
13. Lee, D., Smallbone, K., Dunn, W.B., Murabito, E., Winder, C.L., Kell, D.B., Mendes, P. and Swainston, N. (2012) Improving metabolic flux predictions using absolute gene expression data. BMC Systems Biology, 6, 73-73.
14. Liu, L., Markham, K., Blazeck, J., Zhou, N., Leon, D., Otoupal, P. and Alper, H.S. (2015) Surveying the lipogenesis landscape in Yarrowia lipolytica through understanding the function of a Mga2p regulatory protein mutant. Metabolic engineering, 31, 102-111.
15. Dominguez, D., Tsai, Y.-H., Gomez, N., Jha, D.K., Davis, I. and Wang, Z. (2016) A high-resolution transcriptome map of cell cycle reveals novel connections between periodic genes and cancer. Cell Research, 26, 946.
16. Schabort, D.T.W.P., Letebele, P.K., Steyn, L., Kilian, S.G. and du Preez, J.C. (2016) Differential rna-seq, multi-network analysis and metabolic regulation analysis of Kluyveromyces marxianus reveals a compartmentalised response to xylose. PloS one, 11, e0156242.
Page 17 of 22 Lab on a Chip

18
17. Macosko, E.Z., Basu, A., Satija, R., Nemesh, J., Shekhar, K., Goldman, M., Tirosh, I., Bialas, A.R., Kamitaki, N., Martersteck, E.M. et al. (2015) Highly parallel genome-wide expression profiling of individual cells using nanoliter droplets. Cell, 161, 1202-1214.
18. Klein, Allon M., Mazutis, L., Akartuna, I., Tallapragada, N., Veres, A., Li, V., Peshkin, L., Weitz, David A. and Kirschner, Marc W. (2015) Droplet barcoding for single-cell transcriptomics applied to embryonic stem cells. Cell, 161, 1187-1201.
19. Zheng, G.X.Y., Terry, J.M., Belgrader, P., Ryvkin, P., Bent, Z.W., Wilson, R., Ziraldo, S.B., Wheeler, T.D., McDermott, G.P., Zhu, J. et al. (2017) Massively parallel digital transcriptional profiling of single cells. Nature communications, 8, 14049.
20. Gasch, A.P., Yu, F.B., Hose, J., Escalante, L.E., Place, M., Bacher, R., Kanbar, J., Ciobanu, D., Sandor, L., Grigoriev, I.V. et al. (2017) Single-cell RNA sequencing reveals intrinsic and extrinsic regulatory heterogeneity in yeast responding to stress. PLoS biology, 15, e2004050.
21. Eun, Y.-J., Utada, A., Copeland, M.F., Takeuchi, S. and Weibel, D.B. (2011) Encapsulating bacteria in agarose microparticles using microfluidics for high-throughput cell analysis and isolation. ACS chemical biology, 6, 260-266.
22. Lan, F., Demaree, B., Ahmed, N. and Abate, A.R. (2017) Single-cell genome sequencing at ultra-high-throughput with microfluidic droplet barcoding. Nature Biotechnology, 35, 640.
23. Scanlon, T.C., Dostal, S.M. and Griswold, K.E. (2014) A high-throughput screen for antibiotic drug discovery. Biotechnology and bioengineering, 111, 232-243.
24. Abate, A.R. and Weitz, D.A. (2011) Faster multiple emulsification with drop splitting. Lab on a chip, 11, 1911-1915.
25. Abate, A.R., Chen, C.H., Agresti, J.J. and Weitz, D.A. (2009) Beating Poisson encapsulation statistics using close-packed ordering. Lab on a chip, 9, 2628-2631.
26. Nobile, C.J. and Johnson, A.D. (2015) Ccandida albicans biofilms and human disease. Annual Review of Microbiology, 69, 71-92.
27. Takesue, Y., Ueda, T., Mikamo, H., Oda, S., Takakura, S., Kitagawa, Y. and Kohno, S. (2015) Management bundles for candidaemia: the impact of compliance on clinical outcomes. Journal of Antimicrobial Chemotherapy, 70, 587-593.
28. Berman, J. and Sudbery, P.E. (2002) Candida albicans: a molecular revolution built on lessons from budding yeast. Nature reviews. Genetics, 3, 918-930.
29. Lohse, M.B. and Johnson, A.D. (2009) White-opaque switching in Candida albicans. Current opinion in microbiology, 12, 650-654.
30. Srikantha, T. and Soll, D.R. (1993) A white-specific gene in the white-opaque switching-system of Candida albicans. Gene, 131, 53-60.
31. Hernday, A.D., Lohse, M.B., Fordyce, P.M., Nobile, C.J., DeRisi, J.L. and Johnson, A.D. (2013) Structure of the transcriptional network controlling white-opaque switching in candida albicans. Molecular microbiology, 90, 22-35.
32. Tuch, B.B., Mitrovich, Q.M., Homann, O.R., Hernday, A.D., Monighetti, C.K., De La Vega, F.M. and Johnson, A.D. (2010) The transcriptomes of two heritable cell types illuminate the circuit governing their differentiation. PLOS Genetics, 6, e1001070.
33. Lan, C.-Y., Newport, G., Murillo, L.A., Jones, T., Scherer, S., Davis, R.W. and Agabian, N. (2002) Metabolic specialization associated with phenotypic switching in Candida albicans. Proceedings of the National Academy of Sciences, 99, 14907-14912.
34. van der Maaten, L. and Hinton, G. (2008) Visualizing Data using t-SNE. J Mach Learn Res, 9, 2579-2605.
35. Satija, R., Farrell, J.A., Gennert, D., Schier, A.F. and Regev, A. (2015) Spatial reconstruction of single-cell gene expression data. Nature Biotechnology, 33, 495.
Page 18 of 22Lab on a Chip

19
36. Desai, J.V., Bruno, V.M., Ganguly, S., Stamper, R.J., Mitchell, K.F., Solis, N., Hill, E.M., Xu, W., Filler, S.G., Andes, D.R. et al. (2013) Regulatory role of glycerol in Candida albicans biofilm formation. mBio, 4, e00637-00612.
37. Daniels, K.J., Srikantha, T., Lockhart, S.R., Pujol, C. and Soll, D.R. (2006) Opaque cells signal white cells to form biofilms in Candida albicans. The EMBO journal, 25, 2240-2252.
38. Noble, S.M., Gianetti, B.A. and Witchley, J.N. (2016) Candida albicans cell-type switching and functional plasticity in the mammalian host. Nature Reviews Microbiology, 15, 96.
39. Ariyachet, C., Solis, N.V., Liu, Y., Prasadarao, N.V., Filler, S.G. and McBride, A.E. (2013) SR-like RNA-binding protein slr1 affects Candida albicans filamentation and virulence. Infection and immunity, 81, 1267-1276.
40. Gottardi, M., Reifenrath, M., Boles, E. and Tripp, J. (2017) Pathway engineering for the production of heterologous aromatic chemicals and their derivatives in Saccharomyces cerevisiae: bioconversion from glucose. FEMS yeast research, 17, fox035-fox035.
41. Luttik, M.A.H., Vuralhan, Z., Suir, E., Braus, G.H., Pronk, J.T. and Daran, J.M. (2008) Alleviation of feedback inhibition in Saccharomyces cerevisiae aromatic amino acid biosynthesis: Quantification of metabolic impact. Metabolic engineering, 10, 141-153.
42. Alper, H., Moxley, J., Nevoigt, E., Fink, G.R. and Stephanopoulos, G. (2006) Engineering yeast transcription machinery for improved ethanol tolerance and production. Science, 314, 1565-1568.
43. Melamed, D., Young, D.L., Gamble, C.E., Miller, C.R. and Fields, S. (2013) Deep mutational scanning of an RRM domain of the Saccharomyces cerevisiae poly(A)-binding protein. RNA, 19, 1537-1551.
44. Leavitt, J.M., Wagner, J.M., Tu, C.C., Tong, A., Liu, Y. and Alper, H.S. (2017) Biosensor-enabled directed evolution to improve muconic acid production in Saccharomyces cerevisiae. Biotechnology Journal, 12, 1600687-n/a.
45. Utada, A. and Agresti, J. (2019) Use of gel beads to control droplet dispersion. Patent application, US10233487B2.
46. Hereford, L.M. and Rosbash, M. (1977) Number and distribution of polyadenylated RNA sequences in yeast. Cell, 10, 453-462
47. Shapiro, E., Biezuner, T. and Linnarsson, S. (2013) Single-cell sequencing-based technologies will revolutionize whole-organism science. Nature Reviews Genetics, 14, 618-630.
48. Åkesson, M., Förster, J. and Nielsen, J. (2004) Integration of gene expression data into genome-scale metabolic models. Metabolic engineering, 6, 285-293.
49. Zhao, Y., Wang, Y., Zou, L. and Huang, J. (2016) Reconstruction and applications of consensus yeast metabolic network based on RNA sequencing. FEBS Open Bio, 6, 264-275.
50. Dixit, A., Parnas, O., Li, B., Chen, J., Fulco, C.P., Jerby-Arnon, L., Marjanovic, N.D., Dionne, D., Burks, T., Raychowdhury, R. et al. (2016) Perturb-seq: dissecting molecular circuits with scalable single-cell rna profiling of pooled genetic screens. Cell, 167, 1853-1866.e1817.
51. Datlinger, P., Rendeiro, A.F., Schmidl, C., Krausgruber, T., Traxler, P., Klughammer, J., Schuster, L.C., Kuchler, A., Alpar, D. and Bock, C. (2017) Pooled CRISPR screening with single-cell transcriptome readout. Nature Methods, 14, 297.
52. Gorochowski, T.E., Espah Borujeni, A., Park, Y., Nielsen, A.A.K., Zhang, J., Der, B.S., Gordon, D.B. and Voigt, C.A. (2017) Genetic circuit characterization and debugging using RNA-seq. Molecular Systems Biology, 13.
53. Solomon, K.V., Haitjema, C.H., Henske, J.K., Gilmore, S.P., Borges-Rivera, D., Lipzen, A., Brewer, H.M., Purvine, S.O., Wright, A.T., Theodorou, M.K. et al. (2016) Early-branching gut fungi possess a large, comprehensive array of biomass-degrading enzymes. Science.
54. Huseyin, C.E., O’Toole, P.W., Cotter, P.D. and Scanlan, P.D. (2017) Forgotten fungi - the gut mycobiome in human health and disease. FEMS Microbiology Reviews, 41, 479-511.
Page 19 of 22 Lab on a Chip

20
55. Ling, L.L., Schneider, T., Peoples, A.J., Spoering, A.L., Engels, I., Conlon, B.P., Mueller, A., Schaberle, T.F., Hughes, D.E., Epstein, S. et al. (2015) A new antibiotic kills pathogens without detectable resistance. Nature, 517, 455-459.
56. Alexandra, P.V., Mark, J.M., Sokol, P.P., Fernando, U.G., Peter, I.L. and Aydin, T. (2007) Heterogeneous breast tumoroids: An in vitro assay for investigating cellular heterogeneity and drug delivery. Journal of Biomolecular Screening, 12, 13-20.
57. Itskovitz-Eldor, J., Schuldiner, M., Karsenti, D., Eden, A., Yanuka, O., Amit, M., Soreq, H. and Benvenisty, N. (2000) Differentiation of human embryonic stem cells into embryoid bodies compromising the three embryonic germ layers. Molecular Medicine, 6, 88-95.
58. Huch, M. and Koo, B.-K. (2015) Modeling mouse and human development using organoid cultures. Development, 142, 3113-3125.
59. Qin, D., Xia, Y. and Whitesides, G.M. (2010) Soft lithography for micro- and nanoscale patterning. Nature protocols, 5, 491-502.
60. Noble, S.M. and Johnson, A.D. (2005) Strains and strategies for large-scale gene deletion studies of the diploid human fungal pathogen Candida albicans. Eukaryotic cell, 4, 298-309.
61. Lõoke, M., Kristjuhan, K. and Kristjuhan, A. (2011) Extraction of genomic DNA from yeasts for pcr-based applications. BioTechniques, 50, 325-328.
62. Langmead, B., Trapnell, C., Pop, M. and Salzberg, S.L. (2009) Ultrafast and memory-efficient alignment of short DNA sequences to the human genome. Genome Biology, 10, 1-10.
63. Muzzey, D., Schwartz, K., Weissman, J.S. and Sherlock, G. (2013) Assembly of a phased diploid Candida albicans genome facilitates allele-specific measurements and provides a simple model for repeat and indel structure. Genome Biology, 14, R97.
64. Goffeau, A., Barrell, B.G., Bussey, H., Davis, R.W., Dujon, B., Feldmann, H., Galibert, F., Hoheisel, J.D., Jacq, C., Johnston, M. et al. (1996) Life with 6000 Genes. Science, 274, 546-567.
Page 20 of 22Lab on a Chip

We describe Isogenic Colony Sequencing (ICO-seq), a massively-parallel strategy to assess the gene expression profiles of large numbers of genetically distinct yeast colonies.
Page 21 of 22 Lab on a Chip

TTT
TTT
TTT
TTT
TTT
TTT
TTT
TTT
TTT
TTT
TTT
TTT
Digital gene expression table
PCA analysis tSNE plotOutlier identi�cation etc.
Gene1 . . . . .Gene2 Gene3 GeneN
10
0
20
50
0
10
5
5
10
20
0
0
30
20
0
5
Colony1
Colony2
Colony3. . . . .
ColonyM
Co-encapsulation RNA capture and barcode
Sequencing analysis
Page 22 of 22Lab on a Chip