comparative ‘omic’ profiling of industrial wine yeast …
TRANSCRIPT
COMPARATIVE ‘OMIC’ PROFILING OF INDUSTRIAL WINE YEAST STRAINS
By
Debra Rossouw
Dissertation presented for the degree of Doctor of Philosophy (Agricultural Science)
at Stellenbosch University
Institute for Wine Biotechnology, Faculty of AgriSciences
Promoter: Prof Florian F Bauer
December 2009

- ii -
Declaration
By submitting this dissertation electronically, I declare that the entirety of the work contained therein is my own, original work, that I am the owner of the copyright thereof (unless to the extent explicitly otherwise stated) and that I have not previously in its entirety or in part submitted it for obtaining any qualification. Date: 11/11/2009
Copyright © 2009 Stellenbosch University All rights reserved
- iii -
Summary
The main goal of this project was to elucidate the underlying genetic factors responsible for the
different fermentation phenotypes and physiological adaptations of industrial wine yeast strains. To
address this problem an ‘omic’ approach was pursued: Five industrial wine yeast strains, namely
VIN13, EC1118, BM45, 285 and DV10, were subjected to transcriptional, proteomic and exo-
metabolomic profiling during alcoholic fermentation in simulated wine-making conditions. The aim
was to evaluate and integrate the various layers of data in order to obtain a clearer picture of the
genetic regulation and metabolism of wine yeast strains under anaerobic fermentative conditions.
The five strains were also characterized in terms of their adhesion/flocculation phenotypes,
tolerance to various stresses and survival under conditions of nutrient starvation.
Transcriptional profiles for the entire yeast genome were obtained for three crucial stages during
fermentation, namely the exponential growth phase (day 2), early stationary phase (day 5) and late
stationary phase (day 14). Analysis of changes in gene expression profiles during the course of
fermentation provided valuable insights into the genetic changes that occur as the yeast adapt to
changing conditions during fermentation. Comparison of differentially expressed transcripts
between strains also enabled the identification of genetic factors responsible for differences in the
metabolism of these strains, and paved the way for genetic engineering of strains with directed
modifications in key areas. In particular, the integration of exo-metabolite profiles and gene
expression data for the strains enabled the construction of statistical models with a strong predictive
capability which was validated experimentally.
Proteomic analysis enabled correlations to be made between relative transcript abundance and
protein levels for approximately 450 gene and protein pairs per analysis. The alignment of
transcriptome and proteome data was very accurate for interstrain comparisons. For intrastrain
comparisons, there was almost no correlation between trends in protein and transcript levels, except
in certain functional categories such as metabolism. The data also provide interesting insights into
molecular evolutionary mechanisms that underlie the phenotypic diversity of wine yeast strains.
Overall, the systems biology approach to the study of yeast metabolism during alcoholic
fermentation opened up new avenues for hypothesis-driven research and targeted engineering
strategies for the genetic enhancement/ modification of wine yeast for commercial applications.
- iv -
Opsomming
Die hoofdoelwit van hierdie projek was om die onderliggende genetiese faktore wat
verantwoordelik is vir die verskillende fermentasie fenotiepes en fisiologiese aanpassings van
industriële wyngiste, te ontrafel. Om hierdie probleem aan te spreek is ‘n ‘omiese’ aanslag
nagevolg: Vyf industriële wyngiste, naamlik VIN13, EC1118, BM45, 285 en DV10, was onderwerp
aan transkripsionele, proteïomiese en ekso-metaboliet profileering gedurende alkoholiese
fermentasie in gesimuleerde wynmaak toestande. Die doel was om die data te evalueer en te
integreer om ’n duideliker prentjie van die genetiese regulering en metabolisme van wyngis onder
anaerobiese fermentasie toestande te verkry. Die vyf rasse was ook gekarakteriseer in terme van hul
aanklewing/flokkulasie fenotipes, verdraagsaamheid van verskeie stres kondisies en oorlewing
onder toestande van akute gebrek aan voedingstowwe.
Transkripsionele profiele van die hele gisgenoom was verkry vir drie belangrike stadiums
gedurende fermentasie, naamlik die eksponensiële groeifase (dag 2), vroeë stasionêre fase (dag 5)
en laat stasionêre fase (dag 14). Analises van veranderinge in geen-uitdrukkingsprofiele gedurende
die verloop van fermentasie het waardevolle insigte verskaf in terme van die genetiese veranderinge
wat plaasvind soos die gis aanpas tot veranderende toestande gedurende fermentasie. Vergelykings
van differensieel uitgedrukte transkripte tussen rasse het ook die identifisering van genetiese faktore
wat verantwoordelik is vir verskille in die metabolisme van hierdie rasse in staat gestel, en het dit
moontlik gemaak om rasse met gefokusde modifikasies in sleutelareas geneties te manipuleer. In
besonder het die integrasie van ekso-metaboliet profiele en geen-uitdrukkingsdata van hierdie rasse
die konstruksie van statistiese modelle met ’n sterk voorspellende kapasiteit in staat gestel wat
eksperimenteel bevestig is.
Proteomiese analise het dit moontlik gemaak om korrelasies tussen relatiewe geen kopie getalle en
proteïen vlakke vir ongeveer 450 geen- en proteïen pare te verkry. Die ooreenkoms tussen
transkriptoom en proteoom data was akkuraat vir vergelykings tussen gisrasse. Vir vergelykings
tussen verskillende tydspunte was daar omtrent geen ooreenkoms tussen neigings in proteïen- en
geenvlakke nie, behalwe in sekere funksionele kategorië soos metabolisme.
In die geheel het hierdie sisteem biologiese benadering tot die studie van gismetabolisme gedurende
alkoholiese fermentasie nuwe geleenthede geskep vir hipotese-gedrewe navorsing en geteikende
strategië vir die genetiese verbetering/ modifikasie van wyngiste vir kommersiële doeleindes.

- v -
Acknowledgements The work presented here would not have been possible without the innumerable contributions of the
staff and students at the Institute for Wine Biotechnology. Thank you to the Bauer group, past and
present: Sue, Adri, Jaco, Siew, Desiré, Chidi, Gustav and Michael.
In particular, I would like to thank Prof. Florian Bauer for his invaluable input into the research
presented in this dissertation. Without his insight and the many interesting discussions over the
years my research would not have been much of a success.
I would also like to express my gratitude to the National Research Foundation, the Wilhelm Frank
Trust and Stellenbosch University for funding this research.
And lastly, a thank you to my parents, Petro and Dawid Joubert, and my husband, Sarel Rossouw,
for their support and understanding through the many long years of my postgraduate studies.
- vi -
Preface
This dissertation is presented as a compilation of 8 chapters. In Chapter 1 the general aims and
motivation for this study are introduced. Chapter 2 is a review of the literature that is applicable to
the field of study. Chapters 3, 4, 5, 6 and 7 are the experimental chapters which delineate the exact
aims and outcomes that together comprise the full body of experimental work endeavoured in this
research. Chapter 8 concludes the work with a general discussion aimed at coherently integrating
the work presented in the preceding chapters.
Each chapter that has been or will be submitted for publication is written according to the style of
the particular journal as listed below.
Chapter 1
Chapter 2
Chapter 3
Chapter 4
General Introduction.
Will not be submitted for publication.
Style: South African Journal of Viticulture and Enology.
Literature Review: Overview of systems biology and omics
technologies applicable to yeast. Emphasis is placed on the potential
for application of systems biology research to impact on traditional
wine science and biotechnology, particularly with reference to
directed yeast engineering strategies.
Published in the South African Journal of Viticulture and Enology.
Linking gene regulation and the exo-metabolome: A comparative
transcriptomics approach to identify genes that impact on the
production of volatile aroma compounds in yeast.
Published in BMC Genomics
Comparative transcriptomic responses of wine yeast strains in
different fermentation media: towards understanding the interaction
between environment and transcriptome during alcoholic
fermentation.
Published in Applied Microbiology and Biotechnology

- vii -
Chapter 5
Chapter 6
Chapter 7
Chapter 8
A comparative ‘omics’ approach to model changes in wine yeast
metabolism during fermentation.
Published in Applied and Environmental Microbiology.
Transcriptional regulation and diversification of commercial wine
yeast strains.
To be submitted for publication in Molecular Microbiology.
Comparative transcriptomic and proteomic profiling of industrial
wine yeast strains: Towards an integrative understanding of yeast
performance during fermentation.
To be submitted for publication in PLoS Biology.
General discussion.
Will not be submitted for publication.
Style: South African Journal of Viticulture and Enology.
- viii -
Contents
List of figures and tables
CHAPTER 1: General Introduction
References
CHAPTER 2: Wine science in the ‘omics’ era: The impact of systems biology
on the future of wine research
2.1 Abstract
2.2 Introduction
2.3 Yeast biotechnology in the food and beverage industry
2.4 Systems biology background
2.4.1 Genomics
2.4.2 Transcriptomics
2.4.3 Proteomics
2.4.4 Metabolomics
2.4.5 Fluxomics
2.4.6 Interactomics
2.5 Systems biology meets biotechnology
2.6 Conclusion
References
CHAPTER 3: Linking gene regulation and the exo-metabolome: A
comparative transcriptomics approach to identify genes that
impact on the production of volatile aroma compounds in yeast
3.1 Abstract
3.1.1 Background
3.1.2 Results
3.1.3 Conclusion
xiv
1
5
8
9
9
11
12
14
15
17
18
20
20
22
23
24
35
36
36
36
- ix -
3.2 Background
3.3 Methods
3.3.1 Strains, media and culture conditions
3.3.2 Fermentation media
3.3.3 Fermentation conditions
3.3.4 Growth measurement
3.3.5 Analytical methods - HPLC
3.3.6 Analytical methods – GC-FID
3.3.7 Statistical analysis of metabolite data
3.3.8 Microarray analysis
3.3.9 Transcriptomics data acquisition and statistical analysis
3.3.10 Multivariate data analysis
3.3.11 Overexpression constructs and transformation of VIN13
3.4 Results
3.4.1 Fermentation kinetics and formation of metabolites
3.4.2 Microarray analysis
3.4.3 Results of multivariate analysis of metabolites and gene expression
3.4.4 Overexpression of selected genes
3.5 Discussion
3.5.1 Over expression of genes
3.5.2 Other genes of interest
3.6 Conclusions
Acknowledgements
References
Appendix
CHAPTER 4: Comparative transcriptomic responses of wine yeast strains in
different fermentation media: towards understanding the
interaction between environment and transcriptome during
alcoholic fermentation
4.1 Abstract
4.2 Introduction
4.3 Methods
4.3.1 Strains, media and culture conditions
37
40
40
40
41
41
41
42
42
42
43
44
45
48
52
54
58
59
63
63
64
69
72
73
73
75

- x -
4.3.2 Fermentation media
4.3.3 Fermentation conditions
4.3.4 Measurement of growth
4.3.5 Analytical methods – HPLC
4.3.6 Analytical methods – LCMS
4.3.7 Analytical methods – GCMS
4.3.8 General statistical analysis
4.3.9 Microarray analysis
4.3.10 Transcriptomics data acquisition and statistical analysis
4.3.11 Analyses of multivariate data
4.4 Results
4.4.1 Amino acid composition of wine must
4.4.2 Fermentation kinetics
4.4.3 Production of volatile aroma compounds
4.4.4 Global gene expression profiles
4.4.5 Results of PCA analysis
4.4.6 Differentially expressed genes
4.4.7 Functional categorization of differentially expressed genes
4.4.8 Nitrogen and sulfur metabolism
4.4.9 Expression of transporter genes
4.4.10 Enrichment of transcription factors
4.4.11 Comparison of gene loading weights
4.5 Discussion
4.5.1 General: MS300 vs Colombar
4.5.2 Transport facilitation
4.5.3 Nitrogen, sulfur and amino acid metabolism
4.5.3.1 Amino acid transport
4.5.3.2 Amino acid biosynthesis
4.5.3.3. Enrichment of transcription factors
4.6 Conclusions
Acknowledgements
References
75
76
76
76
76
77
77
77
77
78
78
79
81
82
82
84
84
87
88
89
91
92
93
94
95
96
97
98
98
99
- xi -
CHAPTER 5: Comparative transcriptomic approach to investigate
differences in wine yeast physiology and metabolism during
fermentation 5.1 Abstract
5.2 Introduction
5.3 Methods
5.3.1 Strains, media and culture conditions
5.3.2 Fermentation media
5.3.3 Fermentation conditions
5.3.4 Growth measurement
5.3.5 Analytical methods – HPLC
5.3.6 Enzymatic metabolite assays
5.3.7 General statistical analysis
5.3.8 Starvation assays
5.3.9 Ca2+-dependant flocculation assays
5.3.10 Cell surface hydrophobicity assays
5.3.11 Cell surface charge assays
5.3.12 Mat formation
5.3.13 Heat shock
5.3.14 Oxidative stress
5.3.15 Osmotic and hypersaline stress
5.3.16 Heavy metal toxicity
5.3.17 Ethanol tolerance
5.3.18 Microarray analysis
5.3.19 Acquisition of transcriptomics data and statistical analysis
5.3.20 Multivariate data analysis
5.3.21 Reporter metabolite analysis
5.4 Results
5.4.1 Strain physiology and fermentation kinetics
5.4.2 Global gene expression profiles
5.4.3 Outcomes of PCA analysis
5.4.4 Significance and random forest analyses
5.4.5 Glycolysis, fermentation and trehalose metabolism
5.4.6 Reporter metabolite analysis
106
107
107
111
111
112
112
112
112
112
113
113
113
114
114
114
114
115
115
115
115
115
116
116
117
119
120
121
122
- xii -
5.5 Discussion
5.5.1 Stress responses
5.5.2 Flocculation
5.5.2.1 Flocculin-encoding genes
5.5.2.2 Cell-wall mannoproteins
5.5.3 Central carbon metabolism
5.6 Conclusions
Acknowledgements
References
Appendix
CHAPTER 6: Transcriptional regulation and diversification of commercial
wine yeast strains.
6.1 Abstract
6.2 Introduction
6.3 Methods
6.3.1 Strains, media and culture conditions
6.3.2 Fermentation media
6.3.3 Fermentation conditions
6.3.4 Growth measurement
6.3.5 Analytical methods – HPLC
6.3.6 Analytic methods – GC-FID
6.3.7 General statistical analysis
6.3.8 Microarray analysis
6.3.9 Transcriptomics data analysis
6.3.10 Multivariate data analyses
6.3.11 Overexpression constructs and transformation of yeast cells
6.3.12 Quantitative real-time PCR analysis
6.4 Results and Discussion
6.4.1 General
6.4.2 Transcription factor enrichment
6.4.3 Overexpression of selected transcription factors
6.4.4 Fermentation properties of\the overexpressing strains
6.4.5 Results of multivariate analysis
123
127
128
128
128
129
133
133
134
139
140
141
141
143
144
144
144
144
145
145
145
146
146
146
147
148
148
151
152
156
- xiii -
6.4.6 Closing remarks
Acknowledgements
References
CHAPTER 7: Comparative transcriptomic and proteomic profiling of
industrial wine yeast strains.
7.1 Abstract
7.1.1 Background
7.1.2 Results
7.1.3 Conclusion
7.2 Background
7.3 Methods
7.3.1 Strains, media and culture conditions
7.3.2 Fermentation medium
7.3.3 Fermentation conditions
7.3.4 Microarray analyses
7.3.5 Protein extraction
7.3.6 iTRAQ labelling
7.3.7 HPLC method
7.3.8 MS conditions
7.3.9 Data analyses
7.3.10 Network analyses
7.4 Results and Discussion
7.4.1 Transcriptomic data
7.4.2 Interstrain alignment of the transcriptome and proteome
7.4.3 Intrastrain comparison of transcriptome and proteome
7.4.4 Functional categorization of expressed proteins
7.4.5 Correlations between protein levels and phenotype
7.5 Conclusions
Acknowledgements
References
CHAPTER 8: General discussion and conclusions
References
158
159
159
164
165
165
166
166
169
169
169
169
170
170
170
170
171
171
172
172
174
176
180
184
185
185
192
197

- xiv -
List of Figures and Tables CHAPTER 2
Figure 1: A schematic representation of the various ‘omics’ disciplines in
grapevine and yeast research.
CHAPTER 3
Figure 1: Diagrammatic representation of pathways associated with aroma
production and links to associated metabolic activities.
Figure 2: Growth rate (frame A) and CO2 release (frame B) of the five
commercial wine yeast strains during alcoholic fermentation.
Figure 3: Fermentation kinetics of the five yeast strains used in this study:
Glucose utilization (A), fructose utilization (B), glycerol production
(C) and ethanol production (D).
Figure 4: PLS2 scores and loadings plot of all X and Y variables considered in
this study, plotted as coordinates on a PC1 and PC2 plane.
Figure 5: Scores plot for the ethyl caprylate (frame A) and octanoic acid
(frame B) PLS1 models.
Figure 6: Concentrations of ethanol (frame A) and glycerol (frame B) in the
must during fermentation.
Figure 7: Aroma compound production (μg.L-1) in MS300 fermentations
carried out by VIN13 transformed with overexpression constructs.
Figure 8: Qualitative representation of relative real vs. predicted aroma
compound levels in the four transformed VIN13 lines.
Table 1: Exo-metabolites measured in this study.
Table 2: Yeast strains used in this study.
Table 3: Description of plasmids used in this study.
Table 4: Sequences of the primers synthesized in order to amplify genes
relevant to the present study.
Table 5: Volatile alcohols and esters present in the fermentation media at day
13
38
45
46
53
53
55
56
57
37
40
44
44
47
- xv -
2 of fermentation.
Table 6: Volatile alcohols and esters present in the fermentation media at day
5 of fermentation.
Table 7: Volatile alcohols and esters present in the fermentation media at day
14 of fermentation.
Table 8: List of aroma compound production -related transcripts significantly
up/down regulated between different strains at day 2 of
fermentation.
Table 9: List of aroma compound production -related transcripts significantly
up/down regulated between different strains at day 5 of
fermentation.
Table 10: List of aroma compound production -related transcripts
significantly up/down regulated within each strain between days 2
and 5 of fermentation.
Table 11: Summaries of PLS1 models used for interpretation and selection of
genes for overexpression.
CHAPTER 4
Figure 1: CO2 release (frame A) and growth rate (frame B) during
fermentation.
Figure 2: Fermentation kinetics of the five yeast strains used in this study:
Glucose utilization (A), fructose utilization (B), glycerol production
(C) and ethanol production (D).
Figure 3: PCA analysis of whole transcriptome analysis for Colombard and
MS300 fermentations.
Figure 4: HCL clustering of transcripts encoding enzymes involved in
nitrogen and sulfur metabolism.
Figure 5: HCL clustering of transcripts in three clusters showing differential
expression of transport genes between different media.
Figure 6: Expression patterns of genes encoding key transcription factors.
Figure 7: Gene loading weights for aroma compound models based on
transcriptional data from MS300 and Colombar fermentations.
Table 1: Concentrations of the amino acids (in mg.L-1) in Colombar must in
47
48
50
51
52
54
80
80
83
87
89
90
92
79
81
- xvi -
comparison to the standard MS300 composition.
Table 2: Volatile alcohols and esters present in the must at days 2, 5 and 14 of
fermentation in VIN13 and BM45.
Table 3: Categorization (GO function) of genes that are significantly
decreased (greater than 2-fold) in expression in any of the
Colombard samples in comparison to the corresponding MS300
samples.
Table 4: Categorization (GO function) of genes that are significantly
increased (greater than 2-fold) in expression in any of the
Colombard samples in comparison to the corresponding MS300
samples.
CHAPTER 5
Figure 1: Survival response of the 5 yeast strains subjected to starvation
conditions
Figure 2: Assays for heat shock, oxidative stress, osmotic and hypersaline
stress, copper toxicity and ethanol tolerance for VIN13, EC1118,
BM45, 285 and DV10.
Figure 3: PCA analysis showing components 1 and 2.
Figure 4: HCL clustering of transcripts encoding enzymes involved in
glycolysis, fermentation and trehalose metabolism.
Figure 5: Intracellular metabolite concentrations measured in the five strains
at three time points corresponding to the transcriptional analysis.
Table 1: Yeast strains used in this study.
Table 2: Media composition for carbon, nitrogen, sulfur and phosphorus
starvation assays.
Table 3: Summary of cell wall properties and adhesion phenotypes of the five
yeast strains.
Table 4: Functional categorization of the top 200 strain and time point
discriminatory ORF’s.
Table 5: Multiple analysis across all strains for days 2, 5 and 14.
Table 6: Multiple analysis across all time points within each strain.
85
86
118
119
120
123
126
111
113
117
122
124
125
149
150
- xvii -
CHAPTER 6
Figure 1: Hypergeometric distribution of transcription factors into 5 main
expression profiles using STEM analysis.
Figure 2: Expression patterns of genes encoding key transcription factors
Figure 3: Relative gene expression (normalized to PDA1 expression) of RAP1,
SOK2 and selected target genes.
Figure 4: Fermentation kinetics of the 3 yeast strains and two transformants
relevant to this study: Glucose utilization (A), fructose utilization
(B), glycerol production (C) and ethanol production (D).
Figure 5: Principal component analysis of aroma compound concentrations.
Table 1: Yeast strains used in this study.
Table 2: Plasmids constructed in this study.
Table 3: Primers used for amplification of target genes.
Table 4: Target genes and primers for QRT-PCR.
Table 5: Top hits (% of total) for transcription factor enrichment analysis of
random forest outputs.
Table 6: Top hits (% of total) for transcription factor enrichment analysis of
random forest outputs in MIPS functional category of metabolism.
Table 7: Sok2p and Rap1p activity with reference to key target genes.
Table 8: Volatile alcohols and esters present in the fermentation media at day
2 of fermentation.
Table 9: Volatile alcohols and esters present in the fermentation media at day
5 of fermentation.
Table 10: Volatile alcohols and esters present in the fermentation media at
day 14 of fermentation.
CHAPTER 7
Figure 1: Distribution of the different protein-transcript pairs across the
spectrum of ratios determined in our analysis for days 2 (frame A), 5
(frame B) and 14 (frame C) of the BM45 vs. VIN13 comparative
analysis. For the intrastrain analysis, the distribution of protein-
151
153
156
144
147
147
147
148
149
152
154
154
155
173
182
- xviii -
transcript ratios for day 5 compared to day 2 can be seen in frame D
(for BM45) and frame E (for VIN13).
Figure 2: Network visualization of protein and gene expression ratios in
metabolic hubs linked to the metabolism of various amino acids.
The pathway networks for BM45 vs. VIN13 day 2, 5 and 14 are
presented in frames A, B and C respectively. Frame D depicts the
changes in gene and protein levels for day5 versus day2 in VIN13.
Table 1: GO category of energy and metabolism for protein-mRNA pairs at
days 2, 5 and 14. Transcript ratios are indicated by (G) and protein
ratios by (P).
Table 2: GO category of cell rescue and defense for protein-mRNA pairs at
days 2, 5 and 14. Transcript ratios are indicated by (G) and protein
ratios by (P).
Table 3: Relative protein and transcript ratios for day 5 versus day 2 in both
VIN13 and BM45 for genes involved in fermentation and amino acid
metabolism.
Table 4: Relative protein and transcript ratios for day 5 versus day 2 in both
VIN13 and BM45 for the GO categories of transcription and cell
cycle control.
177
179
180
181

1
CChhaapptteerr 11
General introduction
2
CHAPTER 1
General Introduction
The advent of molecular biology revolutionised the biological sciences and led to an exponential
increase in scientific knowledge in all biological disciplines. However, after almost 40 years a ‘ceiling’
has been reached in terms of the potential for these approaches to answer key questions and address
needs in applied fields of research. The problem is that the more classic molecular biology approaches
can be described as ‘reductionist’ in terms of their methodology. In other words, scientific problems are
approached by dissecting the system in question into its component parts and studying these
individually. Though invaluable, the shortfall of these approaches is the fact that biological systems are
infinitely complex and the functioning of the whole system cannot simply be predicted by analysis of
its component parts. Interactions between different modules of the biological system in question and
interplay between various layers of regulatory mechanisms means that a holistic, interdisciplinary
approach is needed to understand the biology of complex living systems.
Biological problems in the context of yeast engineering have traditionally been dealt with by classic
approaches such as isolation of new strains, hybridisation, mutagenesis and selection under competitive
conditions (Pretorius & Bauer, 2002). In this manner more than 200 commercial wine yeast strains
(mainly of the species Saccharomyces cerevisiae) have been isolated to meet specific requirements of
wine producers and, more importantly, wine consumers. These requirements are primarily related to
phenotypical traits such as fermentation performance, general stress resistance, the profile of aromatic
compounds produced and the ability to release beneficial enzymes or mannoproteins (Bauer &
Pretorius, 2002), and different strains differ significantly from each other to offer wine makers a wide
variety of options.
In recent times however, following the sequencing and annotation of the yeast genome (Goffeau et al.,
1996) it has become relatively easy to target specific yeast genes for knockout or overexpression in
commercial wine yeast strains. This technology has been at the forefront of yeast research over the past
decade and has proven to be a feasible means for introducing specific changes in yeast behaviour,
based on known or predicted functions of the targeted genes (Bauer & Pretorius, 2002; Coulon, 2006).
However, many wine-relevant traits are polygenic, and part of complex regulatory systems that can not
3
be controlled and manipulated in a predictive manner by simplistic, directed genetic engineering
strategies (Marullo et al., 2004).
In this project we sought to answer key questions related to the metabolic regulation and physiological
adaptations of yeast strains by following a systems biology approach. By ‘systems biology’ we refer to
the analysis of fermenting yeast in a top-down approach in which entire classes of biological molecules
(i.e. mRNA, proteins, metabolites) are detected and quantified.
For this purpose, we made use of several omics technologies, beginning with the relatively well-
established technology of large-scale gene expression analysis using microarrays. This is one of the
most powerful systems methodologies that can be applied to yeast. Transcript levels of all known or
predicted genes can be measured simultaneously, under any selected condition and at several time
points, to identify sets of genes whose expression levels are induced or repressed relative to different
time points or any other experimental parameter (Ashby & Rine, 1996). Transcriptional profiling
presents the opportunity to examine gene expression changes in fermenting wine yeast strains at key
points during fermentation, as well as the potential for comparisons of transcriptional patterns between
different strains at these time points. Analysis of transcriptomes is usually the first step in any systems
biology study as it enables the generation of systematic information on cellular functioning on a genetic
level (Grigoriev, 2001; Ge et al., 2001). Transcriptome analysis of wine yeast strains has already
proven useful to analyse the broad genetic regulation of fermentative growth in wine environments.
These studies have illuminated the intrinsic genetic and regulatory mechanisms involved in
fermentation, and have greatly increased our understanding of this important process (Alexandre et al.,
2001; Erasmus et al., 2003; Rossignol et al., 2003; Varela et al., 2005; Mendes-Ferreira et al., 2007;
Marks et al., 2008). In the context of our research plan, transcriptional analysis was employed to help
identify differentially expressed genes or differentially regulated modules between different strains as
well as time points during fermentation.
Transcript levels are unfortunately not always directly correlated to protein levels and in vivo metabolic
fluxes (Griffin et al., 2002; Daran-Lapujade et al., 2004) For this reason transcriptomic datasets also
need to be combined with other data subsets, such as proteomic data, so that the overlapping set of
interactions provides more reliable and biologically valid insights/ information on the system in
question (Tong et al., 2002; Walhout et al., 2002). The most accurate and reproducible proteomics
methodology to date involves high-throughput chromatography in combination with mass
4
spectrometry. This approach can be used for fast and accurate protein identification as long as the
protein/s already exist/s uniquely in a sequence database (Mann et al., 2001). A total of 1504 yeast
proteins have already been unambiguously identified in a single analysis using such a dimensional
chromatography approach coupled with tandem mass spectrometry (MS/MS) (Peng et al., 2002). In
wine yeast, the proteomics field has remained largely unexplored, with very few forays into proteomic
analysis having been reported (Trabalzini et al., 2003; Husnik et al., 2006; Salvadó et al., 2008).
Ultimately, the particular phenotype of a yeast cell is essentially a function of the metabolic activity of
the cell. This includes parameters such as the metabolic flux through key pathways, the steady state
levels of intermediates in these pathways as well as the levels of the ‘end point’ compounds produced
by the metabolic activity of the cells. In the wine context, yeast metabolism is the primary causative
agent responsible for the transformation of grape must into wine. As the yeast utilizes the sugar present
in the grape must it produces and releases a variety of metabolites. The impact of yeast on fermentation
is a thus a direct function of the metabolic activity of the yeast cells. Fermenting yeast cells produce a
number of important metabolites that are released into the wine must (exometabolome), most notably
of which are the higher alcohols and esters which endow the wine with characteristic flavour or aroma
tones.
Advances in high-throughput methodologies in analytical chemistry now allow the detection and
relative quantification of a large number of the important metabolites simultaneously (Dunn & Ellis
2005, Smedsgaard & Nielsen 2005). By combining such high-throughput metabolomics
methodologies with other ‘omics’ platforms it becomes possible to correlate yeast metabolism and
fermentative performance with the underlying gene expression patterns responsible for the overall
phenotype in this regard.
In this project, analyses based on the comparison of transcriptome and limited proteome and
metabolome datasets derived from different commercial yeast strains were employed to identify genes
which have a significant impact on interesting parts of the yeast metabolic network (under industrial
wine-making conditions). The strength of our methodology is the fact that five different wine yeast
strains were analysed at different time points during fermentation, as opposed to the single strain
analyses reported in previous studies. Having such multidimensional datasets available is essential to
achieving our principal goal of modeling wine yeast metabolism and predicting the effect of
perturbations to the metabolic network. By combining the different ‘omic’ datasets of several strains
5
within the framework of strain phenotypic data we were uniquely positioned to identify specific gene
expression programs that can be associated with particular traits of interest. Such areas of interest
include aroma compound production, flocculation responses and stress tolerance. A second important
aim was to understand the underlying genetic and regulatory factors that are responsible for the
phenotypic divergence of the different yeast strains used in industrial wine-making. The last important
outcome of this research pertains to the degree to which the different ‘omic’ datasets align with and
corroborate one another. Having different layers of ‘omic’ information available provided a unique
platform for cross-comparissons to evaluate the alignment of transcript and protein levels.
The ultimate goal of our comparative systems biology study was to increase our knowledge and
understanding of the metabolism and physiology of fermenting yeast in a holistic manner, as well as to
identify targets and design intelligent strategies for the directed enhancement of wine yeast strains.
References Alexandre H, Ansanay-Galeote V, Dequin S & Blondin B, 2001. Global gene expression during short-
term ethanol stress in Saccharomyces cerevisiae. FEBS Lett. 498, 98–103.
Ashby M & Rine J, 2006. Methods for drug screening. The Regents of the University of California.
Oakland, CA USA, Patent number: 5,569,588.
Coulon J, Husnik JI, Inglis DL, van der Merwe GK, Lonvaud A, Erasmus DJ & van Vuuren HJJ, 2006.
Metabolic engineering of Saccharomyces cerevisiae to minimize the production of ethyl carbamate in
wine. Am. J. Enol. Vitic. 57, 113-124.
Daran-Lapujade P, Jansen ML, Daran JM, van Gulik W, de Winde JH & Pronk JT, 2004. Role of
transcriptional regulation in controlling fluxes in central carbon metabolism of Saccharomyces
cerevisiae. A chemostat culture study. J. Biol. Chem. 279, 9125-9138.
Dunn W & Ellis D, 2005. Metabolomics: Current analytical platforms and methodologies. Trends
Anal. Chem. 24, 285–294.
6
Erasmus DJ, van der Merwe GK & van Vuuren HJJ, 2003. Genome-wide expression analyses:
metabolic adaptation of Saccharomyces cerevisiae to high sugar stress. FEMS Yeast Res. 3, 375–399.
Ge H et al., 2001. Correlation between trancriptome and interactome mapping data from
Saccharomyces cerevisiae. Nat. Genet. 29, 482-486.
Goffeau A et al., 1996. Life with 6000 genes. Science 274, 546, 563-567.
Gregoriev A, 2001. A relationship between gene expression and protein interactions on proteome scale:
analysis of the bacteriophage T7 and the yeast Saccharomyces cerevisiae. Nucleic Acids Res. 29, 3513-
3519.
Griffin TJ, Gygi SP, Ideker T, Rist B, Eng J, Hood L & Aebersold R, 2002. Complementary profiling
of gene expression at the transcriptome and proteome levels in Saccharomyces cerevisiae. Mol. Cell.
Proteomics 1, 323-333.
Husnik JI, Volschenk H, Bauer J, Colavizza D, Luo Z & van Vuuren HJJ, 2006. Metabolic engineering
of malolactic wine yeast. Metab. Eng. 8, 315-323.
Mann M et al., 2001. Analysis of proteins and proteomes by mass spectrometry. Annu. Rev. Biochem.
70, 437-473.
Marks VD, Ho Sui SJ, Erasmus D, van den Merwe GK, Brumm J, Wasserman WW, Bryan J & van
Vuuren HJJ, 2008. Dynamics of the yeast transcriptome during wine fermentation reveals a novel
fermentation stress response. FEMS Yeast Res. 8, 35-52.
Marullo P, Bely M, Masneuf-Pomarede I, Aigle M & Dubourdieu D, 2004. Inheritable nature of
enological quantitative traits is demonstrated by meiotic segregation of industrial wine yeast strains.
FEMS Yeast Res. 4, 711-719.
Mendes-Ferreira A, del Olmo M, Garcia-Martinez J, Jimenez-Marti E, Mendes-Faia A, Perez-
Ortin J.E & Leao C, 2007. Transcriptional response of Saccharomyces cerevisiae to different
nitrogen concentrations during alcoholic fermentation. Appl. Environ. Microbiol. 73, 3049–3060.

7
Peng J, Elias JE, Thoreen CC, Licklider LJ & Gygi SP, 2002. Evaluation of multidimensional
chromatography coupled with tandem mass spectrometry (LC/LC-MS/MS) for large-scale protein
analysis: The yeast proteome. J. Prot. Res. 2, 43-50.
Pretorius IS & Bauer FF, 2002. Meeting the consumer challenge through genetically customized wine-
yeast strains. Trends Biotech. 20, 426-432.
Rossignol T, Dulau L, Julien A & Blondin B, 2003. Genome-wide monitoring of wine yeast gene
expression during alcoholic fermentation. Yeast 20, 1369-1385.
Salvadó Z, Chiva R, Rodríguez-Vargas S, Rández-Gil F, Mas A, Guillamón JM, 2008. Proteomic
evolution of a wine yeast during the first hours of fermentation. FEMS Yeast Res. 8, 1137-1146.
Smedsgaard J & Nielsen J, 2005. Metabolite profiling of fungi and yeast: from phenotype to
metabolome by MS and informatics. J. Exp. Bot. 56, 273–286.
Tong AH et al., 2002. A combined experimental and computational strategy to define protein
interaction networks for peptide recognition modules. Science 295, 321-324.
Trabalzini L, Paffeti A, Scaloni A, Talamo F, Ferro E, Coratza G, Bovalini L, Lusini P, Martelli P,
Santucci A, 2003. Proteomic response to physiological fermentation stresses in a wild-type wine strain
of Saccharomyces cerevisiae. Biochem J. 370, 35-46.
Varela C, Cardenas J, Melo F & Agosin E, 2005. Quantitative analysis of wine yeast gene expression
profiles under winemaking conditions. Yeast 22, 369–383.
Walhout AJ et al., 2002. Integrating interactome, phenome, and transcriptome mapping data for the C.
elegans germline. Curr. Biol. 12, 1952-1958.
8
CChhaapptteerr 22
Literature review
Wine science in the omics era: The impact of systems
biology on the future of wine research
This manuscript was published in: South African Journal of Viticulture and Enology 2009, 30:101-109
Authors: Debra Rossouw & Florian F Bauer
9
CHAPTER 2
Wine science in the omics era: The impact of systems biology on the
future of wine research
2.1 Abstract Industrial wine making confronts viticulturalists, wine makers, process engineers and scientists alike
with a bewildering array of independent and semi-independent parameters that can in many cases only
be optimized by trial and error. Furthermore, as most parameters are outside of individual control,
predictability and consistency of the end product remain difficult to achieve. The traditional wine
sciences of viticulture and oenology have been accumulating data sets and generating knowledge and
know-how that has resulted in a significant optimization of the vine growing and wine making
processes. However, much of these processes remain based on empirical and even anecdotal evidence,
and only a small part of all the interactions and cause-effect relationships between individual input and
output parameters is scientifically well understood. Indeed, the complexity of the process has prevented
a deeper understanding of such interactions and causal relationships. New technologies and methods in
the biological and chemical sciences, combined with improved tools of multivariate data analysis, open
new opportunities to assess the entire vine growing and wine making process from a more holistic
perspective. This review outlines the current efforts to use the tools of systems biology in particular to
better understand complex industrial processes such as wine making.
2.2 Introduction Grapevine growing and wine making have been a part of human agricultural activity for thousands of
years. Today, grapes are the most planted fruit crop in the world, and the global wine industry has
become a multi-billion dollar business. Yet, the process of vine growing and wine making continues to
present tremendous challenges. The traditional wine sciences of viticulture and oenology are
challenged by the complexity of the process, and many studies, while reporting on the effects of
individual parameters, all too frequently fail to establish causality. The input variables in the vineyard
involve a large number of factors that influence the growth of the grapevine and the composition of the
grape berries, and in particular include many environmental factors such as soil, aspect, slope, and
climate. These factors interact with and impact on the genetic potential of individual grapevine
cultivars or rather individual plants. From a wine making perspective, the relevant end result of these
10
processes is defined by the chemical composition of the grape, otherwise known as the grape
metabolome (Cramer et al. 2007, Da Silva et al. 2005, Driesel et al. 2003). Traditional research on
grapevine biology (physiological, genetic and molecular approaches) has helped to establish broad
correlations between specific environmental factors and aspects of the final grape and must
composition. On the whole though, our current understanding of grapevine biology is curtailed by an
incomplete molecular map and limited knowledge regarding the genetic regulation of this complex
woody perennial.
On the oenological side many factors will contribute to transform and give expression to the grape
metabolome, and will impact on the character and quality of the final product. Such factors include the
treatment of the grapes and of the must before fermentation, the physical parameters prevalent during
fermentation, and the impact thereof on dynamic microbial ecosystem that will continuously adapt and
change while alcoholic fermentation proceeds. This wine fermentation ecosystem usually includes
numerous strains of lactic and acetic acid bacteria, as well as a large spectrum of yeast species and
other fungi. From an oenological perspective, the most relevant of these organisms is the scientifically
well studied yeast Saccharomyces cerevisiae. This yeast appears best adapted to the harsh
environmental conditions prevalent during wine fermentation, such as high osmotic pressure, low pH
and in particular the increasing levels of ethanol (Attfield, 1997). As a consequence, commercial wine
yeast strains indeed are almost exclusively of this species, and spontaneously fermenting musts also
usually end up with one or more S. cerevisiae strains as the dominant yeast (Frezier & Dubourdieu,
1992). For this reason most research on alcoholic fermentation has centered on this organism.
However, our current knowledge of grapevine and microbial biology and of the chemical processes that
result in a specific wine remains limited. This lack of knowledge and understanding significantly limits
our ability to further improve wine quality and consistency. In particular, modern biotechnological
approaches are knowledge-based, and we are only able to change or manipulate a biological system to
the extent that we understand its functioning. While the amount of data describing biological systems
has been increasing rapidly, this increase has been largely built on approaches that can be qualified as
reductionist. Such approaches focus on individual components, such as a single gene or protein within
a biological system, and have contributed tremendously to our understanding of biological systems, in
particular by mapping genetic and metabolic pathways and fluxes. However, they are inherently
incapable of elucidating the nature of the complex biological networks that characterize living
organisms. Ultimately, complex systems can only be interpreted by complex, high-level analyses.
11
With the recent development of new technologies in the biological and chemical sciences, as well as
improvements in statistical and interpretation tools, such high level analyses have become a feasible
option, and a unique opportunity exists to approach the analysis of biological systems in a holistic
manner. Hence the birth of systems biology as a novel approach to investigate biological processes on a
whole cell or whole organism level. Conveniently, S. cerevisiae also happens to be the traditional
model organism of choice for molecular and cellular biologists. For this reason, S. cerevisiae will be
the main focus of the following sections in this paper and will serve to highlight the role of ‘omic’-
applications in wine science and research.
2.3 Yeast biotechnology in the food and beverage industry
Indigenous fermented foods such as bread, cheese and wine have been prepared and consumed for
thousands of years, and it is estimated that fermented foods contribute to about one-third of the human
diet worldwide. Biotechnology in the food and beverage sector targets the selection and improvement
of yeast strains with the objectives of improving process control, yields and efficiency as well as the
quality, safety and consistency of the end-product (Wang & Hatzimanikatis, 2006).
Wine and beer represent the two most popular products of alcoholic fermentation processes. The
commercial yeast strains that are used in these processes have been primarily selected for their
fermentation efficiency. However, besides the conversion of sugars to alcohol and CO2, yeast
metabolism results in the production of a diversity of metabolites, including vitamins, antimicrobial
compounds, amino acids, organic acids (e.g. citric acid, lactic acid) and flavour compounds (e.g. esters
and aldehydes). These metabolites make an important contribution to the character and quality of the
final product, in particular with regard to aroma, flavour, and microbiological stability (Lambrechts &
Pretorius, 2000). A considerable volume of current research both in academia and industry therefore
targets the application of yeast biotechnology to improve fermentation efficiency and the production,
quality and yields of metabolites (Cereghino & Cregg, 1999; Stephanopoulos et al., 2004).
Traditional methods of genetic improvement such as classical mutagenesis and hybridization have been
used in the improvement of yeast strains which are widely used industrially in baking, brewing and
wine making (Pretorius & Bauer, 2002). Recombinant DNA approaches have also been used for
genetic modification of yeast strains to promote the expression of desirable genes, to hinder the
12
expression of others, to alter specific genes or to inactivate genes so as to block specific pathways. In
the field of wine science specifically, genetic modification of wine yeast for improved secretion of
oenologically relevant enzymes (Louw et al., 2006; Malherbe et al., 2003), production of aroma
compounds (Lilly et al., 2006 a, b), glycerol production (Cambon et al., 2006), malate degradation
(Volschenk et al., 1997 a, b) and decreased ethanol production (Heux et al., 2006) has proven to be
a feasible endeavour.
Several genetically modified yeasts appropriate for brewing, baking and wine making have been
approved for use, although, as far as can be ascertained, none of these strains have been widely used
commercially in the past. The possibilities for further engineering improved yeast strains are however
clearly enormous.
2.4 Systems biology background Metabolic engineering is the rational alteration of the genetic architecture of an organism to achieve a
specific phenotype (Bailey, 1991). Classic ‘bottleneck engineering’ targeting the so-called rate-limiting
steps in a pathway has only met with partial success. This is because cells are comprised of a complex
network of regulatory mechanisms that counteract genetic modifications such as those derived from
mutations by employing alternative pathways for continued robust performance (Farmer & Liao, 2000).
Control of metabolic processes is in part hierarchical, with information transfer occurring from the
genome to the transcriptional level, moving on to translation and finally enzyme activity. However,
feed-back loops among the different levels are numerous. ‘Omics’ technologies today can analyze and
monitor entire classes of biological macromolecules, such as DNA, RNA and proteins, as well as
metabolites on a whole cell, whole tissue, whole organism or whole population level (Brown &
Botstein, 1999; Bruggeman & Westerhoff, 2007). Such omics-based technologies have led to the
establishment of fields of expertise referred to as transcriptomics, proteomics and metabolomics,
depending on the specific layer of biological information that is being monitored. Ideally, in a systems
analysis approach, all biochemical components that are involved in the process of interest should be
monitored. While most of these analyses have thus far been focusing on quantification, other
technologies aim to determine the interactions between components (interactomics) and the genetic or
metabolic flux (fluxomics) within the system.
Taken together, such data can allow the reconstruction of in silico biological networks (Goryanin et al.,
1999). The properties of the reconstructed network are in principle amenable to mathematical
13
modeling, allowing incorporation into computer models that can be interrogated systematically to
predict biological functions and system responses to specific perturbations (Palsson, 2000; Price et al.,
2003).
The large volumes of data generated by these approaches necessitates concomitant development in
fields known as bioinformatics and multivariate data analysis (Palsson, 2002; Ge et al., 2003; Larsson
et al., 2006; Lavine & Workman, 2006). Fortunately for the wine sciences, S. cerevisiae retains its title
as one of the preferred model organism in the field of systems biology and bioinformatics as well. This
has meant that many cutting edge ‘omics’ technologies and supporting statistical analysis modules are
routinely available for research on wine yeast strains, as will be discussed in the following sections.
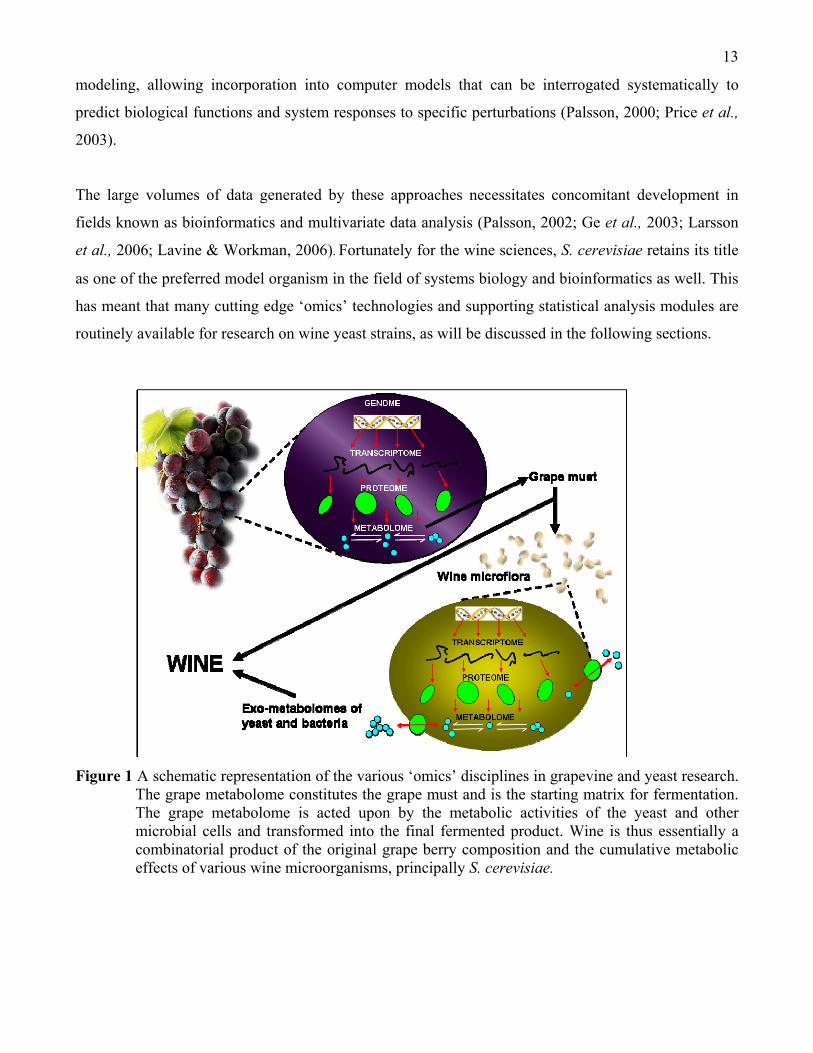
Figure 1 A schematic representation of the various ‘omics’ disciplines in grapevine and yeast research.
The grape metabolome constitutes the grape must and is the starting matrix for fermentation. The grape metabolome is acted upon by the metabolic activities of the yeast and other microbial cells and transformed into the final fermented product. Wine is thus essentially a combinatorial product of the original grape berry composition and the cumulative metabolic effects of various wine microorganisms, principally S. cerevisiae.
14
2.4.1 Genomics
The general starting point of any system-wide analysis is usually at the genome level, as phenotypic
features and changes therein are due to changes in the primary genome sequence of a particular
organism. Whole genome sequencing is the process whereby the complete DNA sequence of an
organism's genome is determined at a single time. This entails sequencing all of an organism's
chromosomal DNA as well as DNA contained in the mitochondria. Whole genome sequencing has
changed in the most profound way the manner in which scientists plan and perform research as gene
sequences have provided enabling information and resources for a wide variety of scientific
applications.
The most well known sequencing technique, called shotgun sequencing, is carried out by breaking up
DNA randomly into numerous small segments, which are sequenced using the chain termination
method. Multiple overlapping sequences are obtained by performing several rounds of fragmentation
and sequencing, followed by assembly of the fragments into a continuous sequence (Anderson, 1981).
Shotgun sequencing was the most advanced technique for sequencing genomes from about 1995-2005,
but newer technologies (such as nanopore and pyrosequencing technology) have emerged in recent
years (Ronaghi et al., 1998). Although these methods generate high volumes of data in a relatively
short space of time, the assembly process is much more computationally expensive, and coverage is
improved at the expense of accuracy.
S. cerevisiae was one of the first organisms to have its genome completely sequenced, more than 10
years ago (Goffeau et al., 1996). This breakthrough in yeast research opened the door for yeast
biologists to gain insight into yeast physiology on a molecular level. One of the main goals of genome
sequencing is to identify all the genes in an organism: Computational methods for protein-coding gene
identification are reasonably well developed, especially for compact genomes such as that of S.
cerevisiae, which has a coding density of around 75% (Goffeau et al., 1996). The genome of the
original S288c laboratory strain is thus well annotated, with clearly delineated coding regions and
regulatory elements, and is easily accessible to interested researchers.
In the case of wine yeast strains, however, increased complexity becomes an important factor: These
yeasts exhibit great variation in chromosome size and number in comparison to laboratory strains, and
are also aneuploid (Bakalinsky & Snow, 1990). Chromosomal changes include gain or loss of whole
chromosomes and large-scale deletions and/or duplications (Adams et al., 1992; Rachidi et al., 1999).
15
Unfortunately very few DNA sequences of wine yeasts have been published or are publicly accessible
in databases (Masneuf et al., 1998). Overall though, the sequence homology between the laboratory
strain S288c and wine yeasts is approximated at around 99% (Masneuf et al., 1998), which means that
sequence information from the S288c strain can be used for general systematic analysis of wine yeast
strains (Puig et al., 1998, 2000).
Recently a major milestone in wine yeast genomics was reached when the Australian Wine Research
Institute completed the genome sequencing of the commercial yeast AWRI1631 (Borneman et al.,
2008). Interestingly, about 0.6% of this sequence information differed from that of the laboratory strain
S288c, and extra DNA sequences (enough to carry at least 27 genes) were discovered in the wine yeast.
Three decades have passed since the invention of electrophoretic methods for DNA sequencing, and
advancements in the efficiency and cost-effectiveness of sequencing has made rapid sequencing of
small genomes financially and practically feasible. Various novel sequencing technologies are being
developed, as well as software tools for automated genome annotation, together aspiring to reduce costs
and time frames for genome analysis. This means that many more wine yeast genomes will be
sequenced and become publicly available in the near future. Comparative genomics will thus become a
major tool for the insightful interpretation of genomic data within the wine-making context.
2.4.2 Transcriptomics
As mentioned, system-wide endeavours tend to start at the genomic level, since phenotypic changes are
due to perturbations of gene sequence and transcriptional levels. In the decade following the
sequencing of the S. cerevisiae genome a whole suite of analysis tools were developed based on gene
sequence knowledge and functional annotation of 90% of the coding sequences in the yeast genome.
The challenge of large-scale functional genomics followed as the next key step in the pursuit of
complete understanding of yeast physiology and metabolism. Functional genomics, a relatively new
area of research, aims to determine patterns of gene expression and interaction in the genome. It can
provide an understanding of how yeast responds to environmental influences at the genetic level, and
should therefore allow adaptation of conditions to improve technological processes. Functional
genomics holds the potential to shed light on genetic differences allowing some strains to perform
better than others with regard to certain desirable processes. It also holds great promise for defining and
modifying elusive metabolic mechanisms used by yeast to adapt to different environmental conditions.

16
The technology of transcriptomics is a result of the convergence of several technologies, such as DNA
sequencing and amplification, synthesis of oligonucleotides, fluorescence biochemistry, and
computational statistics. It basically confers the ability to measure mRNA abundance (Lander, 1999),
which reveals the effects of the global physiological and metabolic control machinery on transcription
by identifying differentially expressed genes. It is thus possible to observe the expression of many, if
not all genes simultaneously, including those with unknown biological functions, as they are switched
on and off during normal growth, or while the yeast attempts to cope with ever-changing environmental
conditions such as those encountered during fermentation. By identifying similarities in the
transcriptional profile, the role of many previously uncharacterized genes was predicted, based on the
assumption that coexpressed genes are functionally related. An early example of such studies was the
identification of genes that were differentially expressed in S. cerevisiae in response to a metabolic
shift from growth on glucose to diauxic growth on glucose and ethanol (DeRisi et al., 1997).
Numerous yeast transcriptomics studies have also been conducted in chemostat cultures, which
revealed, among others, that growth-limiting nutrients have a profound impact on genome-wide
transcriptional responses of yeast to process perturbations and/or molecular genetic interventions (Boer
et al., 2003). Transcriptomic profiling of yeast exposed to various stress conditions has likewise
provided insights into the effects of those stresses on the cell at the transcriptional level (Gasch et al.,
2000, Gasch & Werner-Washburne, 2002; Kuhn et al., 2001). These examples of iterative perturbations
and systematic phenotype characterization (on a gene expression level) have yielded a plethora of
system insights that have revolutionized microbial biology.
Several transcriptomic studies have also been published for research conducted with wine yeast strains
(Erasmus et al., 2003; Mendes-Ferreira et al., 2007; Rossignol et al., 2003; Varela et al., 2005; Marks
et al., 2008; Rossouw & Bauer, 2008). These studies have illuminated the intrinsic genetic and
regulatory mechanisms involved in fermentation, and have greatly increased our understanding of this
important process.
17
2.4.3 Proteomics
Moving from the gene to the protein level brings us to proteomics, an approach aiming to identify and
characterize complete sets of proteins, and protein-protein interactions in a given species (Hartwell et
al., 1999; Ideker et al., 2001). An increased transcript level cannot be interpreted as evidence for a
contribution of the encoded protein to the cellular response in the immediate experimental context. But
even though gene expression might not relate directly to protein expression (Ideker et al., 2001), the
protein products of genes that are coexpressed under different conditions are often functionally related
with one another as part of the same pathway or complex (Grigoriev, 2001; Ge et al., 2001).
Considering, however, that transcript levels are not directly correlated to protein levels and in vivo
fluxes (Griffin et al., 2002; Washburn et al., 2003; Daran-Lapujade et al., 2004), large-scale
transcriptomic data sets need to be combined with other data subsets such that the overlapping set of
interactions provides more insightful and meaningful information on the system in question (Tong et
al., 2002). Combining many layers of systematic cell and molecular biology such as protein levels and
transcript expression data enables the construction of an accurate information matrix and a complete
cellular map (Walhout et al., 2002).
Genome-scale protein quantification is not yet feasible, but methods for determining relative levels of
protein between samples have been developed (Smolka et al., 2002). Conventional quantitative
proteome analysis utilizes two-dimensional (2D) gel electrophoresis (O’Farrell, 1975) to separate
complex protein mixtures followed by in-gel tryptic digestion and mass spectrometry for the
identification of protein. More than 1500 soluble proteins of yeast are detectable and well separated of
two-dimensional gels. This technique offers the opportunity to detect alterations in protein synthesis,
protein modifications, and protein degradation occurring in response to environmental or genetic
changes. However, the two-dimensional gel approach suffers from the low number of proteins which
are identified on the yeast protein map, as well as poor gel-to-gel reproducibility, the under-
representation of low-abundant and hydrophobic proteins and the poor dynamic range of detection (Fey
& Larsen, 2001; Rabilloud, 2002).
To overcome some of these limitations, high-throughput chromatography in combination with mass
spectrometry can be used for fast and accurate protein identification, as long as the protein/s already
exist/s uniquely in a sequence database (Mann et al., 2001). The most commonly used high-
performance liquid chromatographic (HPLC) approach for the separation of peptides from protein
digests in complex proteomic applications is 2D nano-liquid chromatography-mass spectrometry

18
(LC/MS). In this approach, a strong cation exchange (SCX) column is used for the first dimension and
a reversed phase (RP) column for the second (Nägele et al., 2004). A total of 1504 yeast proteins have
been unambiguously identified in a single analysis using this 2D chromatography approach coupled
with tandem mass spectrometry (MS/MS) (Peng et al., 2002).
In fermenting yeast, the first forays into proteomics have been reported, usually in conjunction with
transcriptomic or metabolomic analysis (Brejning et al., 2005; Salvadó et al., 2008). Such studies have
increased our knowledge regarding the growth phases of fermenting yeasts, and have suggested new
methodologies for optimization and control of growth during fermentation-based industrial
applications. Proteome studies of yeast responses to various stress conditions have also increased our
knowledge of the functional modules involved in yeast responses to specific environmental factors
(Vido et al., 2001; Kolkman et al., 2006).
Another important goal of functional proteomics is the identification of functional modules based on
the knowledge of protein action. Protein-protein interactions play a crucial role in elucidating the
nature of these mechanisms. Innovative methods for the cell-wide analysis of protein interactions and
signaling pathways have been developed in recent times (Templin et al., 2004). These include the high-
throughput yeast two-hybrid systems (Ito et al., 2001; Uetz et al., 2000), protein arrays (Walter et al.,
2000; Weiner et al., 2004; Zhu & Snyder, 2003), and fluorescence-based interaction assays (Hu &
Kerppola, 2003). In contrast to clustering genes, clustering protein interactions reveals modules which
have similar functionalities and are therefore more closely associated in bringing about a particular
response. For yeast specifically, the protein interactions from a wide range of experiments were
transformed into a weighted network, with the weights representing the experimentally determined
confidence levels for a particular interaction (Pereira-Leal et al., 2004). Such models of protein-protein
interactions in yeast form an invaluable framework for future analysis and evaluation of ‘omic’ data-
types.
2.4.4 Metabolomics
Strain phenotype characterization has relied primarily on transcript abundance and protein
measurements. Only rarely have small metabolites been included in the analysis of the system due to
difficulties in sampling and analyzing these molecules. The major complication is the rapid time scales
of change, or oscillations in the levels of metabolites in a pathway, even if this pathway is in a
balanced, unperturbed state of equilibrium. Small molecules also cover a wider range of chemical
19
characteristics than do RNA transcripts, for example, and are more difficult to measure simultaneously
(Dettmer et al., 2006).
Despite all the above-mentioned complications, advances in high-throughput methodologies in
analytical chemistry now allow the detection and relative quantification of a large number of
metabolites simultaneously (Dunn & Ellis 2005, Smedsgaard & Nielsen 2005). Gas
chromatography coupled to mass spectrometry allows high-throughput analysis in a relatively short
time and at a fairly low cost. The gas chromatograph separates metabolites while the mass spectrometer
identifies and quantifies metabolites corresponding to a given standard peak. Specifically, the chemical
analysis of wine has made tremendous progress over the last decade, and it is now possible to quantify
a large number of chemical compounds (both volatile and non-volatile) with relative accuracy. In
addition to the normal gas chromatography or liquid chromatography –mass spectrometry (GCMS or
LCMS), the development of two dimensional techniques has increased throughput and effectiveness by
allowing for the analysis of compounds with different physiochemical properties in one analysis
(Adahchour et al., 2006; Campo et al., 2006).
Metabolites are known to be involved as key regulators of systems homeostasis. As such, level changes
of specific groups of metabolites may be descriptive of systems responses to environmental
interventions. Their study is therefore a powerful approach for characterizing complex phenotypes, as
well as for identifying biomarkers for specific physiological responses. Globally assaying metabolic
states does present the opportunity to identify a more diverse set of active molecular relationships,
particularly in the context of high-level regulation of transcriptional and translational processes by
certain metabolites. Metabolic profiles can be used to define a ‘footprint’ of processes that occur in
response to developmental, genetic or environmental effects, and are thus useful in defining the cellular
phenotype (Allen et al., 2003). Metabolic data can also be incorporated into databases that integrate
transcription, protein-protein interactions and metabolism to identify multilevel subnetworks which are
activated in response to a given perturbation to the system.
To complement these types of analysis, chemometrics approaches have evolved to enable these large
data sets to be mined for information through multivariate analysis of multi-level datasets. The broader
metabolic state characterization of fermenting yeast should allow better understanding of the interplay
between different pathways and may enhance our ability to identify key cellular mechanisms (Çakir et
al., 2006). Metabolomics studies focused on yeast have been on the increase over the past few years
20
(Daran-Lapujade et al., 2004; Beltran et al., 2006; Kresnowati et al., 2006; Villas-Bôas et al., 2007),
and have provided new insights into molecular events associated with the responses of yeast to
environmental factors such as fermentation temperature and the availability of carbon substrates.
2.4.5 Fluxomics
Another noteworthy obstacle to the rational optimization of yeast for industrial purposes is the lack of a
reliable, global metabolic model that captures the majority of the stoichiometric, kinetic and regulatory
effects on metabolite interconversions and metabolic flux distribution through the cellular reaction
network (Edwards & Palsson, 2000). In order to gain full understanding of the metabolism of any
cell/tissue/organism, both levels of metabolites and their fluxes need to be studied. Flux determination
is thus an essential component of strain evaluation for metabolic engineering (Stephanopoulos, 1999).
Methods for flux measurement have been developed based on NMR and MS technologies which allow
accurate, high resolution measurements of pathway flux to be made using radiolabeled substrates, for
example Szyperski (1998). Metabolic fluxes can be used to characterize phenotypes and carbon flow in
a system due to any given perturbation (Nielsen, 2003) and forms an integral part of applications in
yeast systems biology and metabolic engineering.
Metabolic flux modeling can be used to capture the genome-scale systems properties of an organism's
metabolism and further facilitate the construction, validation, and predictive capabilities of models
constructed from ‘omic’ information (Sauer, 2004). For instance, constraint-based network models
have been developed using reaction stoicheometry to represent the biological network (Reed &
Palsson, 2003). Such models are built by connecting the metabolites and the reactions they participate
in to form a metabolic graph which is then applied to optimize the reaction rates (fluxes) given a
specific target function (ie biomass or fermentation product formation). These models have also been
invaluable in predicting the impact of gene deletions in several model organisms (Edwards et al., 2001;
Famili et al., 2003; Forster et al., 2003). Conveniently, genome-scale models have also been
constructed for yeast (Forster et al., 2003; Duarte et al., 2004), which means that predictions of carbon
flux distribution can be integrated with other ‘omics’ data types for interpretation purposes and to
further guide metabolic engineering strategies.
2.5.6 Interactomics
Ultimately, systems biology is faced with the formidable task of interpreting and contextualizing the
diverse sets of biological data from the various levels of ‘omic’ analysis with the aim to elucidate the
21
mechanisms behind complex biological phenomena. Comparisons of yeast transcriptomes and
proteomes under different cultivation conditions have shown that multilevel analysis is essential for
yeast systems biology (Kolkman et al., 2006) to avoid possibly missing the cause and effect
relationships from other stages which impact the system as a whole.
The significant advances in genome sequencing, transcription, and protein and metabolite profiling
have not always translated into successful metabolic engineering applications in yeast and other
microbial systems. This is mainly due to a breach in the incorporation of these large datasets into
meaningful models which explain how these components work in unison to produce the desired trait in
the cell (Vemuri & Aristidou, 2005). A comparative transcriptomic and exometabolomic analysis has
been successful in predicting the impact of changes in expression levels of individual genes on the
complex network of pathways that lead to the production of aroma compounds (Rossouw et al., 2008).
The final component of a successful systems biology study is thus within the sphere of interactomics,
which aims to integrate the transfer of information between the other phases of analysis with the use of
mathematical modeling and simulation tools (de Jong, 2002).
Cellular computational models are becoming crucial for the analysis of complex biological systems.
Various statistical methods, including pattern discovery and characterization tools, are available to
create links between large data sets and phenotypes. Given enough data, it becomes possible to extract
probabilistic models that can theoretically capture cellular interactions without prior knowledge of an
interaction network (Jeong et al., 2000; de Jong et al., 2003). By building these cellular models, a
comprehensive scaffold of molecular interactions is made available for mining to reveal a hierarchy of
signaling, regulatory and metabolic pathways. Pathway maps can be extracted from this scaffold using
computational models which identify the key components, interactions and influences required for
more detailed interrogation using data from transcriptome or proteome analyses (Ideker &
Lauffenberger, 2003).
To summarize, the yeast cell is an elaborate network of molecular and environmental interactions that
together bring about a highly complex phenotype. Understanding the functional consequences of the
biomolecular interactions that occur in the yeast is a pre-requisite to understanding the relationship
between yeast and must, and how each is changed by the other during the course of fermentation.
Although we are still limited in our understanding of regulatory phenomena from a global perspective,
high-throughput ‘omic’ techniques have the potential to provide such information. In particular, the

22
combination of comparative microarray datasets with existing models of yeast metabolism and
interaction networks offers the potential for in silico evaluation of biologically relevant gene expression
changes in the context of key areas of metabolism (Förster et al., 2003; Patil & Nielsen, 2005). This
approach is one of several accessible multi-level analyses that can be applied to fermenting yeast, and
holds great potential in terms of providing answers to scientific questions of fundamental importance.
2.5 Systems biology meets biotechnology The emergence of systems biology constitutes a massive paradigm shift for biotechnologists. The
switch from reductionist approaches in molecular biology to a new school of biological thought that is
dominated by integrative ‘big-picture’ thinking opens new perspectives for the design and
implementation of biotechnological approaches. The high throughput technologies of the post-genomic
era have effectively created a massive amount of largely unexplored datasets, mostly publicly available
in various databases. Systems biology may hold the key to assimilating all this information together
into coherent models that facilitate drug discovery and metabolic engineering, the two hubs of modern
biotechnology. There is undoubtedly a desperate need for novel alternatives to the hit-and-miss
approaches of bioprocess and bioproduct development in the past. A few systems biology companies
have already emerged in the last decade, mostly in the spheres of drug discovery and development, as
well as signal transduction. Global biotech companies such as Novartis have also embraced systems
biology divisions into the folds of their existing corporate structure (Mark, 2004). By using systems
biology approaches, established pharmaceutical companies have managed to drastically reduce their
‘screening to compound development’ periods in drug development for diabetes, obesity, arthritis,
asthma, several cancers and many more money-spinning diseases. Outside of healthcare, the same
opportunity for accelerated success exists for metabolic engineers as well.
Europe is taking the lead in the commercialization of ‘omics’-based biotechnology in metabolic
engineering. A well-known French company is collaborating with several large chemical companies to
genetically engineer bacterial strains capable of synthesizing valuable chemicals more economically
than conventional manufacturing processes. Other leaders in the field include a German company
involved in optimization of amino acid fermentation processes, as well as production of other
undisclosed high-value products via fermentation. Another Paris-based biotech subsidiary of a well
known seed producer is also using systems biology technology to characterize and manipulate plant
secondary metabolism (Mack, 2004).
23
Systems biology also has the potential to be a key role-player in the strain improvement arena of
biotechnology (Stephanopoulos et al., 2004). Successful exploitation of cellular complexity for strain
enhancement relies on a coordinated understanding of multiple cellular processes. Progress in this area
is thus dependent on the development of theoretical frameworks that facilitate the elucidation of
molecular mechanisms and the identification of genetic targets for modification. Strain improvement
does present a very specific and attainable goal in the context of systems biology, particularly in
combination with genetic tools such as the yeast overexpression and deletion libraries. Strains can be
modified by introducing specific transport, conversion or regulatory changes that result in flux
redistribution and improved production of desired compounds, or altered strain physiology. Clearly
innovative application of relevant technologies holds the potential to expedite insightful modifications
to yeast strains for application in the wine-making industry.
2.6 Conclusion The idea of wine science as a convergence of multidisciplinary scientific exploits is a well known and
established reality. Core sciences include biological, chemical, ecological, geological and sensory
sciences, as well as certain aspects of process and chemical engineering. As understood by everyone in
the field, the process of winemaking on a large-scale agricultural and industrial level involves
numerous interlinked factors that are to a large extent poorly characterized and even more poorly
controlled. While the more classic methods of scientific research will always remain an integral and
indispensable part of the biological sciences, a ceiling is eventually reached by these approaches which
can only be breached by holistic interdisciplinary techniques that integrate biological information into
knowledge-based models of complex systems. Systems biology has emerged as the scientific challenge
of present times, and looks set to hold this title for a few more years to come. In order to be able to
benefit from current and future scientific developments, wine science has to embrace the ‘omic’ era and
incorporate its toolbox of profiling technologies into standard research practices. A holistic approach
towards understanding the complex metabolic and regulatory phenomena that characterize living
systems will undoubtedly reveal many of the unknown interactions between genes, proteins, and
metabolites, facilitating the truly rational improvement of production processes and the development of
new biotechnological approaches to address current limitations of vine growing and wine making.
24
References Adahchour M, Beens J, Vreuls R & Brinkman U, 2006. Recent developments in comprehensive two-
dimensional gas chromatography (GCxGC) IV. Further applications, conclusions and perspectives.
Trends Anal. Chem. 25, 821–840.
Adams J, Puskas-Rozca S, Simlar J & Wilke CM, 1992. Adaptation and major chromosomal changes
in population of Saccharomyces cerevisiae. Curr. Biol. 22, 13-19.
Allen J, Davey HM, Broadhurst D, Heald JK, Rowland JJ, Oliver SG & Kell DB, 2003. High-
throughput classification of yeast mutants for functional genomics using metabolic footprinting. Nat.
Biotechnol. 21, 692-696.
Anderson S, 1981. Shotgun DNA sequencing using cloned DNase 1-generated fragments. Nucl. Acids
Res. 9, 3015-3027.
Attfield PV, 1997. Stress tolerance: the key to effective strains of baker’s yeast. Nat. Biotechnol. 15,
1351-1357.
Bailey J, 1991. Toward a science of metabolic engineering. Science 252, 1668–1675.
Bakalinsky AT & Snow R, 1990. The chromosomal constitution of wine strains of Saccharomyces
cerevisiae. Yeast 6, 367– 382.
Beltran G, Novo M, Leberre V, Sokol S, Labourdette D, Guillamon J-M, Mas A, François J & Rozes
N, 2006. Integration of transcriptomic and metabolic analyses for understanding the global response of
low-temperature winemaking fermentations. FEMS Yeast Res. 6, 1167-1183.
Boer VM, de Winde JH, Pronk JT & Piper MD, 2003. The genome-wide transcriptional responses of
Saccharomyces cerevisiae grown on glucose in aerobic chemostat cultures limited for carbon, nitrogen,
phosphorus or sulfur. J. Biol. Chem. 278, 3265-3274.
25
Borneman AR, Forgan A, Pretorius IS & Chambers PJ, 2008. Comparative genome analysis of a
Saccharomyces cerevisiae wine strain. FEMS Yeast Res. 8, 1185-1195.
Brejning J, Arneborg N & Jespersen L, 2005. Identification of genes and proteins induced during the
lag and early exponential phase of lager brewing yeasts. J. Appl. Microbiol. 98, 261-271.
Brown PO & Botstein D, 1999. Exploring the new world of the genome with microarrays. Nat. Genet.
21, 33-37.
Bruggeman FJ & Westerhoff HV, 2007. The nature of systems biology. Trends Microbiol. 15, 45–50.
Çakır T, Patil KR, Önsan ZI, Ülgen KO, Kirdar B & Nielsen J, 2006. Integration of metabolome data
with metabolic networks reveals reporter reactions. Molecular Systems Biology 2, 50.
Cambon B, Monteil V, Remize F, Camarasa C & Dequin S, 2006. Effects of GPD1 overexpression in
Saccharomyces cerevisiae commercial wine yeast strains lacking ALD6 genes. Appl. Environ.
Microbiol. 72, 4688–4694.
Campo E, Ferreira V, Lopez R, Escudero A & Cacho J, 2006. Identification of three novel compounds
in wine by means of a laboratory-constructed multidimensional gas chromatographic system. J. Chrom.
A. 1122, 202–208.
Cereghino GP & Cregg JM, 1999. Applications of yeast in biotechnology: protein production and
genetic analysis. Curr. Opin. Biotechnol. 10, 422-427.
Cramer G, Cushman JC & Cook DR, 2005. Characterizing the grape transcriptome. Analysis of
expressed sequence tags from multiple Vitis species and development of a compendium of gene
expression during berry development. Plant Physiol. 139, 574–597.
Cramer G, Ergül A, Grimplet J, Tillett R, Tattersall E, Bohlman M, Vincent D, Sonderegger J, Evans
J, Osborne C, Quilici D, Schlauch K, Schooley D & Cushman J, 2007. Water and salinity stress in
grape-vines: early and late changes in transcript and metabolite profiles. Funct. Integr. Genomics 7,
111–134.

26
Daran-Lapujade P, Jansen ML, Daran JM, van Gulik W, de Winde JH & Pronk JT, 2004. Role of
transcriptional regulation in controlling fluxes in central carbon metabolism of Saccharomyces
cerevisiae. A chemostat culture study. J. Biol. Chem. 279, 9125-9138.
Da Silva F, Iandolino A, Al-Kayal F, Bohlmann M, Cushman M, Lim H, Ergul A, Figueroa R,
Kabuloglu E, Osborne C, Rowe J, Tatter-sall E, Leslie A, Xu J, Baek J, DeRisi JL, Iyer VR & Brown
PO, 1997. Exploring the metabolic and genetic control of gene expression on a genomic scale. Science
278, 680–686.
de Jong H, 2002. Modeling and simulation of genetic regulatory systems: a literature review. J.
Comput. Biol. 9, 69–105.
de Jong H, Geiselmann J, Hernandez C & Page M, 2003. Genetic Network Analyzer: Qualtitative
simulation of genetic regulatory networks. Bioinformatics 19, 336-344.
Dettmer K, Aronov PA & Hammock BD, 2006. Mass spectrometry-based metabolomics. Mass Spec.
Rev. 26, 51-78.
Driesel A, Lommele A, Drescher B, Topfer R, Bell M, Cartharius I, Cheutin N, Huck J-F, Kubiak J,
& Regnard P, 2003. Towards the transcriptome of grapevine (Vitis vinifera L.) Acta Hort. 603, 239–
250.
Duarte NC, Herrgård MJ & Palsson BO, 2004. Reconstruction and validation of Saccharomyces
cerevisiae iND750, a fully compartmentalized genome-scale metabolic model. Genome Res. 14, 1298-
1309.
Dunn W & Ellis D, 2005. Metabolomics: Current analytical platforms and methodologies. Trends
Anal. Chem. 24, 285–294.
Edwards JS & Palsson B, 2000. The Escherichia coli MG1655 in silico metabolic genotype: Its
definition, characteristics, and capabilities. Proc. Natl. Acad. Sci. USA 97, 5528-5533.
27
Edwards JS, Ibarra RU & Palsson BO, 2001. In silico predictions of Escherichia coli metabolic
capabilities are consistent with experimental data. Nat. Biotechnol. 19, 125–130.
Erasmus DJ, van der Merwe GK & van Vuuren HJJ, 2003. Genome-wide expression analyses:
Metabolic adaptation of Saccharomyces cerevisiae to high sugar stress. FEMS Yeast Res. 3, 375–399.
Famili I, Forster J, Nielsen J & Palsson BO, 2003. Saccharomyces cerevisiae phenotypes can be
predicted by using constraint-based analysis of a genome-scale reconstructed metabolic network. Proc.
Natl. Acad. Sci. USA 100, 13134–13139.
Farmer WR & Liao JC, 2000. Improving lycopene production in Escherichia coli by engineering
metabolic control. Nat. Biotechnol. 18, 533–537.
Fey SJ & Larsen PM, 2001. 2D or not 2D. Two-dimensional gel electrophoresis. Curr. Opin. Chem.
Biol. 5, 26-33.
Forster J, Famili I, Fu P, Palsson BO & Nielsen J, 2003. Genome-scale reconstruction of the
Saccharomyces cerevisiae metabolic network. Genome Res. 13, 244–253.
Forster J, Famili I, Palsson BO & Nielsen J, 2003. Large-scale evaluation of in silico gene deletions in
Saccharomyces cerevisiae. Omics 7, 193–202.
Frezier V & Dubourdieu D, 1992. Ecology of yeast strain Saccharomyces cerevisiae during
spontaneous fermentation in a Bordeaux winery. Am. J. Enol. Vitic. 43, 375-380.
Gasch A, Spellman P, Kao C, Carmel-Harel O, Eisen M, Storz G, Botstein D & Brown P, 2000.
Genomic expression changes in the response of yeast cells to environmental changes. Mol. Biol. Cell
11, 4241-4257.
Gasch AP & Werner-Washburne M, 2002. The genomics of yeast responses to environmental stress
and starvation. Funct. Integr. Genomics 2, 181-192.
28
Ge H, Liu Z, Church GM & Vidal M, 2001. Correlation between trancriptome and interactome
mapping data from Saccharomyces cerevisiae. Nat. Genet. 29, 482-486.
Ge H, Walhout AJ & Vidal M, 2003. Integrating ‘omic’ information: a bridge between genomics and
systems biology. Trends Genet. 19, 551-560.
Goffeau A, Barrell BG, Bussey H, Davis RW, Dujon B, Feldmann H, Galibert F, Hoheisel JD, Jacq C,
Johnston M, Louis EJ, Mewes HW, Murakami Y, Philippsen P, Tettelin H & Oliver SG, 1996. Life
with 6000 genes. Science 274, 563-567.
Goryanin I, Hodgman TC & Selkov E, 1999. Bioinformatics 15, 749-758.
Gregoriev A, 2001. A relationship between gene expression and protein interactions on proteome scale:
analysis of the bacteriophage T7 and the yeast Saccharomyces cerevisiae. Nucl. Acids Res. 29, 3513-
3519.
Griffin TJ, Gygi SP, Ideker T, Rist B, Eng J, Hood L & Aebersold R, 2002. Complementary profiling
of gene expression at the transcriptome and proteome levels in Saccharomyces cerevisiae. Mol. Cell
Proteomics 1, 323-333.
Hartwell LH, Hopfield JJ, Leibler S & Murray AW, 1999. From molecular to modular cell biology.
Nature 402, C47-C52.
Heux S, Sablayrolles JM, Cachon R & Dequin S, 2006. Engineering a Saccharomyces cerevisiae wine
yeast that exhibits reduced ethanol production during fermentation under controlled
microoxygenation conditions. Appl. Environ. Microbiol. 72, 5822–5828.
Hu CD & Kerppola TK, 2003. Simultaneous visualization of multiple protein interactions in living
cells using multicolor fluorescence complementation analysis. Nat. Biotechnol. 21, 539–545.
Ideker T, Galitski T & Hood L, 2001. A new approach to decoding life: systems biology. Annu. Rev.
Genomics Hum. Genet. 2, 343-372.
29
Ideker T, Thorsson V, Ranish JA, Christmas R, Christmas R, Buhler J, Eng JK, Bumgarner R, Goodlett
DR, Aebersold R & Hood L, 2001. Integrated genomic and proteomic analyses of a systematically
perturbed metabolic network. Science 292, 929-934.
Ideker T & Lauffenberger D, 2003. Building with a scaffold: emerging strategies for high- to low-level
cellular modeling. Trends Biotechnol. 21, 255-262.
Ito T, Chiba T & Yoshida M, 2001. Exploring the protein interactome using comprehensive two-hybrid
projects. Trends Biotechnol. 19, S23–S27.
Jeong H, Tombor B, Albert R, Oltvai ZN & A-L Barabasi, 2000. The large-scale organization of
metabolic networks. Nature 407, 651-654.
Kolkman A, Daran-Lapujade P, Fullaondo A, Olsthoorn MMA, Pronk JT, Slijper M & Heck AJR,
2006. Proteome analysis if yeast response to various nutrient limitations. Mol. Sys. Biol. 2, 2006.0026.
Kuhn KM, DeRisi JL, Brown PO & Sarnow P, 2001. Global and specific translational regulation in the
genomic response of Saccharomyces cerevisiae to a rapid transfer from a fermentable to a
nonfermentable carbon source. Mol. Cell. Biol. 21, 916-927.
Kresnowati MT, van Winden WA, Almering MJ, ten Pierick A, Ras C, Knijnenburg TA, Daran-
Lapujade P, Pronk JT, Heijnen JJ & Daran JM, 2006. When transcriptome meets metabolome: fast
cellular responses of yeast to sudden relief of glucose limitation. Mol. Syst. Biol. 2, 49.
Lambrechts MG & Pretorius IS, 2000. Yeast and its importance to wine aroma. S. Afr. J. Enol. Vitic.
21, 97-129.
Lander ES, 1999. Array of hope. Nat. Genet. 21, 3–4.
Larsson O, Wennmalm K & Sandberg R, 2006. Comparative microarray analysis. Omics 10, 381–397.
30
Lavine B & Workman J, 2006. Chemometrics. Anal. Chem. 78, 4137–4145.
Lilly M, Bauer FF, Styger G, Lambrechts MG & Pretorius IS, 2006. The effect of increased branched-
chain amino acid transaminase activity in yeast on the production of higher alcohols and on the flavour
profiles of wine and distillates. FEMS Yeast Res. 6, 726–743.
Louw C, La Grange D, Pretorius IS & van Rensburg P, 2006. The effect of polysaccharide-degrading
wine yeast transformants on the effciency of wine processing and wine flavour. Biotechnol. 125, 447–
461.
Mack GS, 2004. Can complexity be commercialized? Nat. Biotechnol. 22, 1223-1229.
Malherbe DF, du Toit M, Cordero Otero RR, van Rensburg P & Pretorius IS, 2003. Expression of the
Aspergillus niger glucose oxidase gene in Saccharomyces cerevisiae and its potential applications in
wine production. Appl. Microbiol. Biotechnol. 61, 502–551.
Mann M, Hendricksen RC & Pandey A, 2001. Analysis of proteins and proteomes by mass
spectrometry. Annu. Rev. Biochem. 70, 437-473.
Marks VD, Ho Sui SJ, Erasmus D, van den Merwe GK, Brumm J, Wasserman WW, Bryan J & van
Vuuren HJJ, 2008. Dynamics of the yeast transcriptome during wine fermentation reveals a novel
fermentation stress response. FEMS Yeast Res. 8, 35-52.
Masneuf I, Hansen J, Groth C, Piskur J & Dubourdieu D, 1998. New hybrids between Saccharomyces
sensu stricto yeast species found among wine and cider production strains. Appl. Environ. Microbiol.
64, 3887-3892.
Mendes-Ferreira A, del Olmo M, Garcia-Martinez J, Jimenez-Marti E, Mendes-Faia A, Perez-Ortin
J.E & Leao C, 2007. Transcriptional response of Saccharomyces cerevisiae to different nitrogen
concentrations during alcoholic fermentation. Appl. Environ. Microbiol. 73, 3049–3060.
Nägele E, Vollmer M & Hörth P, 2004. Improved 2D nano-LC/MS for proteomics applications: A
comparative analysis using yeast proteome. J. Biomol. Tech. 15, 134-143.
31
Nielsen J, 2003. It’s all about metabolic fluxes. J. Bacteriol. 185, 7031–7035.
O’Farrell PH, 1997. High resolution two-dimensional electrophoresis of proteins. J. Biol. Chem. 250,
4007-4021.
Palsson BO, 2000. The challenges of in silico biology. Nat. Biotechnol. 18, 1147-1150.
Palsson BO, 2002. In silico biology through ‘omics’. Nat. Biotechnol. 20, 649-650.
Patil KR & Nielsen J, 2005. Uncovering transcriptional regulation of metabolism by using metabolic
network topology. PNAS 102, 2685-2689.
Peng J, Elias JE, Thoreen CC, Licklider LJ & Gygi SP, 2002. Evaluation of multidimensional
chromatography coupled with tandem mass spectrometry (LC/LC-MS/MS) for large-scale protein
analysis: The yeast proteome. J. Proteome Res. 2, 43-50.
Pereira-Leal JB, Enright AJ & Ouzounis CA, 2004. Detection of functional modules from protein
interaction networks. Proteins 54, 49–57.
Pretorius IS & Bauer FF, 2002. Meeting the consumer challenge through genetically customised
wine yeast strains. Trends Biotechnol. 20, 426–432.
Price ND, Papin JA, Schilling CH & Palsson B, 2003. Trends Biotechnol. 21, 162-169.
Puig S, Ramón D, Pérez-Ortin JE, 1998. Optimized method to obtain stable food-safe recombinant
wine yeast strains. J. Agric. Food Chem. 46, 1689-1693.
Puig S & Pérez-Ortin JE, 2000. Stress response and expression patterns in wine fermentation of yeast
genes induced at the diaxic shift. Yeast 16, 139-148.
Rabilloud T, 2002. Two-dimensional gel electrophoresis in proteomics: old, old fashioned, but it still
climbs the mountains. Proteomics 2, 3-10.
32
Rachidi N, Barre P & Blondin B, 1999. Multiple Ty-mediated chromosomal translocation lead to
karyotype changes in a wine strain of Saccharomyces cerevisiae. Mol. Gen. Genet. 261, 841–850.
Reed J L & Palsson BO, 2003. Thirteen years of building constraint-based in silico models of
Escherichia coli. J. Bacteriol. 185, 2692–2699.
Ronaghi M, Uhlén M & Nyrén P, 1998. A sequencing method based on real-time pyrophosphate.
Science 281, 363, 365.
Rossignol T, Dulau L, Julien A & Blondin B, 2003. Genome-wide monitoring of wine yeast gene
expression during alcoholic fermentation. Yeast 20, 1369-1385.
Rossouw D, Naes T & Bauer FF, 2008. Linking gene regulation and the exo-metabolome: A
comparative transcriptomics approach to identify genes that impact on the production of volatile aroma
compounds in yeast. BMC Genomics 9, 530.
Salvadó Z, Chiva R, Rodriguez-Vargas S, Rández-Gil F, Mas A & Guillamón JM, 2008. Proteomic
evolution of a wine yeast during the first hours of fermentation. FEMS Yeast Res. 8, 1137-1146.
Sauer U, 2004. High-throughput phenomics: experimental methods for mapping fluxomes. Curr. Opin.
Biotechnol. 15, 58–63.
Smolka M, Zhou H & Aebersold R, 2002. Quantitative protein profiling using two-dimensional gel
electrophoresis, isotope-coded affinity tag labeling, and mass spectrometry. Mol. Cell. Proteomics 1,
19-29.
Stephanpoulos G, 1999. Metabolic fluxes and metabolic engineering. Metab. Eng. 1, 1-10.
Stephanopoulos G, Alper H, Moxley, 2004. Exploiting biological complexity for strain improvement
through systems biology. Nat. Biotechnol. 22, 1261-1267.
33
Smedsgaard J & Nielsen J, 2005, Metabolite profiling of fungi and yeast: from phenotype to
metabolome by MS and informatics. J. Exp. Bot. 56, 273–286.
Szyperski T, 1998. 13C-NMR, MS and metabolic flux balancing in biotechnology research. Q. Rev.
Biophys. 31, 41–106.
Templin M F, Stoll D, Bachmann J & Joos TO, 2004. Protein microarrays and multiplexed sandwich
immunoassays: what beats the beads? Comb. Chem. High Throughput Screen. 7, 223–229.
Tong AH, Drees B, Nardelli G, Bader GD, Brannetti B, Castagnoli L, Evangelista M, Ferracuti S,
Nelson B, Paoluzi S, Quondam M, Zucconi A, Hoque CW, Fields S, Boone C & Cesareni G, 2002. A
combined experimental and computational strategy to define protein interaction networks for peptide
recognition modules. Science 295, 321-324.
Uetz P, Giot L, Cagney G, Mansfield TA, Judson RS, Knight JR, Lockshon D, Narayan V, Srinivasan
M, Pochart P, Qureshi-Emili A, Li Y, Godwin B, Conover D, Kalbfleisch T, Vijayadamodar G, Yang
M, Johnson M, Fields S & Rothberg JM, 2000. A comprehensive analysis of protein-protein
interactions in Saccharomyces cerevisiae. Nature 403, 623-627.
Varela C, Cardenas J, Melo F & Agosin E, 2005. Quantitative analysis of wine yeast gene expression
profiles under winemaking conditions. Yeast 22, 369–383.
Vemuri GN & Aristidou AA, 2005. Metabolic engineering in the –omics era: Elucidating and
modulating regulatory networks. Microbiol. Mol. Biol. R. 69, 197-216.
Vido K, Spector D, Lagniel G, Lopez S, Toledano MB & Labarre J, 2001. A proteome analysis of the
Cadmium response in Saccharomyces cerevisiae. J. Biol. Chem. 276, 8469-8474.
Villas-Bôas SG, Roessner U, Hansen MAE, Smedsgaard J & Nielsen J, 2007. Yeast Metabolomics:
The discovery of new metabolic pathways in Saccharomyces cerevisiae. In: Metabolome Analysis.
John Wiley & Sons, Inc.
34
Volschenk, H., M. Viljoen, J. Grobler, B. Petzold, F. Bauer, R.E. Subden, R.A. Young, A. Lonvaud-
Funel, M. Denayrolles & H.J.J. van Vuuren. 1997. Engineering pathways for malate degradation in
Saccharomyces cerevisiae. Nat. Biotechnol. 15, 253-257.
Volschenk, H., M. Viljoen, J. Grobler, F. Bauer, A. Lonvaud-Funel, M. Denayrolles, R.E. Subden &
HJJ van Vuuren. 1997. Malolactic fermentation in grape musts by a genetically engineered strain of
Saccharomyces cerevisiae. Am. J. Enol. Vitic. 48, 193-197.
Walhout AJ,Reboul J, Shtanko O, Bertin N, Vaglio P, Ge H, Lee H, Doucette-Stamm L, Gunsalus KC,
Schetter AJ, Morton DG, Kemphues KJ, Reinke V, Kim SK, Piano F & Vidal M, 2002. Integrating
interactome, phenome, and transcriptome mapping data for the C. elegans germline. Curr. Biol. 12,
1952-1958.
Walter G, Bussow K, Cahill D, Lueking A & Lehrach H, 2000. Protein arrays for gene expression and
molecular interaction screening. Curr. Opin. Microbiol. 3, 298–302.
Wang L & Hatzimanikatis V, 2006. Metabolic engineering under uncertainty. I: Framework
development. Metab. Eng. 8, 133-141.
Washburn MP, Ulaszek R, Deciu C, Schielts DM & Yates JR, 2002. Analysis of quantitative proteomic
data generated via multidimensional protein identification technology. Anal. Chem. 74, 1650-1657.
Weiner H, Faupel T & Bussow K, 2004. Protein arrays from cDNA expression libraries. Methods Mol.
Biol. 264, 1–13.
Westerhoff HV & Palsson BO, 2004. The evolution of molecular biology into systems biology. Nat.
Biotechnol. 22, 1249-1252.
Zhu H & Snyder M, 2003. Protein chip technology. Curr. Opin. Chem. Biol. 7, 55–63.
35
CChhaapptteerr 33
Research results
Linking gene regulation and the exo-metabolome: A
comparative transcriptomics approach to identify genes
that impact on the production of volatile aroma
compounds in yeast
This manuscript was published in: BMC Genomics 2008, 9:530
Authors:
Debra Rossouw, Tormod Næs* & Florian F Bauer
* Centre for Biospectroscopy and Data Modelling, NOFIMA FOOD, Matforsk AS, Oslovegen 1, 1430
Ås, Norway
36
CHAPTER 3
Linking gene regulation and the exo-metabolome: A comparative
transcriptomics approach to identify genes that impact on the
production of volatile aroma compounds in yeast
3.1 Abstract 3.1.1 Background
‘Omics’ tools provide novel opportunities for system-wide analysis of complex cellular functions.
Secondary metabolism is an example of a complex network of biochemical pathways, which, although
well mapped from a biochemical point of view, is not well understood with regards to its physiological
roles and genetic and biochemical regulation. Many of the metabolites produced by this network such
as higher alcohols and esters are significant aroma impact compounds in fermentation products, and
different yeast strains are known to produce highly divergent aroma profiles. Here, we investigated
whether we can predict the impact of specific genes of known or unknown function on this metabolic
network by combining whole transcriptome and partial exo-metabolome analysis.
3.1.2 Results
For this purpose, the gene expression levels of five different industrial wine yeast strains that produce
divergent aroma profiles were established at three different time points of alcoholic fermentation in
synthetic wine must. A matrix of gene expression data was generated and integrated with the
concentrations of volatile aroma compounds measured at the same time points. This relatively unbiased
approach to the study of volatile aroma compounds enabled us to identify candidate genes for aroma
profile modification. Five of these genes, namely YMR210W, BAT1, AAD10, AAD14 and ACS1 were
selected for overexpression in commercial wine yeast, VIN13. Analysis of the data show a statistically
significant correlation between the changes in the exo-metabome of the overexpressing strains and the
changes that were predicted based on the unbiased alignment of transcriptomic and exo-metabolomic
data.
3.1.3 Conclusion
The data suggest that a comparative transcriptomics and metabolomics approach can be used to identify
the metabolic impacts of the expression of individual genes in complex systems, and the amenability of
transcriptomic data to direct applications of biotechnological relevance.

37
3.2 Background
Commercial wine yeast strains have been selected to meet specific requirements of wine producers
with regard to phenotypical traits such as fermentation performance, general stress resistance, the
profile of aromatic compounds produced, the ability to release enzymes or mannoproteins of
oenological relevance and many more [1]. As a result, more than 200 different yeast strains, almost
exclusively of the species S. cerevisiae are currently produced and sold in the global industry. Many
research and development programs have focused on improving specific aspects of wine yeast strains
[1]. However, many of the relevant traits are of a polygenic nature, and our understanding of the
genetic and molecular regulation of complex, commercially relevant phenotypes is limited [2]. In this
paper, we investigate the possibility of using a holistic systems biology approach to identify genes that
impact on volatile aroma compound production during fermentation. The approach is based on
combining comparative transcriptomics and aroma metabolomics of five commercial wine yeast strains
that produce significantly different aroma profiles.
During alcoholic fermentation, S. cerevisiae strains convert sugars to ethanol, but also produce a large
number of volatile aroma compounds, including fatty acids, higher alcohols and esters (table 1).
Table 1 Exo-metabolites measured in this study Primary
metabolites Organic acids Higher alcohols Esters Acids Fatty Acids
Glucose Citrate Methanol Ethyl Acetate Valeric Acid Octanoic Acid
Fructose Malate Propanol Hexyl acetate Propionic Acid Decanoic Acid
Glycerol Acetate Isoamyl alcohol Isoamyl Acetate Iso-Valeric Acid Ethyl Caprylate
Ethanol 2-Phenyl Ethanol 2-Phenylethyl Acetate Iso-Butyric Acid Ethyl Lactate
Isobutanol Butyric Acid Ethyl Caprate
Butanol
Many of these compounds are important flavor and aroma compounds in wine and beer, and different
strains of S. cerevisiae are well known to impart significantly different aroma profiles to the final
product. The metabolic pathways responsible for the production of these compounds are responsive to
many factors including the availability of precursors, different types of stress, the cellular redox
potential and the energy status of the cell [3-11]. These pathways are not linear, but rather form a
network of interlinked reactions converging and diverging from shared intermediates (figure 1).
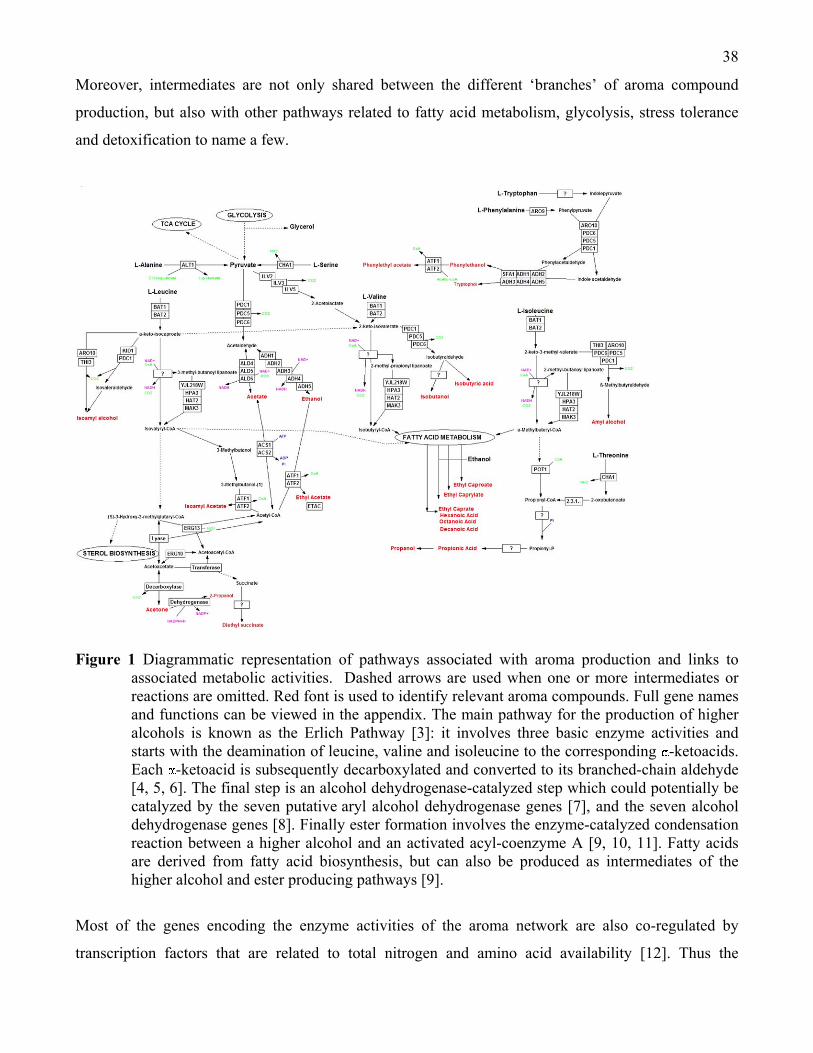
38
Moreover, intermediates are not only shared between the different ‘branches’ of aroma compound
production, but also with other pathways related to fatty acid metabolism, glycolysis, stress tolerance
and detoxification to name a few.
Figure 1 Diagrammatic representation of pathways associated with aroma production and links to
associated metabolic activities. Dashed arrows are used when one or more intermediates or reactions are omitted. Red font is used to identify relevant aroma compounds. Full gene names and functions can be viewed in the appendix. The main pathway for the production of higher alcohols is known as the Erlich Pathway [3]: it involves three basic enzyme activities and starts with the deamination of leucine, valine and isoleucine to the corresponding -ketoacids. Each -ketoacid is subsequently decarboxylated and converted to its branched-chain aldehyde [4, 5, 6]. The final step is an alcohol dehydrogenase-catalyzed step which could potentially be catalyzed by the seven putative aryl alcohol dehydrogenase genes [7], and the seven alcohol dehydrogenase genes [8]. Finally ester formation involves the enzyme-catalyzed condensation reaction between a higher alcohol and an activated acyl-coenzyme A [9, 10, 11]. Fatty acids are derived from fatty acid biosynthesis, but can also be produced as intermediates of the higher alcohol and ester producing pathways [9].
Most of the genes encoding the enzyme activities of the aroma network are also co-regulated by
transcription factors that are related to total nitrogen and amino acid availability [12]. Thus the
39
nutritional status of the cell as well as the nutrient composition of the growth media throughout
fermentation plays a vital role in determining the aroma profile produced by the fermenting yeast. A
further complication is due to the fact that very little is known about the kinetics of individual enzymes
involved in these pathways. What is clear is that a number of these enzymes are capable of catalyzing
both the forward and reverse reactions, depending on the ratios of substrates to end products, as well as
the prevailing redox balance of the cell [13-15]. The various dehydrogenase- catalyzed reactions which
are integral to most branches of aroma production are particularly sensitive to the ratios of enzyme co-
factors such as NAD and NADH, with obvious ramifications regarding the directionality of various key
reactions [16].
This intricate lattice of chemical and biological interactions makes interpretation of individual gene and
enzyme contributions problematic in the context of aroma compound production as a whole (figure 1).
Indeed, individual parts of the system can combine and interact in unexpected ways, giving rise to
emergent properties or functions that would not be anticipated by studying a single part of the system.
Such systems are thus irreducible, and cannot be understood by dissection and analysis of a single part
at a time. In recognition of the complex and intricate nature of this process we have sought to follow an
‘omics’ approach in the study of aroma compound production.
In the present study our goal was to compare the aroma-relevant exo-metabolomes of five industrial
yeast strains at three different stages of fermentation, and to align these data with gene expression data
obtained through microarray-based genome-wide transcription analysis. This enabled the incorporation
of gene expression levels and aroma compound production into multivariate statistical models. By
using these models as a predictive tool various genes were identified as potential candidates for
overexpression in order to increase / decrease the levels of key aroma compounds during fermentation.
To verify whether genes whose differential regulation appeared most strongly linked to the differences
observed in the aroma profiles of different strains were indeed impacting on aroma compound
metabolism, five of these genes were individually overexpressed in one of the industrial strains. The
data indicate that these genes indeed impacted significantly on the aroma profiles produced by the
modified strains. Moreover, the pattern of changes observed was significantly correlated to the pattern
predicted through the comparative analysis of transcriptome and metabolome. The data therefore
clearly support our hypothesis that direct comparative analysis of transcriptomes and metabolomes can
be used for the identification of genes that affect specific metabolic networks and for predicting the
impact of the expression of such genes on these networks.
40
3.3 Methods
3.3.1 Strains. media and culture conditions
The yeast strains used in this study are listed in table 2. All are diploid S. cerevisiae strains used in
industrial wine fermentations. Yeast cells were cultivated at 30oC in YPD synthetic media 1% yeast
extract (Biolab, South Africa), 2% peptone (Fluka, Germany), 2% glucose (Sigma, Germany). Solid
medium was supplemented with 2% agar (Biolab, South Africa).
Table 2 Yeast strains used in this study
Strain Source/ Reference
VIN13 Anchor Yeast, South Africa
EC1118 Lallemand Inc., Montréal, Canada
BM45 Lallemand Inc., Montréal, Canada
285 Lallemand Inc., Montréal, Canada
DV10 Lallemand Inc., Montréal, Canada
VIN13(pBAT1-s) Lilly et al., 2006
3.3.2 Fermentation medium
Fermentation experiments were carried out with synthetic must MS300 which approximates to a
natural grape must as previously described [17]. The medium contained 125 g/L glucose and 125 g/L
fructose, and the pH was buffered at 3.3 with NaOH.
3.3.3 Fermentation conditions
All fermentations were carried out under microaerophilic conditions in 100 ml glass bottles (containing
80 ml of the medium) sealed with rubber stoppers with a CO2 outlet. The fermentation temperature was
approximately 22oC and no stirring was performed during the course of the fermentation. Fermentation
bottles were inoculated with YPD cultures in the logarithmic growth phase (around OD600 = 1) to an
OD600 of 0.1 (i.e. a final cell density of approximately 106 cfu.ml-1). The cells from the YPD pre-
cultures were briefly centrifuged and resuspended in MS300 to avoid carryover of YPD to the
fermentation media. The fermentations followed a time course of 14 days and the bottles were weighed
daily to assess CO2 release and the progress of fermentation. Samples of the fermentation medium and
41
cells were taken at days 2, 5 and 14 as representative of the exponential, early stationary and late
stationary growth phases respectively. It should be stressed that yeast cells in early stationary phase in
these conditions are metabolically active, since growth arrest is due to ethanol toxicity. Sugar levels
and fermentative activity are still high at this stage.
3.3.4 Growth measurement
Cell proliferation (i.e. growth) was determined spectrophotometrically (PowerwaveX, Bio-Tek
Instruments) by measuring the optical density (at 600 nm) of 200 µl samples of the suspensions over
the 14 day experimental period.
3.3.5 Analytical methods - HPLC
Culture supernatants were obtained from the cell-free upper layers of the fermentation media. For the
purposes of glucose determination and carbon recovery, culture supernatants and starting media were
analyzed by high performance liquid chromatography (HPLC) on an AMINEX HPX-87H ion exchange
column using 5 mM H2SO4 as the mobile phase. Agilent RID and UV detectors were used in tandem
for peak detection and quantification. Analysis was carried out using the HPChemstation software
package.
3.3.6 Analytical methods – GC-FID
Each 5 ml sample of synthetic must taken during fermentation was spiked with an internal standard of
4-methyl-2-pentanol to a final concentration of 10 mg.l-1. To each of these samples 1 ml of solvent
(diethyl ether) was added and the tubes sonicated for 5 minutes. The top layer in each tube was
separated by centrifugation at 3000 rpm for 5 minutes and the extract analyzed. After mixing, 3 μl of
each sample was injected into the gas chromatograph (GC). All extractions were done in triplicate.
The analysis of volatile compounds was carried out on a Hewlett Packard 5890 Series II GC coupled to
an HP 7673 auto-sampler and injector and an HP 3396A integrator. The column used was a Lab
Alliance organic-coated, fused silica capillary with dimensions of 60 m × 0.32 mm internal diameter
with a 0.5 μm coating thickness. The injector temperature was set to 200°C, the split ratio to 20:1 and
the flow rate to 15 ml.min 1, with hydrogen used as the carrier gas for a flame ionisation detector held
at 250°C. The oven temperature was increased from 35°C to 230°C at a ramp of 3°C min 1.
42
Internal standards (Merck, Cape Town) were used to calibrate the machine for each of the compounds
measured.
3.3.7 Statistical analysis of metabolite data
T-tests and anova analyses were conducted using Statistica (version 7). HCL and KMC clustering were
carried out using TIGR MeV v2.2 [18].
3.3.8 Microarray analysis
Sampling of cells from fermentations and total RNA extraction was performed as described [19]. Probe
preparation and hybridization to Affymetrix Genechip® microarrays were performed according to
Affymetrix instructions, starting with 6 μg of total RNA. Results for each strain and time point were
derived from three independent culture replicates. The quality of total RNA, cDNA, cRNA and
fragmented cRNA were confirmed using the Agilent Bioanalyzer 2100.
3.3.9 Transcriptomics data acquisition and statistical analysis
Acquisition and quantification of array images and data filtering were performed using Affymetrix
GeneChip® Operating Software (GCOS) version 1.4. All arrays were scaled to a target value of 500
using the average signal from all gene features using GCOS. Genes with expression values below 12
were set to 12 + the expression value as previously described in order to eliminate insignificant
variations [20].
Variable (gene) selection is important for the successful analysis of gene expression data since most of
the genes are unchanged and irrelevant to the prediction and analysis of phenotypic measurements.
These non-informative genes should be removed before further analysis. One approach is by
significance analysis of microarrays [21]. Determination of differential gene expression between
experimental parameters was conducted using SAM (Significance Analysis of Microarrays) version 2.
The two-class, unpaired setting was used and genes with a Q value less than 0.5 were considered
differentially expressed. Only genes with a fold change greater than 2 (positive or negative) for inter-
or intra- strain comparisons were taken into consideration.
43
3.3.10 Multivariate data analysis
In terms of design, the samples represent the different fermentations (three independent replicates for
each of the five strains) at different time points. The variables considered are the expression levels of
the pre-selected genes (genes with a potential and established role in aroma compound metabolism
according to GO and MIPS functional classification) as well as aroma compound concentrations in the
synthetic must. The patterns within the different sets of data were investigated by principal-component
analysis (PCA), while the correlations between different sets of data were determined by using partial
least-squares (PLS) regression (The Unscrambler; Camo Inc., Corvallis, Oreg.).
PCA is a bilinear modeling method which gives a visually interpretable overview of the main
information in large, multidimensional datasets. By plotting the principal components it is possible to
view statistical relationships between different variables in complex data sets and detect and interpret
sample groupings, similarities or differences, as well as the relationships between the different
variables [22].
PLS regression is a bilinear modeling method for identifying the variations in a data matrix for
explanatory or predictive purposes [23]. By plotting the first PLS components one can view main
associations between X variables and Y variables and also relationships within X data and within Y
data. PLS2 analysis was conducted using all X and Y variables considered in our study. For predictive
purposes, PLS1 models were constructed for individual Y variables to increase model-specificity and
reliability.
The data were analyzed by using test-set validation with centered data and the variables were weighted
according to their standard deviations. One strain was used as the test segment at each of the time
points. Day 2 and 5 data were considered together as representative of the full scope of fermentation
variability as the period from the start of fermentation until day 5 represents the period of maximum
aroma compound production. The Y variables were the respective aroma compounds measured and the
X variables were the gene expression levels of the gene set that was pre-selected for analysis [24].
Genes were selected based on known or putative functions related to amino acid transport, metabolism,
regulation etc. as well as other enzymatic or regulatory activity in pathways leading to the production
of higher alcohols and esters. The same set of genes (X variables) was used for each of the different
PLS1 models.
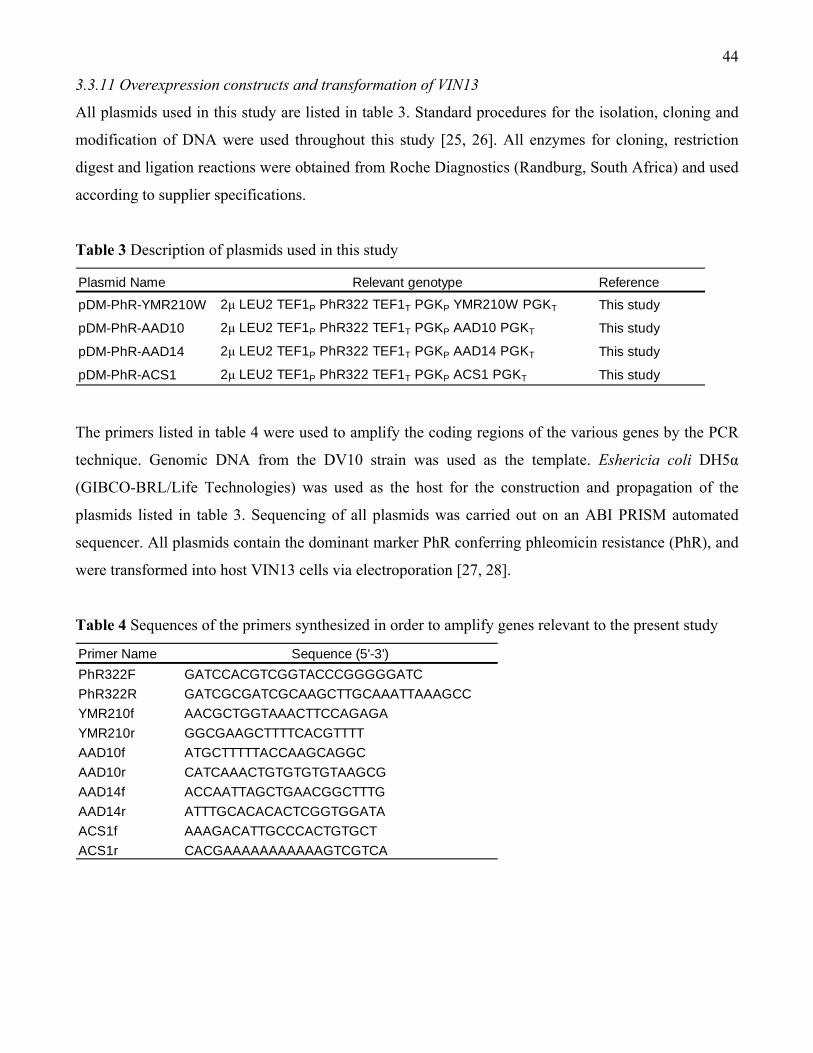
44
3.3.11 Overexpression constructs and transformation of VIN13
All plasmids used in this study are listed in table 3. Standard procedures for the isolation, cloning and
modification of DNA were used throughout this study [25, 26]. All enzymes for cloning, restriction
digest and ligation reactions were obtained from Roche Diagnostics (Randburg, South Africa) and used
according to supplier specifications.
Table 3 Description of plasmids used in this study
Plasmid Name Relevant genotype Reference
pDM-PhR-YMR210W 2μ LEU2 TEF1P PhR322 TEF1T PGKP YMR210W PGKT This study
pDM-PhR-AAD10 2μ LEU2 TEF1P PhR322 TEF1T PGKP AAD10 PGKT This study
pDM-PhR-AAD14 2μ LEU2 TEF1P PhR322 TEF1T PGKP AAD14 PGKT This study
pDM-PhR-ACS1 2μ LEU2 TEF1P PhR322 TEF1T PGKP ACS1 PGKT This study
The primers listed in table 4 were used to amplify the coding regions of the various genes by the PCR
technique. Genomic DNA from the DV10 strain was used as the template. Eshericia coli DH5α
(GIBCO-BRL/Life Technologies) was used as the host for the construction and propagation of the
plasmids listed in table 3. Sequencing of all plasmids was carried out on an ABI PRISM automated
sequencer. All plasmids contain the dominant marker PhR conferring phleomicin resistance (PhR), and
were transformed into host VIN13 cells via electroporation [27, 28].
Table 4 Sequences of the primers synthesized in order to amplify genes relevant to the present study
Primer NamePhR322F GATCCACGTCGGTACCCGGGGGATCPhR322R GATCGCGATCGCAAGCTTGCAAATTAAAGCCYMR210f AACGCTGGTAAACTTCCAGAGAYMR210r GGCGAAGCTTTTCACGTTTTAAD10f ATGCTTTTTACCAAGCAGGCAAD10r CATCAAACTGTGTGTGTAAGCGAAD14f ACCAATTAGCTGAACGGCTTTGAAD14r ATTTGCACACACTCGGTGGATAACS1f AAAGACATTGCCCACTGTGCTACS1r CACGAAAAAAAAAAAGTCGTCA
Sequence (5'-3')
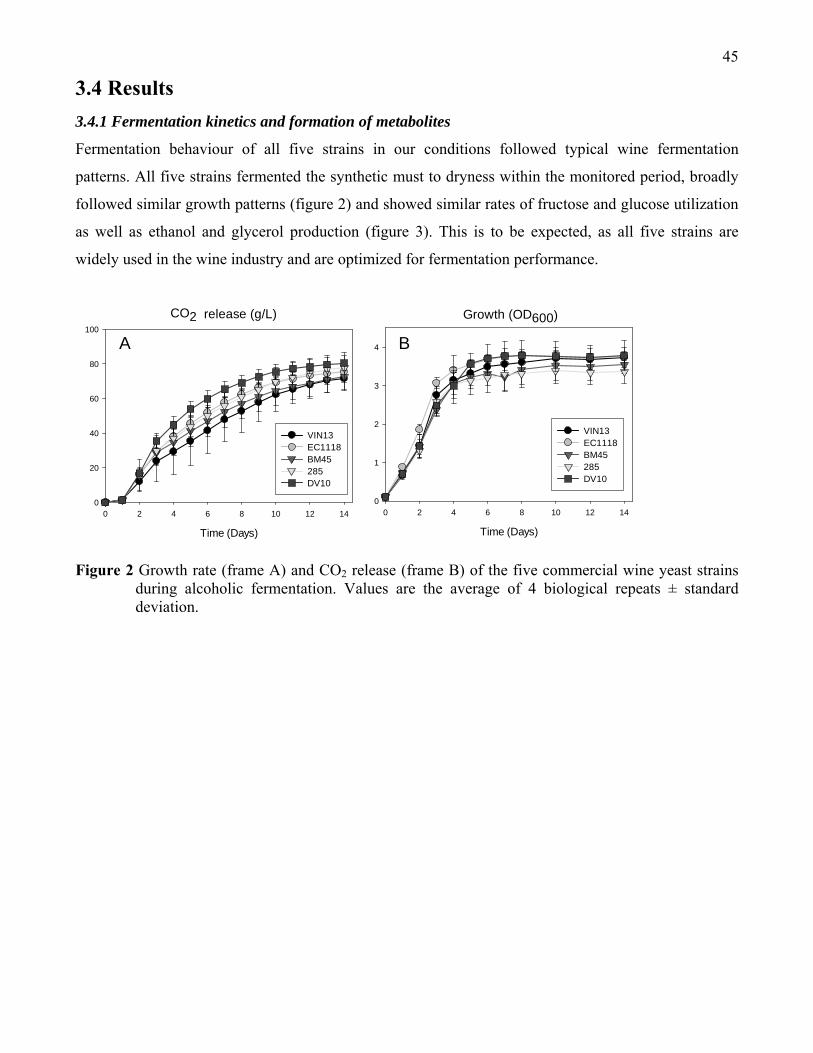
45
3.4 Results 3.4.1 Fermentation kinetics and formation of metabolites
Fermentation behaviour of all five strains in our conditions followed typical wine fermentation
patterns. All five strains fermented the synthetic must to dryness within the monitored period, broadly
followed similar growth patterns (figure 2) and showed similar rates of fructose and glucose utilization
as well as ethanol and glycerol production (figure 3). This is to be expected, as all five strains are
widely used in the wine industry and are optimized for fermentation performance.
Figure 2 Growth rate (frame A) and CO2 release (frame B) of the five commercial wine yeast strains
during alcoholic fermentation. Values are the average of 4 biological repeats ± standard deviation.
Growth (OD600)
Time (Days)
0 2 4 6 8 10 12 140
1
2
3
4
CO2 release (g/L)
Time (Days)
0 2 4 6 8 10 12 140
20
40
60
80
100
VIN13EC1118BM45285DV10
VIN13EC1118BM45285DV10
A B
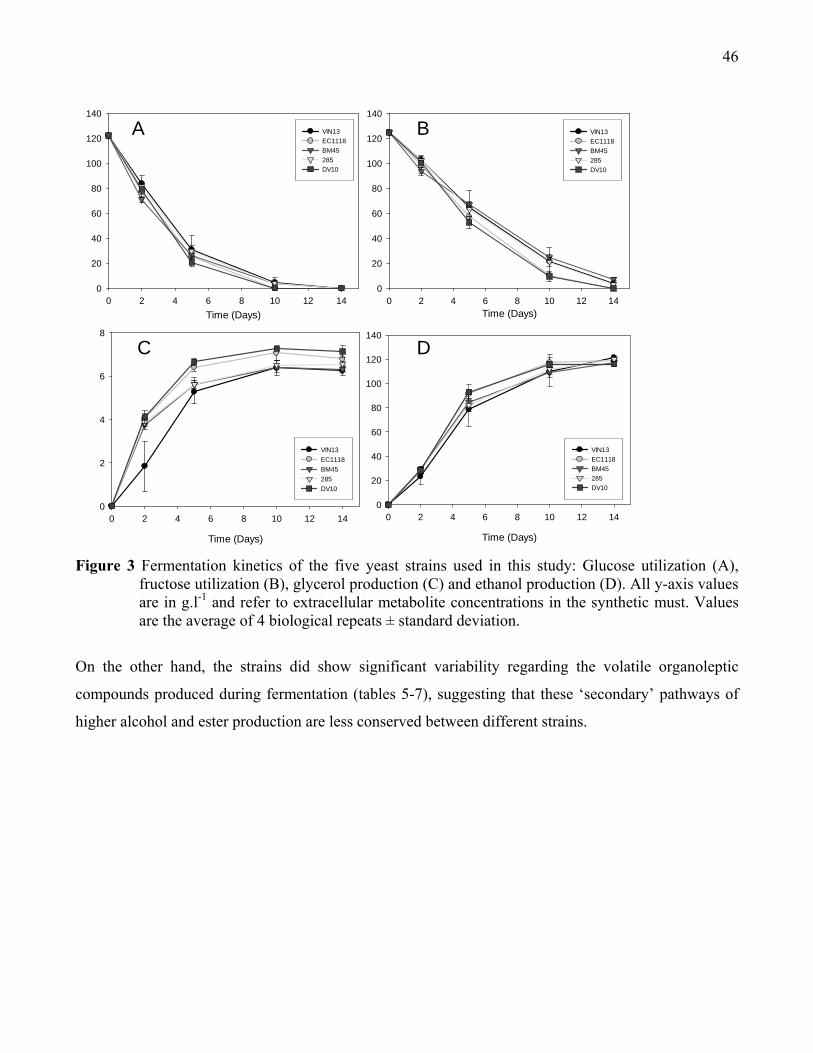
46
Figure 3 Fermentation kinetics of the five yeast strains used in this study: Glucose utilization (A),
fructose utilization (B), glycerol production (C) and ethanol production (D). All y-axis values are in g.l-1 and refer to extracellular metabolite concentrations in the synthetic must. Values are the average of 4 biological repeats ± standard deviation.
On the other hand, the strains did show significant variability regarding the volatile organoleptic
compounds produced during fermentation (tables 5-7), suggesting that these ‘secondary’ pathways of
higher alcohol and ester production are less conserved between different strains.
Time (Days)
0 2 4 6 8 10 12 140
2
4
6
8
VIN13EC1118BM45285DV10
Time (Days)0 2 4 6 8 10 12 14
0
20
40
60
80
100
120
140
Time (Days)0 2 4 6 8 10 12 14
0
20
40
60
80
100
120
140
Time (Days)
0 2 4 6 8 10 12 140
20
40
60
80
100
120
140
VIN13EC1118BM45285DV10
VIN13EC1118BM45285DV10
VIN13EC1118BM45285DV10
BA
C D
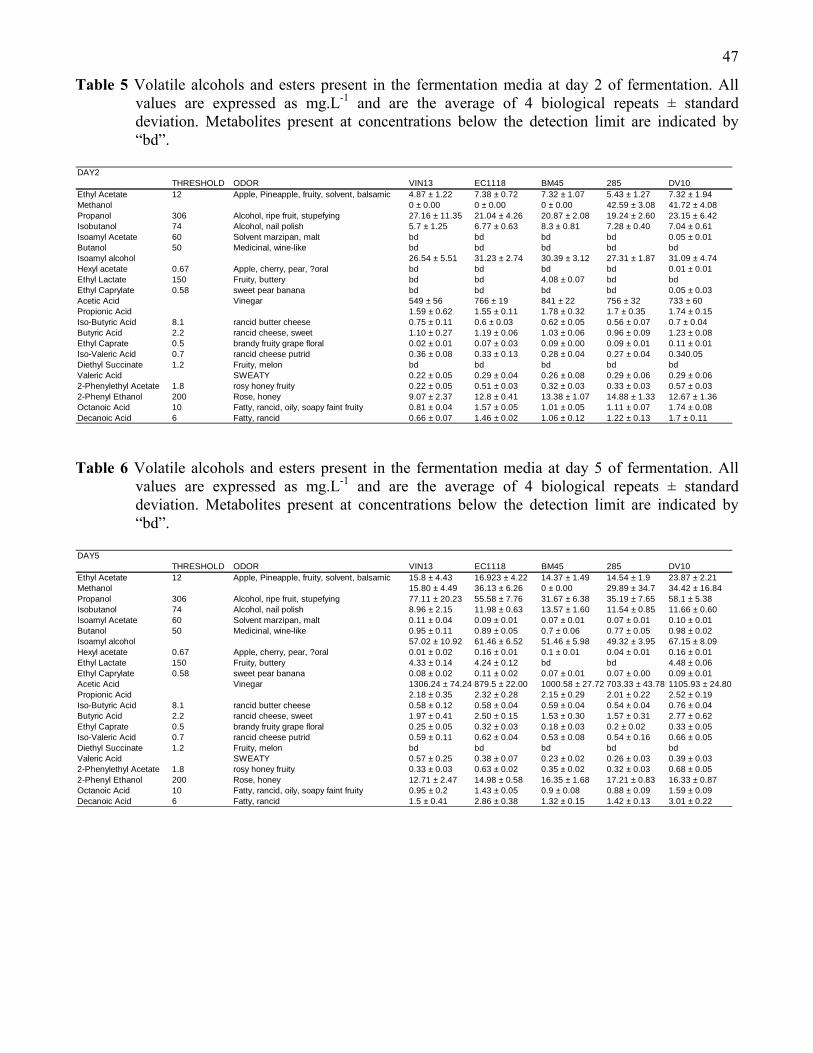
47
Table 5 Volatile alcohols and esters present in the fermentation media at day 2 of fermentation. All values are expressed as mg.L-1 and are the average of 4 biological repeats ± standard deviation. Metabolites present at concentrations below the detection limit are indicated by “bd”.
DAY2
THRESHOLD ODOR VIN13 EC1118 BM45 285 DV10Ethyl Acetate 12 Apple, Pineapple, fruity, solvent, balsamic 4.87 ± 1.22 7.38 ± 0.72 7.32 ± 1.07 5.43 ± 1.27 7.32 ± 1.94Methanol 0 ± 0.00 0 ± 0.00 0 ± 0.00 42.59 ± 3.08 41.72 ± 4.08Propanol 306 Alcohol, ripe fruit, stupefying 27.16 ± 11.35 21.04 ± 4.26 20.87 ± 2.08 19.24 ± 2.60 23.15 ± 6.42Isobutanol 74 Alcohol, nail polish 5.7 ± 1.25 6.77 ± 0.63 8.3 ± 0.81 7.28 ± 0.40 7.04 ± 0.61Isoamyl Acetate 60 Solvent marzipan, malt bd bd bd bd 0.05 ± 0.01Butanol 50 Medicinal, wine-like bd bd bd bd bdIsoamyl alcohol 26.54 ± 5.51 31.23 ± 2.74 30.39 ± 3.12 27.31 ± 1.87 31.09 ± 4.74Hexyl acetate 0.67 Apple, cherry, pear, ?oral bd bd bd bd 0.01 ± 0.01Ethyl Lactate 150 Fruity, buttery bd bd 4.08 ± 0.07 bd bdEthyl Caprylate 0.58 sweet pear banana bd bd bd bd 0.05 ± 0.03Acetic Acid Vinegar 549 ± 56 766 ± 19 841 ± 22 756 ± 32 733 ± 60Propionic Acid 1.59 ± 0.62 1.55 ± 0.11 1.78 ± 0.32 1.7 ± 0.35 1.74 ± 0.15Iso-Butyric Acid 8.1 rancid butter cheese 0.75 ± 0.11 0.6 ± 0.03 0.62 ± 0.05 0.56 ± 0.07 0.7 ± 0.04Butyric Acid 2.2 rancid cheese, sweet 1.10 ± 0.27 1.19 ± 0.06 1.03 ± 0.06 0.96 ± 0.09 1.23 ± 0.08Ethyl Caprate 0.5 brandy fruity grape floral 0.02 ± 0.01 0.07 ± 0.03 0.09 ± 0.00 0.09 ± 0.01 0.11 ± 0.01Iso-Valeric Acid 0.7 rancid cheese putrid 0.36 ± 0.08 0.33 ± 0.13 0.28 ± 0.04 0.27 ± 0.04 0.340.05Diethyl Succinate 1.2 Fruity, melon bd bd bd bd bdValeric Acid SWEATY 0.22 ± 0.05 0.29 ± 0.04 0.26 ± 0.08 0.29 ± 0.06 0.29 ± 0.062-Phenylethyl Acetate 1.8 rosy honey fruity 0.22 ± 0.05 0.51 ± 0.03 0.32 ± 0.03 0.33 ± 0.03 0.57 ± 0.032-Phenyl Ethanol 200 Rose, honey 9.07 ± 2.37 12.8 ± 0.41 13.38 ± 1.07 14.88 ± 1.33 12.67 ± 1.36Octanoic Acid 10 Fatty, rancid, oily, soapy faint fruity 0.81 ± 0.04 1.57 ± 0.05 1.01 ± 0.05 1.11 ± 0.07 1.74 ± 0.08Decanoic Acid 6 Fatty, rancid 0.66 ± 0.07 1.46 ± 0.02 1.06 ± 0.12 1.22 ± 0.13 1.7 ± 0.11
Table 6 Volatile alcohols and esters present in the fermentation media at day 5 of fermentation. All values are expressed as mg.L-1 and are the average of 4 biological repeats ± standard deviation. Metabolites present at concentrations below the detection limit are indicated by “bd”.
DAY5
THRESHOLD ODOR VIN13 EC1118 BM45 285 DV10Ethyl Acetate 12 Apple, Pineapple, fruity, solvent, balsamic 15.8 ± 4.43 16.923 ± 4.22 14.37 ± 1.49 14.54 ± 1.9 23.87 ± 2.21Methanol 15.80 ± 4.49 36.13 ± 6.26 0 ± 0.00 29.89 ± 34.7 34.42 ± 16.84Propanol 306 Alcohol, ripe fruit, stupefying 77.11 ± 20.23 55.58 ± 7.76 31.67 ± 6.38 35.19 ± 7.65 58.1 ± 5.38Isobutanol 74 Alcohol, nail polish 8.96 ± 2.15 11.98 ± 0.63 13.57 ± 1.60 11.54 ± 0.85 11.66 ± 0.60Isoamyl Acetate 60 Solvent marzipan, malt 0.11 ± 0.04 0.09 ± 0.01 0.07 ± 0.01 0.07 ± 0.01 0.10 ± 0.01Butanol 50 Medicinal, wine-like 0.95 ± 0.11 0.89 ± 0.05 0.7 ± 0.06 0.77 ± 0.05 0.98 ± 0.02Isoamyl alcohol 57.02 ± 10.92 61.46 ± 6.52 51.46 ± 5.98 49.32 ± 3.95 67.15 ± 8.09Hexyl acetate 0.67 Apple, cherry, pear, ?oral 0.01 ± 0.02 0.16 ± 0.01 0.1 ± 0.01 0.04 ± 0.01 0.16 ± 0.01Ethyl Lactate 150 Fruity, buttery 4.33 ± 0.14 4.24 ± 0.12 bd bd 4.48 ± 0.06Ethyl Caprylate 0.58 sweet pear banana 0.08 ± 0.02 0.11 ± 0.02 0.07 ± 0.01 0.07 ± 0.00 0.09 ± 0.01Acetic Acid Vinegar 1306.24 ± 74.24 879.5 ± 22.00 1000.58 ± 27.72 703.33 ± 43.78 1105.93 ± 24.80Propionic Acid 2.18 ± 0.35 2.32 ± 0.28 2.15 ± 0.29 2.01 ± 0.22 2.52 ± 0.19Iso-Butyric Acid 8.1 rancid butter cheese 0.58 ± 0.12 0.58 ± 0.04 0.59 ± 0.04 0.54 ± 0.04 0.76 ± 0.04Butyric Acid 2.2 rancid cheese, sweet 1.97 ± 0.41 2.50 ± 0.15 1.53 ± 0.30 1.57 ± 0.31 2.77 ± 0.62Ethyl Caprate 0.5 brandy fruity grape floral 0.25 ± 0.05 0.32 ± 0.03 0.18 ± 0.03 0.2 ± 0.02 0.33 ± 0.05Iso-Valeric Acid 0.7 rancid cheese putrid 0.59 ± 0.11 0.62 ± 0.04 0.53 ± 0.08 0.54 ± 0.16 0.66 ± 0.05Diethyl Succinate 1.2 Fruity, melon bd bd bd bd bdValeric Acid SWEATY 0.57 ± 0.25 0.38 ± 0.07 0.23 ± 0.02 0.26 ± 0.03 0.39 ± 0.032-Phenylethyl Acetate 1.8 rosy honey fruity 0.33 ± 0.03 0.63 ± 0.02 0.35 ± 0.02 0.32 ± 0.03 0.68 ± 0.052-Phenyl Ethanol 200 Rose, honey 12.71 ± 2.47 14.98 ± 0.58 16.35 ± 1.68 17.21 ± 0.83 16.33 ± 0.87Octanoic Acid 10 Fatty, rancid, oily, soapy faint fruity 0.95 ± 0.2 1.43 ± 0.05 0.9 ± 0.08 0.88 ± 0.09 1.59 ± 0.09Decanoic Acid 6 Fatty, rancid 1.5 ± 0.41 2.86 ± 0.38 1.32 ± 0.15 1.42 ± 0.13 3.01 ± 0.22
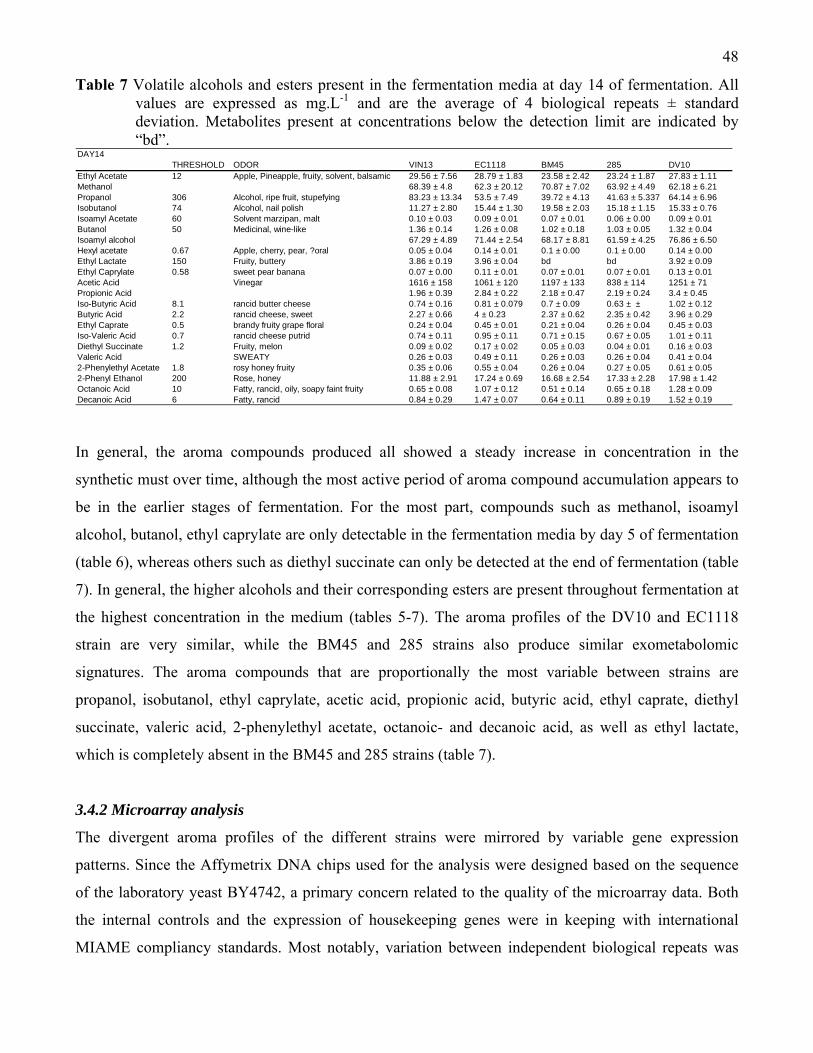
48
Table 7 Volatile alcohols and esters present in the fermentation media at day 14 of fermentation. All values are expressed as mg.L-1 and are the average of 4 biological repeats ± standard deviation. Metabolites present at concentrations below the detection limit are indicated by “bd”.
DAY14THRESHOLD ODOR VIN13 EC1118 BM45 285 DV10
Ethyl Acetate 12 Apple, Pineapple, fruity, solvent, balsamic 29.56 ± 7.56 28.79 ± 1.83 23.58 ± 2.42 23.24 ± 1.87 27.83 ± 1.11Methanol 68.39 ± 4.8 62.3 ± 20.12 70.87 ± 7.02 63.92 ± 4.49 62.18 ± 6.21Propanol 306 Alcohol, ripe fruit, stupefying 83.23 ± 13.34 53.5 ± 7.49 39.72 ± 4.13 41.63 ± 5.337 64.14 ± 6.96Isobutanol 74 Alcohol, nail polish 11.27 ± 2.80 15.44 ± 1.30 19.58 ± 2.03 15.18 ± 1.15 15.33 ± 0.76Isoamyl Acetate 60 Solvent marzipan, malt 0.10 ± 0.03 0.09 ± 0.01 0.07 ± 0.01 0.06 ± 0.00 0.09 ± 0.01Butanol 50 Medicinal, wine-like 1.36 ± 0.14 1.26 ± 0.08 1.02 ± 0.18 1.03 ± 0.05 1.32 ± 0.04Isoamyl alcohol 67.29 ± 4.89 71.44 ± 2.54 68.17 ± 8.81 61.59 ± 4.25 76.86 ± 6.50Hexyl acetate 0.67 Apple, cherry, pear, ?oral 0.05 ± 0.04 0.14 ± 0.01 0.1 ± 0.00 0.1 ± 0.00 0.14 ± 0.00Ethyl Lactate 150 Fruity, buttery 3.86 ± 0.19 3.96 ± 0.04 bd bd 3.92 ± 0.09Ethyl Caprylate 0.58 sweet pear banana 0.07 ± 0.00 0.11 ± 0.01 0.07 ± 0.01 0.07 ± 0.01 0.13 ± 0.01Acetic Acid Vinegar 1616 ± 158 1061 ± 120 1197 ± 133 838 ± 114 1251 ± 71Propionic Acid 1.96 ± 0.39 2.84 ± 0.22 2.18 ± 0.47 2.19 ± 0.24 3.4 ± 0.45Iso-Butyric Acid 8.1 rancid butter cheese 0.74 ± 0.16 0.81 ± 0.079 0.7 ± 0.09 0.63 ± ± 1.02 ± 0.12Butyric Acid 2.2 rancid cheese, sweet 2.27 ± 0.66 4 ± 0.23 2.37 ± 0.62 2.35 ± 0.42 3.96 ± 0.29Ethyl Caprate 0.5 brandy fruity grape floral 0.24 ± 0.04 0.45 ± 0.01 0.21 ± 0.04 0.26 ± 0.04 0.45 ± 0.03Iso-Valeric Acid 0.7 rancid cheese putrid 0.74 ± 0.11 0.95 ± 0.11 0.71 ± 0.15 0.67 ± 0.05 1.01 ± 0.11Diethyl Succinate 1.2 Fruity, melon 0.09 ± 0.02 0.17 ± 0.02 0.05 ± 0.03 0.04 ± 0.01 0.16 ± 0.03Valeric Acid SWEATY 0.26 ± 0.03 0.49 ± 0.11 0.26 ± 0.03 0.26 ± 0.04 0.41 ± 0.042-Phenylethyl Acetate 1.8 rosy honey fruity 0.35 ± 0.06 0.55 ± 0.04 0.26 ± 0.04 0.27 ± 0.05 0.61 ± 0.052-Phenyl Ethanol 200 Rose, honey 11.88 ± 2.91 17.24 ± 0.69 16.68 ± 2.54 17.33 ± 2.28 17.98 ± 1.42Octanoic Acid 10 Fatty, rancid, oily, soapy faint fruity 0.65 ± 0.08 1.07 ± 0.12 0.51 ± 0.14 0.65 ± 0.18 1.28 ± 0.09Decanoic Acid 6 Fatty, rancid 0.84 ± 0.29 1.47 ± 0.07 0.64 ± 0.11 0.89 ± 0.19 1.52 ± 0.19
In general, the aroma compounds produced all showed a steady increase in concentration in the
synthetic must over time, although the most active period of aroma compound accumulation appears to
be in the earlier stages of fermentation. For the most part, compounds such as methanol, isoamyl
alcohol, butanol, ethyl caprylate are only detectable in the fermentation media by day 5 of fermentation
(table 6), whereas others such as diethyl succinate can only be detected at the end of fermentation (table
7). In general, the higher alcohols and their corresponding esters are present throughout fermentation at
the highest concentration in the medium (tables 5-7). The aroma profiles of the DV10 and EC1118
strain are very similar, while the BM45 and 285 strains also produce similar exometabolomic
signatures. The aroma compounds that are proportionally the most variable between strains are
propanol, isobutanol, ethyl caprylate, acetic acid, propionic acid, butyric acid, ethyl caprate, diethyl
succinate, valeric acid, 2-phenylethyl acetate, octanoic- and decanoic acid, as well as ethyl lactate,
which is completely absent in the BM45 and 285 strains (table 7).
3.4.2 Microarray analysis
The divergent aroma profiles of the different strains were mirrored by variable gene expression
patterns. Since the Affymetrix DNA chips used for the analysis were designed based on the sequence
of the laboratory yeast BY4742, a primary concern related to the quality of the microarray data. Both
the internal controls and the expression of housekeeping genes were in keeping with international
MIAME compliancy standards. Most notably, variation between independent biological repeats was
49
negligible, giving us confidence in the reliability and reproducibility of our microarray analysis.
Furthermore, changes in gene expression during the course of fermentation matched up well to data
from related microarray analysis for the EC1118 [29] and VIN13 strains [30].
Between different time points approximately 1000-1500 genes significantly increased or decreased in
expression (within the criteria specified in the materials and methods section) for the five yeast strains
in our study. At the time points considered, the variation in gene expression between the different
strains was in the range of about 50-400 transcripts. Strains that appear to be most similar to one
another on a gene expression level were the EC1118 and DV10 strains, as well as the BM45 and 285
strains. The VIN13 strain was least similar to any of the other four strains. This pattern is in line with
the differences observed in aroma production for all of these strains.
Numerous and substantial changes in the expression of genes involved in pathways that lead to the
production of volatile aroma compounds were evident both between strains at comparable stages of
fermentation and for individual strains at different fermentative stages. To identify relevant
transcriptional variation in the context of aroma compound production, PCA analysis and PLS1 and
PLS2 models were constructed for the compounds in tables 5-7 using the transcriptomic data as X
variables. Transcriptomic data from days 2 and 5 were used for modeling purposes as these time points
represent the period when the accumulation rate of most aroma compounds is at a maximum. From
these models, transcripts with a strong positive or negative loading were selected for further in depth
statistical analysis. The corresponding ORFs, together with a brief annotation, are listed in the appendix
to this chapter.
The general intrastrain trend revealed a decrease in the transcript levels of enzymes involved in the
synthesis of aromatic and branched-chain amino acids, while transcript levels encoding aldehyde and
alcohol dehydrogenases, as well as certain acetyltransferases were generally increased. Fold changes
for differentially expressed transcripts, both between different strains at either day 2 or day 5 of
fermentation (tables 8 and 9) and between day 2 and day 5 in individual strains (table 10), are listed
below.

50
Table 8 List of aroma compound production -related transcripts significantly up/down regulated between different strains at day 2 of fermentation.
GENE ID
BM45 vs EC1118
BM45 vs VIN13
EC1118vs VIN13
DV10 vs VIN13
285 vs VIN13
DV10 vs EC1118
DV10 vs BM45
285 vs EC1118
285 vs BM45
DV10 vs 285
AAD3 2.28 1.72 -1.32 -1.43 1.46 -1.08 -2.47 1.93 -1.18 -2.09POT1 -1.05 1.80 1.88 1.75 2.25 -1.08 -1.03 1.19 1.25 -1.29LEU2 1.50 1.13 -1.33 -1.76 -3.63 -1.32 -1.98 -2.72 -4.08 2.06ALD3 -1.43 1.60 2.28 3.38 4.78 1.49 2.12 2.10 3.00 -1.41SFA1 1.09 1.14 1.05 1.15 1.66 1.10 1.01 1.58 1.45 -1.44EEB1 -1.44 1.25 1.80 1.63 -1.43 -1.10 1.30 -2.57 -1.79 2.33YJL218W -7.01 -7.88 -1.12 1.04 -6.75 1.17 8.22 -6.00 1.17 7.04ARO1 1.03 -1.43 -1.47 -1.39 -4.83 1.06 1.03 -3.28 -3.37 3.48ADH6 1.52 1.10 -1.37 -1.15 -3.25 1.20 -1.27 -2.37 -3.59 2.83ATF2 1.62 -1.02 -1.65 -1.46 -2.86 1.13 -1.43 -1.74 -2.81 1.96ARO10 2.18 1.31 -1.67 -4.62 -15.11 -2.77 -6.05 -9.05 -19.78 3.27PDC6 -1.13 1.18 1.33 1.10 1.05 -1.21 -1.07 -1.27 -1.12 1.04ALP1 2.20 4.32 1.96 2.02 -2.03 1.03 -2.14 -3.99 -8.79 4.11ALD5 1.14 1.06 -1.08 -1.20 -2.53 -1.12 -1.28 -2.35 -2.68 2.10ARO7 -1.16 -1.11 1.05 -1.13 -1.71 -1.19 -1.02 -1.79 -1.54 1.51ADH3 -1.06 -1.05 1.01 -1.21 -1.66 -1.22 -1.15 -1.68 -1.58 1.38ACS1 1.05 1.06 1.01 1.04 2.34 1.03 -1.02 2.33 2.21 -2.26GRE2 1.51 1.97 1.30 1.32 3.64 1.01 -1.50 2.79 1.84 -2.76HPA3 1.16 1.05 -1.10 -1.26 -3.32 -1.14 -1.32 -3.01 -3.48 2.64BAP3 -1.09 1.39 1.51 1.15 2.03 -1.31 -1.21 1.34 1.46 -1.76HAT2 1.04 -1.10 -1.14 -1.42 -1.03 -1.25 -1.29 1.10 1.06 -1.38ILV5 -1.24 -1.15 1.08 -1.24 -2.41 -1.34 -1.08 -2.60 -2.10 1.94ARO4 1.20 -1.13 -1.37 -1.70 -6.22 -1.24 -1.50 -4.56 -5.48 3.66ILV3 -1.34 -1.53 -1.14 -1.38 -5.55 -1.21 1.11 -4.86 -3.62 4.02ADH2 1.42 1.02 -1.39 -1.53 2.32 -1.10 -1.56 3.23 2.28 -3.55VBA3 3.25 11.31 3.48 4.54 -1.30 1.30 -2.49 -4.51 -14.65 5.88FDH1 /// FDH 3.80 3.74 -1.02 -1.03 4.01 -1.01 -3.84 4.08 1.07 -4.12AAD10 1.18 -1.96 -2.30 -1.62 -1.01 1.42 1.21 2.29 1.95 -1.61YJL045W -1.50 -1.48 1.01 1.02 2.44 1.01 1.51 2.41 3.60 -2.38PDC5 -3.05 -3.33 -1.09 -1.74 -6.19 -1.59 1.92 -5.68 -1.86 3.57ACS2 1.12 1.38 1.23 1.24 -1.78 1.01 -1.11 -2.19 -2.46 2.21BAP2 1.38 4.53 3.29 4.52 9.44 1.37 -1.00 2.87 2.09 -2.09ERG10 1.19 1.33 1.11 1.15 -1.16 1.03 -1.15 -1.30 -1.54 1.34ARO9 2.02 -1.24 -2.49 -5.85 -3.79 -2.35 -4.74 -1.52 -3.07 -1.54YMR041C 2.00 3.05 1.52 1.13 2.41 -1.35 -2.70 1.59 -1.26 -2.14ARO8 1.35 -1.07 -1.44 -2.04 -6.63 -1.41 -1.91 -4.61 -6.23 3.26ERG13 1.13 1.23 1.09 1.14 -1.65 1.05 -1.08 -1.79 -2.03 1.88ADR1 1.50 1.97 1.31 1.17 22.48 -1.12 -1.69 17.15 11.40 -19.21TAT1 1.32 1.52 1.15 -1.06 -1.06 -1.22 -1.61 -1.22 -1.61 1.00ILV1 -1.09 -1.10 -1.02 -1.47 -2.81 -1.45 -1.33 -2.77 -2.55 1.92ALD4 1.45 2.05 1.42 1.26 4.00 -1.12 -1.63 2.83 1.95 -3.17MAE1 -1.08 -1.75 -1.61 -3.14 -2.22 -1.95 -1.80 -1.37 -1.27 -1.42BAT2 1.46 1.39 -1.05 -1.34 1.18 -1.28 -1.87 1.24 -1.18 -1.58BDH1 1.65 1.65 -1.00 1.20 2.35 1.20 -1.37 2.35 1.43 -1.96LEU1 -1.36 -1.55 -1.13 -1.27 -1.31 -1.12 1.22 -1.16 1.18 1.03YMR210W 1.24 1.22 -1.02 -1.05 2.58 -1.03 -1.28 2.63 2.11 -2.71YGL039W 1.57 1.45 -1.08 -1.13 -3.35 -1.04 -1.64 -3.09 -4.86 2.97YGL157W -1.13 -1.05 1.07 -1.39 -2.87 -1.48 -1.31 -3.07 -2.72 2.07THI3 -1.18 -1.21 -1.03 -1.56 -1.01 -1.52 -1.29 1.01 1.20 -1.54ADH7 -1.89 -2.44 -1.30 -2.51 -4.90 -1.94 -1.03 -3.78 -2.00 1.95AYT1 17.30 2.50 -6.91 -6.86 2.45 1.01 -17.18 16.93 -1.02 -16.81TKL2 1.77 5.07 2.86 2.52 5.38 -1.14 -2.01 1.88 1.06 -2.14TMT1 3.10 3.05 -1.02 -1.05 1.18 -1.03 -3.19 1.20 -2.58 -1.24ADH4 1.08 -2.18 -2.36 -2.63 -2.24 -1.12 -1.21 1.05 -1.03 -1.18ALD6 1.08 1.51 1.40 1.14 -2.36 -1.23 -1.33 -3.31 -3.57 2.69CHA1 -1.05 4.30 4.49 1.17 -2.08 -3.84 -3.68 -9.33 -8.93 2.43TKL1 -1.00 -1.05 -1.05 -1.26 -3.77 -1.21 -1.20 -3.60 -3.59 2.98BAT1 -1.09 -1.18 -1.08 -1.62 -3.07 -1.50 -1.37 -2.86 -2.61 1.90GRE3 1.19 1.65 1.38 1.77 2.39 1.28 1.08 1.73 1.45 -1.35EHT1 1.37 -1.03 -1.40 -1.56 1.90 -1.11 -1.52 2.67 1.95 -2.97ADH5 1.36 1.48 1.09 1.08 1.86 -1.01 -1.38 1.72 1.26 -1.73ILV6 -1.02 -1.09 -1.07 -2.25 -4.47 -2.11 -2.07 -4.19 -4.11 1.98MAK3 -1.53 -2.39 -1.56 -1.37 -1.80 1.14 1.75 -1.15 1.33 1.31ATF1 2.00 1.67 -1.19 -1.24 1.10 -1.03 -2.07 1.31 -1.53 -1.36ILV2 1.13 -1.10 -1.24 -1.67 -1.54 -1.35 -1.52 -1.24 -1.40 -1.09LEU9 -1.04 -1.36 -1.31 -1.42 -3.69 -1.08 -1.04 -2.82 -2.70 2.60YPL113C -1.81 -1.38 1.32 -1.03 -2.13 -1.35 1.34 -2.80 -1.54 2.07AAD14 -2.04 -1.14 1.80 1.55 1.72 -1.16 1.76 -1.05 1.95 -1.10
DAY 2 FOLD CHANGE
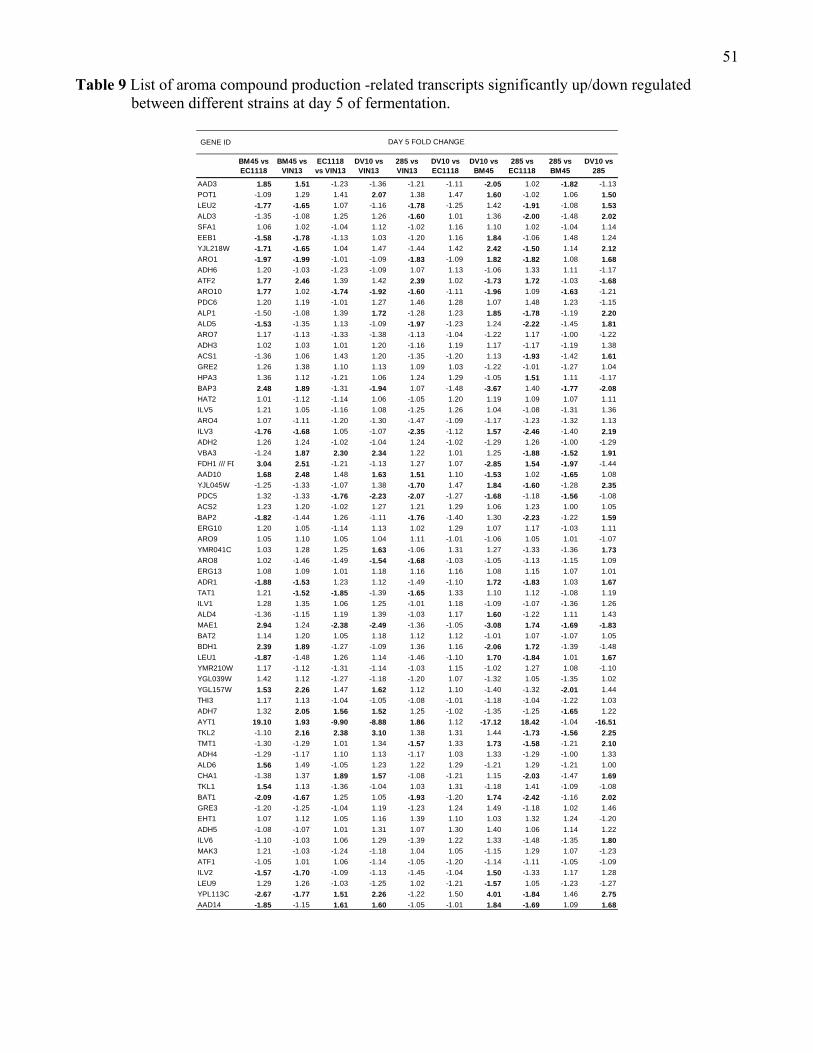
51
Table 9 List of aroma compound production -related transcripts significantly up/down regulated between different strains at day 5 of fermentation.
GENE ID
BM45 vs EC1118
BM45 vs VIN13
EC1118vs VIN13
DV10 vs VIN13
285 vs VIN13
DV10 vs EC1118
DV10 vs BM45
285 vs EC1118
285 vs BM45
DV10 vs 285
AAD3 1.85 1.51 -1.23 -1.36 -1.21 -1.11 -2.05 1.02 -1.82 -1.13POT1 -1.09 1.29 1.41 2.07 1.38 1.47 1.60 -1.02 1.06 1.50LEU2 -1.77 -1.65 1.07 -1.16 -1.78 -1.25 1.42 -1.91 -1.08 1.53ALD3 -1.35 -1.08 1.25 1.26 -1.60 1.01 1.36 -2.00 -1.48 2.02SFA1 1.06 1.02 -1.04 1.12 -1.02 1.16 1.10 1.02 -1.04 1.14EEB1 -1.58 -1.78 -1.13 1.03 -1.20 1.16 1.84 -1.06 1.48 1.24YJL218W -1.71 -1.65 1.04 1.47 -1.44 1.42 2.42 -1.50 1.14 2.12ARO1 -1.97 -1.99 -1.01 -1.09 -1.83 -1.09 1.82 -1.82 1.08 1.68ADH6 1.20 -1.03 -1.23 -1.09 1.07 1.13 -1.06 1.33 1.11 -1.17ATF2 1.77 2.46 1.39 1.42 2.39 1.02 -1.73 1.72 -1.03 -1.68ARO10 1.77 1.02 -1.74 -1.92 -1.60 -1.11 -1.96 1.09 -1.63 -1.21PDC6 1.20 1.19 -1.01 1.27 1.46 1.28 1.07 1.48 1.23 -1.15ALP1 -1.50 -1.08 1.39 1.72 -1.28 1.23 1.85 -1.78 -1.19 2.20ALD5 -1.53 -1.35 1.13 -1.09 -1.97 -1.23 1.24 -2.22 -1.45 1.81ARO7 1.17 -1.13 -1.33 -1.38 -1.13 -1.04 -1.22 1.17 -1.00 -1.22ADH3 1.02 1.03 1.01 1.20 -1.16 1.19 1.17 -1.17 -1.19 1.38ACS1 -1.36 1.06 1.43 1.20 -1.35 -1.20 1.13 -1.93 -1.42 1.61GRE2 1.26 1.38 1.10 1.13 1.09 1.03 -1.22 -1.01 -1.27 1.04HPA3 1.36 1.12 -1.21 1.06 1.24 1.29 -1.05 1.51 1.11 -1.17BAP3 2.48 1.89 -1.31 -1.94 1.07 -1.48 -3.67 1.40 -1.77 -2.08HAT2 1.01 -1.12 -1.14 1.06 -1.05 1.20 1.19 1.09 1.07 1.11ILV5 1.21 1.05 -1.16 1.08 -1.25 1.26 1.04 -1.08 -1.31 1.36ARO4 1.07 -1.11 -1.20 -1.30 -1.47 -1.09 -1.17 -1.23 -1.32 1.13ILV3 -1.76 -1.68 1.05 -1.07 -2.35 -1.12 1.57 -2.46 -1.40 2.19ADH2 1.26 1.24 -1.02 -1.04 1.24 -1.02 -1.29 1.26 -1.00 -1.29VBA3 -1.24 1.87 2.30 2.34 1.22 1.01 1.25 -1.88 -1.52 1.91FDH1 /// FD 3.04 2.51 -1.21 -1.13 1.27 1.07 -2.85 1.54 -1.97 -1.44AAD10 1.68 2.48 1.48 1.63 1.51 1.10 -1.53 1.02 -1.65 1.08YJL045W -1.25 -1.33 -1.07 1.38 -1.70 1.47 1.84 -1.60 -1.28 2.35PDC5 1.32 -1.33 -1.76 -2.23 -2.07 -1.27 -1.68 -1.18 -1.56 -1.08ACS2 1.23 1.20 -1.02 1.27 1.21 1.29 1.06 1.23 1.00 1.05BAP2 -1.82 -1.44 1.26 -1.11 -1.76 -1.40 1.30 -2.23 -1.22 1.59ERG10 1.20 1.05 -1.14 1.13 1.02 1.29 1.07 1.17 -1.03 1.11ARO9 1.05 1.10 1.05 1.04 1.11 -1.01 -1.06 1.05 1.01 -1.07YMR041C 1.03 1.28 1.25 1.63 -1.06 1.31 1.27 -1.33 -1.36 1.73ARO8 1.02 -1.46 -1.49 -1.54 -1.68 -1.03 -1.05 -1.13 -1.15 1.09ERG13 1.08 1.09 1.01 1.18 1.16 1.16 1.08 1.15 1.07 1.01ADR1 -1.88 -1.53 1.23 1.12 -1.49 -1.10 1.72 -1.83 1.03 1.67TAT1 1.21 -1.52 -1.85 -1.39 -1.65 1.33 1.10 1.12 -1.08 1.19ILV1 1.28 1.35 1.06 1.25 -1.01 1.18 -1.09 -1.07 -1.36 1.26ALD4 -1.36 -1.15 1.19 1.39 -1.03 1.17 1.60 -1.22 1.11 1.43MAE1 2.94 1.24 -2.38 -2.49 -1.36 -1.05 -3.08 1.74 -1.69 -1.83BAT2 1.14 1.20 1.05 1.18 1.12 1.12 -1.01 1.07 -1.07 1.05BDH1 2.39 1.89 -1.27 -1.09 1.36 1.16 -2.06 1.72 -1.39 -1.48LEU1 -1.87 -1.48 1.26 1.14 -1.46 -1.10 1.70 -1.84 1.01 1.67YMR210W 1.17 -1.12 -1.31 -1.14 -1.03 1.15 -1.02 1.27 1.08 -1.10YGL039W 1.42 1.12 -1.27 -1.18 -1.20 1.07 -1.32 1.05 -1.35 1.02YGL157W 1.53 2.26 1.47 1.62 1.12 1.10 -1.40 -1.32 -2.01 1.44THI3 1.17 1.13 -1.04 -1.05 -1.08 -1.01 -1.18 -1.04 -1.22 1.03ADH7 1.32 2.05 1.56 1.52 1.25 -1.02 -1.35 -1.25 -1.65 1.22AYT1 19.10 1.93 -9.90 -8.88 1.86 1.12 -17.12 18.42 -1.04 -16.51TKL2 -1.10 2.16 2.38 3.10 1.38 1.31 1.44 -1.73 -1.56 2.25TMT1 -1.30 -1.29 1.01 1.34 -1.57 1.33 1.73 -1.58 -1.21 2.10ADH4 -1.29 -1.17 1.10 1.13 -1.17 1.03 1.33 -1.29 -1.00 1.33ALD6 1.56 1.49 -1.05 1.23 1.22 1.29 -1.21 1.29 -1.21 1.00CHA1 -1.38 1.37 1.89 1.57 -1.08 -1.21 1.15 -2.03 -1.47 1.69TKL1 1.54 1.13 -1.36 -1.04 1.03 1.31 -1.18 1.41 -1.09 -1.08BAT1 -2.09 -1.67 1.25 1.05 -1.93 -1.20 1.74 -2.42 -1.16 2.02GRE3 -1.20 -1.25 -1.04 1.19 -1.23 1.24 1.49 -1.18 1.02 1.46EHT1 1.07 1.12 1.05 1.16 1.39 1.10 1.03 1.32 1.24 -1.20ADH5 -1.08 -1.07 1.01 1.31 1.07 1.30 1.40 1.06 1.14 1.22ILV6 -1.10 -1.03 1.06 1.29 -1.39 1.22 1.33 -1.48 -1.35 1.80MAK3 1.21 -1.03 -1.24 -1.18 1.04 1.05 -1.15 1.29 1.07 -1.23ATF1 -1.05 1.01 1.06 -1.14 -1.05 -1.20 -1.14 -1.11 -1.05 -1.09ILV2 -1.57 -1.70 -1.09 -1.13 -1.45 -1.04 1.50 -1.33 1.17 1.28LEU9 1.29 1.26 -1.03 -1.25 1.02 -1.21 -1.57 1.05 -1.23 -1.27YPL113C -2.67 -1.77 1.51 2.26 -1.22 1.50 4.01 -1.84 1.46 2.75AAD14 -1.85 -1.15 1.61 1.60 -1.05 -1.01 1.84 -1.69 1.09 1.68
DAY 5 FOLD CHANGE

52
Table 10 List of aroma compound production -related transcripts significantly up/down regulated within each strain between days 2 and 5 of fermentation.
GENE ID GENE ID
VIN13 EC1118 BM45 285 DV10 VIN13 EC1118 BM45 285 DV10
POT1 1.63 1.22 1.17 1.34 2.42 ERG13 -1.92 -2.07 -2.16 -2.02 -1.49
LEU2 -2.04 -1.43 -3.78 -4.19 -1.08 ADR1 33.47 31.45 11.10 24.70 40.17ALD3 7.67 4.21 4.44 5.26 3.57 TAT1 1.56 -1.37 -1.49 -1.13 1.48
SFA1 1.69 1.55 1.50 1.51 2.06 ILV1 -2.79 -2.59 -1.87 -2.28 -1.22
EEB1 -1.19 -2.41 -2.65 -1.80 -1.50 ALD4 4.13 3.46 1.75 3.70 5.68YJL218W -10.59 -6.23 6.61 -19.99 -2.65 MAE1 -1.62 -2.39 1.33 -1.08 -1.03
ARO1 -2.64 -1.80 -3.66 -3.86 -1.66 BAT2 1.05 1.16 -1.11 -1.52 2.08ADH6 -3.49 -3.14 -3.97 -4.35 -2.65 BDH1 1.73 1.37 1.98 2.12 1.66ATF2 -6.83 -2.98 -2.72 -3.90 -2.63 LEU1 1.11 1.59 1.16 -1.10 2.02ARO10 -9.46 -9.86 -12.15 -14.27 -3.15 YMR210W 2.67 2.07 1.96 2.30 3.08PDC6 -1.39 -1.87 -1.38 -1.09 1.04 YGL039W -2.78 -3.25 -3.61 -4.23 -2.33ALP1 -1.59 -2.24 -7.40 -8.46 -1.50 YGL157W -3.21 -2.34 -1.35 -1.66 -1.15
ALD5 -1.29 -1.06 -1.85 -2.33 1.07 THI3 1.06 1.05 1.46 1.41 1.99ARO7 -1.50 -2.10 -1.54 -1.71 -1.48 ADH7 -6.10 -3.03 -1.22 -1.48 -1.28
ADH3 -1.44 -1.44 -1.33 -1.63 1.26 AYT1 1.32 -3.20 1.01 1.36 1.43
ACS1 3.15 4.49 3.14 2.22 4.56 TKL2 3.91 3.25 1.66 2.56 6.02GRE2 3.34 2.82 2.34 2.94 3.59 TMT1 1.86 1.90 -2.12 1.22 3.26HPA3 -4.14 -4.55 -3.86 -5.28 -2.48 ADH4 -1.91 1.36 -1.03 -1.06 1.95BAP3 1.90 -1.04 2.58 1.67 1.06 ALD6 -2.89 -4.26 -2.95 -2.70 -2.15HAT2 1.02 1.01 -1.01 1.05 1.91 CHA1 -1.93 -4.59 -6.07 -4.89 -1.15
ILV5 -1.92 -2.40 -1.60 -1.99 -1.14 TKL1 -3.90 -5.07 -3.29 -3.35 -2.57ARO4 -4.24 -3.71 -4.16 -5.31 -2.59 BAT1 -1.59 -1.18 -2.25 -2.47 1.33
ILV3 -2.37 -1.98 -2.60 -4.51 -1.47 GRE3 2.93 2.04 1.43 1.82 2.46ADH2 1.87 2.56 2.29 3.00 3.45 EHT1 1.37 2.02 1.58 2.15 3.09VBA3 -2.56 -2.39 -9.61 -4.29 -2.46 ADH5 1.75 1.62 1.10 1.14 2.65FDH1 /// FD 3.15 2.65 2.12 2.56 3.57 ILV6 -3.22 -2.84 -3.05 -3.00 1.13
AAD10 -1.52 2.25 3.21 1.21 2.17 AAD3 1.83 1.33 1.53 1.42 1.91YJL045W 4.15 3.84 4.60 2.67 7.01 MAK3 -1.88 -1.49 1.24 -1.07 -1.29
PDC5 -2.99 -4.83 -1.20 -2.42 -3.08 ATF1 1.15 1.45 -1.45 -1.11 1.56ACS2 -2.14 -2.69 -2.46 -2.20 -1.67 AAD3 1.20 1.35 1.37 1.43 1.86BAP2 16.64 6.39 2.55 2.17 4.14 ILV2 -1.06 1.08 -1.65 -1.10 1.74ERG10 -1.19 -1.51 -1.49 -1.41 1.03 LEU9 -3.76 -2.95 -2.19 -3.54 -2.66ARO9 -4.19 -1.60 -3.09 -2.11 1.81 YPL113C -1.75 -1.52 -2.25 -2.12 1.66YMR041C 2.57 2.10 1.08 2.29 4.63 AAD14 1.80 1.62 1.78 1.87 2.32ARO8 -3.94 -4.08 -5.40 -5.03 -2.38
DAY 5 vs DAY 2 DAY 5 vs DAY 2
3.4.3 Results of multivariate analysis of metabolites and gene expression
Figure 4 shows a PLS2 plot which depicts the variation/ relationships between all the measured aroma
compounds as well as the 70 genes selected for multivariate modeling purposes. These genes were
selected due to their varying expression levels between different strains as well as different time points
during fermentation. Also, we selected genes whose annotation suggested that they may have a role in
aroma compound production, such as enzymes whose sequence suggests a role in redox reactions,
central carbon metabolism, and amino acid uptake and metabolism (GO and MIPS classification).
The X-Y scores and loading plots (figure 4) are clearly useful in representing the overall ‘structure’ of
the entire dataset, and are pointing out possible connections between specific compounds/ groups of
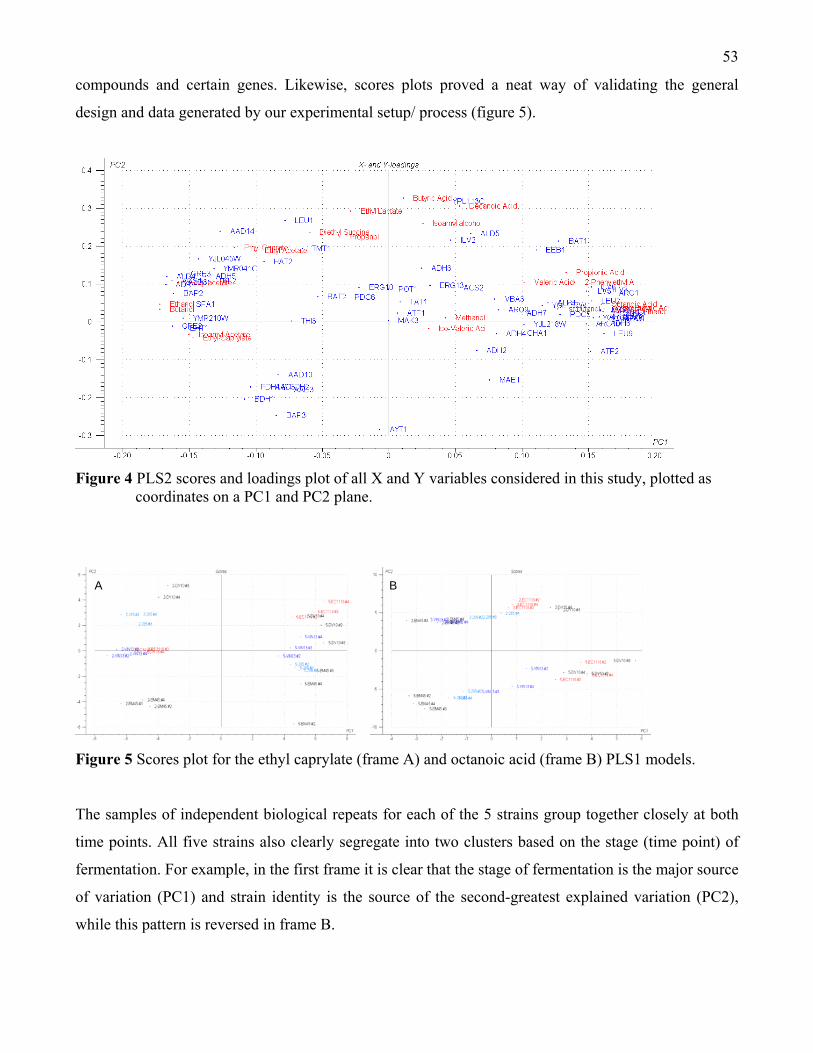
53
compounds and certain genes. Likewise, scores plots proved a neat way of validating the general
design and data generated by our experimental setup/ process (figure 5).
Figure 4 PLS2 scores and loadings plot of all X and Y variables considered in this study, plotted as
coordinates on a PC1 and PC2 plane.
Figure 5 Scores plot for the ethyl caprylate (frame A) and octanoic acid (frame B) PLS1 models.
The samples of independent biological repeats for each of the 5 strains group together closely at both
time points. All five strains also clearly segregate into two clusters based on the stage (time point) of
fermentation. For example, in the first frame it is clear that the stage of fermentation is the major source
of variation (PC1) and strain identity is the source of the second-greatest explained variation (PC2),
while this pattern is reversed in frame B.
A B
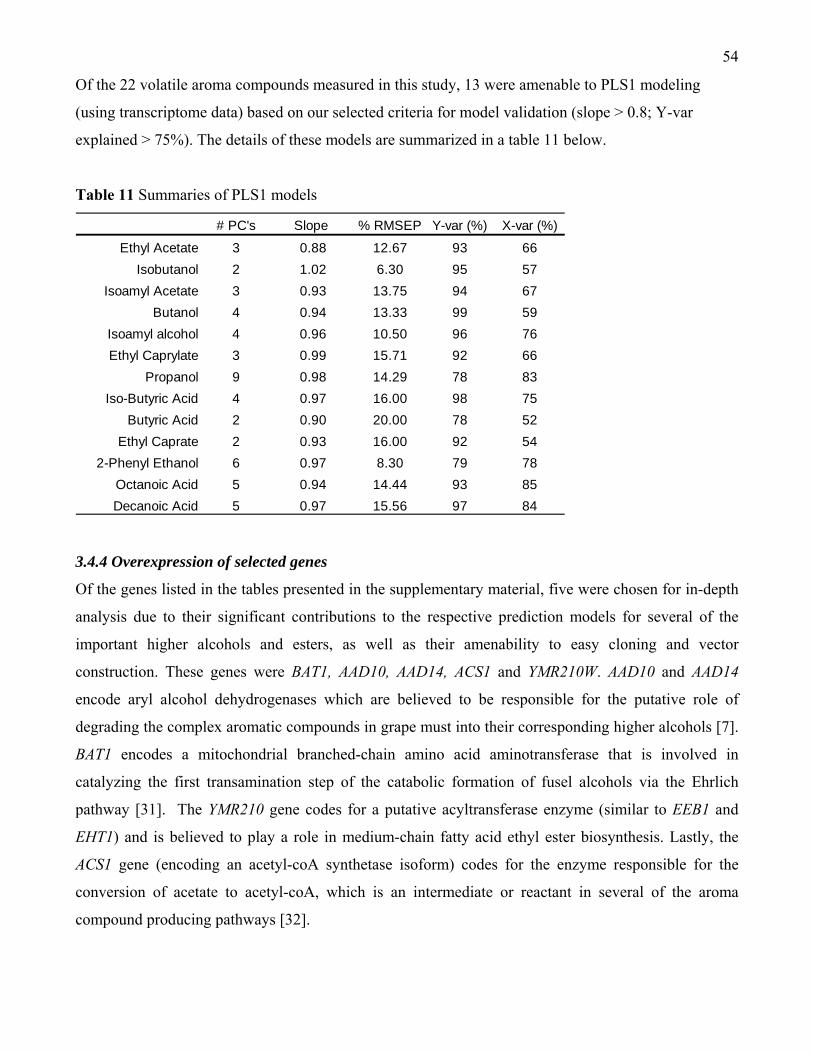
54
Of the 22 volatile aroma compounds measured in this study, 13 were amenable to PLS1 modeling
(using transcriptome data) based on our selected criteria for model validation (slope > 0.8; Y-var
explained > 75%). The details of these models are summarized in a table 11 below.
Table 11 Summaries of PLS1 models
# PC's Slope % RMSEP Y-var (%) X-var (%)
Ethyl Acetate 3 0.88 12.67 93 66Isobutanol 2 1.02 6.30 95 57
Isoamyl Acetate 3 0.93 13.75 94 67Butanol 4 0.94 13.33 99 59
Isoamyl alcohol 4 0.96 10.50 96 76Ethyl Caprylate 3 0.99 15.71 92 66
Propanol 9 0.98 14.29 78 83Iso-Butyric Acid 4 0.97 16.00 98 75
Butyric Acid 2 0.90 20.00 78 52Ethyl Caprate 2 0.93 16.00 92 54
2-Phenyl Ethanol 6 0.97 8.30 79 78Octanoic Acid 5 0.94 14.44 93 85Decanoic Acid 5 0.97 15.56 97 84
3.4.4 Overexpression of selected genes
Of the genes listed in the tables presented in the supplementary material, five were chosen for in-depth
analysis due to their significant contributions to the respective prediction models for several of the
important higher alcohols and esters, as well as their amenability to easy cloning and vector
construction. These genes were BAT1, AAD10, AAD14, ACS1 and YMR210W. AAD10 and AAD14
encode aryl alcohol dehydrogenases which are believed to be responsible for the putative role of
degrading the complex aromatic compounds in grape must into their corresponding higher alcohols [7].
BAT1 encodes a mitochondrial branched-chain amino acid aminotransferase that is involved in
catalyzing the first transamination step of the catabolic formation of fusel alcohols via the Ehrlich
pathway [31]. The YMR210 gene codes for a putative acyltransferase enzyme (similar to EEB1 and
EHT1) and is believed to play a role in medium-chain fatty acid ethyl ester biosynthesis. Lastly, the
ACS1 gene (encoding an acetyl-coA synthetase isoform) codes for the enzyme responsible for the
conversion of acetate to acetyl-coA, which is an intermediate or reactant in several of the aroma
compound producing pathways [32].
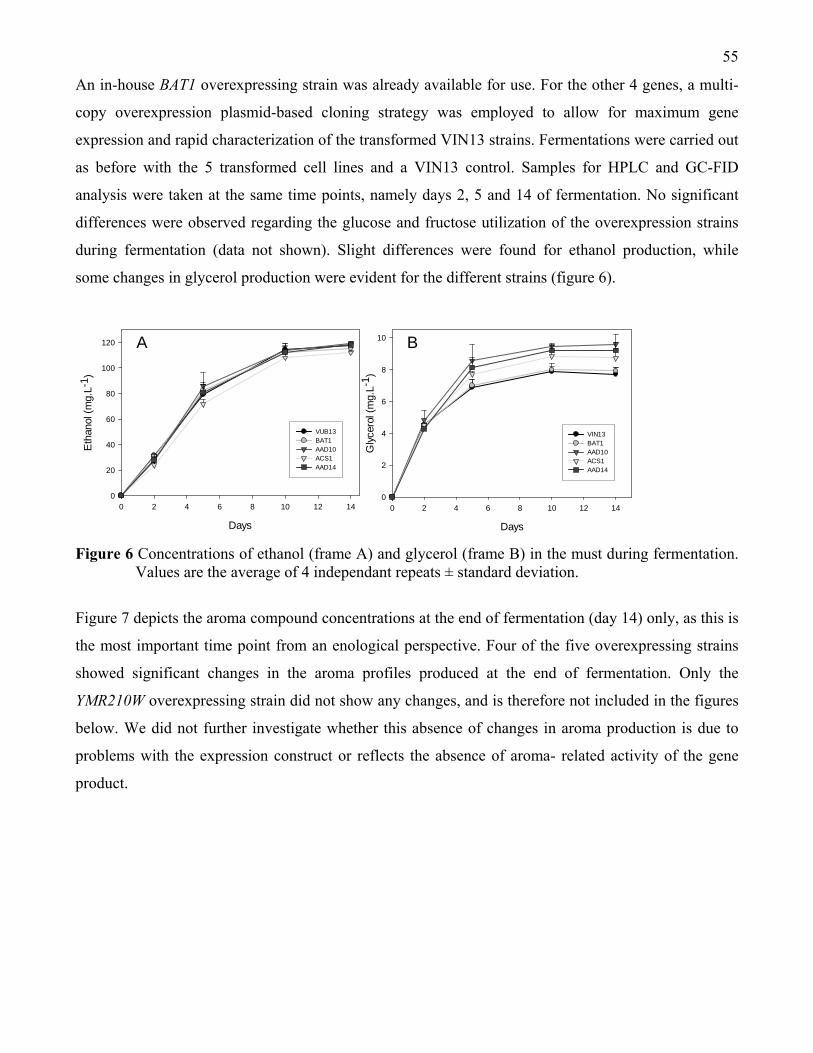
55
An in-house BAT1 overexpressing strain was already available for use. For the other 4 genes, a multi-
copy overexpression plasmid-based cloning strategy was employed to allow for maximum gene
expression and rapid characterization of the transformed VIN13 strains. Fermentations were carried out
as before with the 5 transformed cell lines and a VIN13 control. Samples for HPLC and GC-FID
analysis were taken at the same time points, namely days 2, 5 and 14 of fermentation. No significant
differences were observed regarding the glucose and fructose utilization of the overexpression strains
during fermentation (data not shown). Slight differences were found for ethanol production, while
some changes in glycerol production were evident for the different strains (figure 6).
Figure 6 Concentrations of ethanol (frame A) and glycerol (frame B) in the must during fermentation.
Values are the average of 4 independant repeats ± standard deviation.
Figure 7 depicts the aroma compound concentrations at the end of fermentation (day 14) only, as this is
the most important time point from an enological perspective. Four of the five overexpressing strains
showed significant changes in the aroma profiles produced at the end of fermentation. Only the
YMR210W overexpressing strain did not show any changes, and is therefore not included in the figures
below. We did not further investigate whether this absence of changes in aroma production is due to
problems with the expression construct or reflects the absence of aroma- related activity of the gene
product.
Days
0 2 4 6 8 10 12 14
Glyc
erol
(mg.
L-1)
0
2
4
6
8
10
VIN13BAT1AAD10ACS1AAD14
Days
0 2 4 6 8 10 12 14
Etha
nol (
mg.
L-1 )
0
20
40
60
80
100
120
VUB13BAT1AAD10ACS1AAD14
A B
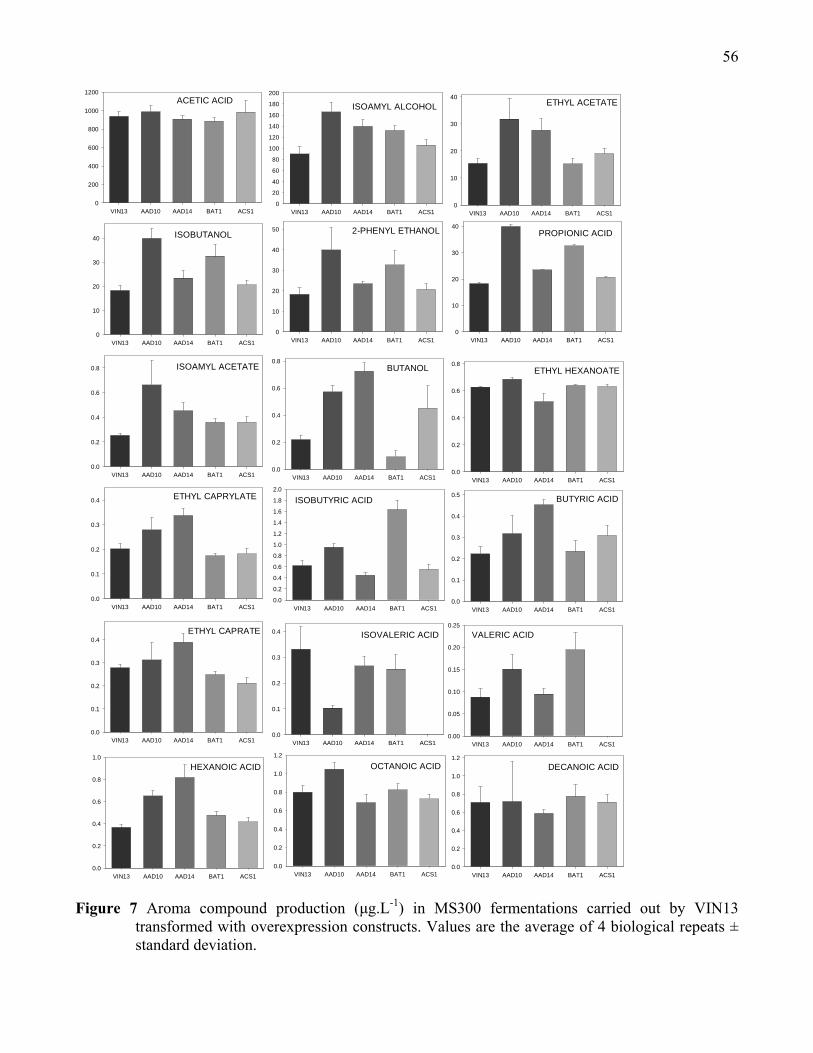
56
Figure 7 Aroma compound production (μg.L-1) in MS300 fermentations carried out by VIN13
transformed with overexpression constructs. Values are the average of 4 biological repeats ± standard deviation.
ACETIC ACID
VIN13 AAD10 AAD14 BAT1 ACS10
200
400
600
800
1000
1200
ISOAMYL ALCOHOL
VIN13 AAD10 AAD14 BAT1 ACS10
20
40
60
80
100
120
140
160
180
200
ETHYL ACETATE
VIN13 AAD10 AAD14 BAT1 ACS10
10
20
30
40
ISOBUTANOL
VIN13 AAD10 AAD14 BAT1 ACS10
10
20
30
402-PHENYL ETHANOL
VIN13 AAD10 AAD14 BAT1 ACS10
10
20
30
40
50 PROPIONIC ACID
VIN13 AAD10 AAD14 BAT1 ACS10
10
20
30
40
ISOAMYL ACETATE
VIN13 AAD10 AAD14 BAT1 ACS10.0
0.2
0.4
0.6
0.8 BUTANOL
VIN13 AAD10 AAD14 BAT1 ACS10.0
0.2
0.4
0.6
0.8
ETHYL HEXANOATE
VIN13 AAD10 AAD14 BAT1 ACS10.0
0.2
0.4
0.6
0.8
ETHYL CAPRYLATE
VIN13 AAD10 AAD14 BAT1 ACS10.0
0.1
0.2
0.3
0.4 ISOBUTYRIC ACID
VIN13 AAD10 AAD14 BAT1 ACS10.0
0.2
0.4
0.6
0.8
1.0
1.2
1.4
1.6
1.8
2.0
BUTYRIC ACID
VIN13 AAD10 AAD14 BAT1 ACS10.0
0.1
0.2
0.3
0.4
0.5
ETHYL CAPRATE
VIN13 AAD10 AAD14 BAT1 ACS10.0
0.1
0.2
0.3
0.4ISOVALERIC ACID
VIN13 AAD10 AAD14 BAT1 ACS10.0
0.1
0.2
0.3
0.4 VALERIC ACID
VIN13 AAD10 AAD14 BAT1 ACS10.00
0.05
0.10
0.15
0.20
0.25
HEXANOIC ACID
VIN13 AAD10 AAD14 BAT1 ACS10.0
0.2
0.4
0.6
0.8
1.0OCTANOIC ACID
VIN13 AAD10 AAD14 BAT1 ACS10.0
0.2
0.4
0.6
0.8
1.0
1.2
DECANOIC ACID
VIN13 AAD10 AAD14 BAT1 ACS10.0
0.2
0.4
0.6
0.8
1.0
1.2
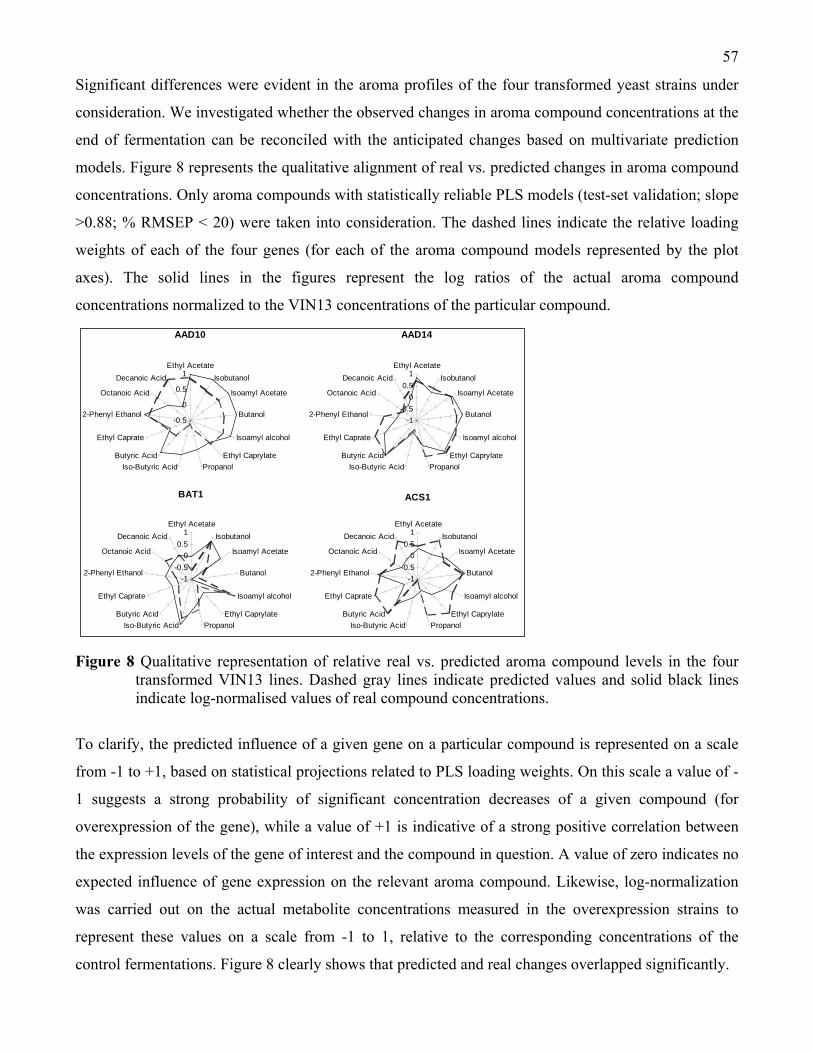
57
Significant differences were evident in the aroma profiles of the four transformed yeast strains under
consideration. We investigated whether the observed changes in aroma compound concentrations at the
end of fermentation can be reconciled with the anticipated changes based on multivariate prediction
models. Figure 8 represents the qualitative alignment of real vs. predicted changes in aroma compound
concentrations. Only aroma compounds with statistically reliable PLS models (test-set validation; slope
>0.88; % RMSEP < 20) were taken into consideration. The dashed lines indicate the relative loading
weights of each of the four genes (for each of the aroma compound models represented by the plot
axes). The solid lines in the figures represent the log ratios of the actual aroma compound
concentrations normalized to the VIN13 concentrations of the particular compound.
Figure 8 Qualitative representation of relative real vs. predicted aroma compound levels in the four
transformed VIN13 lines. Dashed gray lines indicate predicted values and solid black lines indicate log-normalised values of real compound concentrations.
To clarify, the predicted influence of a given gene on a particular compound is represented on a scale
from -1 to +1, based on statistical projections related to PLS loading weights. On this scale a value of -
1 suggests a strong probability of significant concentration decreases of a given compound (for
overexpression of the gene), while a value of +1 is indicative of a strong positive correlation between
the expression levels of the gene of interest and the compound in question. A value of zero indicates no
expected influence of gene expression on the relevant aroma compound. Likewise, log-normalization
was carried out on the actual metabolite concentrations measured in the overexpression strains to
represent these values on a scale from -1 to 1, relative to the corresponding concentrations of the
control fermentations. Figure 8 clearly shows that predicted and real changes overlapped significantly.
AAD10
-0.5
0
0.5
1Ethyl Acetate
Isobutanol
Isoamyl Acetate
Butanol
Isoamyl alcohol
Ethyl CaprylatePropanolIso-Butyric Acid
Butyric Acid
Ethyl Caprate
2-Phenyl Ethanol
Octanoic Acid
Decanoic Acid
AAD14
-1-0.5
00.5
1Ethyl Acetate
Isobutanol
Isoamyl Acetate
Butanol
Isoamyl alcohol
Ethyl CaprylatePropanolIso-Butyric Acid
Butyric Acid
Ethyl Caprate
2-Phenyl Ethanol
Octanoic Acid
Decanoic Acid
BAT1
-1-0.5
00.5
1Ethyl Acetate
Isobutanol
Isoamyl Acetate
Butanol
Isoamyl alcohol
Ethyl CaprylatePropanolIso-Butyric Acid
Butyric Acid
Ethyl Caprate
2-Phenyl Ethanol
Octanoic Acid
Decanoic Acid
ACS1
-1-0.5
00.5
1Ethyl Acetate
Isobutanol
Isoamyl Acetate
Butanol
Isoamyl alcohol
Ethyl CaprylatePropanolIso-Butyric Acid
Butyric Acid
Ethyl Caprate
2-Phenyl Ethanol
Octanoic Acid
Decanoic Acid
58
3.5 Discussion 3.5.1 Over expression of genes
The aim of this study was to determine whether the transcription profiles of the various strains during
fermentation could be reconciled with the volatile aroma compound production of these strains, and
whether this comparative analysis could be used to predict the impact of individual gene expression
levels on aroma compounds and profiles. The data generated by the overexpression of four of the genes
whose expression was statistically most significantly linked to the production of aroma profiles suggest
that this approach has been successful. Indeed, overexpression of the selected genes had a far reaching
impact on the aroma profiles produced by the fermenting yeast, and this impact was generally well
aligned with the impact predicted from the comparative omics analysis. The data aligned better than
we, considering the significant challenges when approaching complex systems, had expected. Our data
show that the metabolic changes observed upon overexpression of three of the four genes, AAD10,
AAD14 and BAT1, were very significantly aligned with the changes that were predicted from the
alignment of transcriptome and metabolome data alone.
The predictions, as can be seen from the alignment of predicted vs. observed changes in metabolite
levels in a qualitative manner, indeed proved fairly reliable. The model was able to assign positive and
negative influences on a particular compound with relative accuracy. Although the extent / magnitude
of the increase / decrease is not always well aligned with model values, the absolute direction of the
change holds true in most cases. An absolute alignment would not be expected, since the level of
expression in a plasmid-based system can not be adjusted to the differences of expression observed
between the different strains.
In the case of AAD10, only the influence of the overexpression on decanoic acid was not in line with
the projection. Predictions for AAD14 and BAT1 were well matched with the observed changes in
metabolite profiles. Predicted and real changes did not match satisfactorily in only one case, ACS1.
Nevertheless, even in this case, eight out of the thirteen compounds evolved in the predicted direction.
It should also be noted that the expression of this gene had generally a less severe impact on changes in
the aroma profile than those of the other three genes.
Considering the complexity of the system, the rate of success achieved in this study can be considered
as highly significant. To our knowledge, this is the first report to exploit such an intra- and interstrain
59
comparative approach to identify genes that play a significant role in a complex metabolic network.
While we were clearly able to identify genes with significant impact on aroma compound production in
a specific industrial environment, and which in some cases had not been previously directly linked to
these pathways, the data do not allow a firm conclusion on the exact metabolic role of these genes.
Indeed, the vast number of significant changes to metabolite levels makes it difficult to identify the
specific ‘point of influence’ of any overexpressed gene in a given pathway.
The increases/ decreases in specific volatile compounds seen for the VIN13(pBAT1-s) strain is in
keeping with the results reported in colombar fermentations [28]. The two AAD gene overexpressing
strains also showed interesting trends: Both strains produced higher levels (at comparable
concentrations) of isoamyl alcohol, ethyl acetate, butanol, ethyl caprylate, ethyl caprate and hexanoic
acid. However, noticeable differences can be seen in the levels of isobutanol, 2-phenyl ethanol,
propionic acid, isoamyl acetate, ethyl hexanoate, isobutyric acid and isovaleric acid, relative to the
control and to one another. This is indicative of the potential for the AAD genes to have overlapping
yet distinct functional roles in the pathways leading to higher alcohol and ester production.
Overexpression of the ACS1 gene did not lead to such numerous and substantial increases/ decreases in
volatile production as was the case for the other three genes. Interestingly, valeric and isovaleric acid
were below detection levels in these fermentations. Concentrations of isoamyl acetate, ethyl acetate,
butanol and butyric acid were significantly higher, and ethyl caprate lower relative to control
fermentations.
On the whole though, our analysis shows that the cross-comparison of gene expression data with
metabolite levels has the potential to identify points of interest on a genomic scale. This also opens new
possibilities to design improved yeast enhancement strategies for optimized aroma production and
fermentation performance.
3.5.2 Other genes of interest
Many other genes showed significant variation in expression between different strains and / or time
points, as well as high loadings on PLS models and strong negative or positive correlations with
specific aroma compounds. These genes encode enzymes that either are known to participate in aroma
compound production, or have activities (either experimentally proven or suggested through sequence
alignments) that could suggest such roles. Here we discuss some of the most relevant of these enzymes,
which fall into several categories, either according to their place in a specific metabolic pathway such
60
as the metabolisms of branched chain amino acids or of aromatic amino acids, or based on their
specific activity such as dehydrogenases (in particular aldehyde and alcohol dehydrogenases) and
acetyl transferases.
Of the enzymes involved in branched chain amino acid metabolism, BAT1 has been discussed above.
Other genes that encode enzymes in this pathway and that were identified in our study for their strong
statistical link between expression levels and the production of specific compounds include LEU2,
encoding a beta-isopropylmalate dehydrogenase that catalyzes the third step in the leucine biosynthesis
pathway, and, to a lesser degree, LEU1, which encodes an isopropylmalate isomerase [33, 34]. Both of
these genes showed a significant statistical correlation with compounds such as isobutanol. Of the
genes involved in the metabolism of isoleucine and valine (Ilv), only ILV5, which encodes an
acetohydroxyacid reductoisomerase involved in branched-chain amino acid biosynthesis [35], showed
a very strong positive correlation with almost all of the compounds analysed here, and, interestingly, a
negative correlation with ethanol, suggesting that this gene could be an interesting target for metabolic
engineering.
While BAT1 expression showed a significant positive correlation with a large number of the volatile
compounds measured in our study, the cytosolic isoform (BAT2) of this enzyme showed no significant
correlations with any of these aroma compounds. Although this isoform is supposedly highly expressed
during stationary phase and repressed during the logarithmic phase, BAT2 expression levels in our
study were found to stay constant, if not to decrease slightly upon entry into stationary phase in
comparison to the exponential phase at day 2. In addition, BAT2 expression levels were generally
considerably lower throughout fermentation when compared to BAT1.
Of the genes involved in aromatic amino acid metabolism, three, ARO1, which encodes a
pentafunctional arom protein, ARO7, which encodes a chorismate mutase responsible for the
conversion of chorismate to prephenate and ARO8, which codes for an aromatic aminotransferase
showed statistically significant correlations between expression levels and metabolite production [36,
37]. All three genes showed a modest positive correlation (r2 = 0.7) with 2-phenyl ethanol and mild
negative correlations with all the other compounds. Only octanoic acid showed a very strong (r2 = 0.82)
negative correlation with ARO8 expression at day 2 of fermentation. Despite its seemingly crucial role,
ARO10, which encodes a phenylpyruvate decarboxylase corresponding to the first specific step in the
Ehrlich pathway did not show any noteworthy correlations between its expression and any of the
61
volatile compounds in our study [38]. Of course the possibility of translational or post-translational
control of activity cannot be excluded.
Several specific enzyme activities were also overrepresented in our list. Such enzymes include many
dehydrogensases. Aldehyde and alcohol dehydrogenases such as those encoded by ALD5, ALD6,
ADH6 and ADH7 showed a substantial decline in expression levels between days 2 and 5 of
fermentation, while others (such as ALD3, ALD4, ADH2 and ADH5) increased during this time. The
distinct expression patterns during fermentation reflects the different regulatory mechanisms governing
the expression of these genes (i.e. expression of ALD3 is glucose-repressed and stress-induced) and
suggests that the different ALD gene products have specific roles during different stages of
fermentation [39].
ALD4 and ALD5 (mitochondrial), and ALD3 and ALD6 (cytoplasmic) encode aldehyde dehydrogenases
involved in the conversion of acetaldehyde to acetate [40]. ALD4 encodes a mitochondrial aldehyde
dehydrogenase (utilizing NADP+ or NAD+) that is required for growth on ethanol and conversion of
acetaldehyde to acetate [40]. Expression of ALD4 is also glucose repressed, and increases 2 to 4-fold
from day 2 to 5 of fermentation. ALD4 expression shows a very strong correlation to the amount of
hexyl acetate (R2 = 0.82) produced by the fermenting yeast, as well as to ethyl acetate (0.77), isoamyl
alcohol (0.91) and isoamyl acetate (0.85).
ALD6 encodes a constitutively expressed cytosolic aldehyde dehydrogenase (utilizes NADP+ as the
preferred coenzyme) and is required for conversion of acetaldehyde to acetate [41]. Not surprisingly,
ALD6 expression showed a very strong positive correlation to the levels of acetic acid produced by the
fermenting cells (0.92). Also, expression was very strongly inversely correlated to ethanol production
(R2 = 0.81). Interestingly, fairly strong positive correlations were also evident for 2-phenyl ethanol (R2
= 0.79) and 2-phenyl ethyl acetate (R2 = 0.67).
ADH6 encodes an NADPH-dependent cinnamyl alcohol dehydrogenase family member with broad
substrate specificity [42]. Expression was correlated very strongly with isobutanol levels (0.81),
isobutyric acid (0.86), propionic acid (0.81), acetic acid (0.87) and 2-phenyl ethanol (0.92). ADH4,
ADH5 and ADH7 on the other hand showed only modest correlations with the above-mentioned, or any
other aroma compounds for that matter.
62
With respect to the aryl alcohol dehydrogenase family of genes, the transcripts for AAD3, AAD10 and
AAD14 showed the greatest variation in expression, both on an intra- and interstrain level. Expression
of AAD10 and AAD14, for example, was increased more than twofold in most of the strains at day 5
relative to day 2 of fermentation. No distinct physiological role has been established for the products of
these genes [7], but it is reasonable to suspect that the consistent increase in their respective transcript
levels during the course of fermentation could be associated with the increase in one or several of the
long chain alcohols or their acid counterparts as fermentation progresses (Tables 5 & 6).
This hypothesis is supported by the data generated through the overexpression of these genes. Indeed,
overexpression yielded changes to the aroma profile that were very similar to those predicted from the
alignment of transcriptome and metabolome data sets. The expression of AAD10 showed weak yet
significant positive correlations with a number of the aroma compounds. Expression of AAD14
between different strains and time points was also highly variable. Highest expression levels were
noted for the DV10 strain, and significant positive correlations with ethyl acetate (0.67) and ethyl
caprate (0.74) were observed for this gene.
Acetyl transferases are another family of enzymes of relevance to aroma compound metabolism [43].
However, neither ATF1 nor ATF2, the two most prominent alcohol acetyl transferases, showed
statistically strong correlations between expression levels and metabolite production. EEB1, on the
other hand, which encodes an acyl-coenzymeA:ethanol O-acyltransferase and is responsible for the
major part of medium-chain fatty acid ethyl ester biosynthesis during fermentation [44], showed weak
negative correlations with ethanol and other higher alcohols, and a strong positive correlation for 2-
phenylethyl acetate (0.9) as well as octanoic acid (0.78). It is tempting to speculate that Eeb1p may thus
be largely responsible for the acetylation of 2-phenyl ethanol to produce 2-phenylethyl acetate.
EHT1 encodes an acyl-coenzymeA:ethanol O-acyltransferase that plays a role in medium-chain fatty
acid ethyl ester biosynthesis, but also contains a known esterase activity [44]. EHT1 expression
increased somewhat as fermentation progressed and inter-strain expression at both day 2 and 5 of
fermentation varied significantly. Interestingly, EHT1 expression showed a fairly strong inverse
correlated with 2-phenylethyl acetate (R2 = 0.74) and octanoic acid (R2 = 0.75), as well as a weaker yet
significant inverse correlation with decanoic acid (R2 = 0.59). This could indicate that the esterase
activity of Eht1p could predominate under certain conditions.
63
YMR210W encodes a putative acyltransferase with similarity to both Eeb1p and Eht1p, and may have a
minor role in medium-chain fatty acid ethyl ester biosynthesis [44]. Expression was positively
correlated with ethyl acetate (0.74), ethyl caprylate (0.85) and isoamyl acetate (0.78). In addition to
these relatively well studied acetyltransferases, the mRNA levels of the AYT1 gene, encoding a
transferase of unknown substrate specificity, also showed considerable variation at different
fermentative stages [45].
3.6 Conclusions The impact of these individual genes on aroma compound metabolism has to be assessed individually.
However, from the data presented here, it is clear that an analysis based on the comparison of
transcriptome and metabolome data derived from different commercial yeast strains can help to
identify genes that most significantly impact a metabolic network in specific environmental and
industrial conditions. Our over-expression analysis of five genes that were randomly selected from the
list of ORFs identified for their statistically significant impact on aroma production also clearly
suggests that the method has significant predictive power regarding the reorientation of metabolic flux
through the network in response to changes in gene expression levels. Indeed, for four out of five
selected genes, BAT1, AAD10, AAD14 and ACS1, the match between predicted and real changes is
highly significant. This is the first study linking metabolic networks to transcriptome analysis through
the comparative analysis of different wine yeast strains.
Acknowledgements
Funding for the research presented in this paper was provided by the NRF and Winetech, and personal
sponsorship by the Wilhelm Frank Trust. We would also like to thank Jo McBride and the Cape Town
Centre for Proteomic and Genomic Research for the microarray analysis, and the staff and students at
the IWBT, the analytical laboratory of the Department of Viticulture and Oenology and the Central
Analytical Facility, all of Stellenbosch University, for their support and assistance in numerous areas.
64
References
1. Pretorius IS, Bauer FF: Meeting the consumer challenge through genetically customized wine-
yeast strains. Trends Biotech 2002, 20:426-432.
2. Marullo P, Bely M, Masneuf-Pomarede I, Aigle M, Dubourdieu D: Inheritable nature of
enological quantitative traits is demonstrated by meiotic segregation of industrial wine yeast
strains. FEMS Yeast Res 2004, 4:711-719.
3. Ehrlich F: Über die Bedingungen der Fuselölbildung und über ihren Zusammenhang mit dem
Eiweissaufbau der Hefe. Berichte Deutsch Chem Gesellschaft 1907, 40:1027-1047.
4. Dickinson JR, Lanterman MM, Daner DJ, Pearson BM, Sanz P, Harrison SJ, Hewlins MJE: A 13C
nuclear magnetic resonance investigation of the metabolism of leucine to isoamyl alcohol in
Saccharomyces cerevisiae. J Biol Chem 1997, 272:26871-26878.
5. Dickinson JR, Harrison SJ, Hewlins MJE: An investigation of the metabolism of valine to
isobutyl alcohol in Saccharomyces cerevisiae. J Biol Chem 1998, 273:25751-25756.
6. Dickinson JR, Harrison SJ, Dickinson JA, Hewlins MJE: An investigation of the metabolism of
isoleucine to active amyl alcohol in Saccharomyces cerevisiae. J Biol Chem 2000, 275:10937-
10942.
7. Delneri D, Gardner DCJ, Bruschi CV, Oliver SG: Disruption of seven hypothetical aryl alcohol
dehydrogenase genes from Saccharomyces cerevisiae and construction of a multiple knock-out
strain. Yeast 1999, 15:1681-1689.
8. Dickinson JR, Eshantha L, Salgado J, Hewlins MJE: The catabolism of amino acids to long chain
and complex alcohols in Saccharomyces cerevisiae. J Biol Chem 2002, 278:8028-8034.
9. Nykänen L, Nykänen I: Production of esters by different yeast strains in sugar fermentations. J
Inst Brew 1977, 83:30-31.
65
10. Peddie HAB: Ester formation in brewery fermentations. J Inst Brew 1990, 96:327-331.
11. Malcorps P, Cheval JM, Jamil S, Dufour J-P: A new model for the regulation of ester synthesis
by alcohol acetyltransferases in Saccharomyces cerevisiae. J Am Soc Brew Chem 1991, 49:47-53.
12. Vollbrecht D, Radler F: Formation of higher alcohols by amino acid deficient mutants of
Saccharomyces cerevisiae. I. The decomposition of amino acids to higher alcohols. Arch
Mikrobiol 1973, 94:351–358.
13. Van Dijken JP, Scheffers WA: Redox balances in the metabolism of sugars by yeasts. FEMS
Microbiol Rev 1986, 32:199–224.
14. Zoecklein BW, Fugelsang KC, Gump BH, Nury FS: Alcohol and extract. In Wine Analysis and
Production. New York: The Chapman & Hall Enology Library 1995: 97-114.
15. Ribéreau-Gayon P, Dubourdieu D, Donèche B, Lonvaud A: Biochemistry of alcoholic
fermentation and metabolic pathways of wine yeasts. In Handbook of Enology Vol. 1, New York:
John Wiley and Sons 2000: 51–74.
16. Heux S, Cachon R, Dequin S: Cofactor engineering in Saccharomyces cerevisiae: Expression of
a H2O-forming NADH oxidase and impact on redox metabolism. Metab Eng 2006, 8:303-314.
17. Bely L, Sablayrolles J, Barre P: Description of alcoholic fermentation kinetics: its variability
and significance. Am J Enol Vitic 1990, 40:319-324.
18. Ben-Dor A, Shamir R, Yakhini Z: Clustering gene expression patterns. J Comp Biol 1999,
6:281-297.
19. Abbott DA, Knijnenburg TA, de Poorter LM, Reinders MJ, Pronk JT, van Maris AJ: Generic and
specific transcriptional responses to different weak organic acids in anaerobic chemostat
cultures of Saccharomyces cerevisiae. FEMS Yeast Res Doi: 10. 1111/j. 1567-1364. 2007. 00242. x.
66
20. Boer VM, de Winde JH, Pronk JT, Piper MD: The genome-wide transcriptional responses of
Saccharomyces cerevisiae grown on glucose in aerobic chemostat cultures limited for carbon,
nitrogen, phosphorus or sulfur. J Biol Chem 2003, 278:3265-3274.
21. Tusher CG, Tibshirani R, Chu G: Significance analysis of microarrays applied to the ionizing
radiation response. Proc Natl Acad Sci USA 2001, 98:5116-5121.
22. Mardia KV, Kent JT, Bibby JH: Multivariate analysis. UK: Academic Press; 1979.
23. Martens H, Næs T: Multivariate calibration. UK: J. Wiley and sons; 1989.
24. Tan Y, Shi L, Hussain SM, Xu J, Tong W, Frazier JM, Wang C: Integrating time-course
microarray gene expression profiles with cytotoxicity for identification of biomarkers in
primary rat hepatocytes exposed to cadmium. Bioinformatics 2006, 22:77-87.
25. Ausubel FM, Brent R, Kingston RE, Moore DD, Seidman JG: Current protocols in molecular
biology. New York: John Wiley & Sons; 1994.
26. Sambrook J, Fritsch EF, Maniatis T: Molecular cloning: A laboratory manual. 2nd edition. New
York: Cold Spring Harbor Laboratory Press; 1989.
27. Wenzel TJ, Migliazza A, Steensma HY, van den Berg JA: Efficient selection of phleomycin-
resistant Saccharomyces cerevisiae transformants. Yeast 1992, 8:667-668.
28. Lilly M, Bauer FF, Styger G, Lambrechts MG, Pretorius IS: The effect of increased breanched-
chain amino acid transaminase activity in yeast on the production of higher alcohols and on
the flavour profiles of wine and distillates. FEMS Yeast Res 2006, 6:726-743.
29. Rossignol T, Dulau L, Julien A, Blondin B: Genome-wide monitoring of wine yeast gene
expression during alcoholic fermentation. Yeast 2003, 20:1369-1385.
67
30. Marks VD, Ho Sui SJ, Erasmus D, van den Merwe GK, Brumm J, Wasserman WW, Bryan J, van
Vuuren HJJ: Dynamics of the yeast transcriptome during wine fermentation reveals a novel
fermentation stress response. FEMS Yeast Res 2008, 8:35-52.
31. Kispal G, Steiner H, Court DA, Rolinski B, Lill R: Mitochondrial and cytosolic branched-chain
amino acid transaminases from yeast, homologs of the myc oncogene-regulated Eca39 protein.
J Biol Chem 1996, 271:24458-24464.
32. Van den Berg MA, de Jong-Gubbels P, Kortland CJ, van Dijken JP, Pronk JT, Steensma HY: The
two acetyl-coenzyme A synthetases of Saccharomyces cerevisiae differ with respect to kinetic
properties and transcriptional regulation. J Biol Chem 1996, 271:28953-28959.
33. Andreadis A, Hsu YP, Hermodson M, Kohlhaw G, Schimmel P: Yeast LEU2. Repression of
mRNA by leucine and primary structure of the gene product. J Biol Chem 1984, 259:8059-8062.
34. Hsu YP, Schimmel P: Yeast LEU1: Repression of mRNA levels by leucine and relationship of
5’-noncoding region to that of LEU2. J Biol Chem 1984, 259:3714-3719.
35. Holmberg S, Petersen JG: Regulation of isoleucine-valine biosynthesis in Saccharomyces
cerevisiae. Curr Genet 1988, 13:207-217.
36. Ball SG, Wickner RB, Corrarei G, Schaus M, Tirtiaux C: Molecular cloning and characterization
of ARO7-OSM2, a single yeast gene necessary for chorismate mutase activity and growth in
hypertonic medium. Mol Gen Genet 1986, 205:326-30.
37. Iraqui I, Vissers S, Cartiaux M, Urrestarazu A: Characterization of Saccharomyces cerevisiae
ARO8 and ARO9 genes encoding aromatic aminotransferases I and II reveals a new
amintransferase subfamily. Mol Gen Genet 1998, 257:238-248.
38. Vuralhan Z, Morais MA, Tai S-L, Piper MDW, Pronk JT: Identification and characterization of
phenylpyruvate decarboxylase genes in Saccharomyces cerevisiae. Appl Environ Microbiol 2003,
69:4534-4541.

68
39. Navarro-Aviño JP, Prasad R, Miralles VJ, Benito RM, Serrano R: A proposal for nomeclature of
aldehyde dehydrogenases in Saccharomyces cerevisiae and characterization of the stress-
inducible ALD2 and ALD3 genes. Yeast 1999, 15:829-842.
40. Wang X, Mann CJ, Bai Y, Ni L, Weiner H: Molecular cloning, characterization, and potential
roles of cytosolic and mitochondrial aldehyde dehydrogenases in ethanol metabolism in
Saccharomyces cerevisiae. J Bacteriol 1998, 180:822-830.
41. Saint-Prix F, Bönquist L, Dequin S: Functional analysis of the ALD gene family of
Saccharomyces cerevisiae during anaerobic growth on glucose: the NADP+ -dependent Aldp6p
and Aldp5p isoforms play a major role in acetate formation. Microbiology 2004, 150:2209-2220.
42. Larroy C, Parés X, Biosca JA: Characterization of a Saccharomyces cerevisiae NADP(H)-
dependent alcohol dehydrogenase (ADH7), a member of the cinnamyl alcohol dehydrogenase
family. Eur J Biochem 2002, 269:5738-5745.
43. Vestrepen KJ, Van Laere SD, Vanderhaegen BM, Derdelinckx G, Dufour JP, Pretorius IS,
Winderickx J, Thevelein JM, Delvaux FR: Expression levels of the yeast alcohol acetyltransferase
genes ATF1, Lg-ATF1, and ATF2 control the formation of a broad range of volatile esters.
Appl Environ Microbiol 2003, 69:5228-5237.
44. Saerens SMG, Verstrepen KJ, Van Laere SDM, Voet ARD, Van Dijck P, Delvaux FR Thevelein
JM: The Saccharomyces cerevisiae EHT1 and EEB1 genes encode novel enzymes with medium-
chain fatty acid ethyl ester synthesis and hydrolysis capacity. J Biol Chem 2006, 281:4446-4456.
45. Alexander NJ, McCormick SP, Hohn TM: The identification of the Saccharomyces cerevisiae
gene AYT1(ORF-YLL063C) encoding an acetyltransferase. Yeast 2003, 19:1425-1430.

69
Appendix GENE NAME SYSTEMATIC
NAME
AAD3 YCR107W
AAD3 YCR107W
POT1 YIL160C
LEU2 YCL018W
ALD3 YMR169C
SFA1 YDL168W
EEB1 YPL095C
YJL218W YJL218W
ARO1 YDR127W
ADH6 YMR318C
ATF2 YGR177C
ARO10 YDR380W
PDC6 YGR087C
ALP1 YNL270C
ALD5 YER073W
ARO7 YPR060C
ADH3 YMR083W
ACS1 YAL054C
GRE2 YOL151W
HPA3 YEL066W
BAP3 YDR046C
HAT2 YEL056W
ILV5 YLR355C
ARO4 YBR249C
ILV3 YJR016C
ADH2 YMR303C
VBA3 YCL069W
FDH1 /// FDH2 YOR388C
AAD10 YJR155W
FUNCTIONAL DESCRIPTION (BRIEF)
Putative aryl-alcohol dehydrogenase with similarity to P. chrysosporium aryl-alcohol dehydrogenase; mutational analysis has not yet revealed a physiological role
Putative aryl-alcohol dehydrogenase with similarity to P. chrysosporium aryl-alcohol dehydrogenase; mutational analysis has not yet revealed a physiological role
3-ketoacyl-CoA thiolase with broad chain length specificity, cleaves 3-ketoacyl-CoA into acyl-CoA and acetyl-CoA during beta-oxidation of fatty acids
Beta-isopropylmalate dehydrogenase, catalyzes the third step in the leucine biosynthesis pathway
Cytoplasmic aldehyde dehydrogenase, involved in beta-alanine synthesis; uses NAD+ as the preferred coenzyme; very similar to Ald2p; expression is induced by stress and repressed by glucose
Bifunctional enzyme containing both alcohol dehydrogenase and glutathione-dependent formaldehyde dehydrogenase activities, functions in formaldehyde detoxification and formation of long chain and complex alcohols
Acyl-coenzymeA:ethanol O-acyltransferase responsible for the major part of medium-chain fatty acid ethyl ester biosynthesis during fermentation; possesses short chain esterase activity
Putative protein of unknown function, similar to bacterial galactoside O-acetyltransferases; induced by oleate in an OAF1/PIP2-dependent manner
Pentafunctional arom protein, catalyzes steps 2 through 6 in the biosynthesis of chorismate, which is a precursor to aromatic amino acids
NADPH-dependent cinnamyl alcohol dehydrogenase family member with broad substrate specificity; may be involved in fusel alcohol synthesis or in aldehyde tolerance
Alcohol acetyltransferase, may play a role in steroid detoxification; forms volatile esters during fermentation, which is important in brewing
Phenylpyruvate decarboxylase, catalyzes decarboxylation of phenylpyruvate to phenylacetaldehyde, which is the first specific step in the Ehrlich pathway
Minor isoform of pyruvate decarboxylase, key enzyme in alcoholic fermentation, decarboxylates pyruvate to acetaldehyde, regulation is glucose- and ethanol-dependent, involved in amino acid catabolism
Basic amino acid transporter, involved in uptake of cationic amino acids
Mitochondrial aldehyde dehydrogenase, involved in regulation or biosynthesis of electron transport chain components and acetate formation; activated by K+; utilizes NADP+ as the preferred coenzyme; constitutively expressed
Chorismate mutase, catalyzes the conversion of chorismate to prephenate to initiate the tyrosine/phenylalanine-specific branch of aromatic amino acid biosynthesis
Mitochondrial alcohol dehydrogenase isozyme III; involved in the shuttling of mitochondrial NADH to the cytosol under anaerobic conditions and ethanol production
Acetyl-coA synthetase isoform which, along with Acs2p, is the nuclear source of acetyl-coA for histone acetlyation; expressed during growth on nonfermentable carbon sources and under aerobic conditions
NADPH-dependent methylglyoxal reductase (D-lactaldehyde dehydrogenase); stress induced (osmotic, ionic, oxidative, heat shock and heavy metals); regulated by the HOG pathway
D-Amino acid N-acetyltransferase; similar to Hpa2p, acetylates histones weakly in vitro
Amino acid permease involved in the uptake of cysteine, leucine, isoleucine and valine
Subunit of the Hat1p-Hat2p histone acetyltransferase complex;
Acetohydroxyacid reductoisomerase, mitochondrial protein involved in branched-chain amino acid biosynthesis, also required for maintenance of wild-type mitochondrial DNA
3-deoxy-D-arabino-heptulosonate-7-phosphate (DAHP) synthase, catalyzes the first step in aromatic amino acid biosynthesis and is feedback-inhibited by tyrosine or high concentrations of phenylalanine or tryptophan
Dihydroxyacid dehydratase, catalyzes third step in the common pathway leading to biosynthesis of branched-chain amino acids
Glucose-repressible alcohol dehydrogenase II, catalyzes the conversion of ethanol to acetaldehyde; involved in the production of certain carboxylate esters; regulated by ADR1
Permease of basic amino acids in the vacuolar membrane /// Hypothetical protein
NAD(+)-dependent formate dehydrogenase, may protect cells from exogenous formate
Putative aryl-alcohol dehydrogenase with similarity to P. chrysosporium aryl-alcohol dehydrogenase; mutational analysis has not yet revealed a physiological role
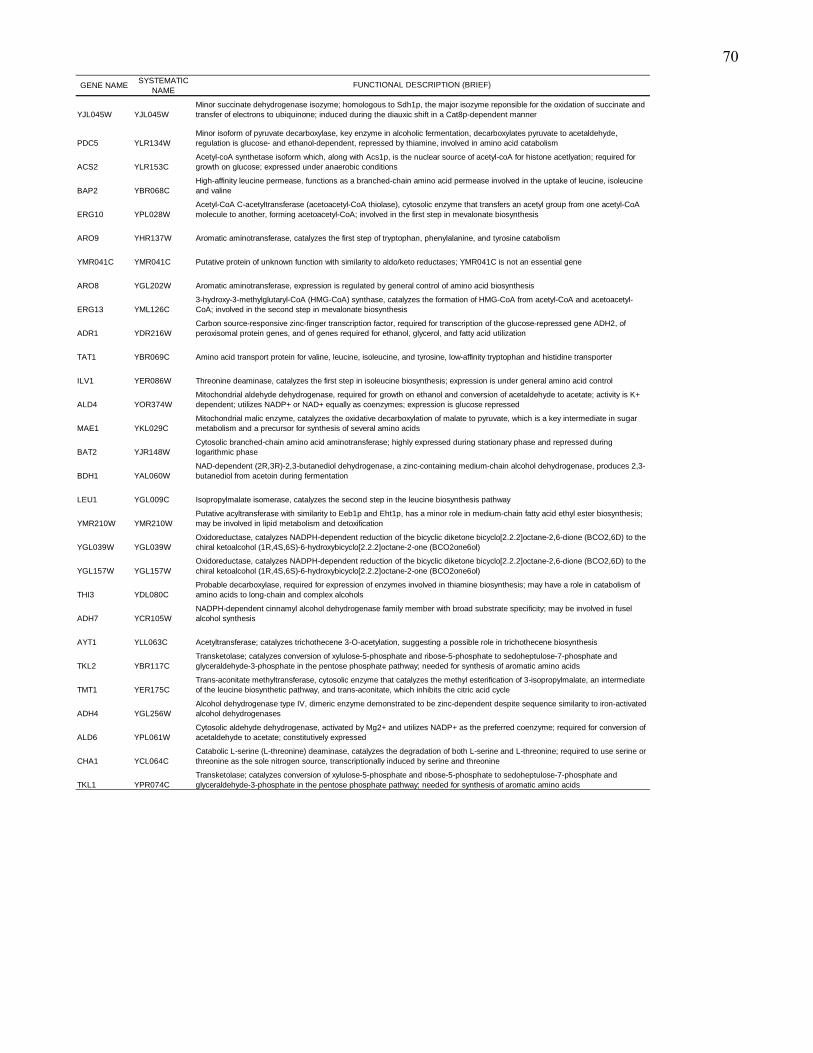
70
GENE NAME SYSTEMATICNAME
YJL045W YJL045W
PDC5 YLR134W
ACS2 YLR153C
BAP2 YBR068C
ERG10 YPL028W
ARO9 YHR137W
YMR041C YMR041C
ARO8 YGL202W
ERG13 YML126C
ADR1 YDR216W
TAT1 YBR069C
ILV1 YER086W
ALD4 YOR374W
MAE1 YKL029C
BAT2 YJR148W
BDH1 YAL060W
LEU1 YGL009C
YMR210W YMR210W
YGL039W YGL039W
YGL157W YGL157W
THI3 YDL080C
ADH7 YCR105W
AYT1 YLL063C
TKL2 YBR117C
TMT1 YER175C
ADH4 YGL256W
ALD6 YPL061W
CHA1 YCL064C
TKL1 YPR074C
FUNCTIONAL DESCRIPTION (BRIEF)
Minor succinate dehydrogenase isozyme; homologous to Sdh1p, the major isozyme reponsible for the oxidation of succinate and transfer of electrons to ubiquinone; induced during the diauxic shift in a Cat8p-dependent manner
Minor isoform of pyruvate decarboxylase, key enzyme in alcoholic fermentation, decarboxylates pyruvate to acetaldehyde, regulation is glucose- and ethanol-dependent, repressed by thiamine, involved in amino acid catabolism
Acetyl-coA synthetase isoform which, along with Acs1p, is the nuclear source of acetyl-coA for histone acetlyation; required for growth on glucose; expressed under anaerobic conditions
High-affinity leucine permease, functions as a branched-chain amino acid permease involved in the uptake of leucine, isoleucine and valine
Acetyl-CoA C-acetyltransferase (acetoacetyl-CoA thiolase), cytosolic enzyme that transfers an acetyl group from one acetyl-CoA molecule to another, forming acetoacetyl-CoA; involved in the first step in mevalonate biosynthesis
Aromatic aminotransferase, catalyzes the first step of tryptophan, phenylalanine, and tyrosine catabolism
Putative protein of unknown function with similarity to aldo/keto reductases; YMR041C is not an essential gene
NADPH-dependent cinnamyl alcohol dehydrogenase family member with broad substrate specificity; may be involved in fusel alcohol synthesis
Acetyltransferase; catalyzes trichothecene 3-O-acetylation, suggesting a possible role in trichothecene biosynthesis
NAD-dependent (2R,3R)-2,3-butanediol dehydrogenase, a zinc-containing medium-chain alcohol dehydrogenase, produces 2,3-butanediol from acetoin during fermentation
Isopropylmalate isomerase, catalyzes the second step in the leucine biosynthesis pathway
Putative acyltransferase with similarity to Eeb1p and Eht1p, has a minor role in medium-chain fatty acid ethyl ester biosynthesis; may be involved in lipid metabolism and detoxification
Oxidoreductase, catalyzes NADPH-dependent reduction of the bicyclic diketone bicyclo[2.2.2]octane-2,6-dione (BCO2,6D) to the chiral ketoalcohol (1R,4S,6S)-6-hydroxybicyclo[2.2.2]octane-2-one (BCO2one6ol)
Oxidoreductase, catalyzes NADPH-dependent reduction of the bicyclic diketone bicyclo[2.2.2]octane-2,6-dione (BCO2,6D) to the chiral ketoalcohol (1R,4S,6S)-6-hydroxybicyclo[2.2.2]octane-2-one (BCO2one6ol)
Probable decarboxylase, required for expression of enzymes involved in thiamine biosynthesis; may have a role in catabolism of amino acids to long-chain and complex alcohols
Catabolic L-serine (L-threonine) deaminase, catalyzes the degradation of both L-serine and L-threonine; required to use serine or threonine as the sole nitrogen source, transcriptionally induced by serine and threonine
Transketolase; catalyzes conversion of xylulose-5-phosphate and ribose-5-phosphate to sedoheptulose-7-phosphate and glyceraldehyde-3-phosphate in the pentose phosphate pathway; needed for synthesis of aromatic amino acids
Threonine deaminase, catalyzes the first step in isoleucine biosynthesis; expression is under general amino acid control
Mitochondrial aldehyde dehydrogenase, required for growth on ethanol and conversion of acetaldehyde to acetate; activity is K+ dependent; utilizes NADP+ or NAD+ equally as coenzymes; expression is glucose repressed
Carbon source-responsive zinc-finger transcription factor, required for transcription of the glucose-repressed gene ADH2, of peroxisomal protein genes, and of genes required for ethanol, glycerol, and fatty acid utilization
Amino acid transport protein for valine, leucine, isoleucine, and tyrosine, low-affinity tryptophan and histidine transporter
Mitochondrial malic enzyme, catalyzes the oxidative decarboxylation of malate to pyruvate, which is a key intermediate in sugar metabolism and a precursor for synthesis of several amino acids
Cytosolic branched-chain amino acid aminotransferase; highly expressed during stationary phase and repressed during logarithmic phase
Aromatic aminotransferase, expression is regulated by general control of amino acid biosynthesis
3-hydroxy-3-methylglutaryl-CoA (HMG-CoA) synthase, catalyzes the formation of HMG-CoA from acetyl-CoA and acetoacetyl-CoA; involved in the second step in mevalonate biosynthesis
Transketolase; catalyzes conversion of xylulose-5-phosphate and ribose-5-phosphate to sedoheptulose-7-phosphate and glyceraldehyde-3-phosphate in the pentose phosphate pathway; needed for synthesis of aromatic amino acids
Trans-aconitate methyltransferase, cytosolic enzyme that catalyzes the methyl esterification of 3-isopropylmalate, an intermediate of the leucine biosynthetic pathway, and trans-aconitate, which inhibits the citric acid cycle
Alcohol dehydrogenase type IV, dimeric enzyme demonstrated to be zinc-dependent despite sequence similarity to iron-activated alcohol dehydrogenases
Cytosolic aldehyde dehydrogenase, activated by Mg2+ and utilizes NADP+ as the preferred coenzyme; required for conversion of acetaldehyde to acetate; constitutively expressed
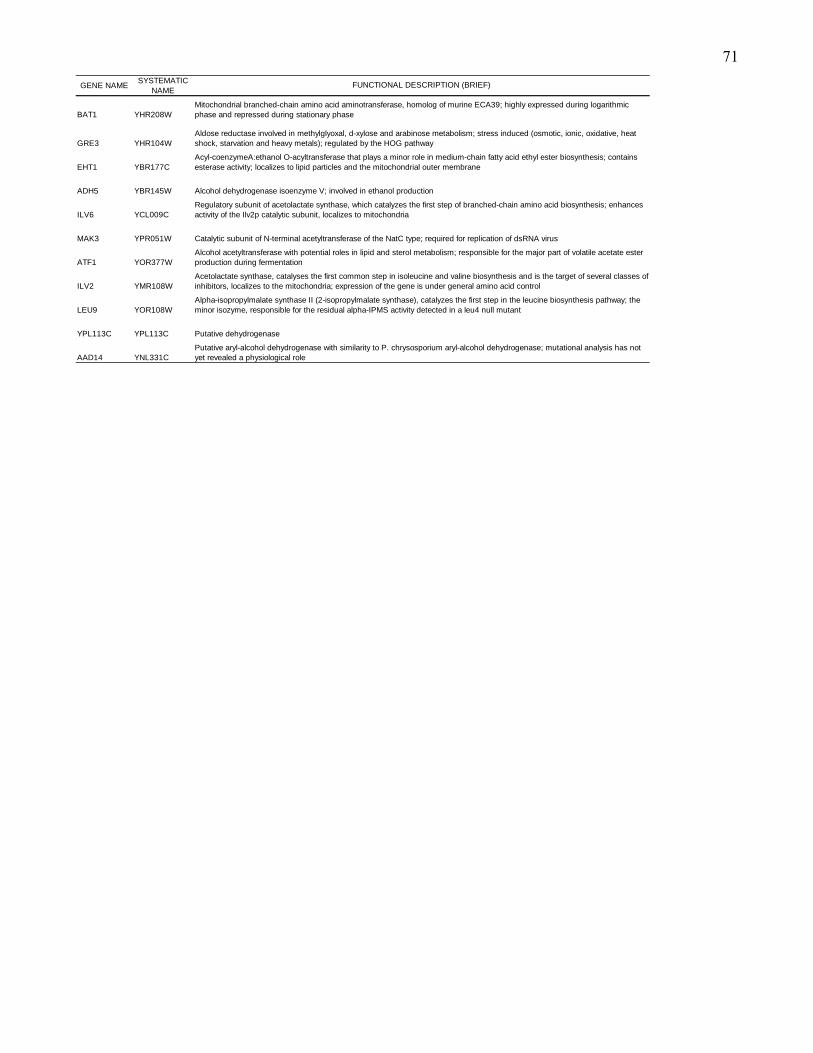
71
GENE NAME SYSTEMATICNAME
BAT1 YHR208W
GRE3 YHR104W
EHT1 YBR177C
ADH5 YBR145W
ILV6 YCL009C
MAK3 YPR051W
ATF1 YOR377W
ILV2 YMR108W
LEU9 YOR108W
YPL113C YPL113C
AAD14 YNL331C
Alcohol acetyltransferase with potential roles in lipid and sterol metabolism; responsible for the major part of volatile acetate ester production during fermentation
Acetolactate synthase, catalyses the first common step in isoleucine and valine biosynthesis and is the target of several classes of inhibitors, localizes to the mitochondria; expression of the gene is under general amino acid control
Alpha-isopropylmalate synthase II (2-isopropylmalate synthase), catalyzes the first step in the leucine biosynthesis pathway; the minor isozyme, responsible for the residual alpha-IPMS activity detected in a leu4 null mutant
Putative dehydrogenase
Putative aryl-alcohol dehydrogenase with similarity to P. chrysosporium aryl-alcohol dehydrogenase; mutational analysis has not yet revealed a physiological role
FUNCTIONAL DESCRIPTION (BRIEF)
Mitochondrial branched-chain amino acid aminotransferase, homolog of murine ECA39; highly expressed during logarithmic phase and repressed during stationary phase
Aldose reductase involved in methylglyoxal, d-xylose and arabinose metabolism; stress induced (osmotic, ionic, oxidative, heat shock, starvation and heavy metals); regulated by the HOG pathway
Acyl-coenzymeA:ethanol O-acyltransferase that plays a minor role in medium-chain fatty acid ethyl ester biosynthesis; contains esterase activity; localizes to lipid particles and the mitochondrial outer membrane
Alcohol dehydrogenase isoenzyme V; involved in ethanol production
Regulatory subunit of acetolactate synthase, which catalyzes the first step of branched-chain amino acid biosynthesis; enhances activity of the Ilv2p catalytic subunit, localizes to mitochondria
Catalytic subunit of N-terminal acetyltransferase of the NatC type; required for replication of dsRNA virus
72
CChhaapptteerr 44
Research results
Comparative transcriptomic responses of wine yeast
strains in different fermentation media: towards
understanding the interaction between environment and
transcriptome during alcoholic fermentation
This manuscript was publihsed in: Applied Microbiology and Biotechnology 2009, 84:937-954
Authors:
Debra Rossouw & Florian F Bauer
73
CHAPTER 4
Comparative transcriptomic responses of wine yeast strains in different
fermentation media: towards understanding the interaction between
environment and transcriptome during alcoholic fermentation
4.1 Abstract System-wide ‘omics’ approaches have been widely applied in Saccharomyces cerevisiae. The large
majority of such studies have been focusing on a limited number of laboratory strains to provide
general insights into the nature of biological systems. More recently, industrial S. cerevisiae strains
have become the target of such analyses, mainly to improve our understanding of biotechnologically
relevant phenotypes that can not be adequately studied in laboratory strains. While such studies have
provided significant insights, they have mostly, if not exclusively, been based on investigating single
strains in a single medium. This experimental lay-out does not allow differentiating between generally
relevant molecular responses and strain- or media-specific features. Here we analysed the
transcriptomes of two phenotypically diverging wine yeast strains in two different fermentation media
at three stages of wine fermentation. The data show that the intersection of transcriptome datasets from
fermentations using either synthetic MS300 (simulated wine must) or real grape must (Colombard) can
help to delineate relevant from ‘noisy’ changes in gene expression in response to experimental factors
such as fermentation stage and strain identity. The differences in the expression profiles of strains in
the different environments also provide some relevant insights into the transcriptional responses
towards specific compositional features of the media. In a broader cellular context, the data also
suggest that the synthetic must MS300 is a representative environment for conducting research on
grape must fermentation and industrially relevant properties of wine yeast strains.
4.2 Introduction Research on the model eukaryote, S. cerevisiae, has mainly been conducted using laboratory strains
under laboratory conditions in laboratory media. Most approaches were designed to facilitate genetic
and molecular analysis and were not representative of the natural or industrial ecological niches that
provided the evolutionary framework for this species in the past centuries. As a probable consequence,
laboratory conditions and strains appear unsuited for the analysis of many genes and their function/s,
and in particular of many biotechnologically relevant phenotypes.
74
In the case of wine fermentation, some of the most obvious differences to standard laboratory
conditions include very high sugar levels (20-30% w/v) of an equimolar mixture of glucose and
fructose, a low pH (pH 3.0-3.8), self-anaerobic growth and nitrogen as the limiting nutrient for growth.
In these conditions, metabolism is programmed to optimize yeast cells for fermentative dissimilation of
the carbon source. During alcoholic fermentation yeast cells are also exposed simultaneously and
sequentially to numerous stress conditions (Attfield, 1997; Bauer & Pretorius, 2000). The yeast must
respond to fluctuations in dissolved oxygen concentration, pH, osmolarity, ethanol concentration,
nutrient supply and temperature in order to survive. Not surprisingly, data suggest that the fermentation
performance of industrial wine yeast strains is largely dependent on their ability to adapt to these
changes (Ivorra et al., 1999).
Analysis of the molecular adaptations and responses in such a complex system in the past had to use a
reductionist, gene-by-gene approach. Large scale functional genomic analysis tools today open the way
for new approaches to allow a holistic understanding of these molecular systems. Several such
approaches have been undertaken to analyze wine yeast strains and wine fermentation conditions. The
synthetic wine must MS300 has been used to investigate transcriptional changes during fermentation of
a single yeast strain (Rossignol et al., 2003). Other transcriptional studies of wine yeast have relied on
different wine musts such as Riesling (Marks et al., 2003; Marks et al., 2008) and Muscat (Beltran et
al., 2006) for fermentations of single strains only. These studies have identified differentially expressed
transcripts in these specific strains in response to experimental factors such as temperature, nitrogen
availability and fermentative stage. However, no attempt has been made to compare the effects that
different grape-based or grape-like fermentation media have on the transcriptional responses of wine
yeast strains, or to assess the effect of strain identity. It is therefore unknown to what degree the data
derived from such studies are representative of wine fermentations in the broader context, and to what
degree comparisons between transcript data from different fermentation media reflect biologically
relevant responses to general fermentation conditions as opposed to media-specific responses.
In a previous work (Rossouw et al., 2008), we have been able to show that complex molecular systems
can be fruitfully analysed by taking a comparative approach. In this study, several phenotypically
diverging wine yeast strains were compared on a transcriptomic and metabolomic level. These data
allowed us to predict the impact of individual gene expression levels on a complex metabolic network
in the conditions that were used to generate the initial data sets. To provide comparable datasets, all
analyses were conducted in a well-defined synthetic medium that approximates conditions encountered
75
in grape must, and which has been used in many studies to provide conditions that are representative of
wine fermentation. A question that requires further investigation is therefore whether data generated in
such a system can serve as a general model and be extrapolated to events occurring in real grape must,
a medium that is infinitely more complex and highly variable.
In this study, we therefore conducted parallel fermentations with two phenotypically highly divergent
commercial wine yeast strains, VIN13 and BM45, in two different media, namely the synthetic MS300
and real Colombard must. The data show that the intersection of transcriptome datasets from both
MS300 (simulated wine must) and Colombard fermentations can help to delineate relevant from
‘noisy’ changes in gene expression in response to experimental factors such as fermentation stage and
strain identity. Differences in the expression profiles of strains in different environments also provide
some insights into the transcriptional responses towards specific compositional features of the media.
In a broader cellular context, the data also show that the synthetic must MS300 is a representative
environment for conducting research on grape must fermentation and industrially relevant properties of
wine yeast strains.
4.3 Methods 4.3.1 Strains, media and culture conditions
The two yeast strains used in this study are BM45 (Lallemand Inc., Montréal, Canada) and VIN13
(Anchor yeast, South Africa). Both are diploid S. cerevisiae strains used in industrial wine
fermentations. Yeast cells were cultivated at 30oC in YPD synthetic media 1% yeast extract (Biolab,
South Africa), 2% peptone (Fluka, Germany), 2% glucose (Sigma, Germany). Solid medium was
supplemented with 2% agar (Biolab, South Africa).
4.3.2 Fermentation media
One set of fermentation experiments was carried out with synthetic must MS300, which approximates
to a natural must as previously described (Bely et al., 1990). The medium contained 125 g/L glucose
and 125 g/L fructose, and the pH was buffered at 3.3 with NaOH. The second complementary set of
fermentations was carried out with a 2008 Colombard must (pH 3.5) containing 108 g/L glucose and
117 g/L fructose.
76
4.3.3 Fermentation conditions
All fermentations were carried out under microaerobic conditions in 100ml glass bottles (containing 80
ml of the medium) sealed with rubber stoppers with a CO2 outlet. The fermentation temperature was
approximately 22oC and no stirring was performed during the course of the fermentation. Fermentation
bottles were inoculated with YPD cultures in the logarithmic growth phase (around OD600 = 1) to an
OD600 of 0.1 (i.e. a final cell density of approximately 106 cfu.ml-1). The cells from the YPD pre-
cultures were briefly centrifuged and resuspended in MS300 or Colombard must to avoid carryover of
YPD to the fermentation media. The fermentations followed a time course of 14 days and the bottles
were weighed daily to assess the progress of fermentation. Samples of the fermentation media and cells
were taken at days 2, 5 and 14 as representative of the exponential, early logarithmic and late
logarithmic growth phases respectively.
4.3.4 Measurement of growth
Cell proliferation (i.e. growth) was determined spectrophotometrically (PowerwaveX, Bio-Tek
Instruments) by measuring the optical density (at 600 nm) of 200 µl samples of the suspensions over
the 14 day experimental period.
4.3.5 Analytical methods - HPLC
Culture supernatants were obtained from the cell-free upper layers of the fermentation media. For the
purposes of glucose determination and carbon recovery, culture supernatants and starting media were
analyzed by high performance liquid chromatography (HPLC) on an AMINEX HPX-87H ion exchange
column (at a temperature of 55 oC) using 5 mM H2SO4 as the mobile phase at a flow rate of 0.5 ml.min-
1. Agilent RID and UV detectors were used in tandem for peak detection and quantification. Analysis
was carried out using the HPChemstation software package.
4.3.6 Analytical methods - LCMS
The amino acid composition of the grape must was determined by liquid chromatography mass
spectrometry. Samples were analyzed using the EZ:Faast LCMS protocol (Phenomenex, UK). After
solid phase extraction and derivatization the samples were subjected to LCMS analysis using the
EZ:Faast column (method described by the EZ:Faast user’s guide). Labelled Homoarginine,
Methionine-D3 and homophenylalanine were included as internal standards.
77
4.3.7 Analytical methods - GCMS
Each 5 ml sample of synthetic must taken during fermentation was spiked with an internal standard of
4-methyl-2-pentanol to a final concentration of 10 mg.l-1. To each of these samples 1 ml of solvent
(diethyl ether) was added and the tubes sonicated for 5 minutes. The top layer in each tube was
separated by centrifugation at 3000 rpm for 5 minutes and the extract analyzed. After mixing, 3 μl of
each sample was injected into the gas chromatograph (GC). All extractions were done in triplicate.
The analysis of volatile compounds was carried out on a Hewlett Packard 5890 Series II GC coupled to
an HP 7673 auto-sampler and injector and an HP 3396A integrator. The column used was a Lab
Alliance organic-coated, fused silica capillary with dimensions of 60 m × 0.32 mm internal diameter
with a 0.5 μm coating thickness. The injector temperature was set to 200°C, the split ratio to 20:1 and
the flow rate to 15 ml.min-1, with hydrogen used as the carrier gas for a flame ionisation detector held
at 250°C. The oven temperature was increased from 35°C to 230°C at a ramp of 3°C min 1.
Internal standards (from Merck, Cape Town) were used to calibrate the machine for each of the
compounds measured.
4.3.8 General statistical analysis
T-tests and anova analyses were conducted using Statistica (version 7). HCL and KMC clustering were
carried out using TIGR MeV v2.2 (Ben-Dor et al., 1999).
4.3.9 Microarray analysis
Sampling of cells from fermentations and total RNA extraction was performed as described by Abbott
et al., (2007). Probe preparation and hybridization to Affymetrix Genechip® microarrays were
performed according to Affymetrix instructions, starting with 6 μg of total RNA. Results for each strain
and time point were derived from 3 independent culture replicates. The quality of total RNA, cDNA,
cRNA and fragmented cRNA were confirmed using the Agilent Bioanalyzer 2100.
4.3.10 Transcriptomics data acquisition and statistical analysis
Microarray data for the MS300 fermentations can be viewed at the GEO repository under the accession
number GSE11651. The Colombard microarray outputs are available under the accession number
GSE13695. Acquisition and quantification of array images and data filtering were performed using
Affymetrix GeneChip® Operating Software (GCOS) version 1.4. All arrays were scaled to a target
78
value of 500 using the average signal from all gene features using GCOS. Genes with expression
values below 12 were set to 12 + the expression value as previously described (Boer et al., 2003) in
order to eliminate insignificant variations.
Determination of differential gene expression between experimental parameters was conducted using
SAM (Significance Analysis of Microarrays) version 2 (Tusher et al., 2001). The two-class, unpaired
setting was used and genes with a Q value less than 0.5 (p < 0,0005) were considered differentially
expressed. Only genes with a fold change greater than 2 (positive or negative) were taken into
consideration.
4.3.11 Analyses of multivariate data
The patterns within the different sets of data were investigated by principal-component analysis (PCA;
The Unscrambler; Camo Inc., Corvallis, Oreg.). PCA is a bilinear modeling method which gives a
visually interpretable overview of the main information in large, multidimensional data sets. By
plotting the principal components it is possible to view statistical relationships between different
variables in complex data sets and detect and interpret sample groupings, similarities or differences, as
well as the relationships between the different variables (Mardia et al., 1979).
4.4 Results 4.4.1 Composition of wine must
The most relevant characteristics of the Colombard must, including pH (3.5) and sugar concentrations
(108 g/L glucose and 117 g/L fructose) were determined. In addition, the amino acid concentrations of
the must was determined by LCMS and compared to the composition of MS300 (Table 1), since amino
acids are the primary precursors of many aroma compounds.
The total amino acid content of the Colombard must is much lower than that of MS300 (approximately
1.2 g.L-1 as opposed to 2.4 g.L-1). However, the fact that trypthophan and cystein are largely destroyed
by the sample preparation procedure should be taken into consideration. Also, recoveries for sulfur-
containing amino acids such as tyrosine and methionine can be as low as 50 - 75%. Overall, the most
significant differences in the amino acid concentrations of the two media were found for glutamine,
arginine, leucine, glycine, threonine and methionine.

79
Table 1 Concentrations of the amino acids (in mg.L-1) in Colombard must in comparison to the standard MS300 composition. Amino acids that are present at concentrations below the detection limit are indicated by ‘bd’. The last column represents amino acids in the Colombard must as a percentage of the corresponding amino acids in MS300.
Amino AcidMS300[mg/l]
Colombar[mg/l] %
tyrosine 18.3 20.9 114.0
tryptophan 179.3 n/a n/a
isoleucine 32.7 20.9 63.9
aspartic acid 44.5 78.5 176.4
glutamic acid 120.4 76.7 63.7
arginine 374.4 67.6 18.1
leucine 48.4 18.4 38.0
threonine 75.9 41.6 54.8
glycine 18.3 9.4 51.3
glutamine 505.3 112.8 22.3
alanine 145.3 170.5 117.3
valine 44.5 55.4 124.5
methionine 31.4 2.5 8.0
phenylalanine 38.0 20.4 53.7
serine 78.5 90.7 115.5
histidine 32.7 39 119.2
lysine 17.0 bd 0.0
cystein 13.1 n/a n/a
proline 612.6 424 69.2
4.4.2 Fermentation kinetics
The BM45 and VIN13 strains generally displayed similar growth rates and primary fermentation
kinetics such as fermentation rate, sugar utilization, ethanol production etc, regardless of the
fermentation media (Figures 1 and 2). The strains followed typical wine fermentation patterns and all
fermented to dryness within the monitored period.
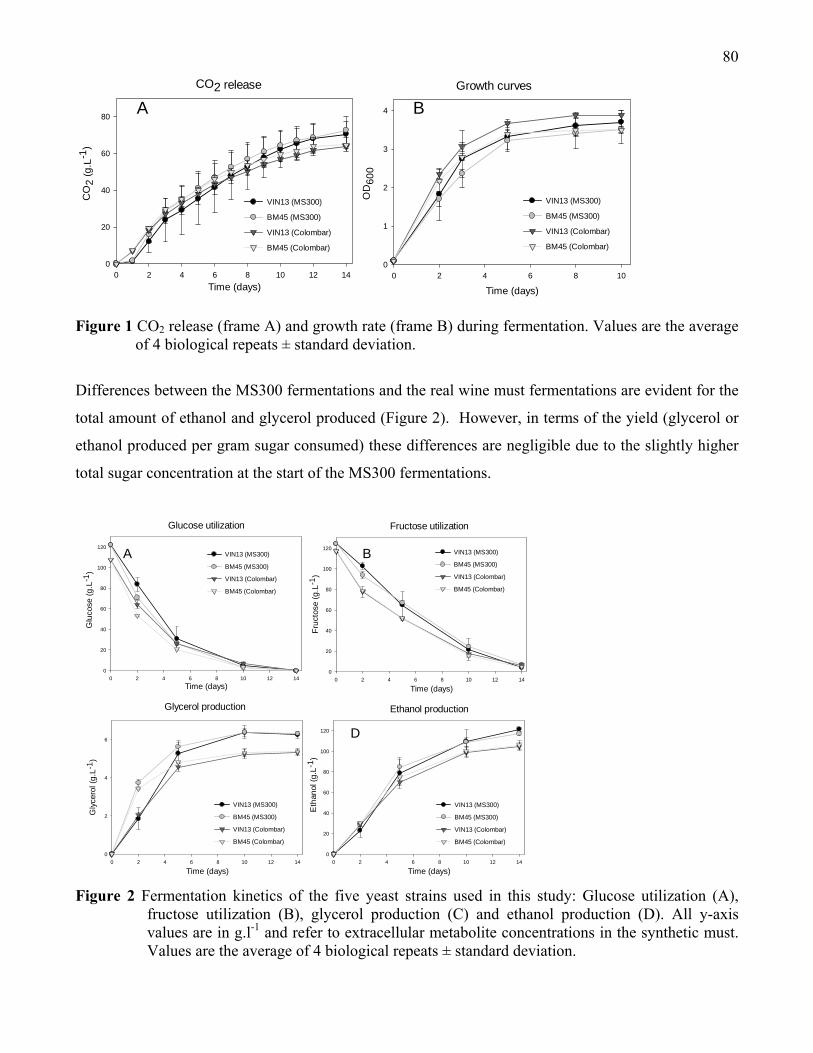
80
Figure 1 CO2 release (frame A) and growth rate (frame B) during fermentation. Values are the average of 4 biological repeats ± standard deviation.
Differences between the MS300 fermentations and the real wine must fermentations are evident for the
total amount of ethanol and glycerol produced (Figure 2). However, in terms of the yield (glycerol or
ethanol produced per gram sugar consumed) these differences are negligible due to the slightly higher
total sugar concentration at the start of the MS300 fermentations.
Figure 2 Fermentation kinetics of the five yeast strains used in this study: Glucose utilization (A),
fructose utilization (B), glycerol production (C) and ethanol production (D). All y-axis values are in g.l-1 and refer to extracellular metabolite concentrations in the synthetic must. Values are the average of 4 biological repeats ± standard deviation.
Glucose utilization
Time (days)0 2 4 6 8 10 12 14
Glu
cose
(g.L
-1)
0
20
40
60
80
100
120
Fructose utilization
Time (days)0 2 4 6 8 10 12 14
Fruc
tose
(g.L
-1)
0
20
40
60
80
100
120VIN13 (MS300)
BM45 (MS300)
VIN13 (Colombar)
BM45 (Colombar)
Glycerol production
Time (days)0 2 4 6 8 10 12 14
Gly
cero
l (g.
L-1 )
0
2
4
6
Ethanol production
Time (days)0 2 4 6 8 10 12 14
Eth
anol
(g.L
-1)
0
20
40
60
80
100
120
VIN13 (MS300)
BM45 (MS300)
VIN13 (Colombar)
BM45 (Colombar)
VIN13 (MS300)
BM45 (MS300)
VIN13 (Colombar)
BM45 (Colombar)
VIN13 (MS300)
BM45 (MS300)
VIN13 (Colombar)
BM45 (Colombar)
A B
D
CO2 release
Time (days)0 2 4 6 8 10 12 14
CO
2 (g
.L-1
)
0
20
40
60
80
Growth curves
Time (days)0 2 4 6 8 10
OD
600
0
1
2
3
4
VIN13 (MS300)
BM45 (MS300)
VIN13 (Colombar)
BM45 (Colombar)
VIN13 (MS300)
BM45 (MS300)
VIN13 (Colombar)
BM45 (Colombar)
A B
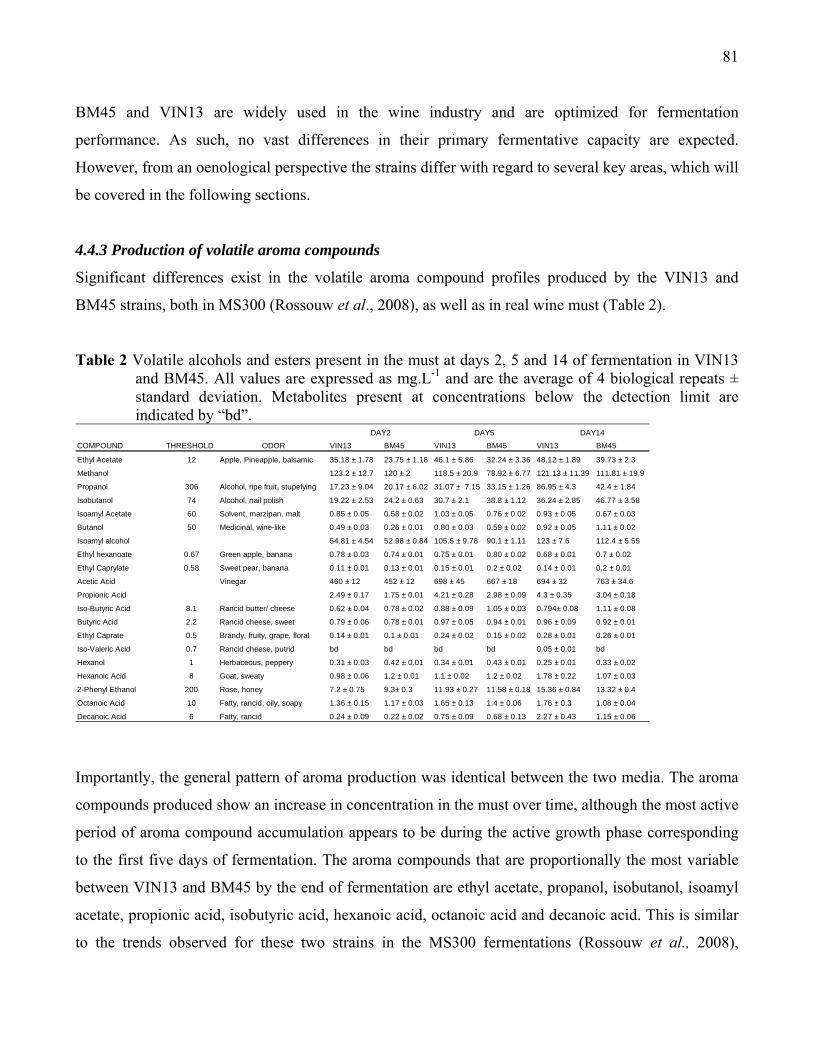
81
BM45 and VIN13 are widely used in the wine industry and are optimized for fermentation
performance. As such, no vast differences in their primary fermentative capacity are expected.
However, from an oenological perspective the strains differ with regard to several key areas, which will
be covered in the following sections.
4.4.3 Production of volatile aroma compounds
Significant differences exist in the volatile aroma compound profiles produced by the VIN13 and
BM45 strains, both in MS300 (Rossouw et al., 2008), as well as in real wine must (Table 2).
Table 2 Volatile alcohols and esters present in the must at days 2, 5 and 14 of fermentation in VIN13 and BM45. All values are expressed as mg.L-1 and are the average of 4 biological repeats ± standard deviation. Metabolites present at concentrations below the detection limit are indicated by “bd”.
COMPOUND THRESHOLD ODOR VIN13 BM45 VIN13 BM45 VIN13 BM45
Ethyl Acetate 12 Apple, Pineapple, balsamic 35.18 ± 1.78 23.75 ± 1.18 46.1 ± 5.86 32.24 ± 3.36 48.12 ± 1.89 39.73 ± 2.3
Methanol 123.2 ± 12.7 120 ± 2 118.5 ± 20.9 78.92 ± 6.77 121.13 ± 11.39 111.81 ± 19.9
Propanol 306 Alcohol, ripe fruit, stupefying 17.23 ± 9.04 20.17 ± 6.02 31.07 ± 7.15 33.15 ± 1.26 86.95 ± 4.3 42.4 ± 1.84
Isobutanol 74 Alcohol, nail polish 19.22 ± 2.53 24.2 ± 0.63 30.7 ± 2.1 38.8 ± 1.12 36.24 ± 2.85 46.77 ± 3.58
Isoamyl Acetate 60 Solvent, marzipan, malt 0.85 ± 0.05 0.58 ± 0.02 1.03 ± 0.05 0.76 ± 0.02 0.93 ± 0.05 0.67 ± 0.03
Butanol 50 Medicinal, wine-like 0.49 ± 0.03 0.26 ± 0.01 0.80 ± 0.03 0.59 ± 0.02 0.92 ± 0.05 1.11 ± 0.02
Isoamyl alcohol 54.81 ± 4.54 52.98 ± 0.84 105.5 ± 9.78 90.1 ± 1.11 123 ± 7.6 112.4 ± 5.55
Ethyl hexanoate 0.67 Green apple, banana 0.78 ± 0.03 0.74 ± 0.01 0.75 ± 0.01 0.80 ± 0.02 0.68 ± 0.01 0.7 ± 0.02
Ethyl Caprylate 0.58 Sweet pear, banana 0.11 ± 0.01 0.13 ± 0.01 0.15 ± 0.01 0.2 ± 0.02 0.14 ± 0.01 0.2 ± 0.01
Acetic Acid Vinegar 460 ± 12 452 ± 12 698 ± 45 667 ± 18 694 ± 32 763 ± 34.6
Propionic Acid 2.49 ± 0.17 1.75 ± 0.01 4.21 ± 0.28 2.98 ± 0.09 4.3 ± 0.35 3.04 ± 0.18
Iso-Butyric Acid 8.1 Rancid butter/ cheese 0.62 ± 0.04 0.78 ± 0.02 0.88 ± 0.09 1.05 ± 0.03 0.794± 0.08 1.11 ± 0.08
Butyric Acid 2.2 Rancid cheese, sweet 0.79 ± 0.06 0.78 ± 0.01 0.97 ± 0.05 0.94 ± 0.01 0.96 ± 0.09 0.92 ± 0.01
Ethyl Caprate 0.5 Brandy, fruity, grape, floral 0.14 ± 0.01 0.1 ± 0.01 0.24 ± 0.02 0.15 ± 0.02 0.28 ± 0.01 0.26 ± 0.01
Iso-Valeric Acid 0.7 Rancid cheese, putrid bd bd bd bd 0.05 ± 0.01 bd
Hexanol 1 Herbaceous, peppery 0.31 ± 0.03 0.42 ± 0.01 0.34 ± 0.01 0.43 ± 0.01 0.25 ± 0.01 0.33 ± 0.02
Hexanoic Acid 8 Goat, sweaty 0.98 ± 0.06 1.2 ± 0.01 1.1 ± 0.02 1.2 ± 0.02 1.78 ± 0.22 1.07 ± 0.03
2-Phenyl Ethanol 200 Rose, honey 7.2 ± 0.75 9.3± 0.3 11.93 ± 0.27 11.58 ± 0.18 15.36 ± 0.84 13.32 ± 0.4
Octanoic Acid 10 Fatty, rancid, oily, soapy 1.36 ± 0.15 1.17 ± 0.03 1.65 ± 0.13 1.4 ± 0.06 1.76 ± 0.3 1.08 ± 0.04
Decanoic Acid 6 Fatty, rancid 0.24 ± 0.09 0.22 ± 0.02 0.75 ± 0.09 0.68 ± 0.13 2.27 ± 0.43 1.15 ± 0.06
DAY2 DAY5 DAY14
Importantly, the general pattern of aroma production was identical between the two media. The aroma
compounds produced show an increase in concentration in the must over time, although the most active
period of aroma compound accumulation appears to be during the active growth phase corresponding
to the first five days of fermentation. The aroma compounds that are proportionally the most variable
between VIN13 and BM45 by the end of fermentation are ethyl acetate, propanol, isobutanol, isoamyl
acetate, propionic acid, isobutyric acid, hexanoic acid, octanoic acid and decanoic acid. This is similar
to the trends observed for these two strains in the MS300 fermentations (Rossouw et al., 2008),
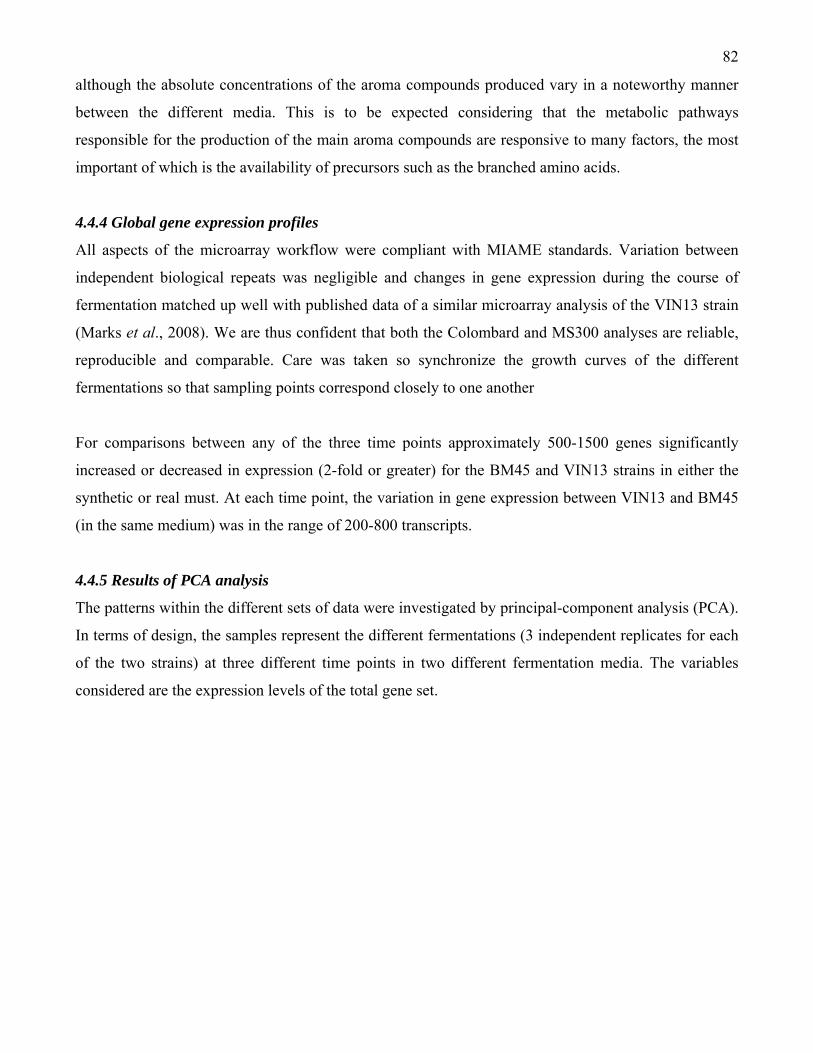
82
although the absolute concentrations of the aroma compounds produced vary in a noteworthy manner
between the different media. This is to be expected considering that the metabolic pathways
responsible for the production of the main aroma compounds are responsive to many factors, the most
important of which is the availability of precursors such as the branched amino acids.
4.4.4 Global gene expression profiles
All aspects of the microarray workflow were compliant with MIAME standards. Variation between
independent biological repeats was negligible and changes in gene expression during the course of
fermentation matched up well with published data of a similar microarray analysis of the VIN13 strain
(Marks et al., 2008). We are thus confident that both the Colombard and MS300 analyses are reliable,
reproducible and comparable. Care was taken so synchronize the growth curves of the different
fermentations so that sampling points correspond closely to one another
For comparisons between any of the three time points approximately 500-1500 genes significantly
increased or decreased in expression (2-fold or greater) for the BM45 and VIN13 strains in either the
synthetic or real must. At each time point, the variation in gene expression between VIN13 and BM45
(in the same medium) was in the range of 200-800 transcripts.
4.4.5 Results of PCA analysis
The patterns within the different sets of data were investigated by principal-component analysis (PCA).
In terms of design, the samples represent the different fermentations (3 independent replicates for each
of the two strains) at three different time points in two different fermentation media. The variables
considered are the expression levels of the total gene set.

83
Figure 3 PCA analysis of whole transcriptome analysis for Colombar and MS300 fermentations. Components 1 and 2, and components 1 and 3, are plotted in frames A and B respectively. Strains can be identified as follows: MS300 VIN13 (green) and BM45 (light blue); Colombar VIN13 (blue) and BM45 (red).
From frame A (Figure 3) it is clear that, not surprisingly, the primary experimental factor responsible
for the variation in gene expression data is time, or rather the stage of fermentation. Three main clusters
are evident along the first component axis corresponding to day2, day5 and day14 sample clusters,
regardless of strain or must. PC1 accounts for 36% of the explained variance in the dataset, and is the
main contributor to the PCA model. Within the broader time-point groupings the biological repeats of
each strain cluster closely together, spreading out along the second component axis (accounting for
19% of the explained variance). The third component (depicted in frame B) clearly divides all the
B
84
samples into two medium-specific sub-groups. As this component only contributes 12% to the total
explained variance, it would seem that the composition of the fermentation must is a lesser contributor
to variance in a fermentation compared to the inherent genetic differences between the two strains and
the stage of fermentation. The remaining six model components together only contribute a further 25%
to explained variance.
4.4.6 Differentially expressed genes
A complete analysis was performed of the inter- and intra- strain genes with statistically significant
changes in gene expression and a fold change greater than positive or negative 2 across strains, time
points and fermentation media. In the case of the intra-strain comparisons between time points, the
overlap between the significantly up/down –regulated genes was in the area of 50-75% when
comparing the MS300 and Colombard outputs. In other words, 50-75% of the genes present in the
MS300 VIN13 day 5 vs. day 2 list also featured on the corresponding analysis of the Colombard data.
This was true for both the VIN13 and BM45 strains. However, for the inter-strain comparisons between
VIN13 and BM45 at the three time points the intersection between gene lists was even greater: Less
than 50 of the genes from the MS300 BM45 vs. VIN13 significance analysis were absent from the
complementary Colombard analysis in the case of days 2 and 5. Only for day 14 were the differences
between the inter-strain analyses greater, amounting to about one third of the differentially expressed
genes. This is not surprising considering the variable responses of the BM45 and VIN13 strains to
stress conditions that would be encountered towards the end of fermentation which are expected to be
different in different musts. Overall though, comparative patterns of gene expression between different
strains seem to be fairly reproducible regardless of the fermentation environment, particularly during
the earlier parts of fermentation.
4.4.7 Functional categorization of differentially expressed genes
The genes that showed significant differences in expression between the MS300 and Colombard
fermentations in any of the analyses (both inter- and intra- strain for VIN13 and/or BM45 at all time
points) were extracted for further evaluation. This cumulative set amounted to approximately 1200
genes showing greater than 2-fold changes (both positive and negative). These genes were divided into
groups based on known or predicted function (Tables 3 and 4) in order to gain insight into the broader
areas of yeast metabolism that are influenced by varying environmental conditions during fermentation.

85
Table 3 Categorization (GO function) of genes that are significantly decreased (greater than 2-fold) in expression in any of the Colombar samples in comparison to the corresponding MS300 samples. ‘n’ represents the number of genes from the list in the category, while ‘t’ is the total number of genes in any given category.
Biological Process Repressed genes in category from all Colombar vs MS300 frementations n t %
Nucleotide and nucleic acid metabolism
DEP1 MAK5 ADY2 PWP2 HCM1 STP4 NOP14 AIR2 YRB1 RRP8 CPR1 REF2 UME6 URH1 NPL3 ADA2 PRP22 EDC2 SPT15 CCA1 ACT1 PUS2 NAB2 NUP49 SAE2 MPT5 EDC1 ADE3 TAF1 OPI1 RPP1 RRP3 DBP8 SSL2 MRS1 DAL81 ZAP1 SIP4 MRS3 RPB4 RPA34 TAH11 CCE1 MSN4 ABF1 RRN3 MRS4 PRP16 ACE2 CBF5 BUR2 CDD1 HAP1 NEJ1 YHC1 SFH1 SEN1 RAD52 CAC2 DAT1 SPT21 CTL1 RGM1 SGS1 SKY1 RNT1 GCD10 RPC19 NRD1 SSK2 DBP6 SPT20 HIR2 CDC21 NUP1 ADE2 GAC1 MBF1 DBP1 HHO1 TBF1 PRP46 RAD53 FCY1 DPB2 ADE1 MTD1 ADE4 SER1 89 1046 8.5
Response to stress
UGA2 LRE1 HSP30 GPD1 RAD59 GRX3 LCD1 ISC1 RAD51 HSF1 RRD1 MGA2 GPX1 MNN4 SIS2 HSP104 TSL1 SIP5 SIP18 HSC82 RAD50 WSC2 DDR2 POS5 HSP82 SKT5 HSP26 UBC4 FAP7 HSP42 HSP78 GLC7 HSP12 HAC1 PHO4 YHB1 GRE3 CKA1 XBP1 DEF1 PSR1 TEN1 PSR2 AHP1 SML1 HAL9 CRS5 IQG1 ATH1 49 199 24.6
Ribosome biogenesis and assembly
MAK5 PWP2 NOP14 RRP8 LOC1 NUP49 NOP7 RPP1 RRP3 DBP8 NMD3 RPF2 RLP24 RPL10 CBF5 SEN1 YML025C RNT1 DBP6 BRX1 UTP5 SNU13 NOP16 MTR3 HCA4 MRT4 TOR2 DRS1 SOF1 NOC3 GSP1 POP1 POP3 NOP58 NIP7 FHL1 36 165 21.8
C-compound and Carbohydrate metabolismSHP1 SKT5 PGI1 GLK1 TPI1 SCS2 GLC7 SKN1 XKS1 SMI1 GRE3 GUT2 YJR096W IDP2 FBP1 PGM2 GLC8 IDH1 ZWF1 CIT1 22 415 5.3
Amino acid and derivative metabolismGCV1 ARO3 ARG82 SER3 MET13 STR3 MUQ1 MET28 MAE1 MET1 MHT1 IDP2 SAM1 LEU3 ARG80 ILV2 IDH1 MET2 CIT1 ARG1 MET16 21 149 14.1
Sulfur metabolismCYS3 SAH1 CYS4 OPT1 MET3 ECM17 MET14 MET4 MET13 STR3 MET28 GTT1 GSH1 MET1 GTT2 MHT1 SAM1 MET2 BIO5 MET16 20 44 45.5
Cell wall TIP1 BGL2 SPS100 CWP1 PIR3 PIR1 WSC3 7 38 18.4
Amino acid transport BAP2 TAT1 BAP3 GNP1 AGP3 MUP1 MUP3 7 23 30.4
Inorganic anion transport PHO88 SUL1 PHO89 FZF1 PHO84 YER053C YPR003C 7 15 46.7
Sulfur amino acid metabolism MET13 STR3 MET28 MET1 MHT1 SAM1 MET2 MET16 CYS3 SAH1 CYS4 MET3 MET14 MET4 14 29 48.3
Regulation of nitrogen and sulphur utilization UME6 MET32 GLN3 FZF1 DAL81 ABF1 6 29 20.7
Methionine metabolism MET13 STR3 MET1 SAM1 MET2 MET16 6 20 30.0
Nicotinamide metabolism PYC2 BNA3 UTR1 IDP3 YOR356W FDH1 6 25 24.0
Serine family amino acid metabolism CYS3 SAH1 CYS4 SER33 SER1 5 15 33.3
Cell adhesion FLO1 HSP12 AGA2 CKA1 4 11 36.4
Threonine metabolism GLY1 HOM3 HOM6 3 7 42.9
Pentose metabolism XKS1 GRE3 YJR096W 3 5 60.0
Glutathione metabolism GTT1 GSH1 GTT2 3 6 50.0
The bulk of the genes that are decreased in expression in Colombard fermentations are related to
nucleotide metabolism and various stress responses. The metabolism of specific amino acids such as
serine and threonine are also influenced by differences in the fermentation media. Nitrogen and sulfur
metabolism as well as numerous transport activities are also repressed in the Colombard must when
compared to MS300.
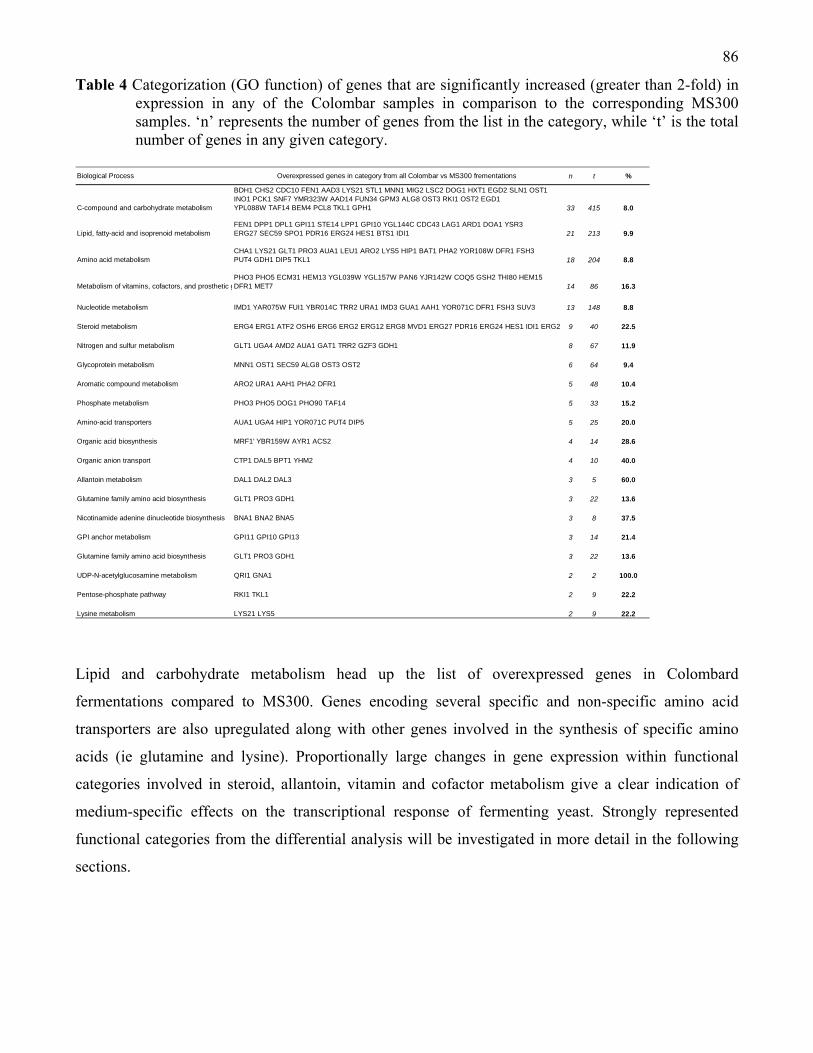
86
Table 4 Categorization (GO function) of genes that are significantly increased (greater than 2-fold) in expression in any of the Colombar samples in comparison to the corresponding MS300 samples. ‘n’ represents the number of genes from the list in the category, while ‘t’ is the total number of genes in any given category.
Biological Process Overexpressed genes in category from all Colombar vs MS300 frementations n t %
C-compound and carbohydrate metabolism
BDH1 CHS2 CDC10 FEN1 AAD3 LYS21 STL1 MNN1 MIG2 LSC2 DOG1 HXT1 EGD2 SLN1 OST1 INO1 PCK1 SNF7 YMR323W AAD14 FUN34 GPM3 ALG8 OST3 RKI1 OST2 EGD1 YPL088W TAF14 BEM4 PCL8 TKL1 GPH1 33 415 8.0
Lipid, fatty-acid and isoprenoid metabolismFEN1 DPP1 DPL1 GPI11 STE14 LPP1 GPI10 YGL144C CDC43 LAG1 ARD1 DOA1 YSR3 ERG27 SEC59 SPO1 PDR16 ERG24 HES1 BTS1 IDI1 21 213 9.9
Amino acid metabolismCHA1 LYS21 GLT1 PRO3 AUA1 LEU1 ARO2 LYS5 HIP1 BAT1 PHA2 YOR108W DFR1 FSH3 PUT4 GDH1 DIP5 TKL1 18 204 8.8
Metabolism of vitamins, cofactors, and prosthetic gPHO3 PHO5 ECM31 HEM13 YGL039W YGL157W PAN6 YJR142W COQ5 GSH2 THI80 HEM15 DFR1 MET7 14 86 16.3
Nucleotide metabolism IMD1 YAR075W FUI1 YBR014C TRR2 URA1 IMD3 GUA1 AAH1 YOR071C DFR1 FSH3 SUV3 13 148 8.8
Steroid metabolism ERG4 ERG1 ATF2 OSH6 ERG6 ERG2 ERG12 ERG8 MVD1 ERG27 PDR16 ERG24 HES1 IDI1 ERG2 9 40 22.5
Nitrogen and sulfur metabolism GLT1 UGA4 AMD2 AUA1 GAT1 TRR2 GZF3 GDH1 8 67 11.9
Glycoprotein metabolism MNN1 OST1 SEC59 ALG8 OST3 OST2 6 64 9.4
Aromatic compound metabolism ARO2 URA1 AAH1 PHA2 DFR1 5 48 10.4
Phosphate metabolism PHO3 PHO5 DOG1 PHO90 TAF14 5 33 15.2
Amino-acid transporters AUA1 UGA4 HIP1 YOR071C PUT4 DIP5 5 25 20.0
Organic acid biosynthesis MRF1' YBR159W AYR1 ACS2 4 14 28.6
Organic anion transport CTP1 DAL5 BPT1 YHM2 4 10 40.0
Allantoin metabolism DAL1 DAL2 DAL3 3 5 60.0
Glutamine family amino acid biosynthesis GLT1 PRO3 GDH1 3 22 13.6
Nicotinamide adenine dinucleotide biosynthesis BNA1 BNA2 BNA5 3 8 37.5
GPI anchor metabolism GPI11 GPI10 GPI13 3 14 21.4
Glutamine family amino acid biosynthesis GLT1 PRO3 GDH1 3 22 13.6
UDP-N-acetylglucosamine metabolism QRI1 GNA1 2 2 100.0
Pentose-phosphate pathway RKI1 TKL1 2 9 22.2
Lysine metabolism LYS21 LYS5 2 9 22.2
Lipid and carbohydrate metabolism head up the list of overexpressed genes in Colombard
fermentations compared to MS300. Genes encoding several specific and non-specific amino acid
transporters are also upregulated along with other genes involved in the synthesis of specific amino
acids (ie glutamine and lysine). Proportionally large changes in gene expression within functional
categories involved in steroid, allantoin, vitamin and cofactor metabolism give a clear indication of
medium-specific effects on the transcriptional response of fermenting yeast. Strongly represented
functional categories from the differential analysis will be investigated in more detail in the following
sections.
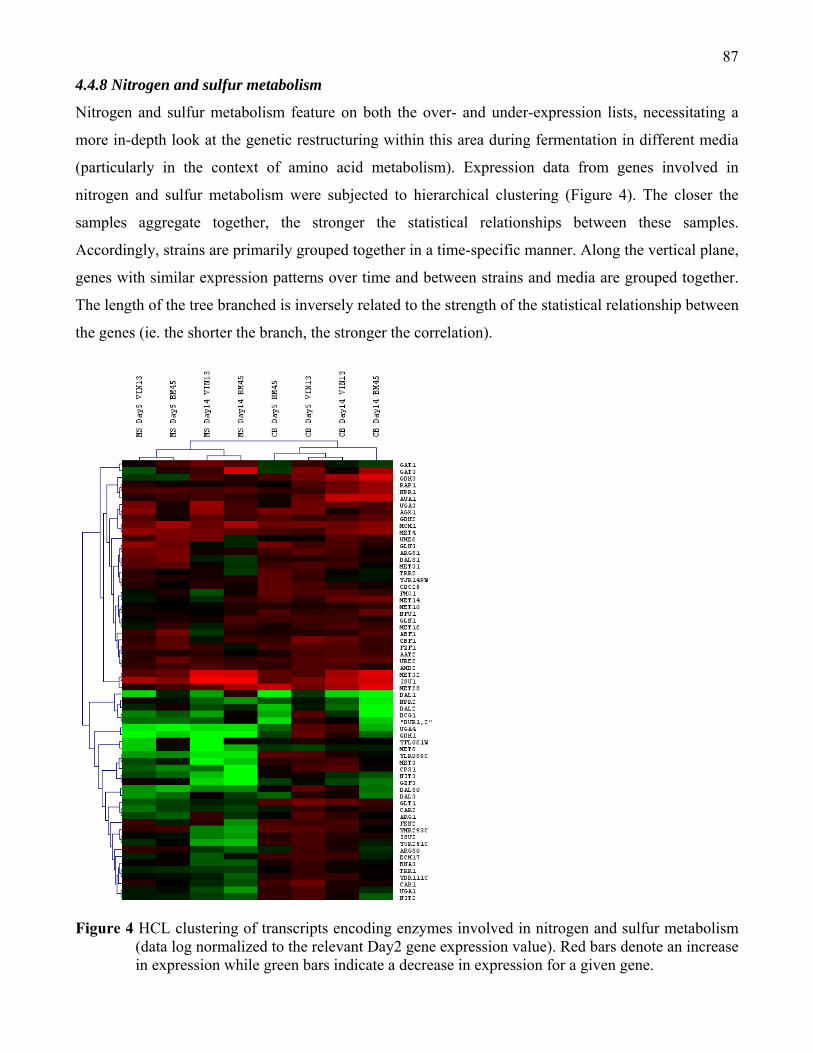
87
4.4.8 Nitrogen and sulfur metabolism
Nitrogen and sulfur metabolism feature on both the over- and under-expression lists, necessitating a
more in-depth look at the genetic restructuring within this area during fermentation in different media
(particularly in the context of amino acid metabolism). Expression data from genes involved in
nitrogen and sulfur metabolism were subjected to hierarchical clustering (Figure 4). The closer the
samples aggregate together, the stronger the statistical relationships between these samples.
Accordingly, strains are primarily grouped together in a time-specific manner. Along the vertical plane,
genes with similar expression patterns over time and between strains and media are grouped together.
The length of the tree branched is inversely related to the strength of the statistical relationship between
the genes (ie. the shorter the branch, the stronger the correlation).
Figure 4 HCL clustering of transcripts encoding enzymes involved in nitrogen and sulfur metabolism (data log normalized to the relevant Day2 gene expression value). Red bars denote an increase in expression while green bars indicate a decrease in expression for a given gene.
88
In this figure, clear differences exist in the expression patterns of transcription factors-encoding genes
such as ARG80 and ARG81, which are involved in the regulation of arginine-responsive genes along
with the product of the ARG82 gene (El Alami et al., 2003). As another example, UGA3 encodes a
transcriptional activator necessary for induction of gamma-aminobutyrate -dependent induction of
genes such as UGA1, UGA2, UGA4 that are involved in glutamate degradation and intercellular
nitrogen utilization and mobilization. Likewise, the DAL81 gene encodes a protein that acts as a
positive regulator of genes in multiple nitrogen degradation pathways (Talibi et al., 1995).
MET4 is another well-known transcriptional activator that is responsible for the regulation of the sulfur
amino acid pathway (Thomas & Surdin-Kerjan, 1997). It requires different combinations of the
auxiliary factors encoded by CBF1, MET28, MET31 and MET32, all of which fall into the same cluster
depicted in Figure 4. On the enzymatic side, the proteins encoded by MET10 and ECM17 (sulfite
reductase subunits), MET14 (an adenylylsulfate kinase), MET16 (a 3'-phosphoadenylsulfate reductase)
and MET3 (an ATP sulfurylase) which collectively catalyze sulfate assimilation and are involved in
sulfur amino acid metabolism (Thomas et al, 1990). Several of these genes are overexpressed at one or
more stages in the Colombard fermentations as opposed to the corresponding MS300 fermentations.
In terms of nitrogen metabolism, various genes involved in allantoin degradation such as DAL1, DAL2,
DAL3, and DUR1,2 (Yoo et al., 1985; Buckholz & Cooper, 1991) are also represented in Figure 4
because of increased expression in Colombard fermentations. Included in this category are also a large
number of genes involved in amino acid metabolism. In general, most of the genes that stand out from
the SAM analysis are involved in amino acid synthesis, uptake or catabolism of specific amino acids
for nitrogen mobilization. Specific genes in this category will be considered in more detail later on in
this paper.
4.4.9 Expression of transporters genes
Expression data from genes involved in transport activities were subjected to K-means clustering.
Clusters showing variable expression patterns between Colombard and MS300 fermentations can be
seen in Figure 5 below.

89
Figure 5 HCL clustering of transcripts in 3 clusters showing differential expression between different media for genes involved in amino acid metabolism (data log normalized to the relevant Day2 gene expression value). Red bars denote an increase in expression while green bars indicate a decrease in expression for a given gene.
The transport activities represented in Figure 5 are the most obvious manifestation of the compositional
differences in the MS300 and Colombard fermentation media. Once again, amino acid transporters of
varying affinities and specificities feature strongly in this figure, along with transporters for various
inorganic (phosphate, iron, zinc, magnesium, copper, calcium, potassium) and organic substances
(hexoses, allantoin, sterols, polyamines, myo-inositol).
4.4.10 Enrichment of transcription factors
The spheres of yeast metabolism related to nitrogen and sulfur uptake and utilization (including amino
acid metabolism) were heavily impacted by differences in the composition of the fermentation media.
Transcription factor enrichment analysis of these genes (from the significance analysis of Colombard
vs. MS300 data) led to the identification of a few prominent transcription patterns that regulate the
expression of these genes (Figure 6).

90
Figure 6 Expression patterns of genes encoding key transcription factors.
The six transcription factor-encoding genes depicted in Figure 6 (namely GCN4, LEU3, GLN3, STP2,
CBF1 and MET31) not only showed substantial changes in expression over time, but also between
corresponding samples from the parallel Colombard and MS300 fermentations. These changes were
not only related to the overall intensity of normalized gene expression (such as in the case of MET31
VIN13 (MS300)
BM45 (MS300)
VIN13 (Colombar)
BM45 (Colombar)
GCN4
Time (days)
0 2 4 6 8 10 12 14
Nor
mal
ized
exp
ress
ion
valu
e
4000
6000
8000
10000
12000
14000LEU3
Time (days)0 2 4 6 8 10 12 14
Nor
mal
ized
exp
ress
ion
valu
e
0
200
400
600
800
1000
1200
GLN3
Time (days)
0 2 4 6 8 10 12 14
Nor
mal
ized
exp
ress
ion
valu
e
0
200
400
600
800
1000
1200
1400STP2
Time (days)
0 2 4 6 8 10 12 14
Nor
mal
ized
exp
ress
ion
valu
e
0
500
1000
1500
2000
2500
CBF1
Time (days)
0 2 4 6 8 10 12 14
Nor
mal
ized
exp
ress
ion
valu
e
50
100
150
200
250
300
350
400
MET31
Time (days)
0 2 4 6 8 10 12 14
Nor
mal
ized
exp
ress
ion
valu
e
0
200
400
600
800
1000
91
and GCN4) but also to the actual pattern of gene expression over time (GCN4, LEU3, GLN3, STP2).
These differences were most pronounced during the earlier stages of fermentation. By day 14 (at the
end of fermentation) the expression levels of the three key regulatory factors (GCN4, LEU3 and GLN3)
were similar. The possible functional relevance of these transcription factors in the context of nitrogen
and sulfur metabolism will be considered in the following section.
4.4.11 Comparison of gene loading weights
A principle aim of this study was to determine the comparability of the experimental must MS300 to
real wine-making conditions. In particular, we were interested to see if predictive statistical models
based on transcriptional information from MS300 studies could be reproduced in a real wine must
background. In a previous paper (Rossouw et al., 2008) gene targets for genetic modification were
identified based on the loading weights of individual genes in regression models. In these models the X
variables were the expression levels of a selected set of genes related to aroma metabolism, and the Y
variables were the concentrations of volatile aroma compounds in the must. Experimental validation
proved that this approach indeed provided a predictive ability that was satisfactorily accurate (Rossouw
et al., 2008).
One of our key questions was whether the modeling capacity and predictability of such an approach
was medium specific. To attend to this issue we constructed parallel PLS1 regression models using the
aroma compound concentrations and gene expression values from the Colombard fermentations in the
same manner as was done for the MS300 fermentations. To demonstrate the alignment of key model
information we plotted the gene loading weights (for several important aroma compounds) of the 4 key
genes considered in a previous study (Rossouw et al., 2008). The better the fit or overlap of these
loading weights, the closer the alignment of model predictions from the two different experimental
conditions (Figure 7). Clearly model alignments for three of the four genes are extremely close. The
exception is AAD14, where only about three of the 11 loading weights are comparable in both
fermentation conditions.
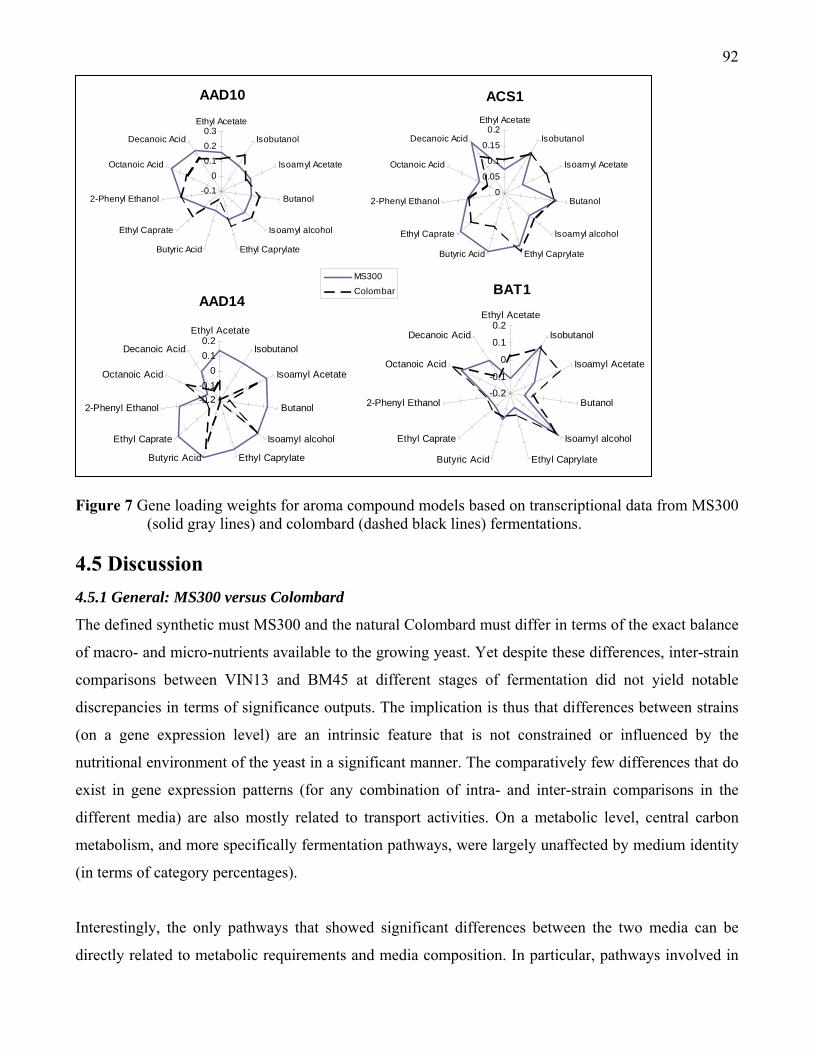
92
Figure 7 Gene loading weights for aroma compound models based on transcriptional data from MS300 (solid gray lines) and colombard (dashed black lines) fermentations.
4.5 Discussion 4.5.1 General: MS300 versus Colombard
The defined synthetic must MS300 and the natural Colombard must differ in terms of the exact balance
of macro- and micro-nutrients available to the growing yeast. Yet despite these differences, inter-strain
comparisons between VIN13 and BM45 at different stages of fermentation did not yield notable
discrepancies in terms of significance outputs. The implication is thus that differences between strains
(on a gene expression level) are an intrinsic feature that is not constrained or influenced by the
nutritional environment of the yeast in a significant manner. The comparatively few differences that do
exist in gene expression patterns (for any combination of intra- and inter-strain comparisons in the
different media) are also mostly related to transport activities. On a metabolic level, central carbon
metabolism, and more specifically fermentation pathways, were largely unaffected by medium identity
(in terms of category percentages).
Interestingly, the only pathways that showed significant differences between the two media can be
directly related to metabolic requirements and media composition. In particular, pathways involved in
AAD14
-0.2-0.1
00.10.2
Ethyl Acetate
Isobutanol
Isoamyl Acetate
Butanol
Isoamyl alcohol
Ethyl CaprylateButyric Acid
Ethyl Caprate
2-Phenyl Ethanol
Octanoic Acid
Decanoic Acid
AAD10
-0.1
00.1
0.2
0.3Ethyl Acetate
Isobutanol
Isoamyl Acetate
Butanol
Isoamyl alcohol
Ethyl CaprylateButyric Acid
Ethyl Caprate
2-Phenyl Ethanol
Octanoic Acid
Decanoic Acid
ACS1
0
0.05
0.1
0.15
0.2Ethyl Acetate
Isobutanol
Isoamyl Acetate
Butanol
Isoamyl alcohol
Ethyl CaprylateButyric Acid
Ethyl Caprate
2-Phenyl Ethanol
Octanoic Acid
Decanoic Acid
BAT1
-0.2
-0.1
0
0.1
0.2Ethyl Acetate
Isobutanol
Isoamyl Acetate
Butanol
Isoamyl alcohol
Ethyl CaprylateButyric Acid
Ethyl Caprate
2-Phenyl Ethanol
Octanoic Acid
Decanoic Acid
MS300Colombar

93
amino acid biosynthesis or degradation were notably impacted by the different media. Some stress
response pathways and steroid metabolism were the other areas of yeast physiology that show varying
genetic responses in the different fermentation media (Tables 3 and 4).
MS300 appears thus a close enough an approximation to real wine must to be of benefit in comparative
studies between, for example, different yeast species or strains, and possibly even different
environmental factors. The PCA analysis (Figure 3) confirms that must composition is only the third
most significant source of variation, after the stage of fermentation and strain identity factors. In light
of this, the data produced or results inferred from studies in MS300 should in principle be transferable
to real wine-making conditions to a large extent. Having a reliable and reproducible standard
fermentation media available in the yeast research community is indeed advantageous in terms of
knowledge-sharing and experimental comparability.
In terms of the differences between media that can be directly aligned with media composition, the
following observations appear of most relevance:
4.5.2 Transport facilitation
A large proportion of transcripts that were differentially expressed between corresponding samples in
different fermentation media constituted very specific plasma membrane transport activities. While a
large number of these transporters related to the uptake of amino acids (to be discussed in the following
section) and other organic substances, a substantial amount of inorganic compound carriers also
featured in the analysis (Figure 5). Most of the transport activities for the inorganic salts were increased
in the Colombard fermentations (relative to MS300) at one or more time points during fermentation.
AUS1 and PDR11 encode two transporters involved in sterol uptake (Wilcox et al., 2002), and showed
expression increases of up to 20-fold in both VIN13 and BM45 fermentations in the Colombard must.
The same trends were evident for other organic compound transporters, such as the high-affinity
biotin/H+ symporter VHT1 as well as HNM1, a choline permease that is co-regulated with membrane
lipid biosynthetic genes (Stolz et al., 2001). Two related genes, ITR1 and ITR2 (coding for myo-
inositol permeases; Nikawa et al., 1991) were also overexpressed in the Colombard fermentations,
particularly at the end of fermentation. All these genes have a role to play in the metabolism of long-
chain fatty acids and are essential for anaerobic growth and cell membrane integrity. Their
overexpression in the Colombard fermentations are likely related to simple differences in the
availability of the target compounds in the different media.
94
Expression levels of several glycerol importers such as GUP1, GUP2 and SLT1 (Holst et al., 2000;
Ferreira et al., 2005) were also increased substantially in the Colombard fermentations. Expression of
the glycerol transporter genes is believed to be induced by osmotic shock, and differences in the
concentrations of extracellular glycerol in the MS300 and Colombard fermentations (Figure 2) could
account for the different transcriptional responses of the cells in this regard.
The two major cell membrane sulfate permeases (SUL1 and SUL2; Smith et al., 1995) were highly
underexpressed in the Colombard fermentations (up to 50-fold decrease), while the overexpression of
the two ammonium permeases (MEP2 and MEP3; Marini et al., 1997) were of the same magnitude
(Figure 5; Tables 3 and 4). These vast transcriptional disparities reflect the cellular responses of the
yeast to their different nutritional environments.
Of the metal ion transporters, most of the differentially expressed transcripts were related to iron
metabolism, including SIT1 (Lesuisse et al., 1998), FET3 (Askwith et al., 1994), FTR1 (Kwok et al.,
2006), ARN1 and ARN2 (Philpott et al., 2002). The expression of these genes is responsive to iron
deprivation and extracellular iron concentrations. The SIT1, ARN1 and ARN2 gene products specifically
recognize siderophore-iron chelates. Whereas these genes were overexpressed in the Colombard BM45
and VIN13 strains throughout fermentation (Figure 5; Table 4), the FET3 and FTR1 genes (which
encode high-affinity permeases for unbound ferrous iron) were highly repressed. These highly specific
transcriptional responses demonstrate the tight control between transporter induction in response to not
only iron availability, but also to the form in which the iron is present in the fermentation medium. In
terms of other ionic compounds, only the transcription of a few inorganic phosphate transporters
(PHO87, PHO84 and PHO90; Caspar et al., 2007) showed noteworthy differences in expression
between fermentations in different media (Figure 5).
4.5.3 Nitrogen, sulfur and amino acid metabolism
Several differences in expression levels can be directly correlated to the different amino acid
composition of the two media. Since the number of genes that can be discussed is large, only some
examples are considered here.

95
4.5.3.1 Amino acid transport
Beginning with the uptake of amino acids from the media, it should be mentioned that all known
amino-acid permeases in yeast belong to a single family of homologous proteins with a wide range of
substrate specificities (Regenberg et al., 1999). Several transport proteins involved in amino acid
uptake showed significant differences in expression levels between inter- or intra- strain comparisons
of MS300 and Colombard analyses (Figure 5). Noteworthy genes from the underexpressed list (Table
3) in Colombard versus MS300 fermentations include MUP1, MUP2, AGP3 and GNP1.
MUP1 and MUP2 both encode high affinity methionine permeases that are also involved in cysteine
uptake (Isnard et al., 1996; Kosugi et al., 2001). As the Colombard must contains negligible levels of
methionine (Table 1), the MUP genes are in all likelihood transcribed at lower levels in the yeast due to
the near absence of their target metabolites.
AGP3 encodes a low affinity, relatively non-specific general permease for most of the uncharged
amino acids (Schreve & Garrett, 2004). The closely related GNP1 is more specific for Leu, Ser, Thr,
Cys, Met, Gln and Asn (Zhu et al., 1996). This permease is transcriptionally induced by extracellular
levels of the afore-mentioned amino acids, which may explain the discrepancies between the
Colombard and MS300 expression levels (Tables 1 and 3).
In terms of the genes overexpressed in Colombard must and related to amino acid uptake (Table 4),
AUA1, HIP1, PUT4 and DIP5 are the most prominent candidates. AUA1 encodes a protein that is
required for the negative regulation of GAP1 (Sophianopoulou & Diallinas 2003), which is a general
amino acid permease (Regenberg et al., 1999). In light of the relative paucity of amino acids available
to the yeast in the Colombard must it is economical for the cells to transcribe and translate specific
transport activities for the few amino acids which are in fact abundant in the medium. This is clearly
the case for the other three permeases: HIP1 codes for a histidine-specific permease (Tanaka & Fink,
1985), which would enable the Colombard yeasts to take up the abundant histidine present in the
medium (Table 1). Similarly, abundant proline is the likely reason for high expression levels of the
PUT4 gene coding for a high-affinity proline permease (Lasko & Brandriss, 1981; Omura et al., 2005).
And lastly, DIP5 expression mediates high-affinity and high-capacity transport of L-glutamate and L-
aspartate (Regenberg et al., 1998), both of which are present at high concentrations at the start of
fermentation in the Colombard must (Table 1).
96
4.5.3.2 Amino acid biosynthesis
Amino acid transporters and amino acid biosynthetic enzymes together account for the majority of the
metabolic discrepancies between transcriptome data from strains under different fermentation
conditions (Figures 4 and 5). Most of these differences can be accounted for directly by variation in
medium composition. In further support of this argument one need only examine some of the
biosynthetic enzymes that feature in the differential expression lists for Nitrogen and Sulfur
metabolism (Figure 4, Tables 3 and 4).
Genes that are overexpressed in the Colombard fermentations generally code for enzymes involved in
the biosynthesis of specific amino acids that are lacking in the medium. For example, the low
availability of the essential amino acid leucine in the Colombard must is reflected by an increase in the
expression of LEU1, an isopropylmalate isomerase which catalyzes an important step in the leucine
biosynthesis pathway (Baichwal et al., 1983; Friden & Schimmel, 1987). Likewise, LEU9 encodes an
alpha-isopropylmalate synthase that is responsible for the first step in leucine biosynthesis (Casalone et
al., 2000), and also shows increased expression levels in Colombard vs. MS300 fermentations (Table
4).
Lysine concentrations in the Colombard must were below detection, and thus we see a significant
increase in the expression levels of key genes involved in the lysine biosynthesis pathway, namely
LYS5 and LYS21 (Table 4; Ehmann et al., 1999) which are probably repressed in the MS300 cells due
to feedback inhibition by the higher lysine levels (Feller et al., 1999). ARO2, TKL2 and PHA2 are all
involved in the synthesis of precursors for the aromatic amino acids (Jones et al., 1991; Schaaff-
Gerstenschlager et al., 1993; Maftahi et al., 1995), which once again aligns well with the limited
availability of these amino acids (most notably phenylalanine) in the Colombard must (Table 1).
Similar observation can be applied to the catabolism of amino acids that are present in high
concentrations. Indeed, only the CHA1 and FSH3 transcripts were overexpressed in the Colombard
fermentations: These genes encode a serine deaminase and serine hydrolase respectively, both of which
are involved in the degradation of L-serine for use as a nitrogen source (Petersen et al., 1988; Baxter et
al., 2004). From Table 1 it is clear that this particular amino acid is also present at high concentrations
at the start of fermentation and thus probably serves as a suitable source of nitrogen for the nitrogen-
limited Colombard must.
97
4.5.3.3 Enrichment of transcription factors
Most of the nitrogen or sulfur metabolising enzymes/ transporters discussed in the previous sections
can be grouped under the effector systems of a few main transcription factors (refer to Figure 6). Most
notable among these is probably GCN4, which codes for a key transcriptional activator of amino acid
biosynthetic genes in response to amino acid starvation (Roussou et al., 1988). Expression levels of this
gene were significantly and substantially elevated in the Colombard fermentations for both VIN13 and
BM45, most likely due to the lower concentrations of free amino acids in this medium. The Gcn4p
transcription factor targets the promoters of a large number of genes involved in amino acid
metabolism in a highly specific manner (Natarajan et al., 2001). Indeed, it is reasonable to attribute a
large proportion of the differentially expressed amino acid metabolizing genes to changes in the
transcript abundance of this particular gene.
Gcn4p in turn regulates the expression of another important transcription factor, namely Leu3p (Wang
et al., 1999). The product of the LEU3 gene is involved in the specific regulation of the leucine -
isoleucine-valine pathways (Fridden & Schimmel, 1987; Zhou et al., 1987). The gene expression levels
for this transcription factor show different trends for the MS300 fermentations (expression lowest early
on in fermentation) as opposed to the Colombard fermentations (expression highest at earliest stage of
fermentation). As the expression of this gene is under general amino acid control, the differences in the
amino acid compositions of the fermentation media (and the rapid decline in amino acid availability in
the Colombard must as fermentation progresses) accounts for these differences in expression profiles.
Regarding the remaining four noteworthy transcription factors, GLN3 encodes the transcriptional
activator responsible for nitrogen catabolite repression (Cox et al., 2002), STP2 is involved in inducing
BAP gene expression in response to external amino acid availability (de Boer et al., 2000), while
MET31 and CBF1 are both core components involved in the transcriptional regulation of sulfur amino
acid metabolism (Thomas & Surdin-Kerjan, 1997).
While the exact functionalities and interactions associated with these transcriptional regulators are not
completely delineated, the large differences in the expression levels and patterns of these key
modulators provide a legitimate explanation for the overarching differences in gene expression at the
level of amino acid metabolism. Differences between Colombard and MS300 fermentations appear to
be more pronounced during the earlier stages of fermentation. The overlap of transcription factor data
at day 14 is most likely a reflection of the fact that the nutritional status of the fermenting cells are
98
similar in both media at this stage due to the exhaustion of free amino acids and macronutrients such as
carbon, nitrogen and sulfur.
4.6 Conclusions In general, the differences in the transcriptional responses of the VIN13 and BM45 strains in different
fermentation can easily be accounted for by the compositional features of the different media (where
this is known). This attests to the reliability and reproducibility of microarray analyses in batch
fermentations and the interpretation of results regardless of minor variations in medium composition.
As mentioned earlier, a key question was whether the modeling capacity and predictability of
regression-based statistical approaches were largely independent of medium composition. Since this
appears to be the case, the potential for integrative omics applications to be incorporated into reliable
predictive models across the board, regardless of variation in specific environmental conditions, exists.
Considering the analysis represented in Figure 7 it appears that this is indeed the case: The model
predictions of gene loading weights for key aroma compounds were comparable in both the Colombard
must and MS300 systems.
In light of this, defined synthetic fermentation musts (such as MS300) are an invaluable component of
systems biology approaches directed towards the study of industrial fermentation processes.
Knowledge gained from ‘omic’ research in the field of fermentation science thus holds the potential to
be relevant in industrial applications in spite of the relatively controlled experimental frameworks of
laboratory research.
Acknowledgements Funding for the research presented in this paper was provided by the National Research Foundation
(NRF) of South Africa and Winetech, and personal sponsorship by the Wilhelm Frank Trust. We would
also like to thank Jo McBride and the Cape Town Centre for Proteomic and Genomic Research for the
microarray analysis.
99
References
Abbott DA, Knijnenburg TA, de Poorter LM, Reinders MJ, Pronk JT & van Maris AJ (2007) Generic
and specific transcriptional responses to different weak organic acids in anaerobic chemostat cultures
of Saccharomyces cerevisiae. FEMS Yeast Res 7:819-833.
Askwith C, Eide D, Van Ho A, Bernard PS, Li L, Davis-Kaplan S, Sipe DM & Kaplan J (1994) The
FET3 gene of S. cerevisiae encodes a multicopper oxidase required for ferrous iron uptake. Cell
76:403-410.
Attfield PV (1997) Stress tolerance: the key to effective strains of baker’s yeast. Nat Biotechnol
15:1351-1357.
Baichwal V, Cunningham T, Gatzek P & Kohlhaw G (1983) Leucine biosynthesis in yeast.
Identification of two genes (LEU4, LEU5) that affect alpha-Isopropylmalate synthase activity and
evidence that LEU1 and LEU2 gene expression is controlled by alpha-Isopropylmalate and the product
of a regulatory gene. Curr Genet 7:369-377.
Bauer FF & Pretorius IS (2000) Yeast stress response and fermentation efficiency: how to survive the
making of wine – a review. S Afr J Enol 21:27-51.
Baxter SM, Rosenblum JS, Knutson S, Nelson MR, Montimurro JS, Di Gennaro JA, Speir JA,
Burbaum JJ & Fetrow JS (2004) Synergistic computational and experimental proteomics approaches
for more accurate detection of active serine hydrolases in yeast. Mol Cell Proteomics 3:209-225.
Beltran G, Novo M, Leberre V, Sokol S, Labourdette D, Guillamon JM, Mas A, François J & N Rozes
(2006) Integration of transcriptomic and metabolic analyses for understanding the global responses of
low-temperature winemaking fermentations. FEMS Yeast Res 6:1167-1183.
Bely L, Sablayrolles J & Barre P (1990) Description of alcoholic fermentation kinetics: its variability
and significance. Am J Enol Viticult 40:319-324.
Ben-Dor A, Shamir R, Yakhini Z (1999) Clustering gene expression patterns. J Comp Biol 6:281-297.
100
Boer VM, de Winde JH, Pronk JT & Piper MD (2003) The genome-wide transcriptional responses of
Saccharomyces cerevisiae grown on glucose in aerobic chemostat cultures limited for carbon, nitrogen,
phosphorus or sulfur. J Biol Chem 278:3265-3274.
Buckholz RG & Cooper TG (1991) The allantoinase (DAL1) gene of Saccharomyces cerevisiae. Yeast
7:913-23.
Casalone E, Barberio C, Cavalieri D & Polsinelli M (2000) Identification by functional analysis of the
gene encoding alpha-isopropylmalate synthase II (LEU9) in Saccharomyces cerevisiae. Yeast 16:539-
545.
Caspar Hurlimann H, Stadler-Waibel M, Werner TP & Freimoser FM (2007) Pho91 Is a Vacuolar
Phosphate Transporter That Regulates Phosphate and Polyphosphate Metabolism in Saccharomyces
cerevisiae. Mol Biol Cell 18:4438-4445.
Cox KH, Tate JJ & Cooper TG (2002) Cytoplasmic compartmentation of Gln3 during nitrogen
catabolite repression and the mechanism of its nuclear localization during carbon starvation in
Saccharomyces cerevisiae. J Biol Chem 277:37559-37566.
de Boer M, Nielsen PS, Bebelman JP, Heerikhuizen H, Andersen HA & Planta RJ (2000) Stp1p, Stp2p
and Abf1p are involved in regulation of expression of the amino acid transporter gene BAP3 of
Saccharomyces cerevisiae. Nucl Acids Res 28:974-981.
Ehmann DE, Gehring AM & Walsh CT (1999) Lysine biosynthesis in Saccharomyces cerevisiae:
mechanism of alpha-aminoadipate reductase (Lys2) involves posttranslational
phosphopantetheinylation by Lys5. Biochem 38:6171-6177.
El Alami M, Messenguy F, Scherens B & Dubois E (2003) Arg82p is a bifunctional protein whose
inositol polyphosphate kinase activity is essential for nitrogen and PHO gene expression but not for
Mcm1p chaperoning in yeast. Mol Microbiol 49:457-68.
101
Feller A, Ramos F, Pierard A, Dubois E (1999) In Saccharomyces cerevisae, feedback inhibition of
homocitrate synthase isoenzymes by lysine modulates the activation of LYS gene expression by
Lys14p. Eur J Biochem 261:163-170.
Ferreira C, van Voorst F, Martins A, Neves L, Oliveira R, Kielland-Brandt MC, Lucas C & Brandt
A (2005) A member of the sugar transporter family, Stl1p is the glycerol/H+ symporter in
Saccharomyces cerevisiae. Mol Biol Cell 16:2068-2076.
Friden P & Schimmel P (1987) LEU3 of Saccharomyces cerevisiae encodes a factor for control of
RNA levels of a group of leucine-specific genes. Mol Cell Biol 7:2708-2717.
Holst B, Lunde C, Lages F, Oliveira R, Lucas C & Kielland-Brandt MC (2000) GUP1 and its close
homologue GUP2, encoding multimembrane-spanning proteins involved in active glycerol uptake in
Saccharomyces cerevisiae. Mol Microbiol 37:108-124.
Isnard AD, Thomas D & Surdin-Kerjan Y (1996) The study of methionine uptake in Saccharomyces
cerevisiae reveals a new family of amino acid permeases. J Mol Biol 262:473-84.
Ivorra C, Pérez-Ortín JE & M del Olmo (1999) An inverse correlation between stress resistance and
stuck fermentations in wine yeasts. A molecular study. Biotechnol Bioeng 54:698-708.
Jones DG, Reusser U & Braus GH (1991) Molecular cloning, characterization and analysis of the
regulation of the ARO2 gene, encoding chorismate synthase, of Saccharomyces cerevisiae. Mol
Microbiol 5:2143-2152.
Kosugi A, Koizumi Y, Yanagida F & Udaka S (2001) MUP1, high affinity methionine permease, is
involved in cysteine uptake by Saccharomyces cerevisiae. Biosci Biotechnol Biochem 65:728-731.
Kwok EY, Severance S & Kosman DJ (2006) Evidence for iron channeling in the Fet3p-Ftr1p high-
affinity iron uptake complex in the yeast plasma membrane. Biochemistry 45:6317-6327.
Lasko PF & Brandriss MC (1981) Proline transport in Saccharomyces cerevisiae. J Bacteriol 148:241-
247.
102
Lesuisse E, Simon-Casteras M & Labbe P (1998) Siderophore-mediated iron uptake in Saccharomyces
cerevisiae: the SIT1 gene encodes a ferrioxamine B permease that belongs to the major facilitator
superfamily. Microbiology 144:3455-34621.
Maftahi M, Nicaud JM, Levesque H & Gaillardin C (1995) Sequencing analysis of a 24.7 kb fragment
of yeast chromosome XIV identifies six known genes, a new member of the hexose transporter family
and ten new open reading frames. Yeast 11:1077-1085.
Mardia KV, Kent JT & Bibby JH (1979) Multivariate analysis. UK, Academic Press.
Marks VD, van der Merwe GK & HJJ van Vuuren (2003) Transcriptional profiling of wine yeast in
fermenting grape juice: regulatory effect of diammonium phosphate. FEMS Yeast Res 3:269-287.
Marks VD, Ho Sui SJ, Erasmus D, van den Merwe GK, Brumm J, Wasserman WW, Bryan J & van
Vuuren HJJ (2008) Dynamics of the yeast transcriptome during wine fermentation reveals a novel
fermentation stress response. FEMS Yeast Res 8:35-52.
Marini AM, Soussi-Boudekou S, Vissers S & Andre B (1997) A family of ammonium transporters in
Saccharomyces cerevisiae. Mol Cell Biol 17:4282-4293.
Natarajan K, Meyer MR, Jackson BM, Slade D, Roberts C, Hinnebusch AG & Marton MJ (2001)
Transcriptional profiling shows that Gcn4p is a master regulator of gene expression during amino acid
starvation in yeast. Mol Cell Biol 21:4347-4368.
Nikawa J, Tsukagoshi Y & Yamashita S (1991) Isolation and characterization of two distinct myo-
inositol transporter genes of Saccharomyces cerevisiae. J Biol Chem 266:11184-11191.
Omura F, Fujita A, Miyajima K & Fukui N (2005) Engineering of yeast put4 permease and its
application to lager yeast for efficient proline assimilation. Biosci Biotechnol Biochem 69:1162-1171.

103
Petersen JG, Kielland-Brandt MC, Nilsson-Tillgren T, Bornaes C & Holmberg S (1988) Molecular
genetics of serine and threonine catabolism in Saccharomyces cerevisiae. Genetics 119:527-534.
Philpott CC, Protchenko O, Kim YW, Boretsky Y & Shakoury-Elizeh M (2002) The response to iron
deprivation in Saccharomyces cerevisiae: expression of siderophore-based systems of iron uptake.
Biochem Soc Trans 30:698-702.
Regenberg B, Holmberg S, Olsen LD & Kielland-Brandt MC (1998) Dip5p mediates high-affinity and
high-capacity transport of L-glutamate and L-aspartate in Saccharomyces cerevisiae. Curr Genet
33:171-177.
Regenberg B, During-Olsen L, Kielland-Brandt MC & Holmberg S (1999) Substrate specificity and
gene expression of the amino-acid permeases in Saccharomyces cerevisiae. Curr Genet 36:317-328.
Rossignol T, L Dulau, A Julien & B Blondin (2003) Genome-wide monitoring of wine yeast gene
expression during alcoholic fermentation. Yeast 20:1369-1385.
Rossouw D, Naes T & FF Bauer (2008) Linking gene regulation and the exo-metabolome: A
comparative transcriptomics approach to identify genes that impact on the production of volatile aroma
compounds in yeast. BMC Genomics 9:530-548.
Roussouw I, Thireos G & Hauge BM (1988) Transcriptional-translational regulatory circuit in
Saccharomyces cerevisiae which involves the GCN4 transcriptional activator and the GCN2 protein
kinase. Mol Cell Biol 8:2132-2139.
Schaaff-Gerstenschlager I, Mannhaupt G, Vetter I, Zimmermann FK & Feldmann H (1993) TKL2, a
second transketolase gene of Saccharomyces cerevisiae. Cloning, sequence and deletion analysis of the
gene. Eur J Biochem 217:487-492.
Schreve JL & Garret JM (2004) Yeast Agp2 and Agp3 function as amino acid permeases in poor
nutrient conditions. Biochem Biophys Res Commun 313:645-751.

104
Sophianopoulou V & Diallinas G (1993) AUA1, a gene involved in ammonia regulation of amino acid
transport in Saccharomyces cerevisiae. Mol Microbiol 8:167-178.
Stolz J, Hoja U, Meier S, Sauer N & Schweizer E (1999) Identification of the plasma membrane H+-
biotin symporter of Saccharomyces cerevisiae by rescue of a fatty acid-auxotrophic mutant. J Biol
Chem 274:18741-18746.
Talibi D, Grenson M & Andre B (1995) Cis- and trans-acting elements determining induction of the
genes of the gamma-aminobutyrate (GABA) utilization pathway in Saccharomyces cerevisiae. Nucl
Acids Res 23:550-557.
Tanaka J & Fink GR (1985) The histidine permease gene (HIP1) of Saccharomyces cerevisiae. Gene
38:205-214.
Thomas D, Barbey R & Surdin-Kerjan Y (1990) Gene-enzyme relationship in the sulfate assimilation
pathway of Saccharomyces cerevisiae. Study of the 3'-phosphoadenylylsulfate reductase structural
gene. J Biol Chem 265:15518-15524.
Thomas D & Surdin-Kerjan Y (1997) Metabolism of sulfur amino acids in Saccharomyces cerevisiae.
Microbiol Mol Biol Rev 61:503-32.
Tusher CG, Tibshirani R & Chu G (2001) Significance analysis of microarrays applied to the ionizing
radiation response. Proc Natl Acad Sci USA 98:5116-5121.
Wilcox LJ, Balderes DA, Wharton B, Tinkelenberg AH, Rao G & Sturley SL (2002) Transcriptional
profiling identifies two members of the ATP-binding cassette transporter superfamily required for
sterol uptake in yeast. J Biol Chem 277:32466-32472.
Yoo HS, Genbauffe FS & Cooper TG (1985) Identification of the ureidoglycolate hydrolase gene in the
DAL gene cluster of Saccharomyces cerevisiae. Mol Cell Biol 5:2279-2288.
Zhou K, Brisco PR, Hinkkanen AE & Kohlhaw GB (1987) Structure of yeast regulatory gene LEU3
and evidence that LEU3 itself is under general amino acid control. Nucl Acids Res 15:5261-5273.

105
Zhu X, Garrett J, Schreve J & Michaeli T (1996) GNP1, the high-affinity glutamine permease of S.
cerevisiae. Curr Genet 30:107-114.
106
CChhaapptteerr 55
Research results
Comparative transcriptomic approach to investigate
differences in wine yeast physiology and metabolism
during fermentation
This manuscript was published in: Applied and Environmental Microbiology 2009, 75:6600-6612
Authors:
Debra Rossouw, Roberto Olivares-Hernandes*, Jens Nielsen* & Florian F Bauer
* Systems Biology, Department of Chemical and Biological Engineering, Chalmers University of
Technology, SE-41296 Göteborg, Sweden.
107
CHAPTER 5
A comparative ‘omics’ approach to investigate differences in wine yeast
physiology and metabolism during fermentation
5.1 Abstract Commercial wine yeast strains of the species Saccharomyces cerevisiae have been selected to satisfy
many different, and sometimes highly specific, oenological requirements. As a consequence, more than
200 different strains with significantly diverging phenotypic traits are produced globally. This genetic
resource has been rather neglected by the scientific community because industrial strains are less easily
manipulated than the limited number of laboratory strains that have been successfully employed to
investigate fundamental aspects of cellular biology. However, laboratory strains are unsuitable for the
study of many phenotypes that are of significant scientific and industrial interest. Here we investigate
whether a comparative transcriptomics and phenomics approach, based on the analysis of five
phenotypically diverging industrial wine yeast strains, can provide insights into the molecular networks
that are responsible for the expression of such phenotypes. For this purpose, some oenologically
relevant phenotypes, including resistance to various stresses, cell wall properties and metabolite
production of these strains were evaluated, and aligned with transcriptomic data collected during
alcoholic fermentation. The data reveal significant differences in gene regulation between the five
strains. While the genetic complexity underlying the various successive stress responses in a dynamic
system such as wine fermentation reveal the limits of the approach, many of the relevant differences in
gene expression can be linked to specific phenotypic differences between the strains. This is in
particular the case for many aspects of metabolic regulation. The comparative approach therefore
opens new possibilities to investigate complex phenotypic traits on a molecular level.
5.2 Introduction S. cerevisiae is a preferred model organism for studying eukaryotic cells. The haploid yeast genome is
compact (12 - 13.5 megabases) and contains only around 6,000 protein encoding genes [17]. However,
the functional analysis of the yeast genome remains a challenge, predominantly because many of the
putative protein-encoding genes appear not amenable to classical genetic approaches. One possible
reason is that most studies have been limited to a small number of laboratory strains. While these
strains have been selected for their ease of use in laboratory conditions, they lack many of the
108
characteristics that are prominent in industrial isolates of this species. These industrial strains are
highly diverse, since they have been selected for a large number of different and highly specific tasks.
This geno- and phenotypic diversity represents a largely untouched genetic resource. Some of the
challenges of large-scale functional genomics can therefore likely be met by including such strains in
comparative ‘omics’ studies. Such approaches should contribute to building a comprehensive map of
the yeast cell, including genome sequences and gene expression data, information on protein
localization, structure, function and expression, and phenotypic descriptions [21; 25].
In commercial wine fermentations, the yeast species S. cerevisiae is the major role player. In excess of
200 different strains of S. cerevisiae are produced and sold in the global fermentation industry. These
wine yeast strains have been isolated and selected for optimized performance in certain key areas of
oenological relevance. The specific phenotypic traits selected for include fermentative efficiency,
general stress resistance, production of metabolites and in particular aroma compounds, cell wall
adhesion properties and the ability to release enzymes of enological interest or mannoproteins [35].
Different varietals and styles of wine require specialized properties, explaining the significant
phenotypic divergence between strains. Various research methodologies have been applied in an
attempt to understand crucial aspects of wine yeast physiology. However, many important questions
remain unanswered regarding the genetic and molecular regulation of most of these traits, which are
mostly of a polygenic nature [32], and can not be fully understood through traditional approaches.
In this paper, we investigate the potential of a comparative functional omics approach to correlate
oenologically relevant phenotypes to specific gene expression patterns. The approach is based on the
comparative analysis of physiological data and global gene expression data of five phenotypically
diverging commercial wine yeast strains. Phenotypes investigated include general stress resistance, cell
wall properties such as adhesion, and metabolic regulation and production.
The ability of fermenting yeast cells to withstand certain stress factors is of extreme importance to the
overall fermentation efficiency of the strains [26]. During the course of the wine fermentation process,
S. cerevisiae cells are subjected to multiple severe stress conditions that affect their growth, viability
and fermentative performance. These stresses include high osmotic pressure, acidity, nutrient
deprivation, starvation and high alcohol concentration [2; 14; 20]. Some of these stresses occur
sequentially, whereas others occur simultaneously [3]. This means that the genetic factors and
regulatory networks involved in stress response pathways during fermentation are interwoven into
109
complex regulatory circuits with notable interplay/overlap between the various response pathways [18].
The predominant stress condition faced by yeast cells at the beginning of fermentation is probably the
high sugar concentration, giving rise to high osmotic pressure, whereas towards the end of
fermentation, the main stress factors are related to the high ethanol concentrations and depletion of
essential nutrients.
Several gene expressions studies of individual wine yeast strains have been undertaken in recent years
to shed some light on the adaptation and stress tolerance mechanisms of industrial wine yeast strains.
Ivorra et al. [26] and Zuzuarregui et al. [47] both evaluated expression levels of pre-selected
representative genes involved in stress responses in several wine yeast strains during fermentation.
Both studies indicated a good correlation between stress resistance and the ability to complete
fermentations under suboptimal or optimal conditions. They also reported that a common pattern of
stress response exists between efficient wine strains, providing the first prospects for the establishment
of connections between gene expression and stress tolerance traits in wine yeast.
Large scale transcriptome monitoring during alcoholic fermentation under conditions mimicking an
enological environment has helped to elucidate the coordinated transcriptional reprogramming that
takes place during alcoholic fermentation as changes in nutritional, environmental and physiological
conditions occur [31; 39]. These approaches have helped to identify master regulatory pathways that
play a key role in coordinating stress-induced changes in gene expression [39]. The data has also
pointed to a group of genes designated as fermentation stress response (FSR) genes that are
dramatically induced at various points during fermentation [31]. More specific transcriptional profiling
of wine yeast strains has focused on cold stress [4] and the response to nitrogen availability [30].
Another important area of yeast performance relates to the ability of yeast cells to adhere to one
another and settle out of suspension by the end of fermentation. Adhesion phenotypes such as
flocculation and substrate adhesion are directly linked to cell wall properties and can have a major
impact in biotechnological processes such as wine making [19]. Flocculation (the reversible, calcium-
dependent, non-sexual aggregation of yeast cells into 'flocs') in particular is a process of great
importance to the fermentative characteristics of yeast strains (for a review, see Verstrepen et al., [43]).
Several structurally related lectin-like proteins (flocculins), encoded by FLO genes [12], are
responsible for different adhesion phenotypes, suggesting differential programs of pre- and post-

110
transcriptional regulation a strong likelihood for this gene family (for a review, see Verstrepen et al.,
[44].
The last key area of yeast physiology investigated here relates to the general metabolic activity of the
cells during fermentation, particularly in terms of the production of volatile flavour and aroma
compounds. During fermentation, S. cerevisiae not only converts sugars to ethanol but also produces a
number of long chain, complex alcohols and their corresponding acetate esters. These long chain and
complex alcohols are the end products of amino acid catabolism [45]. Although the general sequence of
biochemical reactions for these pathways is annotated to some degree [15], significant breaches exist in
our current understanding of these pathways: There is almost no information available regarding the
kinetics, substrate specificity or regulation of most of the enzymes involved in aroma compound
production, and several reactions have not been attributed to a specific gene product. Because of these
inherent complications a simplistic analysis of gene expression or protein activity in this important
sphere of yeast metabolism is not yet feasible, and top-down set or graph analyses are needed to
provide new insights.
One such integrative metabolic and transcriptomic study of a wine yeast strain has been performed at
different fermentation temperatures in order to correlate transcriptional changes with differences in the
production of fatty acids and their corresponding esters [4]. Similar studies have been reported for
transcriptome analysis in combination with targeted metabolome analysis in wine yeast [34]. Rossouw
et al. [40] were able to align transcriptome data sets with the changes in exometabolome and to identify
genes that impact on aroma compound metabolites. Theses approaches helped identify highly
correlated gene expression subnetworks that could be linked to specific areas of fermentative
metabolism related to the production of organoleptic compounds.
In other areas of yeast metabolism, not much is known regarding the underlying molecular and
biochemical reasons for the metabolic differences between different wine yeast strains. Differences in
wine yeast metabolic activities will have a direct impact on the ability of the cells to tolerate biotic and
abiotic stress conditions, as well as influence the likelihood of ‘stuck’ fermentations.
One way to contextualize transcriptomic information is by integrating a priori knowledge of gene
interaction and metabolic networks with the gene expression data, as described in Vemuri & Aristidou
[42]. The combination of comparative microarray datasets with existing models of yeast metabolism
111
and interaction networks offers the potential for in silico evaluation of biologically relevant gene
expression changes in the context of key areas of metabolism [16; 34].
In this study, the phenotypic profile of five industrial wine yeast strains was established. These profiles
were aligned with DNA microarray transcriptome datasets within the context and framework of
existing interaction networks. The analyses shows that it is possible to pint-point specific genes and
gene expression patterns that are related to areas which impact on yeast metabolism and general
physiology, and more specifically areas that are of oenological relevance. In particular, we demonstrate
that differences in gene expression patterns between strains can be linked to reporter metabolites
around which significant metabolic and physiological changes can be grouped.
5.3 Methods 5.3.1 Strains. media and culture conditions
The yeast strains used in this study are listed in Table1. All are diploid S. cerevisiae strains used in
industrial wine fermentations. Yeast cells were cultivated at 30oC in YPD synthetic media 1% yeast
extract (Biolab, South Africa), 2% peptone (Fluka, Germany), 2% glucose (Sigma, Germany). Solid
medium was supplemented with 2% agar (Biolab, South Africa).
Table 1 Yeast strains used in this study
Strain Source/ Reference
VIN13 Anchor Yeast, South Africa
EC1118 Lallemand Inc., Montréal, Canada
BM45 Lallemand Inc., Montréal, Canada
285 Lallemand Inc., Montréal, Canada
DV10 Lallemand Inc., Montréal, Canada
5.3.2 Fermentation media
Fermentation experiments were carried out with synthetic must MS300 which approximates to a
natural must as previously described [5]. The medium contained 125 g/L glucose and 125 g/L fructose,
and the pH was buffered at 3.3 with NaOH.

112
5.3.3 Fermentation conditions
All fermentations were carried out under microaerobic conditions in 100 ml glass bottles (containing 80
ml of the medium) sealed with rubber stoppers with a CO2 outlet. The fermentation temperature was
approximately 22oC and no stirring was performed during the course of the fermentation. Fermentation
bottles were inoculated with YPD cultures in the logarithmic growth phase (around OD600 = 1) to an
OD600 of 0.1 (i.e. a final cell density of approximately 106 cfu.ml-1). The cells from the YPD pre-
cultures were briefly centrifuged and resuspended in MS300 to avoid carryover of YPD to the
fermentation media. The fermentations followed a time course of 14 days and the bottles were weighed
daily to assess the progress of fermentation. Samples of the fermentation media and cells were taken at
days 2, 5 and 14 as representative of the exponential, early logarithmic and late logarithmic growth
phases respectively.
5.3.4 Growth measurement
Cell proliferation (i.e. growth) was determined spectrophotometrically (PowerwaveX, Bio-Tek
Instruments) by measuring the optical density (at 600 nm) of 200 µl samples of the suspensions over
the 14 day experimental period.
5.3.5 Analytical methods - HPLC
Culture supernatants were obtained from the cell-free upper layers of the fermentation media. For the
purposes of glucose determination and carbon recovery, culture supernatants and starting media were
analyzed by high performance liquid chromatography (HPLC) on an AMINEX HPX-87H ion exchange
column using 5 mM H2SO4 as the mobile phase at a flow rate of 0.5 ml.min-1 and a temperature of 55 oC. Agilent RID and UV detectors were used in tandem for peak detection and quantification. Analysis
was carried out using the HPChemstation software package.
5.3.6 Enzymatic metabolite assays
All enzymes and cofactors were obtained from Roche (Germany) or Sigma (Germany). Metabolite
concentrations were determined using the enzymatic methods described by Bergmeyer and Bernt [7].
5.3.7 General statistical analysis
T-tests and anova analyses were conducted using Statistica (version 7). HCL and KMC clustering were
carried out using TIGR MeV v2.2 [6].
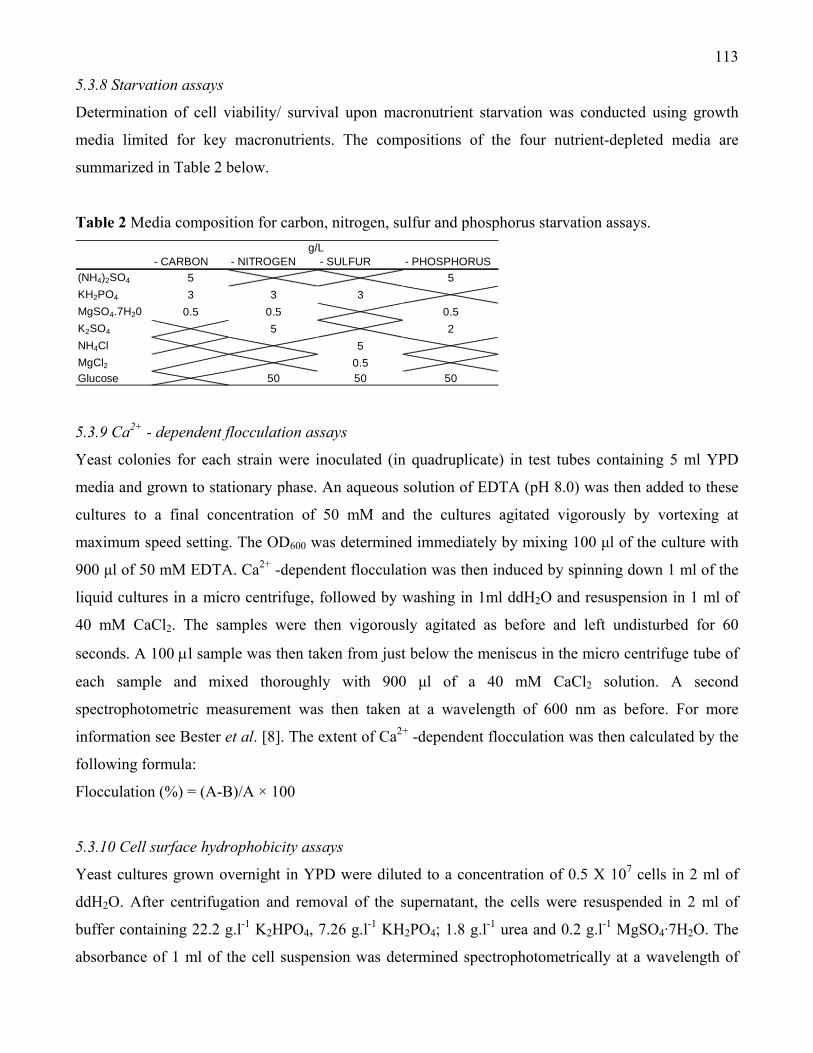
113
5.3.8 Starvation assays
Determination of cell viability/ survival upon macronutrient starvation was conducted using growth
media limited for key macronutrients. The compositions of the four nutrient-depleted media are
summarized in Table 2 below.
Table 2 Media composition for carbon, nitrogen, sulfur and phosphorus starvation assays.
- CARBON - NITROGEN - SULFUR - PHOSPHORUS(NH4)2SO4 5 5KH2PO4 3 3 3MgSO4.7H20 0.5 0.5 0.5K2SO4 5 2NH4Cl 5MgCl2 0.5Glucose 50 50 50
g/L
5.3.9 Ca2+ - dependent flocculation assays
Yeast colonies for each strain were inoculated (in quadruplicate) in test tubes containing 5 ml YPD
media and grown to stationary phase. An aqueous solution of EDTA (pH 8.0) was then added to these
cultures to a final concentration of 50 mM and the cultures agitated vigorously by vortexing at
maximum speed setting. The OD600 was determined immediately by mixing 100 μl of the culture with
900 μl of 50 mM EDTA. Ca2+ -dependent flocculation was then induced by spinning down 1 ml of the
liquid cultures in a micro centrifuge, followed by washing in 1ml ddH2O and resuspension in 1 ml of
40 mM CaCl2. The samples were then vigorously agitated as before and left undisturbed for 60
seconds. A 100 μl sample was then taken from just below the meniscus in the micro centrifuge tube of
each sample and mixed thoroughly with 900 μl of a 40 mM CaCl2 solution. A second
spectrophotometric measurement was then taken at a wavelength of 600 nm as before. For more
information see Bester et al. [8]. The extent of Ca2+ -dependent flocculation was then calculated by the
following formula:
Flocculation (%) = (A-B)/A × 100
5.3.10 Cell surface hydrophobicity assays
Yeast cultures grown overnight in YPD were diluted to a concentration of 0.5 X 10⁷ cells in 2 ml of
ddH2O. After centrifugation and removal of the supernatant, the cells were resuspended in 2 ml of
buffer containing 22.2 g.l-1 K2HPO4, 7.26 g.l-1 KH2PO4; 1.8 g.l-1 urea and 0.2 g.l-1 MgSO4·7H2O. The
absorbance of 1 ml of the cell suspension was determined spectrophotometrically at a wavelength of
114
660 nm (Reading A). To the remaining 1 ml cell suspensions, 100 μl of xylene was added to each
sample and the samples vortexed vigorously for 30 seconds and left to stand for 15 minutes thereafter.
The xylene layer was then removed from each tube and the absorbance of the remaining aqueous layer
determined as before at 660 nm (Reading B). The modified hydrophobicity index (MHI) was defined as
1 – (B/A). High MHI values are indicative of increased partitioning of cells towards the non-polar
xylene phase, and thus of a hydrophobic yeast population [22].
5.3.11 Cell surface charge assays
Yeast cultures grown overnight in YPD were diluted to a concentration of 0.5 X 10⁷ cells in 1ml of 0.2
M acetate buffer (pH 4.0), consisting of 4.1% acetic acid and 0.9% sodium acetate. Cells were washed
three times in acetate buffer before final resuspension in acetate buffer containing alcian blue (0.015
g.l-1). The cell suspensions were incubated at 120 rpm on a shaker for 5 minutes at room temperature.
Samples were subsequently centrifuged at 4000 rpm for 5 minutes and the absorbance of the
supernatant determined spectrophotometrically at 607 nm. The amount of alcian blue that remained
bound to the cells was calculated using a standard curve set up by diluting the original 0.015 g.ll- alcian
blue in acetate buffer. Data was expressed as μg of alcian blue bound per 0.5 X 10⁷ cells (i.e. per 1 ml
of OD600 = 0.5) [37].
5.3.12 Mat formation
To ability of yeast strains to form spreading growth mats (also referred to as biofilm formation) on
plates was determined as described previously [38]. Ten μl of a yeast suspension grown overnight in
liquid media was spotted in the centre of an YPD plate containing 0,3% (w/v) agar and incubated at
23˚C.
5.3.13 Heat shock
Cells were grown continuously at 30oC to an OD600 of 1.0 before centrifugation and resuspension in an
equal volume of ddH2O at a temperature of 55oC. The cell suspensions were then incubated at this
temperature for 15, 40 and 45 minute periods and plated out in 10 μl serial dilution ranges on YPD
plates and incubated for 24-48 hours at 30oC to assess for survival.
5.3.14 Oxidative stress
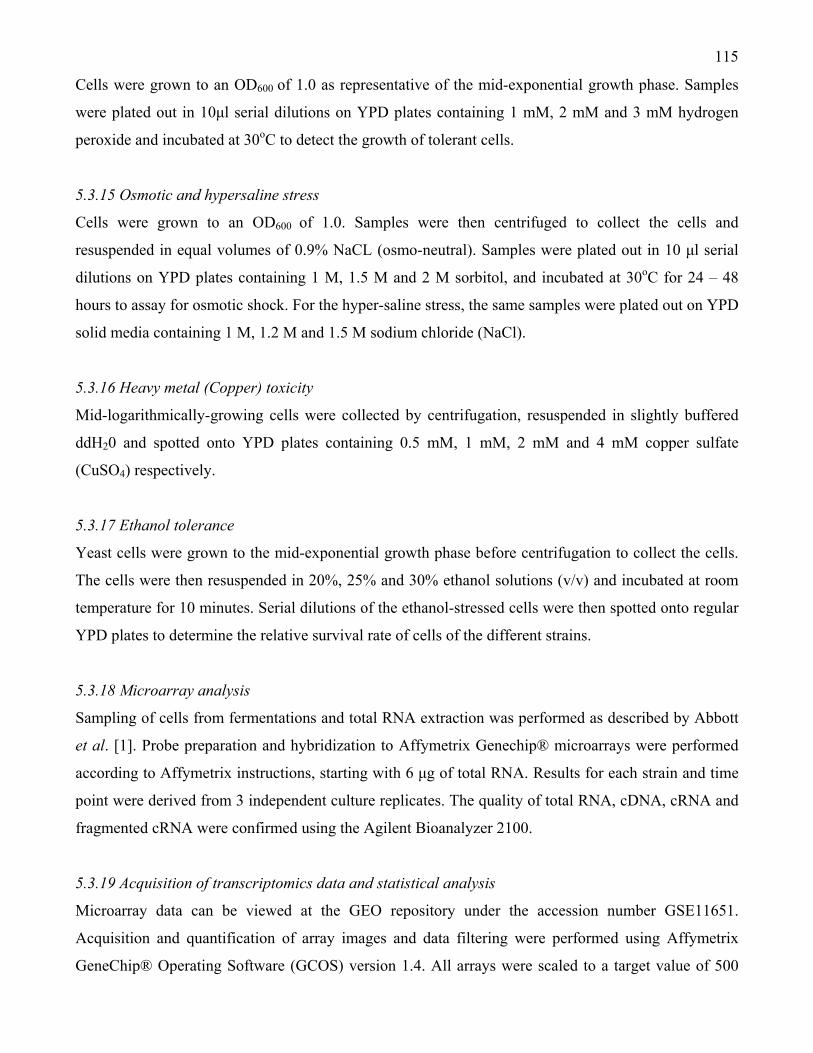
115
Cells were grown to an OD600 of 1.0 as representative of the mid-exponential growth phase. Samples
were plated out in 10μl serial dilutions on YPD plates containing 1 mM, 2 mM and 3 mM hydrogen
peroxide and incubated at 30oC to detect the growth of tolerant cells.
5.3.15 Osmotic and hypersaline stress
Cells were grown to an OD600 of 1.0. Samples were then centrifuged to collect the cells and
resuspended in equal volumes of 0.9% NaCL (osmo-neutral). Samples were plated out in 10 μl serial
dilutions on YPD plates containing 1 M, 1.5 M and 2 M sorbitol, and incubated at 30oC for 24 – 48
hours to assay for osmotic shock. For the hyper-saline stress, the same samples were plated out on YPD
solid media containing 1 M, 1.2 M and 1.5 M sodium chloride (NaCl).
5.3.16 Heavy metal (Copper) toxicity
Mid-logarithmically-growing cells were collected by centrifugation, resuspended in slightly buffered
ddH20 and spotted onto YPD plates containing 0.5 mM, 1 mM, 2 mM and 4 mM copper sulfate
(CuSO4) respectively.
5.3.17 Ethanol tolerance
Yeast cells were grown to the mid-exponential growth phase before centrifugation to collect the cells.
The cells were then resuspended in 20%, 25% and 30% ethanol solutions (v/v) and incubated at room
temperature for 10 minutes. Serial dilutions of the ethanol-stressed cells were then spotted onto regular
YPD plates to determine the relative survival rate of cells of the different strains.
5.3.18 Microarray analysis
Sampling of cells from fermentations and total RNA extraction was performed as described by Abbott
et al. [1]. Probe preparation and hybridization to Affymetrix Genechip® microarrays were performed
according to Affymetrix instructions, starting with 6 μg of total RNA. Results for each strain and time
point were derived from 3 independent culture replicates. The quality of total RNA, cDNA, cRNA and
fragmented cRNA were confirmed using the Agilent Bioanalyzer 2100.
5.3.19 Acquisition of transcriptomics data and statistical analysis
Microarray data can be viewed at the GEO repository under the accession number GSE11651.
Acquisition and quantification of array images and data filtering were performed using Affymetrix
GeneChip® Operating Software (GCOS) version 1.4. All arrays were scaled to a target value of 500
116
using the average signal from all gene features using GCOS. Genes with expression values below 12
were set to 12 + the expression value as previously described [9] in order to eliminate insignificant
variations.
Determination of differential gene expression between experimental parameters was conducted using
SAM (Significance Analysis of Microarrays) version 2 [41]. The two-class, unpaired setting was used
and genes with a Q value less than 0.5 (p < 0,0005) were considered differentially expressed. Only
genes with a fold change greater than 2 (positive or negative) were taken into consideration.
Random forest analysis was carried out as described by Breiman [11]. Genes were differentially ranked
according to their ability to discriminate between different time points (clamped strain data) and
between different strains (clamped time data). The top 200 ORF’s for each analysis were considered for
further in depth analysis and evaluation.
5.3.20 Multivariate data analysis
The patterns within the different sets of data were investigated by principal-component analysis (PCA;
The Unscrambler; Camo Inc., Corvallis, Oreg.). PCA is a bilinear modeling method which gives a
visually interpretable overview of the main information in large, multidimensional datasets. By plotting
the principal components it is possible to view statistical relationships between different variables in
complex datasets and detect and interpret sample groupings, similarities or differences, as well as the
relationships between the different variables [29].
5.3.21 Reporter metabolite analysis
Microarray data were analysed using an algorithm that integrates the topology of the yeast metabolic
graph to uncover the transcriptional regulatory architecture of the metabolic pathways. The so called
‘reporter metabolites’ are metabolites around which the most significant transcriptional changes can
occur. The algorithm allows pair-wise and multiple comparisons to be performed using transcriptome
data. Thus, multidimensional analysis of gene expression patterns at different times and between
different strains is used first to score reporter metabolites. Based on the reconstruction of the metabolic
network graphs it is possible to subsequently uncover highly correlated connected subgraphs
(subnetworks) within the enzyme-interaction graph. For more information, see the original article by
Patil & Nielsen [33].
117
5.4 Results 5.4.1 Strain physiology and fermentation kinetics
All five commercial strains displayed comparable growth rates and primary fermentation kinetics such
as fermentation rate, sugar utilization and ethanol production, while displaying significant differences
with regard to the production of extracellular metabolites [40]. Additional phenotypic characterisation
reveals significant differences in the general physiology of these strains. Such differences include (i)
cell surface and adhesion properties related phenotypes such as flocculation, invasive growth and mat
formation (Table 3), and (ii) the ability of the different strains to tolerate carbon, nitrogen, sulfur and
phosphorous starvation (Figure 1) as well as key stress conditions such as oxidative, osmotic and
ethanol stress (Figure 2).
Table 3 Summary of cell wall properties and adhesion phenotypes of the five yeast strains.
VIN13 EC1118 BM54 285 DV10
Flocculation % 3.63 ± 0.25 3.53 ± 0.55 12.17 ± 2.08 12.32 ± 2.75 5.85 ± 0.99
Modified Hydrophobicity Index (MHI) 0.037 ± 0.012 0.193 ± 0.031 0.555 ± 0.074 0.381 ± 0.042 0.155 ± 0.027
Cell surface charge index 25.4 ± 3.7 23.3 ± 2.4 26.5 ± 03.2 23.1 ± 2.2 28.1 ± 1.2
Mat formation No No Yes Yes No
With regard to cell surface properties, a general flocculation test revealed that the different strains
showed significant variation in their inherent ability to flocculate in the presence of Ca2+. Flocculation
was low in EC1118, VIN13, increased in DV10, and was highest for 285 and BM45. The flocculation
percentages observed are however all much lower when compared to those obtained in similar
conditions with laboratory yeast strains [8]. Besides flocculation ability, the cell surface hydrophobicity
of the various strains also differed significantly from one another. The inter-strain trends observed were
similar to those reported for the flocculation experiments. Furthermore only the BM45 and 285 strains
showed the ability to form mats or ‘biofilms’ on semi-solid media.
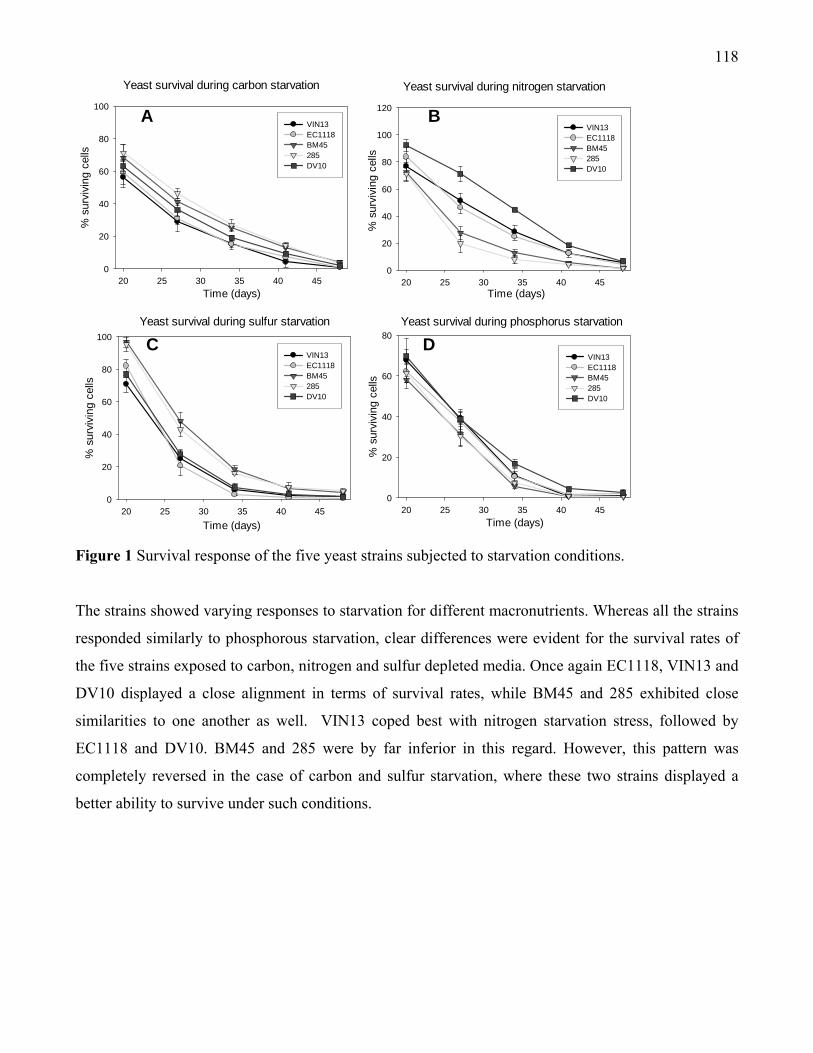
118
Figure 1 Survival response of the five yeast strains subjected to starvation conditions.
The strains showed varying responses to starvation for different macronutrients. Whereas all the strains
responded similarly to phosphorous starvation, clear differences were evident for the survival rates of
the five strains exposed to carbon, nitrogen and sulfur depleted media. Once again EC1118, VIN13 and
DV10 displayed a close alignment in terms of survival rates, while BM45 and 285 exhibited close
similarities to one another as well. VIN13 coped best with nitrogen starvation stress, followed by
EC1118 and DV10. BM45 and 285 were by far inferior in this regard. However, this pattern was
completely reversed in the case of carbon and sulfur starvation, where these two strains displayed a
better ability to survive under such conditions.
Yeast survival during carbon starvation
Time (days)20 25 30 35 40 45
% s
urvi
ving
cel
ls
0
20
40
60
80
100
VIN13EC1118BM45285DV10
Yeast survival during nitrogen starvation
Time (days)20 25 30 35 40 45
% s
urvi
ving
cel
ls
0
20
40
60
80
100
120
VIN13EC1118BM45285DV10
Yeast survival during sulfur starvation
Time (days)20 25 30 35 40 45
% s
urvi
ving
cel
ls
0
20
40
60
80
100
VIN13EC1118BM45285DV10
Yeast survival during phosphorus starvation
Time (days)20 25 30 35 40 45
% s
urvi
ving
cel
ls
0
20
40
60
80
VIN13EC1118BM45285DV10
A B
D C
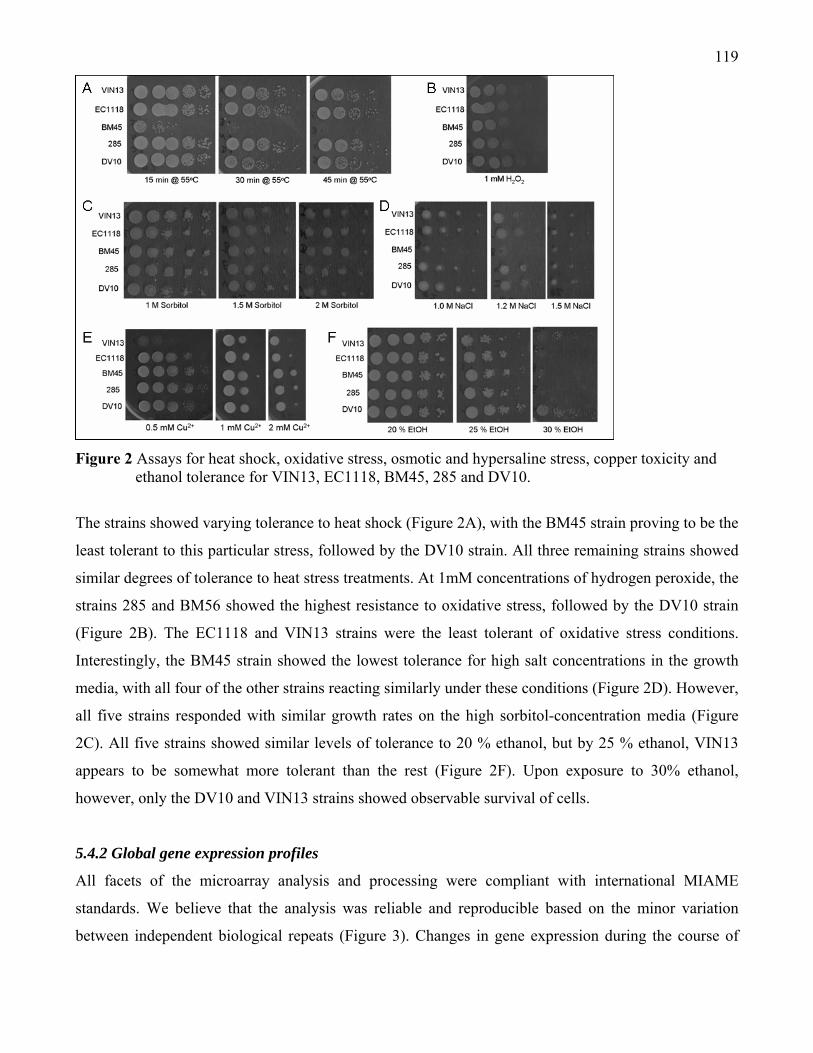
119
Figure 2 Assays for heat shock, oxidative stress, osmotic and hypersaline stress, copper toxicity and
ethanol tolerance for VIN13, EC1118, BM45, 285 and DV10.
The strains showed varying tolerance to heat shock (Figure 2A), with the BM45 strain proving to be the
least tolerant to this particular stress, followed by the DV10 strain. All three remaining strains showed
similar degrees of tolerance to heat stress treatments. At 1mM concentrations of hydrogen peroxide, the
strains 285 and BM56 showed the highest resistance to oxidative stress, followed by the DV10 strain
(Figure 2B). The EC1118 and VIN13 strains were the least tolerant of oxidative stress conditions.
Interestingly, the BM45 strain showed the lowest tolerance for high salt concentrations in the growth
media, with all four of the other strains reacting similarly under these conditions (Figure 2D). However,
all five strains responded with similar growth rates on the high sorbitol-concentration media (Figure
2C). All five strains showed similar levels of tolerance to 20 % ethanol, but by 25 % ethanol, VIN13
appears to be somewhat more tolerant than the rest (Figure 2F). Upon exposure to 30% ethanol,
however, only the DV10 and VIN13 strains showed observable survival of cells.
5.4.2 Global gene expression profiles
All facets of the microarray analysis and processing were compliant with international MIAME
standards. We believe that the analysis was reliable and reproducible based on the minor variation
between independent biological repeats (Figure 3). Changes in gene expression during the course of
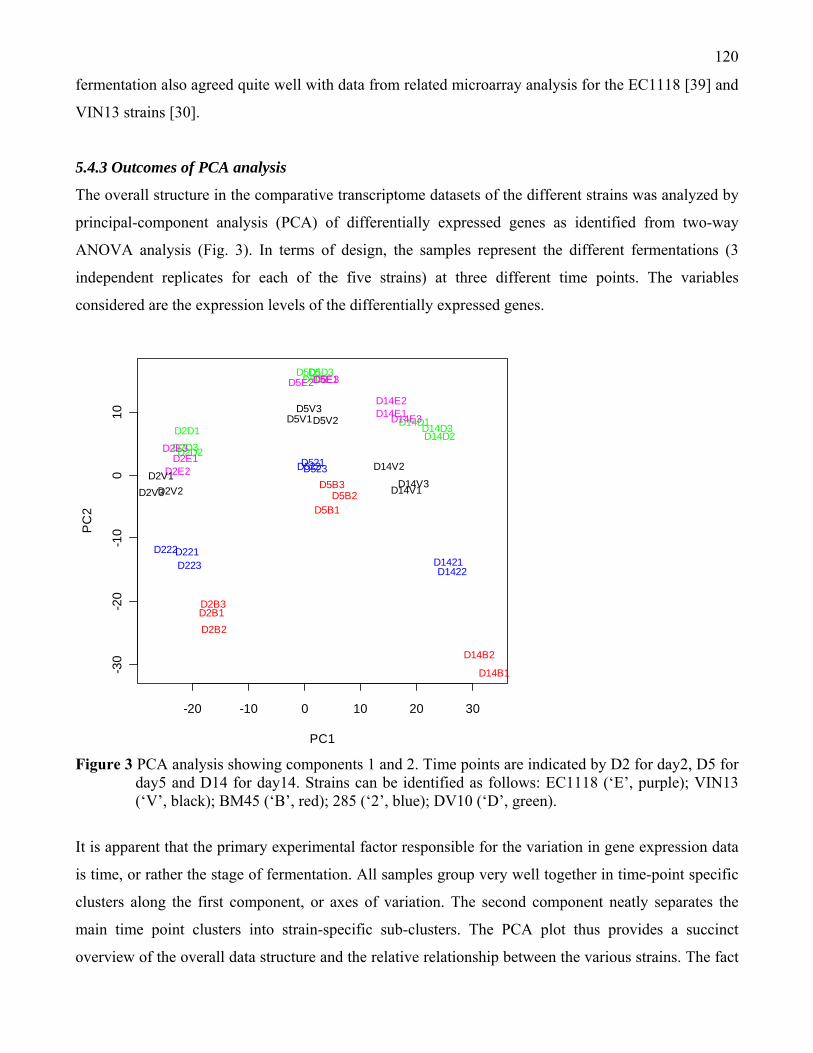
120
fermentation also agreed quite well with data from related microarray analysis for the EC1118 [39] and
VIN13 strains [30].
5.4.3 Outcomes of PCA analysis
The overall structure in the comparative transcriptome datasets of the different strains was analyzed by
principal-component analysis (PCA) of differentially expressed genes as identified from two-way
ANOVA analysis (Fig. 3). In terms of design, the samples represent the different fermentations (3
independent replicates for each of the five strains) at three different time points. The variables
considered are the expression levels of the differentially expressed genes.
Figure 3 PCA analysis showing components 1 and 2. Time points are indicated by D2 for day2, D5 for
day5 and D14 for day14. Strains can be identified as follows: EC1118 (‘E’, purple); VIN13 (‘V’, black); BM45 (‘B’, red); 285 (‘2’, blue); DV10 (‘D’, green).
It is apparent that the primary experimental factor responsible for the variation in gene expression data
is time, or rather the stage of fermentation. All samples group very well together in time-point specific
clusters along the first component, or axes of variation. The second component neatly separates the
main time point clusters into strain-specific sub-clusters. The PCA plot thus provides a succinct
overview of the overall data structure and the relative relationship between the various strains. The fact
-20 -10 0 10 20 30
-30
-20
-10
010
PC1
PC
2
D221D222D223
D2B1D2B2
D2B3
D2D1
D2D2D2D3D2E1
D2E2
D2E3
D2V1D2V2D2V3
D521D522D523
D5B1D5B2
D5B3
D5D1D5D2D5D3D5E1D5E2D5E3
D5V1D5V2D5V3
D1421D1422
D14B1
D14B2
D14D1D14D2D14D3
D14E1D14E2
D14E3
D14V1
D14V2
D14V3
121
that distinct groupings are evident for biological repeats attests to the integrity of the microarray
analyses. It is also evident (especially from second component) that certain strains are more similar in
terms of their overall gene expression patterns. For instance, BM45 and 285 group closely together at
all three time points, while EC1118 and DV10 also appear to group close together, with VIN13 in an
intermediate position between the two aforementioned clusters.
5.4.4 Significance and random forest analyses
A large number of genes were significantly differentially expressed between different strains at the
same time point ( ± 100-400) and within a particular strain at different time points during fermentation
( ± 1000-2000). The only genes from these detailed results that will be considered in more detail later
are those related to the GO process categories of energy and metabolism.
Random forest analysis is a CART aggregation technique that can be applied to comparative
microarray –type data in order to ‘rank’ genes in terms of their ability to discriminate between different
‘classes’ or samples from different experimental conditions. The technique is essentially similar to the
concept of biomarker identification and can be applied to discriminate between different experimental
factors or conditions. In our research, we used the approach in order to identify genes with a strong
discriminatory power, regardless of the absolute magnitude of fold change (which would otherwise
obscure more subtle yet extremely relevant changes in the expression of certain genes).
In the first case, genes are ranked in order of their ability to discriminate between different time points
during fermentation (regardless of strain variability). In the second case, genes are ranked based on
their ability to discriminate between different yeast strains regardless of growth cycles or fermentative
stage. The top 200 ranked genes for both strain and time point discrimination were subject to functional
categorization. The results of this functional enrichment of the ranked gene lists are summarized in
Table 4.
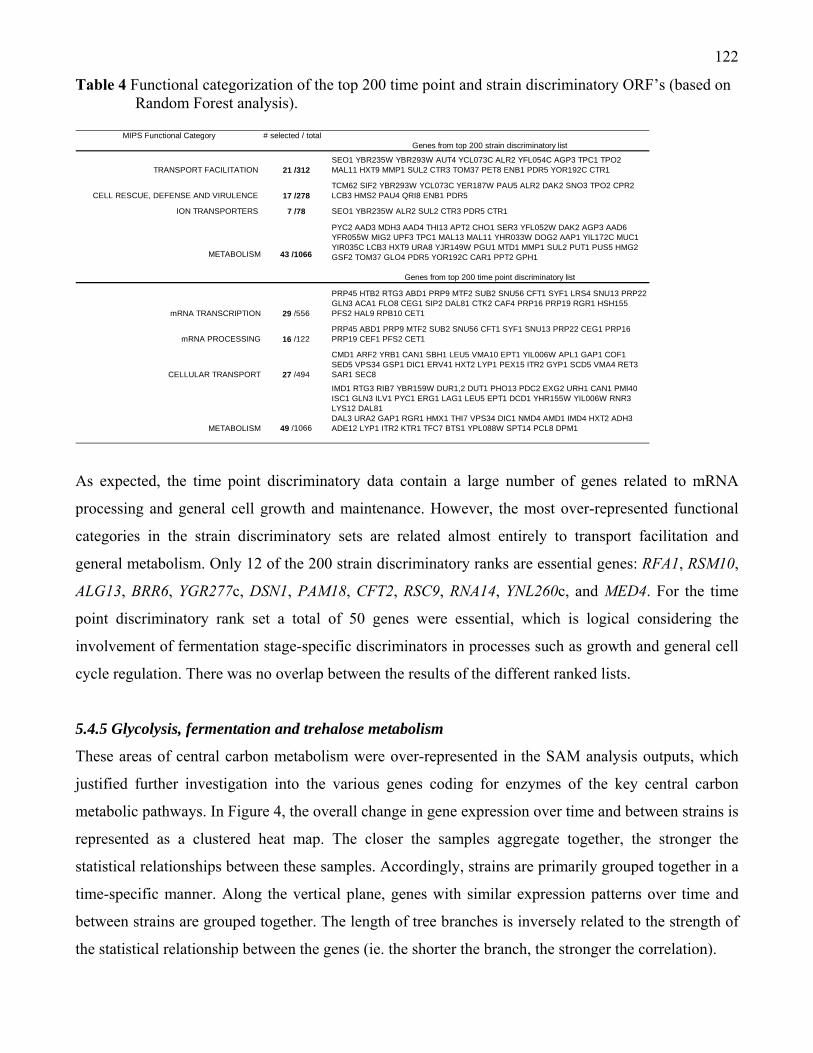
122
Table 4 Functional categorization of the top 200 time point and strain discriminatory ORF’s (based on Random Forest analysis).
MIPS Functional Category # selected / total
Genes from top 200 strain discriminatory list
TRANSPORT FACILITATION 21 /312SEO1 YBR235W YBR293W AUT4 YCL073C ALR2 YFL054C AGP3 TPC1 TPO2 MAL11 HXT9 MMP1 SUL2 CTR3 TOM37 PET8 ENB1 PDR5 YOR192C CTR1
CELL RESCUE, DEFENSE AND VIRULENCE 17 /278TCM62 SIF2 YBR293W YCL073C YER187W PAU5 ALR2 DAK2 SNO3 TPO2 CPR2 LCB3 HMS2 PAU4 QRI8 ENB1 PDR5
ION TRANSPORTERS 7 /78 SEO1 YBR235W ALR2 SUL2 CTR3 PDR5 CTR1
METABOLISM 43 /1066
PYC2 AAD3 MDH3 AAD4 THI13 APT2 CHO1 SER3 YFL052W DAK2 AGP3 AAD6 YFR055W MIG2 UPF3 TPC1 MAL13 MAL11 YHR033W DOG2 AAP1 YIL172C MUC1 YIR035C LCB3 HXT9 URA8 YJR149W PGU1 MTD1 MMP1 SUL2 PUT1 PUS5 HMG2 GSF2 TOM37 GLO4 PDR5 YOR192C CAR1 PPT2 GPH1
Genes from top 200 time point discriminatory list
mRNA TRANSCRIPTION 29 /556
PRP45 HTB2 RTG3 ABD1 PRP9 MTF2 SUB2 SNU56 CFT1 SYF1 LRS4 SNU13 PRP22 GLN3 ACA1 FLO8 CEG1 SIP2 DAL81 CTK2 CAF4 PRP16 PRP19 RGR1 HSH155 PFS2 HAL9 RPB10 CET1
mRNA PROCESSING 16 /122PRP45 ABD1 PRP9 MTF2 SUB2 SNU56 CFT1 SYF1 SNU13 PRP22 CEG1 PRP16 PRP19 CEF1 PFS2 CET1
CELLULAR TRANSPORT 27 /494
CMD1 ARF2 YRB1 CAN1 SBH1 LEU5 VMA10 EPT1 YIL006W APL1 GAP1 COF1 SED5 VPS34 GSP1 DIC1 ERV41 HXT2 LYP1 PEX15 ITR2 GYP1 SCD5 VMA4 RET3 SAR1 SEC8
METABOLISM 49 /1066
IMD1 RTG3 RIB7 YBR159W DUR1,2 DUT1 PHO13 PDC2 EXG2 URH1 CAN1 PMI40 ISC1 GLN3 ILV1 PYC1 ERG1 LAG1 LEU5 EPT1 DCD1 YHR155W YIL006W RNR3 LYS12 DAL81 DAL3 URA2 GAP1 RGR1 HMX1 THI7 VPS34 DIC1 NMD4 AMD1 IMD4 HXT2 ADH3 ADE12 LYP1 ITR2 KTR1 TFC7 BTS1 YPL088W SPT14 PCL8 DPM1
As expected, the time point discriminatory data contain a large number of genes related to mRNA
processing and general cell growth and maintenance. However, the most over-represented functional
categories in the strain discriminatory sets are related almost entirely to transport facilitation and
general metabolism. Only 12 of the 200 strain discriminatory ranks are essential genes: RFA1, RSM10,
ALG13, BRR6, YGR277c, DSN1, PAM18, CFT2, RSC9, RNA14, YNL260c, and MED4. For the time
point discriminatory rank set a total of 50 genes were essential, which is logical considering the
involvement of fermentation stage-specific discriminators in processes such as growth and general cell
cycle regulation. There was no overlap between the results of the different ranked lists.
5.4.5 Glycolysis, fermentation and trehalose metabolism
These areas of central carbon metabolism were over-represented in the SAM analysis outputs, which
justified further investigation into the various genes coding for enzymes of the key central carbon
metabolic pathways. In Figure 4, the overall change in gene expression over time and between strains is
represented as a clustered heat map. The closer the samples aggregate together, the stronger the
statistical relationships between these samples. Accordingly, strains are primarily grouped together in a
time-specific manner. Along the vertical plane, genes with similar expression patterns over time and
between strains are grouped together. The length of tree branches is inversely related to the strength of
the statistical relationship between the genes (ie. the shorter the branch, the stronger the correlation).
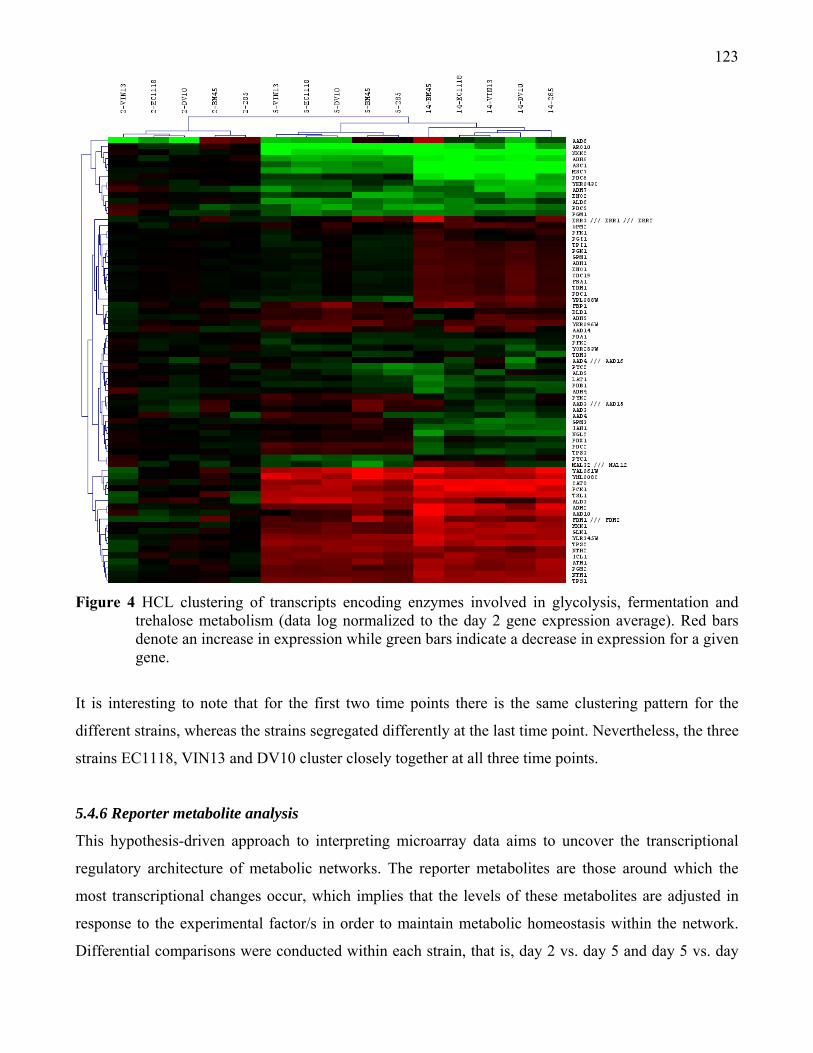
123
Figure 4 HCL clustering of transcripts encoding enzymes involved in glycolysis, fermentation and
trehalose metabolism (data log normalized to the day 2 gene expression average). Red bars denote an increase in expression while green bars indicate a decrease in expression for a given gene.
It is interesting to note that for the first two time points there is the same clustering pattern for the
different strains, whereas the strains segregated differently at the last time point. Nevertheless, the three
strains EC1118, VIN13 and DV10 cluster closely together at all three time points.
5.4.6 Reporter metabolite analysis
This hypothesis-driven approach to interpreting microarray data aims to uncover the transcriptional
regulatory architecture of metabolic networks. The reporter metabolites are those around which the
most transcriptional changes occur, which implies that the levels of these metabolites are adjusted in
response to the experimental factor/s in order to maintain metabolic homeostasis within the network.
Differential comparisons were conducted within each strain, that is, day 2 vs. day 5 and day 5 vs. day
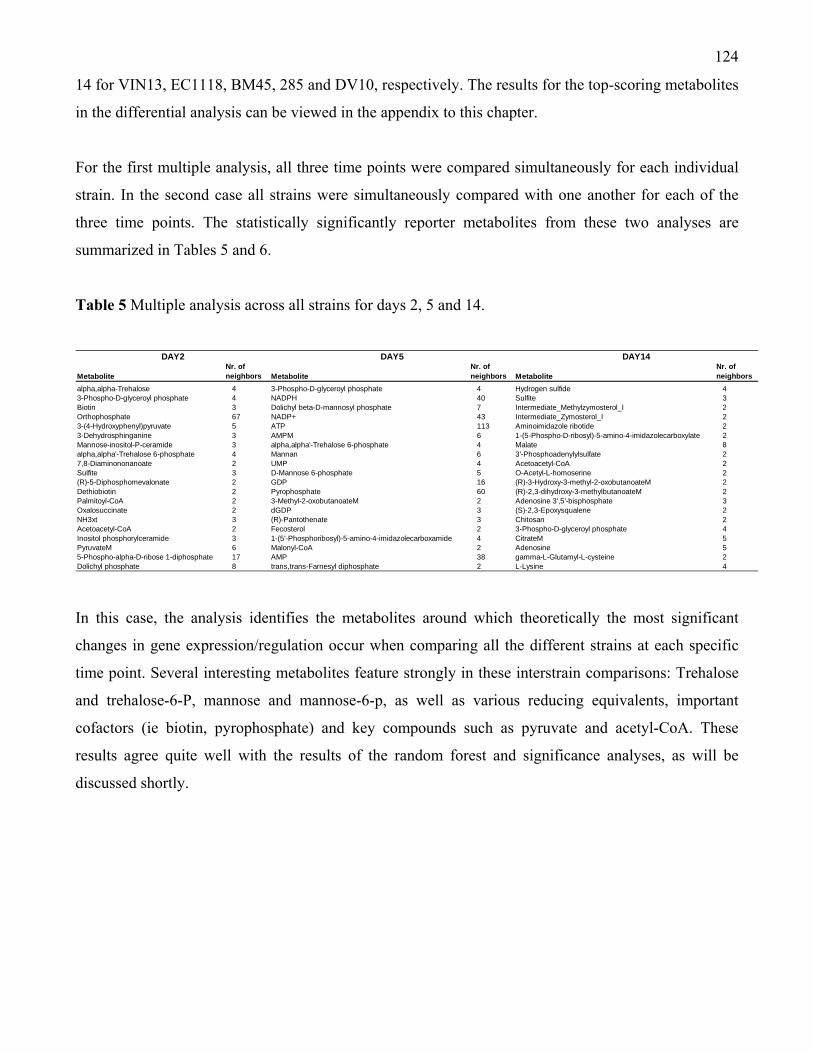
124
14 for VIN13, EC1118, BM45, 285 and DV10, respectively. The results for the top-scoring metabolites
in the differential analysis can be viewed in the appendix to this chapter.
For the first multiple analysis, all three time points were compared simultaneously for each individual
strain. In the second case all strains were simultaneously compared with one another for each of the
three time points. The statistically significantly reporter metabolites from these two analyses are
summarized in Tables 5 and 6.
Table 5 Multiple analysis across all strains for days 2, 5 and 14.
MetaboliteNr. ofneighbors Metabolite
Nr. ofneighbors Metabolite
Nr. ofneighbors
alpha,alpha-Trehalose 4 3-Phospho-D-glyceroyl phosphate 4 Hydrogen sulfide 43-Phospho-D-glyceroyl phosphate 4 NADPH 40 Sulfite 3Biotin 3 Dolichyl beta-D-mannosyl phosphate 7 Intermediate_Methylzymosterol_I 2Orthophosphate 67 NADP+ 43 Intermediate_Zymosterol_I 23-(4-Hydroxyphenyl)pyruvate 5 ATP 113 Aminoimidazole ribotide 23-Dehydrosphinganine 3 AMPM 6 1-(5-Phospho-D-ribosyl)-5-amino-4-imidazolecarboxylate 2Mannose-inositol-P-ceramide 3 alpha,alpha'-Trehalose 6-phosphate 4 Malate 8alpha,alpha'-Trehalose 6-phosphate 4 Mannan 6 3'-Phosphoadenylylsulfate 27,8-Diaminononanoate 2 UMP 4 Acetoacetyl-CoA 2Sulfite 3 D-Mannose 6-phosphate 5 O-Acetyl-L-homoserine 2(R)-5-Diphosphomevalonate 2 GDP 16 (R)-3-Hydroxy-3-methyl-2-oxobutanoateM 2Dethiobiotin 2 Pyrophosphate 60 (R)-2,3-dihydroxy-3-methylbutanoateM 2Palmitoyl-CoA 2 3-Methyl-2-oxobutanoateM 2 Adenosine 3',5'-bisphosphate 3Oxalosuccinate 2 dGDP 3 (S)-2,3-Epoxysqualene 2NH3xt 3 (R)-Pantothenate 3 Chitosan 2Acetoacetyl-CoA 2 Fecosterol 2 3-Phospho-D-glyceroyl phosphate 4Inositol phosphorylceramide 3 1-(5'-Phosphoribosyl)-5-amino-4-imidazolecarboxamide 4 CitrateM 5PyruvateM 6 Malonyl-CoA 2 Adenosine 55-Phospho-alpha-D-ribose 1-diphosphate 17 AMP 38 gamma-L-Glutamyl-L-cysteine 2Dolichyl phosphate 8 trans,trans-Farnesyl diphosphate 2 L-Lysine 4
DAY2 DAY5 DAY14
In this case, the analysis identifies the metabolites around which theoretically the most significant
changes in gene expression/regulation occur when comparing all the different strains at each specific
time point. Several interesting metabolites feature strongly in these interstrain comparisons: Trehalose
and trehalose-6-P, mannose and mannose-6-p, as well as various reducing equivalents, important
cofactors (ie biotin, pyrophosphate) and key compounds such as pyruvate and acetyl-CoA. These
results agree quite well with the results of the random forest and significance analyses, as will be
discussed shortly.
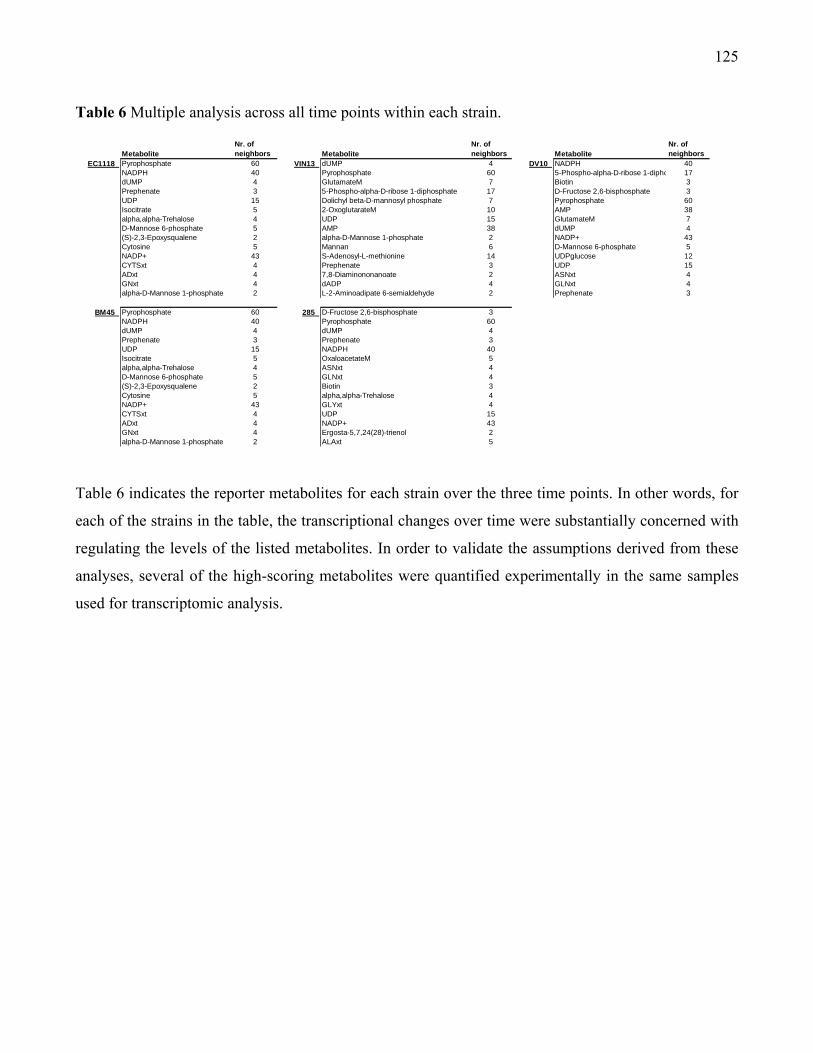
125
Table 6 Multiple analysis across all time points within each strain.
MetaboliteNr. ofneighbors Metabolite
Nr. ofneighbors Metabolite
Nr. ofneighbors
EC1118 Pyrophosphate 60 VIN13 dUMP 4 DV10 NADPH 40NADPH 40 Pyrophosphate 60 5-Phospho-alpha-D-ribose 1-dipho 17dUMP 4 GlutamateM 7 Biotin 3Prephenate 3 5-Phospho-alpha-D-ribose 1-diphosphate 17 D-Fructose 2,6-bisphosphate 3UDP 15 Dolichyl beta-D-mannosyl phosphate 7 Pyrophosphate 60Isocitrate 5 2-OxoglutarateM 10 AMP 38alpha,alpha-Trehalose 4 UDP 15 GlutamateM 7D-Mannose 6-phosphate 5 AMP 38 dUMP 4(S)-2,3-Epoxysqualene 2 alpha-D-Mannose 1-phosphate 2 NADP+ 43Cytosine 5 Mannan 6 D-Mannose 6-phosphate 5NADP+ 43 S-Adenosyl-L-methionine 14 UDPglucose 12CYTSxt 4 Prephenate 3 UDP 15ADxt 4 7,8-Diaminononanoate 2 ASNxt 4GNxt 4 dADP 4 GLNxt 4alpha-D-Mannose 1-phosphate 2 L-2-Aminoadipate 6-semialdehyde 2 Prephenate 3
BM45 Pyrophosphate 60 285 D-Fructose 2,6-bisphosphate 3NADPH 40 Pyrophosphate 60dUMP 4 dUMP 4Prephenate 3 Prephenate 3UDP 15 NADPH 40Isocitrate 5 OxaloacetateM 5alpha,alpha-Trehalose 4 ASNxt 4D-Mannose 6-phosphate 5 GLNxt 4(S)-2,3-Epoxysqualene 2 Biotin 3Cytosine 5 alpha,alpha-Trehalose 4NADP+ 43 GLYxt 4CYTSxt 4 UDP 15ADxt 4 NADP+ 43GNxt 4 Ergosta-5,7,24(28)-trienol 2alpha-D-Mannose 1-phosphate 2 ALAxt 5
Table 6 indicates the reporter metabolites for each strain over the three time points. In other words, for
each of the strains in the table, the transcriptional changes over time were substantially concerned with
regulating the levels of the listed metabolites. In order to validate the assumptions derived from these
analyses, several of the high-scoring metabolites were quantified experimentally in the same samples
used for transcriptomic analysis.
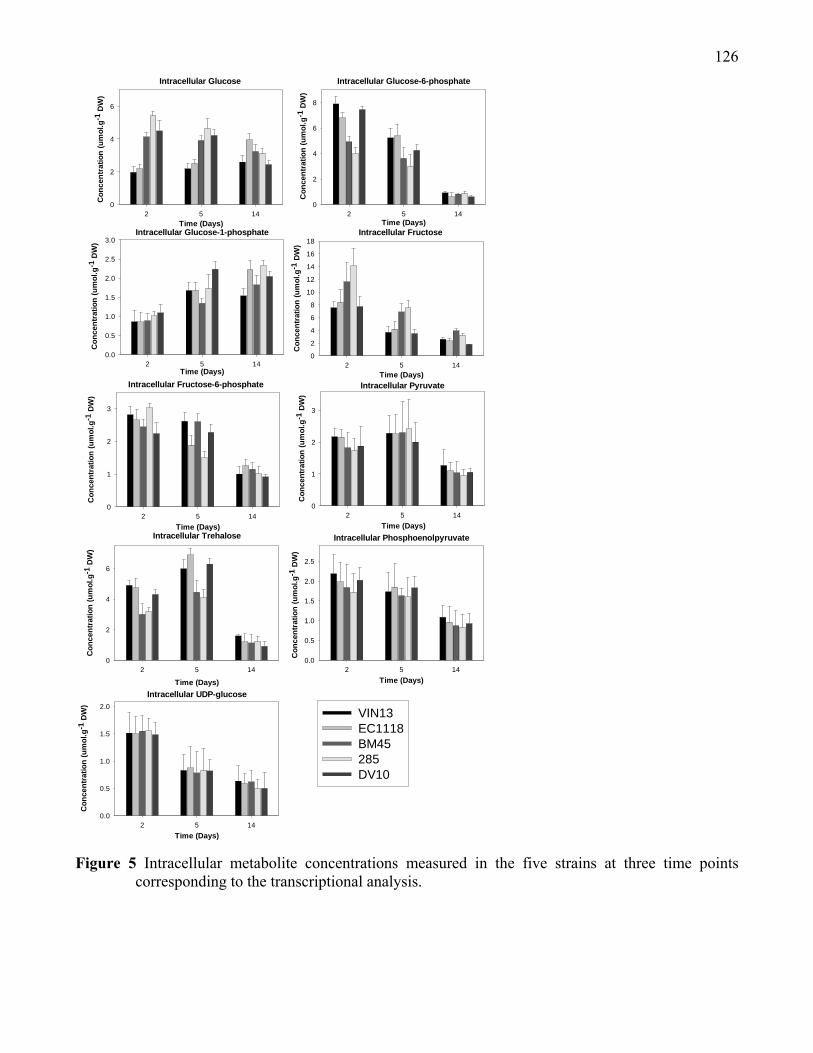
126
Figure 5 Intracellular metabolite concentrations measured in the five strains at three time points
corresponding to the transcriptional analysis.
Intracellular Phosphoenolpyruvate
Time (Days)2 5 14
Con
cent
ratio
n (u
mol
.g-1
DW
)
0.0
0.5
1.0
1.5
2.0
2.5
VIN13EC1118BM45285DV10
Intracellular Pyruvate
Time (Days)2 5 14
Con
cent
ratio
n (u
mol
.g-1
DW
)
0
1
2
3
Intracellular Glucose-6-phosphate
Time (Days)2 5 14
Con
cent
ratio
n (u
mol
.g-1
DW
)
0
2
4
6
8
Intracellular Glucose
Time (Days)2 5 14
Con
cent
ratio
n (u
mol
.g-1
DW
)
0
2
4
6
Intracellular Glucose-1-phosphate
Time (Days)2 5 14
Con
cent
ratio
n (u
mol
.g-1
DW
)
0.0
0.5
1.0
1.5
2.0
2.5
3.0Intracellular Fructose
Time (Days)2 5 14
Con
cent
ratio
n (u
mol
.g-1
DW
)
0
2
4
6
8
10
12
14
16
18
Intracellular Fructose-6-phosphate
Time (Days)2 5 14
Con
cent
ratio
n (u
mol
.g-1
DW
)
0
1
2
3
Intracellular Trehalose
Time (Days)2 5 14
Con
cent
ratio
n (u
mol
.g-1
DW
)
0
2
4
6
Intracellular UDP-glucose
Time (Days)2 5 14
Con
cent
ratio
n (u
mol
.g-1
DW
)
0.0
0.5
1.0
1.5
2.0
127
Most metabolite levels followed the same general pattern of decrease as fermentation progresses
(Figure 5). One notable exception is trehalose, which showed an increase in intracellular concentration
between days 2 and 5, with lower levels once again evident at day14 at the end of fermentation.
Intracellular glucose-1-phosphate also showed a definite increase in intracellular levels from beginning
to end of the fermentation cycle. In terms of inter-strain variations, no statistically significant
differences were evident across strains for the metabolites phosphoenolpyruvate (PEP), pyruvate and
UDP-glucose. Intracellular glucose and fructose concentrations were significantly higher in the BM45
and 285 strains in the early stages of fermentation (days 2 and 5), while glucose-6-phosphate (and to a
lesser extent glucose-1-phosphate and fructose-6-phosphate) concentrations were significantly lower in
comparison to the EC1118 and VIN13. Intracellular trehalose levels were also consistently higher in
EC1118, VIN13 and DV10 compared to BM45 and 285, particularly at days 2 and 5.
5.5 Discussion 5.5.1 Stress responses
From our comparative transcriptome analysis it was evident that differences in the expression of genes
involved in the various pathways involved in stress tolerance were substantial at all three time points
considered. Clearly significant differences exist in the manner in which the five strains adapt to the
changing fermentation environment at the molecular level. However, the problem from a data analysis
perspective regarding these phenotypes is two-fold: Firstly, the genomic response programs for the
different stress conditions share common effectors and regulators, making it difficult to attribute
differences in gene expression levels to any specific stress tolerance phenotype. The second
complication in the batch fermentation context is the fact that we have limited control and knowledge
over the stress factors that are faced by the yeast at the specific time points at which transcriptomic
analyses were conducted. There are thus inherent complications in terms of connecting differences in
stress-related gene expression with stress responses and inherent phenotypic differences between the
strains, as revealed by our analysis.
Instead of a haphazard attempt to arbitrarily connect gene expression profiles with stress phenotypes
we sought to explain some of these differences in light of the more concrete (and experimentally
validated) metabolic differences between the strains. These links will be explored in more detail in the
discussion of the reporter metabolite analysis.
128
5.5.2 Flocculation
The flocculation response of yeast cells is a highly complex process, involving several interrelated
signal transduction and stress response pathways as well as numerous structural proteins in the cell
wall. Key components of this intricate system include not only the flocculation proteins themselves but
also the enzymes responsible for the production and attachment of mannosyl residues to these structural
proteins of the cell wall. Enzymes involved in the production of GPI anchors may also play a role in the
covalent attachment and incorporation of flocculins and mannoproteins into the cell wall [28; 46].
There is great diversity/variation in the inherent adhesion abilities of different yeast strains used in
industrial wine fermentations. In terms of the five strains used in this study, BM45 and 285 are the
strains with superior cell-cell and cell-substrate adhesion properties in comparison to the EC1118 and
VIN13 strains (Table 3). In light of the results of our comparative transcriptomic profiling there may be
several genetic factors responsible for these differences.
5.5.2.1 Flocculin-encoding genes
Although the ability of S. cerevisiae to adhere to other cells and one another is a component of complex
developmental processes, one of the main requirements is the expression of various FLO genes, FLO1,
FLO5, FLO10 and FLO11/ MUC1 [8; 10; 27; 43]. However, these genes are known to present strong
strain-dependent variation in size and in their effectiveness to induce adhesion-related phenotypes [44]
and their individual expression levels may not be accurately measured in current arrays because of
significant sequence homology. More interesting from a phenotypic perspective should be the
expression levels of transcriptional activators that are known to control general adhesion properties
such as FLO8. Indeed, it has been well established that the expression levels of this gene directly
correlate with flocculation and adhesion efficiency [8; 43; 44]. This gene showed significantly higher
expression levels during early stationary phase in the BM45 strain compared to the weaker flocculating
strains VIN13 and EC11118, correlating well with the observed difference in intrinsic flocculation and
adhesion ability.
5.5.2.2. Cell wall mannoproteins
Several cell wall mannoproteins of the FIT and DAN families showed significant increases in
expression in the BM45 and 285 strains in comparison to the rest. Most notable among these are FIT2,
FIT3, DAN1, and DAN4. The FIT genes code for GPI-anchored cell wall mannoproteins that are
involved in the uptake and retention of iron in the cell wall [36]. The regulation and roles of the DAN
129
family of mannoproteins are still poorly understood, although they are evidently required for anaerobic
growth [13]. As mannoproteins, the FIT and DAN gene products are cell-wall bound and present
mannose residues for selective binding by flocculation proteins of adjacent cells. The higher expression
levels of genes in both the FIT and DAN families in the two strains with superior cell adhesion
properties (BM45 and 285; Table 3) thus serve as a possible indicator of the potential involvement of
these two gene families in establishing different adhesion phenotypes in wine yeast strains.
5.5.3 Central carbon metabolism
Our data show that a large proportion of differentially expressed transcripts are related to core
metabolic activities of the fermenting yeasts (see Tables 2 and 3, Figure 4). Several enzymes involved
in hexose metabolism, glycolysis, trehalose metabolism and redox balance are differentially expressed
between strains at various stages of fermentation. The analysis of the gene expression levels within the
framework of enzyme-enzyme and enzyme-metabolite interaction graphs (using the reporter metabolite
approach) helped to pin-point areas of metabolism that could speculatively be related to strain-strain or
time point variation.
Trehalose, glucose-6-phosphate, glucose, UDP-glucose and fructose-6-phosphate scored high on the
differential and multiple analyses across time points during fermentation (see table 6 and
supplementary material. Indeed, these metabolites did show marked differences in concentration
between time points (Figure 5). Trehalose was also a prominent inter-strain reporter for days 2 and 5,
and once again experimentally determined trehalose levels were found to be significantly different
between strains at these time points (Figure 5). This provides confidence that the outputs of the reporter
analysis are biologically relevant and useful for an in silico interpretation of metabolic variation
between different strains or key time points during fermentation. Several interesting features of these
outputs will be discussed briefly in the following section.
Trehalose and trehalose-6-phosphate appear numerous times in the multiple and differential reporter
analyses, indicating that regulation of trehalose levels plays a key role throughout fermentation, both as
a stress metabolite and as a key allosteric regulator of several important glycolytic enzymes. Trehalose-
6-P restricts sugar influx into glycolysis through inhibition of the hexokinases [23], and thus
determines the flux through glycolysis and the provision of energy and intermediates for fermentation,
glycerol metabolism and the OPP pathway. Changes in the expression of the genes involved in
trehalose metabolism could potentially account for the metabolic restructuring that occurs in carbon

130
metabolism as fermentation progresses. For instance, expression levels of genes encoding TPS1, TPS2
and TSL1 (involved in trehalose synthesis) increase sharply between days 2 and 5 of fermentation. This
is mirrored by the experimentally determined increase in trehalose levels between these two time
points. It would be anticipated that trehalose levels would continue to increase sharply towards the end
stages of fermentation. Our observation of lower trehalose levels at the end of fermentation can be
explained by trehalose mobilization at the final stage of fermentation when sugar exhaustion is
imminent. This correlates well with the increasing expression levels of transcripts encoding
intracellular trehalose-degrading enzymes (NTH1 and NTH2), as well as a decrease in the expression of
TPS3, which encodes a positive regulator of the TPS1 and TPS3 encoded subunits.
Trehalose concentrations are significantly higher in the EC1118, VIN13 and DV10 strains during
exponential and early logarithmic growth in comparison to the BM45 and 285 strains. This propensity
for comparatively greater trehalose accumulation could be an important contributing factor for the
increased thermo-tolerance, ethanol and osmotic shock tolerance exhibited by these three strains in
comparison to BM45 in particular [24].
The BM45 and 285 strains were characterized by significantly lower levels of intracellular hexose
phosphates, and higher levels of fructose. This suggests a possible discrepancy in the phosphorylation
efficiency of these strains, and may explain their generally lower fermentative rate, higher residual
sugars at the end of fermentation and propensity for ‘stuck’ or sluggish fermentations. This apparently
more ‘conservative’ phosphorylation and utilization of glucose and fructose by these two strains could
explain why they showed a significantly higher survival rate under carbon starvation conditions in
comparison to the other three strains.
As mentioned earlier, trehalose-6-phosphate levels also play a key inhibitory role in the rate of hexose
phosphorylation [23]. Both trehalose and trehalose-6-phosphate feature as strong reporters for the inter-
strain comparisons at day 2 and 5 (Table 5). It is thus tempting to speculate that the regulation of
trehalose metabolism is a noteworthy area of divergence between wine yeast strains, and that this in
turn has far-reaching effects on hexose phosphorylation and entry into glycolysis. Trehalose
metabolism could thus potentially represent a type of overarching regulator with implications for the
general fermentation phenotypes of different wine yeast strains.
131
Several other reporter metabolites are of interest in terms of their likely connection with fermentative
phenotypes or relevant physiological traits. The presence of mannose in most of the top10 reporter
metabolite lists for the intra-strain analysis (i.e. the time point differential data, Table 6) suggests a shift
in the provision and availability of mannose residues for mannosylation of cell wall proteins as
fermentation progresses. This could again point to protein mannosylation as an important area in terms
of determining cell-cell adherence and aggregation during fermentation. Mannose residues or
precursors thereof also feature heavily on the day 2 and day 5 inter-strain lists, suggesting that
regulation of mannose metabolism differs between the strains in this study, at least partially accounting
for their different cell wall properties and flocculation responses.
Reducing equivalents like NADP and NADPH as well as related metabolites like glutamate and
oxoglutarate (interconversion of these two metabolites is involved in regulating the intercellular
NADP/NADH ratios) also stand out in this analysis. Changes in/maintenance of the ratios of these
important reducing equivalents is a major area of metabolic adjustment during anaerobic fermentation
due to the decreased availability of sugars (glucose) and the build-up of glycolytic intermediates and
other potentially toxic products, e.g. acetaldehyde, as fermentation progresses.
Prephenate (which is present in the top 15 reporters for each strain) is an intermediate in the
biosynthesis of the aromatic amino acids phenylalanine and tyrosine. This suggests that large-scale
changes in the expression of genes involved in this branch of amino acid metabolism occur during the
course of fermentation. These aromatic amino acids are starting points for pathways that produce
important aroma compounds in wine, namely 2-phenylethanol and 2-phenylethyl acetate [40]. The rate
at which these volatile compounds appear in the must is high during the first few days of fermentation,
decreasing substantially towards the end. This could reflect a reduced availability of the necessary
precursors in the later stages of fermentation, as suggested by the reporter analysis.
Fru-2,6-P2 also features in the DV10 and 285 strains for the intra-strain analysis. This metabolite is not
just an intermediary metabolite of glycolysis, but like trehalose it is a very potent regulator of
glycolysis by inhibiting Pfkp activity. This could potentially be related to the slowing in the rate of
glycolysis as fermentation progresses. Biotin (also on the list for DV10 and 285) also exerts a marked
effect upon the hexokinase activity of yeast, leading to a stimulation of the rate of glucose and fructose
utilization. Once again this could contribute to the regulation of flux through glycolysis and related
pathways etc during the course of fermentation.
132
The regulatory changes surrounding trehalose metabolism are different for the strains at especially day
2 and also day 5. Likewise glycolytic metabolites like 3-Phospho-D-glyceroyl phosphate (just below
the branch point between the glycerol pathway and the lower glycolysis) are also well represented in
the analysis at days 2 and 5. This could indicate a difference in the way that the strains partition carbon
towards glycerol production (to maintain NAD/NADH ratios) versus pyruvate production, leading
ultimately to ethanol formation. In support of this concept, glycerol production was compared in the 5
strains and there were indeed significant differences [40]. Such inherent differences in glycerol
production by the different strains could account for their varying tolerance levels of osmotic stress
conditions.
NADP and NADPH are high scoring metabolites for the inter-strain comparisons at day 5. This could
be the result of the differences in the dehydrogenase-catalysed reactions of the strains. The ratio of
NADP and NADPH will impact on the production of a number of higher alcohols produced by the
strains, and interestingly many of these alcohols differ significantly between strains [40]. The pathways
leading to the production of these compounds contain several aldehyde/alcohol dehydrogenase
catalysed steps. These enzymes can usually catalyze both the forward and reverse reactions and are
very sensitive to NAD/NADH ratios. It is reasonable to speculate that differences in the directionality
and flux through dehydrogenase-catalysed pathways in the different strains affects the overall
regulation of NAD/NADH and NADP/NADPH levels in these strains, leading to differences in the
cellular balance of reducing equivalents. Identification of the NADP/NADPH ratio as a key metabolic
marker between different strains holds far-reaching implications for the overall regulation of metabolic
networks in these strains.
(S)-2,3-Epoxysqualene, methylzymosterol and zymosterol (on the day14 list) are uncommon sterols
that have hypothesized roles in membrane stabilization under high ethanol levels, which makes sense in
light of the high ethanol concentrations at the end of fermentation. The reporter analysis identifies
reactions related to the metabolism of these sterols as areas of variability between strains. It is tempting
to speculate that this is one of the contributory factors for the differences in ethanol tolerance that was
observed in our stress assays.
133
5.6 Conclusions The research presented here provides a base for further hypothesis-driven investigations into the role of
various genetic systems in oenologically relevant phenotypes. By analyzing large comparative
transcriptomic datasets of five industrial wine yeast strains we were able to identify various genes /
gene sets that could be linked to relevant aspects of yeast performance in key areas related to
flocculation, stress tolerance and metabolism. The study sheds light on some of the underlying
molecular factors related to common inter-strain variations between strains, and also increased our
understanding of metabolic changes that occur during fermentation under wine-making conditions. By
using five yeast strains and three time points we were able to eliminate ‘noise’ and clearly distinguish
between differences in gene expression that are related to strain identity alone, as opposed to the
specific stage of fermentation. Strains such as BM45 and 285, which were similar in terms of their
overall gene expression patterns (as can be seen from the PCA analysis in Figure 3) showed similar cell
adhesion properties and stress tolerance properties (Table 3, Figure 1-2). The same is true for EC1118,
DV10 and VIN13 (to a lesser extent). These strain groupings also hold for the profiles of exo-
metabolites produced [40], as well as for the concentrations of the nine key intercellular metabolites
measured (Figure 5). By contextualizing the comparative transcriptome datasets within existing
metabolic maps and applying the reporter metabolite algorithm we were able to pin-point some of the
underlying molecular and genetic factors responsible for these important physiological trait differences
between strains. Ultimately, the research presented in this paper provides new insights for targeted
engineering strategies aimed at improving the performance of wine yeast strains.
Acknowledgements Funding for the research presented in this paper was provided by the NRF and Winetech, and personal
sponsorship by the Wilhelm Frank Trust. Funding for travel and collaboration was provided by the
Swedish-South African bilateral grant. We would also like to thank Jo McBride and the Cape Town
Centre for Proteomic and Genomic Research for the microarray analysis and the staff and students at
the IWBT for their support and assistance in numerous areas.
134
References 1. Abbott DA, TA Knijnenburg, LM de Poorter, MJ Reinders, JT Pronk & AJ van Maris
2007. Generic and specific transcriptional responses to different weak organic acids in
anaerobic chemostat cultures of Saccharomyces cerevisiae. FEMS Yeast Res. 7:819-833.
2. Attfield PV 1997. Stress tolerance: the key to effective strains of baker’s yeast. Nat.
Biotechnol. 15:1351-1357.
3. Bauer FF & Pretorius IS 2000. Yeast stress response and fermentation efficiency: how to
survive the making of wine – a review. S. Afr. J. Enol. 21:27-51.
4. Beltran G, Novo M, Leberre V, Sokol S, Labourdette D, Guillamon JM, Mas A, François
J & N Rozes 2006. Integration of transcriptomic and metabolic analyses for understanding the
global responses of low-temperature winemaking fermentations. FEMS Yeast Res. 6:1167-
1183.
5. Bely L, J Sablayrolles & P Barre 1990. Description of alcoholic fermentation kinetics: its
variability and significance. Am. J. Enol. Vitic. 40:319-324.
6. Ben-Dor A, R Shamir & Z Yakhini 1999. Clustering gene expression patterns. J. Comp. Biol.
6:281-297.
7. Bergmeyer HU & E Bernt 1974. Methods of Enzymatic Analysis, vol. 3. Verlag Chemie
Meinheim, Academic Press Inc., New York, London.
8. Bester MC, IS Pretorius & FF Bauer 2006. The regulation of Saccharomyces cerevisiae FLO
gene expression and Ca2+ -dependent flocculation by Flo8p and Mss11p. Curr. Genet. 49:375-
383.
9. Boer VM, JH de Winde, JT Pronk & MD Piper 2003. The genome-wide transcriptional
responses of Saccharomyces cerevisiae grown on glucose in aerobic chemostat cultures limited
for carbon, nitrogen, phosphorus or sulfur. J. Biol. Chem. 278:3265-3274.

135
10. Braus GH, O Grundmann, S Brückner & HU Mösch 2003. Amino acid starvation and
Gcn4p regulate adhesive growth and FLO11 gene expression in Saccharomyces cerevisiae.
Mol. Biol. Cell 14:4272-4284.
11. Breiman L 2001. Random Forests. Machine Learning 45: 5-22.
12. Caro LHP, H Tettelin, JH Vossen, AFJ Ram, H van den Ende & FM Klis 1997. In silico
identification of glycosyl-phosphatidylinositol-anchored plasma-membrane and cell wall
proteins of Saccharomyces cerevisiae. Yeast 13:1477-1489.
13. Cohen BD, O Sertil, NE Abramova, KJA Davies & CV Lowry 2001. Induction and
repression of DAN1 and the family of anaerobic mannoprotein genes in Saccharomyces
cerevisiae occurs through a complex array of regulatory sites. Nucl. Acids Res. 29:799-808.
14. d’Amore T & Stewart GG 1987. Ethanol tolerance of yeast. Enzyme Microb. Technol. 9:322-
330.
15. Dickinson JR, Eshantha L, Salgado J & Hewlins MJE 2002. The catabolism of amino acids
to long chain and complex alcohols in Saccharomyces cerevisiae. J. Biol. Chem. 278:8028-
8034.
16. Förster J, I Famili, P Fu, B Palsson & J Nielsen 2003. Genome-scale reconstruction of the
Saccharomyces cerevisiae metabolic network. Genome Res. 13:244-253.
17. Goffeau A, BG Barrell, H Bussey, RW Davis, B Dujon, H Feldmann, F Galibert, JD
Hoheisel, C Jacq, M Johnston, EJ Louis, HW Mewes, Y Murakami, P Philippsen, H
Tettelin & SG Oliver 1996. Life with 6000 genes. Science 274:563-567.
18. Gasch AP, Spellman PT, Kao CM, Carmel-Harel O, Eisen MB, Storz G, Botstein D & PO
Brown 2000. Genomic expression changes in the response of yeast cells to environmental
changes. Mol. Biol. Cell. 11:4241-4257.

136
19. Govender P, Domingo JL, Bester MC, Pretorius IS & FF Bauer 2008. Controlled
expression of the dominant flocculation genes FLO1, FLO5, and FLO11 in Saccharomyces
cerevisiae. Appl. Environ. Microbiol. 74:6041-6052.
20. Hallsworth JE 1998. Ethanol-induced water stress in yeast. J. Ferment. Bioeng. 85:125-137.
21. Hartwell LH, JJ Hopfield, S Leibler & AW Murray 1999. From molecular to modular cell
biology. Nature 402:C47-C52.
22. Hinchcliffe E, WG Box, EF Walton & M Appleby 1985. The influences of cell wall
hydrophobicity on the top fermenting properties of brewing yeast. Proc. Eur. Brew. Congr.
20:323-330.
23. Hohmann S, W Bell, MJ Neves, D Valckx & JM Thevelein 1996. Evidence for trehalose-6-
phosphate-dependent and -independent mechanisms in the control of sugar influx into yeast
glycolysis. Mol. Microbiol. 20:981 -91.
24. Hohmann S 1997. Shaping up: the response of yeast to osmotic stress. In: Hohmann S, Mager
WH, eds. stress responses. Heidelberg, Springer, pp 101-134.
25. Ideker T, T Galitski & L Hood 2001. A new approach to decoding life: systems biology.
Annu. Rev. Genomics Hum. Genet. 2:343-372.
26. Ivorra C, Pérez-Ortín JE & M del Olmo 1999. An inverse correlation between stress
resistance and stuck fermentations in wine yeasts. A molecular study. Biotechnol. Bioeng.
54:698-708.
27. Lo WS & AM Dranginis 1998. The cell surface flocculin Flo11 is required for pseudohyphae
formation and invasion by Saccharomyces cerevisiae. Mol. Biol. Cell 9:161-171.
28. Maneesri J, M Azuma, Y Sakai, K Igarashi, T Matsumoto, H Fukuda, A Kondo & H
Ooshima 2005. Deletion of MCD4 involved in glycosylphosphatidylinositol (GPI) anchor

137
synthesis leads to an increase in β—1,6-glucan level and a decrease in GPI-anchored protein
and mannan levels in the cell wall of Saccharomyces cerevisiae. J. Biosci. Bioeng. 99:354-360.
29. Mardia KV, JT Kent JT & JH Bibby 1979. Multivariate analysis. Academic Press, UK.
30. Marks VD, van der Merwe GK & HJJ van Vuuren 2003. Transcriptional profiling of wine
yeast in fermenting grape juice: regulatory effect of diammonium phosphate. FEMS Yeast Res.
3:269-287.
31. Marks VD, SJ Ho Sui, D Erasmus, GK van den Merwe, J Brumm, WW Wasserman, J
Bryan & HJJ van Vuuren 2008. Dynamics of the yeast transcriptome during wine
fermentation reveals a novel fermentation stress response. FEMS Yeast Res. 8:35-52.
32. Marullo P, M Bely, I Masneuf-Pomarede, M Aigle & D Dubourdieu 2004. Inheritable
nature of enological quantitative traits is demonstrated by meiotic segregation of industrial wine
yeast strains. FEMS Yeast Res. 4:711-719.
33. Patil KR & J Nielsen 2005. Uncovering transcriptional regulation of metabolism by using
metabolic network topology. PNAS 102:2685-2689.
34. Pizarro FJ, Jewett MC, Nielsen J & E Agosin 2008. Growth temperature exerts differential
physiological and transcriptional responses in laboratory and wine yeast strains of
Saccharomyces cerevisiae. Appl. Environ. Microbiol. 74:6358-6368.
35. Pretorius IS & FF Bauer 2002. Meeting the consumer challenge through genetically
customized wine-yeast strains. Trends Biotech. 20:426-432.
36. Protchenko O, T Ferea, J Rashford, J Tiedeman, PO Brown, D Botstein & CC Philpott
2001. Three cell wall mannoproteins facilitate the uptake of iron in Saccharomyces cerevisiae.
J. Biol. Chem. 276:49244-49250.
37. Rappoport A & M Becker 1985. Changes in the surface charge of yeast cells during their
dehydration and rehydration. Miktobiologiya 54:450-453.
138
38. Reynolds TB & GR Fink 2001. Bakers' yeast, a model for fungal biofilm formation. Science
291:878-881.
39. Rossignol T, L Dulau, A Julien & B Blondin 2003. Genome-wide monitoring of wine yeast
gene expression during alcoholic fermentation. Yeast 20:1369-1385.
40. Rossouw D, Naes T & FF Bauer 2008. Linking gene regulation and the exo-metabolome: A
comparative transcriptomics approach to identify genes that impact on the production of volatile
aroma compounds in yeast. BMC Genomics 9:530-548.
41. Tusher CG, R Tibshirani & G Chu 2001. Significance analysis of microarrays applied to the
ionizing radiation response. Proc. Natl. Acad. Sci. USA 98:5116-5121.
42. Vemuri GN & AA Aristidou 2005. Metabolic engineering in the –omics era: Elucidating and
modulating regulatory networks. Microbiol. Mol. Biol. Rev. 69:197-216.
43. Verstrepen KJ, G Derdelinckx, H Verachtert & FR Delvaux 2003. Yeast flocculation: what
brewers should know. Appl. Microbiol. Biotechnol. 61:197-205.
44. Verstrepen KJ, TB Reynolds & GR Fink 2004. Origins of variation in the fungal cell surface.
Nat. Rev. Microbiol. 2:533-540.
45. Webb AD & JL Ingraham 1963. Fusel oil. Adv. Appl. Microbiol. 5:317-353.
46. Wiedman JM, A-L Fabre, BW Taron, CH Taron & P Orlean 2007. In vivo characterization
of the GPI assembly defect in yeast mcd4-174 mutants and bypass of the Mcd4p-dependent step
in mcd4Δ cells. FEMS Yeast Res. 7:78-83.
47. Zuzuarregui A, Carrasco P, Palacois A, Julien A & M del Olmo 2005. Analysis of the
expression of some stress induced genes in several commercial wine yeast strains at the
beginning of vinification. J. Appl. Microbiol. 98:299-307.
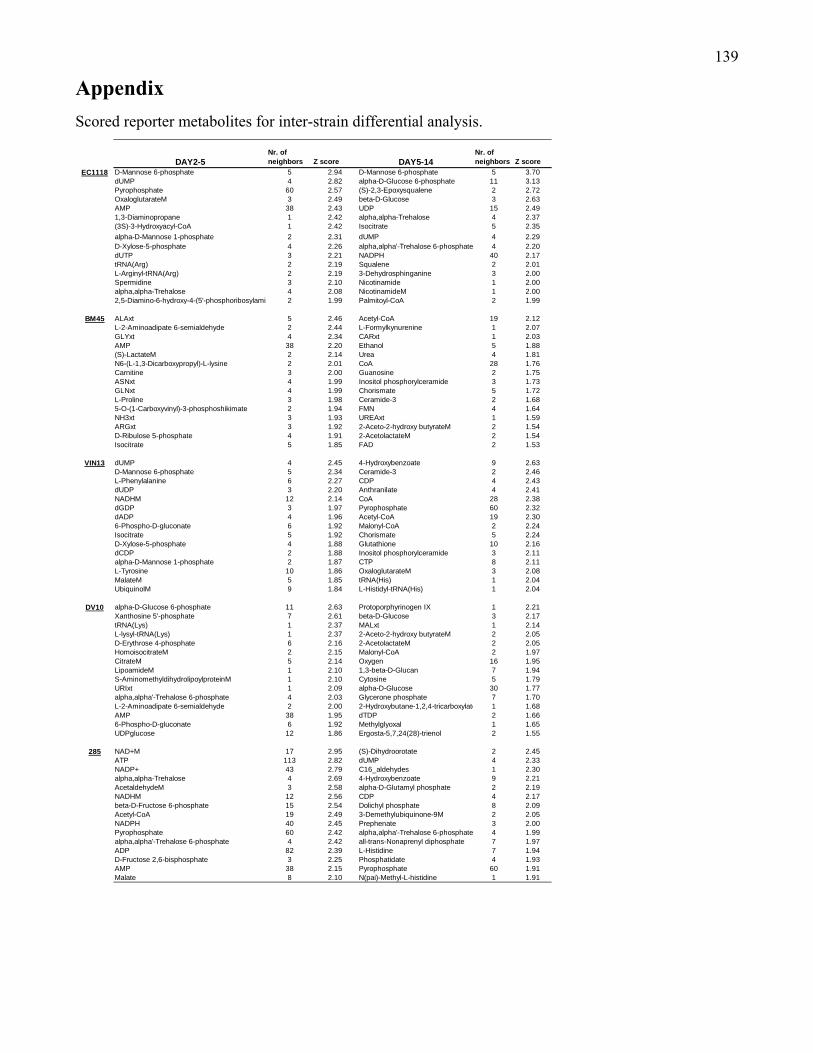
139
Appendix Scored reporter metabolites for inter-strain differential analysis.
DAY2-5Nr. ofneighbors Z score DAY5-14
Nr. ofneighbors Z score
EC1118 D-Mannose 6-phosphate 5 2.94 D-Mannose 6-phosphate 5 3.70dUMP 4 2.82 alpha-D-Glucose 6-phosphate 11 3.13Pyrophosphate 60 2.57 (S)-2,3-Epoxysqualene 2 2.72OxaloglutarateM 3 2.49 beta-D-Glucose 3 2.63AMP 38 2.43 UDP 15 2.491,3-Diaminopropane 1 2.42 alpha,alpha-Trehalose 4 2.37(3S)-3-Hydroxyacyl-CoA 1 2.42 Isocitrate 5 2.35alpha-D-Mannose 1-phosphate 2 2.31 dUMP 4 2.29D-Xylose-5-phosphate 4 2.26 alpha,alpha'-Trehalose 6-phosphate 4 2.20dUTP 3 2.21 NADPH 40 2.17tRNA(Arg) 2 2.19 Squalene 2 2.01L-Arginyl-tRNA(Arg) 2 2.19 3-Dehydrosphinganine 3 2.00Spermidine 3 2.10 Nicotinamide 1 2.00alpha,alpha-Trehalose 4 2.08 NicotinamideM 1 2.002,5-Diamino-6-hydroxy-4-(5'-phosphoribosylamin 2 1.99 Palmitoyl-CoA 2 1.99
BM45 ALAxt 5 2.46 Acetyl-CoA 19 2.12L-2-Aminoadipate 6-semialdehyde 2 2.44 L-Formylkynurenine 1 2.07GLYxt 4 2.34 CARxt 1 2.03AMP 38 2.20 Ethanol 5 1.88(S)-LactateM 2 2.14 Urea 4 1.81N6-(L-1,3-Dicarboxypropyl)-L-lysine 2 2.01 CoA 28 1.76Carnitine 3 2.00 Guanosine 2 1.75ASNxt 4 1.99 Inositol phosphorylceramide 3 1.73GLNxt 4 1.99 Chorismate 5 1.72L-Proline 3 1.98 Ceramide-3 2 1.685-O-(1-Carboxyvinyl)-3-phosphoshikimate 2 1.94 FMN 4 1.64NH3xt 3 1.93 UREAxt 1 1.59ARGxt 3 1.92 2-Aceto-2-hydroxy butyrateM 2 1.54D-Ribulose 5-phosphate 4 1.91 2-AcetolactateM 2 1.54Isocitrate 5 1.85 FAD 2 1.53
VIN13 dUMP 4 2.45 4-Hydroxybenzoate 9 2.63D-Mannose 6-phosphate 5 2.34 Ceramide-3 2 2.46L-Phenylalanine 6 2.27 CDP 4 2.43dUDP 3 2.20 Anthranilate 4 2.41NADHM 12 2.14 CoA 28 2.38dGDP 3 1.97 Pyrophosphate 60 2.32dADP 4 1.96 Acetyl-CoA 19 2.306-Phospho-D-gluconate 6 1.92 Malonyl-CoA 2 2.24Isocitrate 5 1.92 Chorismate 5 2.24D-Xylose-5-phosphate 4 1.88 Glutathione 10 2.16dCDP 2 1.88 Inositol phosphorylceramide 3 2.11alpha-D-Mannose 1-phosphate 2 1.87 CTP 8 2.11L-Tyrosine 10 1.86 OxaloglutarateM 3 2.08MalateM 5 1.85 tRNA(His) 1 2.04UbiquinolM 9 1.84 L-Histidyl-tRNA(His) 1 2.04
DV10 alpha-D-Glucose 6-phosphate 11 2.63 Protoporphyrinogen IX 1 2.21Xanthosine 5'-phosphate 7 2.61 beta-D-Glucose 3 2.17tRNA(Lys) 1 2.37 MALxt 1 2.14L-lysyl-tRNA(Lys) 1 2.37 2-Aceto-2-hydroxy butyrateM 2 2.05D-Erythrose 4-phosphate 6 2.16 2-AcetolactateM 2 2.05HomoisocitrateM 2 2.15 Malonyl-CoA 2 1.97CitrateM 5 2.14 Oxygen 16 1.95LipoamideM 1 2.10 1,3-beta-D-Glucan 7 1.94S-AminomethyldihydrolipoylproteinM 1 2.10 Cytosine 5 1.79URIxt 1 2.09 alpha-D-Glucose 30 1.77alpha,alpha'-Trehalose 6-phosphate 4 2.03 Glycerone phosphate 7 1.70L-2-Aminoadipate 6-semialdehyde 2 2.00 2-Hydroxybutane-1,2,4-tricarboxylate 1 1.68AMP 38 1.95 dTDP 2 1.666-Phospho-D-gluconate 6 1.92 Methylglyoxal 1 1.65UDPglucose 12 1.86 Ergosta-5,7,24(28)-trienol 2 1.55
285 NAD+M 17 2.95 (S)-Dihydroorotate 2 2.45ATP 113 2.82 dUMP 4 2.33NADP+ 43 2.79 C16_aldehydes 1 2.30alpha,alpha-Trehalose 4 2.69 4-Hydroxybenzoate 9 2.21AcetaldehydeM 3 2.58 alpha-D-Glutamyl phosphate 2 2.19NADHM 12 2.56 CDP 4 2.17beta-D-Fructose 6-phosphate 15 2.54 Dolichyl phosphate 8 2.09Acetyl-CoA 19 2.49 3-Demethylubiquinone-9M 2 2.05NADPH 40 2.45 Prephenate 3 2.00Pyrophosphate 60 2.42 alpha,alpha'-Trehalose 6-phosphate 4 1.99alpha,alpha'-Trehalose 6-phosphate 4 2.42 all-trans-Nonaprenyl diphosphate 7 1.97ADP 82 2.39 L-Histidine 7 1.94D-Fructose 2,6-bisphosphate 3 2.25 Phosphatidate 4 1.93AMP 38 2.15 Pyrophosphate 60 1.91Malate 8 2.10 N(pai)-Methyl-L-histidine 1 1.91
140
CChhaapptteerr 66
Research results
Transcriptional regulation and diversification of wine yeast strains
A modified version of this manuscript will be submitted for publication in: Molecular Microbiology
Authors:
Debra Rossouw & Florian F Bauer

141
CHAPTER 6
Transcriptional regulation and diversification of wine yeast strains
6.1 Abstract Industrial wine yeast strains are geno- and phenotypically highly diversified, and have adapted to the
ecological niches provided by industrial wine making environments. These strains have been selected
for very specific and diverse purposes, and the adaptation of these strains to the oenological
environment is a function of the specific expression profiles of their genomes. It has been proposed that
some of the primary targets of yeast adaptation are functional binding sites of transcription factors (TF)
and the transcription factors themselves. Sequence divergence or regulatory changes related to specific
transcription factors would lead to far-reaching changes in overall gene expression patterns, which will
in turn impact on specific phenotypic characteristics of different yeast species/strains. Variations in
transcriptional regulation between different wine yeast strains could thus be responsible for rapid
adaptation to different fermentative requirements in the context of commercial wine-making. In this
study, we compare the transcriptional profiles of five different wine yeast strains in simulated wine-
making conditions. Comparative analyses of gene expression profiles in the context of TF regulatory
networks provided new insights into the molecular basis for variations in gene expression in these
industrial strains. We also show that the metabolic phenotype of one strain can indeed be shifted in the
direction of another by modifying the expression of key transcription factors.
6.2 Introduction
The genus Saccharomyces can be divided into two major groups: sensu stricto and sensu lato (Barnett,
1992). The sensu stricto yeasts include S. bayanus, S. cerevisiae, S. paradoxus, and S. pastorianus
(Kurtzman & Robnett), but S. cerevisiae is the species that is most widely used in the fermentation
industry (oenology, bread-making and brewing). S. cerevisiae has been studied at the genetic level
since the 1930’s. Most of these studies were carried out using only a handful of strains (Mortimer et al.,
1957; Mortimer & Johnston 1986) that were selected for their ease of use in laboratory conditions.
Thus the knowledge regarding the genetics and molecular biology of S. cerevisiae is based on a geno-
and phenotypically narrow range of strains, while studies of natural populations and industrial strains
of S. cerevisiae are very few (Liu et al., 1996; Mortimer 2000).
142
In contrast to the ‘laboratory’ yeast strains, industrial yeast strains are geno- and phenotypically highly
diversified (Frezier & Dubourdieu, 1992; Schütz & Gafner, 1994). These strains have adapted to the
ecological niches provided by industrial or semi-industrial environments. In the wine industry, a large
number of such strains are commercially produced. Most of the strains were originally isolated from
spontaneous wine fermentations (Johnston et al., 2000). Although the original or natural ecological
niche of the species S. cerevisiae is still subject to conjectures, industrial environments have certainly
provided much of the evolutionary framework for the strains that are currently used industry. These
strains were all primarily all selected for their ability to completely ferment, or, in the language of
wine, to ferment to dryness, very high levels (>200g/l) of initial sugars in a largely anaerobic
environment. However, beyond this generic trait, strains have been selected for very specific and
diverse purposes, for example to support the production of different styles of wine or to produce
different aroma profiles. The strains represent therefore a wide range of phenotypic traits, which is
reflected by significant genetic diversity.
Most wine strains are diploid, which may confer an advantage in terms of rapid adaptation to variable
external environments. It may also be a way to increase the dosage of some genes important for
fermentation (Bakalinsky & Snow, 1990; Salmon, 1997). In addition to these changes, the subtelomeric
chromosomal regions are subject to ongoing duplications and rearrangements via ectopic exchanges
(Bidenne et al., 1992; Rachidi et al., 1999). Another possible mode of evolution of yeast in the genus
Saccharomyces is the formation of interspecific hybrids, whereby haploid cells or spores of S.
cerevisiae, S. bayanus and S. paradoxus mate with one another. The resulting genome plasticity
resulting from these changes promote faster adaptation in response to environmental changes (Puig &
Perez-Ortin, 2000) by providing important genetic diversity upon which natural selection mechanisms
can operate.
Obviously the adaptation of these strains to the oenological environment is a function of the specific
expression profiles of their genomes. The availability of high quality sequence information offers
opportunities for global transcriptomic, proteomic and metabolomic studies. Such approaches can
correlate differences in fermentation phenotypes to gene expression and metabolic regulation. It has
been proposed that some of the primary evolutionary targets of diversification are functional binding
sites of transcription factors and the transcription factors themselves (Dermitzakis & Clark, 2002). In S.
cerevisiae a large variety of sequence-specific transcription factors (TFs) regulate the expression of
around 6000 protein-coding genes, ensuring the proper development and functioning of the organism.
143
Nucleotide substitutions, as well as short insertions and deletions involving a TF binding site, can be
correlated with interspecies differences in the expression profiles of the corresponding genes
(Dermitzakis & Clark, 2002), which in turn impacts on specific phenotypic differences between these
related species.
A recent study showed that although S. cerevisiae and S. mikatae are very similar in terms of
nucleotide sequence, they are significantly different to one another and to other Saccharomyces species
in terms of their TF profiles (Tsong et al., 2006; Borneman et al., 2007). It has been hypothesized that
the extensive binding site differences observed between the different species reflect the rapid
specialization of Saccharomyces for distinct ecological environments (Borneman et al., 2007).
Variations in transcriptional regulation between related species could thus be responsible for rapid
adaptation to different niches, or according to different fermentative requirements in the context of
commercial wine-making.
In this study, we compare the transcriptional profiles of five different wine yeast strains in simulated
wine-making conditions: Detailed comparative analyses of gene expression profiles, particularly in the
context of TF regulatory networks, provided new insights into the molecular basis for variations in
gene expression in these industrial strains. A core issue pertained to whether the metabolic phenotype
of one strain could be shifted in the direction of another by simply adjusting the expression of key
transcription factors. This would credit sequence divergence or regulatory changes related to specific
transcription factors as a major overarching theme responsible for the evolutionary adaptation of
different Saccharomyces species, as well as different strains within a given species. This did indeed
prove to be the case, shedding light on the mode of adaptation of industrial yeasts to environmental
conditions. From a biotechnological point of view, the identification of key TF’s will enable targeted
exploitation of yeast potential for improved fermentation performance.
6.3 Methods 6.3.1 Strains, media and culture conditions
The yeast strains used in this study are listed in Table1. Yeast cells were cultivated at 30oC in YPD
synthetic media 1% yeast extract (Biolab, South Africa), 2% peptone (Fluka, Germany), 2% glucose
(Sigma, Germany). Solid medium was supplemented with 2% agar (Biolab, South Africa).
144
Table 1 Yeast strains used in this study.
Strain Source/ Reference
VIN13 Anchor Yeast, South AfricaBM45 Lallemand Inc., Montréal, CanadaDV10 Lallemand Inc., Montréal, CanadaSOK2-VIN13 This studyRAP1-VIN13 This study
6.3.2 Fermentation medium
Fermentation experiments were carried out with synthetic must MS300 which approximates to a
natural must as previously described (Bely et al., 1990). The medium contained 125 g/L glucose and
125 g/L fructose, and the pH was buffered at 3.3 with NaOH.
6.3.3 Fermentation conditions
All fermentations were carried out under anaerobic conditions in 100 ml glass bottles (containing 80 ml
of the medium) sealed with rubber stoppers with a CO2 outlet. The fermentation temperature was
approximately 22oC and no continuous stirring was performed during the course of the fermentation.
Fermentation bottles were inoculated with YPD cultures in the logarithmic growth phase (around
OD600 = 1) to an OD600 of 0.1 (i.e. a final cell density of approximately 106 cfu.ml-1). The cells from the
YPD pre-cultures were briefly centrifuged and resuspended in MS300 to avoid carryover of YPD to the
fermentation media. The fermentations followed a time course of 14 days and the bottles were weighed
daily to assess the progress of fermentation. Samples of the fermentation media and cells were taken at
days 2, 5 and 14 as representative of the exponential, early logarithmic and late logarithmic growth
phases respectively.
6.3.4 Growth measurement
Cell proliferation (i.e. growth) was determined spectrophotometrically (PowerwaveX, Bio-Tek
Instruments) by measuring the optical density (at 600 nm) of 200 µl samples of the suspensions over
the 14 day experimental period.
6.3.5 Analytical methods - HPLC
Culture supernatants were obtained from the cell-free upper layers of the fermentation media. For the
purposes of glucose determination and carbon recovery, culture supernatants and starting media were
analyzed by high performance liquid chromatography (HPLC) on an AMINEX HPX-87H ion exchange

145
column using 5 mM H2SO4 as the mobile phase. Agilent RID and UV detectors were used in tandem
for peak detection and quantification. Analysis was carried out using the HPChemstation software
package.
6.3.6 Analytical methods – GC-FID
Each 5 ml sample of synthetic must taken during fermentation was spiked with an internal standard of
4-methyl-2-pentanol to a final concentration of 10 mg.l-1. To each of these samples 1 ml of solvent
(diethyl ether) was added and the tubes sonicated for 5 minutes. The top layer in each tube was
separated by centrifugation at 3000 rpm for 5 minutes and the extract analyzed. After mixing, 3 μl of
each sample was injected into the gas chromatograph (GC). All extractions were done in triplicate.
The analysis of volatile compounds was carried out on a Hewlett Packard 5890 Series II GC coupled to
an HP 7673 auto-sampler and injector and an HP 3396A integrator. The column used was a Lab
Alliance organic-coated, fused silica capillary with dimensions of 60 m × 0.32 mm internal diameter
with a 0.5 μm coating thickness. The injector temperature was set to 200°C, the split ratio to 20:1 and
the flow rate to 15 ml.min 1, with hydrogen used as the carrier gas for a flame ionisation detector held
at 250°C. The oven temperature was increased from 35°C to 230°C at a ramp of 3°C min 1.
Internal standards (Merck, Cape Town) were used to calibrate the machine for each of the compounds
measured.
6.3.7 General statistical analysis
T-tests and anova analyses were conducted using Statistica (version 7). HCL and KMC clustering were
carried out using TIGR MeV v2.2 (Ben-Dor et al., 1999).
6.3.8 Microarray analysis
Sampling of cells from fermentation and total RNA extraction was performed as described by Abbott et
al., (2007). For a complete description of the hybridization conditions, as well as normalization and
statistical analysis, refer to Rossouw et al. 2008. Transcript data can be downloaded from the GEO
repository under the following accession number: GSE11651.
146
6.3.9 Transcriptomics data analysis
Determination of differential gene expression between experimental parameters was conducted using
SAM (Significance Analysis of Microarrays) version 2 (Tusher et al, 2001). The two-class, unpaired
setting was used and genes with a Q value less than 0.5 (p < 0,0005) were considered differentially
expressed. Only genes with a fold change greater than 2 (positive or negative) were taken into
consideration.
Random forest analysis was carried out as described by Breiman (2001). Genes were differentially
ranked according to their ability to discriminate between different time points (clamped strain data) and
between different strains (clamped time data). The top 200 ORF’s for each analysis were considered for
further in depth analysis and evaluation.
Gene expression profiles were clustered using the Short Time Series Expression Miner (STEM; Ernst
& Bar-Joseph, 2006).
6.3.10 Multivariate data analyses
The patterns within the different sets of data were investigated by principal-component analysis (PCA;
The Unscrambler; Camo Inc., Corvallis, Oreg.). PCA is a bilinear modeling method which gives a
visually interpretable overview of the main information in large, multidimensional datasets. By plotting
the principal components it is possible to view statistical relationships between different variables in
complex datasets and detect and interpret sample groupings, similarities or differences, as well as the
relationships between the different variables (Mardia et al., 1979).
6.3.11 Overexpression constructs and transformation of yeast cells
All plasmids used in this study are listed in Table 2, and primers used for amplification of transcription
factor-encoding genes are listed in Table 3. Standard procedures for the isolation of DNA were used
throughout this study (Ausubel et al., 1994). Standard DNA techniques were also carried out as
described by Sambrook et al., (1989). All enzymes for cloning, restriction digest and ligation reactions
were obtained from Roche Diagnostics (Randburg, South Africa) and used according to supplier
specifications. Sequencing of all plasmids was carried out on an ABI PRISM automated sequencer. All
plasmids contain the dominant marker PhR conferring phleomicin resistance (PhR), and were
transformed into host VIN13 and BM45 cells via electroporation (Wenzel et al., 1992; Lilly et al.,
2006).

147
Table 2 Plasmids constructed in this study.
Plasmid Name Relevant genotype Reference
pDM-PhR-RAP1 2μ LEU2 TEF1P PhR322 TEF1T PGKP RAP1 PGKT This study
pDM-PhR-SOK2 2μ LEU2 TEF1P PhR322 TEF1T PGKP SOK2 PGKT This study
Table 3 Primers used for amplification of target genes.
Primer Name Sequence (5'-3')PhR322F GATCCACGTCGGTACCCGGGGGATCPhR322R GATCGCGATCGCAAGCTTGCAAATTAAAGCCRAP1f TTAAGCGGCCGCATACGCAACCGCCCTACATAARAP1r TCTACATATGCGTGAATCAGTGAAATAAAGGSOK2f TTAAGCGGCCGCTATAACCCTGGTAAGGTCCTTSOK2r TCTACATATGGGCGGTAGGGTTTTGATTAA
6.3.12 Quantitative real-time PCR analysis (QRT-PCR)
RNA extractions from fermenting yeasts were carried out as per the microarray analyses. Primer design
for QRT-PCR analysis was performed using the Primer Express software v. 3 (Applied Biosystems)
and reagents were purchased from KAPA Biosystems. Spectral data were captured by the 7500 cycler
(Applied Biosystems). Data analyses were conducted using Signal Detection Software (SDS) v. 1.3.1.
(Applied Biosystems) to determine the corresponding Ct values and PCR efficiencies respectively for
the samples analysed (Ramakers et al., 2003). The genes selected for QRT-PCR, as well as the primer
sequences used for amplification are described in Table 4 below.
Table 4 Target genes and primers for QRT-PCR.
Gene ID Forward primer (5'-3') Reverse primer (5'-3')
ADH2 TTCAAGCCGCTCACATTCC CACAAGATTGGCGCGACTT
ALD4 TTGTGGGTGAGGCCATTACA ACCCTGTGAAGGCAACCTTTT
ARO10 AGTGTTGAATCAGCTGGCCTAAG CATAAGCGGCGTTCAGTTCAT
ATF2 GTTCGGCCTAAACGTTTGCT CCACGCTCATGTCCATGTTC
BAT1 CCATGTTCCGTCCGGATAAG CAAACAAATTCTAGCGGCAG
BAT2 AATCTGTTTGCCAACGTTCGA TGCTGGATCAGTTTCCCAATT
ERG10 CGTGCGGGTGCCAAAT CCATCTCTTTCGACACCATCAA
ERG13 GATCGGTCCTGATGCTCCAA CGTAGGCGTGTTCCATGTAAGA
HAT2 TGCCCGCAACCTTTCAA GGCCGCAAGGAGGTTTG
ILV3 CGTCCCAGGCCATGCTT CCCGACTTGAGGCTTCTTGA
RAP1 ATTGGATCCGAGTATGGTCGTT TCCGATGGCGCTGTGACT
SOK2 TCAACCTCTGATGCCCGTATC GCGGGTACGGCCACTGT
THI3 GGCGTGGCCGGATCTTA GGCGGCATACCCACTATGTG
YJL218W GGTCATCCAATTGACGTGGAA GGTCACAGGCATGGCATATTC
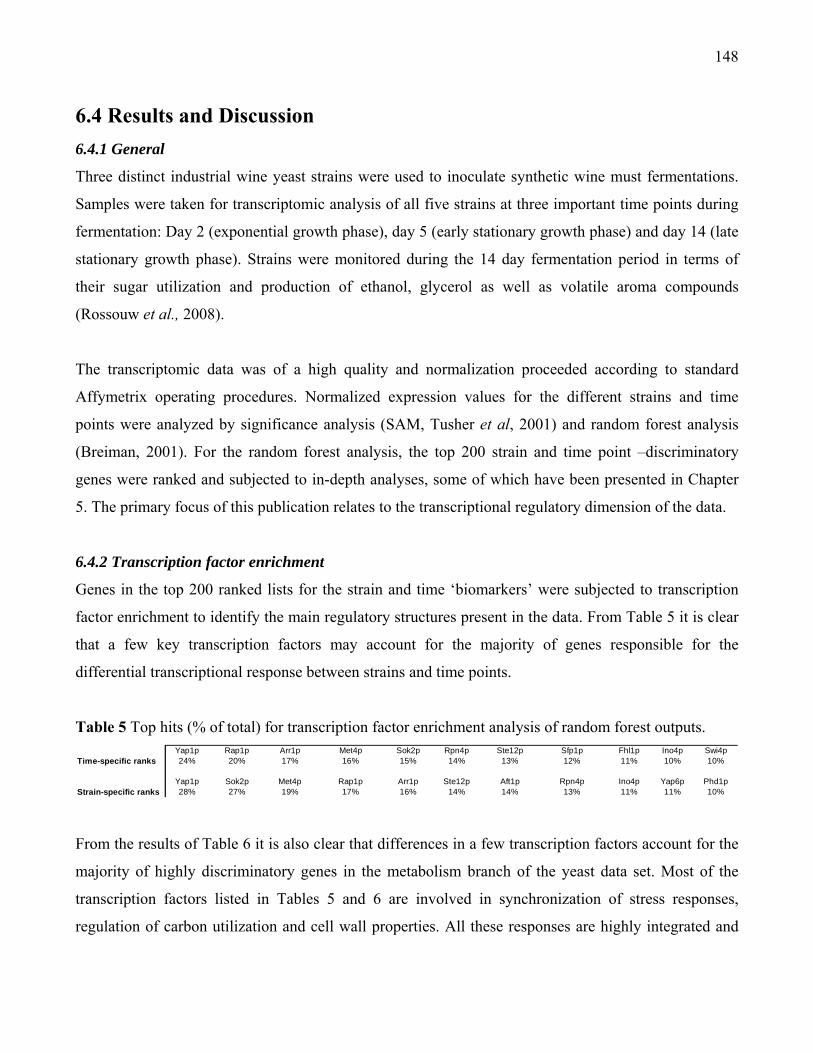
148
6.4 Results and Discussion 6.4.1 General
Three distinct industrial wine yeast strains were used to inoculate synthetic wine must fermentations.
Samples were taken for transcriptomic analysis of all five strains at three important time points during
fermentation: Day 2 (exponential growth phase), day 5 (early stationary growth phase) and day 14 (late
stationary growth phase). Strains were monitored during the 14 day fermentation period in terms of
their sugar utilization and production of ethanol, glycerol as well as volatile aroma compounds
(Rossouw et al., 2008).
The transcriptomic data was of a high quality and normalization proceeded according to standard
Affymetrix operating procedures. Normalized expression values for the different strains and time
points were analyzed by significance analysis (SAM, Tusher et al, 2001) and random forest analysis
(Breiman, 2001). For the random forest analysis, the top 200 strain and time point –discriminatory
genes were ranked and subjected to in-depth analyses, some of which have been presented in Chapter
5. The primary focus of this publication relates to the transcriptional regulatory dimension of the data.
6.4.2 Transcription factor enrichment
Genes in the top 200 ranked lists for the strain and time ‘biomarkers’ were subjected to transcription
factor enrichment to identify the main regulatory structures present in the data. From Table 5 it is clear
that a few key transcription factors may account for the majority of genes responsible for the
differential transcriptional response between strains and time points.
Table 5 Top hits (% of total) for transcription factor enrichment analysis of random forest outputs. Yap1p Rap1p Arr1p Met4p Sok2p Rpn4p Ste12p Sfp1p Fhl1p Ino4p Swi4p
Time-specific ranks 24% 20% 17% 16% 15% 14% 13% 12% 11% 10% 10%
Yap1p Sok2p Met4p Rap1p Arr1p Ste12p Aft1p Rpn4p Ino4p Yap6p Phd1pStrain-specific ranks 28% 27% 19% 17% 16% 14% 14% 13% 11% 11% 10%
From the results of Table 6 it is also clear that differences in a few transcription factors account for the
majority of highly discriminatory genes in the metabolism branch of the yeast data set. Most of the
transcription factors listed in Tables 5 and 6 are involved in synchronization of stress responses,
regulation of carbon utilization and cell wall properties. All these responses are highly integrated and

149
connected in the yeast system as a whole, necessitating further analysis of the top scoring transcription
factors.
Table 6 Top hits (% of total) for transcription factor enrichment analysis of random forest outputs in MIPS functional category of metabolism.
Yap1p Sok2p Arr1p Gcn4p Ste12p Met4p Rap1p Tec1p Rpn4p Swi4p Adr1p
Time-specific ranks 39% 26% 26% 24% 22% 20% 17% 17% 15% 13% 13%
Yap1p Sok2p Arr1p Met4p Gcn4p Aft1p Ino4p Rpn4p Nrg1p Yap6p Rap1pStrain-specific ranks 50% 42% 32% 26% 24% 21% 21% 21% 18% 18% 18%
Of the 18 transcrption factors listed in Tables 5 and 6, 12 showed no differences in expression levels
and patterns over the time points considered in this study. Hypergeomtric distribution analysis grouped
these 12 transcription factors into five clusters based on gene expression patterns over time. The
expression clusters are summarized in Figure 1 below.
Figure 1 Hypergeometric distribution of transcription factors into 5 main expression profiles using
STEM analysis.
The remaining six transcription factors (notably some of the top-scoring candidates of the TF
enrichment) showed significant differences between strains in terms of relative transcript abundance
and expression patterns over time (Figure 2).
EXPRESSION PROFILES
DAY2 4 6 8 10 12 14
MET4 FHL1 INO4 SFP1SWI4 ARR1 AFT1NRG1 RPN4 ADR1TEC1GCN4
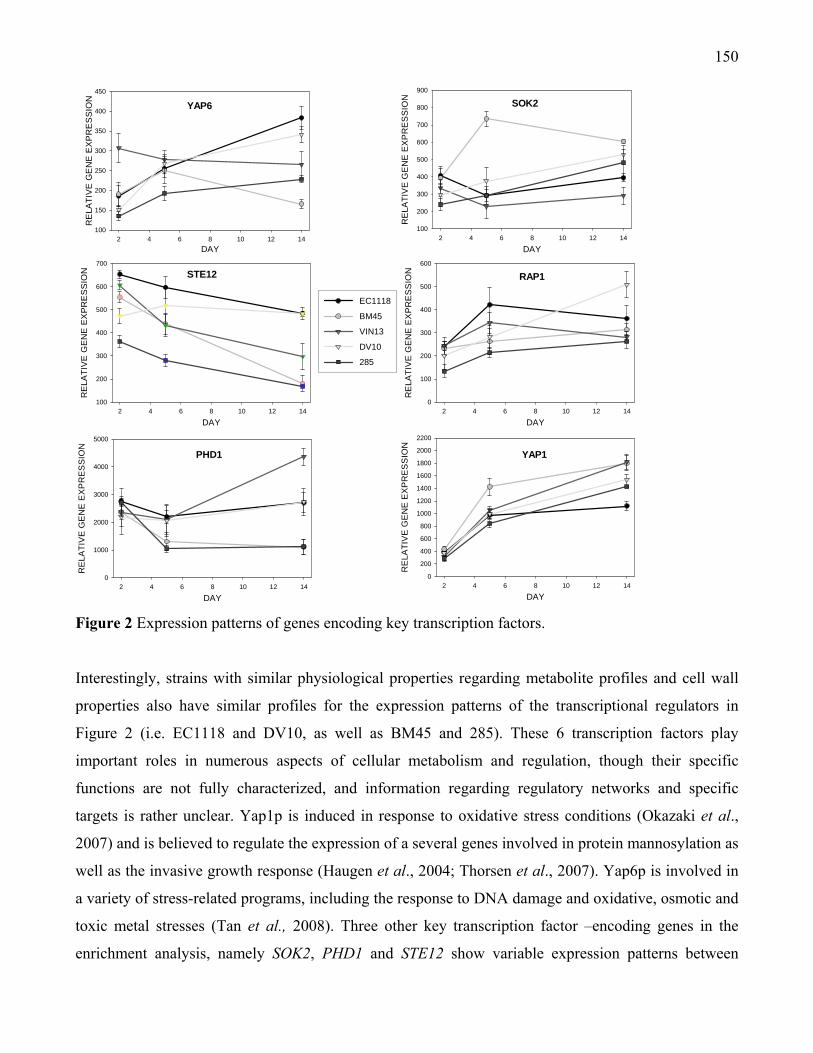
150
YAP6
DAY2 4 6 8 10 12 14
RE
LATI
VE
GE
NE
EX
PR
ES
SIO
N
100
150
200
250
300
350
400
450
EC1118
BM45
VIN13
DV10
285
SOK2
DAY2 4 6 8 10 12 14
RE
LATI
VE
GE
NE
EX
PR
ES
SIO
N
100
200
300
400
500
600
700
800
900
STE12
DAY2 4 6 8 10 12 14
RE
LATI
VE
GE
NE
EX
PR
ES
SIO
N
100
200
300
400
500
600
700
RAP1
DAY2 4 6 8 10 12 14
RE
LATI
VE
GE
NE
EX
PR
ES
SIO
N0
100
200
300
400
500
600
PHD1
DAY2 4 6 8 10 12 14
RE
LATI
VE
GE
NE
EX
PR
ES
SIO
N
0
1000
2000
3000
4000
5000
YAP1
DAY2 4 6 8 10 12 14
RE
LATI
VE
GE
NE
EX
PR
ES
SIO
N
0
200
400
600
800
1000
1200
1400
1600
1800
2000
2200
Figure 2 Expression patterns of genes encoding key transcription factors.
Interestingly, strains with similar physiological properties regarding metabolite profiles and cell wall
properties also have similar profiles for the expression patterns of the transcriptional regulators in
Figure 2 (i.e. EC1118 and DV10, as well as BM45 and 285). These 6 transcription factors play
important roles in numerous aspects of cellular metabolism and regulation, though their specific
functions are not fully characterized, and information regarding regulatory networks and specific
targets is rather unclear. Yap1p is induced in response to oxidative stress conditions (Okazaki et al.,
2007) and is believed to regulate the expression of a several genes involved in protein mannosylation as
well as the invasive growth response (Haugen et al., 2004; Thorsen et al., 2007). Yap6p is involved in
a variety of stress-related programs, including the response to DNA damage and oxidative, osmotic and
toxic metal stresses (Tan et al., 2008). Three other key transcription factor –encoding genes in the
enrichment analysis, namely SOK2, PHD1 and STE12 show variable expression patterns between
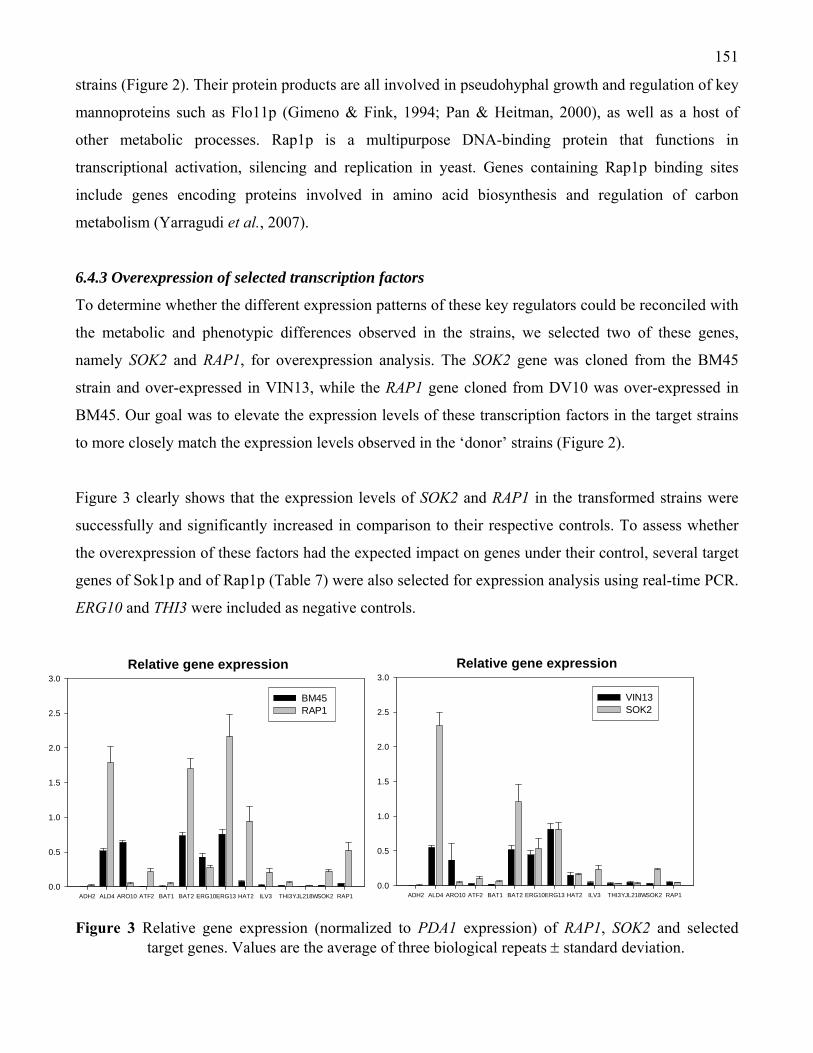
151
strains (Figure 2). Their protein products are all involved in pseudohyphal growth and regulation of key
mannoproteins such as Flo11p (Gimeno & Fink, 1994; Pan & Heitman, 2000), as well as a host of
other metabolic processes. Rap1p is a multipurpose DNA-binding protein that functions in
transcriptional activation, silencing and replication in yeast. Genes containing Rap1p binding sites
include genes encoding proteins involved in amino acid biosynthesis and regulation of carbon
metabolism (Yarragudi et al., 2007).
6.4.3 Overexpression of selected transcription factors
To determine whether the different expression patterns of these key regulators could be reconciled with
the metabolic and phenotypic differences observed in the strains, we selected two of these genes,
namely SOK2 and RAP1, for overexpression analysis. The SOK2 gene was cloned from the BM45
strain and over-expressed in VIN13, while the RAP1 gene cloned from DV10 was over-expressed in
BM45. Our goal was to elevate the expression levels of these transcription factors in the target strains
to more closely match the expression levels observed in the ‘donor’ strains (Figure 2).
Figure 3 clearly shows that the expression levels of SOK2 and RAP1 in the transformed strains were
successfully and significantly increased in comparison to their respective controls. To assess whether
the overexpression of these factors had the expected impact on genes under their control, several target
genes of Sok1p and of Rap1p (Table 7) were also selected for expression analysis using real-time PCR.
ERG10 and THI3 were included as negative controls.
Figure 3 Relative gene expression (normalized to PDA1 expression) of RAP1, SOK2 and selected
target genes. Values are the average of three biological repeats ± standard deviation.
Relative gene expression
ADH2 ALD4 ARO10 ATF2 BAT1 BAT2 ERG10ERG13 HAT2 ILV3 THI3YJL218WSOK2 RAP10.0
0.5
1.0
1.5
2.0
2.5
3.0
BM45 RAP1
Relative gene expression
ADH2 ALD4 ARO10 ATF2 BAT1 BAT2 ERG10ERG13 HAT2 ILV3 THI3YJL218WSOK2 RAP10.0
0.5
1.0
1.5
2.0
2.5
3.0
VIN13SOK2
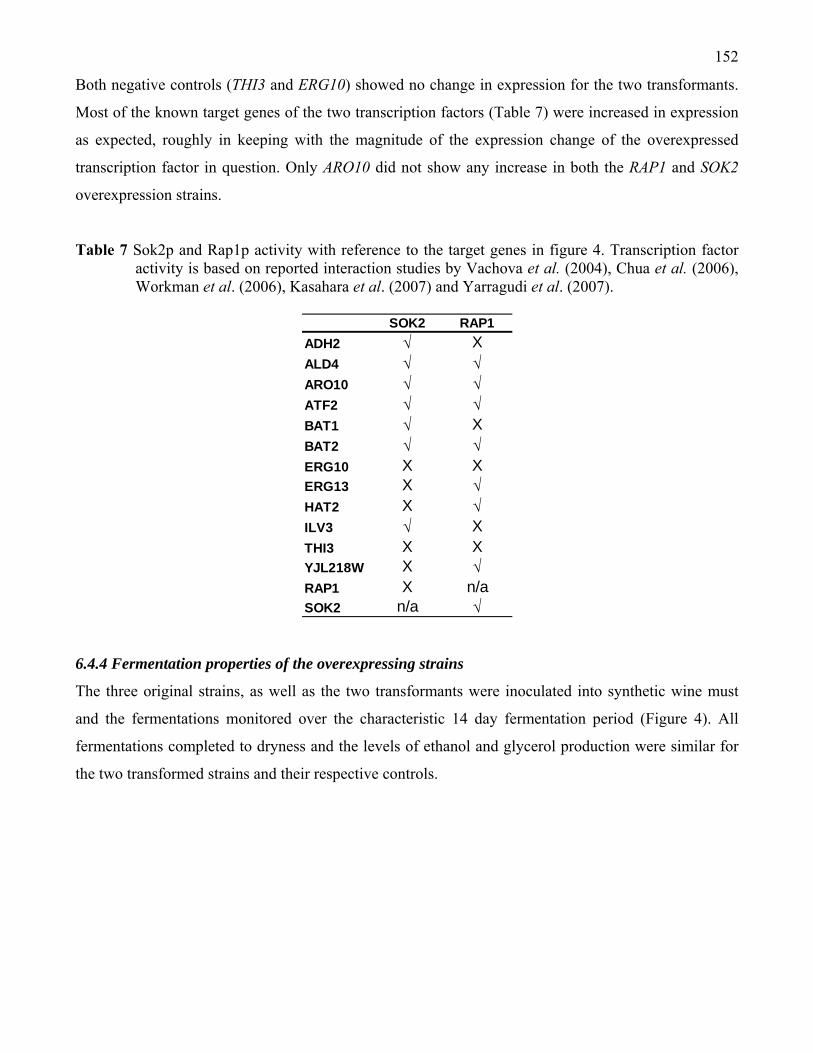
152
Both negative controls (THI3 and ERG10) showed no change in expression for the two transformants.
Most of the known target genes of the two transcription factors (Table 7) were increased in expression
as expected, roughly in keeping with the magnitude of the expression change of the overexpressed
transcription factor in question. Only ARO10 did not show any increase in both the RAP1 and SOK2
overexpression strains.
Table 7 Sok2p and Rap1p activity with reference to the target genes in figure 4. Transcription factor activity is based on reported interaction studies by Vachova et al. (2004), Chua et al. (2006), Workman et al. (2006), Kasahara et al. (2007) and Yarragudi et al. (2007).
SOK2 RAP1
ADH2 √ XALD4 √ √ARO10 √ √ATF2 √ √BAT1 √ XBAT2 √ √ERG10 X XERG13 X √HAT2 X √ILV3 √ XTHI3 X XYJL218W X √RAP1 X n/aSOK2 n/a √
6.4.4 Fermentation properties of the overexpressing strains
The three original strains, as well as the two transformants were inoculated into synthetic wine must
and the fermentations monitored over the characteristic 14 day fermentation period (Figure 4). All
fermentations completed to dryness and the levels of ethanol and glycerol production were similar for
the two transformed strains and their respective controls.
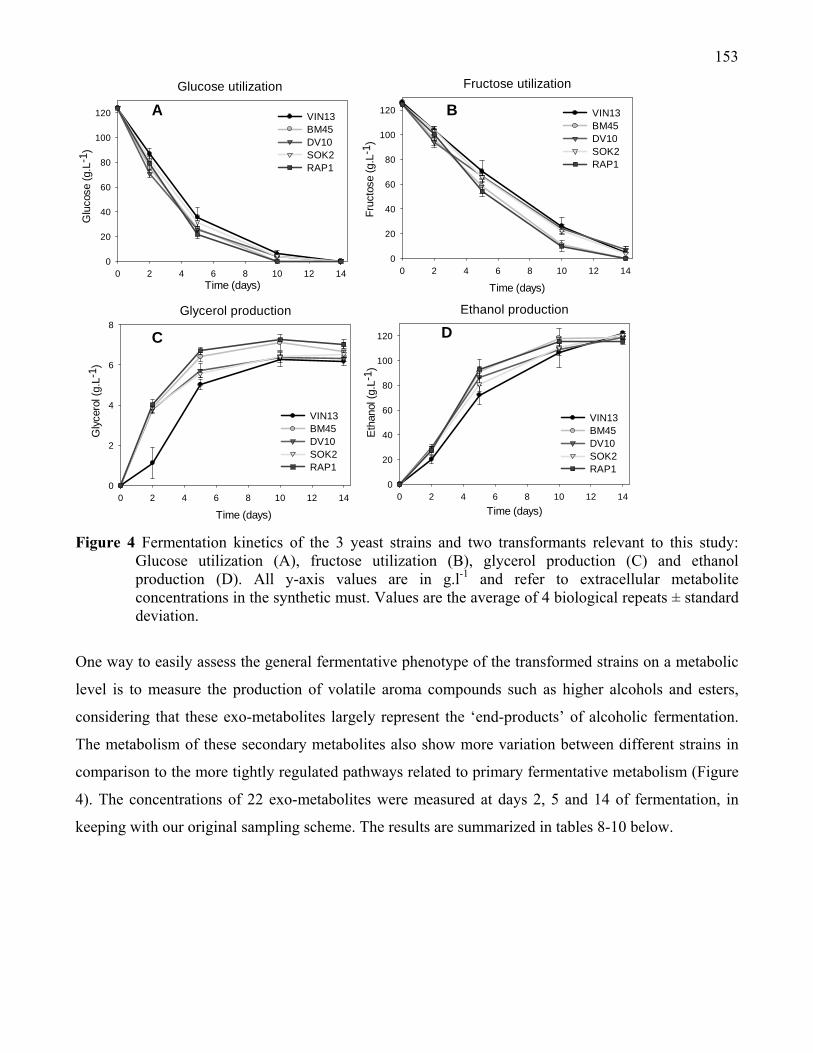
153
Figure 4 Fermentation kinetics of the 3 yeast strains and two transformants relevant to this study:
Glucose utilization (A), fructose utilization (B), glycerol production (C) and ethanol production (D). All y-axis values are in g.l-1 and refer to extracellular metabolite concentrations in the synthetic must. Values are the average of 4 biological repeats ± standard deviation.
One way to easily assess the general fermentative phenotype of the transformed strains on a metabolic
level is to measure the production of volatile aroma compounds such as higher alcohols and esters,
considering that these exo-metabolites largely represent the ‘end-products’ of alcoholic fermentation.
The metabolism of these secondary metabolites also show more variation between different strains in
comparison to the more tightly regulated pathways related to primary fermentative metabolism (Figure
4). The concentrations of 22 exo-metabolites were measured at days 2, 5 and 14 of fermentation, in
keeping with our original sampling scheme. The results are summarized in tables 8-10 below.
Glycerol production
Time (days)0 2 4 6 8 10 12 14
Glyc
erol
(g.L
-1)
0
2
4
6
8
VIN13BM45DV10SOK2RAP1
Ethanol production
Time (days)0 2 4 6 8 10 12 14
Etha
nol (
g.L-
1 )
0
20
40
60
80
100
120
Glucose utilization
Time (days)0 2 4 6 8 10 12 14
Glu
cose
(g.L
-1)
0
20
40
60
80
100
120
Fructose utilization
Time (days)0 2 4 6 8 10 12 14
Fruc
tose
(g.L
-1)
0
20
40
60
80
100
120VIN13BM45DV10SOK2RAP1
VIN13BM45DV10SOK2RAP1
VIN13BM45DV10SOK2RAP1
BA
DC
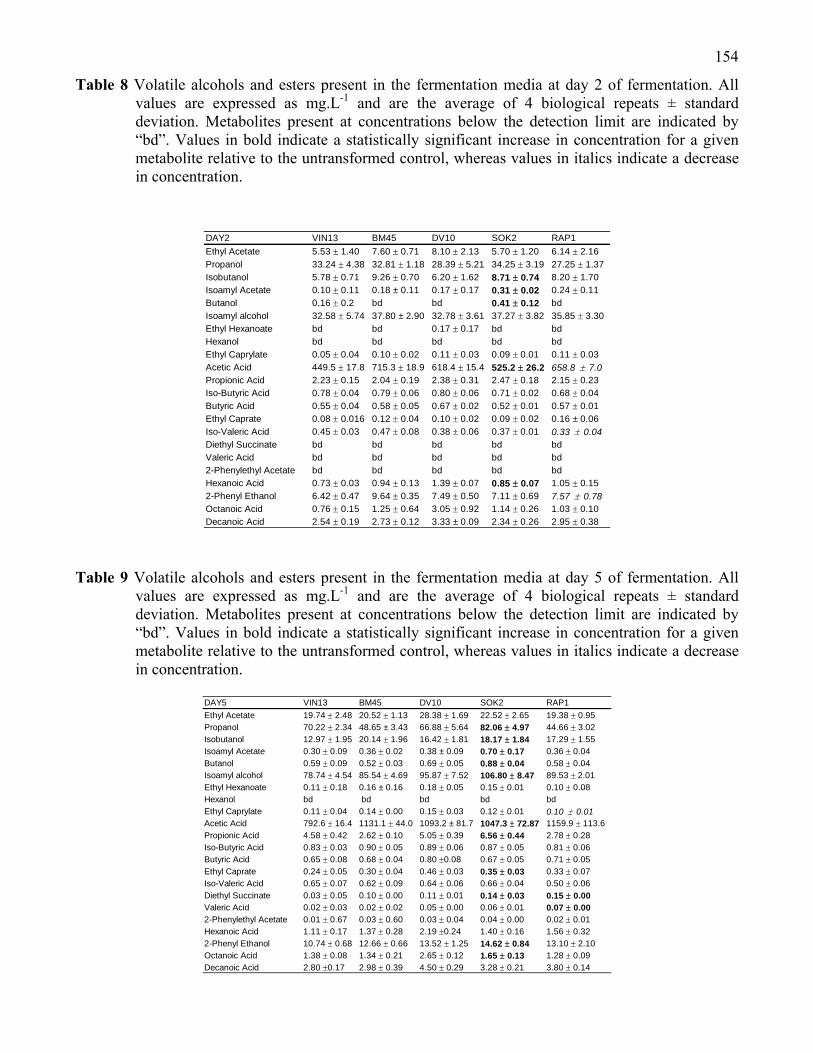
154
Table 8 Volatile alcohols and esters present in the fermentation media at day 2 of fermentation. All values are expressed as mg.L-1 and are the average of 4 biological repeats ± standard deviation. Metabolites present at concentrations below the detection limit are indicated by “bd”. Values in bold indicate a statistically significant increase in concentration for a given metabolite relative to the untransformed control, whereas values in italics indicate a decrease in concentration.
DAY2 VIN13 BM45 DV10 SOK2 RAP1Ethyl Acetate 5.53 ± 1.40 7.60 ± 0.71 8.10 ± 2.13 5.70 ± 1.20 6.14 ± 2.16Propanol 33.24 ± 4.38 32.81 ± 1.18 28.39 ± 5.21 34.25 ± 3.19 27.25 ± 1.37Isobutanol 5.78 ± 0.71 9.26 ± 0.70 6.20 ± 1.62 8.71 ± 0.74 8.20 ± 1.70Isoamyl Acetate 0.10 ± 0.11 0.18 ± 0.11 0.17 ± 0.17 0.31 ± 0.02 0.24 ± 0.11Butanol 0.16 ± 0.2 bd bd 0.41 ± 0.12 bdIsoamyl alcohol 32.58 ± 5.74 37.80 ± 2.90 32.78 ± 3.61 37.27 ± 3.82 35.85 ± 3.30Ethyl Hexanoate bd bd 0.17 ± 0.17 bd bdHexanol bd bd bd bd bdEthyl Caprylate 0.05 ± 0.04 0.10 ± 0.02 0.11 ± 0.03 0.09 ± 0.01 0.11 ± 0.03Acetic Acid 449.5 ± 17.8 715.3 ± 18.9 618.4 ± 15.4 525.2 ± 26.2 658.8 ± 7.0Propionic Acid 2.23 ± 0.15 2.04 ± 0.19 2.38 ± 0.31 2.47 ± 0.18 2.15 ± 0.23Iso-Butyric Acid 0.78 ± 0.04 0.79 ± 0.06 0.80 ± 0.06 0.71 ± 0.02 0.68 ± 0.04Butyric Acid 0.55 ± 0.04 0.58 ± 0.05 0.67 ± 0.02 0.52 ± 0.01 0.57 ± 0.01Ethyl Caprate 0.08 ± 0.016 0.12 ± 0.04 0.10 ± 0.02 0.09 ± 0.02 0.16 ± 0.06Iso-Valeric Acid 0.45 ± 0.03 0.47 ± 0.08 0.38 ± 0.06 0.37 ± 0.01 0.33 ± 0.04Diethyl Succinate bd bd bd bd bdValeric Acid bd bd bd bd bd2-Phenylethyl Acetate bd bd bd bd bdHexanoic Acid 0.73 ± 0.03 0.94 ± 0.13 1.39 ± 0.07 0.85 ± 0.07 1.05 ± 0.152-Phenyl Ethanol 6.42 ± 0.47 9.64 ± 0.35 7.49 ± 0.50 7.11 ± 0.69 7.57 ± 0.78Octanoic Acid 0.76 ± 0.15 1.25 ± 0.64 3.05 ± 0.92 1.14 ± 0.26 1.03 ± 0.10Decanoic Acid 2.54 ± 0.19 2.73 ± 0.12 3.33 ± 0.09 2.34 ± 0.26 2.95 ± 0.38
Table 9 Volatile alcohols and esters present in the fermentation media at day 5 of fermentation. All values are expressed as mg.L-1 and are the average of 4 biological repeats ± standard deviation. Metabolites present at concentrations below the detection limit are indicated by “bd”. Values in bold indicate a statistically significant increase in concentration for a given metabolite relative to the untransformed control, whereas values in italics indicate a decrease in concentration.
DAY5 VIN13 BM45 DV10 SOK2 RAP1Ethyl Acetate 19.74 ± 2.48 20.52 ± 1.13 28.38 ± 1.69 22.52 ± 2.65 19.38 ± 0.95Propanol 70.22 ± 2.34 48.65 ± 3.43 66.88 ± 5.64 82.06 ± 4.97 44.66 ± 3.02Isobutanol 12.97 ± 1.95 20.14 ± 1.96 16.42 ± 1.81 18.17 ± 1.84 17.29 ± 1.55Isoamyl Acetate 0.30 ± 0.09 0.36 ± 0.02 0.38 ± 0.09 0.70 ± 0.17 0.36 ± 0.04Butanol 0.59 ± 0.09 0.52 ± 0.03 0.69 ± 0.05 0.88 ± 0.04 0.58 ± 0.04Isoamyl alcohol 78.74 ± 4.54 85.54 ± 4.69 95.87 ± 7.52 106.80 ± 8.47 89.53 ± 2.01Ethyl Hexanoate 0.11 ± 0.18 0.16 ± 0.16 0.18 ± 0.05 0.15 ± 0.01 0.10 ± 0.08Hexanol bd bd bd bd bdEthyl Caprylate 0.11 ± 0.04 0.14 ± 0.00 0.15 ± 0.03 0.12 ± 0.01 0.10 ± 0.01Acetic Acid 792.6 ± 16.4 1131.1 ± 44.0 1093.2 ± 81.7 1047.3 ± 72.87 1159.9 ± 113.6Propionic Acid 4.58 ± 0.42 2.62 ± 0.10 5.05 ± 0.39 6.56 ± 0.44 2.78 ± 0.28Iso-Butyric Acid 0.83 ± 0.03 0.90 ± 0.05 0.89 ± 0.06 0.87 ± 0.05 0.81 ± 0.06Butyric Acid 0.65 ± 0.08 0.68 ± 0.04 0.80 ±0.08 0.67 ± 0.05 0.71 ± 0.05Ethyl Caprate 0.24 ± 0.05 0.30 ± 0.04 0.46 ± 0.03 0.35 ± 0.03 0.33 ± 0.07Iso-Valeric Acid 0.65 ± 0.07 0.62 ± 0.09 0.64 ± 0.06 0.66 ± 0.04 0.50 ± 0.06Diethyl Succinate 0.03 ± 0.05 0.10 ± 0.00 0.11 ± 0.01 0.14 ± 0.03 0.15 ± 0.00Valeric Acid 0.02 ± 0.03 0.02 ± 0.02 0.05 ± 0.00 0.06 ± 0.01 0.07 ± 0.002-Phenylethyl Acetate 0.01 ± 0.67 0.03 ± 0.60 0.03 ± 0.04 0.04 ± 0.00 0.02 ± 0.01Hexanoic Acid 1.11 ± 0.17 1.37 ± 0.28 2.19 ±0.24 1.40 ± 0.16 1.56 ± 0.322-Phenyl Ethanol 10.74 ± 0.68 12.66 ± 0.66 13.52 ± 1.25 14.62 ± 0.84 13.10 ± 2.10Octanoic Acid 1.38 ± 0.08 1.34 ± 0.21 2.65 ± 0.12 1.65 ± 0.13 1.28 ± 0.09Decanoic Acid 2.80 ±0.17 2.98 ± 0.39 4.50 ± 0.29 3.28 ± 0.21 3.80 ± 0.14
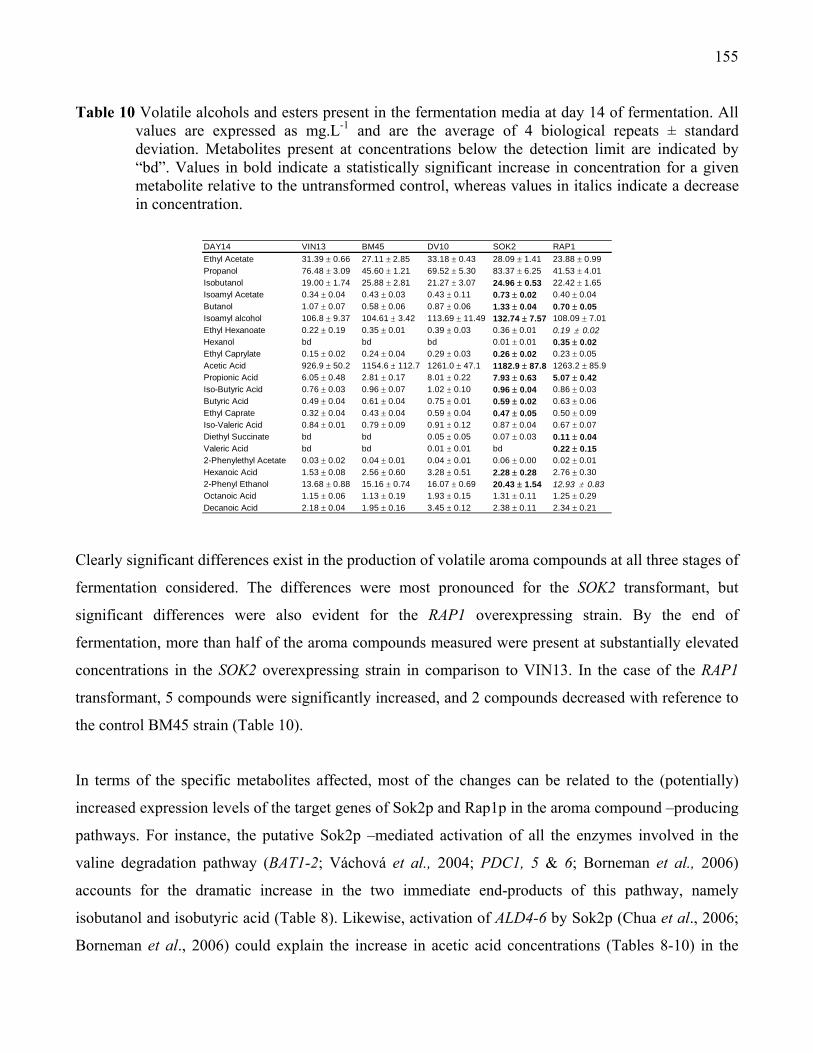
155
Table 10 Volatile alcohols and esters present in the fermentation media at day 14 of fermentation. All values are expressed as mg.L-1 and are the average of 4 biological repeats ± standard deviation. Metabolites present at concentrations below the detection limit are indicated by “bd”. Values in bold indicate a statistically significant increase in concentration for a given metabolite relative to the untransformed control, whereas values in italics indicate a decrease in concentration.
DAY14 VIN13 BM45 DV10 SOK2 RAP1Ethyl Acetate 31.39 ± 0.66 27.11 ± 2.85 33.18 ± 0.43 28.09 ± 1.41 23.88 ± 0.99Propanol 76.48 ± 3.09 45.60 ± 1.21 69.52 ± 5.30 83.37 ± 6.25 41.53 ± 4.01Isobutanol 19.00 ± 1.74 25.88 ± 2.81 21.27 ± 3.07 24.96 ± 0.53 22.42 ± 1.65Isoamyl Acetate 0.34 ± 0.04 0.43 ± 0.03 0.43 ± 0.11 0.73 ± 0.02 0.40 ± 0.04Butanol 1.07 ± 0.07 0.58 ± 0.06 0.87 ± 0.06 1.33 ± 0.04 0.70 ± 0.05Isoamyl alcohol 106.8 ± 9.37 104.61 ± 3.42 113.69 ± 11.49 132.74 ± 7.57 108.09 ± 7.01Ethyl Hexanoate 0.22 ± 0.19 0.35 ± 0.01 0.39 ± 0.03 0.36 ± 0.01 0.19 ± 0.02Hexanol bd bd bd 0.01 ± 0.01 0.35 ± 0.02Ethyl Caprylate 0.15 ± 0.02 0.24 ± 0.04 0.29 ± 0.03 0.26 ± 0.02 0.23 ± 0.05Acetic Acid 926.9 ± 50.2 1154.6 ± 112.7 1261.0 ± 47.1 1182.9 ± 87.8 1263.2 ± 85.9Propionic Acid 6.05 ± 0.48 2.81 ± 0.17 8.01 ± 0.22 7.93 ± 0.63 5.07 ± 0.42Iso-Butyric Acid 0.76 ± 0.03 0.96 ± 0.07 1.02 ± 0.10 0.96 ± 0.04 0.86 ± 0.03Butyric Acid 0.49 ± 0.04 0.61 ± 0.04 0.75 ± 0.01 0.59 ± 0.02 0.63 ± 0.06Ethyl Caprate 0.32 ± 0.04 0.43 ± 0.04 0.59 ± 0.04 0.47 ± 0.05 0.50 ± 0.09Iso-Valeric Acid 0.84 ± 0.01 0.79 ± 0.09 0.91 ± 0.12 0.87 ± 0.04 0.67 ± 0.07Diethyl Succinate bd bd 0.05 ± 0.05 0.07 ± 0.03 0.11 ± 0.04Valeric Acid bd bd 0.01 ± 0.01 bd 0.22 ± 0.152-Phenylethyl Acetate 0.03 ± 0.02 0.04 ± 0.01 0.04 ± 0.01 0.06 ± 0.00 0.02 ± 0.01Hexanoic Acid 1.53 ± 0.08 2.56 ± 0.60 3.28 ± 0.51 2.28 ± 0.28 2.76 ± 0.302-Phenyl Ethanol 13.68 ± 0.88 15.16 ± 0.74 16.07 ± 0.69 20.43 ± 1.54 12.93 ± 0.83Octanoic Acid 1.15 ± 0.06 1.13 ± 0.19 1.93 ± 0.15 1.31 ± 0.11 1.25 ± 0.29Decanoic Acid 2.18 ± 0.04 1.95 ± 0.16 3.45 ± 0.12 2.38 ± 0.11 2.34 ± 0.21
Clearly significant differences exist in the production of volatile aroma compounds at all three stages of
fermentation considered. The differences were most pronounced for the SOK2 transformant, but
significant differences were also evident for the RAP1 overexpressing strain. By the end of
fermentation, more than half of the aroma compounds measured were present at substantially elevated
concentrations in the SOK2 overexpressing strain in comparison to VIN13. In the case of the RAP1
transformant, 5 compounds were significantly increased, and 2 compounds decreased with reference to
the control BM45 strain (Table 10).
In terms of the specific metabolites affected, most of the changes can be related to the (potentially)
increased expression levels of the target genes of Sok2p and Rap1p in the aroma compound –producing
pathways. For instance, the putative Sok2p –mediated activation of all the enzymes involved in the
valine degradation pathway (BAT1-2; Váchová et al., 2004; PDC1, 5 & 6; Borneman et al., 2006)
accounts for the dramatic increase in the two immediate end-products of this pathway, namely
isobutanol and isobutyric acid (Table 8). Likewise, activation of ALD4-6 by Sok2p (Chua et al., 2006;
Borneman et al., 2006) could explain the increase in acetic acid concentrations (Tables 8-10) in the
156
SOK2 overexpressing strain (acetate is the direct product of the reaction catalysed by these three
aldehyde dehydrogenase isomers). Numerous other correlations can be found between Sok2p target
genes and corresponding increases in the specific products of reactions catalysed by these genes, i.e.
ARO10 (Chua et al., 2006) and the compounds 2-phenylethanol and isoamyl alcohol (Tables 9 and 10).
The same observations can be made regarding the RAP1 –overexpressing strain: For example, one of
its target genes, ERG13 (Kasahara et al., 2007) is involved in the production of diethyl succinate, with
is present at much higher concentrations at the end of fermentation in the transformed strain compared
to the reference BM45 strain (Table 10).
6.4.5 Results of multivariate analysis
Our original question pertained to whether the metabolic phenotype of one strain could be shifted in the
direction of another by adjusting the expression of a key transcription factor. This would suggest that
changes in the regulation/expression of specific transcription factors could be responsible for major
phenotypic divergence and adaptation of different Saccharomyces species or different strains within a
species. To address this issue we followed a multivariate approach to present the overall structure of
the collective dataset in a qualitative manner. The results of the PCA analysis are depicted in frames A-
C of figure 5 below.
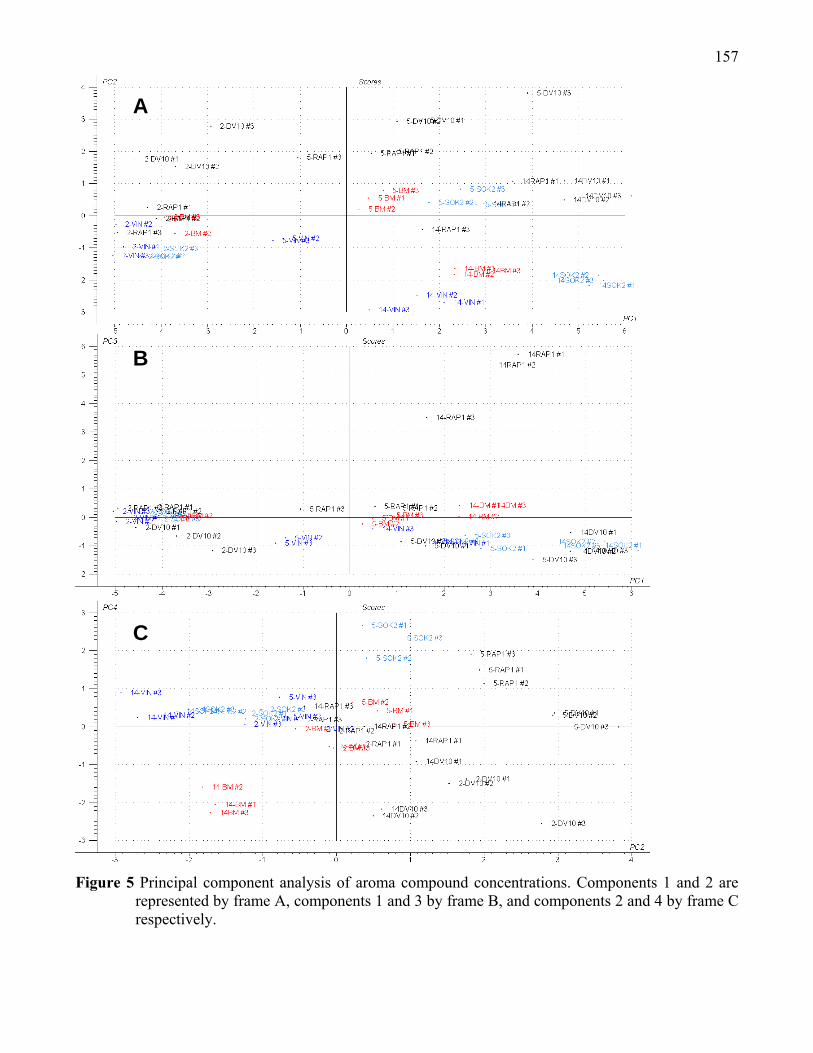
157
Figure 5 Principal component analysis of aroma compound concentrations. Components 1 and 2 are
represented by frame A, components 1 and 3 by frame B, and components 2 and 4 by frame C respectively.
B
A
C

158
From the PCA analysis it is clear that major shifts have occurred in the metabolite profiles of the two
transformed strains in comparison to the BM45 and VIN13 reference strains (Figure 5). By day 2 of
fermentation the differences between the sample groupings of the SOK2 -overexpressing VIN13 and
the reference VIN13 strain is negligible. The same is true of the RAP1 -overexpressing strain and its
control BM45 strain. However, by day 5 of fermentation the two transformed industrial strains form
clearly disparate clusters that are separated from their control samples along the first three principal
components or axes of variation. The same is true for day 14, where the distances between distinct
sample groupings are even greater for four principal components (accounting for 85% of the explained
variance).
As can be seen from frames A and B of Figure 5, the overall exo-metabolite composition of the RAP1 –
overexpressing strain has shifted from the BM45 control strain in the direction of the DV10 target
strain for days 5 and 14 of fermentation. Yet although large distances separate the SOK2 –
overexpressing samples from the control VIN13 cluster, the shift did not appear to approximate to the
target BM45 cluster in a reliable manner, sometimes even shifting in the complete opposite direction
(for components three and four, for example).
6.4.6 Closing remarks
To conclude, although the moderation of key transcription factor expression levels in a particular wine
yeast strain can indeed alter metabolism in a large-scale manner, the changes are somewhat
unpredictable and do not always align with preconceived expectations. This is not surprising, given the
complexity of cellular metabolic regulation, particularly aroma compound metabolism: Various factors
such as the prevailing redox balance, the concentration of intermediates and flux through upstream and
downstream pathways affect the rates and directionality of the many promiscuous enzymes which
catalyze the reactions of higher alcohol and ester synthesis. This of course makes a direct and
quantitative prediction of the role and metabolic impact of a single transcription factor largely
unfeasible for the time being. Yet despite these layers complexity, we were still able to moderate
metabolism in a fairly defined manner (qualitatively) by moderating transcription factor expression
levels in a strategy based on evaluation of high quality comparative gene expression data.
Lessons from nature have shown us that micro-evolution, which has presumably provided us with the
plethora of Saccharomyces strains known today, implements this technique of transcription factor
moderation, or binding site alteration, in order to effect a large-scale rewiring of metabolic and
159
regulatory circuits in the cell. The possibility thus exists to modify or enhance industrial wine yeasts in
a holistic manner by carefully selecting and modifying high-level master regulatory systems, instead of
instituting numerous single gene changes at the effector level.
Acknowledgements Funding for the research presented in this paper was provided by the NRF and Winetech, and personal
sponsorship by the Wilhelm Frank Trust. We would also like to thank Jo McBride and the Cape Town
Centre for Proteomic and Genomic Research for the microarray analysis and the staff and students at
the IWBT for their support and assistance in numerous areas.
References Abbott DA, Knijnenburg TA, de Poorter LM, Reinders MJ, Pronk JT & van Maris AJ (2007) Generic
and specific transcriptional responses to different weak organic acids in anaerobic chemostat cultures
of Saccharomyces cerevisiae. FEMS Yeast Res. 7: 819-833.
Ausubel FM, Brent R, Kingston RE, Moore DD & Seidman JG (1994) Current protocols in molecular
biology. New York: John Wiley & Sons.
Bakalinsky AT & Snow R (1990) The chromosomal constitution of wine strains of Saccharomyces
cerevisiae. Yeast 6: 367– 382.
Barnett JA (1992) The taxonomy of the genus Saccharomyces: a short review for non-taxonomist.
Yeast 8: 1–23
Bely L, Sablayrolles J & Barre P (1990) Description of alcoholic fermentation kinetics: its variability
and significance. Am. J. Enol. Vitic. 40: 319-324.
Ben-Dor A, Shamir R & Yakhini Z (1999) Clustering gene expression patterns. J. Comp. Biol. 6: 281-
297.
Bidenne C, Blondin B, Dequin S & Vezinhet F (1992) Analysis of the chromosomal DNA
polymorphism of wine strains of Saccharomyces cerevisiae. Curr. Genet. 22:1–7.
160
Borneman AR, Leigh-Bell JA, Yu H, Bertone P, Gerstein M & Snyder M (2006) Target hub proteins
serve as master regulators of development in yeast. Genes & Dev. 20: 435-448.
Borneman AR, Gianoulis TA, Zhang ZD, Yu H, Rozowsky J, Seringhaus MR, Wang LY, Gerstein M
& Snyder M (2007) Divergence of transcription factor binding sites across related yeast species.
Science 317: 815- 819.
Breiman L (2001) Random Forests. Machine Learning 45: 5-22.
Chua G, Morris QD, Sopko R, Robinson MD, Ryan O, Chan ET et al. (2006) Identifying transcription
factor functions and targets by phenotypic activation. Proc. Natl. Acad. Sci. USA 103: 12045-12050.
Dermitzakis ET & Clark AG (2002) Evolution of transcription factor binding sites in Mammalian gene
regulatory regions: conservation and turnover. Mol. Biol. Evol. 19:1114-21.
Ernst J & Bar-Joseph Z (2006) STEM: a tool for the analysis of short time series gene expression data.
BMC Bioinformatics 7: 191.
Frezier V & Dubourdieu D (1992) Ecology of yeast strain Saccharomyces cerevisiae during
spontaneous fermentation in a Bordeaux winery. Am. J. Enol. Viticult. 43: 375–380.
Gimeno CJ & Fink GR (1994) Induction of pseudohyphal growth by overexpression of PHD1, a
Saccharomyces cerevisiae gene related to transcriptional regulators of fungal development. Mol. Cell
Biol. 14: 2100-2112.
Haugen AC, Kelley R, Collins JB, Tucker CJ, Deng C, Afshari CA, Brown JM, Ideker T & Van
Houten B (2004) Integrating phenotypic and expression profiles to map arsenic-response networks.
Genome Biol. 5: R95.
Johnston JR, Baccari C & Mortimer RK (2000) Genotypic characterization of strains of commercial
wine yeasts by tetrad analysis. Res. Microbiol. 151: 583-590.

161
Kasahara K, Ohtsuki K, Ki S, Aoyama K, Takahashi H, Kobayashi T, Shirahige K & Kokubo T (2007)
Assembly of regulatory factors on rRNA and ribosomal protein genes in Saccharomyces cerevisiae.
Mol. Cell Biol. 27: 6686-6705.
Kurtzman CP & Robnett CJ (1991) Phylogenetic relationship among species of Saccharomyces,
Schizosaccharomyces, Debaryomyces and Schwanniomyces determined from partial ribosomal RNA
sequences. Yeast 7:61–72.
Lilly M, Bauer FF, Styger G, Lambrechts MG & Pretorius IS (2006) The effect of increased
breanched-chain amino acid transaminase activity in yeast on the production of higher alcohols and on
the flavour profiles of wine and distillates. FEMS Yeast Res. 6:726-743.
Liu H, Styles CA & Fink GR (1996) Saccharomyces cerevisiae S288C has a mutation in FLO8, a gene
required for filamentous growth. Genetics 144: 967–978.
Mardia KV, Kent JT & Bibby JH (1979) Multivariate analysis. UK: Academic Press.
Mortimer R, Lerner R & Barr J (1957) Ultraviolet-induced biochemical mutants of Saccharomyces
cerevisiae. U.S. Afon. Energy Comm. Doc. UCRL 3746: 1–10.
Mortimer R & Johnston J (1986) Geneology of principal strains of the Yeast Genetics Stock Center.
Genetics 113: 35–43.
Mortimer RK (2000) Evolution and variation of the yeast (Saccharomyces) genome. Genome Res. 10:
403–409.
Okazaki S, Tachibana T, Naganuma A, Mano N & Kuge S (2007) Multistep disulfide bond formation
in Yap1 is required for sensing and transduction of H2O2 stress signal. Mol. Cell. Biol. 27: 675-688.
Pan X & Heitman J (2000) Sok2 regulates yeast pseudohyphal differentiation via a transcription factor
cascade that regulates cell-cell adhesion. Mol. Cell. Biol. 20: 8364-8372.
162
Puig S & Perez-Ortin JE (2000) Stress response and expression patterns in wine fermentations of yeast
genes induced at the diauxic shift. Yeast 16: 139–148.
Rachidi N, Barre P & Blondin B (1999) Multiple Ty-mediated chromosomal translocation lead to
karyotype changes in a wine strain of Saccharomyces cerevisiae. Mol. Gen. Genet. 261: 841–850.
Ramakers C, Ruijter JM, Deprez RH & Moorman AF (2003). Assumption-free analysis of quantitative
real-time polymerase chain reaction (PCR) data. Neurosci. Lett. 339: 62-66.
Rossouw D, Naes T & Bauer FF (2008) Linking gene regulation and the exo-metabolome: A
comparative transcriptomics approach to identify genes that impact on the production of volatile aroma
compounds in yeast. BMC Genomics 9: 530-548.
Salmon JM (1997) Enological fermentation kinetics of an isogenic ploidy series derived form an
industrial Saccharomyces cerevisiae strain. J. Ferment. Bioeng. 83: 253– 260.
Sambrook J, Fritsch EF & Maniatis T (1989) Molecular cloning: A laboratory manual (2nd edn). New
York: Cold Spring Harbor Laboratory Press.
Schütz M & Gafner J (1994) Dynamics of the yeast strain population during spontaneous alcoholic
fermentation determined by CHEF gel electrophoresis. Lett. Appl. Microbiol. 19: 253–257.
Tan K, Feizi H, Luo C, Fan SH, Ravasi T & Ideker TG (2008) A systems approach to delineate
functions of paralogous transcription factors: Role of the Yap family in the DNA damage response.
PNAS 105: 2934-2939.
Thorsen M, Lagniel G, Kristiansson E, Junot C, Nerman O, Labarre J & Tamás MJ (2007) Quantitative
transcriptome, proteome, and sulfur metabolite profiling of the Saccharomyces cerevisiae response to
arsenite. Physiol.Genomics 30: 35-43.
Tsong AE, Tuch BB, Li H & Johnson AD (2006) Evolution of alternative transcriptional circuits with
identical logic. Nature 443: 415-420.
163
Tusher CG, Tibshirani R & Chu G (2001) Significance analysis of microarrays applied to the ionizing
radiation response. Proc. Natl. Acad. Sci. USA 98: 5116-5121.
Váchová L, Devaux F, Kucerová H, Ricicová M, Jacq C & Palková Z (2004) Sok2p transcription factor
is involved in adaptive program relevant for long term survival of Saccharomyces cerevisiae colonies.
J. Biol. Chem. 279: 37973-37981.
Workman CT, Mak HC, McCuine S, Tagne JB, Agarwal M, Ozier O, Begley TJ, Samson LD & Ideker
T (2006) A systems approach to mapping DNA damage response pathways. Science 312: 1054-1059.
Wenzel TJ, Migliazza A, Steensma HY & van den Berg JA (1992) Efficient selection of phleomycin-
resistant Saccharomyces cerevisiae transformants. Yeast 8:667-668.
Yarragudi A, Parfrey LW & Morse RH (2007) Genome-wide analysis of transcriptional dependence
and probable target sites for Abf1 and Rap1 in Saccharomyces cerevisiae. Nucl. Acids Res. 35: 193-
202.
164
CChhaapptteerr 77
Research results
Comparative transcriptomic and proteomic profiling of industrial wine
yeast strains
A modified version of this manuscript will be submitted for publication in: PLoS Biology
Authors:
Debra Rossouw, Adri van den Dool, Dan Jacobson & Florian F Bauer
165
CHAPTER 7
Comparative transcriptomic and proteomic profiling of industrial wine
yeast strains
7.1 Abstract 7.1.1 Background
The geno- and phenotypic diversity of commercial Saccharomyces cerevisiae wine yeast strains
provides an opportunity to apply the system-wide approaches that are reasonably well established for
laboratory strains to generate insight on the functioning of complex cellular networks in industrial
environments. We have previously shown that a comparative analysis of the transcriptome and
exometabolome of five phenotypically divergent wine yeast strains allows the establishment of a
statistically robust omics matrix to correlate changes in gene expression and exometabolome, including
a predictive capability regarding impacts of genetic perturbations on complex metabolic network.
However, transcriptomic data sets do not provide an accurate reflection of changes at the proteome
level. Here, we extend the comparative approach to include a proteomic analysis of two of the
previously analysed wine yeast strains.
7.1.2 Results
An iTRAQ-based approach was used to investigate protein levels in two industrial wine yeast strains at
three different time points of alcoholic fermentation in synthetic wine must. The data show that
differences in the transcriptomes of the two strains at a given time point rather accurately reflect
differences in the corresponding proteomes, providing strong support for the biological relevance of
comparative transcriptomic data sets in yeast. In line with previous observations, the alignment proves
less accurate when assessing intrastrain changes at different time points. In this case, differences
between transcriptome and proteome appear strongly dependent on the GO category of the
corresponding genes. The data in particular suggest that metabolic enzymes and the corresponding
genes appear strongly correlated over time and between strains, suggesting a strong transcriptional
control of such enzymes. The data also allow the generation of hypotheses regarding the molecular
origin of significant differences in phenotypic traits between the two strains.

166
7.1.3 Conclusion
The data suggest that the comparative approach provides more robust and biologically more
meaningful data sets than can be derived from single strain approaches. The interstrain comparison of
transcriptomic and proteomic data sets reveal intrinsic molecular differences between strains that in
many cases can be directly correlated to relevant phenotypes, and are therefore well suited to the
analysis of complex phenotypes. Wine yeast strains appear furthermore ideally suited for such
approaches, and offer the additional advantage that data sets can be directly analysed for
biotechnological relevance.
7.2 Background Saccharomyces cerevisiae has long been a model organism to investigate the biology of the eukaryotic
cell. The yeast genome, which is compact and contains only around 6000 protein-encoding genes, was
completely sequenced in 1996 [1], but nearly 10% of putative proteins remain without predicted
functions. The majority, if not all of these remaining gene products are non-essential in laboratory
conditions and the deletion of these genes in most cases does not lead to a detectable phenotype.
A major limitation of most current approaches in this regard is that research is conducted using a
limited number of laboratory yeast strains which, while displaying characteristics that are useful for
genetic and molecular analyses, represent limited genetic and phenotypic diversity. These laboratory
strains are furthermore significantly different from the strains that are used for industrial and
commercial purposes. Industrial environments however constitute much of the evolutionary framework
of the species S. cerevisiae in the past centuries, and many genes that can not be related to a specific
function in laboratory strains may be related to specific phenotypes in industrial strains. Such strains
may therefore be better suited for the analysis of complex genetic and molecular networks and of their
phenotypic relevance or biological meaning. The recent sequencing of a wine yeast strain [2] already
showed that at least 27 new genes were present in the genome sequence of this strain in comparison to
the standard S288c laboratory strain, and that a large number of other significant differences exist
between these genomes. Furthermore, different wine yeast strains exhibit great variation in
chromosome size and number, as well as ploidy, and cover a wide range of phenotypic traits, many of
which are absent in laboratory yeast [3].
167
Large-scale gene expression analysis with microarrays is one of the most powerful and best developed
genomics methodologies that can be applied to yeast. Transcript levels of predicted genes can be
measured simultaneously, under any selected condition and at specific time points, to identify sets of
genes whose expression levels are induced or repressed relative to a reference sample [4].
Transcriptome analysis of wine yeast strains has already proven useful to analyse the broad genetic
regulation of fermentative growth in wine environments, and has allowed identification of stress
response mechanisms that are active in these conditions [5;6;7]. Rossouw et al. [8] showed that a
comparative analysis of transcriptome and exometabolome could be used to identify genes that are
involved in aroma metabolism and to predict some of the impacts. While of great usefulness,
transcription data alone are of limited value since they can not be directly correlated with protein levels
and, a forteriori, with in vivo metabolic fluxes [9;10;11]. All omics datasets would indeed be
significantly strengthened by combination with other layers of the biological information transfer
system [12;13].
A current bottleneck of such systems biology approaches is that most ‘omics’ tools are not developed
to the same degree as transcriptomics. In particular, genome-scale protein quantification faces
significant challenges, but methods for determining relative levels of protein between samples have
been developed [14]. Two-dimensional (2D) gel electrophoresis has been and continues to be employed
to separate complex protein mixtures, and is frequently combined with in-gel tryptic digestion and
mass spectrometry for the identification of proteins [15]. In general, most yeast proteomic studies to
date have been conducted using this 2D gel electrophoresis technology [16;17;18;19]. In wine yeast,
the 2D gel approach coupled to mass spectrometry has been used to study post-inoculation changes in
protein levels [20], as well as the proteomic response of fermenting yeast to glucose exhaustion [21].
While over 1400 soluble proteins of yeast have been identified using 2D analyses, this approach has
not addressed the issue of quantification in a satisfactory manner, and also suffers from the relatively
low number of proteins which are identified in a single analysis, including the under-representation of
low-abundance and hydrophobic proteins [22;23].
To overcome some of these limitations, whole proteome analysis can also be implemented by a high-
throughput chromatography approach in combination with mass spectrometry [24]. The separation of
peptides from complex protein digests is usually achieved by 2 dimensional nano-liquid
chromatography-mass spectrometry (LC/MS) [25]. A total of 1504 yeast proteins have been
unambiguously identified in a single analysis using this 2D chromatography approach coupled with
168
tandem mass spectrometry (MS/MS) [26]. Advances in LC/MS –based proteome analysis, in
combination with advances in computational methods, have led to a more comprehensive identification
and accurate quantification of endogenous yeast proteins [27;28]. Yet most of the above-mentioned
studies were carried out with laboratory yeast strains, mostly under confined experimental conditions
limited to steady, exponential growth rates. No such studies have been conducted using different wine
yeast strains at different stages of the normal growth cycle.
In our study we made use of such a chromatography-coupled mass spectrometry approach for the
comparative analysis of wine yeast strains. To enable relative quantification between samples, we
employed the 8-plex iTRAQ labeling strategy. The strategy enables relative quantification of up to
eight complex protein samples in a single analysis using isobaric tags [29]. In short, unlabelled protein
samples are trypsin digested, then labeled using isobaric tags (the eight reporter ions) and subsequently
separated by liquid chromatography followed by tandem MS (MS/MS). The covalently bound isobaric
tags have the same charge and overall mass, but produce different low mass signatures upon MS/MS,
thus enabling relative quantification between different samples in a single analysis [30].
In this paper, we extend the comparative omics approach by aligning the transcriptomes and proteomes
of two industrial wine yeast strains. The transcriptomes of these strains, generated at the same time
points in the same conditions, have been analysed previously [8]. Our data show that differences in
transcript levels of the two strains at a given time point are a reasonably accurate reflection of
differences in the corresponding protein levels. This provides strong support for the biological
relevance of comparative transcriptomic data sets in yeast, showing that intrinsic differences between
strains may form a more reliable platform for analyses of biologically relevant and meaningful genetic
features of a system. Interstrain comparative transcriptome and proteome analyses (as opposed to single
strain analyses) appear to substantially increase our ability to provide a biologically relevant
interpretation of omic data sets and to understand metabolic and physiological changes that occur
during wine fermentation. Such combinatorial comparative approaches should ultimately enable
accurate model-building for industrial wine yeast and facilitate the generation of intelligent yeast
improvement strategies.
169
7.3 Materials & Methods 7.3.1 Strains, media and culture conditions
Two yeast strains were used in this study, namely VIN13 (Anchor Yeast, South Africa) and BM45
(Lallemand Inc., Canada). Both are diploid Saccharomyces cerevisiae strains used in industrial wine
fermentations. Yeast cells were cultivated at 30oC in YPD synthetic media 1% yeast extract (Biolab,
South Africa), 2% peptone (Fluka, Germany), 2% glucose (Sigma, Germany). Solid medium was
supplemented with 2% agar (Biolab, South Africa).
7.3.2 Fermentation medium
Fermentation experiments were carried out with synthetic must MS300 which approximates to a
natural must as previously described [31]. The medium contained 125 g/L glucose and 125 g/L
fructose, and the pH was buffered at 3.3 with NaOH.
7.3.3 Fermentation conditions
All fermentations were carried out under microaerobic conditions in 100 ml glass bottles (containing 80
ml of the medium) sealed with rubber stoppers with a CO2 outlet. The fermentation temperature was
approximately 22oC and no stirring was performed during the course of the fermentation. Fermentation
bottles were inoculated with YPD cultures in the logarithmic growth phase (around OD600 = 1) to an
OD600 of 0.1 (i.e. a final cell density of approximately 106 cfu.ml-1). The cells from the YPD pre-
cultures were briefly centrifuged and resuspended in MS300 to avoid carryover of YPD to the
fermentation media. The fermentations followed a time course of 14 days and the bottles were weighed
daily to assess the progress of fermentation. Samples of the fermentation media and cells were taken at
days 2, 5 and 14 as representative of the exponential, early logarithmic and late logarithmic growth
phases.
7.3.4 Microarray analyses
Sampling of cells from fermentation and total RNA extraction was performed as described by Abbott et
al. [32]. For a complete description of the hybridization conditions, as well as normalization and
statistical analysis, refer to Rossouw et al. [8]. Transcript data can be downloaded from the GEO
repository under the following accession numbers: GSE11651.
170
7.3.5 Protein extraction
General chemicals for sample preparation were acquired from Merck. Samples of the cells were taken
from the fermentations (at days 2, 5 and 14) by centrifugation and weighed after washing with ddH2O.
The pellets were sonicated using a Soniprep 150 probe sonicator on ice in 30 second bursts, then spun
at 16000 g, and the supernatants collected. Protein content was assayed by the EZQ method
(Invitrogen) and aliquots containing 50 μg of total protein underwent reduction (incubation with 10
mM DTT at 56°C for one hour) and alkylation (incubation with 30 mM iodoacetamide at pH 8.0 in the
dark for one hour) and were then quenched with further DTT. Samples were subsequently digested by
incubation with 2 ug of trypsin (Promega, Madison, Wisconson, USA) at 37°C overnight. The
resulting peptides were desalted on 10 mg Oasis SPE cartridges (Waters Corporation, Massachusetts,
USA) and completely dried down using a speed vacuum concentrator (Thermo Savant, Holbrook, NY,
USA).
7.3.6 iTRAQ labeling
Dried protein digests were re-constituted with 30 μL of dissolution buffer from the iTRAQ Reagent
Multi-Plex Kit (Applied Biosystems, Foster City, CA, USA) and labelled with 8-plex iTRAQ reagents
according to the manufacturer’s instruction. Labelled material from six different samples were then
combined, acidified, desalted as above, concentrated to approximately 50 μL, and finally diluted to 250
μL in 0.1% formic acid.
7.3.7 HPLC method
Pooled samples were fractionated in an on-line fashion on a BioSCX II 0.3 x 35 mm column (Agilent
Technologies, Santa Clara, CA, USA) using ten salt-steps; 10, 20, 40, 60, 80, 100, 140, 200, 260 and
500 mM KCl. Peptides were captured on a 0.3 x 5 mm PepMap cartridge (LC Packings, Dionex
Corporation, Sunnyvale, CA, USA) before being separated on a 0.3 x 100 mm Zorbax 300SB- C18
column (Agilent). The HPLC gradient between Buffer A (0.1% formic acid in water) and Buffer B
(0.1% formic acid in acetonitrile) was formed at 6 ul/min as follows: 10% B for the first 3 min,
increasing to 35%B by 80 min, increasing to 95% B by 84 min, held at 95% until 91 min, back to 10%
B at 91.5 min and held there until 100 min.
7.3.8 MS conditions

171
The LC effluent was directed into the Ionspray source of QSTAR XL hybrid Quadrupole- Time-of -
Flight mass spectrometer (Applied Biosystems) scanning from 300-1600 m/z. The top three most
abundant multiple charged peptides were selected for MS/MS analysis (55-1600 m/z). The mass
spectrometer and HPLC system were under the control of the Analyst QS software package (Applied
Biosystems).
7.3.9 Data analyses
All of the datafiles from each 2D LC-MS/MS experiment were searched as a set by ProteinPilot 2.0.1
(Applied Biosystems) against a yeast protein database from Stanford University’s Saccharomyces
Genome Database (5884 sequences, downloaded November 2008). The data was also searched against
the same set of sequences in reverse to estimate the False Discovery Rate for each run, which was
below 0.3% for all three runs.
7.3.10 Network analyses
Microarray data were normalized with the GCRMA method [33]. Ratios of the RNA levels for each
gene at each time point comparing BM45 to VIN13 were subsequently created from the means of
technical replicates performed for each strain. If the resulting ratio was less than one it was
transformed by taking its negative inverse in order to express relative expression levels on the same
scale. Ratios for protein levels between BM45 and VIN13 were similarly created. Ratios of the RNA
and protein levels were also created to show the differences between time points within each strain.
XML files for the KEGG pathway database [34;35;36] were downloaded, parsed and used to create an
undirected graph consisting of nodes representing pathways and nodes representing gene products
which participate in said pathways. Edges were created between the gene product nodes and each of
the pathway nodes in which they are thought to participate. A neighborhood walking algorithm was
implemented in order to extract subgraphs corresponding to all of the gene products and their
associated pathways for which we had ratios for both protein and RNA levels. Given that the proteins
identified by iTRAQ varied across each time point (within and between each strain) this subgraph
extraction was done separately for each time point.
The resulting subgraphs were visualized with Cytoscape v 2.6.1 [37;38]. Pathways representing
differences between strains as well as reasonable concordance in the regulation of RNA and protein
levels were subsequently selected. An unweighted force directed layout algorithm was applied to the
selected subgraphs and finally the order of gene product nodes around pathway nodes was manually

172
adjusted to be consistent across time points. Manual node order adjustment was necessary due to the
variation in protein data identified by iTRAQ from time point to time point.
The resulting visually mapped subgraphs provide an effective visualization method with which to
observe the ratios of RNA and proteins involved in specific pathways simultaneously and as such, give
further insight into the differences in metabolic regulation between strains and time points for both
types of molecules.
All programming required for ratio creation, data parsing, graph creation and neighborhood walking
was implemented in Perl.
7.4 Results & Discussion 7.4.1 Transcriptome data
Transcriptome data was acquired (using the Affymetrix platform) at three time points during
fermentation, namely day 2 (exponential growth phase), day 5 (early stationary phase) and day 14 (late
stationary phase) at the end of fermentation. The data were evaluated more comprehensively in a
previous publication [8] and will not be the focus of the research presented here. Complete
transcriptomic datasets are available at the GEO repository under the accession number GSE11651.
7.4.2 Interstrain alignment of the transcriptome and proteome
Protein abundance data for the BM45 and VIN13 strains were also generated at the same three time
points. Three repeats each for both strains were combined for each time point in a single 8-plex iTRAQ
analysis. In other words, the repeats for BM45 and VIN13 were pooled for comparative analyses in
three sets according to time points (i.e. all day 2 samples together, all day 5 samples together and all
day 14 samples together). A total of 436 proteins were unambiguously identified. Not all of these
proteins were identified for both strains across all three time points, but for each time point at least 300
common proteins were quantified for the three BM45 and VIN13 samples.
To get an impression of the general data structure and overall alignment of transcript and protein data
when comparing the two strains at each time point, we first calculated the ratios in the concentrations
of identified proteins and the ratios of the corresponding gene expression values between the two
strains. As a broad measure of alignment, we used the ratio of these protein and transcript comparisons
(Figure 1). In these representations, values of above 1.5 and below 0.67 represent cases were the
difference in fold change between protein concentration and transcription levels between the two
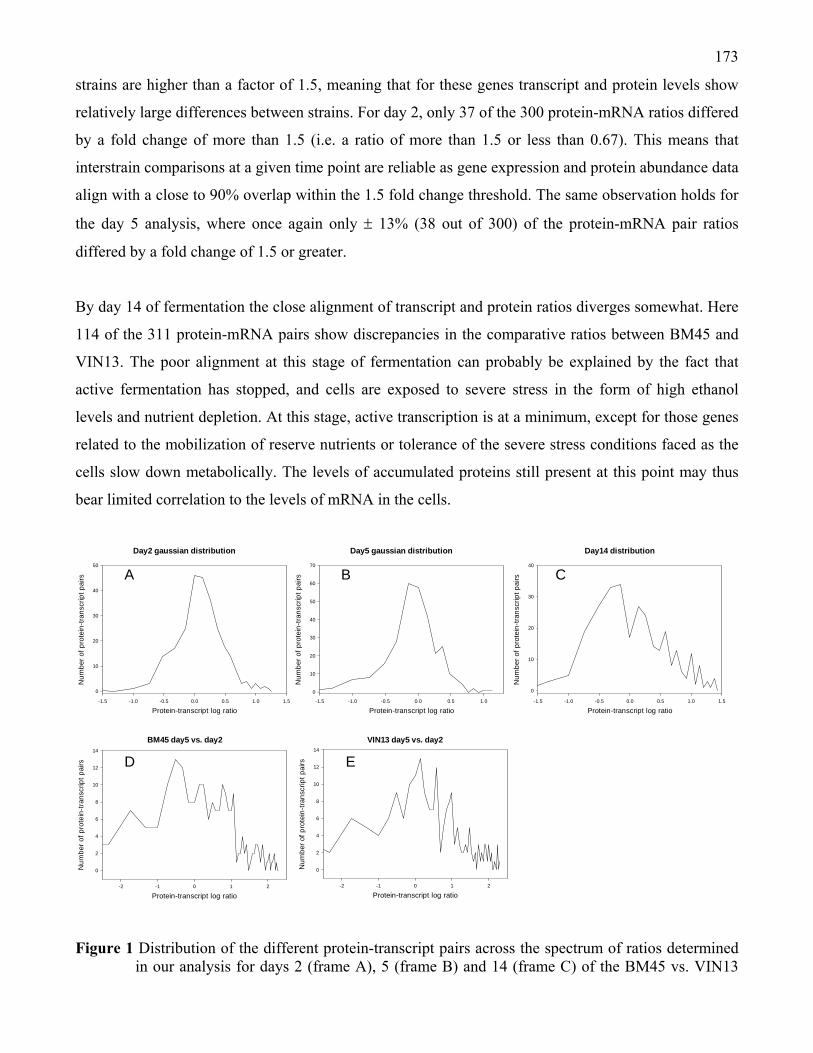
173
strains are higher than a factor of 1.5, meaning that for these genes transcript and protein levels show
relatively large differences between strains. For day 2, only 37 of the 300 protein-mRNA ratios differed
by a fold change of more than 1.5 (i.e. a ratio of more than 1.5 or less than 0.67). This means that
interstrain comparisons at a given time point are reliable as gene expression and protein abundance data
align with a close to 90% overlap within the 1.5 fold change threshold. The same observation holds for
the day 5 analysis, where once again only ± 13% (38 out of 300) of the protein-mRNA pair ratios
differed by a fold change of 1.5 or greater.
By day 14 of fermentation the close alignment of transcript and protein ratios diverges somewhat. Here
114 of the 311 protein-mRNA pairs show discrepancies in the comparative ratios between BM45 and
VIN13. The poor alignment at this stage of fermentation can probably be explained by the fact that
active fermentation has stopped, and cells are exposed to severe stress in the form of high ethanol
levels and nutrient depletion. At this stage, active transcription is at a minimum, except for those genes
related to the mobilization of reserve nutrients or tolerance of the severe stress conditions faced as the
cells slow down metabolically. The levels of accumulated proteins still present at this point may thus
bear limited correlation to the levels of mRNA in the cells.
Figure 1 Distribution of the different protein-transcript pairs across the spectrum of ratios determined in our analysis for days 2 (frame A), 5 (frame B) and 14 (frame C) of the BM45 vs. VIN13
Day14 distribution
Protein-transcript log ratio-1.5 -1.0 -0.5 0.0 0.5 1.0 1.5
Num
ber o
f pro
tein
-tran
scrip
t pai
rs
0
10
20
30
40
Day5 gaussian distribution
Protein-transcript log ratio-1.5 -1.0 -0.5 0.0 0.5 1.0
Num
ber o
f pro
tein
-tran
scrip
t pai
rs
0
10
20
30
40
50
60
70
Day2 gaussian distribution
Protein-transcript log ratio-1.5 -1.0 -0.5 0.0 0.5 1.0 1.5
Num
ber o
f pro
tein
-tran
scrip
t pai
rs
0
10
20
30
40
50
BM45 day5 vs. day2
Protein-transcript log ratio-2 -1 0 1 2
Num
ber o
f pro
tein
-tran
scrip
t pai
rs
0
2
4
6
8
10
12
14
VIN13 day5 vs. day2
Protein-transcript log ratio-2 -1 0 1 2
Num
ber o
f pro
tein
-tran
scrip
t pai
rs
0
2
4
6
8
10
12
14
A
D
C
E
B
174
comparative analysis. For the intrastrain analysis, the distribution of protein-transcript ratios for day 5 compared to day 2 can be seen in frame D (for BM45) and frame E (for VIN13).
In Figure 1 the general alignment of all the log2-transformed protein-mRNA ratios is represented as a
distribution curve. Log2-transformed ratios close to zero indicate very strong agreement between the
protein levels and gene expression levels for comparisons between strains. Hence the steeper the
gradient of the slopes of the Gaussian-shaped curves, the closer the alignment of transcript and protein
datasets as a whole.
For the interstrain analysis at specific time points, there is clearly a significant peak for days 2 and 5
around the optimal alignment point of zero, with sharp declining slopes in the direction of the two-fold
change indicators (namely values of 1 and -1). The narrow peaks for these two days are a clear
indicator of the close alignment of protein and transcript datasets. The opposite is clearly true for day
14 (frame C), where no classic Gaussian distribution is evident, but rather a segmented pattern of
increase and decrease across the wide range of protein-transcript ratios.
7.4.3 Intrastrain comparison of the evolution of transcriptome and proteome
In order to compare peptide signal areas between different runs (i.e. for comparisons between different
time points for either VIN13 and BM45) the data were normalized as follows: All of the iTRAQ
signals for peptides that are not shared among multiple detected proteins and that have a confidence
score of at least 1.00 were selected. The area for each label in these peptides was calculated as a
percentage of the total iTRAQ signal for each of the labels. This final transformed value is more
conducive for comparisons across multiple iTRAQ experiments. The agreement among the replicates
when expressed as a % of total signal as per our calculations was very good, and enabled intra-strain
comparisons across time points to be made.
When the analysis of transcript versus protein ratios was applied to the intra-strain analysis at different
time points, the result indicates a largely random distribution of protein-transcript ratios (Figure 1).
Although only the day5 vs. day2 analysis is shown, the results for the day14 vs. day5 analysis were no
different. The intra-strain comparisons clearly do not conform to any normal distribution curve when
applying the stringent criteria used for the transcript-protein alignment in this case. It must be kept in
mind that in this analysis a large positive or negative change in the expression of a particular gene,
along with a moderate change in the corresponding protein levels (in the same direction) would fall
175
outside of the threshold applied here for a good alignment. However, such an alignment would in many
cases be considered a good fit from a biological perspective.
To overcome the inherent stringency of this form of analysis, and considering the breakdown of
correlation between transcripts and protein levels observed for the intra-strain analysis, we decided to
use trends in transcript and protein levels as a second criterion. This assessment is much less stringent
since it only queries whether up or down changes in transcript levels over the time points investigated
here would generally correlate with similar trends on the protein level. In this case, ratios where both
transcript and protein were less than one or both greater than one were considered aligned (+). Inverse
ratios (i.e. one ratio less than one and the other greater than one) constituted a negative result (non-
aligned).
Using this approach, the alignment of protein vs. transcript data for the VIN13 and BM45 strains
between time points (i.e. day 5 vs. day 2, day 14 vs. day 5) was only around 60% for all three
comparisons. Considering that a random sample would yield 50%, this value is surprisingly low, but in
line with previous reports. Even when protein-transcript pairs for only the top 50 genes in terms of the
magnitude of increase/decrease in expression were evaluated, the trend analysis did not improve in any
noteworthy manner: For day 5 vs. day 2 in both strains, the alignment value increased slightly to 65-
68%, but for day 14 vs. day 5 there was in fact a decrease to close to 50%, much lower than the 60%
value calculated for the entire gene. This is surprising, since the transcript levels of these genes were
changed by at least 1.8 fold (and up to 32 fold), and such significant changes would be expected to
reflect on the proteome level. It is noteworthy that 2-fold is a threshold value that is frequently used in
transcriptomic analysis to differentiate significant from non-significant changes.
There are several possible explanations for this discordant alignment of transcript and protein levels for
the intrastrain comparisons. Firstly, our transcriptome and proteome data were generated at the same
stage of fermentation. However, the proteome at a specific time point is a reflection of previous rather
than concomitant transcript levels. In other words, it would be expected that a particular transcriptomic
dataset should be more closely aligned with proteomic data that are generated at a later time point, i.e.
after the translation and post-translational modification workflow has responded to the earlier changes
in transcription levels. Secondly, the time points assessed here represent very different environmental
conditions within a dynamically changing system, whereas the comparison of different strains at the
same time points de facto normalises for the environmental background. These findings help to explain

176
our observation that the predictive capacity of the omics matrix that was derived from the alignment of
transcriptome and exometabolome data sets [8] was statistically mainly reliant on inter-strain, and
much less on intra-strain comparisons.
Our dataset also confirms previous observations [27;39] that transcriptomic and proteomic datasets are
frequently difficult to align across different time points and need to be interpreted with caution. This is
particularly the case when only a single strain is analysed, as any changes at the transcript level might
be specific to the strain in question, and not represent a generally relevant response. In this sense,
transcriptome comparisons of different strains under the same experimental conditions (regarding time
point, medium composition etc.) might represent a more reliable system for inferring biological
meaning, since only the genetic background will provide the basis for differences in physiological or
phenotypic changes. Using different strains in comparative transcriptome analyses represents an
inherent control system that is self-standardized to limit ‘noisy’ outputs.
7.4.4 Functional categorization of expressed proteins
For comparisons within a single experiment, the ratios of BM45 vs. VIN13 for both expressed genes
and proteins were determined and compared. To facilitate evaluation of the data, the protein-mRNA
pairs were categorized according to GO classification terms. The proteins identified in our analysis can
reasonably be considered as representative of the entire proteome as all functional categories are well
represented (i.e. approximately 160 proteins involved in energy and metabolism, 25 in cell cycle
regulation, 35 in cellular transport, 35 in cell rescue and defense, 80 in protein synthesis and 25 in
transcription). Furthermore, no bias towards any generic protein feature such as concentration or
hydrophobicity profiles were obvious in the data. In this section, two relevant categories are further
discussed as examples: Energy and metabolism as well as cell rescue and defense (Tables 1 and 2).
Ratios above 1.3 and below 0.77 are indicated in bold font to represent relatively large increases or
decreases in the abundance of transcript or protein for BM45 in comparison to VIN13. Missing values
indicate that no data was acquired for a particular protein at that time point.
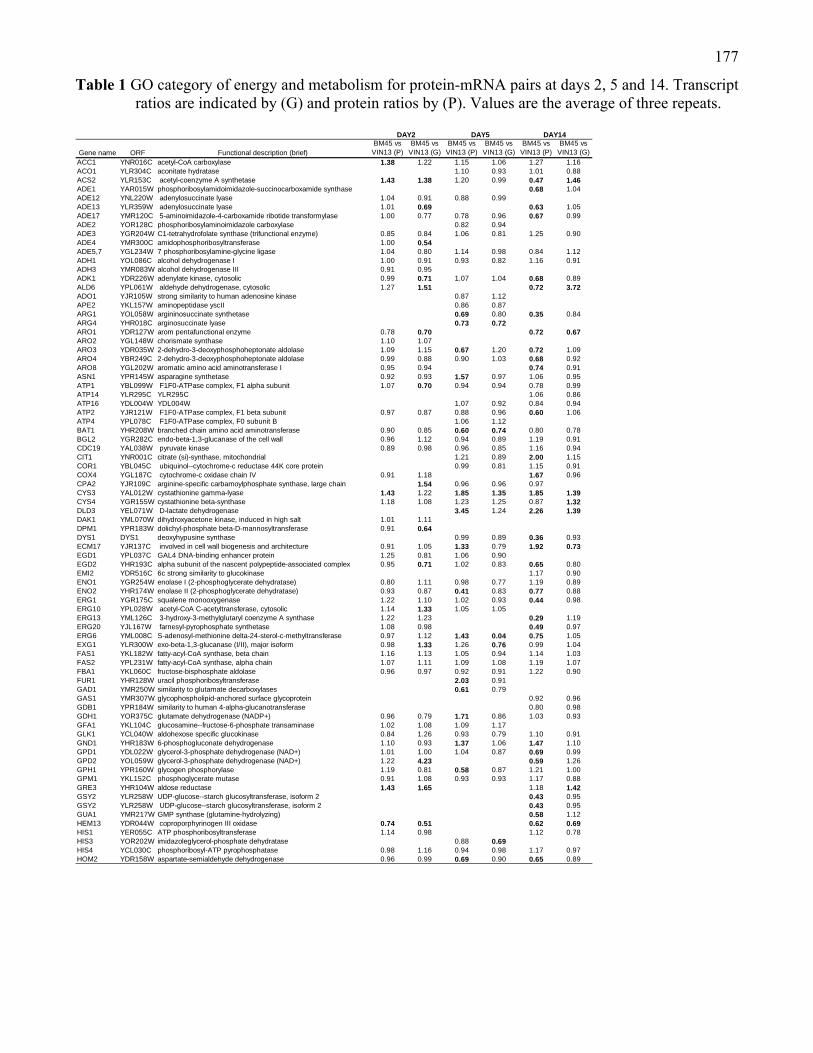
177
Table 1 GO category of energy and metabolism for protein-mRNA pairs at days 2, 5 and 14. Transcript ratios are indicated by (G) and protein ratios by (P). Values are the average of three repeats.
Gene name ORF Functional description (brief)BM45 vs
VIN13 (P)BM45 vs
VIN13 (G)BM45 vs
VIN13 (P)BM45 vs
VIN13 (G)BM45 vs
VIN13 (P)BM45 vs
VIN13 (G)ACC1 YNR016C acetyl-CoA carboxylase 1.38 1.22 1.15 1.06 1.27 1.16ACO1 YLR304C aconitate hydratase 1.10 0.93 1.01 0.88ACS2 YLR153C acetyl-coenzyme A synthetase 1.43 1.38 1.20 0.99 0.47 1.46ADE1 YAR015W phosphoribosylamidoimidazole-succinocarboxamide synthase 0.68 1.04ADE12 YNL220W adenylosuccinate lyase 1.04 0.91 0.88 0.99ADE13 YLR359W adenylosuccinate lyase 1.01 0.69 0.63 1.05ADE17 YMR120C 5-aminoimidazole-4-carboxamide ribotide transformylase 1.00 0.77 0.78 0.96 0.67 0.99ADE2 YOR128C phosphoribosylaminoimidazole carboxylase 0.82 0.94ADE3 YGR204W C1-tetrahydrofolate synthase (trifunctional enzyme) 0.85 0.84 1.06 0.81 1.25 0.90ADE4 YMR300C amidophosphoribosyltransferase 1.00 0.54ADE5,7 YGL234W 7 phosphoribosylamine-glycine ligase 1.04 0.80 1.14 0.98 0.84 1.12ADH1 YOL086C alcohol dehydrogenase I 1.00 0.91 0.93 0.82 1.16 0.91ADH3 YMR083W alcohol dehydrogenase III 0.91 0.95ADK1 YDR226W adenylate kinase, cytosolic 0.99 0.71 1.07 1.04 0.68 0.89ALD6 YPL061W aldehyde dehydrogenase, cytosolic 1.27 1.51 0.72 3.72ADO1 YJR105W strong similarity to human adenosine kinase 0.87 1.12APE2 YKL157W aminopeptidase yscII 0.86 0.87ARG1 YOL058W argininosuccinate synthetase 0.69 0.80 0.35 0.84ARG4 YHR018C arginosuccinate lyase 0.73 0.72ARO1 YDR127W arom pentafunctional enzyme 0.78 0.70 0.72 0.67ARO2 YGL148W chorismate synthase 1.10 1.07ARO3 YDR035W 2-dehydro-3-deoxyphosphoheptonate aldolase 1.09 1.15 0.67 1.20 0.72 1.09ARO4 YBR249C 2-dehydro-3-deoxyphosphoheptonate aldolase 0.99 0.88 0.90 1.03 0.68 0.92ARO8 YGL202W aromatic amino acid aminotransferase I 0.95 0.94 0.74 0.91ASN1 YPR145W asparagine synthetase 0.92 0.93 1.57 0.97 1.06 0.95ATP1 YBL099W F1F0-ATPase complex, F1 alpha subunit 1.07 0.70 0.94 0.94 0.78 0.99ATP14 YLR295C YLR295C 1.06 0.86ATP16 YDL004W YDL004W 1.07 0.92 0.84 0.94ATP2 YJR121W F1F0-ATPase complex, F1 beta subunit 0.97 0.87 0.88 0.96 0.60 1.06ATP4 YPL078C F1F0-ATPase complex, F0 subunit B 1.06 1.12BAT1 YHR208W branched chain amino acid aminotransferase 0.90 0.85 0.60 0.74 0.80 0.78BGL2 YGR282C endo-beta-1,3-glucanase of the cell wall 0.96 1.12 0.94 0.89 1.19 0.91CDC19 YAL038W pyruvate kinase 0.89 0.98 0.96 0.85 1.16 0.94CIT1 YNR001C citrate (si)-synthase, mitochondrial 1.21 0.89 2.00 1.15COR1 YBL045C ubiquinol--cytochrome-c reductase 44K core protein 0.99 0.81 1.15 0.91COX4 YGL187C cytochrome-c oxidase chain IV 0.91 1.18 1.67 0.96CPA2 YJR109C arginine-specific carbamoylphosphate synthase, large chain 1.54 0.96 0.96 0.97CYS3 YAL012W cystathionine gamma-lyase 1.43 1.22 1.85 1.35 1.85 1.39CYS4 YGR155W cystathionine beta-synthase 1.18 1.08 1.23 1.25 0.87 1.32DLD3 YEL071W D-lactate dehydrogenase 3.45 1.24 2.26 1.39DAK1 YML070W dihydroxyacetone kinase, induced in high salt 1.01 1.11DPM1 YPR183W dolichyl-phosphate beta-D-mannosyltransferase 0.91 0.64DYS1 DYS1 deoxyhypusine synthase 0.99 0.89 0.36 0.93ECM17 YJR137C involved in cell wall biogenesis and architecture 0.91 1.05 1.33 0.79 1.92 0.73EGD1 YPL037C GAL4 DNA-binding enhancer protein 1.25 0.81 1.06 0.90EGD2 YHR193C alpha subunit of the nascent polypeptide-associated complex 0.95 0.71 1.02 0.83 0.65 0.80EMI2 YDR516C 6c strong similarity to glucokinase 1.17 0.90ENO1 YGR254W enolase I (2-phosphoglycerate dehydratase) 0.80 1.11 0.98 0.77 1.19 0.89ENO2 YHR174W enolase II (2-phosphoglycerate dehydratase) 0.93 0.87 0.41 0.83 0.77 0.88ERG1 YGR175C squalene monooxygenase 1.22 1.10 1.02 0.93 0.44 0.98ERG10 YPL028W acetyl-CoA C-acetyltransferase, cytosolic 1.14 1.33 1.05 1.05ERG13 YML126C 3-hydroxy-3-methylglutaryl coenzyme A synthase 1.22 1.23 0.29 1.19ERG20 YJL167W farnesyl-pyrophosphate synthetase 1.08 0.98 0.49 0.97ERG6 YML008C S-adenosyl-methionine delta-24-sterol-c-methyltransferase 0.97 1.12 1.43 0.04 0.75 1.05EXG1 YLR300W exo-beta-1,3-glucanase (I/II), major isoform 0.98 1.33 1.26 0.76 0.99 1.04FAS1 YKL182W fatty-acyl-CoA synthase, beta chain 1.16 1.13 1.05 0.94 1.14 1.03FAS2 YPL231W fatty-acyl-CoA synthase, alpha chain 1.07 1.11 1.09 1.08 1.19 1.07FBA1 YKL060C fructose-bisphosphate aldolase 0.96 0.97 0.92 0.91 1.22 0.90FUR1 YHR128W uracil phosphoribosyltransferase 2.03 0.91GAD1 YMR250W similarity to glutamate decarboxylases 0.61 0.79GAS1 YMR307W glycophospholipid-anchored surface glycoprotein 0.92 0.96GDB1 YPR184W similarity to human 4-alpha-glucanotransferase 0.80 0.98GDH1 YOR375C glutamate dehydrogenase (NADP+) 0.96 0.79 1.71 0.86 1.03 0.93GFA1 YKL104C glucosamine--fructose-6-phosphate transaminase 1.02 1.08 1.09 1.17GLK1 YCL040W aldohexose specific glucokinase 0.84 1.26 0.93 0.79 1.10 0.91GND1 YHR183W 6-phosphogluconate dehydrogenase 1.10 0.93 1.37 1.06 1.47 1.10GPD1 YDL022W glycerol-3-phosphate dehydrogenase (NAD+) 1.01 1.00 1.04 0.87 0.69 0.99GPD2 YOL059W glycerol-3-phosphate dehydrogenase (NAD+) 1.22 4.23 0.59 1.26GPH1 YPR160W glycogen phosphorylase 1.19 0.81 0.58 0.87 1.21 1.00GPM1 YKL152C phosphoglycerate mutase 0.91 1.08 0.93 0.93 1.17 0.88GRE3 YHR104W aldose reductase 1.43 1.65 1.18 1.42GSY2 YLR258W UDP-glucose--starch glucosyltransferase, isoform 2 0.43 0.95GSY2 YLR258W UDP-glucose--starch glucosyltransferase, isoform 2 0.43 0.95GUA1 YMR217W GMP synthase (glutamine-hydrolyzing) 0.58 1.12HEM13 YDR044W coproporphyrinogen III oxidase 0.74 0.51 0.62 0.69HIS1 YER055C ATP phosphoribosyltransferase 1.14 0.98 1.12 0.78HIS3 YOR202W imidazoleglycerol-phosphate dehydratase 0.88 0.69HIS4 YCL030C phosphoribosyl-ATP pyrophosphatase 0.98 1.16 0.94 0.98 1.17 0.97HOM2 YDR158W aspartate-semialdehyde dehydrogenase 0.96 0.99 0.69 0.90 0.65 0.89
DAY2 DAY5 DAY14
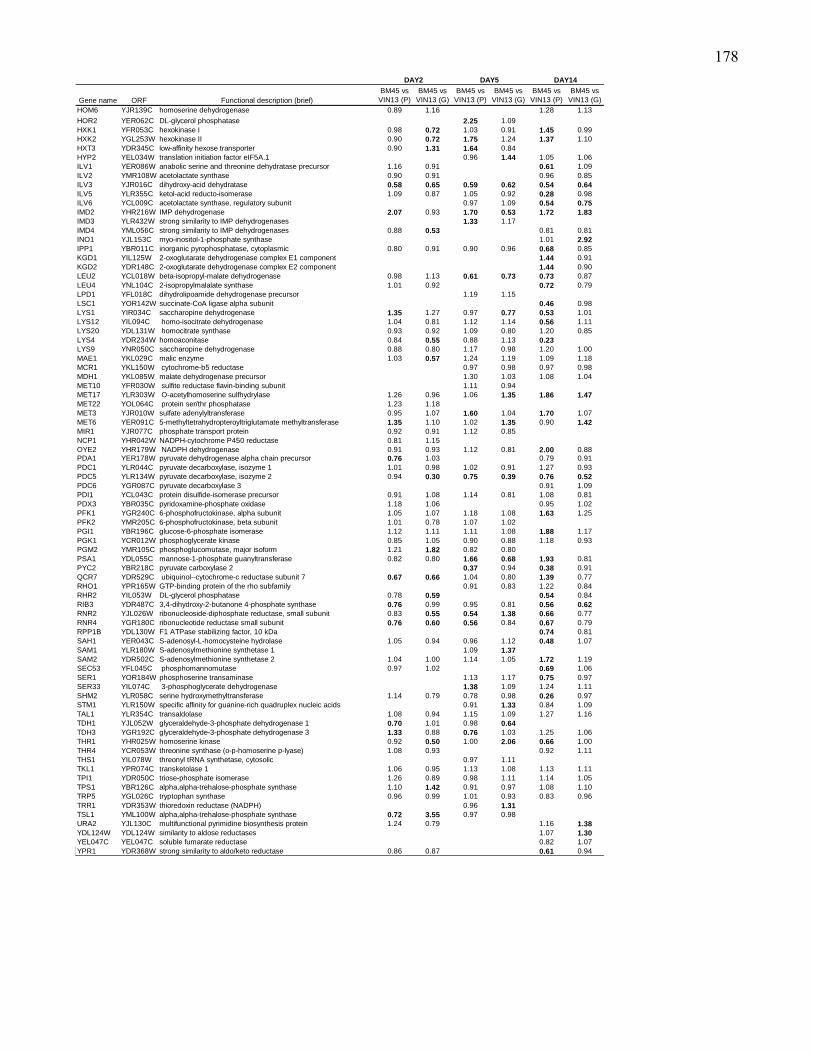
178
Gene name ORF Functional description (brief)BM45 vs
VIN13 (P)BM45 vs
VIN13 (G)BM45 vs
VIN13 (P)BM45 vs
VIN13 (G)BM45 vs
VIN13 (P)BM45 vs
VIN13 (G)HOM6 YJR139C homoserine dehydrogenase 0.89 1.16 1.28 1.13HOR2 YER062C DL-glycerol phosphatase 2.25 1.09HXK1 YFR053C hexokinase I 0.98 0.72 1.03 0.91 1.45 0.99HXK2 YGL253W hexokinase II 0.90 0.72 1.75 1.24 1.37 1.10HXT3 YDR345C low-affinity hexose transporter 0.90 1.31 1.64 0.84HYP2 YEL034W translation initiation factor eIF5A.1 0.96 1.44 1.05 1.06ILV1 YER086W anabolic serine and threonine dehydratase precursor 1.16 0.91 0.61 1.09ILV2 YMR108W acetolactate synthase 0.90 0.91 0.96 0.85ILV3 YJR016C dihydroxy-acid dehydratase 0.58 0.65 0.59 0.62 0.54 0.64ILV5 YLR355C ketol-acid reducto-isomerase 1.09 0.87 1.05 0.92 0.28 0.98ILV6 YCL009C acetolactate synthase, regulatory subunit 0.97 1.09 0.54 0.75IMD2 YHR216W IMP dehydrogenase 2.07 0.93 1.70 0.53 1.72 1.83IMD3 YLR432W strong similarity to IMP dehydrogenases 1.33 1.17IMD4 YML056C strong similarity to IMP dehydrogenases 0.88 0.53 0.81 0.81INO1 YJL153C myo-inositol-1-phosphate synthase 1.01 2.92IPP1 YBR011C inorganic pyrophosphatase, cytoplasmic 0.80 0.91 0.90 0.96 0.68 0.85KGD1 YIL125W 2-oxoglutarate dehydrogenase complex E1 component 1.44 0.91KGD2 YDR148C 2-oxoglutarate dehydrogenase complex E2 component 1.44 0.90LEU2 YCL018W beta-isopropyl-malate dehydrogenase 0.98 1.13 0.61 0.73 0.73 0.87LEU4 YNL104C 2-isopropylmalalate synthase 1.01 0.92 0.72 0.79LPD1 YFL018C dihydrolipoamide dehydrogenase precursor 1.19 1.15LSC1 YOR142W succinate-CoA ligase alpha subunit 0.46 0.98LYS1 YIR034C saccharopine dehydrogenase 1.35 1.27 0.97 0.77 0.53 1.01LYS12 YIL094C homo-isocitrate dehydrogenase 1.04 0.81 1.12 1.14 0.56 1.11LYS20 YDL131W homocitrate synthase 0.93 0.92 1.09 0.80 1.20 0.85LYS4 YDR234W homoaconitase 0.84 0.55 0.88 1.13 0.23LYS9 YNR050C saccharopine dehydrogenase 0.88 0.80 1.17 0.98 1.20 1.00MAE1 YKL029C malic enzyme 1.03 0.57 1.24 1.19 1.09 1.18MCR1 YKL150W cytochrome-b5 reductase 0.97 0.98 0.97 0.98MDH1 YKL085W malate dehydrogenase precursor 1.30 1.03 1.08 1.04MET10 YFR030W sulfite reductase flavin-binding subunit 1.11 0.94MET17 YLR303W O-acetylhomoserine sulfhydrylase 1.26 0.96 1.06 1.35 1.86 1.47MET22 YOL064C protein ser/thr phosphatase 1.23 1.18MET3 YJR010W sulfate adenylyltransferase 0.95 1.07 1.60 1.04 1.70 1.07MET6 YER091C 5-methyltetrahydropteroyltriglutamate methyltransferase 1.35 1.10 1.02 1.35 0.90 1.42MIR1 YJR077C phosphate transport protein 0.92 0.91 1.12 0.85NCP1 YHR042W NADPH-cytochrome P450 reductase 0.81 1.15OYE2 YHR179W NADPH dehydrogenase 0.91 0.93 1.12 0.81 2.00 0.88PDA1 YER178W pyruvate dehydrogenase alpha chain precursor 0.76 1.03 0.79 0.91PDC1 YLR044C pyruvate decarboxylase, isozyme 1 1.01 0.98 1.02 0.91 1.27 0.93PDC5 YLR134W pyruvate decarboxylase, isozyme 2 0.94 0.30 0.75 0.39 0.76 0.52PDC6 YGR087C pyruvate decarboxylase 3 0.91 1.09PDI1 YCL043C protein disulfide-isomerase precursor 0.91 1.08 1.14 0.81 1.08 0.81PDX3 YBR035C pyridoxamine-phosphate oxidase 1.18 1.06 0.95 1.02PFK1 YGR240C 6-phosphofructokinase, alpha subunit 1.05 1.07 1.18 1.08 1.63 1.25PFK2 YMR205C 6-phosphofructokinase, beta subunit 1.01 0.78 1.07 1.02PGI1 YBR196C glucose-6-phosphate isomerase 1.12 1.11 1.11 1.08 1.88 1.17PGK1 YCR012W phosphoglycerate kinase 0.85 1.05 0.90 0.88 1.18 0.93PGM2 YMR105C phosphoglucomutase, major isoform 1.21 1.82 0.82 0.80PSA1 YDL055C mannose-1-phosphate guanyltransferase 0.82 0.80 1.66 0.68 1.93 0.81PYC2 YBR218C pyruvate carboxylase 2 0.37 0.94 0.38 0.91QCR7 YDR529C ubiquinol--cytochrome-c reductase subunit 7 0.67 0.66 1.04 0.80 1.39 0.77RHO1 YPR165W GTP-binding protein of the rho subfamily 0.91 0.83 1.22 0.84RHR2 YIL053W DL-glycerol phosphatase 0.78 0.59 0.54 0.84RIB3 YDR487C 3,4-dihydroxy-2-butanone 4-phosphate synthase 0.76 0.99 0.95 0.81 0.56 0.62RNR2 YJL026W ribonucleoside-diphosphate reductase, small subunit 0.83 0.55 0.54 1.38 0.66 0.77RNR4 YGR180C ribonucleotide reductase small subunit 0.76 0.60 0.56 0.84 0.67 0.79RPP1B YDL130W F1 ATPase stabilizing factor, 10 kDa 0.74 0.81SAH1 YER043C S-adenosyl-L-homocysteine hydrolase 1.05 0.94 0.96 1.12 0.48 1.07SAM1 YLR180W S-adenosylmethionine synthetase 1 1.09 1.37SAM2 YDR502C S-adenosylmethionine synthetase 2 1.04 1.00 1.14 1.05 1.72 1.19SEC53 YFL045C phosphomannomutase 0.97 1.02 0.69 1.06SER1 YOR184W phosphoserine transaminase 1.13 1.17 0.75 0.97SER33 YIL074C 3-phosphoglycerate dehydrogenase 1.38 1.09 1.24 1.11SHM2 YLR058C serine hydroxymethyltransferase 1.14 0.79 0.78 0.98 0.26 0.97STM1 YLR150W specific affinity for guanine-rich quadruplex nucleic acids 0.91 1.33 0.84 1.09TAL1 YLR354C transaldolase 1.08 0.94 1.15 1.09 1.27 1.16TDH1 YJL052W glyceraldehyde-3-phosphate dehydrogenase 1 0.70 1.01 0.98 0.64TDH3 YGR192C glyceraldehyde-3-phosphate dehydrogenase 3 1.33 0.88 0.76 1.03 1.25 1.06THR1 YHR025W homoserine kinase 0.92 0.50 1.00 2.06 0.66 1.00THR4 YCR053W threonine synthase (o-p-homoserine p-lyase) 1.08 0.93 0.92 1.11THS1 YIL078W threonyl tRNA synthetase, cytosolic 0.97 1.11TKL1 YPR074C transketolase 1 1.06 0.95 1.13 1.08 1.13 1.11TPI1 YDR050C triose-phosphate isomerase 1.26 0.89 0.98 1.11 1.14 1.05TPS1 YBR126C alpha,alpha-trehalose-phosphate synthase 1.10 1.42 0.91 0.97 1.08 1.10TRP5 YGL026C tryptophan synthase 0.96 0.99 1.01 0.93 0.83 0.96TRR1 YDR353W thioredoxin reductase (NADPH) 0.96 1.31TSL1 YML100W alpha,alpha-trehalose-phosphate synthase 0.72 3.55 0.97 0.98URA2 YJL130C multifunctional pyrimidine biosynthesis protein 1.24 0.79 1.16 1.38YDL124W YDL124W similarity to aldose reductases 1.07 1.30YEL047C YEL047C soluble fumarate reductase 0.82 1.07YPR1 YDR368W strong similarity to aldo/keto reductase 0.86 0.87 0.61 0.94
DAY2 DAY5 DAY14
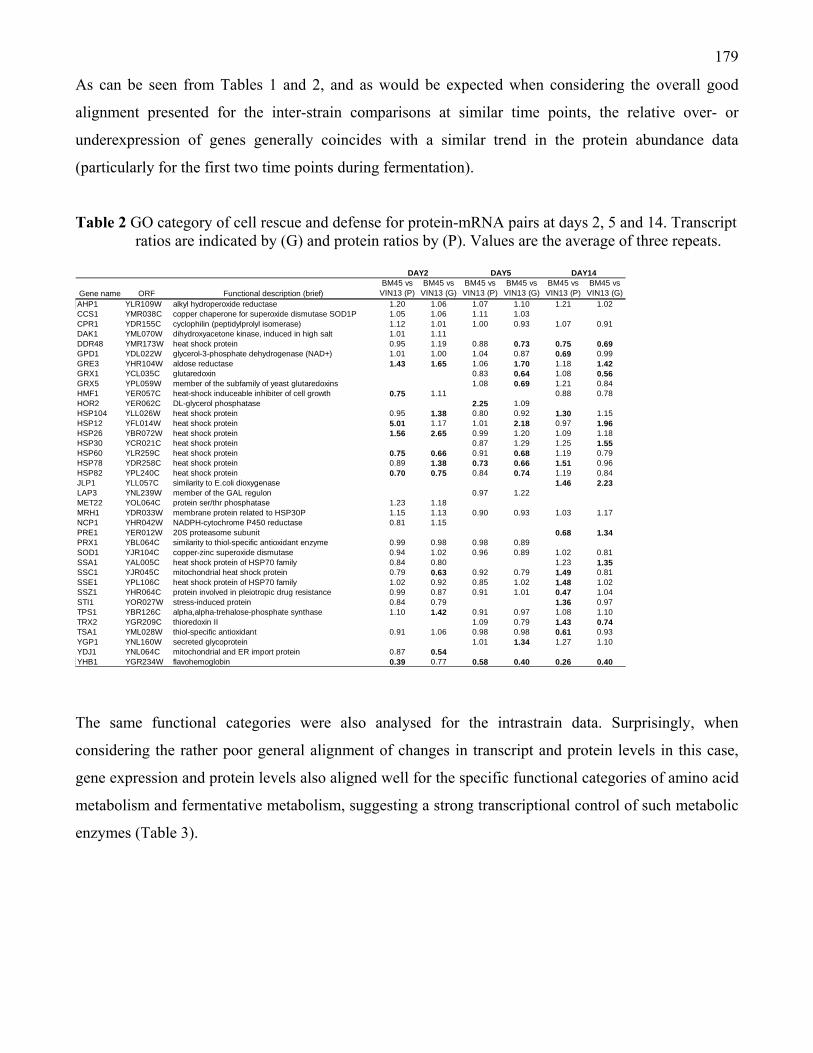
179
As can be seen from Tables 1 and 2, and as would be expected when considering the overall good
alignment presented for the inter-strain comparisons at similar time points, the relative over- or
underexpression of genes generally coincides with a similar trend in the protein abundance data
(particularly for the first two time points during fermentation).
Table 2 GO category of cell rescue and defense for protein-mRNA pairs at days 2, 5 and 14. Transcript ratios are indicated by (G) and protein ratios by (P). Values are the average of three repeats.
Gene name ORF Functional description (brief)BM45 vs
VIN13 (P)BM45 vs
VIN13 (G)BM45 vs
VIN13 (P)BM45 vs
VIN13 (G)BM45 vs
VIN13 (P)BM45 vs
VIN13 (G)AHP1 YLR109W alkyl hydroperoxide reductase 1.20 1.06 1.07 1.10 1.21 1.02CCS1 YMR038C copper chaperone for superoxide dismutase SOD1P 1.05 1.06 1.11 1.03CPR1 YDR155C cyclophilin (peptidylprolyl isomerase) 1.12 1.01 1.00 0.93 1.07 0.91DAK1 YML070W dihydroxyacetone kinase, induced in high salt 1.01 1.11DDR48 YMR173W heat shock protein 0.95 1.19 0.88 0.73 0.75 0.69GPD1 YDL022W glycerol-3-phosphate dehydrogenase (NAD+) 1.01 1.00 1.04 0.87 0.69 0.99GRE3 YHR104W aldose reductase 1.43 1.65 1.06 1.70 1.18 1.42GRX1 YCL035C glutaredoxin 0.83 0.64 1.08 0.56GRX5 YPL059W member of the subfamily of yeast glutaredoxins 1.08 0.69 1.21 0.84HMF1 YER057C heat-shock induceable inhibiter of cell growth 0.75 1.11 0.88 0.78HOR2 YER062C DL-glycerol phosphatase 2.25 1.09HSP104 YLL026W heat shock protein 0.95 1.38 0.80 0.92 1.30 1.15HSP12 YFL014W heat shock protein 5.01 1.17 1.01 2.18 0.97 1.96HSP26 YBR072W heat shock protein 1.56 2.65 0.99 1.20 1.09 1.18HSP30 YCR021C heat shock protein 0.87 1.29 1.25 1.55HSP60 YLR259C heat shock protein 0.75 0.66 0.91 0.68 1.19 0.79HSP78 YDR258C heat shock protein 0.89 1.38 0.73 0.66 1.51 0.96HSP82 YPL240C heat shock protein 0.70 0.75 0.84 0.74 1.19 0.84JLP1 YLL057C similarity to E.coli dioxygenase 1.46 2.23LAP3 YNL239W member of the GAL regulon 0.97 1.22MET22 YOL064C protein ser/thr phosphatase 1.23 1.18MRH1 YDR033W membrane protein related to HSP30P 1.15 1.13 0.90 0.93 1.03 1.17NCP1 YHR042W NADPH-cytochrome P450 reductase 0.81 1.15PRE1 YER012W 20S proteasome subunit 0.68 1.34PRX1 YBL064C similarity to thiol-specific antioxidant enzyme 0.99 0.98 0.98 0.89SOD1 YJR104C copper-zinc superoxide dismutase 0.94 1.02 0.96 0.89 1.02 0.81SSA1 YAL005C heat shock protein of HSP70 family 0.84 0.80 1.23 1.35SSC1 YJR045C mitochondrial heat shock protein 0.79 0.63 0.92 0.79 1.49 0.81SSE1 YPL106C heat shock protein of HSP70 family 1.02 0.92 0.85 1.02 1.48 1.02SSZ1 YHR064C protein involved in pleiotropic drug resistance 0.99 0.87 0.91 1.01 0.47 1.04STI1 YOR027W stress-induced protein 0.84 0.79 1.36 0.97TPS1 YBR126C alpha,alpha-trehalose-phosphate synthase 1.10 1.42 0.91 0.97 1.08 1.10TRX2 YGR209C thioredoxin II 1.09 0.79 1.43 0.74TSA1 YML028W thiol-specific antioxidant 0.91 1.06 0.98 0.98 0.61 0.93YGP1 YNL160W secreted glycoprotein 1.01 1.34 1.27 1.10YDJ1 YNL064C mitochondrial and ER import protein 0.87 0.54YHB1 YGR234W flavohemoglobin 0.39 0.77 0.58 0.40 0.26 0.40
DAY2 DAY5 DAY14
The same functional categories were also analysed for the intrastrain data. Surprisingly, when
considering the rather poor general alignment of changes in transcript and protein levels in this case,
gene expression and protein levels also aligned well for the specific functional categories of amino acid
metabolism and fermentative metabolism, suggesting a strong transcriptional control of such metabolic
enzymes (Table 3).
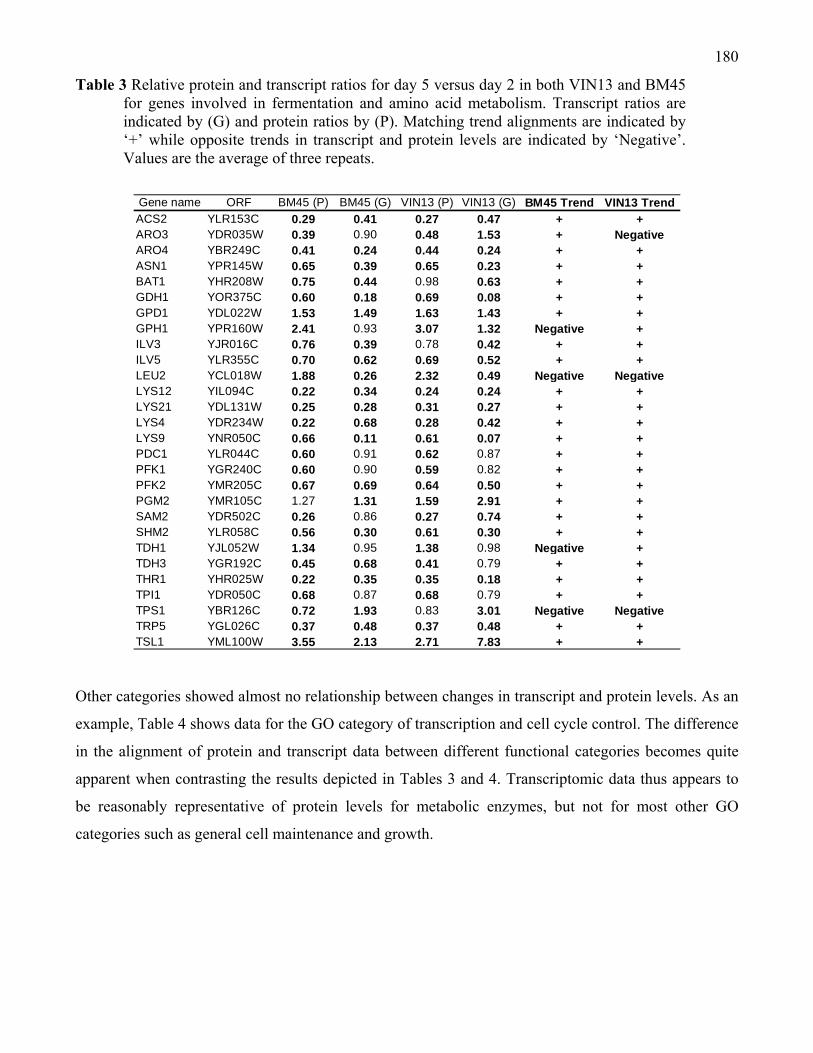
180
Table 3 Relative protein and transcript ratios for day 5 versus day 2 in both VIN13 and BM45 for genes involved in fermentation and amino acid metabolism. Transcript ratios are indicated by (G) and protein ratios by (P). Matching trend alignments are indicated by ‘+’ while opposite trends in transcript and protein levels are indicated by ‘Negative’. Values are the average of three repeats.
Gene name ORF BM45 (P) BM45 (G) VIN13 (P) VIN13 (G) BM45 Trend VIN13 TrendACS2 YLR153C 0.29 0.41 0.27 0.47 + +ARO3 YDR035W 0.39 0.90 0.48 1.53 + NegativeARO4 YBR249C 0.41 0.24 0.44 0.24 + +ASN1 YPR145W 0.65 0.39 0.65 0.23 + +BAT1 YHR208W 0.75 0.44 0.98 0.63 + +GDH1 YOR375C 0.60 0.18 0.69 0.08 + +GPD1 YDL022W 1.53 1.49 1.63 1.43 + +GPH1 YPR160W 2.41 0.93 3.07 1.32 Negative +ILV3 YJR016C 0.76 0.39 0.78 0.42 + +ILV5 YLR355C 0.70 0.62 0.69 0.52 + +LEU2 YCL018W 1.88 0.26 2.32 0.49 Negative NegativeLYS12 YIL094C 0.22 0.34 0.24 0.24 + +LYS21 YDL131W 0.25 0.28 0.31 0.27 + +LYS4 YDR234W 0.22 0.68 0.28 0.42 + +LYS9 YNR050C 0.66 0.11 0.61 0.07 + +PDC1 YLR044C 0.60 0.91 0.62 0.87 + +PFK1 YGR240C 0.60 0.90 0.59 0.82 + +PFK2 YMR205C 0.67 0.69 0.64 0.50 + +PGM2 YMR105C 1.27 1.31 1.59 2.91 + +SAM2 YDR502C 0.26 0.86 0.27 0.74 + +SHM2 YLR058C 0.56 0.30 0.61 0.30 + +TDH1 YJL052W 1.34 0.95 1.38 0.98 Negative +TDH3 YGR192C 0.45 0.68 0.41 0.79 + +THR1 YHR025W 0.22 0.35 0.35 0.18 + +TPI1 YDR050C 0.68 0.87 0.68 0.79 + +TPS1 YBR126C 0.72 1.93 0.83 3.01 Negative NegativeTRP5 YGL026C 0.37 0.48 0.37 0.48 + +TSL1 YML100W 3.55 2.13 2.71 7.83 + +
Other categories showed almost no relationship between changes in transcript and protein levels. As an
example, Table 4 shows data for the GO category of transcription and cell cycle control. The difference
in the alignment of protein and transcript data between different functional categories becomes quite
apparent when contrasting the results depicted in Tables 3 and 4. Transcriptomic data thus appears to
be reasonably representative of protein levels for metabolic enzymes, but not for most other GO
categories such as general cell maintenance and growth.
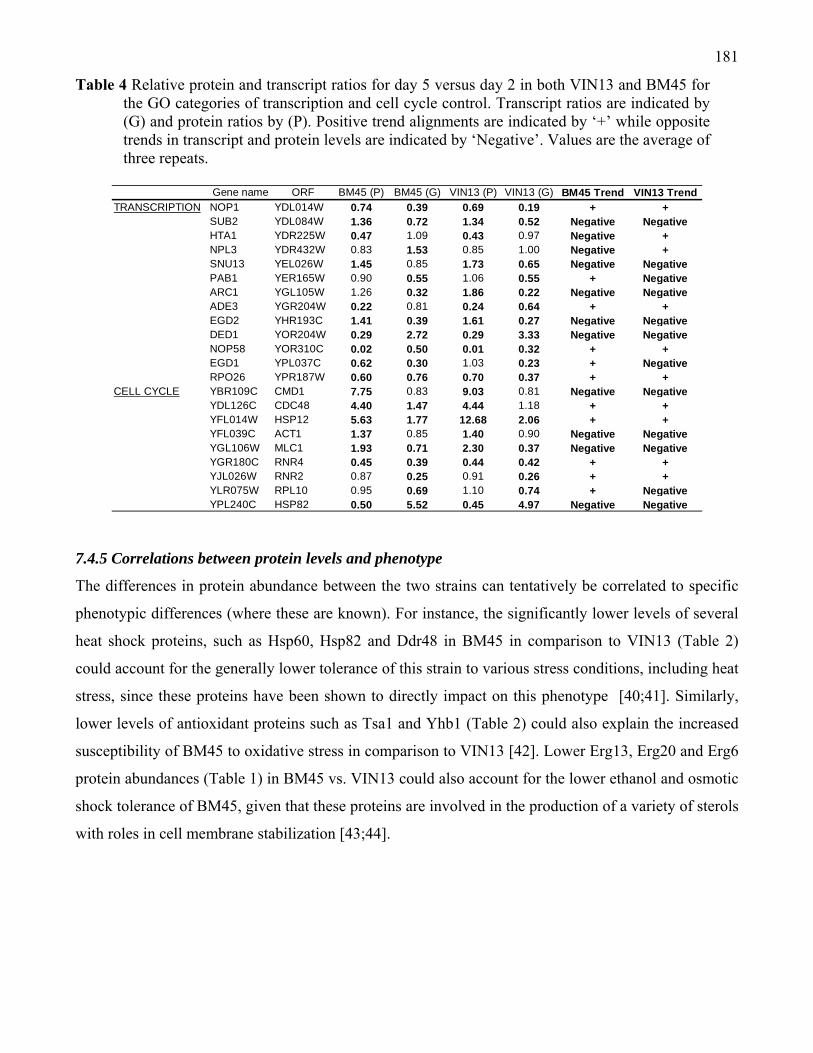
181
Table 4 Relative protein and transcript ratios for day 5 versus day 2 in both VIN13 and BM45 for the GO categories of transcription and cell cycle control. Transcript ratios are indicated by (G) and protein ratios by (P). Positive trend alignments are indicated by ‘+’ while opposite trends in transcript and protein levels are indicated by ‘Negative’. Values are the average of three repeats.
Gene name ORF BM45 (P) BM45 (G) VIN13 (P) VIN13 (G) BM45 Trend VIN13 Trend
TRANSCRIPTION NOP1 YDL014W 0.74 0.39 0.69 0.19 + +SUB2 YDL084W 1.36 0.72 1.34 0.52 Negative NegativeHTA1 YDR225W 0.47 1.09 0.43 0.97 Negative +NPL3 YDR432W 0.83 1.53 0.85 1.00 Negative +SNU13 YEL026W 1.45 0.85 1.73 0.65 Negative NegativePAB1 YER165W 0.90 0.55 1.06 0.55 + NegativeARC1 YGL105W 1.26 0.32 1.86 0.22 Negative NegativeADE3 YGR204W 0.22 0.81 0.24 0.64 + +EGD2 YHR193C 1.41 0.39 1.61 0.27 Negative NegativeDED1 YOR204W 0.29 2.72 0.29 3.33 Negative NegativeNOP58 YOR310C 0.02 0.50 0.01 0.32 + +EGD1 YPL037C 0.62 0.30 1.03 0.23 + NegativeRPO26 YPR187W 0.60 0.76 0.70 0.37 + +
CELL CYCLE YBR109C CMD1 7.75 0.83 9.03 0.81 Negative NegativeYDL126C CDC48 4.40 1.47 4.44 1.18 + +YFL014W HSP12 5.63 1.77 12.68 2.06 + +YFL039C ACT1 1.37 0.85 1.40 0.90 Negative NegativeYGL106W MLC1 1.93 0.71 2.30 0.37 Negative NegativeYGR180C RNR4 0.45 0.39 0.44 0.42 + +YJL026W RNR2 0.87 0.25 0.91 0.26 + +YLR075W RPL10 0.95 0.69 1.10 0.74 + NegativeYPL240C HSP82 0.50 5.52 0.45 4.97 Negative Negative
7.4.5 Correlations between protein levels and phenotype
The differences in protein abundance between the two strains can tentatively be correlated to specific
phenotypic differences (where these are known). For instance, the significantly lower levels of several
heat shock proteins, such as Hsp60, Hsp82 and Ddr48 in BM45 in comparison to VIN13 (Table 2)
could account for the generally lower tolerance of this strain to various stress conditions, including heat
stress, since these proteins have been shown to directly impact on this phenotype [40;41]. Similarly,
lower levels of antioxidant proteins such as Tsa1 and Yhb1 (Table 2) could also explain the increased
susceptibility of BM45 to oxidative stress in comparison to VIN13 [42]. Lower Erg13, Erg20 and Erg6
protein abundances (Table 1) in BM45 vs. VIN13 could also account for the lower ethanol and osmotic
shock tolerance of BM45, given that these proteins are involved in the production of a variety of sterols
with roles in cell membrane stabilization [43;44].
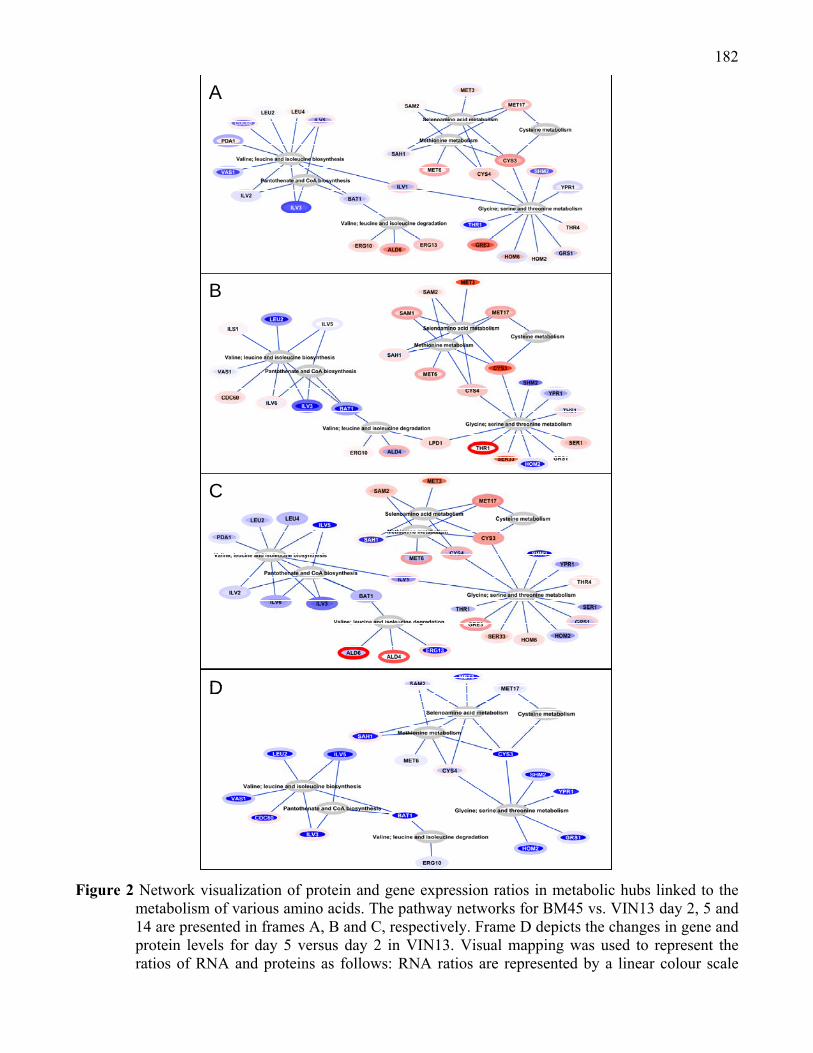
182
Figure 2 Network visualization of protein and gene expression ratios in metabolic hubs linked to the
metabolism of various amino acids. The pathway networks for BM45 vs. VIN13 day 2, 5 and 14 are presented in frames A, B and C, respectively. Frame D depicts the changes in gene and protein levels for day 5 versus day 2 in VIN13. Visual mapping was used to represent the ratios of RNA and proteins as follows: RNA ratios are represented by a linear colour scale
A
B
C
D
A
B
C
A
B
C
D
183
assigned to the interior of each node and protein ratios are represented by a linear colour scale assigned to the border of each node. Both of the linear colour scales are constructed such that the maximum intensity is set to correspond to ratios equal to or above a positive or negative 2 fold difference between strains, or between time points within each strain. The blue scale represents negative ratios while the red scale represents positive ratios. White indicates a ratio of 1.0, i.e. no difference for that molecule.
On the metabolic front, the data indicate why the alignment of exometabolome and transcriptome data
has previously proven successful. Indeed, differences in the ratios of several proteins involved in the
synthesis of the aromatic amino acids (namely Aro1, Aro3, Aro4 and Aro8; Table 1) are reflected by
differences in the concentrations of the end-products of these pathways [8]. Likewise, Bat1 is involved
in catalyzing the first transamination step of the catabolic formation of fusel alcohols via the Ehrlich
pathway [45]. Differences in Bat1 expression (Figure 2; Table 1) has proven to effect large changes in
higher alcohol production by wine yeast strains [8]. BAT1 gene expression and Bat1 protein levels are
quite notably concordant (Figure 2), and the decrease in expression for BM45 relative to VIN13 agrees
with metabolite data showing significantly lower propanol, butanol and methanol production by BM45
in comparison to VIN13 [8]. In fact, this close alignment between transcript and protein levels appears
to be the case for almost all of the gene-protein pairs linked to the metabolism of the amino acids
shown in Figure 2, both at days 2 and 5, and even 14. From Figure 2 it is clear that there is a direct
correlation between transcript and protein abundance in central metabolic pathways, (such as those
pathways related to amino acid metabolism in this example).
Amino acid metabolism is of particular interest from a wine-making perspective as amino acids serve
as the precursors of important volatile aroma compounds. For instance, sulfur-containing amino acids
such as methionine (and cysteine to a lesser extent) are the precursors for the volatile thiols that are
significant aroma compounds in wine [46]. The branched chain amino acids such as valine, leucine and
isoleucine on the other hand, serve as the precursors for various higher alcohols. Of the enzymes
involved in branched chain amino acid metabolism, BAT1 has been discussed above.
Other genes that encode enzymes in this pathway and that were identified in our previous study [8] for
their strong statistical link between expression levels and the production of specific aroma compounds
include LEU2, encoding a beta-isopropylmalate dehydrogenase that catalyzes the third step in the
leucine biosynthesis pathway [47]. Expression of this gene showed a significant statistical correlation
with compounds such as isobutanol [8], and as can be seen from Figure 2, the relative transcript and
protein abundance ratios align well for this gene.

184
Of the genes involved in the metabolism of isoleucine and valine (precursors for higher alcohol
synthesis), the ILV gene family (ILV1, ILV2, ILV3, ILV5, and ILV6) encode isoforms of
acetohydroxyacid reductoisomerases involved in branched-chain amino acid biosynthesis [48].
Expression of the ILV gene isoforms showed strong positive correlations with many higher alcohols
analysed in a previous study, and expression differences between BM45 and VIN13 once again align
with differences in the exo-metabolite profiles of these two strains as reported by Rossouw et al. [8].
The ILV gene versus protein ratios are also well-aligned, again confirming the tight, concordant
regulation of transcript levels and enzyme abundance in key metabolic pathways.
In terms of intrastrain comparisons between time points, the alignment of changes in transcription and
protein abundance is also good when considering metabolic pathways such as those of amino acid
metabolism (Figure 2D). Although the intensity of the fold change differs for mRNA and proteins, the
overall trends match up well. From Figure 2D, it can be seen that there is a general down-regulation of
transcripts (and their corresponding proteins) involved in amino acid metabolism as fermentation
proceeds from the exponential growth phase (day 2) to early stationary phase (day 5). This is to be
expected, as day 5 heralds a fermentative phase characterized by continued high rates of fermentative
metabolism associated with a significant reduction in growth and biomass formation.
7.5 Conclusions Although our coverage of the yeast proteome was only around 5%, the identified proteins were
distributed over all functional categories. This suggests that the protein abundance data present a
sufficient coverage of the proteome to assess the biological relevance and reliability of the
transcriptome data. In our study, the alignment of relative protein abundance ratios with gene
expression data was accurate for data generated within a single iTRAQ experiment. This was mostly
true for the early stages of fermentation (days 2 and 5) when active cell growth and metabolism is
occurring. Also, alignment of protein and transcript levels within metabolic pathways specifically
proved to be extremely reliable. In the case of data comparisons across different iTRAQ experiments
the quality of gene expression to protein correlations deteriorates substantially. The reason for this
observation is that the alignment of transcript and protein datasets across specific time points is
naturally problematic due to the lag time between the expressed transcriptome and later changes in the
protein profile. Clearly transcriptomic studies involving analyses across different time points are
185
fraught with significant complication and therefore may be more difficult to interpret in a biologically
meaningful manner. On the other hand, comparison of transcription patterns in the context of different
genetic backgrounds appears to provide a reliable indication of the real molecular responses of the cells
to underlying genetic differences.
Overall, the close alignment of transcript and protein ratios in particularly interstrain comparisons gives
us great confidence in the quality and usability of our transcript data. Most notably, the concordance of
gene and protein levels of enzymes involved in metabolism confirms transcriptional control of at least
some of the important metabolic pathways in yeast. This implies that transcriptomic data can
theoretically be applied to evaluate and model certain aspects of yeast metabolism with relative
confidence. The agreement of protein abundance ratios between strains with the phenotypic
characteristics of these strains further strengthens our belief that the ‘omic’ datasets we have generated
provide valuable and reliable insights into the fundamental molecular mechanisms at work in industrial
wine yeast strains during alcoholic fermentation.
Acknowledgements Funding for the research presented in this paper was provided by the NRF and Winetech, and personal
sponsorship by the Wilhelm Frank Trust. Proteomic analysis was performed by Martin Middleditch at
the Centre for Genomics and Proteomics at the University of Auckland. We would also like to thank Jo
McBride and the Cape Town Centre for Proteomic and Genomic Research for the microarray
hybridization and the staff and students at the IWBT for their support and assistance in numerous areas.
References 1. Goffeau A, Barrell BG, Bussey H, Davis RW, Dujon B, Feldmann H, Galibert F, Hoheisel JD, Jacq
C, Johnston M, Louis EJ, Mewes HW, Murakami Y, Philippsen P, Tettelin H, Oliver SG: Life with
6000 genes. Science 1996, 274:546, 563-567.
2. Borneman AR, Forgan A, Pretorius IS, Chambers PJ: Comparative genome analysis of a
Saccharomyces cerevisiae wine strain. FEMS Yeast Res 2008, 8:1185-1195.
3. Bakalinsky AT, Snow R: The chromosomal constitution of wine strains of Saccharomyces
cerevisiae. Yeast 1990, 6:367– 382.
186
4. Ashby M, Rine J: Methods for drug screening. The Regents of the University of California.
Oakland, CA USA, 2006, Patent number: 5,569,588.
5. Marks VD, Ho Sui SJ, Erasmus D, van den Merwe GK, Brumm J, Wasserman WW, Bryan J, van
Vuuren HJJ: Dynamics of the yeast transcriptome during wine fermentation reveals a novel
fermentation stress response. FEMS Yeast Res 2008, 8:35-52.
6. Alexandre H, Ansanay-Galeote V, Dequin S, Blondin B: Global gene expression during short-
term ethanol stress in Saccharomyces cerevisiae. FEBS Lett 2001, 498:98–103.
7. Erasmus DJ, van der Merwe GK, van Vuuren HJJ: Genome-wide expression analyses: metabolic
adaptation of Saccharomyces cerevisiae to high sugar stress. FEMS Yeast Res 2003, 3:375–399.
8. Rossouw D, Naes T, Bauer FF: Linking gene regulation and the exo-metabolome: A
comparative transcriptomics approach to identify genes that impact on the production of
volatile aroma compounds in yeast. BMC Genomics 2008, 9: 530-548.
9. Griffin TJ, Gygi SP, Ideker T, Rist B, Eng J, Hood L, Aebersold R: Complementary profiling of
gene expression at the transcriptome and proteome levels in Saccharomyces cerevisiae. Mol Cell
Proteomics 2002, 1:323-333.
10. Washburn MP, Ulaszek R, Deciu C, Schielts DM, Yates JR: Analysis of quantitative proteomic
data generated via multidimensional protein identification technology. Anal Chem 2002,
74:1650-1657.
11. Daran-Lapujade P, Jansen ML, Daran JM, van Gulik W, de Winde JH, Pronk JT: Role of
transcriptional regulation in controlling fluxes in central carbon metabolism of Saccharomyces
cerevisiae. A chemostat culture study. J Biol Chem 2004, 279:9125-9138.
12. Tong AH, Drees B, Nardelli G, Bader GD, Brannetti B, Castagnoli L, Evangelista M, Ferracuti S,
Nelson B, Paoluzi S, Quondam M, Zucconi A, Hoque CW, Fields S, Boone C, Cesareni G: A
187
combined experimental and computational strategy to define protein interaction networks for
peptide recognition modules. Science 2002, 295:321-324.
13. Walhout AJ, Reboul J, Shtanko O, Bertin N, Vaglio P, Ge H, Lee H, Doucette-Stamm L, Gunsalus
KC, Schetter AJ, Morton DG, Kemphues KJ, Reinke V, Kim SK, Piano F, Vidal M: Integrating
interactome, phenome, and transcriptome mapping data for the C. elegans germline. Curr
Biol 2002, 12:1952-1958.
14. Smolka M, Zhou H, Aebersold R: Quantitative protein profiling using two-dimensional gel
electrophoresis, isotope-coded affinity tag labeling, and mass spectrometry. Mol Cell
Proteomics 2002, 1:19-29.
15. O’Farrell PH: High resolution two-dimensional electrophoresis of proteins. J Biol Chem 1997,
250:4007-4021.
16. Maillet I, Lagniel G, Perrot M, Boucherie H, Labarre: Rapid identification of yeast proteins on
two-dimensional gels. J Biol Chem 1996, 271:10263-10270.
17. Vido K, Spector D, Lagniel G, Lopez S, Toledano MB, Labarre J: A proteome analysis of the
cadmium response in Saccharomyces cerevisiae. J Biol Chem 2001, 276:8469-8474.
18. Kobi D, Zugmeyer S, Potier S, Jaquet-Gutfreund L: Two-dimensional map of an “ale”-brewing
yeast strain: proteome dynamics during fermentation. FEMS Yeast Res 2004, 5:213-230.
19. Brejning J, Arneborg N, Jespersen L: Identification of genes and proteins induced during the
lag and early exponential phase of lager brewing yeasts. J Appl Microbiol 2005, 98:261-271.
20. Salvadó Z, Chiva R, Rodríguez-Vargas S, Rández-Gil F, Mas A, Guillamón JM: Proteomic
evolution of a wine yeast during the first hours of fermentation. FEMS Yeast Res 2008, 8:1137-
1146.
188
21. Trabalzini L, Paffeti A, Scaloni A, Talamo F, Ferro E, Coratza G, Bovalini L, Lusini P, Martelli P,
Santucci A: Proteomic response to physiological fermentation stresses in a wild-type wine
strain of Saccharomyces cerevisiae. Biochem J 2003, 370:35-46.
22. Fey SJ, Larsen PM: 2D or not 2D. Two-dimensional gel electrophoresis. Curr Opin Chem Biol
2001, 5:26-33.
23. Rabilloud T: Two-dimensional gel electrophoresis in proteomics: old, old fashioned, but it still
climbs the mountains. Proteomics 2002, 2:3-10.
24. Mann M, Hendricksen RC, Pandey A: Analysis of proteins and proteomes by mass
spectrometry. Annu Rev Biochem 2001, 70:437-473.
25. Nägele E, Vollmer M, Hörth P: Improved 2D nano-LC/MS for proteomics pplications: A
comparative analysis using yeast proteome. J Biomol Tech 2004, 15:134-143.
26. Peng J, Elias JE, Thoreen CC, Licklider LJ, Gygi SP: Evaluation of multidimensional
chromatography coupled with tandem mass spectrometry (LC/LC-MS/MS) for large-scale
protein analysis: The yeast proteome. J Proteome Res 2002, 2:43-50.
27. de Godoy LMF, Olsen JV, Cox J, Nielsen ML, Hubner NC, Fröhlich F, Walther TC, Mann M:
Comprehensive mass-spectrometry-based proteome quantification of haploid versus diploid
yeast. Nature 2008, 55:1251-1255.
28. Kolkman A, Daran-Lapujade P, Fullaondo A, Olsthoorn MMA, Pronk JT, Slijper M, Heck AJR:
Proteome analysis if yeast response to various nutrient limitations. Mol Sys Biol 2006, 2:0026.
29. Chen X, Sun LW, Yu YP, Xue Y, Yang P: Amino acid-coded tagging approaches in
quantitative proteomics. Expert Rev Proteomics 2007, 4:25-37.
30. Aggarwal K, Choe LH, Lee KH: Quantitative analysis of protein expression using amine-
specific isobaric tags in Eschericia coli cells expressing rhsA elements. Proteomics 2005, 5:
2297-2308.
189
31. Bely L, Sablayrolles J, Barre P: Description of alcoholic fermentation kinetics: its variability
and significance. Am J Enol Viticult 1990, 40:319-324.
32. Abbott DA, Knijnenburg TA, de Poorter LM, Reinders MJ, Pronk JT, van Maris AJ: 2007 Generic
and specific transcriptional responses to different weak organic acids in anaerobic chemostat
cultures of Saccharomyces cerevisiae. FEMS Yeast Res 2007, 7:819-833.
33. Wu Z, Irizarry R, Gentleman R, Murillo FM, Spencer F: A Model-Based Background
Adjustment for Oligonucleotide Expression Arrays. Journal of the American Statistical
Association 2004, 99:909–917.
34. Kanehisa M, Araki M, Goto S, Hattori M, Hirakawa M, Itoh M, Katayama T, Kawashima S, Okuda
S, Tokimatsu T, Yamanishi Y: KEGG for linking genomes to life and the environment. Nucl
Acids Res 2008, 36:D480-D484.
35. Kanehisa M, Goto S, Hattori M, Aoki-Kinoshita KF, Itoh M, Kawashima S, Katayama T, Araki M,
Hirakawa M: From genomics to chemical genomics: new developments in KEGG. Nucl Acids
Res 2006, 34:D354-357.
36. Kanehisa M, Goto S: KEGG: Kyoto Encyclopedia of Genes and Genomes. Nucl Acids Res 2000,
28:27-30.
37. Shannon P, Markiel A, Ozier O, Baliga NS, Wang JT, Ramage D, Amin N, Schwikowski B, Ideker
T: Cytoscape: a software environment for integrated models of biomolecular interaction
networks. Genome Res 2003 11:2498-504.
38. Cline MS, Smoot M, Cerami E, Kuchinsky A, Landys N, Workman C, Christmas R, Avila-Campilo
I, Creech M, Gross B, Hanspers K, Isserlin R, Kelley R, Killcoyne S, Lotia S, Maere S, Morris J,
Ono K, Pavlovic V, Pico AR, Vailaya A, Wang PL, Adler A, Conklin BR, Hood L, Kuiper M,
Sander C, Schmulevich I, Schwikowski B, Warner GJ, Ideker T, Bader GD: Integration of
biological networks and gene expression data using Cytoscape. Nat Protoc 2007, 2:2366-82.
190
39. De Groot MJL, Daran-Lapujade P, van Breukelen B, Knijnenburg TA, de Hulster EAF, Reinders
MJT, Pronk JT, Heck JR, Slijper M: Quantitative proteomics and transcriptomics of anaerobic
and aerobic yeast cultures reveals post-transcriptional regulation of key cellular processes.
Microbiol 2007, 153:3864-3878.
40. Borkovich KA, Farrelly FW, Finkelstein DB, Taulien J, Lindquist S: hsp82 is an essential protein
that is required in higher concentrations for growth of cells at higher temperatures. Mol Cell
Biol 1989, 9:3919-3930.
41. Sanyal A, Harington A, Herbert CJ, Groudinsky O, Slonimsky PP, Tung B, Getz GS: Heat shock
protein HSP60 can alleviate the phenotype of mitochondrial RNA-deficient temperature-
sensitive mna2 pet mutants. Mol Gen Genet 1995, 246:56-64.
42. Wong CM, Zhou Y, Ng RW, Kung HF, Jin DY: Cooperation of yeast peroxiredoxins Tsa1p and
Tsa2p in the cellular defense against ocidative and nitrosative stress. J Biol Chem 277:5385-94.
43. Parks LW, Smith SJ, Crowley JH: Biochemical and physiological effects of sterol alterations in
yeast - a review. Lipids 1995, 30:227-230.
44. Yoshikawa K, Tanaka T, Furusawa C, Nagahisa K, Hirasawa T, Shimizu H: Comprehensive
phenotypic analysis for identification of genes affecting growth under ethanol stress in
Saccharomyces cerevisiae. FEMS Yeast Res 2009, 9:32-44.
45. Kispal G, Steiner H, Court DA, Rolinski B, Lill R: Mitochondrial and cytosolic branched chain
amino acid transaminases from yeast, homologs of the myc oncogene-regulated Eca39
protein. J Biol Chem 1996, 271:24458-24464.
46. Swiegers JH, Capone DL, Pardon KH, Elsey GM, Sefton MA, Francis IL & Pretorius IS:
Engineering volatile thiol release in Saccharomyces cerevisiae for improved wine aroma. Yeast
2002, 24:561-574.

191
47. Andreadis A, Hsu YP, Hermodson M, Kohlhaw G, Schimmel P: Yeast LEU2. Repression of
mRNA by leucine and primary structure of the gene product. J Biol Chem 1984, 259:8059-
8062.
48. Holmberg S, Petersen JG: Regulation of isoleucine-valine biosynthesis in Saccharomyces
cerevisiae. Cur Genet 1988, 13:207-217.

192
CChhaapptteerr 88
General discussion and conclusions
193
CHAPTER 8
General Discussion
The main goal of this project was to investigate the genetic factors underlying different fermentation
phenotypes and physiological adaptations of industrial wine yeast strains. Five industrial wine yeast
strains were phenotypically characterized and compared in terms of their fermentation capacity and
physiology, and subjected to transcriptional and exo-metabolomic profiling during alcoholic
fermentation in simulated wine-making conditions. Two of these strains were further characterized in
real grape must and on a proteomics level to assess to what degree the transcriptomic data provide
meaningful information regarding protein levels and changing environmental conditions.
Characterization of the five strains showed that there were significant differences in the complement of
volatile aroma compounds produced by these strains. Other noteworthy differences were also identified
experimentally, including (i) the ability of the different strains to tolerate key stress conditions such as
oxidative, osmotic and ethanol stress, (ii) adhesion properties related phenotypes such as flocculation,
invasive growth and mat formation, (iii) responses to starvation for different macronutrients such as
carbon, nitrogen, sulfur and phosphorous and (iv) intracellular concentrations of key glycolytic
metabolites.
The gene expression profiles of the five strains were systematically analyzed at three time points during
fermentation, corresponding to the exponential, early stationary and late stationary growth phases. As a
means to contextualize our data we evaluated the gene expression levels within the framework of
enzyme-enzyme and enzyme-metabolite interaction graphs (using the reporter metabolite approach).
This approach helped to pin-point specific areas of metabolism that accounted for inter-strain or time
point variation.
We were also interested to see whether we could predict the impact of specific genes of known or
unknown function on the yeast metabolic network by combining whole transcriptome and partial exo-
metabolome analysis. To address this issue the matrix of gene expression data (from the five strains at
the three time points) was integrated with the concentrations of volatile aroma compounds measured at
the same time points. Using the relatively unbiased approach of regression modeling we were able to
identify several candidate genes for aroma profile modification. Overexpression of a few of these target
194
genes and analysis of the data did indeed show a statistically significant correlation between the
changes in the exo-metabolome of the overexpressing strains and the changes that were predicted based
on the unbiased alignment of transcriptomic and exo-metabolomic data. Considering the complexity of
the system, the success rate of this approach was quite satisfactory, suggesting that a comparative
transcriptomics and metabolomics approach can be used to identify the metabolic impacts of the
expression of individual genes in complex systems.
One of the major challenges of large-scale functional genomics in wine yeast is the fact that the
specific strain, the time point during fermentation, as well as the composition of the fermentation media
and other abiotic factors (i.e. temperature) all contribute to the transcriptomic response of the yeast
population to its ‘environment’. We therefore conducted parallel transcriptomic analyses with two wine
yeast strains in two different fermentation media, namely MS300 and Colombard must, in order to
delineate relevant and ‘noisy’ changes in gene expression in response to experimental factors such as
fermentation stage and strain identity. We were also interested to see if predictive statistical models
based on transcriptional information from MS300 studies could be reproduced in a real wine must
background.
Multivariate analysis of gene expression data derived from this study showed that the composition of
the fermentation must is a lesser contributor of variance in a fermentation compared to both strain
identity and the time point during fermentation. Moreover, inter-strain comparisons at different stages
of fermentation did not yield notable discrepancies in terms of significance outputs. We demonstrated
that the alignment of exometabolic model information from the MS300 and Colombard datasets was
very close, which suggested that integrative ‘omics’ applications can be incorporated into reliable
predictive models across the board, regardless of variation in specific environmental conditions. This
finding validated the suitability of the widely-used synthetic must MS300 as a representative
experimental media for conducting research on wine yeast genetics, biochemistry and physiology.
Another important aspect to consider in systems biology research relates to the alignment of different
‘omics’ datasets, or the degree to which the different levels of the cellular information transfer system
compare with one another. Obviously protein levels are a much stronger indicator of the real cellular
response to a particular perturbation/ experimental factor. Since most of our analyses and deductions
were based on gene expression data, it was important to see how protein expression levels aligned with
our transcriptomic analysis.

195
For the proteomic analysis two strains were considered at the same three time points, namely day 2,
day 5 and day 14. A total of approximately 450 proteins were unambiguously identified. We found that
alignment of transcript and protein ratios were extremely high for comparisons between the two strains.
This observation provides strong support for the biological relevance of comparative transcriptomic
datasets in yeast. However for the intrastrain comparisons (between time points) the close alignment of
transcript and protein ratios falls apart. This confirms previous observations (de Groot et al., 2007; de
Godoy et al., 2008) that transcriptomic and proteomic datasets are frequently difficult to align across
different time points and need to be interpreted with caution.
In this context of time point comparissons, differences between transcriptome and proteome appear
strongly dependent on the GO functional category of the corresponding genes. Our data suggest that for
most categories, such as cell cycle control, transcription, translation etc., there is almost no correlation
between trends in transcript levels and proteins over time. However, metabolic enzymes and the
corresponding genes appear strongly correlated over time and between strains, suggesting a strong
transcriptional control of such enzymes. The implication is thus that transcriptomic data can
theoretically be applied to evaluate and model certain aspects of yeast metabolism with relative
confidence.
The large comparative datasets also allow for the generation of hypotheses regarding the molecular
origin of significant differences in phenotypic traits between the different strains: By enrichment of
differentially expressed gene datasets for specific transcription factors (TFs) we were able to identify
key transcription factors showing significant differences in their expression patterns between the
different strains. These transcription factors together accounted for the majority of differentially
expressed genes in the interstrain comparisons. It has been proposed that some of the primary targets of
yeast adaptation are functional binding sites of transcription factors and the transcription factors
themselves. Variations in transcriptional regulation between different wine yeast strains could thus be
responsible for the rapid adaptation to different fermentative requirements in the context of commercial
wine-making.
We hypothesized that much of the transcriptional and metabolic variation encountered among the
different wine yeast strains in use today could be explained by adaptation mediated by changes in the
expression/regulation of certain key transcription factors. Changes in the expression of these ‘master
196
controllers’ can lead to large-scale changes to the fermentation phenotypes of the different yeast
strains. By overexpressing two of these transcription factors we did indeed observe far-reaching
changes in cellular metabolism, particularly a modified aroma compound metabolism. We also showed
that the metabolic phenotype of one strain could indeed be made more similar to another strains by
modifying the expression of these transcription factors. These observations therefore provide some
insights into the mechanisms of adaptation and micro-evolution of wine yeast strains.
On the whole, our transcriptomic data align well with previous studies conducted using similar strains
(Rossignol et al., 2003; Marks et al., 2008). The one drawback of these previous transcriptomic studies
in wine yeast is that only single strains were considered in each analysis. By using several
phenotypically divergent commercial wine yeast strains we were able to generate a more robust dataset.
Such a comparative approach provided more biologically meaningful data than would have been
derived from single strain approaches. The interstrain comparison of transcriptomic and proteomic
datasets revealed intrinsic molecular differences between strains that in many cases could be directly
correlated to relevant phenotypes. Our multi-strain, multi-layered ‘omic’ approach was therefore well
suited to the analysis of complex phenotypes such as aroma compound production, stress tolerance,
flocculation, etc.
There are very few published proteomic studies for wine yeast strains, and even fewer for proteomics
in conjunction with transcriptional analysis (Trabalzini et al., 2003; Salvadó et al., 2008). Our study is
the first of its kind in terms of combing transcriptome and proteome analysis for different strains across
time points. Ultimately, the agreement of protein abundance ratios between strains with the phenotypic
characteristics of these strains further strengthens our belief that the ‘omic’ datasets we have generated
provide valuable and reliable insights into the molecular mechanisms at work in industrial wine yeast
strains during alcoholic fermentation.
However, the major shortfall in our research is the limited nature of our proteomic dataset. The 450
proteins that we have identified represent less than 10% of the whole yeast proteome. Future directives
would obviously include the generation of a more comprehensive protein dataset, considering that
protein levels are a more accurate representation of in vivo enzyme activity and fluxes than transcript
levels.
197
On the metabolic front, our present study focused mainly on the exometabolome, considering the
oenological relevance of this information and the relative ease of experimental analysis. Only a few
selected intracellular metabolites were measured experimentally (for validation of in silico models
only). Clearly a truly comprehensive systems biology approach would have to include a significant
representation of all layers of information, including transcript, protein and metabolite levels. The next
step in our ‘omics’ workflow will be the integration of gene expression and protein levels with high
quality metabolomic data, also generated in a multi-strain comparative framework. Integration and
modeling of all the different ‘omics’ datasets should reveal new properties of the system, and improve
our understanding wine yeast metabolism in the holistic sense.
But for now, our systems biology study of fermenting wine yeast has proven reasonably comprehensive
by current standards, and new knowledge and important insights have been established. To summarize,
by analyzing large comparative transcriptomic datasets of five industrial wine yeast strains we were
able to identify various genes/gene sets that could be linked with relevant aspects of yeast performance
in key areas related to flocculation, stress tolerance and metabolism. Our study has shed light on some
of the underlying molecular factors related to important phenotypic variations between strains, and also
increased our understanding of metabolic changes that occur during fermentation under wine-making
conditions. In addition, the research presented in this dissertation has provided new insights for
improved, targeted engineering strategies aimed at optimizing the performance of wine yeast strains.
References
de Godoy LMF, Olsen JV, Cox J, Nielsen ML, Hubner NC, Fröhlich F, Walther TC & Mann M, 2008.
Comprehensive mass-spectrometry-based proteome quantification of haploid versus diploid yeast.
Nature 55, 1251-1255.
de Groot MJL, Daran-Lapujade P, van Breukelen B, Knijnenburg TA, de Hulster EAF, Reinders MJT,
Pronk JT, Heck JR & Slijper M, 2007. Quantitative proteomics and transcriptomics of anaerobic and
aerobic yeast cultures reveals post-transcriptional regulation of key cellular processes. Microbiol. 153,
3864-3878.
198
Marks VD, Ho Sui SJ, Erasmus D, van den Merwe GK, Brumm J, Wasserman WW, Bryan J & van
Vuuren HJJ, 2008. Dynamics of the yeast transcriptome during wine fermentation reveals a novel
fermentation stress response. FEMS Yeast Res. 8, 35-52.
Rossignol T, Dulau L, Julien A & Blondin B, 2003. Genome-wide monitoring of wine yeast gene
expression during alcoholic fermentation. Yeast 20, 1369-1385.
Salvadó Z, Chiva R, Rodríguez-Vargas S, Rández-Gil F, Mas A, Guillamón JM, 2008. Proteomic
evolution of a wine yeast during the first hours of fermentation. FEMS Yeast Res. 8, 1137-1146.
Trabalzini L, Paffeti A, Scaloni A, Talamo F, Ferro E, Coratza G, Bovalini L, Lusini P, Martelli P,
Santucci A, 2003. Proteomic response to physiological fermentation stresses in a wild-type wine strain
of Saccharomyces cerevisiae. Biochem. J. 370, 35-46.